Embed Size (px)
Citation preview

Copyright © TWI Ltd 2008World Centre for Materials Joining Technology
Palisade User ConferencePalisade User ConferenceApril 22April 22ndnd & 23 & 23rdrd
LondonLondon
Maximising the Net Present Value of Investment in the Maintenance of
Assets
- Ujjwal Bharadwaj, TWI Ltd, Cambridge, UK

Copyright © TWI Ltd 2008World Centre for Materials Joining Technology
Presentation OutlinePresentation Outline• Overview of TWIOverview of TWI• Risk ManagementRisk Management• Risk Based Asset Management Risk Based Asset Management • The Risk Based Approach to Plant The Risk Based Approach to Plant
MaintenanceMaintenance– Qualitative AssessmentQualitative Assessment– Quantitative AnalysesQuantitative Analyses– Risk Based OptimisationRisk Based Optimisation
• Benefits of using the RB methodologyBenefits of using the RB methodology• Some issues Some issues • QuestionsQuestions

Copyright © TWI Ltd 2008World Centre for Materials Joining Technology
Overview of TWIOverview of TWI

Copyright © TWI Ltd 2008World Centre for Materials Joining Technology
What is TWI?What is TWI?
•Independent Research & Independent Research & Technology Organisation for Technology Organisation for welding and joining related welding and joining related technologies technologies •Serves industrial member Serves industrial member companies/government companies/government
•Non-profit distributing and Non-profit distributing and limited by guarantee of limited by guarantee of membersmembers
•Derives from The Welding Derives from The Welding Institute and the British Institute and the British Welding Research AssociationWelding Research Association

Copyright © TWI Ltd 2008World Centre for Materials Joining Technology
Key FiguresKey Figures
• 530 + staff 530 + staff
• 300 graduate status 300 graduate status
• 3500 industrial members 3500 industrial members
fromfrom
• 66 countries world-wide66 countries world-wide
• 4 major UK locations4 major UK locations
• 4 overseas operations 4 overseas operations
and training basesand training bases

Copyright © TWI Ltd 2007World Centre for Materials Joining Technology
Where is TWI HQ?Where is TWI HQ?
On Granta Science Park 8 miles South of Cambridge

Copyright © TWI Ltd 2008World Centre for Materials Joining Technology
TWI – UK LocationsTWI – UK Locations
Cambridge
North East
Yorkshire
Wales

Copyright © TWI Ltd 2008World Centre for Materials Joining Technology
TWI OverseasTWI Overseas
• Operations/training in Malaysia, Brazil, Iran & China Operations/training in Malaysia, Brazil, Iran & China • Associates in Australia, France, Ukraine & USAssociates in Australia, France, Ukraine & US• Agents/presence in US, India, Korea, Japan, Agents/presence in US, India, Korea, Japan,
Indonesia, Italy, Saudi Arabia and the United Arab Indonesia, Italy, Saudi Arabia and the United Arab Emirates, Kazakhstan.Emirates, Kazakhstan.
Training base at Training base at MalaysiaMalaysia

Copyright © TWI Ltd 2008World Centre for Materials Joining Technology
Key Industry Sectors ServedKey Industry Sectors ServedAerospaceAerospace AutomotiveAutomotive ConstructionConstruction
ElectronicsElectronics MedicalMedical Oil & GasOil & Gas PowerPower
Equipment, Equipment, Consumables & MaterialsConsumables & Materials

Copyright © TWI Ltd 2008World Centre for Materials Joining Technology
Risk ManagementRisk Management• Risk:Risk:
– Combination of the probability of an event and its Combination of the probability of an event and its consequences (ISO/IEC Guide 73)consequences (ISO/IEC Guide 73)
• What is Risk Management?What is Risk Management?– Direction and control with regard to riskDirection and control with regard to risk– In a financial settingIn a financial setting
• Concerned with events that pose opportunities for gain Concerned with events that pose opportunities for gain as well as potential for lossas well as potential for loss
– Currency fluctuation, interest rates etcCurrency fluctuation, interest rates etc– In an engineering settingIn an engineering setting
• Risk is a combination of occurrence of harm and the Risk is a combination of occurrence of harm and the severity of that harm ( ISO/IEC Guide 51:1999 )severity of that harm ( ISO/IEC Guide 51:1999 )
• Harm is physical injury or damage to the health of Harm is physical injury or damage to the health of people, or damage to property or the environmentpeople, or damage to property or the environment
• Risk management process…Risk management process…

Copyright © TWI Ltd 2008World Centre for Materials Joining Technology
Risk Management Strategic Objectives
Risk AnalysisRisk IdentificationRisk DescriptionRisk Estimation
Risk Evaluation
Risk Assessment
Risk Mitigation
Risk Acceptance
Risk Communication
Monitoring
Mod
ificati
on
Form
al
Au
dit

Copyright © TWI Ltd 2008World Centre for Materials Joining Technology
Risk Based Asset ManagementRisk Based Asset Management• Asset Integrity Management Asset Integrity Management
– Ensure integrity of engineered systemsEnsure integrity of engineered systems– ‘‘Fit for purpose’ throughout asset Fit for purpose’ throughout asset
lifecyclelifecycle– Ability of an asset to perform required Ability of an asset to perform required
function effectively and efficiently whilst function effectively and efficiently whilst safeguarding life and the environmentsafeguarding life and the environment
• Objective: Maximize returns, Objective: Maximize returns, minimize risksminimize risks
– Safety, Health and Environmental (SHE) Safety, Health and Environmental (SHE) risksrisks
– Business risksBusiness risks

Copyright © TWI Ltd 2008World Centre for Materials Joining Technology
Risk Based Asset ManagementRisk Based Asset Management
• Attributes of a good RBM for asset Attributes of a good RBM for asset mgmtmgmt
– Consistent, Transparent and AuditableConsistent, Transparent and Auditable– Identify potential and active DMs of Identify potential and active DMs of
plantplant– Plan inspection, such that residual risk Plan inspection, such that residual risk
for each DM is within acceptable limitsfor each DM is within acceptable limits– Increased reliability, safety and Increased reliability, safety and
availabilityavailability– Reduced scope of work for shutdown Reduced scope of work for shutdown
inspectioninspection

Copyright © TWI Ltd 2008World Centre for Materials Joining Technology
Failure rate over asset life Failure rate over asset life cyclecycle
Wear out failures
Infant mortality failures Constant
random failures
Failure
rate
Life of the asset
Infant mortality failures

Copyright © TWI Ltd 2008World Centre for Materials Joining Technology
Failure rate over asset life Failure rate over asset life cyclecycle
Failure
rate
Operating Life
Infant Mortality
Stage
Useful LifeAgeing/ Final Stage

Copyright © TWI Ltd 2008World Centre for Materials Joining Technology
The Ageing Stage in a Plant’s The Ageing Stage in a Plant’s LifeLife
• Accumulated damage e.g.Accumulated damage e.g.– Thinning due to Corrosion/ ErosionThinning due to Corrosion/ Erosion– Fatigue due to Cyclic StressesFatigue due to Cyclic Stresses– Creep due to high temperatureCreep due to high temperature
• Remaining Life Assessment/ Remaining Life Assessment/ EstimatesEstimates
– Prediction for Prediction for replacement/maintenancereplacement/maintenance
– DeterministicDeterministic– Probabilistic Probabilistic
» to capture the uncertainty involvedto capture the uncertainty involved

Copyright © TWI Ltd 2008World Centre for Materials Joining Technology
The Risk Based Approach to Plant The Risk Based Approach to Plant MaintenanceMaintenance
• Risk is a combination of probability of an Risk is a combination of probability of an event and its consequence (API 580)event and its consequence (API 580)
• Step 1: Preliminary Risk Analysis of the Step 1: Preliminary Risk Analysis of the System System – By Qualitative Risk AnalysisBy Qualitative Risk Analysis– Identify high risk componentsIdentify high risk components
• Step 2: Detailed Risk Analysis of Step 2: Detailed Risk Analysis of identified System components identified System components – By Quantitative Risk AnalysisBy Quantitative Risk Analysis– Develop a probabilistic RL model of the Develop a probabilistic RL model of the
degradation mechanism degradation mechanism
• Step 3: OptimisationStep 3: Optimisation– Such that financial benefit is maximisedSuch that financial benefit is maximised

Copyright © TWI Ltd 2008World Centre for Materials Joining Technology
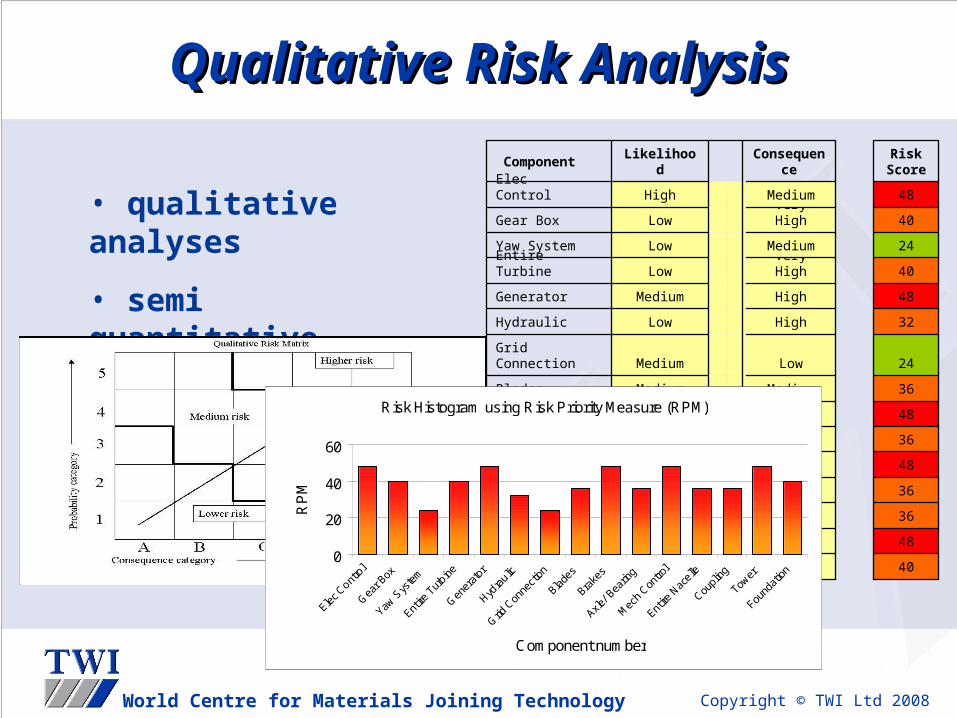
Qualitative Risk AnalysisQualitative Risk Analysis• System AnalysisSystem Analysis
– ETA using @Risk ETA using @Risk Precision tree for Precision tree for all sub componentsall sub components
– System boundaries, System boundaries, failure criteria failure criteria specifiedspecified
– Data usedData used• Historical (local)Historical (local)• Specific dataSpecific data• GenericGeneric• Expert OpinionExpert Opinion
Copyright © TWI Ltd 2008World Centre for Materials Joining Technology
Qualitative Risk AnalysisQualitative Risk Analysis
40Very High Low Foundation
48High Medium Tower
36Medium Medium Coupling
36Medium Medium Entire Nacelle
48Medium High Mech Control
36Medium Medium Axle/ Bearing
48Medium High Brakes
36Medium Medium Blades
24Low Medium Grid Connection
32High Low Hydraulic
48High Medium Generator
40Very High Low Entire Turbine
24Medium Low Yaw System
40Very High Low Gear Box
48Medium High Elec Control
Risk Score
Consequence
Likelihood Component
• qualitative analyses
• semi quantitative analyses
Risk Histogram using Risk Priority Measure (RPM)
0
20
40
60
Elec C
ontro
l
Gea
r Box
Yaw S
yste
m
Entire
Tur
bine
Gen
erat
or
Hydra
ulic
Grid
Con
nect
ion
Blade
s
Brake
s
Axle/ B
earin
g
Mec
h Con
trol
Entire
Nac
elle
Coupl
ing
Tower
Found
atio
n
Component number
RP
M

Copyright © TWI Ltd 2008World Centre for Materials Joining Technology
Quantitative Risk Analysis Quantitative Risk Analysis
• Qualitative Analysis highlighted a structural Qualitative Analysis highlighted a structural component as high risk.component as high risk.
• FMEA identified FMEA identified three main damage mechanisms three main damage mechanisms
– Corrosion Corrosion – Scouring Scouring – Fatigue Fatigue
• Corrosion chosen to illustrate Risk Based Corrosion chosen to illustrate Risk Based approach approach
• Probabilistic Corrosion Model gives failure rate Probabilistic Corrosion Model gives failure rate with respect to years of service.with respect to years of service.
Failure Mode Effect Consequence category Consequence Cost (£k) Source/commentMaintenance durationRegulator penaltiesOther turbinesSea vehicleslocal structuresInjuryDeathInstallation of new structureRepair and recommissionInsurance premiumTechnology confidence lossLost productionMaintenance cost
Keep in serviceMaintenance durationRegulator penaltiesOther turbinesSea vehicleslocal structuresInjuryDeathInstallation of new structureRepair and recommissionInsurance premiumTechnology confidence lossLost productionMaintenance cost
Keep in serviceMaintenance durationRegulator penaltiesOther turbinesSea vehicleslocal structuresInjuryDeathInstallation of new structureRepair and recommissionInsurance premiumTechnology confidence lossLost productionMaintenance cost
Keep in service
Personnel
Maintenance costs
Reputation
Repair
Corrosion - Uniform Band in
Splash Zone
Collapse
Find and Assess
Collapse
Scouring
Fatigue - Circumfrential
cracking
Collapse
Find and Assess
Find and Assess
Reputation
Repair
Production loss
Secondary Damage
Personnel
Maintenance costs
Reputation
Repair
Production loss
Secondary Damage
Production loss
Secondary Damage
Personnel
Maintenance costs

Copyright © TWI Ltd 2008World Centre for Materials Joining Technology
Quantitative Risk AnalysisQuantitative Risk Analysis
• Main input is distribution of Main input is distribution of corrosion rate (CR) reflecting the corrosion rate (CR) reflecting the uncertainty involved.uncertainty involved.
• Remaining life model:Remaining life model:• RL= (Tstart - MAT)/ CRRL= (Tstart - MAT)/ CR
Tstart= Starting wall thickness (mm)Tstart= Starting wall thickness (mm)
MAT=Minimum Allowable Thickness to maintain MAT=Minimum Allowable Thickness to maintain integrity (mm)integrity (mm)
CR=Corrosion Rate (mm/yr)CR=Corrosion Rate (mm/yr)
• Probability of failure is P(RL<0)Probability of failure is P(RL<0)

Copyright © TWI Ltd 2008World Centre for Materials Joining Technology
Quantitative Risk AnalysisQuantitative Risk Analysis
• Corrosion rate estimateCorrosion rate estimate• Curve fitted over historical values Curve fitted over historical values
using @Riskusing @Risk• Expert opinionExpert opinion
Normal(0.40000, 0.1)Trunc(0,+inf)
0.0
0.5
1.0
1.5
2.0
2.5
3.0
3.5
4.0
-0
.1
0.0
0.1
0.2
0.3
0.4
0.5
0.6
0.7
>5.0% 90.0%
0.2355 0.5645
Typical Corrosion Rate of Steel, mpy
Mud Line
Quiet Sea Water
Low Tide
High Tide
Splash Zone
Marine Atmosphere

Copyright © TWI Ltd 2008World Centre for Materials Joining Technology
Quantitative Risk AnalysisQuantitative Risk Analysis
Material Process conditions Current thick ness
MONTE CARLOSIMULATION
Remaining li fe, years
Fre
qu
enc
y
Remaining li fe, years
Pro
babi
lity
Material Process conditions Current thick nessMaterialMaterial Process conditionsProcess conditions Current thick nessCurrent thick ness
MONTE CARLOSIMULATION
Remaining li fe, years
Fre
qu
enc
y
Remaining li fe, years
Fre
qu
enc
y
Remaining li fe, years
Pro
babi
lity
Remaining li fe, years
Pro
babi
lity
•Repeated sampling of values from input distributions gives PoF based on RL for the considered DM.

Copyright © TWI Ltd 2008World Centre for Materials Joining Technology
Quantitative Risk AnalysisQuantitative Risk Analysis

Copyright © TWI Ltd 2008World Centre for Materials Joining Technology
Quantitative Risk AnalysisQuantitative Risk Analysis
Probability of Failure (PoF) Vs Time
0
20
40
60
80
100
1990 2000 2010 2020 2030
Year
Po
F (
%)
Probability of Failure VsTime
%age Remaining Life consumed Vs Year of Operation
0
20
40
60
80
100
1995 2000 2005 2010 2015
Years of Operation
%ag
e R
emai
nin
g L
ife

Copyright © TWI Ltd 2008World Centre for Materials Joining Technology
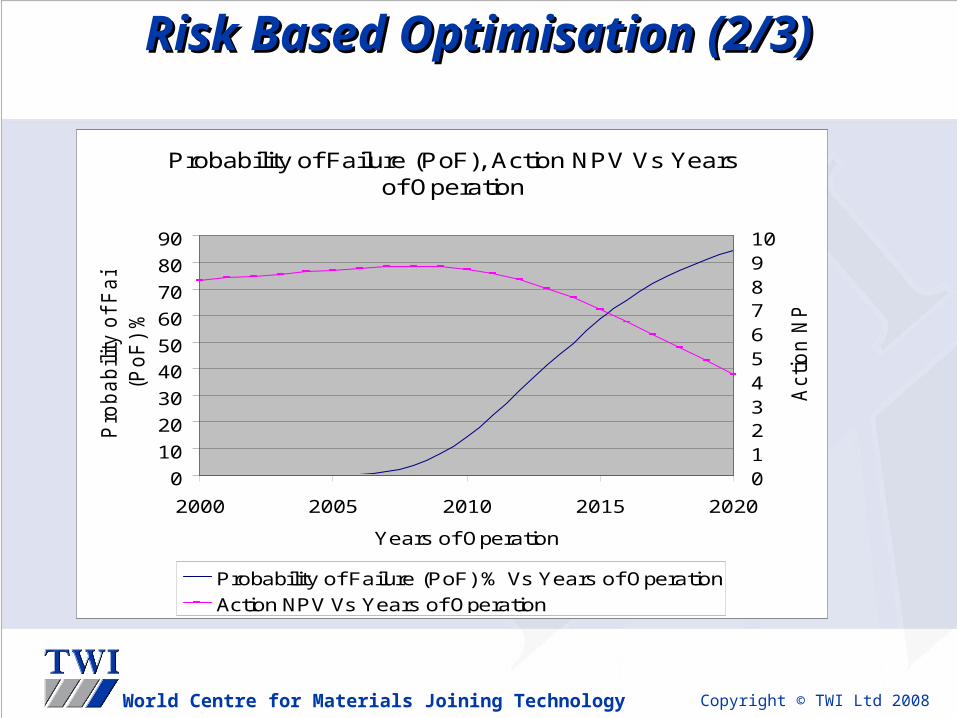
Risk Based Optimisation (1/3)Risk Based Optimisation (1/3)• Risk expressed in Expected Values (EV)Risk expressed in Expected Values (EV)• EV= PoF x CoFEV= PoF x CoF• Consequences of failure mainly lost Consequences of failure mainly lost
production production • The Optimisation model finds the time of The Optimisation model finds the time of
replacement of the plant when the Net replacement of the plant when the Net Present Value (NPV) is the maximum Present Value (NPV) is the maximum over planning periodover planning period
• The optimisation weighs the EV of The optimisation weighs the EV of replacement with the EV of not replacing replacement with the EV of not replacing to identify the optimum year of to identify the optimum year of replacement. replacement.
Copyright © TWI Ltd 2008World Centre for Materials Joining Technology
Risk Based Optimisation (2/3)Risk Based Optimisation (2/3)
Probability of Failure (PoF), Action NPV Vs Years of Operation
0
10
20
30
40
50
60
70
80
90
2000 2005 2010 2015 2020
Years of Operation
Pro
ba
bility o
f F
ailu
re
(Po
F)
%
012345678910
Actio
n N
PV
Probability of Failure (PoF) % Vs Years of Operation
Action NPV Vs Years of Operation

Copyright © TWI Ltd 2008World Centre for Materials Joining Technology
Risk Based OptimisationRisk Based Optimisation
Optimized Action Schedule (w/o budgetary constraints)
Description Action Year Capital Cost NPV
Str 1 2010 -4.072237 -0.548586Str 2 2009 -3.878321 -0.62253Str 3 2005 -3.190704 -0.283258Str 4 2009 -3.878321 0.15813
Total NPV -1.296244
(3/3)(3/3)
Optimized Action Schedule (with budgetary constraints)
Description Action Year Capital Cost NPV
Str 1 2010 -4.072237 -0.548586Str 2 2006 -3.350239 -0.647286Str 3 2003 -2.894063 -0.32284Str 4 2009 -3.878321 0.15813
Total NPV -1.360582

Copyright © TWI Ltd 2008World Centre for Materials Joining Technology
Potential Benefits from using the Potential Benefits from using the Risk Based MethodologyRisk Based Methodology
• Target SHE and business risksTarget SHE and business risks• Maximize return on investment in Maximize return on investment in
O&M by risk prioritisingO&M by risk prioritising• Better understand DMsBetter understand DMs• Better control and prevent Better control and prevent
unexpected system outagesunexpected system outages• Identify and eliminate gaps in Identify and eliminate gaps in
existing integrity mgmt process at a existing integrity mgmt process at a sitesite
• Provide an auditable path for Provide an auditable path for integrity mgmtintegrity mgmt

Copyright © TWI Ltd 2008World Centre for Materials Joining Technology
Some issuesSome issues• Limitations of the optimisation toolLimitations of the optimisation tool
For complex systems, non-linear optimisation For complex systems, non-linear optimisation tools required.tools required.
Increasing dependencies require more computing Increasing dependencies require more computing power.power.
• Limitations of the methodologyLimitations of the methodology Used mainly in the Ageing phase when time Used mainly in the Ageing phase when time
dependent damage has accumulated. Needs to dependent damage has accumulated. Needs to be used in conjunction with an overall strategy for be used in conjunction with an overall strategy for plant/equipment life management.plant/equipment life management.
More suitable to business critical systems as More suitable to business critical systems as opposed to safety critical systems.opposed to safety critical systems.
• Availability and quality of dataAvailability and quality of data

Copyright © TWI Ltd 2008World Centre for Materials Joining Technology
QuestionsQuestions