Embed Size (px)
Citation preview

Distribution Fitting, Illiquid Securities and the Intrepid Risk Modeller
Darren O’Connell
Barry O’Grady
© May 2012.
Curtin University of Technology

2
» Distribution Fitting, Illiquid Securities and the Intrepid Risk Modeller
» May 2012
» Palisade Risk Conference
Disclaimer
The views expressed are those of the presenters, and may not necessarily reflect those of Curtin University of Technology.
The information in this presentation is not intended as investment advice. The presenter is not offering or making recommendations in relation to securities or other financial or investment products.
Use of information contained in this presentation is at your own risk. The presenter recommends you seek independent professional advice prior to making any investment decisions.

3
» Distribution Fitting, Illiquid Securities and the Intrepid Risk Modeller
» May 2012
» Palisade Risk Conference
Presentation Programme
1. Motivation for Study
2. Asset Selection
3. Data Sampling
4. Modelling Approach
5. Results
6. Conclusion

4
» Distribution Fitting, Illiquid Securities and the Intrepid Risk Modeller May 2012 Palisade Risk Conference
Distribution Fitting, Illiquid Securities and the Intrepid Risk Modeller
Motivation for Study

5
Motivations
Excel® remains the tool of choice for many risk management units in Australia because:
Risk management functions are starved of resources
Customised solutions are expensive and must be tailored to specific requirements
System implementation and project risks are very high
Staff training costs increase accordingly
Recipients of risk management output are generally not “quants” and have little appetite for statistical and econometric content
“Close Enough” is “Good Enough” attitude
» Distribution Fitting, Illiquid Securities and the Intrepid Risk Modeller
» May 2012
» Palisade Risk Conference

6
» Distribution Fitting, Illiquid Securities and the Intrepid Risk Modeller
» May 2012
» Palisade Risk Conference
Motivations
From experience, Excel® continues to be utilised heavily for financial risk management in Australia
Excellent “blank canvas” in which to test ideas:
Cheap to purchase
easy-to-use intuitive interface
Wide availability allowing model portability
Wide range of statistical functions
Large data sets can be analysed
Low staff training costs
In short, Excel is a popular development medium

7
Motivations
There are some significant drawbacks that directly affect the accuracy and robustness of statistical models:
Precision of numerical calculations questionable
Statistical functionality frequently inaccurate
Many commonly-used statistics and methods are NOT included
I could go on but…
“... it is not safe to assume that Microsoft Excel’s statistical procedures give the correct answer. Persons who wish to conduct statistical analyses should use some other package.”
McCullough and Heiser (2008)
» Distribution Fitting, Illiquid Securities and the Intrepid Risk Modeller
» May 2012
» Palisade Risk Conference

8
Motivations
Many risk management personnel learn their trade in University
Excel is used to build simple time-series models that analyse the risk and return structure of traded securities
Normal distribution is most commonly cited in text books and is best understood – particularly in the work place
Excel’s in-built probability distributions are used to illustrate simple risk management problems
Practice persists in the work place through direct transfer of this learning
Limited knowledge coupled with Excel’s statistical limitations results in sub-optimal risk models
» Distribution Fitting, Illiquid Securities and the Intrepid Risk Modeller
» May 2012
» Palisade Risk Conference
9
Motivations
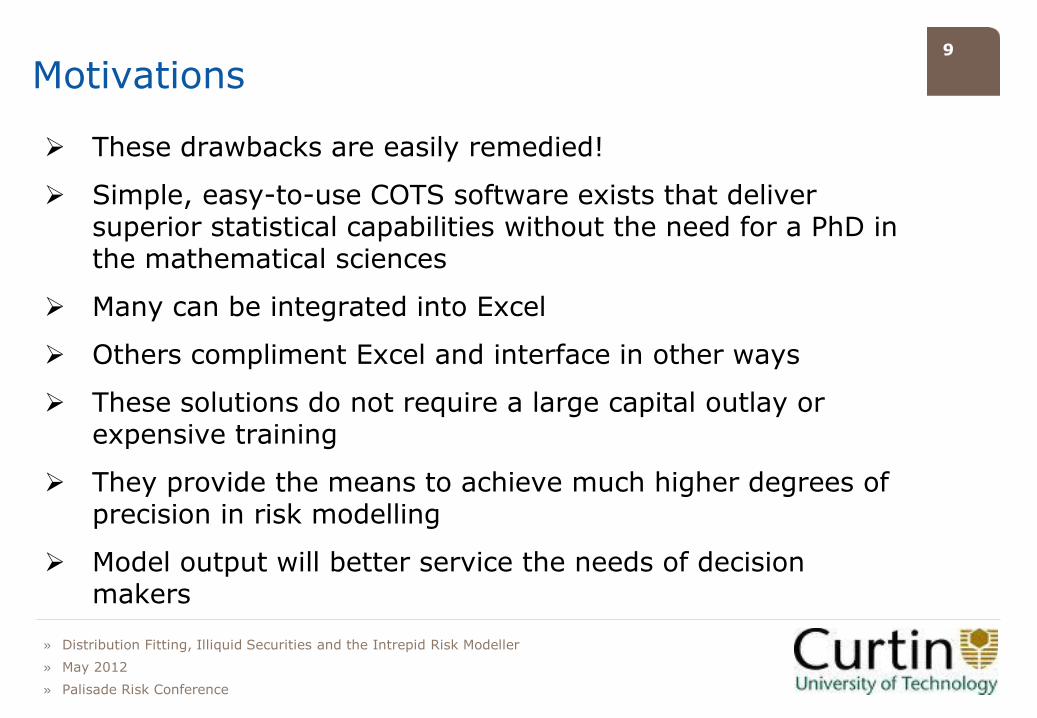
These drawbacks are easily remedied!
Simple, easy-to-use COTS software exists that deliver superior statistical capabilities without the need for a PhD in the mathematical sciences
Many can be integrated into Excel
Others compliment Excel and interface in other ways
These solutions do not require a large capital outlay or expensive training
They provide the means to achieve much higher degrees of precision in risk modelling
Model output will better service the needs of decision makers
» Distribution Fitting, Illiquid Securities and the Intrepid Risk Modeller
» May 2012
» Palisade Risk Conference
10
Motivations
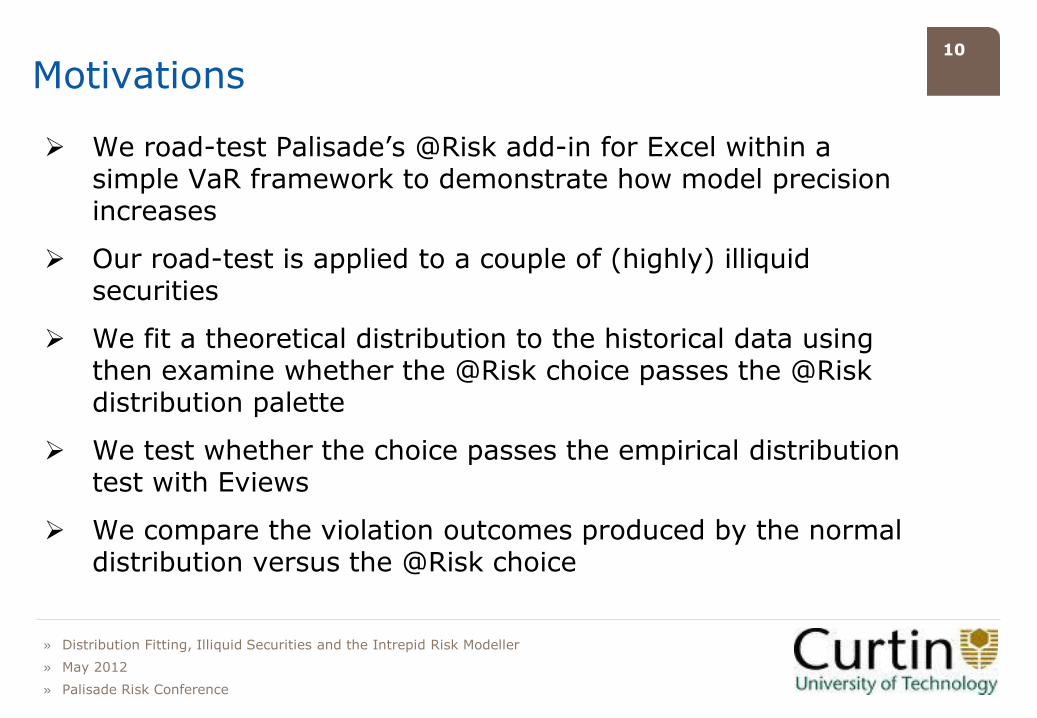
We road-test Palisade’s @Risk add-in for Excel within a simple VaR framework to demonstrate how model precision increases
Our road-test is applied to a couple of (highly) illiquid securities
We fit a theoretical distribution to the historical data using then examine whether the @Risk choice passes the @Risk distribution palette
We test whether the choice passes the empirical distribution test with Eviews
We compare the violation outcomes produced by the normal distribution versus the @Risk choice
» Distribution Fitting, Illiquid Securities and the Intrepid Risk Modeller
» May 2012
» Palisade Risk Conference

11
» Distribution Fitting, Illiquid Securities and the Intrepid Risk Modeller May 2012 Palisade Risk Conference
Distribution Fitting, Illiquid Securities and the Intrepid Risk Modeller
Asset Selection

12
Asset Selection
GFC caused liquidity to evaporate and asset class correlations converged
Significant residual volatility remains, liquidity concerns persists due to Euro currency and debt crisis
Global asset price volatility and illiquidity his Australian securities particularly hard
To demonstrate @Risk’s usefulness in selecting theoretical distributions more closely aligned to the historical data, we selected the following securities:
“Penny” stock PIE Networks
The enviro-asset Renewable Energy Certificate (REC)
» Distribution Fitting, Illiquid Securities and the Intrepid Risk Modeller
» May 2012
» Palisade Risk Conference

13
PIE Networks
Australia possesses an embryonic IT sector but lacks the scale and scope of Europe and the US
ASX lists a number GICS dedicated to IT
PIE describes itself as a manager of WiFi services and public Internet solutions
Flagship product is a Hotspot Webphone – a replacement to the traditional public phone booth – offering telecoms, internet, payment channels and advertising
Currently undertaking trials at Australian airports
Revenue model is based on hardware sales, recurring software sales and service fees
» Distribution Fitting, Illiquid Securities and the Intrepid Risk Modeller
» May 2012
» Palisade Risk Conference

14
PIE Networks
Listing date: 7 April 2000
Market high: $0.118
Market low: $0.007
Average price: $0.17
Average return: 0.13% per week
Return volatility: 16.16% per week
Average turnover: 35,000 shares
Largest marketable parcel: 1,188,863 shares for $140,285
Weekly data: 27/11/2002 to 29 June 2011
448 data points
» Distribution Fitting, Illiquid Securities and the Intrepid Risk Modeller
» May 2012
» Palisade Risk Conference

15
PIE Networks
» Distribution Fitting, Illiquid Securities and the Intrepid Risk Modeller
» May 2012
» Palisade Risk Conference

16
PIE Networks
» Distribution Fitting, Illiquid Securities and the Intrepid Risk Modeller
» May 2012
» Palisade Risk Conference

17
PIE Networks
Use @Risk to estimate the most likely theoretical distribution
Rank fit using the Anderson-Darling test statistic which attempts to fit the tails – of most interest to the risk manager
» Distribution Fitting, Illiquid Securities and the Intrepid Risk Modeller
» May 2012
» Palisade Risk Conference
Distribution A-D Statistic
Logistic 5.9769
Normal 10.8968
Weibull 19.6951

18
PIE Networks
» Distribution Fitting, Illiquid Securities and the Intrepid Risk Modeller
» May 2012
» Palisade Risk Conference

19
» Distribution Fitting, Illiquid Securities and the Intrepid Risk Modeller
» May 2012
» Palisade Risk Conference
Renewable Energy Certificates
August 2009 saw an amendment to the MRET scheme demanding 45,000 GWh or 20% to total energy by 2020.
The objective will be met through the creation, trading and annual surrender of Renewable Energy Certificates (RECs).
Generators create RECs for each MWh of renewable electricity which is sold to retailers.
Retailers obligated to surrender sufficient RECs to meet its total energy purchases each calendar year.

20
» Distribution Fitting, Illiquid Securities and the Intrepid Risk Modeller
» May 2012
» Palisade Risk Conference
Renewable Energy Certificates
Retailers obligated to surrender sufficient RECs to meet its total energy purchases each calendar year.
RECs can be traded in the secondary market through over-the-counter (OTC) channels – poor liquidity
The price of certificates is a function of:
Cost of supplying renewable generation;
The level of generation required to meet the MRET target;
The structure of the wholesale electricity market; and
The level of trading in secondary market RECs.
A number of structural factors underpin price behaviour; namely the exercise of market power and ongoing regulatory uncertainty.

21
Renewable Energy Certificates
Data supplied by AFMA
Collected by polling members about the prevailing offers and bids
Indicative prices are sorted using the “Median of Mids” method
Outliers removed when one standard deviation from midpoint
Resulting time series is “corrected” for skewness
Weekly data: 27/11/2002 to 6/01/2011
Market high & low: $53.21 and $11.94
Average price: 36.21
» Distribution Fitting, Illiquid Securities and the Intrepid Risk Modeller
» May 2012
» Palisade Risk Conference

22
» Distribution Fitting, Illiquid Securities and the Intrepid Risk Modeller
» May 2012
» Palisade Risk Conference
Renewable Energy Certificates

23
» Distribution Fitting, Illiquid Securities and the Intrepid Risk Modeller
» May 2012
» Palisade Risk Conference
Renewable Energy Certificates

24
Renewable Energy Certificates
Use @Risk to estimate the most likely theoretical distribution
Rank fit using the Anderson-Darling test statistic which attempts to fit the tails – of most interest to the risk manager
» Distribution Fitting, Illiquid Securities and the Intrepid Risk Modeller
» May 2012
» Palisade Risk Conference
Distribution A-D Statistic
Logistic 22.3093
Normal 46.7965
Weibull 63.9391

25
Renewable Energy Certificates
» Distribution Fitting, Illiquid Securities and the Intrepid Risk Modeller
» May 2012
» Palisade Risk Conference

26
» Distribution Fitting, Illiquid Securities and the Intrepid Risk Modeller May 2012 Palisade Risk Conference
Distribution Fitting, Illiquid Securities and the Intrepid Risk Modeller
Data Sampling

27
Data Sampling
Lack of long-term price history will result in model calibration issues and unstable VaR estimates
Represents a plausible industry scenario – newly created securities?
Option to use @Risk to synthetically create “history” or plausible “futures”
Using mean and variance parameters of each security to create another 500 (say) data points
Run a simulation to gain stable statistical estimates for normal and logistic distributions
Neither are perfect and both capture some of the stylised facts of the empirical distribtion
» Distribution Fitting, Illiquid Securities and the Intrepid Risk Modeller
» May 2012
» Palisade Risk Conference

28
PIE Return Data vs Hypothetical Returns #1
» Distribution Fitting, Illiquid Securities and the Intrepid Risk Modeller
» May 2012
» Palisade Risk Conference
-1.50
-1.00
-0.50
0.00
0.50
1.00
1.50
0 100 200 300 400 500 600 700 800
Return Normal
Statistic Historical Returns Normal samples
Mean Return 0.0012942 0.0107271
Standard
Deviation 0.1615584 0.1629046
Skewness -0.6370697 -0.0141445
Kurtosis 9.281909 -0.342546
Minimum Value -1.2299483 -0.5015656
Maximum Value 0.6505876 0.4428324
29
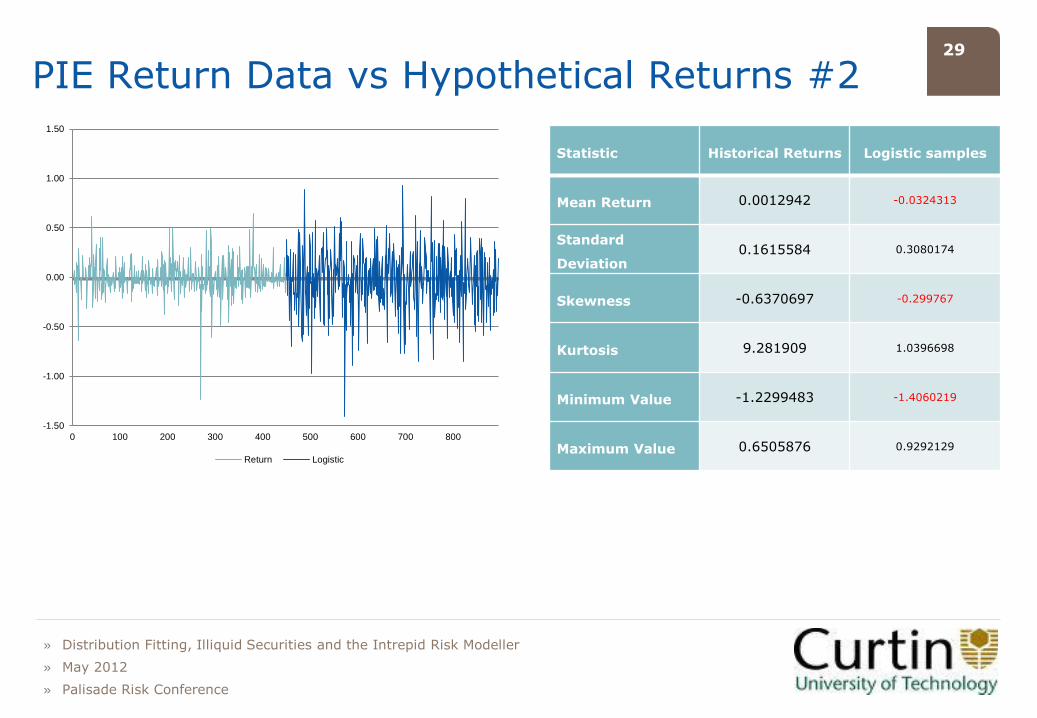
PIE Return Data vs Hypothetical Returns #2
» Distribution Fitting, Illiquid Securities and the Intrepid Risk Modeller
» May 2012
» Palisade Risk Conference
-1.50
-1.00
-0.50
0.00
0.50
1.00
1.50
0 100 200 300 400 500 600 700 800
Return Logistic
Statistic Historical Returns Logistic samples
Mean Return 0.0012942 -0.0324313
Standard
Deviation 0.1615584 0.3080174
Skewness -0.6370697 -0.299767
Kurtosis 9.281909 1.0396698
Minimum Value -1.2299483 -1.4060219
Maximum Value 0.6505876 0.9292129

30
REC Return Data vs Hypothetical Returns #1
» Distribution Fitting, Illiquid Securities and the Intrepid Risk Modeller
» May 2012
» Palisade Risk Conference
-0.40
-0.30
-0.20
-0.10
0.00
0.10
0.20
0.30
0 100 200 300 400 500 600 700 800
Return Normal
Statistic Historical Returns Normal samples
Mean Return -0.000492 0.000235
Standard
Deviation 0.0401726 0.037572
Skewness -0.6404766 -0.0298851
Kurtosis 21.325131 -0.1428352
Minimum Value -0.333154 -0.112075
Maximum Value 0.242703 0.097249

31
REC Return Data vs Hypothetical Returns #2
» Distribution Fitting, Illiquid Securities and the Intrepid Risk Modeller
» May 2012
» Palisade Risk Conference
-0.40
-0.30
-0.20
-0.10
0.00
0.10
0.20
0.30
0 100 200 300 400 500 600 700 800
Return Logistic
Statistic Historical Returns Normal samples
Mean Return -0.000492 0.000235
Standard
Deviation 0.0401726 0.037572
Skewness -0.6404766 -0.0298851
Kurtosis 21.325131 -0.1428352
Minimum Value -0.333154 -0.112075
Maximum Value 0.242703 0.097249

32
» Distribution Fitting, Illiquid Securities and the Intrepid Risk Modeller May 2012 Palisade Risk Conference
Distribution Fitting, Illiquid Securities and the Intrepid Risk Modeller
Modelling Approach

33
Modelling Approach
Risk managers need to understand the empirical characteristics of security prices, especially the volatility structure
If volatility is not mitigated, the probability of an extreme tail remains high
The impact of a tail event could cripple the capital reserves of the financial institution
Advanced models anticipate volatility changes better than non-paratmetric models but are harder to implement
Any market risk modelling should be done in conjunction with stress testing and scenario analysis
This framework helps to mitigate model risk
» Distribution Fitting, Illiquid Securities and the Intrepid Risk Modeller
» May 2012
» Palisade Risk Conference

34
Modelling Approach
Neither securities have an active options market so we are unable to use implied volatility
Historical volatility from empirical data becomes the starting point
The Monte Carlo techniques employed by @Risk help to alleviate this handicap
Resulting models are probabilistic, not deterministic
Both data sets subjected to diagnostic tests in Eviews
Squared returns of both data sets exhibit Auto Regressive Conditional Heteroskedacity (ARCH-LM test)
Minimal skewness present in historical data
» Distribution Fitting, Illiquid Securities and the Intrepid Risk Modeller
» May 2012
» Palisade Risk Conference

35
GARCH Specification
GARCH is a popular choice for VaR modelling because of how “innovations” in price affect today’s volatility (Jorion, 2003)
Volatility assumed to be non-constant
Relatively simple to estimate for fixed weight portfolios
Captures stylized facts of empirical return series such as volatility clustering
For simplicity, we chose the basic GARCH incarnation
» Distribution Fitting, Illiquid Securities and the Intrepid Risk Modeller
» May 2012
» Palisade Risk Conference
2
1
2
1
2
ttt

36
GARCH Specification
» Distribution Fitting, Illiquid Securities and the Intrepid Risk Modeller
» May 2012
» Palisade Risk Conference
ii z
|
|
2
t
2
t
),(~ 2
1 tt NI
),(~1 LFIt

37
GARCH Specification
GARCH parameters are set to near zero, construct a time series of conditional variance
Calculate likelihood of each observation then summed to get log likelihood
RiskOptimiser maximises log likelihood as per GARCH constraints
Initial parameters derived from historical data (simulation 0)
Future estimates of conditional variance estimated from random draws from the theoretical distributions
The VaR is simply the product of the conditional standard deviation and the level of significance chosen, in this case, at 90 per cent
» Distribution Fitting, Illiquid Securities and the Intrepid Risk Modeller
» May 2012
» Palisade Risk Conference

38
GARCH Estimates: PIE
» Distribution Fitting, Illiquid Securities and the Intrepid Risk Modeller
» May 2012
» Palisade Risk Conference
0.00
0.05
0.10
0.15
0.20
0.25
1 41 81 121 161 201 241 281 321 361 401 441 481
Normal GARCH Logistic GARCH

39
GARCH Estimates: RECs
» Distribution Fitting, Illiquid Securities and the Intrepid Risk Modeller
» May 2012
» Palisade Risk Conference
0.00
0.02
0.04
0.06
1 41 81 121 161 201 241 281 321 361 401 441 481
Normal GARCH Logistic GARCH
40
Model Validation
Back testing examines accuracy of VaR using out of sample data
Failure of back test indicates that the model may be mis-specified and that large estimation error exist
A “violation” is recorded in next week’s actual return exceeds the VaR forecast using the sample data
The Conditional Coverage Test (CCT) is used to validate the models
The 500-sample represents one trial which is repeated 100,000 times using the simulation capabilities of @Risk to derive stable number of VaR violations
Test statistics are also recorded for each model
» Distribution Fitting, Illiquid Securities and the Intrepid Risk Modeller
» May 2012
» Palisade Risk Conference

41
Coverage Tests
CCT is a flexible back testing methodology
CCT consists of an unconditional test based on actual number of violations against the theoretical number
There is an independence test to determine whether violations cluster
Null hypothesis for the unconditional test is whether the violations follow an IID Bernouli process and aligned to the significance level selected
Null hypothesis for independence is that the next violation is unrelated to the previous violation
For the model to be valid, and pass the CCT, it must pass the unconditional and independence tests respectively
» Distribution Fitting, Illiquid Securities and the Intrepid Risk Modeller
» May 2012
» Palisade Risk Conference

42
» Distribution Fitting, Illiquid Securities and the Intrepid Risk Modeller May 2012 Palisade Risk Conference
Distribution Fitting, Illiquid Securities and the Intrepid Risk Modeller
Results

43
Backtesting & Coverage: PIE
At the 10% level, similar number of violations
UC test under Normal will pass when 38 < V < 73
UC test under Logistic will pass when 41 < V <66
Violations outside these ranges are different from expected value (i.e. 50)
Will produce more violations due to persistence of volatility due to illiquidity
» Distribution Fitting, Illiquid Securities and the Intrepid Risk Modeller
» May 2012
» Palisade Risk Conference

44
Backtesting & Coverage: RECs
Similar number of violations
UC test under Normal will pass when 38 < V < 75
UC test under Logistic will pass when 33 < V <63
As with PIE, the Logistic results in a tighter rejected band
Other factors in price action may account for wider bands (i.e. mean reversion)
» Distribution Fitting, Illiquid Securities and the Intrepid Risk Modeller
» May 2012
» Palisade Risk Conference

45
Week-ahead VaR Estimates: PIE
The total number of consecutive violations was:
Normal = 8.33%
Logistic = 13.21%
For a difference of -4.88%
Logistic produces less stand-alone violations
Both models pass the independence test
Both models pass the Conditional Coverage Test
» Distribution Fitting, Illiquid Securities and the Intrepid Risk Modeller
» May 2012
» Palisade Risk Conference
0
1
0%
10%
20%
30%
1 51 101 151 201 251 301 351 401 451
Normal VaR Exceedences
0
1
0%
10%
20%
30%
1 51 101 151 201 251 301 351 401 451
Logistic VaR Exceedences

46
Week-ahead VaR Estimates: RECs
The total number of consecutive violations was:
Normal = 13.46%
Logistic = 5.56%
For a difference of +7.90% per cent
Stand-alone violations almost equal
Both models pass the independence test
Both models pass the Conditional Coverage Test
» Distribution Fitting, Illiquid Securities and the Intrepid Risk Modeller
» May 2012
» Palisade Risk Conference
0
1
0%
1%
2%
3%
4%
5%
6%
7%
1 51 101 151 201 251 301 351 401 451
Normal VaR Exceedences
0
1
0%
1%
2%
3%
4%
5%
6%
7%
1 51 101 151 201 251 301 351 401 451
Normal VaR Exceedences

47
» Distribution Fitting, Illiquid Securities and the Intrepid Risk Modeller May 2012 Palisade Risk Conference
Renewable Energy and Risk Modelling in an Australian Market Context
Conclusions

48
» Distribution Fitting, Illiquid Securities and the Intrepid Risk Modeller
» May 2012
» Palisade Risk Conference
Conclusion
Ignoring textbook theory and adopting easy-to-use tools such as @Risk and Eviews in combination with Excel, we get:
An ability to model the price and return structure more accurately
A rich universe of theoretical distributions to model future price risk (in time-series analysis)
Econometrically robust frameworks without the PhDs
This study has shown that by adopting a better fitting PDF to a simple GARCH VaR framework, the resulting model is
More accurate
Sensitive to changes in external volatility
Better able to anticipate changes in risk profiles
49
Conclusion
@Risk and Eviews are powerful tools that provide intuitive insight into risk and reward opportunities contained within time-series securities data
Use these tools within the Excel development environment to build prototype enterprise models
Larger-scale customised solutions based on prototype models deployed at the enterprise level with the correct strategy and safeguards in place
May be a better, cheaper solution to COTS offerings
Start small and build up
No substitute for poor theory: do not let model results dictate theory
» Distribution Fitting, Illiquid Securities and the Intrepid Risk Modeller
» May 2012
» Palisade Risk Conference

50
» Distribution Fitting, Illiquid Securities and the Intrepid Risk Modeller May 2012 Palisade Risk Conference
Distribution Fitting, Illiquid Securities and the Intrepid Risk Modeller
Questions & Comments?