Embed Size (px)
Citation preview

Copyright
by
Qian Susan Chi
2000
Oxidative Degradation of Monoethanolamine
by
Qian Susan Chi, B.S.
Thesis
Presented to the Faculty of the Graduate School
of The University of Texas at Austin
in Partial Fulfillment
of the Requirements
for the Degree of
Master of Science in Engineering
The University of Texas at Austin
December, 2000

Oxidative Degradation of Monoethanolamine
APPROVED BY
SUPERVISING COMMITTEE:
Gary T. Rochelle, Supervisor R. Bruce Eldridge

To BeBe

v
Acknowledgements
I would like to thank Dr. Rochelle for all the great ideas and unending
support he has offered throughout the entire project. He has made this a
rewarding experience and a proud achievement in my life.
Special thanks to Dr. Eldridge for his assistance. Thanks to my fellow
research group members: Hongyi Dang, Sanjay Bishnoi, Norman Yeh, Sharmi
Roy, and Eric Chen for being there for me.
Most of all, I want to thank the person who made all this possible,
Nicholas Nguyen. Without his unconditional love and support, I would have
given up. Thanks for constantly pushing me to be the strongest person who never
admits defeat. He has taught me everything I know, and everything I am is
because of him.
Lastly, I would like to thank God for the destiny he has chosen for me.
He directs me through this world. I am lucky to have him by my side every step
of the way.
I dedicate this work to my best friend Danny Lee who passed away in
January 2000. I hope I made you proud.
December 8, 2000
vi
Oxidative Degradation of Monoethanolamine
by
Susan Chi, M.S.E.
The University of Texas at Austin, 2000
SUPERVISOR: Gary T. Rochelle
Aqueous monoethanolamine (MEA) is used to remove CO2 from flue gas.
MEA degrades in service in the presence of oxygen and CO2 resulting in
extensive amine loss and equipment corrosion as well as generating
environmental impacts.
Oxidative degradation of MEA was studied under typical absorber
conditions 55°C. The rate of evolution of a degradation product NH3, which was
indicative of the overall rate of degradation, was measured continuously in a
batch MEA solvent system. The effects of CO2 loading, iron concentration, and
MEA concentration on the rate of NH3 production were quantified. Several
additives were studied; these include possible inhibitors such as
ethylenediaminetetraacetic acid (EDTA), N,N-Bis (2-hydroxyethyl) glycine or
bicine, and tertiary amines like N,N-diethylethanolamine as well as possible
catalysts such as KMnO4, formaldehyde, and H2O2.
Iron ranging in concentration from 0.0001 mM to 1 mM yields oxidation
rates ranging from 0.37 to 2 mM/hr in CO2 loaded MEA solutions in the presence
of oxygen. The rates can be correlated with the total iron (Fe+2 and Fe+3)
concentration in solution. Additives such as EDTA and bicine effectively
decrease the rate of oxidation in CO2 loaded MEA in the presence of iron by 40 to
50%.
vii
Ferrous ion caused oxidation in unloaded MEA with stoiochiometry
ranging from 0.1 to 0.33. Ferrous concentration from 0.0001 to 3.2 mM yields
rates from 0.12 to 1.1 mM/hr. These rates can also be correlated to the total
ferrous concentration in solution. Ferric iron did not appear to catalyze oxidation
in unloaded MEA.
The oxidation rate was three times faster in CO2 loaded MEA than in
unloaded MEA with no additional iron. The same concentration of iron can
catalyze oxidation in 0.4 CO2 loading MEA 6 to 8 times faster than in unloaded
MEA.
Oxidation rate increased a factor of two over the MEA concentration of
2.5 to 12 m.

viii
Table of Contents
List of Tables ..........................................................................................................xi
List of Figures....................................................................................................... xii
Chapter One: Introduction ......................................................................................1
1.1 Acid Gas Treating.................................................................................1
1.2 Process Flow Diagram..........................................................................1
1.3 Alkanolamines ......................................................................................3
1.4 Degradation...........................................................................................4
1.5 Scope of this Work ...............................................................................5
Chapter Two: Expected Mechanisms and Results..................................................6
2.1 Mechanism............................................................................................6
2.1.1 Amine Oxidation Mechanism and Products ...............................6
2.1.2 Aldehydes ...................................................................................7
2.1.3 Metal Ions .................................................................................. 9
2.1.4 Role of Ferrous Ion ...................................................................10
2.1.5 Role of Copper..........................................................................12
2.1.6 Autooxidation ...........................................................................12
2.1.7 Data on Reaction Rates.............................................................13
2.2 Navy Studies .......................................................................................16
2.2.1 Girdler Studies (1950) ..............................................................16
2.2.2 Blachly and Ravner (1964) .......................................................19
2.2.3 Rooney, Dupart, and Bacon (1998) ..........................................21
Chapter Three: Experimental Methods and Procedures .......................................25
3.1 Overall Flow Diagram ........................................................................25
3.2 Sparged Reactor..................................................................................26
3.3 Supporting Equipment ........................................................................28

ix
3.4 Source Gases.......................................................................................29
3.5 Reagent Preparation, Storage, and Disposal.......................................30
3.6 Batch Mode Operation........................................................................31
3.7 Analytical Methods.............................................................................33
3.7.1 Gas Phase Analysis by FT-IR Spectroscopy ............................33
3.7.2 CO2 Infrared Analyzer .............................................................37
3.8 Data Reduction and Analysis..............................................................37
3.8.1 Unsteady State Model...............................................................37
3.8.2 Raw Data Manipulation ............................................................39
3.8.3 Extrapolation of Steady State Rates..........................................41
3.8.4 Extrapolation of Stiochiometry.................................................43
Chapter Four: Experimental Results and Discussion ...........................................45
4.1 Experimental Conditions ....................................................................45
4.2 Raw Experimental Data ......................................................................46
4.3 Rate Data.............................................................................................47
4.4 Effect of Iron.......................................................................................52
4.4.1 Rates in CO2 Loaded and Acidified MEA................................53
4.4.2. Rates in Unloaded MEA...........................................................54
4.4.3 Ferrous Stoichiometry in Unloaded MEA................................55
4.5 Effect of CO2 Loading ........................................................................58
4.6 Effect of EDTA...................................................................................60
4.7 Effect of Bicine...................................................................................62
4.8 Effect of KMnO4.................................................................................63
4.9 Other Additives...................................................................................64
4.10 Effect of MEA Concentration............................................................66
4.11 Comparison with Other Studies........................................................66
Chapter Five: Conclusions and Recommendations ..............................................69

x
5.1 Conclusions..........................................................................................69
5.1.1 Effect of CO2 Loading ..............................................................69
5.1.2 Iron in Loaded MEA.................................................................69
5.1.3 Iron in Unloaded MEA .............................................................70
5.1.4 Oxidants Other than Oxygen ....................................................70
5.1.5 Oxidation Inhibitors..................................................................71
5.2 Application to Acid Gas Treating.......................................................71
5.3 Recommendations...............................................................................71
Appendix A: Analytical Methods & Equipment Operating Procedures...............73
Appendix B: Experimental Data...........................................................................81
Reference Cited....................................................................................................102
Vita.......................................................................................................................106
xi
List of Tables
Table 2-1 Second Order Rate Constants for Free Radical Reactions ..................13
Table 2-2 Accelerated Oxidation Rates of Amines (Girdler,1950) .....................17
Table 3-1 Gas Cyclinders Used for Experimental Data Collection.....................29
Table 3-2 Calibration Data for Mass Flow Meters and Controller......................30
Table 3-3 Assays for LCI MEA...........................................................................31
Table 3-4 Reagent Specifications ........................................................................31
Table 3-5 Multiple Steady-state Rates with 0.4 mole CO2/mole MEA...............42
Table 3-6 Multiple Steady-state Rates in Unloaded MEA ..................................43
Table 3-7 Ferrous Stoichiometry with Unloaded MEA.......................................44
Table 4-1 Experimental Conditions.....................................................................45
Table 4-2 Experiments at 55°C............................................................................48
Table 4-3 Oxidation Studies 20 wt % MEA with 0.25 mole CO2/mole MEA....60
Table 4-4 Effect of EDTA in Unloaded 5 m MEA with No Additional Iron......61
Table 4-5 Rate Comparison .................................................................................67
Table A-1 NH3 Calibration ...................................................................................77

xii
List of Figures
Figure 1-1 Typical Absorption/Stripping System................................................. 2
Figure 1-2 Structural Formulas for Commonly Used Alkanolamines...................3
Figure 2-1 Oxidation of MEA ...............................................................................6
Figure 2-2 Reaction of Formaldehyde with Monoethanolamine..........................8
Figure 2-3 Reaction of Formaldehyde with Fe(CN)63- at High pH .......................8
Figure 2-4 Reaction of Aldehyde with Peroxyacid and Oxygen ...........................9
Figure 2-5 Reaction Rates of Amines with Chlorine Dioxide at 25°C................15
Figure 2-6 Degradation Prediction Based on Chemical Structures
(Girdler,1950) ..........................................................................18
Figure 2-7 Effect of Bicine in the Presence of Metals
(Blachly and Ravner, 1964) .....................................................21
Figure 2-8 Comparison of Total Anions Measured for Unloaded Amines
(Rooney, 1998) ........................................................................22
Figure 2-9 Comparison of Total Anion Measured for 0.25 mole CO2/mole amine
(Rooney, 1998) ........................................................................23
Figure 2-10 Oxidation of MEA (Rooney, 1998) ...................................................24
Figure 3-1 Experimental Flow Diagram for MEA Oxidation .............................25
Figure 3-2 Reactor Schematic Diagram...............................................................26
Fr om T emp Bath
R eturn to T emp Bat
G as In
Gas Out
The rmo mete r
Ice B athFigure 3-3 Reactor and Condenser Dimensions..................................................27
Figure 3-4 Reactor Top Plate Configuration and Dimensions ............................28
Figure 3-5 FT-IR Spectrum for Ammonia...........................................................34
Figure 3-6 FT-IR Spectrum for 7 m MEA with 0.4 mole CO2/mole MEA.........35
Figure 3-7 Ammonia Calibration Curve and Equation........................................36
Figure 3-8 FT-IR Raw Data.................................................................................39
Figure 3-9 Experiment 71700 Data for Unloaded 5 m MEA ..............................40

xiii
Figure 3-10 Multiple Steady States with Increasing Ferric Concentrations in
7 m MEAwith 0.4 mole CO2/mole MEA ................................41
Figure 3-11 Multiple Steady States with Increasing Ferrous Concentrations in
7 m Unloaded MEA.................................................................42
Figure 3-12 Area of Integration for Determining Reaction Stoichiometry ...........43
Figure 4-1 Oxidation of Unloaded 5 m MEA......................................................50
Figure 4-2 Injection Times for Experiment 092200: Oxidation in
7 m MEA with 0.4 mole CO2/mole MEA with Air .................51
Figure 4-3 Steady-state Rates for Experiment 092200........................................51
Figure 4-4 Effect of Iron in 7 m MEA at 55°C....................................................52
Figure 4-5 Steady-state Rates in Experiment 71700 ...........................................54
Figure 4-6 Rate Dependence on Total Ferrous Concentration in
Unloaded MEA........................................................................55
Figure 4-7 Integration for Experiment 71700......................................................56
Figure 4-8 Ferrous Stoiochiometry in Unloaded MEA .......................................57
Figure 4-9 Oxidation of 7 m MEA, 0 CO2 Loading with N2...............................58
Figure 4-10 Effect of EDTA in 7 m MEA with 0.4 CO2/mole MEA...................61
Figure 4-11 Effect of EDTA in Unloaded MEA with 1 mM Fe+3........................62
Figure 4-12 Effect of Bicine in 7m MEA with 1 mM Fe+2/+3.............................. 63
Figure 4-13 Effect of KMnO4 in Unloaded 5 m MEA with N2............................64
Figure 4-14 Effect of MEA Concentration ..........................................................66
Figure A-1 NH3 Calibration Raw Data................................................................76
Figure A-2 NH3 Calibration Curve......................................................................76
Figure B-1 Experiment 62700A ..........................................................................82
Figure B-2 Experiment 62700B...........................................................................83
Figure B-3 Experiment 70700 .............................................................................84
Figure B-4 Experiment 71300 .............................................................................85
xiv
Figure B-5 Experiment 71700 .............................................................................86
Figure B-6 Experiment 71800 .............................................................................87
Figure B-7 Experiment 72000 .............................................................................88
Figure B-8 Experiment 72600 .............................................................................89
Figure B-9 Experiment 81500 .............................................................................90
Figure B-10 Experiment 81600 .............................................................................91
Figure B-11 Experiment 90800 .............................................................................92
Figure B-12 Experiment 90900 .............................................................................93
Figure B-13 Experiment 91000 .............................................................................94
Figure B-14 Experiment 91300 .............................................................................95
Figure B-15 Experiment 91400 .............................................................................96
Figure B-16 Experiment 91600 .............................................................................97
Figure B-17 Experiment 92000 .............................................................................98
Figure B-18 Experiment 92200 .............................................................................99
Figure B-19 Experiment 100200 .........................................................................100
Figure B-20 Experiment 100300 .........................................................................101

1
Chapter One
Introduction
1.1 Acid Gas Treating
Acid gases, mainly H2S and CO2, are components in a variety of gas
mixtures including natural gas, synthesis gas, flue gas, and refinery streams. H2S
needs to be completely removed from gas streams due to its toxicity and
corrosiveness in refinery operations. Carbon dioxide removal from flue gas is a
necessary means of combating global warming. Carbon dioxide is also removed
from natural gas because it acts as a diluent, increasing transportation costs and
reducing the heating value of the gas. The process of separating acid gases from
source gases is referred to as acid gas treating.
1.2 Process Flow Diagram
Various acid gas treating technologies have been studied and applied in
industry. Adsorption, membrane separation, and reactive absorption are common
processes for removing acid gas.
Absorption/stripping with aqueous alkanolamine solutions is the
dominant technology used by gas processing industries to remove acid gases such
as carbon dioxide and hydrogen sulfide. An ideal solvent should have a high
capacity for absorbing acid gases through reversible chemical reaction.
Increasing the temperature and/or reducing the pressure should also reverse the
chemical reaction between the acid gases and the amine in order to permit
regeneration of the original amine. Monoethanolamine (MEA) in water is the
current solvent of choice for CO2 removal from flue gas. The basic schematic
2
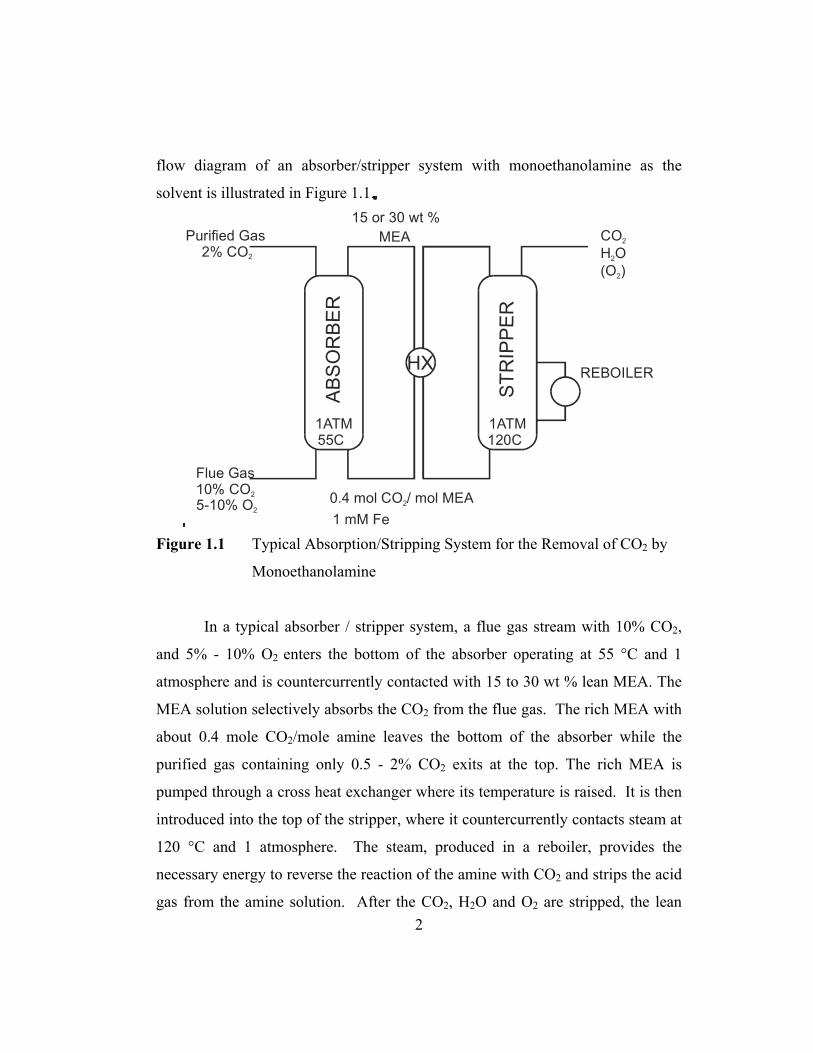
flow diagram of an absorber/stripper system with monoethanolamine as the
solvent is illustrated in Figure 1.1.
ABS
OR
BER
STR
IPPE
R
1ATM55C
1ATM120C
REBOILERHX
0.4 mol C / mol MEAO2
Flue Gas10% CO5-10% O2
2
Purified Gas2% CO2
15 or 30 wt %MEA CO
H O(O )
2
2
2
1 mM Fe Figure 1.1 Typical Absorption/Stripping System for the Removal of CO2 by
Monoethanolamine
In a typical absorber / stripper system, a flue gas stream with 10% CO2,
and 5% - 10% O2 enters the bottom of the absorber operating at 55 °C and 1
atmosphere and is countercurrently contacted with 15 to 30 wt % lean MEA. The
MEA solution selectively absorbs the CO2 from the flue gas. The rich MEA with
about 0.4 mole CO2/mole amine leaves the bottom of the absorber while the
purified gas containing only 0.5 - 2% CO2 exits at the top. The rich MEA is
pumped through a cross heat exchanger where its temperature is raised. It is then
introduced into the top of the stripper, where it countercurrently contacts steam at
120 °C and 1 atmosphere. The steam, produced in a reboiler, provides the
necessary energy to reverse the reaction of the amine with CO2 and strips the acid
gas from the amine solution. After the CO2, H2O and O2 are stripped, the lean
3
MEA is cooled down in the heat exchanger before recycling back to the absorber.
Both trayed and packed towers can be used for gas treating.
1.3 Alkanolamines
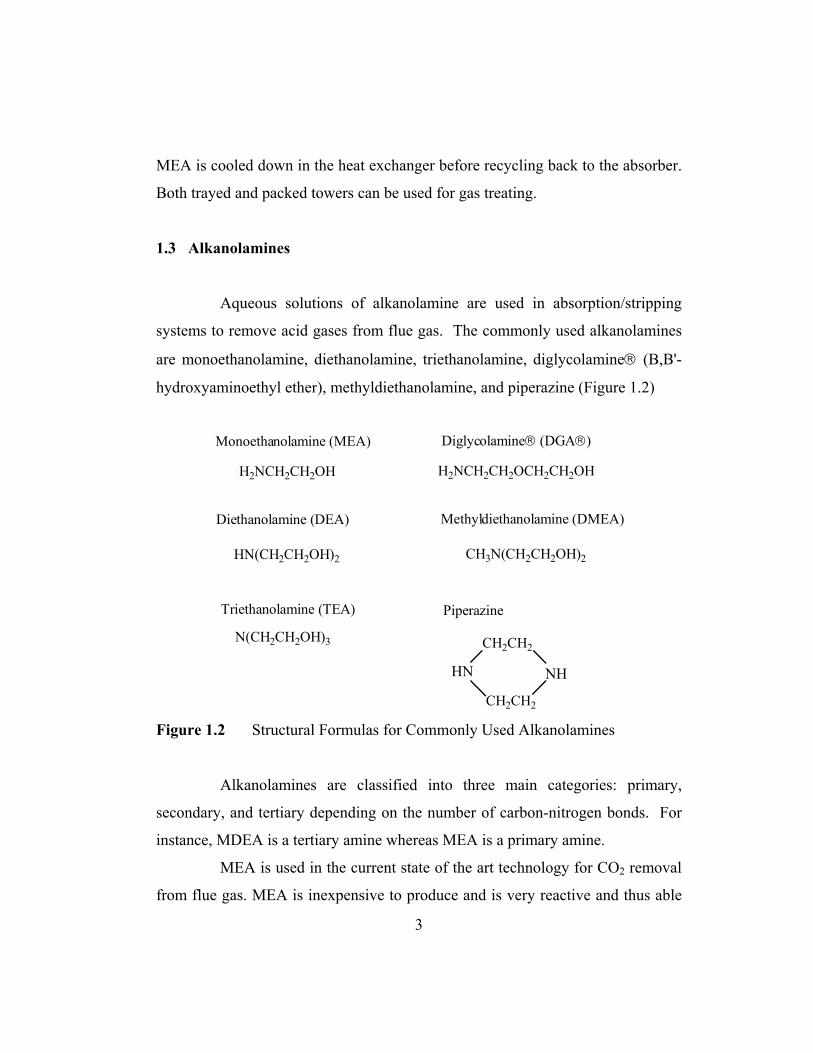
Aqueous solutions of alkanolamine are used in absorption/stripping
systems to remove acid gases from flue gas. The commonly used alkanolamines
are monoethanolamine, diethanolamine, triethanolamine, diglycolamine (B,B'-
hydroxyaminoethyl ether), methyldiethanolamine, and piperazine (Figure 1.2)
Monoethanolamine (MEA)
H2NCH2CH2OH
Diethanolamine (DEA)
HN(CH2CH2OH)2
N(CH2CH2OH)3
Diglycolamine (DGA)
H2NCH2CH2OCH2CH2OH
Methyldiethanolamine (DMEA)
CH3N(CH2CH2OH)2
Piperazine
CH2CH2
HN NH
CH2CH2
Triethanolamine (TEA)
Figure 1.2 Structural Formulas for Commonly Used Alkanolamines
Alkanolamines are classified into three main categories: primary,
secondary, and tertiary depending on the number of carbon-nitrogen bonds. For
instance, MDEA is a tertiary amine whereas MEA is a primary amine.
MEA is used in the current state of the art technology for CO2 removal
from flue gas. MEA is inexpensive to produce and is very reactive and thus able
4
to effect high volume acid gas removal at a fast rate. Tertiary amines like MDEA
are less reactive and therefore mostly used in the selective removal of H2S.
However, the less reactive MDEA is characterized by lower stripping energy
requirement than MEA or DEA. Recently, research attention has been focused on
the use of amine blends to maximize the desirable qualities of individual amines.
1.4 Degradation
Studies made over the years have shown that amines such as DEA and
MEA degrade in service. Degradation is an irreversible chemical transformation
of alkanolamines into undesirable compounds resulting in its diminished ability to
absorb acid gases. Degradation is undesirable and leads to substantial amine loss,
impaired process efficiency and throughput, and equipment fouling and corrosion.
The degradation products generate environmental impacts such as gaseous
pollutants and liquid wastes. The direct and indirect costs resulting from amine
degradation are considerable thus mandating further studies on the chemistry,
mechanisms and kinetics of amine degradation.
Degradation in a typical absorber / stripper system shown in Figure 1.1
can be divided into three types depending on its products, mechanisms, and
conditions.
1. Carbamate polymerization is the most common degradation mechanism. It
requires carbon dioxide and high temperature. Since only primary and secondary
alkanolamines form carbamates with CO2, tertiary amines do not undergo this
type of degradation reaction. The degradation products resulting from carbamate
polymerization are usually of high molecular weight. Carbamate polymerization
is expected to occur at the higher temperature of the stripper.

5
2. Oxidative degradation requires the presence of oxygen and is catalyzed by iron.
The degradation products are typically oxidized fragments of the solvent. For
MEA, oxidation products include heat stable salts such as acetates, formates, and
glycolates; ammonia is also produced as major degradation product. Since flue
gas contains 5 to 10% O2, oxidative degradation can be significant. Neither CO2
nor high temperature is required in this case. Oxidative degradation is expected
to occur in the presence of dissolved O2 in the liquid holdup at the bottom of the
absorber. It may also occur in the absence of O2 at the higher temperature of the
stripper by reaction with oxidized states of dissolved metals such as Fe+3.
3. Thermal degradation is not commonly encountered since it involves
temperatures higher than 205 °C; therefore, it is the least well studied.
1.5 Scope of this Work
This work focuses on the oxidative degradation of monoethanolamine
used in CO2 capture from flue gas. The rate of NH3 production, which is
indicative of the overall rate of degradation, is measured in a batch system. All of
the oxidation experiments were performed at 55°C, 1atm, which corresponds to
typical operating conditions of the absorber. The effects of MEA, CO2 loading,
and dissolved iron (both Fe+2 and Fe+3) on the rate of NH3 production were
quantified. This study also investigates the effect of additives including chelating
agents, free radical inhibitors, and catalyst.
6
Chapter Two
Expected Mechanisms and Results
2.1 Mechanism
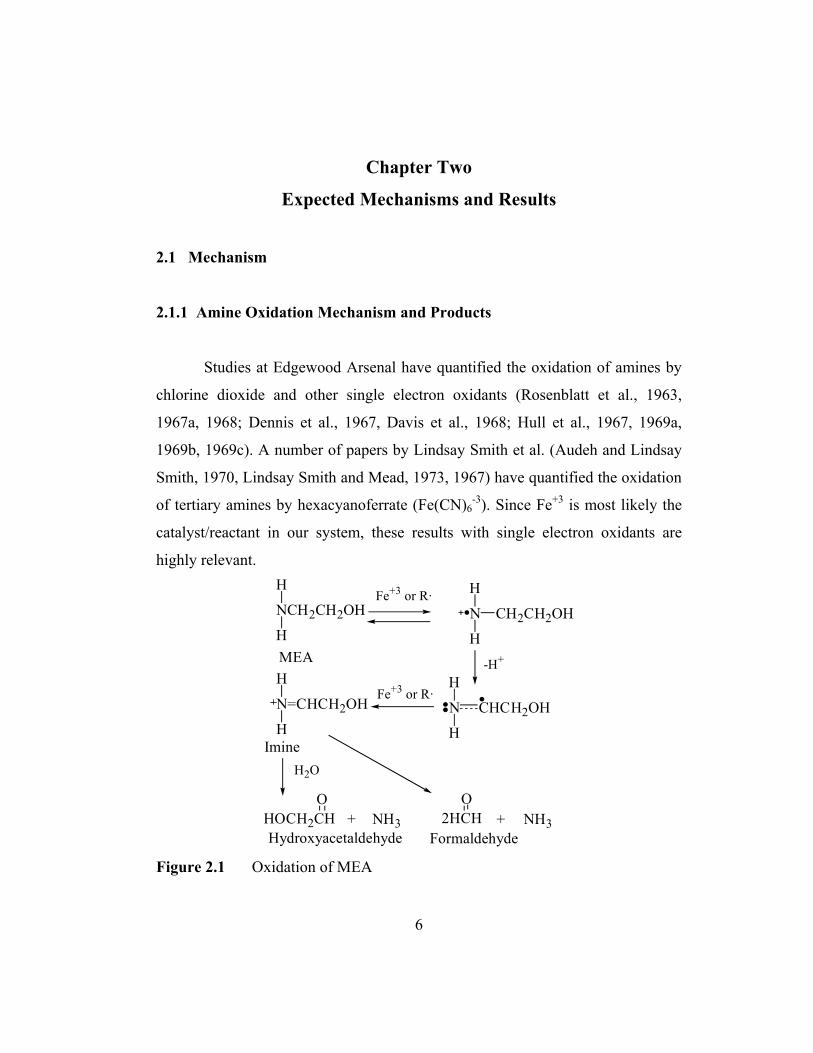
2.1.1 Amine Oxidation Mechanism and Products
Studies at Edgewood Arsenal have quantified the oxidation of amines by
chlorine dioxide and other single electron oxidants (Rosenblatt et al., 1963,
1967a, 1968; Dennis et al., 1967, Davis et al., 1968; Hull et al., 1967, 1969a,
1969b, 1969c). A number of papers by Lindsay Smith et al. (Audeh and Lindsay
Smith, 1970, Lindsay Smith and Mead, 1973, 1967) have quantified the oxidation
of tertiary amines by hexacyanoferrate (Fe(CN)6-3). Since Fe+3 is most likely the
catalyst/reactant in our system, these results with single electron oxidants are
highly relevant. H
NCH2CH2OH
H
Fe+3 or R· H
N
H
CH2CH2OH
H
N
H
CHCH2OH
-H+
H
N=CHCH2OH
H
H2O
HOCH2CH
MEA
Imine
O+ NH3 2HCH + NH3
O
FormaldehydeHydroxyacetaldehyde
Fe+3 or R·
Figure 2.1 Oxidation of MEA

7
The mechanism for MEA oxidation according to the general scheme proposed by
these researchers is shown in Figure 2.1 (Hull et al., 1969a). A reactive free
radical, such as ClO2 or Fe+3, extracts an electron from the nitrogen of an
unprotonated MEA molecule to form an aminium cation radical. This is usually
the rate-limiting step. The cation radical loses a proton to form the imine radical
where the radical is delocalized between the nitrogen and the carbon. Imine
radical is attacked by another free radical or Fe+3 to produce an imine. Imine can
either hydrolyze to form hydroxyacetaldehyde and NH3 resulting from the C-N
bond cleavage, or it can form 2 moles of formaldehyde and NH3 resulting from
the C-C bond cleavage. The latter mechanism is often referred to as oxidative
fragmentation (Dennis et al., 1967).
Rosenblatt et al. (1968) recognized that the oxidation of some amines
could also be initiated by the extraction of a proton from the α-carbon giving the
imine radical directly without forming the aminium cation radical. However,
most of the evidence with aliphatic amines suggests that electron extraction is the
dominant mechanism.
2.1.2 Aldehydes
Aldehydes react with water; in aqueous solution 99% of formaldehyde is
hydrated (Singh et al.,1969). Aldehydes also react readily with primary amines.
These reactions would not be significant with tertiary amines. In aqueous
solution of monoethanolamine, formaldehyde will be present as an equilibrium
mixture primarily in the form of imine with some hydrated aldehyde,
carbinolamine, and aminal (Figure 2.2). Similar reactions can occur with other
aldehydes such as hydroxyacetaldehyde.

8
HCHO
+ HOCH2CH2NH2
OH
C-NHCH2CH2OH
HH
Carbinolamine
HCHO
+ H2OOH
C-OH
HH Hydrated aldehyde
HOCH2CH2NH2
+
NHCH2CH2OH
C-NHCH2CH2OH
HH
Aminal
C=NCH2CH2OH
H
H
Imine
-H2O
Figure 2.2 Reaction of Formaldehyde with Monoethanolamine
At high pH formaldehyde is oxidized by Fe(CN)63- (Singh et al., 1969)
and probably by other similar single electron oxidants. The reaction requires
hydroxide to get the ionized hydrated formaldehyde, which is then attacked by
Fe+3. The resulting radical loses a proton to another Fe+3 and the oxidation results
in formate ion.
OH
C-OH
HH + OH-
OH
C-O-
HH + Fe(CN)6
-3
OH
C-O-
H
H
OH
C-O·
HH
OH
C-O·
HH
Fe(CN)6-4+
+ Fe(CN)6-3 O
C-O-
HH Fe(CN)6
-4+ + H+
Figure 2.3 Reaction of Formaldehyde with Fe(CN)6
3- at High pH
9
The imine formed from primary or secondary amines such as MEA may
be subject to similar attack by radical oxidants. The presence of formaldehyde
may also facilitate the oxidation of the amine molecule.
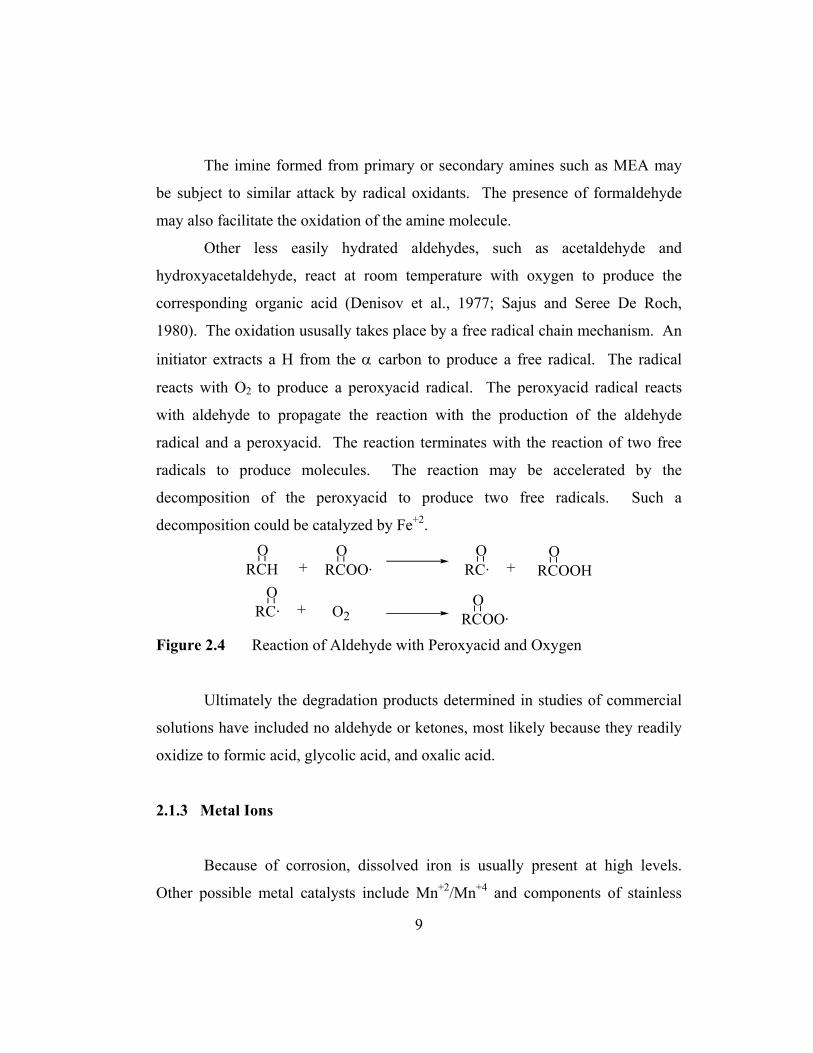
Other less easily hydrated aldehydes, such as acetaldehyde and
hydroxyacetaldehyde, react at room temperature with oxygen to produce the
corresponding organic acid (Denisov et al., 1977; Sajus and Seree De Roch,
1980). The oxidation ususally takes place by a free radical chain mechanism. An
initiator extracts a H from the α carbon to produce a free radical. The radical
reacts with O2 to produce a peroxyacid radical. The peroxyacid radical reacts
with aldehyde to propagate the reaction with the production of the aldehyde
radical and a peroxyacid. The reaction terminates with the reaction of two free
radicals to produce molecules. The reaction may be accelerated by the
decomposition of the peroxyacid to produce two free radicals. Such a
decomposition could be catalyzed by Fe+2.
+O
RCHO
RCOO·O
RC· +O
RCOOHO
RC· + O2O
RCOO· Figure 2.4 Reaction of Aldehyde with Peroxyacid and Oxygen
Ultimately the degradation products determined in studies of commercial
solutions have included no aldehyde or ketones, most likely because they readily
oxidize to formic acid, glycolic acid, and oxalic acid.
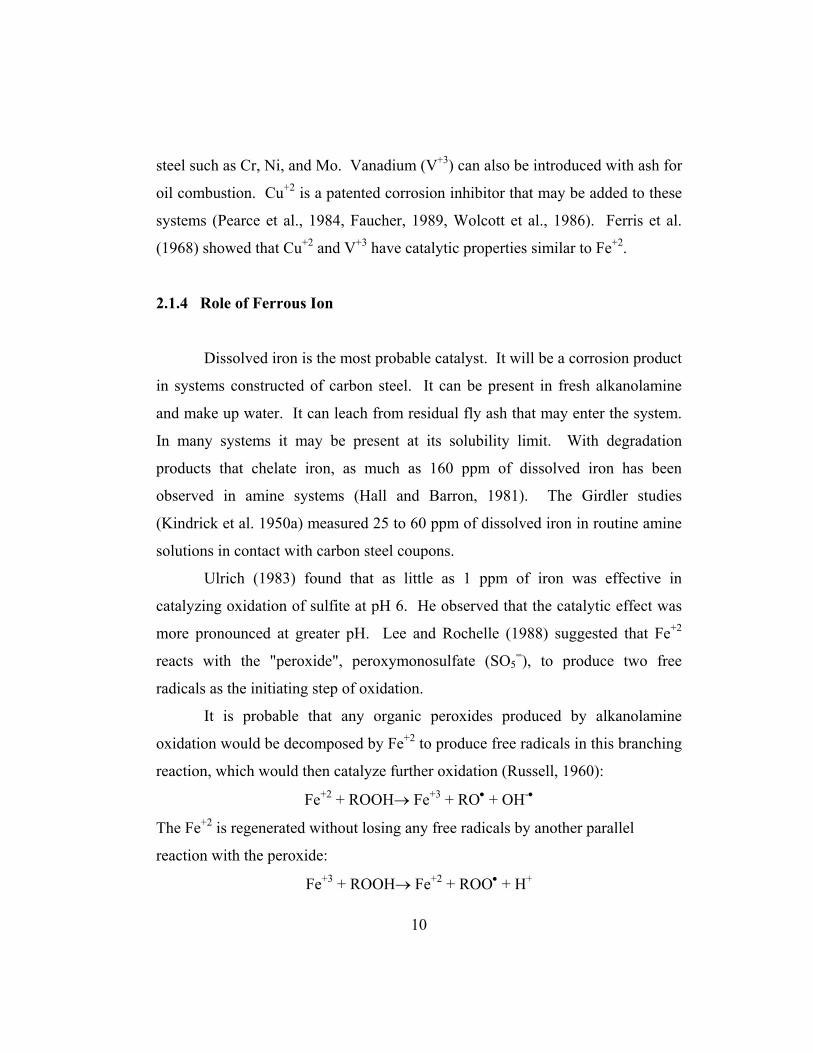
2.1.3 Metal Ions
Because of corrosion, dissolved iron is usually present at high levels.
Other possible metal catalysts include Mn+2/Mn+4 and components of stainless
10
steel such as Cr, Ni, and Mo. Vanadium (V+3) can also be introduced with ash for
oil combustion. Cu+2 is a patented corrosion inhibitor that may be added to these
systems (Pearce et al., 1984, Faucher, 1989, Wolcott et al., 1986). Ferris et al.
(1968) showed that Cu+2 and V+3 have catalytic properties similar to Fe+2.
2.1.4 Role of Ferrous Ion
Dissolved iron is the most probable catalyst. It will be a corrosion product
in systems constructed of carbon steel. It can be present in fresh alkanolamine
and make up water. It can leach from residual fly ash that may enter the system.
In many systems it may be present at its solubility limit. With degradation
products that chelate iron, as much as 160 ppm of dissolved iron has been
observed in amine systems (Hall and Barron, 1981). The Girdler studies
(Kindrick et al. 1950a) measured 25 to 60 ppm of dissolved iron in routine amine
solutions in contact with carbon steel coupons.
Ulrich (1983) found that as little as 1 ppm of iron was effective in
catalyzing oxidation of sulfite at pH 6. He observed that the catalytic effect was
more pronounced at greater pH. Lee and Rochelle (1988) suggested that Fe+2
reacts with the "peroxide", peroxymonosulfate (SO5=), to produce two free
radicals as the initiating step of oxidation.
It is probable that any organic peroxides produced by alkanolamine
oxidation would be decomposed by Fe+2 to produce free radicals in this branching
reaction, which would then catalyze further oxidation (Russell, 1960):
Fe+2 + ROOH→ Fe+3 + RO• + OH-•
The Fe+2 is regenerated without losing any free radicals by another parallel
reaction with the peroxide:
Fe+3 + ROOH→ Fe+2 + ROO• + H+
11
The two organic free radicals produced by this sequence can initiate another
series of oxidation reactions. This reaction is analogous to that occurring with
Fenton's reagent (H2O2, Fe+2).
The direct reaction of Fe+2 with O2 may be an important source of free
radicals (Fe+3) and a way of getting O2 into the oxidation mechanism. In water
Fe+2 appears to react with O2 with intermediates such as hydroperoxy radical
(HOO•), oxygen radical (O2•) and hydrogen peroxide (Stumm and Lee, 1961).
Fe+2 +O2 → Fe+3 + O2-•
Fe+2 + O2-• → Fe+3 + H2O2
Fe+2 + H2O2→ Fe+3 + OH-+ OH•
Fe+2 + OH• → Fe+3 + OH-
At pH 6 - 7.5 the rate of oxidation is second order in hydroxide ion
concentration and first order in Fe+2 and oxygen. Anions such as sulfate (Tamura
et al., 1976) and chelating agents such as EDTA (ethylenediamine tetraacetic
acid) and NTA (nitrilotriacetic acid) do not appear to modify the oxidation
significantly (Sada et al., 1987). In a working solution, the free radicals O2-• and
OH• and H2O2 could react directly with the amine.
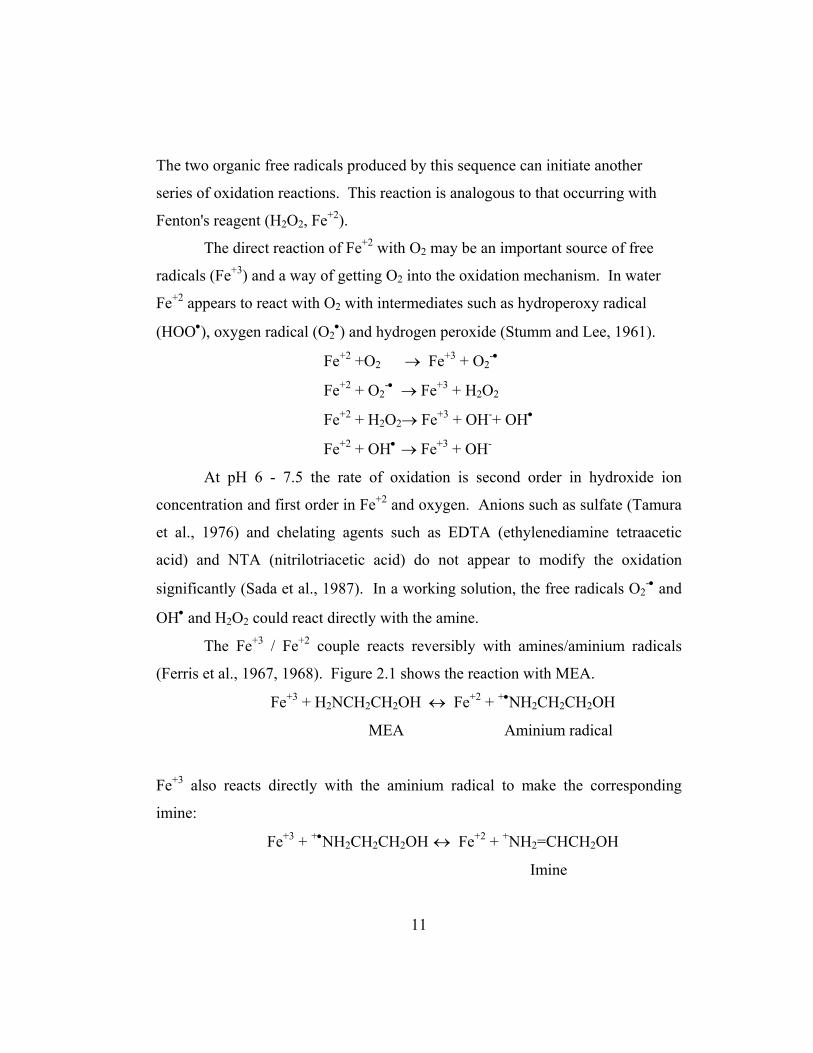
The Fe+3 / Fe+2 couple reacts reversibly with amines/aminium radicals
(Ferris et al., 1967, 1968). Figure 2.1 shows the reaction with MEA.
Fe+3 + H2NCH2CH2OH ↔ Fe+2 + +•NH2CH2CH2OH
MEA Aminium radical
Fe+3 also reacts directly with the aminium radical to make the corresponding
imine:
Fe+3 + +•NH2CH2CH2OH ↔ Fe+2 + +NH2=CHCH2OH
Imine

12
In the case of tertiary amines, rapid hydrolysis of the imine to aldehyde
and secondary amine would mean that there is never the possibility of an α H
prone to free radical or oxygen attack. The net effect of oxidation of a tertiary
amine is simply the production of one mole of aldehyde and a secondary amine
with the consumption of two moles of Fe+3. In contrast, the oxidation of a
secondary or primary amine gives more stable imines or enamines that are subject
to oxidation at α H's.
2.1.5 Role of Copper
Several patents assigned to Dow Chemical address the use of cupric salts
as corrosion inhibitors in alkanolamine system, especially in the presence of O2
(Wolcott et al., 1968; Pearce et al., 1984; Pearce, 1984; Cringle et al.,1987).
Ferris et al. (1968) showed that Cu+2 and V+3 have catalytic properties similar to
Fe+2.
2.1.6 Autooxidation
Oxygen may enter the reaction as peroxides. Most autooxidations show
reactions of O2 with a free radical on a carbon. A possible route for oxidation is
the extraction of H or loss of H+ on a α (next to nitrogen) or β carbon. Molecular
oxygen reacts with the carbon-centered radical to make a peroxy radical. The
peroxy radical could react with Fe+2 or Fe+3 to produce additional radicals in a
branching reaction. Such a mechanism would not applicable if the carbon
adjacent to the nitrogen or α carbon were tertiary.

13
2.1.7 Data on Reaction Rates
A number of fundamental studies of free radical reaction kinetics have
been compiled (Neta et al., 1988; Anbar and Neta, 1967; Howard and Scaiano,
1984; Asmus and Bonifacic, 1984). Rate constants for reactions of several
radicals with a number of amines and other substrates are summarized in Table
2.1. The sulfate radical can be present in our systems with S(IV). It might also
be representative of other highly reactive radicals such as OH•. The carbonate
radical is less reactive and could be a dominant radical in a loaded system.
Bicarbonate reacts with sulfate radical at a rate that is comparable to the alcohols.
Table 2.1 Second Order Rate Constants (L mol-1 s-1) for Free Radical Reactions, Neta et al (1988), Anbar and Neta (1967), Howard and Scaiano (1984), Asmus and Bonifacic (1984)
Radical CO3-• SO4
• (CH3)3COO• (CH3)3CO• ClO2• OH•
Inorganic CO3
= 2e8 HCO3
= 9.1e6 1e7 Fe+2 9.9e8 2.5e8 Fe(CN)6
-4 7.4e7 8.1e9 Mn+2 1.5e7 2.0e7 8.6e9 NH3 1.4e7 NH4
+ 3e5 SO3
= 1.3e7 2e9 7.8e5 3.0e9 S2O3
= 1e9 Primary Alcohols Methanol 5e3 3.2e6 1.3e5 6.1e8 Ethanol 1.5e4 1.6e7 1.1e6 1.1e9 1-propanol 1.9e4 5.8e7 1.1e9 Secondary Alcohols 2-methyl-2-propanol <2e2 4e5 2.1e9 2-propanol 5e4 3.2e7 9e-3 1.8e6 1.3e9 Primary Amines Methylamine, high pH 1.4e9 Isopropylamine 5e5 Isobutylamine 4e5 N-propylamine 1.7e7 Butylamine 4e5 Tert-butylamine 5.4e4 3.3e6
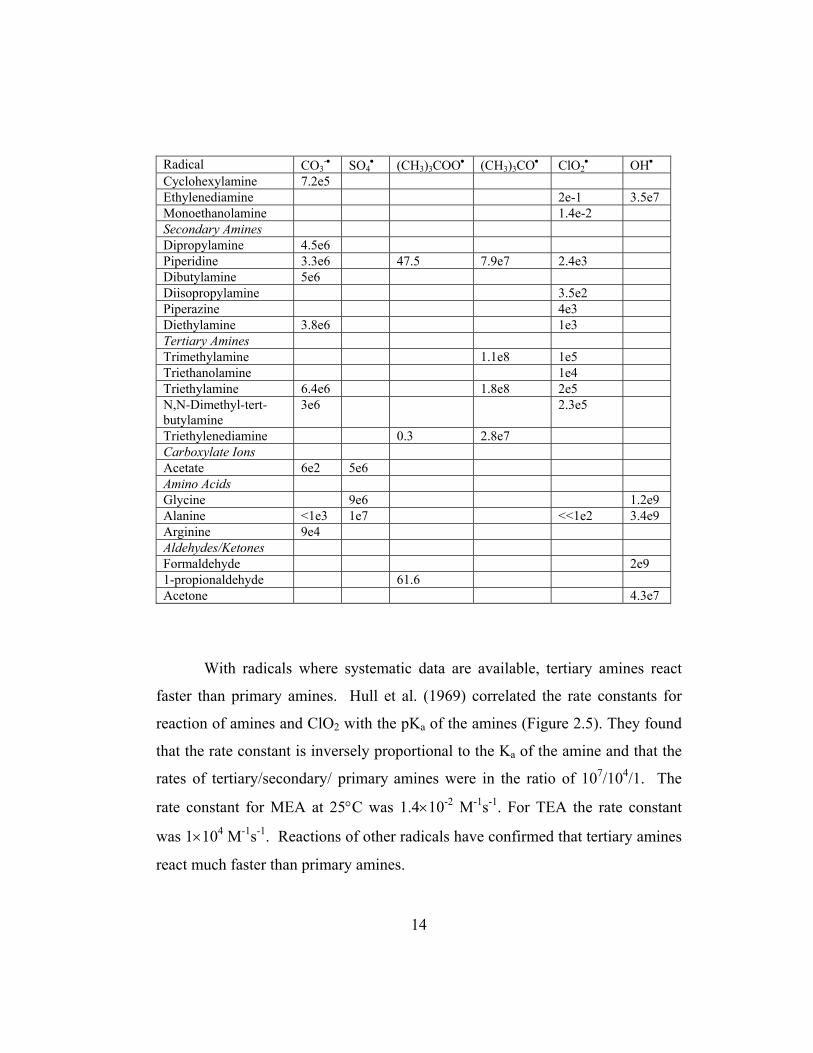
14
Radical CO3-• SO4
• (CH3)3COO• (CH3)3CO• ClO2• OH•
Cyclohexylamine 7.2e5 Ethylenediamine 2e-1 3.5e7 Monoethanolamine 1.4e-2 Secondary Amines Dipropylamine 4.5e6 Piperidine 3.3e6 47.5 7.9e7 2.4e3 Dibutylamine 5e6 Diisopropylamine 3.5e2 Piperazine 4e3 Diethylamine 3.8e6 1e3 Tertiary Amines Trimethylamine 1.1e8 1e5 Triethanolamine 1e4 Triethylamine 6.4e6 1.8e8 2e5 N,N-Dimethyl-tert-butylamine
3e6 2.3e5
Triethylenediamine 0.3 2.8e7 Carboxylate Ions Acetate 6e2 5e6 Amino Acids Glycine 9e6 1.2e9 Alanine <1e3 1e7 <<1e2 3.4e9 Arginine 9e4 Aldehydes/Ketones Formaldehyde 2e9 1-propionaldehyde 61.6 Acetone 4.3e7
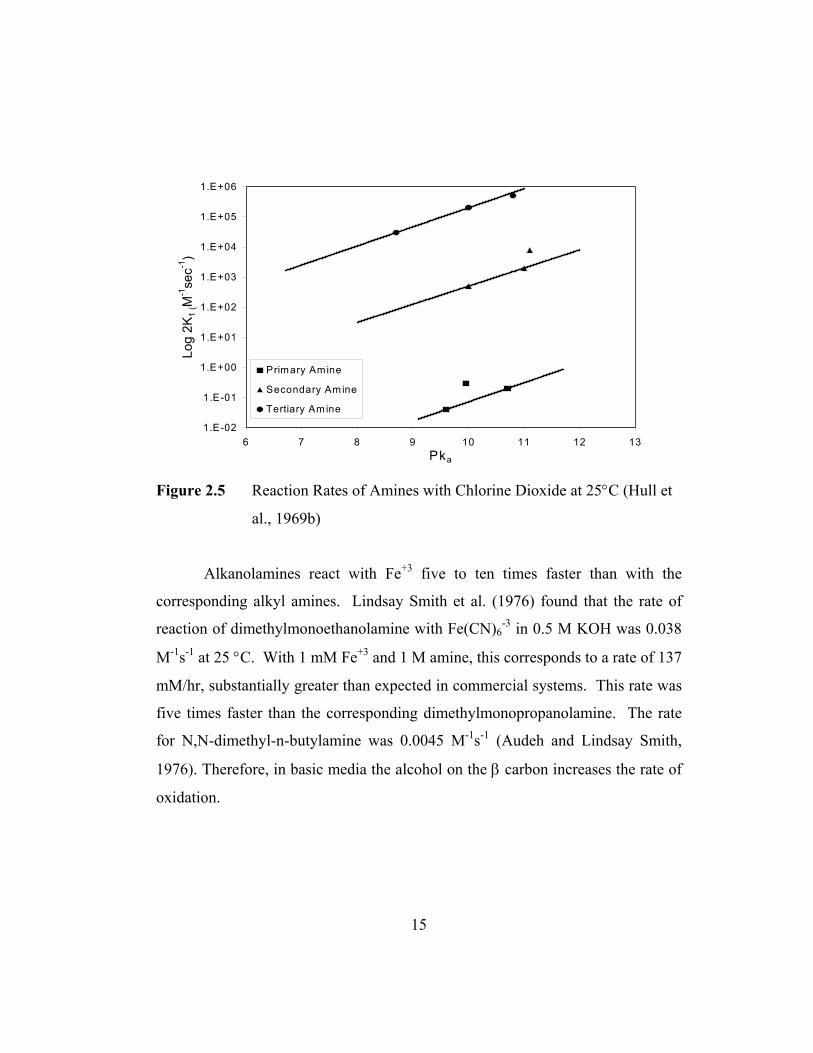
With radicals where systematic data are available, tertiary amines react
faster than primary amines. Hull et al. (1969) correlated the rate constants for
reaction of amines and ClO2 with the pKa of the amines (Figure 2.5). They found
that the rate constant is inversely proportional to the Ka of the amine and that the
rates of tertiary/secondary/ primary amines were in the ratio of 107/104/1. The
rate constant for MEA at 25°C was 1.4×10⁻² M-1s-1. For TEA the rate constant
was 1×10⁴ M-1s-1. Reactions of other radicals have confirmed that tertiary amines
react much faster than primary amines.
15
1.E-02
1.E-01
1.E+00
1.E+01
1.E+02
1.E+03
1.E+04
1.E+05
1.E+06
6 7 8 9 10 11 12 13Pka
Log
2K1
(M-1
sec-1
)
Primary Amine
Secondary Amine
Tertiary Amine
Figure 2.5 Reaction Rates of Amines with Chlorine Dioxide at 25°C (Hull et
al., 1969b)
Alkanolamines react with Fe+3 five to ten times faster than with the
corresponding alkyl amines. Lindsay Smith et al. (1976) found that the rate of
reaction of dimethylmonoethanolamine with Fe(CN)6-3 in 0.5 M KOH was 0.038
M-1s-1 at 25 °C. With 1 mM Fe+3 and 1 M amine, this corresponds to a rate of 137
mM/hr, substantially greater than expected in commercial systems. This rate was
five times faster than the corresponding dimethylmonopropanolamine. The rate
for N,N-dimethyl-n-butylamine was 0.0045 M-1s-1 (Audeh and Lindsay Smith,
1976). Therefore, in basic media the alcohol on the β carbon increases the rate of
oxidation.

16
2.2 Navy Studies
Oxygen is known to be present in streams such as flue gas or in CO2
contaminated air in submarines. The efforts of the U.S. Navy to clean up CO2
contaminated air in nuclear powered submarines drove the earliest work on
oxidative degradation of alkanolamines.
2.2.1 Girdler Studies (1950)
The goal of one study (Kindrick et al., 1950a) was to test the relative
resistance to oxidative degradation of possible CO2 absorbents that are to be used
in the presence of oxygen. Thirty-nine amines and eleven mixtures of amines
were tested for relative resistance to oxidation. Selected results are given in Table
2.2.
The accelerated oxidation test used in this study involved contacting a gas
mixture consisting of 50% CO2 and 50% O2 at a rate of 100 cc/min for 166 hrs
with 100 ml of 2.5 N amine solution at 80°C. These experiments were performed
with 25 - 60 ppm (0.5 - 1 mM) of dissolved iron in solution. The analytical
methods involve determining the free amine concentration by titration. Total
organic N2 was determined using the Micro Kjeldahl method. Ammonia is
condensed into ammonium carbonate. The equivalents of ammonia are
determined to close the N2 balance.
The loss of alkalinity from primary amines (MEA and DGA) was about 5
mM/hr. Secondary amines such as DEA oxidize about twice as fast (10 mM/hr).
The hindered primary amines (AMP and isobutanolamine), the tertiary amines
(MDEA), the K+ salt of alanine, and mixtures of MDEA with other amines (and
17
diethylaminopropylamine) degrade at rates less than 1 mM/hr, approaching the
detection limit of the experiment.
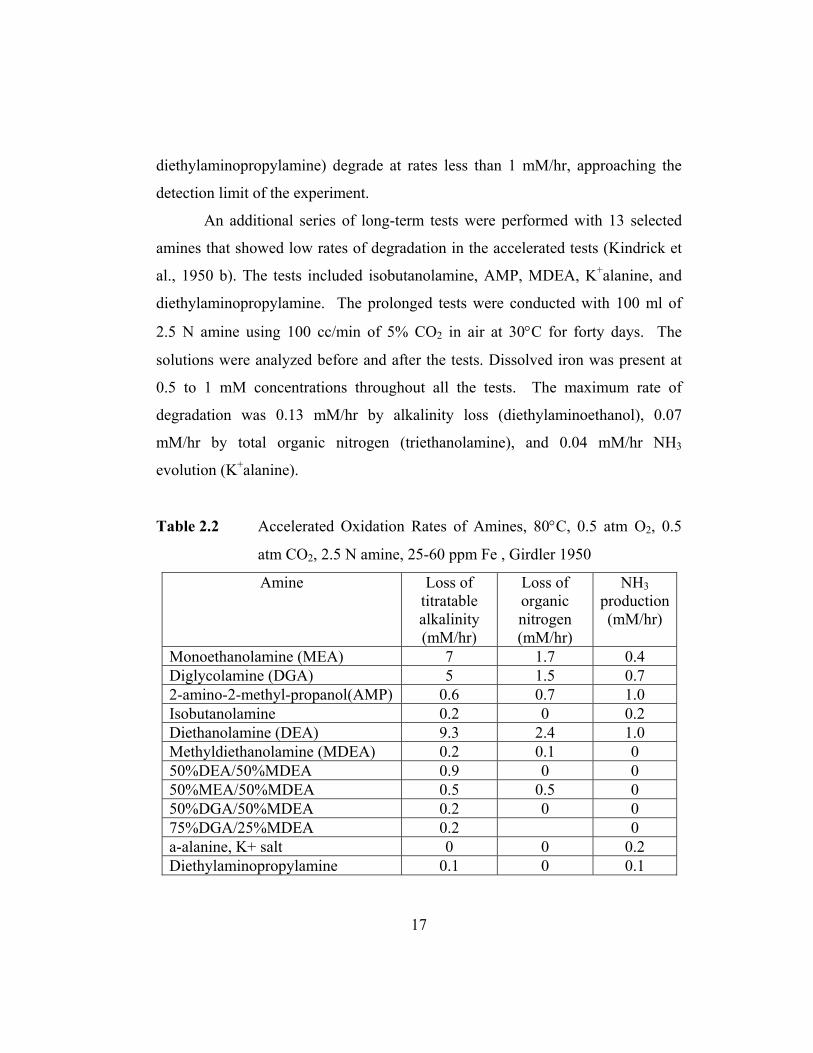
An additional series of long-term tests were performed with 13 selected
amines that showed low rates of degradation in the accelerated tests (Kindrick et
al., 1950 b). The tests included isobutanolamine, AMP, MDEA, K+alanine, and
diethylaminopropylamine. The prolonged tests were conducted with 100 ml of
2.5 N amine using 100 cc/min of 5% CO2 in air at 30°C for forty days. The
solutions were analyzed before and after the tests. Dissolved iron was present at
0.5 to 1 mM concentrations throughout all the tests. The maximum rate of
degradation was 0.13 mM/hr by alkalinity loss (diethylaminoethanol), 0.07
mM/hr by total organic nitrogen (triethanolamine), and 0.04 mM/hr NH3
evolution (K+alanine).
Table 2.2 Accelerated Oxidation Rates of Amines, 80°C, 0.5 atm O2, 0.5
atm CO2, 2.5 N amine, 25-60 ppm Fe , Girdler 1950
Amine Loss of titratable alkalinity (mM/hr)
Loss of organic nitrogen (mM/hr)
NH3 production (mM/hr)
Monoethanolamine (MEA) 7 1.7 0.4 Diglycolamine (DGA) 5 1.5 0.7 2-amino-2-methyl-propanol(AMP) 0.6 0.7 1.0 Isobutanolamine 0.2 0 0.2 Diethanolamine (DEA) 9.3 2.4 1.0 Methyldiethanolamine (MDEA) 0.2 0.1 0 50%DEA/50%MDEA 0.9 0 0 50%MEA/50%MDEA 0.5 0.5 0 50%DGA/50%MDEA 0.2 0 0 75%DGA/25%MDEA 0.2 0 a-alanine, K+ salt 0 0 0.2 Diethylaminopropylamine 0.1 0 0.1

18
From the primary alkanolamines tested in this study, three conclusions can
be drawn about the nature of the chemical structure and the likelihood of
oxidation. First, the rate of oxidation of an alkanolamine depends on the type of
hydroxyl group present. Primary alcohol groups oxidize more readily than
secondary alcohol groups which oxidize much more readily than tertiary alcohol
groups. Tertiary alcohols are especially resistant to oxidation. Second, the rate of
oxidation depends on the type of α carbon adjacent to the amino group. Amines
with primary and secondary α carbons have hydrogen(s) that can be abstracted by
free radicals; therefore, they exhibit higher oxidation rates than amines with a
tertiary α carbon. Lastly, amines with primary alcohol groups oxidize more
readily than amines with primary α carbons.
CCH2NH2H3C
CH3
OHCCH2OHH3C
CH3
NH2
H2NCH2CH2OH >>
MEA 2-amino-2-methyl-1-propanol isobutanolamine Figure 2.6 Degradation Prediction Based on Chemical Structures (Girdler,
1950)
These three predictions can be seen from the analysis of the three
alkanolamines in Figure 11. It is experimentally determined that MEA oxidizes
the most, followed by 2-amino-2-methy1-propanol, followed by isobutanolamine.
All three amines are primary amines, meaning that their amino group has only
carbon substitution. MEA has a primary alcohol group and a primary α carbon
(the carbon adjacent to the amino group only has one carbon substitution). The
second amine, 2-amino-2-methyl-1-propanol, has a primary alcohol group and a
tertiary α carbon. And lastly, isobutanolamine has a tertiary alcohol group and a
primary α carbon. Comparison of MEA with isobutanolamine verifies the

19
conclusion that primary alcohol groups oxidize more than tertiary alcohol groups.
Comparison of the first two amines verifies the conclusion that tertiary α carbon
oxidizes less readily than primary α carbon. Comparison of the last two amines
verifies the conclusion that primary alcohol groups oxidize more readily than
primary α carbon.
The order of least resistance, as far as groups present in an alkanolamine,
is as follows: 1) secondary amino groups, 2) primary alcohol groups, and (3)
primary amino group attached to a primary α carbon.
The failure of tertiary alkanolamines containing primary alcohol groups to
undergo appreciable oxidation is unexpected and contrary to the above
predictions. Therefore, it is suggested that tertiary amino groups have the
unexpected property of slowing degradation of primary alcohol groups. Further
experimental evidence is found in the blends of tertiary amines with primary and
secondary amines. The results showed markedly reduced rates of oxidation of
primary and secondary amines that are in the presence of tertiary amines.
2.2.2 Blachly and Ravner (1964)
MEA is used as a regenerative absorbent in CO2 scrubbers for atmosphere
purification aboard nuclear-powered submarines. This study evaluates the
effectiveness of additives in the stabilization of MEA solution in the presence of
oxidation-catalyzing metals. Aeration oxidation experiments were performed at
55 °C with 4 M MEA. Air at a rate of 1cc. per ml of solution per minute was
sparged into a 300 ml sample. All MEA used was redistilled and stored at 5 °C.
Ammonia evolution was monitored by passing the effluent air through 2% boric
acid solutions, which were periodically titrated with strong acid. Total nitrogen
20
was determined by conventional Kjeldahl analysis, and peroxide formation was
measured by iodine-thiosulfate method.
The first important conclusion of this study was that in the absence of
CO2, no degradation was observed. The addition of 1% CO2 to the air stream
simulating submarine atmospheric conditions resulted in almost instantaneous
degradation characterized by the production of ammonia and peroxides. The rate
of NH3 evolution was 0.14 mM/hr with 100 ml of 4 N MEA solution.
With the addition of the compound, N,N-diethanolglycine or bicine at 1.5
wt %, no degradation was observed during a period of six weeks, indicating that
the chelate was an efficient antioxidant.
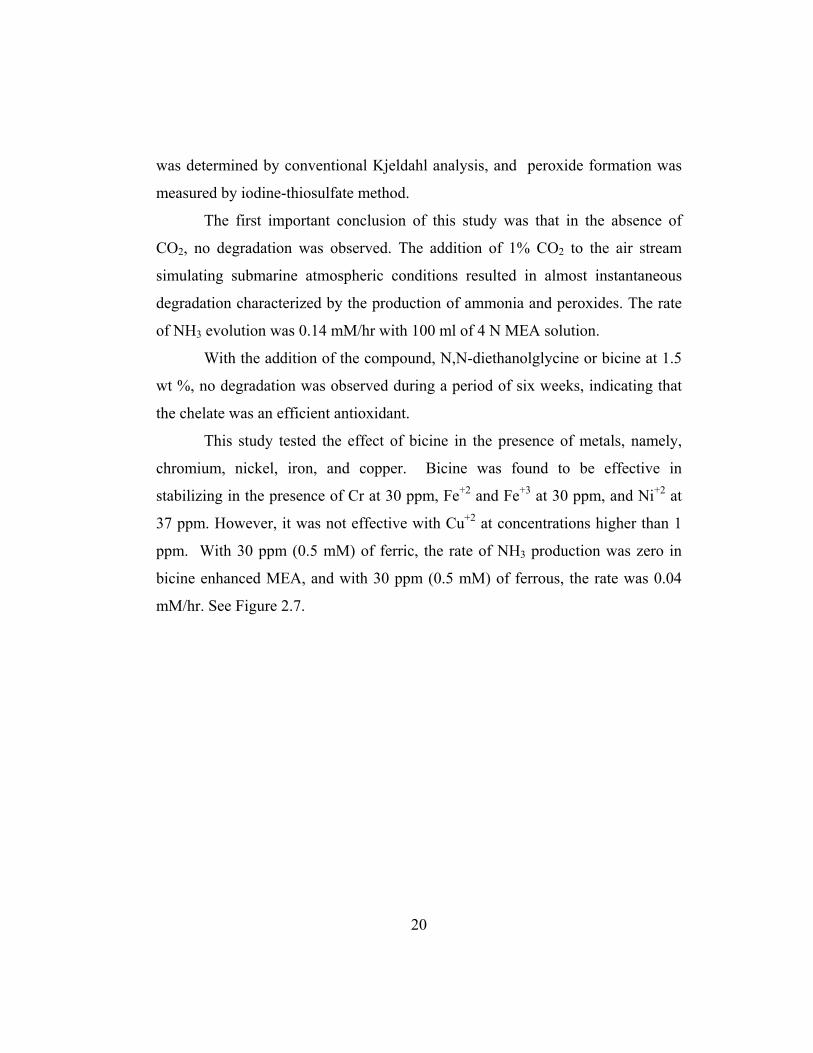
This study tested the effect of bicine in the presence of metals, namely,
chromium, nickel, iron, and copper. Bicine was found to be effective in
stabilizing in the presence of Cr at 30 ppm, Fe+2 and Fe+3 at 30 ppm, and Ni+2 at
37 ppm. However, it was not effective with Cu+2 at concentrations higher than 1
ppm. With 30 ppm (0.5 mM) of ferric, the rate of NH3 production was zero in
bicine enhanced MEA, and with 30 ppm (0.5 mM) of ferrous, the rate was 0.04
mM/hr. See Figure 2.7.

21
0
0.1
0.2
0.3
0.4
0.5
0 1 2 3 4 5 6 7
Days
Rat
e of
NH
3 Evo
lutio
n, M
EQ
per
100
ml 4
N
MEA
Fe+3 (30 ppm)Fe+2 (30 ppm)Ni+2 (37 ppm)Cu+2 (10 ppm)Cr+2 (30 ppm)
Figure 2.7 Effect of Bicine in the Presence of Metals (Blachly and Ravner,
1964)
Oxidation with the additive ethylenediaminetetraacetate (EDTA) resulted
in no NH3 production in a 1-week period with 30 ppm of Cu+2 present. The
additive was less effective than bicine in the presence of metals other than Cu+2.
The researchers hypothesized that the presence of peroxides in oxidized
MEA solutions suggested that oxidation of amine was peroxide-auto-catalyzed.
Both bicine and EDTA reacted with and destroyed peroxides and in turn were
converted to amine oxides.
2.2.3 Rooney, Dupart, and Bacon (1998)
This work quantified the rate of oxidation of various alkanolamines in the
presence of O2 with and without CO2 present. The degradation products used to

22
quantify degradation were heat stable salts such as acetates, formates, glycolates,
and oxalates, which were analyzed using ion chromatography.
Oxidation experiments were performed by sparging compressed air into
amine solutions with and without 0.25 mol CO2/mol amine. The solutions were
agitated and kept at a temperature of 80 °C for 28 days. The amines used by Dow
were not further purified and probably contain a significant amount of dissolved
iron.
When the total concentrations of anions in each solution were plotted
against time, oxidation resistance increased in the order: 30% DEA > 50%
MDEA > 30% MDEA > 50 % DGA > 20% MEA for oxidation without CO2
(Figure 2.8).
0
5
10
15
20
25
30
35
0 5 10 15 20 25 30Days
mm
oles
Ani
on T
otal
30% DEA50% MDEA30% MDEA50% DGA20% MEA
Figure 2.8 Comparison of Total Anions Measured for Unloaded Amines
(Rooney, 1998)

23
With CO2 loading of 0.25, the oxidation resistance increased in the order:
30% DEA > 50% DGA > 20% MEA > 50% MDEA > 30% MDEA. See Figure
2.9.
The rate of anion formation in 20 wt % of unloaded MEA is 3.3 mM/hr
which is three times greater than the rate of 1.1 mM/hr in 20 wt % loaded MEA.
The total anions is less for all the amines they tested when CO2 is present
compared to when CO2 is not present leading to the conclusion that CO2
decreases the oxidation of amines.
0
2
4
6
8
10
12
14
16
0 5 10 15 20 25 30Days
mm
ole
Ani
on T
otal
30% DEA50% DGA20% MEA50% MDEA30% MDEA
Figure 2.9 Comparison of Total Anion Measured for 0.25 mole CO2/mole
Amines (Rooney,1998)
The scheme in Figure 2.10 was proposed to account for the presence of all
the anions observed in this study. This mechanism could be applied to any
alkanolamine. Also, it was noted that although the acid form of acetic, formic,
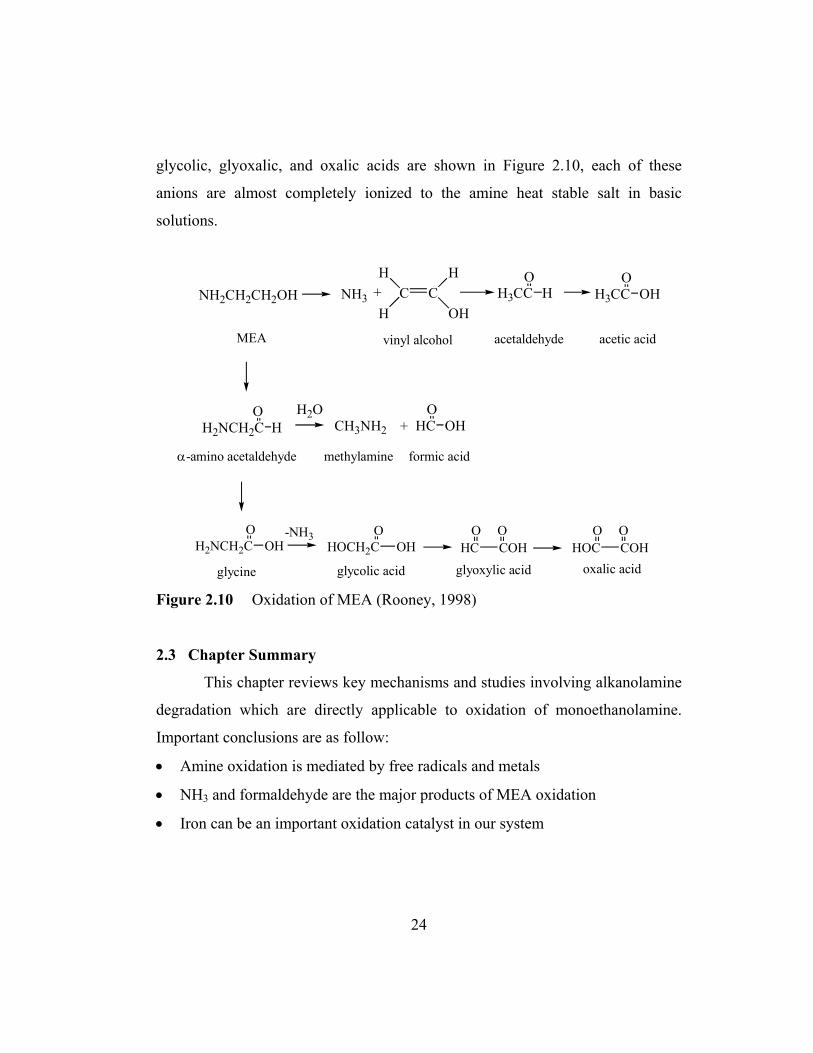
24
glycolic, glyoxalic, and oxalic acids are shown in Figure 2.10, each of these
anions are almost completely ionized to the amine heat stable salt in basic
solutions.
NH2CH2CH2OH
MEA
NH3 + C CH
OH
H
HH3CC H
O
H2NCH2C HO H2O
CH3NH2 + HC OHO
H3CC OHO
H2NCH2C OHO
HOCH2C OHO
HCO
COHO
HOCO
COHO
glycolic acid glyoxylic acid oxalic acidglycine
α-amino acetaldehyde
acetic acid
methylamine formic acid
vinyl alcohol acetaldehyde
-NH3
Figure 2.10 Oxidation of MEA (Rooney, 1998)
2.3 Chapter Summary
This chapter reviews key mechanisms and studies involving alkanolamine
degradation which are directly applicable to oxidation of monoethanolamine.
Important conclusions are as follow:
• Amine oxidation is mediated by free radicals and metals
• NH3 and formaldehyde are the major products of MEA oxidation
• Iron can be an important oxidation catalyst in our system

25
Chapter Three
Experimental Methods and Procedures
This chapter describes the details of the experimental setup, which
includes the sparged reactor along with the supporting equipment used to control
and measure experimental variables. Analytical methods for gas phase and liquid
phase analysis will be presented. Finally, the chapter provides the method of data
reduction.
3.1 Overall Flow Diagram
Figure 3.1 shows the overall flow diagram and the experimental setup.
Figure 3.1 Experimental Flow Diagram for MEA Oxidation
26
The flow system was capable of sparging N2, air, air with a fixed percent CO2,
and pure CO2 into the reactor depending on the conditions of the experiment. The
system operated in a batch mode for the liquid phase. The exit gas from the
reactor was diluted with either air or N2 to eliminate water condensation in the
tubing leading to the FT-IR analyzer. This system also allowed for convenient
ammonia calibration via bypassing the reactor and delivering a known
concentration of NH3 directly to the analyzer. All gases were sent to a knockout
flask before reaching the FT-IR, after which they were sent to the scrubber.
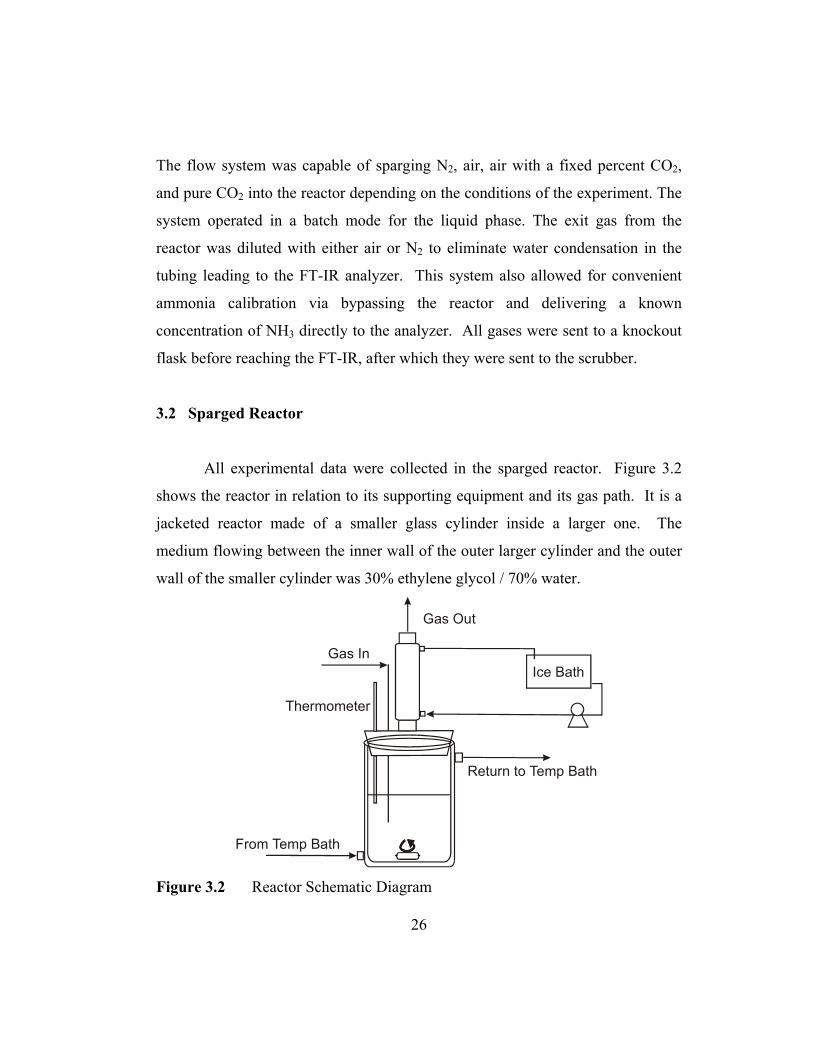
3.2 Sparged Reactor
All experimental data were collected in the sparged reactor. Figure 3.2
shows the reactor in relation to its supporting equipment and its gas path. It is a
jacketed reactor made of a smaller glass cylinder inside a larger one. The
medium flowing between the inner wall of the outer larger cylinder and the outer
wall of the smaller cylinder was 30% ethylene glycol / 70% water.
From Temp Bath
Return to Temp Bath
Gas In
Gas Out
Thermometer
Ice Bath
Figure 3.2 Reactor Schematic Diagram
27
Fr om T emp Bath
R eturn to T emp Bat
G as In
Gas Out
The rmo mete r
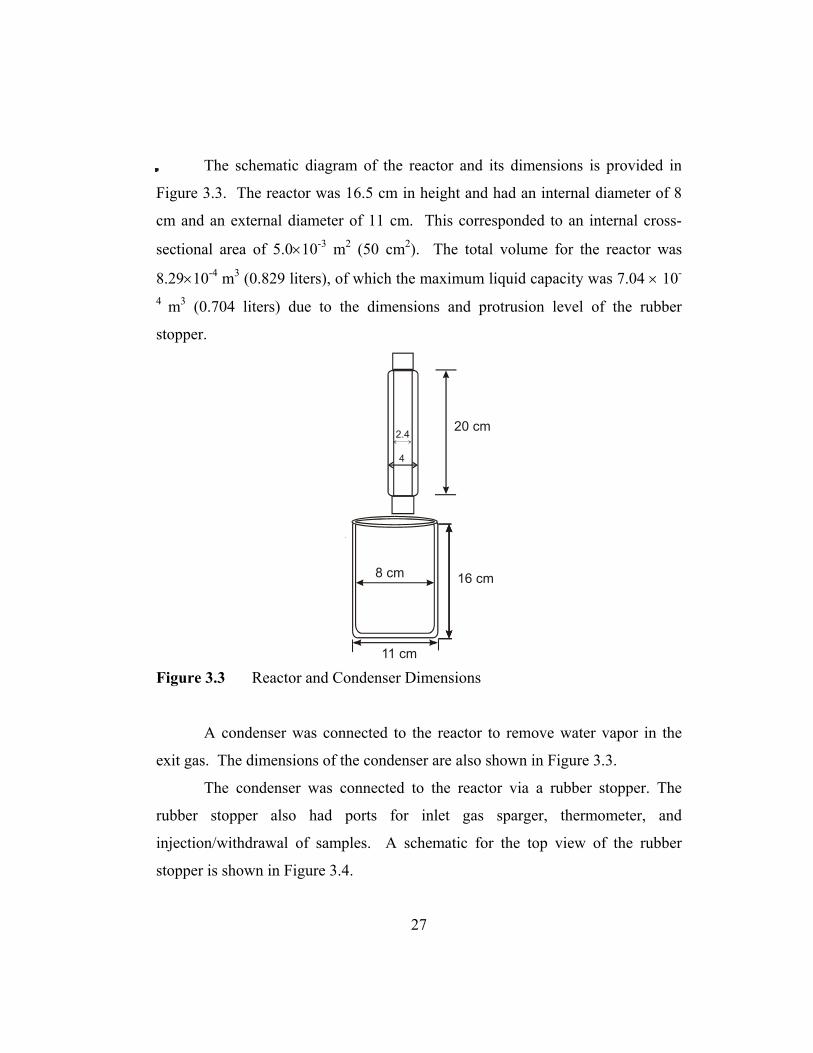
Ice B ath The schematic diagram of the reactor and its dimensions is provided in
Figure 3.3. The reactor was 16.5 cm in height and had an internal diameter of 8
cm and an external diameter of 11 cm. This corresponded to an internal cross-
sectional area of 5.0×10⁻³ m2 (50 cm2). The total volume for the reactor was
8.29×10⁻⁴ m3 (0.829 liters), of which the maximum liquid capacity was 7.04 × 10-
4 m3 (0.704 liters) due to the dimensions and protrusion level of the rubber
stopper.
20 cm
16 cm8 cm
11 cm
4
2.4
Figure 3.3 Reactor and Condenser Dimensions
A condenser was connected to the reactor to remove water vapor in the
exit gas. The dimensions of the condenser are also shown in Figure 3.3.
The condenser was connected to the reactor via a rubber stopper. The
rubber stopper also had ports for inlet gas sparger, thermometer, and
injection/withdrawal of samples. A schematic for the top view of the rubber
stopper is shown in Figure 3.4.

28
Figure 3.4 Reactor Top Plate Configuration and Dimensions
3.3 Supporting Equipment
This section provides the details of other supporting equipment used for
experimental data collection.
All the tubing carrying source gases (air, N2, or CO2) into the reactor were
1/4" polyethylene with the maximum operating temperature of 150 °F. The
sparger used to introduce reaction gases into the reactor was 1/4" OD stainless
steel, protruding the half depth of the solution. The tubing carrying exit gas to the
analyzer was 1/2" OD teflon. From the analyzer, the exit gas was sent to a
scrubber through Tygon 3606 tubing.
Ethylene glycol/water mixture flowed through 3/8" reinforced PVC tubing
between the temperature bath/circulator (MS LAUDA) and the jacketed reactor.
Ice water was circulated between condenser and ice bath using a Cole-Parmer

29
MasterFlex (Model 7520-00) peristaltic pump, equipped with QuickLoad Pump
Head (Model 7021-20) through 1/4" ID Tygon tubing.
Miscellaneous other equipment included a Corning magnetic stir plate for
liquid phase agitation. A K-type thermocouple (Model 2170A-K) was taped to
the outer wall of the condenser, and temperature was displayed on an Omega
Digital Thermometer.
3.4 Source Gases
Most of the oxidation experiments were performed with house air.
Nitrogen was supplied from a liquid nitrogen cyclinder, and pure CO2 was
supplied from another cylinder. Calibration ammonia was a blend of 1000 ppm
of NH3 in N2. The discharge pressure of NH3 was 40 psig, CO2 was 40 psig, N2
was 150 psig, and air was 80 psig. The flow rates of these gases were regulated
using Brooks mass flow meters/controller. Each flow meter was calibrated using
nitrogen or house air.
Details of the source gas used to collect experimental data are provided in
Table 3.1 . The calibration results, applicable ranges, and configuration data for
the flow meters are provided in Table 3.2.
Table 3.1 Gas Cylinder Used for Experimental Data Collection Gas Manufacturer Cylinder
Date Analysis Cylinder
Number Miscellaneous Notes
NH3 in N2
Praxair 7-29-99 1000 ppm (± 1%)
CC109060 2000 psig @70°F 135 ft3
CGA Outlet 705
30
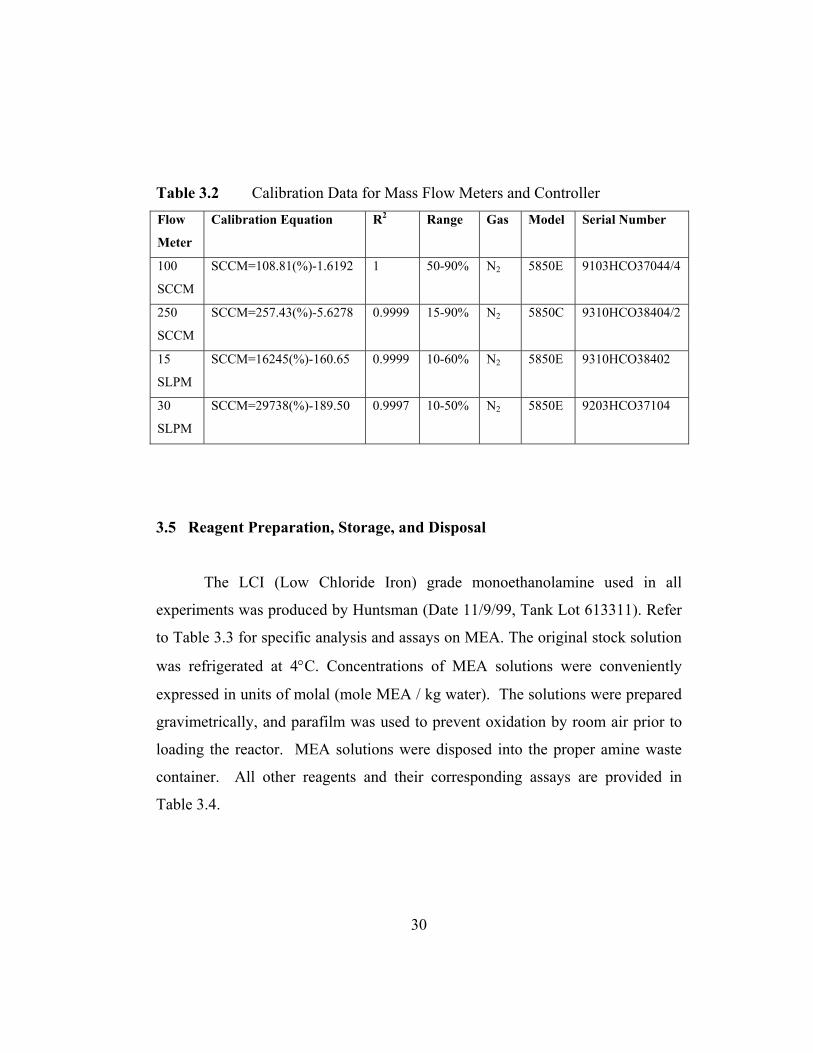
Table 3.2 Calibration Data for Mass Flow Meters and Controller Flow
Meter
Calibration Equation R2 Range Gas Model Serial Number
100
SCCM
SCCM=108.81(%)-1.6192 1 50-90% N2 5850E 9103HCO37044/4
250
SCCM
SCCM=257.43(%)-5.6278 0.9999 15-90% N2 5850C 9310HCO38404/2
15
SLPM
SCCM=16245(%)-160.65 0.9999 10-60% N2 5850E 9310HCO38402
30
SLPM
SCCM=29738(%)-189.50 0.9997 10-50% N2 5850E 9203HCO37104
3.5 Reagent Preparation, Storage, and Disposal
The LCI (Low Chloride Iron) grade monoethanolamine used in all
experiments was produced by Huntsman (Date 11/9/99, Tank Lot 613311). Refer
to Table 3.3 for specific analysis and assays on MEA. The original stock solution
was refrigerated at 4°C. Concentrations of MEA solutions were conveniently
expressed in units of molal (mole MEA / kg water). The solutions were prepared
gravimetrically, and parafilm was used to prevent oxidation by room air prior to
loading the reactor. MEA solutions were disposed into the proper amine waste
container. All other reagents and their corresponding assays are provided in
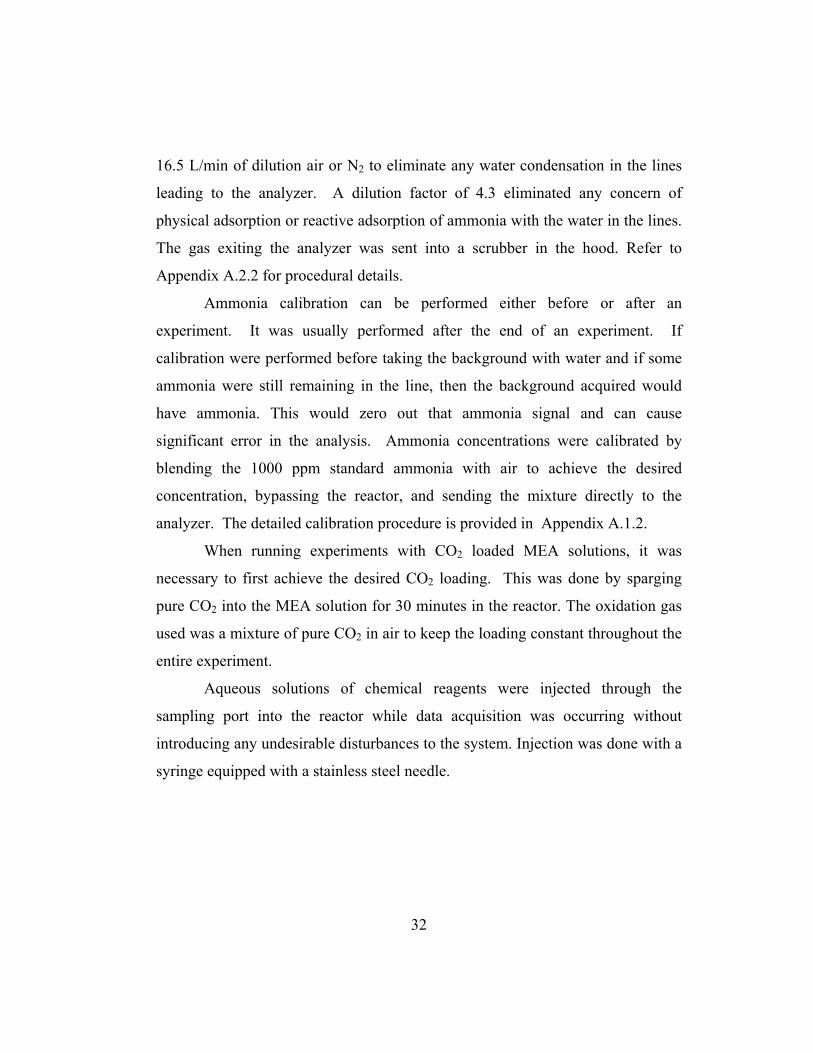
Table 3.4.
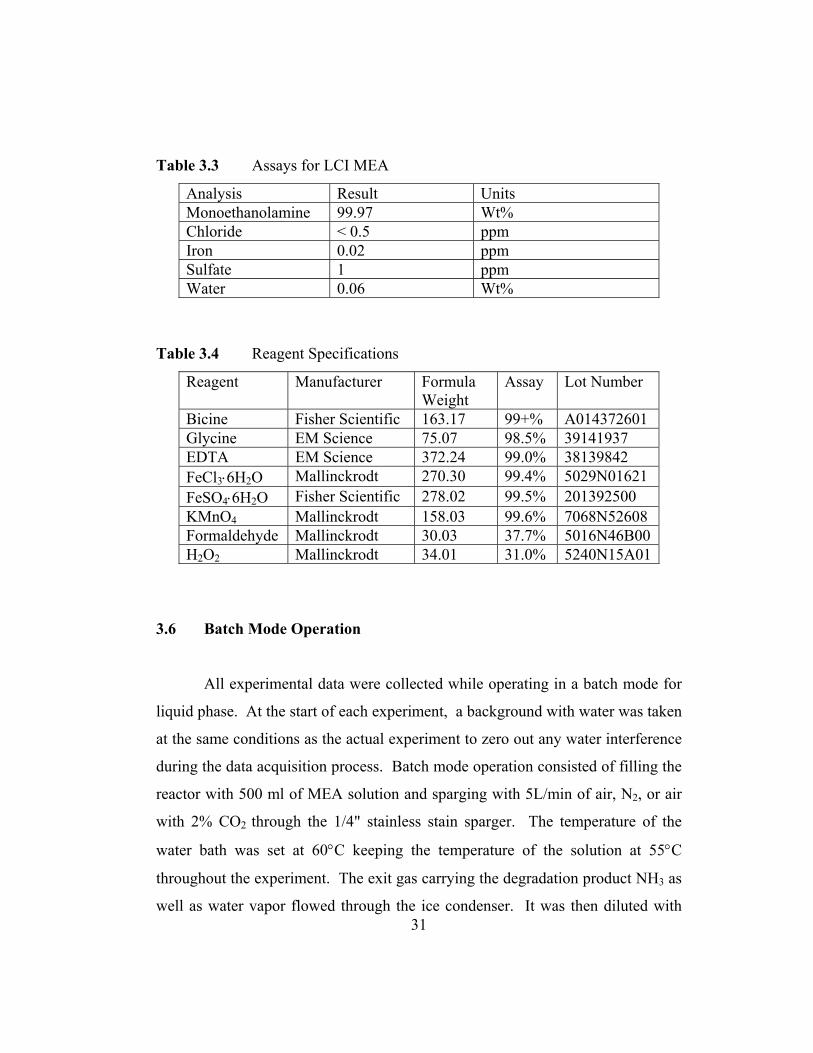
31
Table 3.3 Assays for LCI MEA
Analysis Result Units Monoethanolamine 99.97 Wt% Chloride < 0.5 ppm Iron 0.02 ppm Sulfate 1 ppm Water 0.06 Wt%
Table 3.4 Reagent Specifications
Reagent Manufacturer
Formula Weight
Assay Lot Number
Bicine Fisher Scientific 163.17 99+% A014372601 Glycine EM Science 75.07 98.5% 39141937 EDTA EM Science 372.24 99.0% 38139842 FeCl3⋅6H2O Mallinckrodt 270.30 99.4% 5029N01621 FeSO4⋅6H2O Fisher Scientific 278.02 99.5% 201392500 KMnO4 Mallinckrodt 158.03 99.6% 7068N52608 Formaldehyde Mallinckrodt 30.03 37.7% 5016N46B00 H2O2 Mallinckrodt 34.01 31.0% 5240N15A01
3.6 Batch Mode Operation
All experimental data were collected while operating in a batch mode for
liquid phase. At the start of each experiment, a background with water was taken
at the same conditions as the actual experiment to zero out any water interference
during the data acquisition process. Batch mode operation consisted of filling the
reactor with 500 ml of MEA solution and sparging with 5L/min of air, N2, or air
with 2% CO2 through the 1/4" stainless stain sparger. The temperature of the
water bath was set at 60°C keeping the temperature of the solution at 55°C
throughout the experiment. The exit gas carrying the degradation product NH3 as
well as water vapor flowed through the ice condenser. It was then diluted with
32
16.5 L/min of dilution air or N2 to eliminate any water condensation in the lines
leading to the analyzer. A dilution factor of 4.3 eliminated any concern of
physical adsorption or reactive adsorption of ammonia with the water in the lines.
The gas exiting the analyzer was sent into a scrubber in the hood. Refer to
Appendix A.2.2 for procedural details.
Ammonia calibration can be performed either before or after an
experiment. It was usually performed after the end of an experiment. If
calibration were performed before taking the background with water and if some
ammonia were still remaining in the line, then the background acquired would
have ammonia. This would zero out that ammonia signal and can cause
significant error in the analysis. Ammonia concentrations were calibrated by
blending the 1000 ppm standard ammonia with air to achieve the desired
concentration, bypassing the reactor, and sending the mixture directly to the
analyzer. The detailed calibration procedure is provided in Appendix A.1.2.
When running experiments with CO2 loaded MEA solutions, it was
necessary to first achieve the desired CO2 loading. This was done by sparging
pure CO2 into the MEA solution for 30 minutes in the reactor. The oxidation gas
used was a mixture of pure CO2 in air to keep the loading constant throughout the
entire experiment.
Aqueous solutions of chemical reagents were injected through the
sampling port into the reactor while data acquisition was occurring without
introducing any undesirable disturbances to the system. Injection was done with a
syringe equipped with a stainless steel needle.
33
3.7 Analytical Methods
Only the gas phase NH3 concentration was analyzed. The analyzer
provided continuous and instantaneous measurement of NH3 concentration
throughout the entire run of the experiment. CO2 loaded MEA solution was
sampled at the beginning and the end of the experiment to check for CO2 loading.
pH measurements were also made at the end of the experiment at 25 ° (Appendix
A.2.2).
3.7.1 Gas Phase Analysis by FT-IR Spectroscopy
Gas phase analysis was performed using Fourier Transform infrared
spectroscopy (FT-IR). This method of analysis had the advantage of greater
precision in measuring gas phase concentrations by providing digital output. FT-
IR analysis was conducted using a Perkin Elmer FT-IR spectrometer (Model
Spectrum 2000, SN 41626) equipped with an Infrared Analysis, Inc. gas cell
(Model G-5-22-V-AU, SN TA920911). Software used to collect and analyze data
included Spectrum for Windows (by Perkin Elmer, version 1.00, 12 May 1995),
and TR-IR for Windows (by Perkin Elmer, version 1.00, 7 May 1995). The FT-
IR analyzer was calibrated for NH3 for each experiment. Detailed procedures of
instrument operation are provided in Appendix A.1.
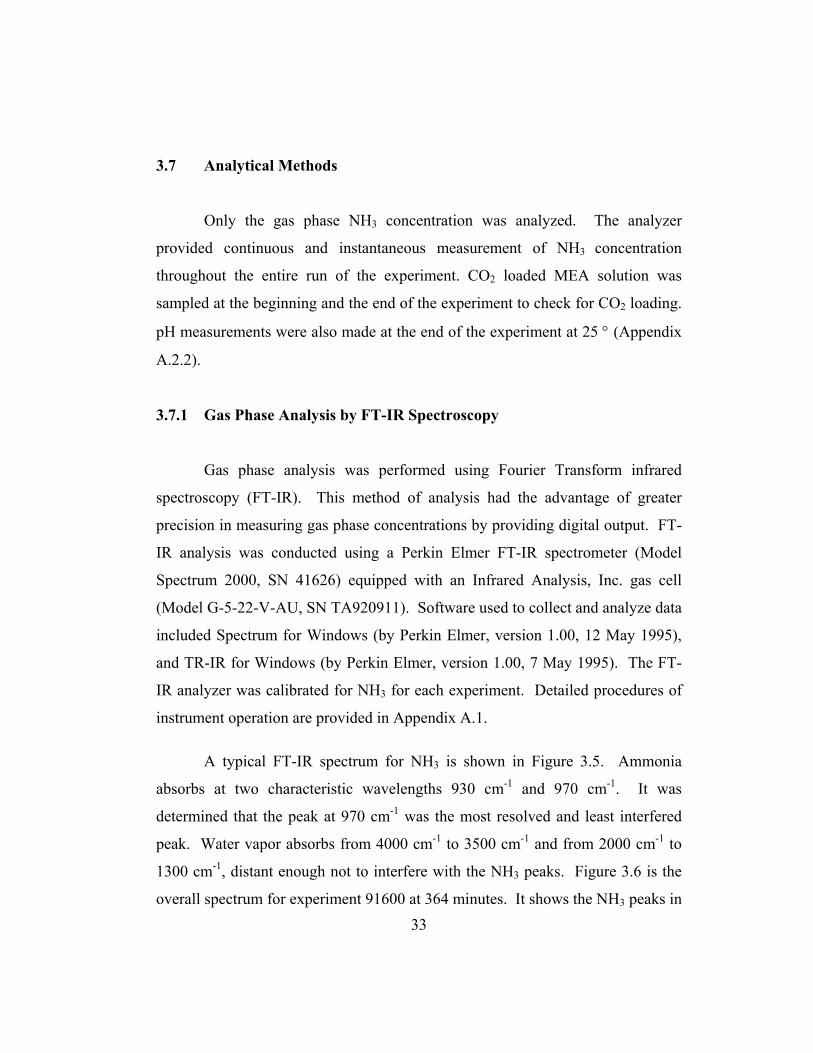
A typical FT-IR spectrum for NH3 is shown in Figure 3.5. Ammonia
absorbs at two characteristic wavelengths 930 cm-1 and 970 cm-1. It was
determined that the peak at 970 cm-1 was the most resolved and least interfered
peak. Water vapor absorbs from 4000 cm-1 to 3500 cm-1 and from 2000 cm-1 to
1300 cm-1, distant enough not to interfere with the NH3 peaks. Figure 3.6 is the
overall spectrum for experiment 91600 at 364 minutes. It shows the NH3 peaks in
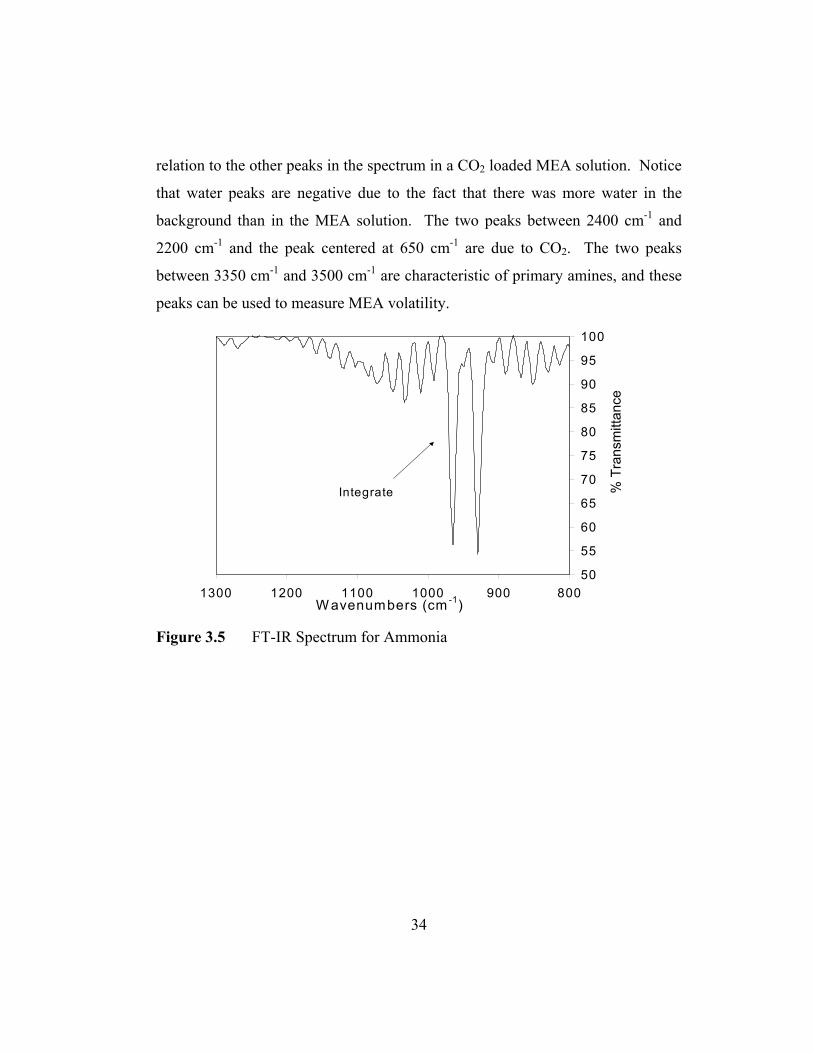
34
relation to the other peaks in the spectrum in a CO2 loaded MEA solution. Notice
that water peaks are negative due to the fact that there was more water in the
background than in the MEA solution. The two peaks between 2400 cm-1 and
2200 cm-1 and the peak centered at 650 cm-1 are due to CO2. The two peaks
between 3350 cm-1 and 3500 cm-1 are characteristic of primary amines, and these
peaks can be used to measure MEA volatility.
50
55
60
65
70
75
80
85
90
95
100
8009001000110012001300W avenumbers (cm -1)
% T
rans
mitt
ance
Integrate
Figure 3.5 FT-IR Spectrum for Ammonia
35
0
20
40
60
80
100
120
140
500150025003500450055006500Wavenumber (cm-1)
% T
rans
mitt
ance
N-H
CO2
NH3
in MEA
H2O
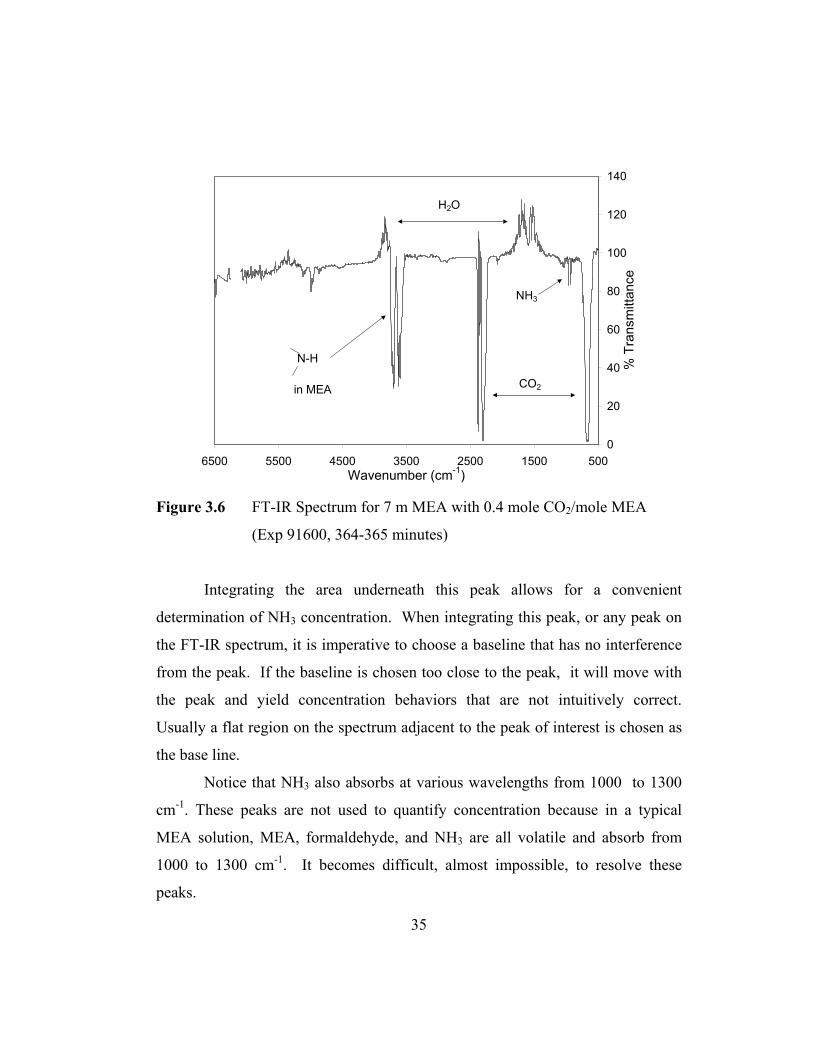
Figure 3.6 FT-IR Spectrum for 7 m MEA with 0.4 mole CO2/mole MEA
(Exp 91600, 364-365 minutes)
Integrating the area underneath this peak allows for a convenient
determination of NH3 concentration. When integrating this peak, or any peak on
the FT-IR spectrum, it is imperative to choose a baseline that has no interference
from the peak. If the baseline is chosen too close to the peak, it will move with
the peak and yield concentration behaviors that are not intuitively correct.
Usually a flat region on the spectrum adjacent to the peak of interest is chosen as
the base line.
Notice that NH3 also absorbs at various wavelengths from 1000 to 1300
cm-1. These peaks are not used to quantify concentration because in a typical
MEA solution, MEA, formaldehyde, and NH3 are all volatile and absorb from
1000 to 1300 cm-1. It becomes difficult, almost impossible, to resolve these
peaks.
36
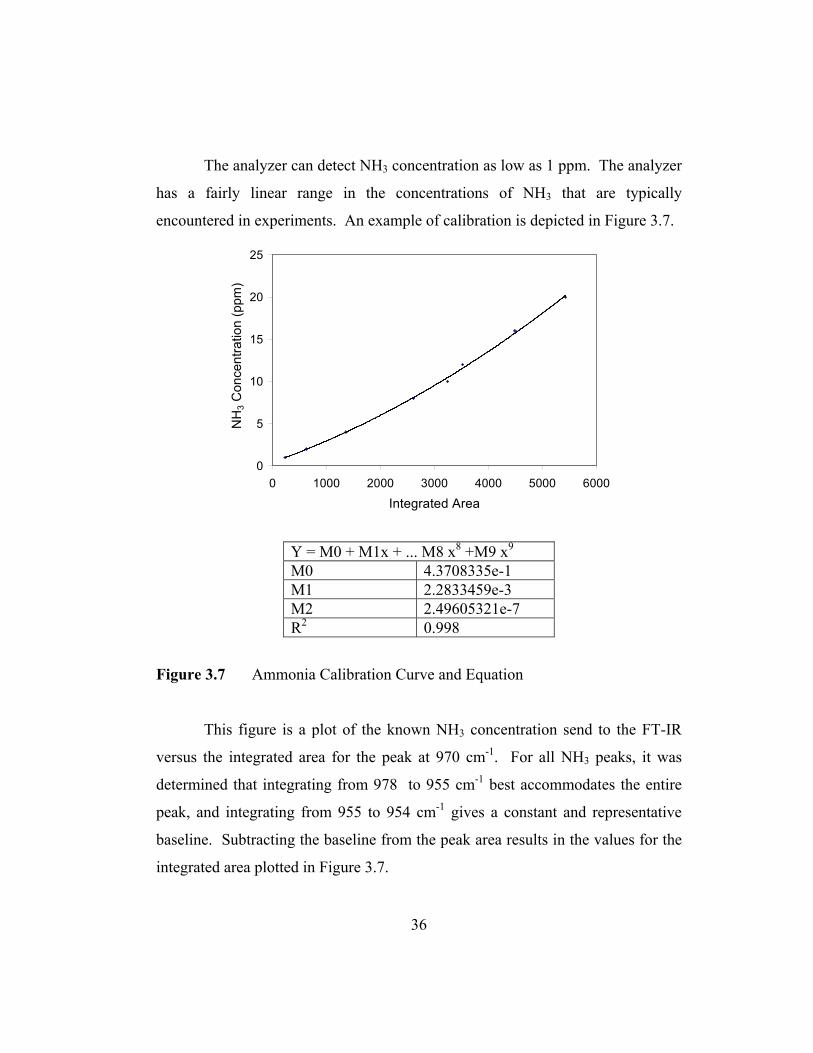
The analyzer can detect NH3 concentration as low as 1 ppm. The analyzer
has a fairly linear range in the concentrations of NH3 that are typically
encountered in experiments. An example of calibration is depicted in Figure 3.7.
0
5
10
15
20
25
0 1000 2000 3000 4000 5000 6000
Integrated Area
NH
3 Con
cent
ratio
n (p
pm)
Y = M0 + M1x + ... M8 x8 +M9 x9 M0 4.3708335e-1 M1 2.2833459e-3 M2 2.49605321e-7 R2 0.998
Figure 3.7 Ammonia Calibration Curve and Equation
This figure is a plot of the known NH3 concentration send to the FT-IR
versus the integrated area for the peak at 970 cm-1. For all NH3 peaks, it was
determined that integrating from 978 to 955 cm-1 best accommodates the entire
peak, and integrating from 955 to 954 cm-1 gives a constant and representative
baseline. Subtracting the baseline from the peak area results in the values for the
integrated area plotted in Figure 3.7.

37
3.7.2 CO2 Infrared Analyzer
The total CO2 (free plus reacted) in the liquid phase was determined using
a total carbon analyzer (Model 525) from Oceanography International
Corporation. The principle of operation is as follows: the analyzer has an acid
chamber with an injection port where one millimeter of 30-40 wt % phosphoric
acid is injected. A liquid sample (50µl to 150 µl) is injected into the acid freeing
the chemically reacted CO2 and the free CO2. A nitrogen stream carries the total
CO2 to the infrared analyzer with a range of 0-0.25 % CO2 volume basis. The
analyzer is calibrated with 7 mM sodium carbonate solution. Variable volumes
(10 to 200 µl) of the standard solution can be injected, and the output of the
analyzer is recorded on a strip chart as peaks with varying heights. The CO2
loading of an aqueous MEA sample is calculated as the ratio of total moles of
CO2 to the total moles of MEA.
3.8 Data Reduction and Analysis
This section will discuss how raw data from the FT-IR analyzer is
converted into useful information such as NH3 concentration, NH3 production
rate, and total NH3 produced.
3.8.1 Unsteady State Model
The NH3 concentration can be predicted using an unsteady state model. A
material balance was done over the reactor and the condenser. The change in
concentration of NH3 in the liquid phase over time is equal to the rate at which
NH3 is produced minus the rate at which NH3 is stripped (G yc).
38
Cdt
)Lx(dGyRR −= (3.1)
L = Total moles of liquid in the reactor
xR = Mole fraction of liquid phase NH3 in the reactor (ppm)
R = Rate of NH3 production (mM/hr)
G = Gas rate (mmole/hr)
This differential equation can be solved for the concentration of NH3 in
the gas phase exiting the condenser which is the concentration sensed by the FT-
IR.
GRe)
RyG1(1y )K/y1(L
tGKi
Ccw
R
⋅
⋅−−= +
−
(3.2)
yc = mole fraction of gas phase NH3 exiting the condenser (ppm)
KR = yNH3/xNH3 at 55 °C (reactor temperature)
Kc = yNH3/xNH3 at 10 °C (condenser temperature)
yw = mole fraction of water in the reactor (55 °C)
yi = Concentration dissolved NH3 in the original MEA
Multiply both sides of equation 3.2 by G, and divide both sides by the total
volume of the solution. On the left hand side, yc times G divide by volume gives
mole of NH3/L-hr, which will be referred to as the instantaneous rate of NH3
production (Ri). On the right hand side, R/L also has the units of mole of NH3/L-
hr can be denoted as Rs for steady state rate rate.
s)K/y1(L
tGKi
i Re)R
yG1(1R cw
R
⋅
⋅−−= +
−
(3.3)

39
The instantaneous rate approaches the steady state rate as t approaches infinite.
Assuming that Rs is not time-dependent, in the limit that t approaches infinite,
dRi/dt is zero, and Ri is equal to Rs.
The time it takes to reach this steady state rate is indicated by the time
constant in equation 3.3. Note that the time constant depends on G/L, KR ,and
KC, and typical values of the time constant are around one hour. The physical
meaning of this time constant is essentially the time required to strip the NH3.
3.8.2 Raw Data Manipulation
An example of raw data generated with the FT-IR is shown in Figure 3.8.
The figure plots the integrated area underneath the 970 cm-1 peak against time in
minutes. Time is expressed in minutes because the instrument scans a spectrum
every minute according to the prior program settings.
0
500
1000
1500
2000
0 20 40 60 80 100 120Time (min)
Inte
grat
ed A
rea
(978
-955
cm
-1)
Figure 3.8 FT-IR Raw Data
40
The NH3 calibration equation is used to convert integrated areas into
concentrations in ppm. Parts per million in concentration units can be converted
into the instantaneous rate with units of mM/hr simply by multiplying by the gas
rate and dividing by the volume to obtain the unsteady state rate or instantaneous
rate of NH3. Sample calculations are provided in Appendix A.2.2. All the
manipulated raw data will plot this instantaneous rate of NH3 production against
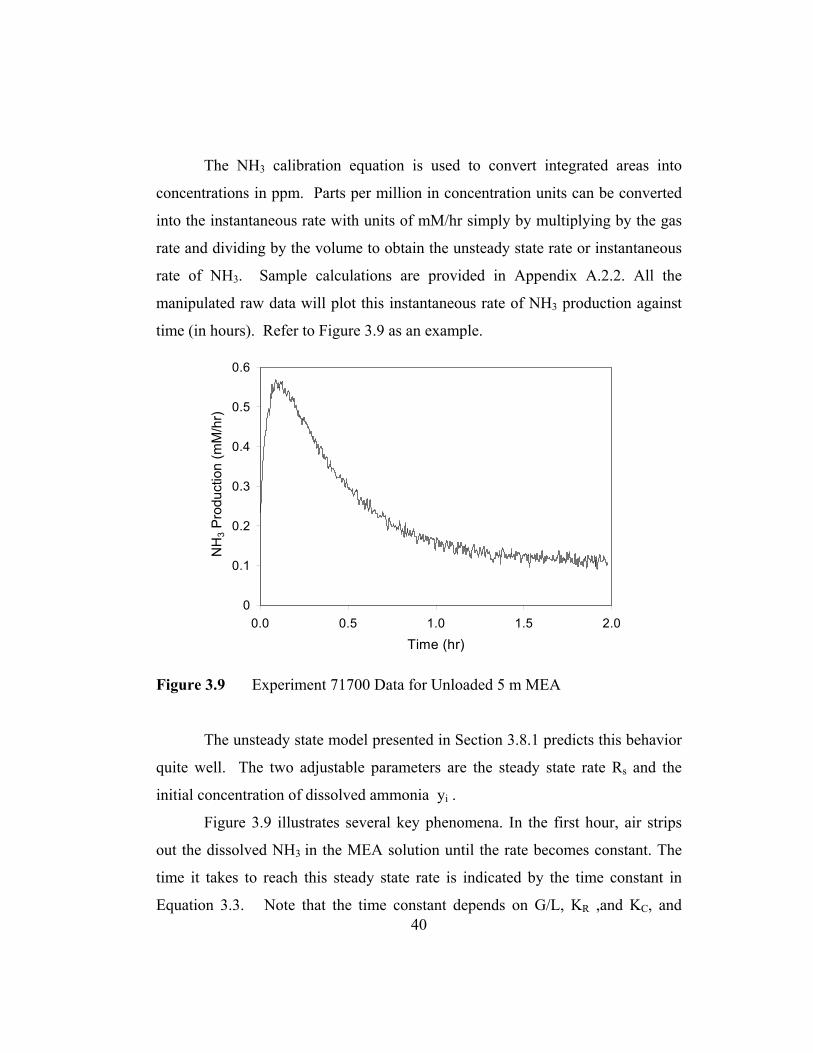
time (in hours). Refer to Figure 3.9 as an example.
0
0.1
0.2
0.3
0.4
0.5
0.6
0.0 0.5 1.0 1.5 2.0
Time (hr)
NH
3 Pro
duct
ion
(mM
/hr)
Figure 3.9 Experiment 71700 Data for Unloaded 5 m MEA
The unsteady state model presented in Section 3.8.1 predicts this behavior
quite well. The two adjustable parameters are the steady state rate Rs and the
initial concentration of dissolved ammonia yi .
Figure 3.9 illustrates several key phenomena. In the first hour, air strips
out the dissolved NH3 in the MEA solution until the rate becomes constant. The
time it takes to reach this steady state rate is indicated by the time constant in
Equation 3.3. Note that the time constant depends on G/L, KR ,and KC, and

41
typical values of the time constant are around one hour. This time constant is
essentially the time required to strip the NH3. The steady state rate of NH3
production reached in this experiment is 0.12 mM/hr.
3.8.3 Extrapolation of Steady State Rates
Frequently, one experiment provided information on several rates
measured under different experimental conditions. Figure 3.10 illustrates an
experiment where several steady state rates can be extrapolated. This experiment
is the air oxidation of 7 m MEA with 0.4 mole CO2/mole MEA at 55 °C. Ferric
chloride is injected into the reaction in increasing concentrations after the
previous reaction has reached steady state. The time of each iron injection along
with the steady states associated with each iron concentration can be seen in
Figure 3.10 and are tabulated in Table 3.5.
0
0.5
1
1.5
0 2 4 6 8
Time (hr)
NH
3 Pro
duct
ion
(mM
/hr)
0.0001 mM Fe 0.003 mM
0.01 mM0.03 mM
0.1 mM
Inject Fe
Figure 3.10 Multiple Steady States with Increasing Ferric Concentrations in
7 m MEA with 0.4 mole CO2/mole MEA
Table 3.5 Multiple Steady-state Rates with 0.4 mole CO2/mole MEA

42
Total Fe (mM) Rate (mM/hr) 0.0001 0.35 0.003 0.48 0.010 0.68 0.030 0.81 0.100 1.11
0
0.5
1
1.5
2
0 1 2 3 4 5 6Time (hr)
NH
3 P
rodu
ctio
n (m
M/h
r)
0.0001mM Fe+2
0.2mM
1.2 mM
3.2 mM Inject Fe
Figure 3.11 Multiple Steady States with Increasing Ferrous Concentrations in
7 m Unloaded MEA
Under different experimental conditions, the instantaneous rate behavior
of the reaction might differ; however, the steady state rates are obtained in the
same manner. Figure 3.11 shows the unusual oxidation phenomenon with ferrous
ion in unloaded MEA solution oxidized by air. Upon injection of ferrous sulfate,
NH3 is produced instantaneously in solution and is stripped out in a period of one
hour. A higher steady state is reached with each successive addition of iron.
These steady state rates are tabulated in Table 3.6.
Table 3.6 Multiple Steady-state Rates in Unloaded MEA

43
Total Fe (mM) Rate (mM/hr) 0.0001 0.11 0.20 0.22 1.2 0.54 3.2 1.11
3.8.4 Extrapolation of Stoichiometry
The reaction of MEA with ferrous ion as presented by the data in Figure
3.11 exhibits a stoichiometric effect that can be quantified. In Figure 3.12 area
0
0.5
1
1.5
2
0 1 2 3 4 5 6Time (hr)
NH
3 P
rodu
ctio
n (m
M/h
r)
0.07mM NH3
0.2mM NH3
0.2mM NH3
Figure 3.12 Area of Integration for Determining Reaction Stoichiometry
underneath each triangle is integrated to obtain the total concentration of NH3
upon injection of a specific iron concentration. The reaction stoichiometry
corresponding to the injected iron concentration can be determined. Table 3.7
shows the moles of NH3 produced by the moles of iron injected.
Table 3.7 Ferrous Stoichiometry with Unloaded MEA

44
Injected Fe (mM) NH3 produced (mM) 0.2 0.07 1 0.2 2 0.2
45
Chapter Four
Experimental Results and Discussion
This chapter presents data on NH3 production measured in a sparged
reactor apparatus where the gas phase NH3 composition was analyzed
continuously. From the raw data, a steady state rate of NH3 production rate can
be obtained. Rates measured under different sets of experimental conditions are
compared. Oxidation rate dependence on iron concentration and additives are
established. Lastly, rates measured in this study are compared to other studies of
MEA oxidation studies.
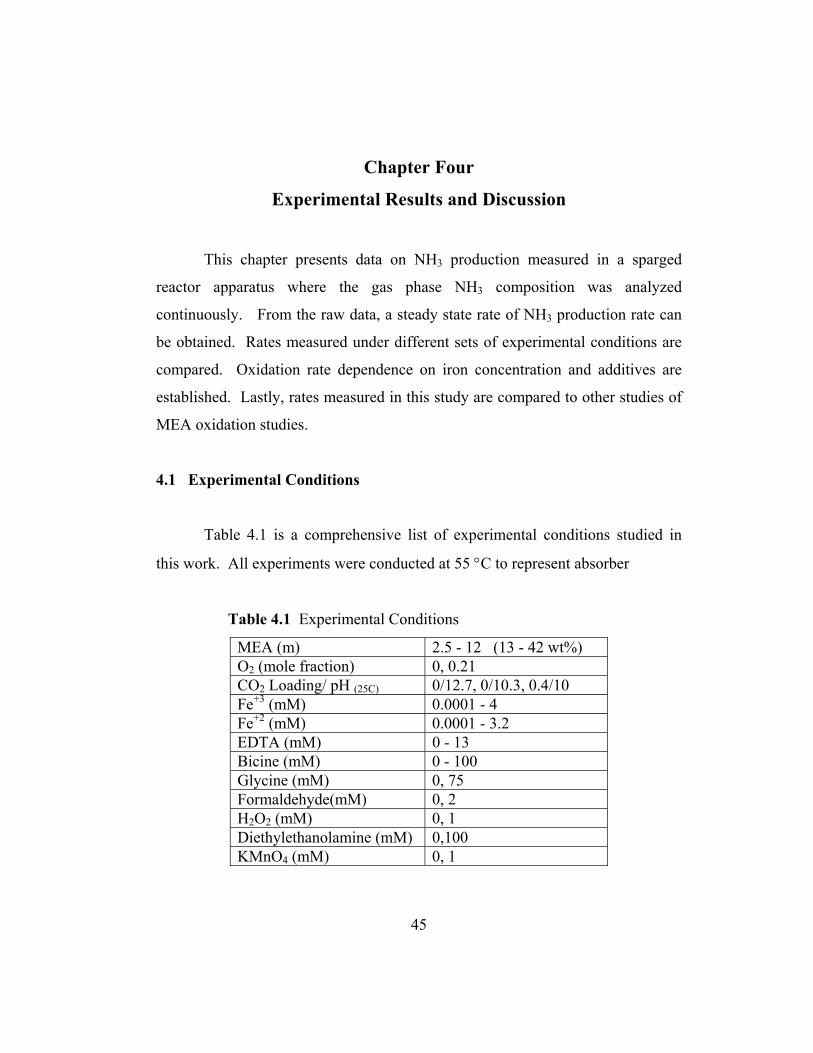
4.1 Experimental Conditions
Table 4.1 is a comprehensive list of experimental conditions studied in
this work. All experiments were conducted at 55 °C to represent absorber
Table 4.1 Experimental Conditions MEA (m) 2.5 - 12 (13 - 42 wt%) O2 (mole fraction) 0, 0.21 CO2 Loading/ pH (25C) 0/12.7, 0/10.3, 0.4/10 Fe+3 (mM) 0.0001 - 4 Fe+2 (mM) 0.0001 - 3.2 EDTA (mM) 0 - 13 Bicine (mM) 0 - 100 Glycine (mM) 0, 75 Formaldehyde(mM) 0, 2 H2O2 (mM) 0, 1 Diethylethanolamine (mM) 0,100 KMnO4 (mM) 0, 1

46
conditions. MEA concentrations were varied from 2.5 m to 12 m (13 to 42 wt
%). ABB typically uses 15-20 wt % MEA, and Fluor Daniel uses 30 wt % with
corrosion inhibitors added.
Most experiments were carried out with air, a few experiments were
performed in nitrogen. Three MEA solution conditions were examined. Zero
CO2 loading which corresponds to a solution pH of 12.7, zero CO2 loading with
HCl added to get pH 10.3, and 0.4 CO2 loading which corresponds to a pH of 10.
In the first solution, most of the MEA is present as free MEA, whereas the second
contains a mixture of free MEA as well as MEAH+. With a 0.4 CO2 loading,
MEA carbamate, MEAH+, and free MEA are all present. Data collected at 0.4
CO2 loading are most representative of the actual degradation rates encountered
in the absorber. The first two conditions of loading/pH are examined to
understand the mechanisms of oxidation. Metals (Fe), oxidation catalysts (Fe,
KMnO4, H2O2), potential oxidation inhibitors (EDTA, bicine, glycine, DMMEA),
and degradation products (formaldehyde) were added.
4.2 Raw Experimental Data
Raw data generates a plot of NH3 production (mM/hr) versus time (hour).
The x-axis represents the length of the run, while the y-axis represents the
instantaneous rate of NH3 production. All experiments are presented graphically.
Each experiment is identified by the following conditions: MEA concentration,
CO2 loading/pH, and oxidizing gas. All of the experiments were performed at
55°C, with gas rate of 5L/min, dilution factor of 4.3, and solution volume of ∼500
ml. The arrows indicate the exact point at which a chemical was injected into the
reaction. The concentration of chemicals in the resulting solution as well as the
time of injection is tabulated. Ten data points that best represent the entire

47
experiment are tabulated as well. These data include the high, medium, and low
points on the graph and all the steady states values. The experiments are listed in
chronological order in Appendix B.
4.3 Rate Data
The steady state rate of NH3 production (Rs) can be determined (dRi/dt =
0) from these raw data. A detailed description of all the experiments, their
conditions, and the steady-state rate and stoichiometry associated with each
condition is show in Table 4.2. Each experiment is identified by its date and
defined by its conditions of MEA concentration, O2, CO2 loading, and final
solution pH at 25°C. The additives and their cumulative concentrations in
solution are tabulated along with their corresponding rates. Since the original
MEA reagent contained 0.02 ppm of dissolved iron, the first steady state is
actually the rate at the 0.02 ppm iron condition. The actual sequence of additions
is shown from top to bottom in the Additives column. Since chemicals were
added sequentially, any steady-state rate represents the rate at the solution
condition at that point and not the condition that is listed in the preceding column.
For instance, in experiment 071300 a rate of 0.13 mM/hr was obtained from
oxidation of unloaded 5 m MEA (originally containing 8.39e-5 mM Fe) with air.
1 mM of Fe+3 was injected to this solution, and the rate of 0.13 mM/hr persisted.
1 mM of Fe+2 was added to the solution at this point, 6 mM EDTA was then
injected into this solution shortly after, and the system was given time to reach
steady state. A production rate of 0.33 mM/hr was obtained. This rate represents
the rate of NH3 production in a MEA solution containing 1 mM Fe+2, 1 mM Fe+3,
and 6 mM EDTA. See Figure 4.1.

48
Table 4.2 Experiments at 55°C
Date MEA (m)
O2 CO2 Loading Final pH25°C Additives Conc (mM) Rate (mM/hr)
62700 2.5 Y 0 12.7 Feinitial 4.7E-05 0.10 62700 10 Y 0 12.7 Feinitial 1.4E-04 0.20 70700 5 N 0 12.7 Feinitial 8.4E-05 0
Ferric 1 0 Ferrous 1 0 KMnO4 2 stoich = 0.97 EDTA 10 0.27
71300 5 Y 0 12.7 Feinitial 8.4E-05 0.13 Ferric 1 0.13 Ferrous 1 - EDTA 6 0.33
71700 5 Y 0 12.7 Feinitial 8.4E-05 0.11 EDTA 5 - Ferrous 0.20 0.22 Ferrous 1.2 0.54 Ferrous 3.2 1.11
71800 5 N 0 12.7 Feinitial 8.4E-05 0 EDTA 5 - Ferric 4 0 Ferrous 1 0
72000 5 Y 0 12.7 Feinitial 8.4E-05 0.12 (NH4)2SO4 1 stoich = 1.87
72600 5 Y 0 12.7 Feinitial 8.4E-05 0.12 EDTA 5 - Ferric 1 0.20
81500 7 Y 0.4 9.85 Feinitial 1.1E-04 0.37 Ferrous 1 2.06
81600 12 Y 0 13 Feinitial 1.5E-04 0.21 Ferrous 1 0.39
90800 7 Y 0 12.7 Feinitial 1.1E-04 0.16 formaldehyde 2 0.16
90900 7 N 0 12.7 Feinitial 1.1E-04 0.00 H2O2 1.0E+00 2.06; stoich = 1
91000 7 Y 0.4 9.96 Feinitial 1.1E-04 0.37 Ferric 1 2.32
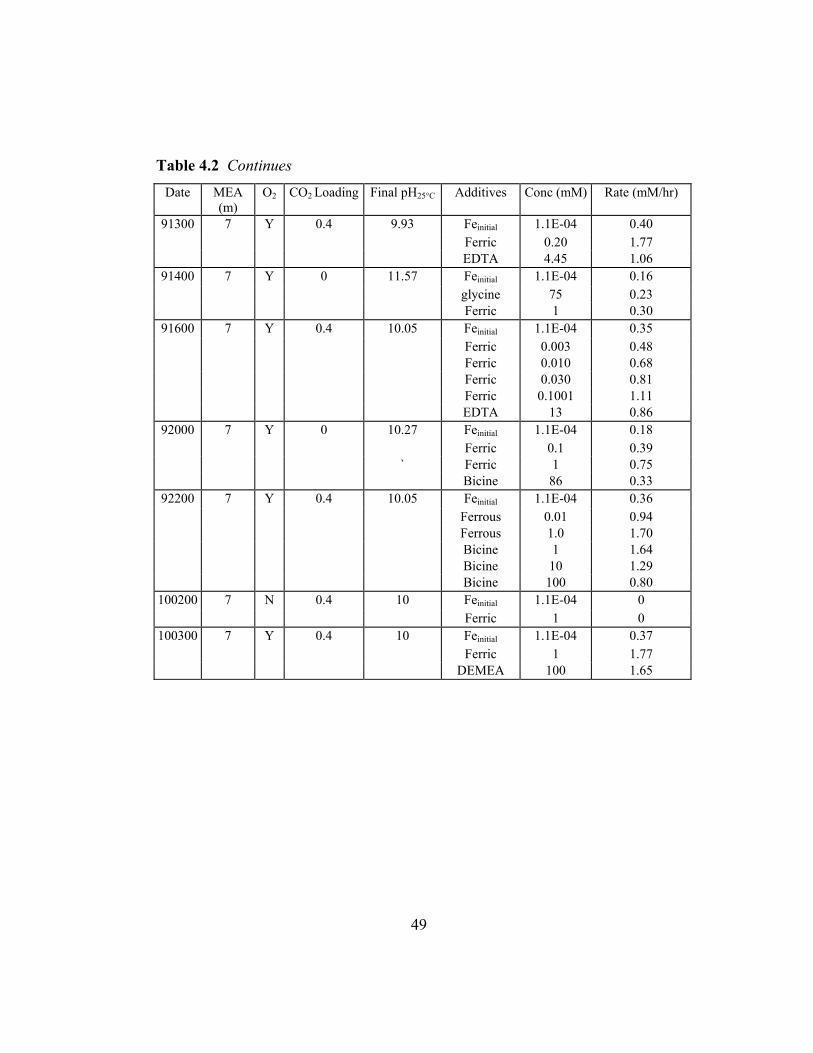
49
Table 4.2 Continues Date MEA
(m) O2 CO2 Loading Final pH25°C Additives Conc (mM) Rate (mM/hr)
91300 7 Y 0.4 9.93 Feinitial 1.1E-04 0.40 Ferric 0.20 1.77 EDTA 4.45 1.06
91400 7 Y 0 11.57 Feinitial 1.1E-04 0.16 glycine 75 0.23
Ferric 1 0.30 91600 7 Y 0.4 10.05 Feinitial 1.1E-04 0.35
Ferric 0.003 0.48 Ferric 0.010 0.68 Ferric 0.030 0.81 Ferric 0.1001 1.11 EDTA 13 0.86
92000 7 Y 0 10.27 Feinitial 1.1E-04 0.18 Ferric 0.1 0.39 ` Ferric 1 0.75 Bicine 86 0.33
92200 7 Y 0.4 10.05 Feinitial 1.1E-04 0.36 Ferrous 0.01 0.94 Ferrous 1.0 1.70 Bicine 1 1.64 Bicine 10 1.29 Bicine 100 0.80
100200 7 N 0.4 10 Feinitial 1.1E-04 0 Ferric 1 0
100300 7 Y 0.4 10 Feinitial 1.1E-04 0.37 Ferric 1 1.77 DEMEA 100 1.65

50
Arrows point to the exact point of chemical injection while the steady
states are labeled by the species present in solution that were responsible in
establishing those rates.
0
0.1
0.2
0.3
0.4
0.5
0.6
0.7
0.8
0 1 2 3 4 5Time (hr)
NH
3 Pr
oduc
tion
(mM
/hr)
0.02 ppm Fe
1 mM Fe+3, 1mM Fe+2,6 mM EDTA
Inject 1 mM Fe+3
Inject 1 mM Fe+2
Inject 3 mM EDTA
Inject 3 mM EDTA
Figure 4.1 Oxidation of Unloaded 5 m MEA
For experiments where chemicals were added in series of increasing
concentrations, the table also provides the sequence of conditions. Experiment
92200 is an example of such an experiment. Figure 4.2 illustrates the times of
chemical injection. Figure 4.3 illustrates the steady-state rates and the
concentration of responsible species. Experiment 92200 began with 7 m MEA
solution with 0.4 mole CO2/mole MEA oxidized with air to yield a steady state
rate of 0.36 mM/hr. 0.01 mM of Fe+2 was added, and a rate of 0.94 mM/hr was
reached. The concentration of Fe+2 in the MEA was raised to a total solution
concentration of 1 mM by injecting 0.99 mM Fe+2 into the reaction, and a rate of
1.7 mM was obtained. 1 mM bicine was added to this MEA solution containing 1
mM Fe+2, resulting in a slightly decreased rate of 1.64 mM/hr. With a solution

51
concentration of 10 mM bicine and 1 mM Fe+2, the steady state rate fell to 1.29
mM/hr. And lastly, a rate of 0.8 mM/hr was obtained with a solution bicine
concentration of 100 mM and Fe+2 concentration of 1 mM.
0
0.5
1
1.5
2
0 2 4 6 8Time (hr)
NH
3 Pro
duct
ion
(mM
/hr)
0.01 mM Fe+2
0.99 mM Fe+2100 mM bicine
10 mM bicine
1 mM bicine
Figure 4.2 Injection Times for Experiment 092200: Oxidation of 7 m MEA
with 0.4 mole CO2/mole MEA with Air
0
0.5
1
1.5
2
0 2 4 6 8Time (hr)
NH
3 Pro
duct
ion
(mM
/hr)
0.02 ppm Fe+2
0.01 mM Fe+2
100 mM bicine
10 mM bicine
1 mM bicine1 mM Fe+2
Figure 4.3 Steady-state Rates for Experiment 09220

52
4.4 Effect of Iron
The experimental data strongly support the conclusion that iron is an
important catalyst in MEA oxidation. All of the iron data are summarized in
Figure 4.4 where the rate of NH3 production is plotted as a function of iron
concentration. All of these rates were measured in 7 m MEA at 55 °C. Five
different series of data sets are shown. From top to bottom, rates measured for
ferrous and ferric in 0.4 CO2 loading/ pH 10 MEA are displayed in the uppermost
curve, followed by ferric with unloaded, acidified MEA (pH 10.3), ferrous with
unloaded / pH 12.7 MEA, and lastly ferric with unloaded / pH 12.7 MEA.
0.1
1
10
0.0001 0.0010 0.0100 0.1000 1.0000 10.0000 Fe (mM)
NH
3 Pro
duct
ion
(mM
/hr)
0.4 ldg, pH 10, Fe+2/+3
0 ldg, pH 10.3, Fe+3
0 ldg, pH 12.7 , Fe+30 ldg, pH 12.7, Fe+2
Figure 4.4 Effect of Iron in 7 m MEA at 55 °C. ( ❏ Fe+2 and ◆ Fe+3)
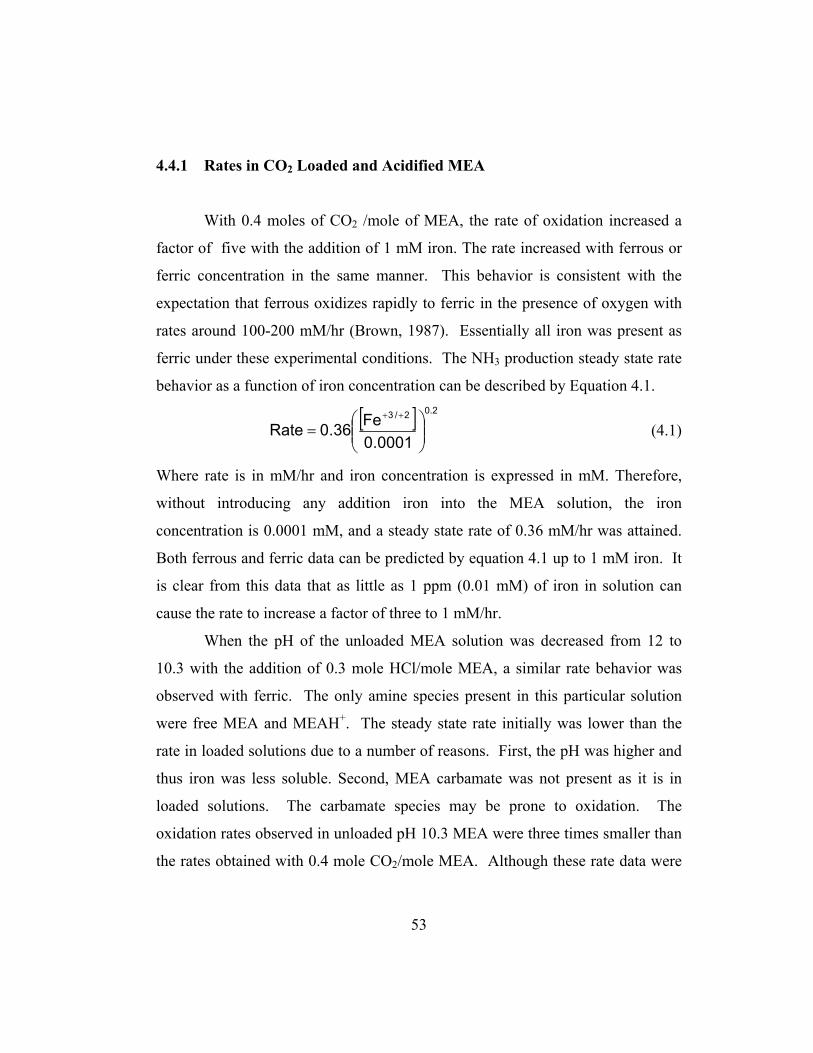
53
4.4.1 Rates in CO2 Loaded and Acidified MEA
With 0.4 moles of CO2 /mole of MEA, the rate of oxidation increased a
factor of five with the addition of 1 mM iron. The rate increased with ferrous or
ferric concentration in the same manner. This behavior is consistent with the
expectation that ferrous oxidizes rapidly to ferric in the presence of oxygen with
rates around 100-200 mM/hr (Brown, 1987). Essentially all iron was present as
ferric under these experimental conditions. The NH3 production steady state rate
behavior as a function of iron concentration can be described by Equation 4.1.
[ ] 2.02/3
0001.0Fe36.0Rate
=
++
(4.1)
Where rate is in mM/hr and iron concentration is expressed in mM. Therefore,
without introducing any addition iron into the MEA solution, the iron
concentration is 0.0001 mM, and a steady state rate of 0.36 mM/hr was attained.
Both ferrous and ferric data can be predicted by equation 4.1 up to 1 mM iron. It
is clear from this data that as little as 1 ppm (0.01 mM) of iron in solution can
cause the rate to increase a factor of three to 1 mM/hr.
When the pH of the unloaded MEA solution was decreased from 12 to
10.3 with the addition of 0.3 mole HCl/mole MEA, a similar rate behavior was
observed with ferric. The only amine species present in this particular solution
were free MEA and MEAH+. The steady state rate initially was lower than the
rate in loaded solutions due to a number of reasons. First, the pH was higher and
thus iron was less soluble. Second, MEA carbamate was not present as it is in
loaded solutions. The carbamate species may be prone to oxidation. The
oxidation rates observed in unloaded pH 10.3 MEA were three times smaller than
the rates obtained with 0.4 mole CO2/mole MEA. Although these rate data were

54
collected with ferric, it is reasonable to expect that data with ferrous would follow
the same trend.
4.4.2. Rates in Unloaded MEA
In unloaded MEA, the steady-state rate corresponding to each ferrous
concentration is labeled in Figure 4.5. The steady state rates can be linearly
correlated with ferrous concentration.
0
0.5
1
1.5
2
0 1 2 3 4 5 6Time (hr)
NH
3 P
rodu
ctio
n (m
M/h
r)
0.0001mM Fe+2 0.2mM 1.2 mM
3.2 mM
Figure 4.5 Steady-state Rates in Experiment 71700: Oxidation of 5 m MEA,
0 CO2 loading with Air
Figure 4.6 clearly illustrates the linear rate dependence on ferrous
concentration and essentially plots the same data in Figure 4.4 on a linear scale.
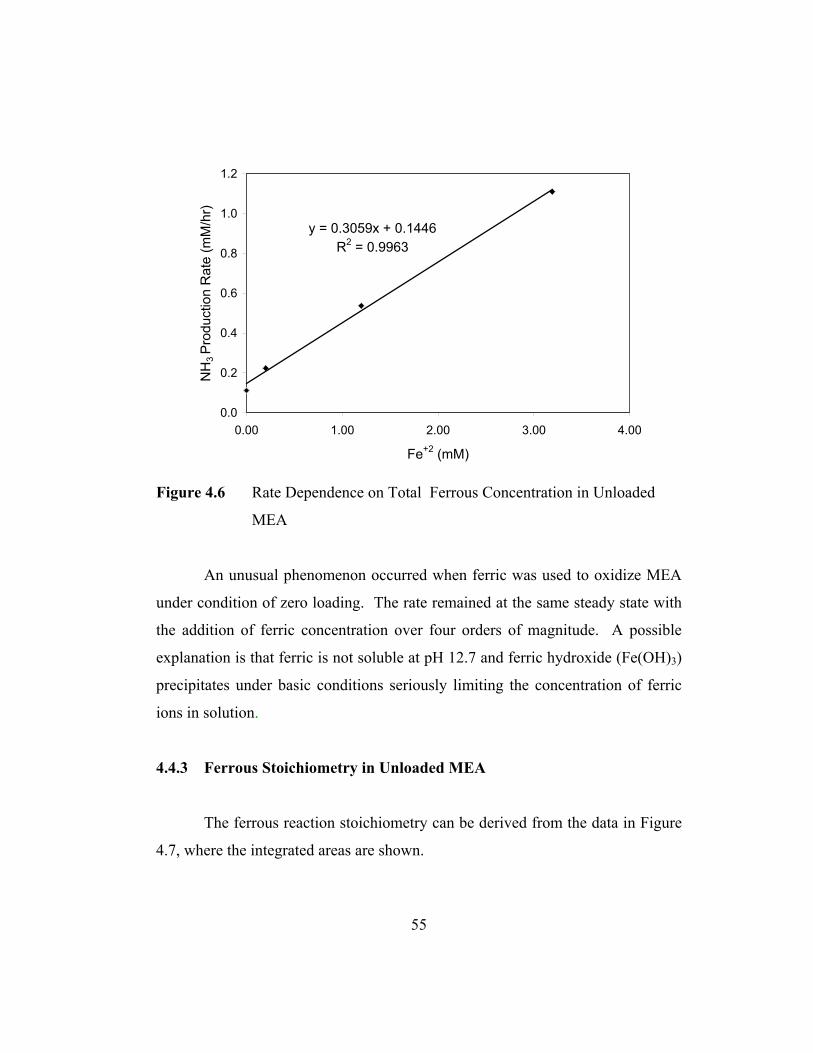
55
y = 0.3059x + 0.1446R2 = 0.9963
0.0
0.2
0.4
0.6
0.8
1.0
1.2
0.00 1.00 2.00 3.00 4.00
Fe+2 (mM)
NH
3 P
rodu
ctio
n R
ate
(mM
/hr)
Figure 4.6 Rate Dependence on Total Ferrous Concentration in Unloaded
MEA
An unusual phenomenon occurred when ferric was used to oxidize MEA
under condition of zero loading. The rate remained at the same steady state with
the addition of ferric concentration over four orders of magnitude. A possible
explanation is that ferric is not soluble at pH 12.7 and ferric hydroxide (Fe(OH)3)
precipitates under basic conditions seriously limiting the concentration of ferric
ions in solution.
4.4.3 Ferrous Stoichiometry in Unloaded MEA
The ferrous reaction stoichiometry can be derived from the data in Figure
4.7, where the integrated areas are shown.
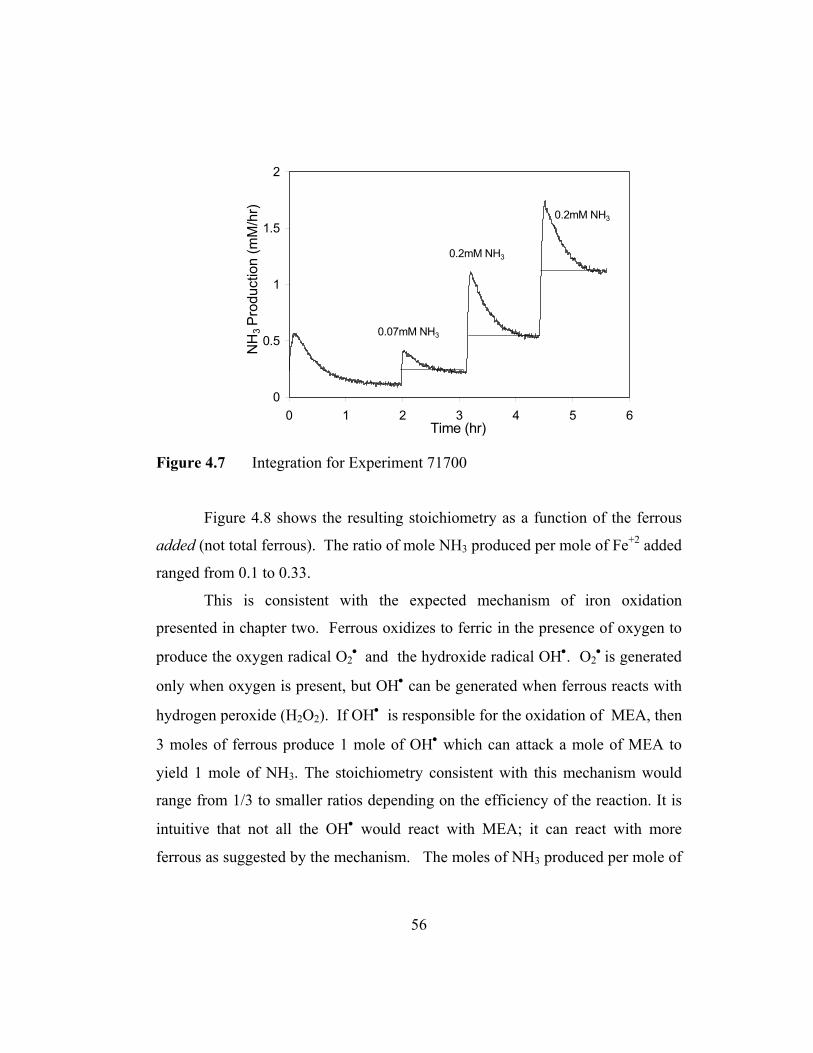
56
0
0.5
1
1.5
2
0 1 2 3 4 5 6Time (hr)
NH
3 P
rodu
ctio
n (m
M/h
r)
0.07mM NH3
0.2mM NH3
0.2mM NH3
Figure 4.7 Integration for Experiment 71700
Figure 4.8 shows the resulting stoichiometry as a function of the ferrous
added (not total ferrous). The ratio of mole NH3 produced per mole of Fe+2 added
ranged from 0.1 to 0.33.
This is consistent with the expected mechanism of iron oxidation
presented in chapter two. Ferrous oxidizes to ferric in the presence of oxygen to
produce the oxygen radical O2• and the hydroxide radical OH•. O2
• is generated
only when oxygen is present, but OH• can be generated when ferrous reacts with
hydrogen peroxide (H2O2). If OH• is responsible for the oxidation of MEA, then
3 moles of ferrous produce 1 mole of OH• which can attack a mole of MEA to
yield 1 mole of NH3. The stoichiometry consistent with this mechanism would
range from 1/3 to smaller ratios depending on the efficiency of the reaction. It is
intuitive that not all the OH• would react with MEA; it can react with more
ferrous as suggested by the mechanism. The moles of NH3 produced per mole of

57
ferrous decreased from 0.3 to 0.1 with each successive addition of ferrous
suggesting that the reaction of ferrous with MEA was not always 100% efficient.
0
0.05
0.1
0.15
0.2
0.25
0.3
0.35
0 0.5 1 1.5 2 2.5Fe+2 added (mM)
mol
NH
3/ m
ol F
e+2
∑NH3*dt - NH3(Fe steady state) ∆t
Figure 4.8 Ferrous Stoiochiometry in Unloaded MEA
To test the hypothesis of oxidation by OH•, an experiment was performed
in N2, thus precluding the presence of any O2•. The oxidation rate of MEA with
iron in the absence of oxygen was zero as seen in Exp 70700. As expected, the
addition of ferrous into a solution of MEA in the absence of oxygen resulted in no
NH3 being produced. When 1 mM hydrogen peroxide was introduced into this
solution, 1 mM of NH3 was produced. Refer to Figure 4.9 for times of chemical
injection as well as area under the peak integrated for total NH3 produced per
1mM H2O2. The only radical present in this solution was the hydroxide radical
and it reacted in a one-to-one ratio with MEA to produce NH3; therefore, it is
reasonable to conclude that OH• was directly involved in the attack of a MEA
molecule.

58
0
0.5
1
1.5
2
2.5
0 1 2 3 4Time (hr)
NH
3 Pro
duct
ion
(mM
/hr)
1 mM FeSO4
1 mM H2O2
Integrated Area =1 mM NH3
Figure 4.9 Oxidation of 7 m MEA, 0 CO2 Loading with N2
4.5 Effect of CO2 Loading
A dramatic increase in NH3 production rate was observed in loaded
compared to unloaded MEA solutions. This effect can be seen in the iron data.
The steady-state rate in unloaded 7 m MEA solutions was consistently 0.16
mM/hr whereas the rate with 0.4 moles of CO2/mole MEA was 0.36 mM/hr.
These rates are highly reproducible as seen in Table 4.2.
The effect of CO2 loading on degradation suggests that the MEA
carbamate species was more susceptible to oxidation than free MEA. An
alternative explanation is that the low pH of the solution allowed more iron to
stay in solution and catalyze oxidation.
Blachly and Ravner (1964) studied MEA oxidation by measuring NH3 and
peroxide production. The first important conclusion of this study was that in the
absence of CO2, no degradation was observed. The addition of 1% CO2 to the air
stream simulating submarine atmospheric conditions resulted in almost

59
instantaneous degradation characterized by the production of ammonia and
peroxides (Section 2.2.2).
CO2 loading was observed to have an opposite effect on MEA oxidation,
as well as oxidation of other amines, in the studies by Rooney et al., 1998
(Section 2.2.3). They concluded that CO2 decreased the oxidation of amines,
since the total anions (acetate, formate, glycolate) measured were less for all the
amines they tested when CO2 was present compared to when CO2 was not present
in solution.
Oxidation rates have been quantified using different degradation products.
Rooney observation of a decrease in the concentration of anions produced with
CO2 is not enough to conclude that the overall oxidation had decreased, especially
if MEA oxidation clearly results in other degradation products that were not
specifically examined by Rooney et al. Ammonia production increased in the
presence of CO2, whereas anion production decreased. It can be seen from the
MEA degradation mechanism proposed by Rooney et al. in Figure 2.10 that
anions, such as acetate and formate, are further oxidation products of their
aldehyde precursors. However, oxidation of MEA may produce NH3 and
aldehydes in the same step (fragmentation or hydrolysis) according to Figure 2.1.
It is entirely possible that these aldehydes are stable species, and the anions can
only be seen much later, after further oxidation has occurred. This is apparent in
the Rooney study where some anions were detected in small quanitities after 7
days, some were not even detectable within the course of their 28-day experiment.
No glycolate or oxalate were detected in the oxidation of 0.25 CO2 loading 30 wt
% MEA with air . Table 4.3 lists the detected anion concentrations as a function
of days. The detection limit for each anion was 10 ppm.
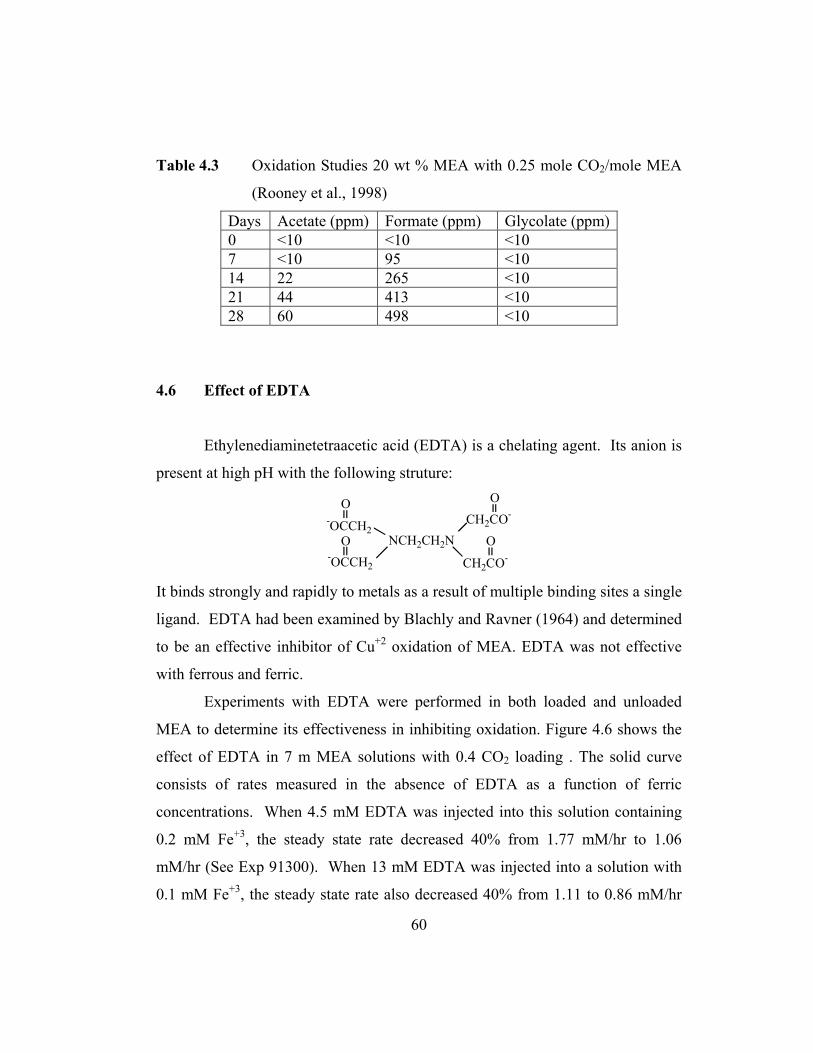
60
Table 4.3 Oxidation Studies 20 wt % MEA with 0.25 mole CO2/mole MEA
(Rooney et al., 1998)
Days Acetate (ppm) Formate (ppm) Glycolate (ppm) 0 <10 <10 <10 7 <10 95 <10 14 22 265 <10 21 44 413 <10 28 60 498 <10
4.6 Effect of EDTA
Ethylenediaminetetraacetic acid (EDTA) is a chelating agent. Its anion is
present at high pH with the following struture:
NCH2CH2NCH2CO-
O
CH2CO-O
-OCCH2O
-OCCH2
O
It binds strongly and rapidly to metals as a result of multiple binding sites a single
ligand. EDTA had been examined by Blachly and Ravner (1964) and determined
to be an effective inhibitor of Cu+2 oxidation of MEA. EDTA was not effective
with ferrous and ferric.
Experiments with EDTA were performed in both loaded and unloaded
MEA to determine its effectiveness in inhibiting oxidation. Figure 4.6 shows the
effect of EDTA in 7 m MEA solutions with 0.4 CO2 loading . The solid curve
consists of rates measured in the absence of EDTA as a function of ferric
concentrations. When 4.5 mM EDTA was injected into this solution containing
0.2 mM Fe+3, the steady state rate decreased 40% from 1.77 mM/hr to 1.06
mM/hr (See Exp 91300). When 13 mM EDTA was injected into a solution with
0.1 mM Fe+3, the steady state rate also decreased 40% from 1.11 to 0.86 mM/hr

61
(See Exp 91600). Thus upon the addition of more EDTA, no further effect was
observed.
0
0.5
1
1.5
2
0.0001 0.0010 0.0100 0.1000 1.0000 10.0000Fe+3 (mM)
NH
3 Pro
duct
ion
(mM
/hr)
4.5 mM EDTA
13 mM EDTA
0.4 CO2 LoadingNo EDTA
Figure 4.10 Effect of EDTA in 7 m MEA with 0.4 mole CO2/mole MEA
In unloaded MEA solutions, EDTA had a negligible effect on the
oxidation rate. Comparing experiments 71300 (without EDTA) to 71700 and
72600 (with 5 mM EDTA), the rates with no additional ferrous were ∼0.12
mM/hr in all three cases (Table 4.4).
Table 4.4 Effect of EDTA in Unloaded 5 m MEA with No Additional Iron
Experiment [EDTA] (mM) Rate (mM/hr) 71300 0 0.13 71700 5 0.11 72600 5 0.12
As a matter of fact, not only was EDTA ineffective in unloaded MEA
solutions, it was observed to even increase the rate of oxidation with ferric in
unloaded solutions. Recall that in the unloaded MEA, ferric did not catalyze

62
oxidation as illustrated on the bottom curve on Figure 4.4. However, if EDTA is
added to the solution prior to the ferric, the rate was observed to increase from
0.12 to 0.2 mM/hr as shown in Figure 4.11.
0
0.1
0.2
0.3
0.4
0.5
0.6
0.7
0 1 2 3 4 5Time (hr)
NH
3 P
rodu
ctio
n (m
M/h
r)
1 mM Fe+3
Inject 5 mM EDTA
Figure 4.11 Effect of EDTA in Unloaded MEA with 1 mM Fe+3
4.7 Effect of Bicine
Bicine is a common name for the chemical compound N,N-Bis (2-
hydroxyethyl)glycine. Bicine is a tertiary amine or just glycine with two ethanol
groups attached to the nitrogen. At high pH, it is present in its anion form:
NCH2CO-OHOCH2CH2
HOCH2CH2 Bicine is a standard additive used by the U.S. Navy to minimize MEA
degradation in submarines at a level of 1.5 wt% in 25 wt% MEA (Blachly and
Ravner, 1964). Blachly and Ravner (1964) concluded in their study that bicine

63
acted as a peroxide scavenger and greatly reduced oxidation of MEA by both
ferrous and ferric (Figure 2.7).
0.00
0.50
1.00
1.50
2.00
0.1 1 10 100 1000Bicine (mM)
NH
3 Pro
duct
ion
(mM
/hr)
0.4 ldg, pH 10, Fe+2
0 ldg, pH 10.3, Fe+3
Figure 4.12 Effect of Bicine in 7 m MEA with 1 mM Fe+2/+3
Figure 4.12 shows the effectiveness of bicine with 7 m MEA containing 1
mM ferrous or ferric. In both solutions (0.4 loading and pH 10.3/ 0 loading), a
bicine concentration of 100 mM decreased the rate by a factor of two.
4.8 Effect of KMnO4
Potassium permanganate caused MEA oxidation even in the absence of
oxygen. Figure 4.13 shows data measured in unloaded 5 m MEA with N2.
Neither Fe+2 or Fe+3 appeared to catalyze further oxidation without oxygen. The
reaction of potassium permanganate with MEA had a stoichiometry of 0.97 mole
NH3/mole KMnO4.

64
0
0.5
1
1.5
2
2.5
3
3.5
4
0 1 2 3 4 5Time (hr)
NH
3 Pro
duct
ion
(mM
/hr)
1mM Fe+3
1 mM Fe+2
2 mM KMnO4
10 m M EDTA
Figure 4.13 Effect of KMnO4 in Unloaded 5 m MEA with N2
4.9 Other Additives
Bicine has been reported to exhibit corrosive properties in MEA solution,
and it is relatively costly to utilize in large quantities. Additives that significantly
reduce degradation are valuable to the process of CO2 removal with MEA. A
number of potential inhibitors including glycine, N,N-diethylethanolamine
(DEMEA), and formaldehyde were studied. The structures of the first two are
shown below. Formaldehyde is a product of MEA oxidation (Figure 2.1).
H2NCH2CO-
ONCH2CH2OH
CH3CH2
CH3CH2
Glycinate N,N-Diethylethanolamine Glycine closely resembles bicine and also is similar in structure to MEA
carbamate. It could exhibit degradation characteristics like MEA carbamate. An
experiment was performed in unloaded MEA containing 75 mM glycine. Ferric
was introduced into this solution since it does not catalyze further oxidation in

65
unloaded MEA/pH 12.7. The addition of glycine decreased the pH to 11.6 and
caused more NH3 to evolve. The addition of ferric resulted in a slight increase
(∼0.07 mM/hr) from the steady state rate with glycine and MEA (Exp 91400).
This experiment failed to mimick the effect of MEA carbamate. Ferric cannot
cause MEA/glycine solution to degrade to the extent as it did in loaded MEA
solutions where carbamate is present. A possible reason for the observed rate
increase with ferric could be the lowering of pH due to glycine.
DEMEA is a tertiary amine with pKa of 9.82 (Christensen et al., 1969) ,
similar to the pKa of bicine. Tertiary amines have been reported to inhibit
degradation of primary and secondary amines (Kindrick et al., 1950). DEMEA is
chosen because of its similarity to bicine in structure as well as pKa.
100 mM DEMEA was injected into a loaded MEA solution containing 1
mM ferrous. The rate dropped only ∼7%.
Lastly, an oxidation product, formaldehyde, was added to an unloaded
MEA solution (Exp 90800). Formaldehyde appeared to absorb between 1250 and
1000 cm-1. NH3 and MEA both have characteristic absorption at that region of the
spectrum. The sudden injection of formaldehyde into the system caused the
ammonia peak at 970 cm-1 to be skewed since the formaldehyde peaks directly
adjacent to it increased in both height and width. This formaldehyde interference
resulted in a dip in the NH3 profile. As formaldehyde was stripped from
solution, the NH3 production rate returned to the consistent steady-state value of
0.16 mM/hr with 7 m MEA. Therefore, formaldehyde had no effect on the
degradation of MEA.
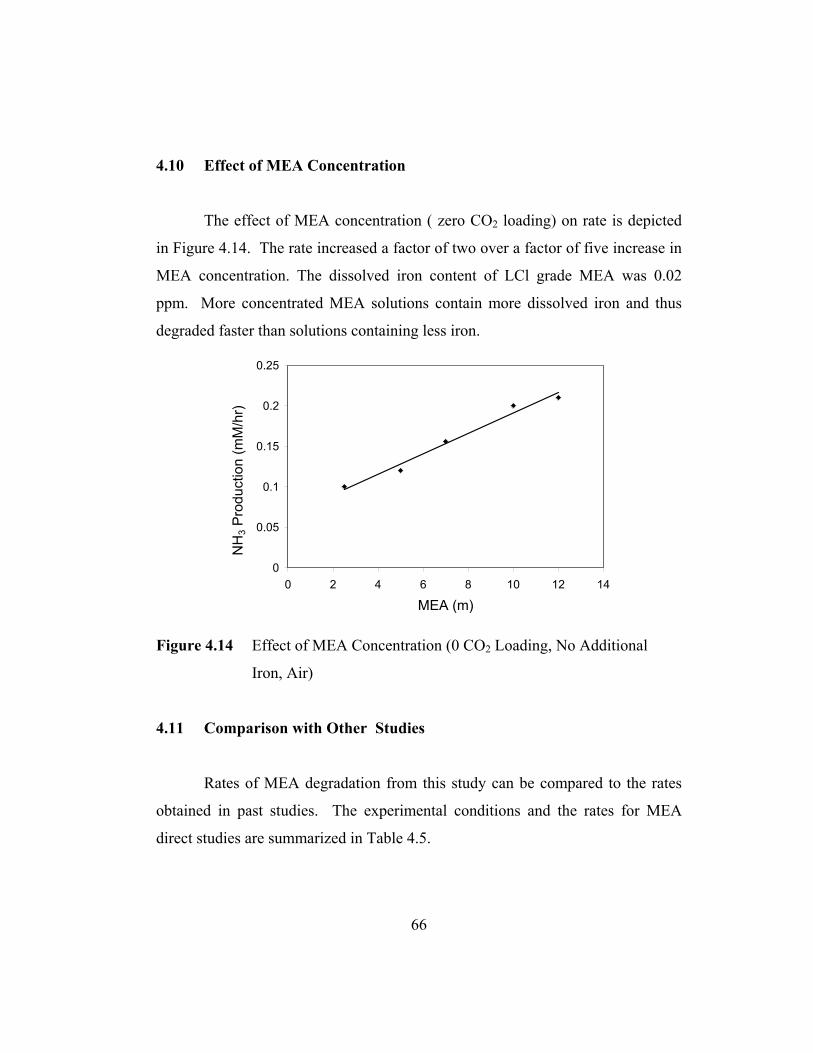
66
4.10 Effect of MEA Concentration
The effect of MEA concentration ( zero CO2 loading) on rate is depicted
in Figure 4.14. The rate increased a factor of two over a factor of five increase in
MEA concentration. The dissolved iron content of LCl grade MEA was 0.02
ppm. More concentrated MEA solutions contain more dissolved iron and thus
degraded faster than solutions containing less iron.
0
0.05
0.1
0.15
0.2
0.25
0 2 4 6 8 10 12 14
MEA (m)
NH
3 Pro
duct
ion
(mM
/hr)
Figure 4.14 Effect of MEA Concentration (0 CO2 Loading, No Additional
Iron, Air)
4.11 Comparison with Other Studies
Rates of MEA degradation from this study can be compared to the rates
obtained in past studies. The experimental conditions and the rates for MEA
direct studies are summarized in Table 4.5.

67
Table 4.5 Rate Comparison Study [MEA]
(m) T °C
CO2 ldg / %CO2
Products Detected
Analytical Method
[Fe] (mM)
Rate (mM/hr)
This Work 7 55 0.4 NH3 FT-IR 0.0001 0.36 This Work 7 55 1% (air) NH3 FT-IR 0.0001 0.16 This Work 7 55 1% NH3 FT-IR 1 0.45 This Work 7 55 0.4 NH3 FT-IR 1 1.7 Blachly (1964) 5 55 1% NH3 Titration < 0.0001 0.14 Girdler (1950) 3 80 50% NH3 Titration 0.5-1.0 0.3 Rooney (1998) 4 80 0.25 Anions IC * 1.1 * Produced by Dow and used without further purification
As illustrated in Table 4.5, the MEA oxidation rates obtained in this study
were comparable to the rates obtained in other studies. The main difference arose
from the differences in experimental conditions as well as the experimental
methods employed in each study. Blachly and Ravner studied oxidation in 1%
CO2, which is equivalent to the air oxidation experiments conducted in this study.
Their MEA iron concentration was not reported; however, the report did specify
that all MEA used was redistilled and stored at 40°F in evacuated sealed vials
until needed. Therefore, their iron content should be comparable to the iron
content of the low metal grade MEA used in this study. The air oxidation rate
with unloaded MEA in this study was 0.16 mM/hr which compared well with the
Blachly and Ravner rate of 0.14 mM/hr.
The rate of 1.7 mM/hr obtained with 0.4 loading 7 m MEA with 1 mM Fe
in this study was comparable to the rate of 1.1 mM/hr in 0.25 loading 4 m MEA
obtained by Rooney. The differences should be greater due to the iron content of
the MEA used in these studies. Since the two studies were detecting different
degradation products, the results cannot be directly compared.
The rate of 1.7 mM/hr obtained in this study with 0.4 loading 7 m MEA
with 1 mM Fe was significantly greater than the rate obtained in the Girdler study

68
with 50% CO2 and 0.5-1.0 mM Fe. The latter rate compared better with the both
the 0.4 loading MEA with 0.0001 mM Fe.
This work verified the inhibiting role of bicine on MEA degradation in the
presence of iron (Blachly and Ravner, 1964). Figure 2.7 shows negligible
degradation in MEA containing 1.5 wt% bicine and 0.5 mM iron. The effect of
bicine was easily detected in this work where the rate dropped a factor of two
shortly after its injection.
Blachly and Ravner (1964) concluded that EDTA (∼ 40 mM) was less
effective with 30 ppm (0.5 mM) of Fe+2. The oxidation rate was as high as 0.26
mM/hr for the first two days, and dropped to 0.08 mM/hr and persisted from day
three until day six. In this work, a rate of 0.3 mM/hr was observed with 5 mM
EDTA and 0.5 mM Fe+2 in 5 m MEA oxidized by air .

69
69
Chapter Five
Conclusions and Recommendations
This chapter summarizes the important conclusions in the study of MEA
oxidation by measuring NH3 production. This chapter also provides
recommendations for future work needed to gain a better understanding of the
oxidation reactions of MEA as well as other amine systems.
5.1 Conclusions
5.1.1 Effect of CO2 Loading
Oxidation rates with 0.4 mole CO2/ mole MEA were two times faster than
rates in unloaded solutions with no additional iron. This confirms the results of
Blachly and Ravner (1964) who also measured production of NH3. It disagrees
with the results of Rooney et al. (1998) who measured the production of organic
acids. The rate dependence on loading as well as the rate with a typical lean
loading of 0.2 are left to be determined in the future.
5.1.2 Iron in Loaded MEA
Iron is an important catalyst in oxidation of MEA to NH3. As little as 1
mM iron can increase the rate by a factor of five with 0.4 mole CO2/mole MEA.
The rate dependence on dissolved iron from 0.0001 to 1 mM is given by:
[ ] 2.02/3
0001.0Fe36.0)hr/mM(Rate
×=
++

70
In loaded solution, the rate depends on the total concentration of iron in solution,
regardless of its oxidation state. In order to minimize oxidation of MEA, it would
be necessary to decrease the iron content below 0.01 mM.
5.1.3 Iron in Unloaded MEA
Without CO2, only ferrous ion catalyzes oxidation. Ferric does not appear
to increase NH3 production in unloaded solutions, possibly due to its solubility
limit at high pH. The steady-state rate of NH3 production depends linearly on
ferrous ion:
Rate (mM/hr) = 0.306 [Fe+2] + 0.145
In unloaded MEA solutions, the reaction stoichiometry ranges from 0.1 to
0.3 moles NH3/mole Fe+2 added. Hydrogen peroxide reacts with MEA in the
absence of O2 to produce 1 mole NH3/mole H2O2. It can be concluded from
these results that the hydroxide radical was responsible in the degradation of
MEA to NH3.
5.1.4 Oxidants Other than Oxygen
Neither Fe+2 or Fe+3 cause degradation to NH3 without O2 in loaded and
unloaded MEA. However, some oxidants were able to oxidize MEA in the
absence of O2. The reaction of H2O2 or KMnO4 with MEA rapidly produced NH3,
and the reaction stoichiometry was determined to be 1 mole NH3/mole H2O2 or
KMnO4.

71
5.1.5 Oxidation Inhibitors
The two effective oxidation inhibitors are bicine and EDTA. Both reduce
MEA oxidation rate in loaded solutions. Bicine reduced the rate a factor of two in
MEA containing 1 mM iron. EDTA reduced oxidation rate 20 to 40% in loaded
MEA with ∼0.2 mM iron. Commercial use of these inhibitors should consider
potential adverse effects on corrosion.
5.2 Application to Acid Gas Treating
Typical makeup rate in acid gas treating with 15-20 wt % MEA is 0.1 lb
MEA/ton CO2. With 30 wt % MEA, the makeup rate is 1.5 lb MEA/ton CO2.
The rich loading is 0.45, and the lean loading is 0.2. Assuming a liquid holdup of
five minutes, the typical degradation rate is 7.4 mM/hr for 30 wt % MEA and
0.33 mM/hr for 15-20 wt% MEA.
The rate of oxidative degradation was 1.8 mM/hr with 0.4 loading in 30
wt % MEA containing 1 mM of iron at 55 °C. The higher makeup rate in
commercial use of 30 wt% MEA may result from higher temperature carbamate
polymerization.
5.3 Recommendations
Future study is recommended in the following areas:
1) Examine potential oxidation inhibitors for iron catalyzed MEA
oxidation. Certain tertiary amines might be effective inhibitors when
72
blended with MEA. These may include bicine, EDTA, nitrilotriacetic
acid (NTA), and MDEA.
2) Examine the effects of MEA degradation products on the oxidation
rate. These can include degradation products formed via carbamate
polymerization such as 1-(2-hydroxyethyl)-2-imidazolidone (HEIA)
and N-(2-hydroxyethyl)- ethylenediamine (HEEDA).
1-(2-hydroxyethyl)-2-imidazolidone(HEIA)
NH
H2C CH2
NCH2CH2OH
O
HOCH2CH2NHCH2CH2NH2
N-(2-hydroxyethyl)-ethylenediamine(HEEDA)
3) Examine the effect of Cu+2 as a oxidation catalyst.
4) Study oxidation at stripper conditions of high temperature and 0.2
loading by oxidized metal ions such as Fe+3 and Cu+2.
5) Examine rates at 0.2 CO2 loading and quantify rate dependence on
loading.
6) Apply this experimental method to investigate degradation
characteristics of other amine systems. These include piperazine,
alanine, and hindered amines such as amino-methyl propanol (AMP).
This can be achieved with detection methods for formaldehyde and
other volatile products.
7) Use the existing system to measure amine volatility.

73
Appendix A
Analytical Methods & Equipment Operating Procedure
A.1 FT-IR Spectroscopy Operating Procedures
This section discusses gas phase analysis for NH3 using Perkin Elmer FT-
IR spectrometer and software. Detailed procedures for using this equipment are
provided by Chisolm (1999).
A.1.1 Start-Up Procedures
• Turn on the analyzer. Check that the green light is on, indicating that
the laser is functioning
• Turn on the computer connected to the analyzer and start the Windows
software
• Start the Spectrum for Windows software program
• Click the Instrument button in Spectrum to connect the software to the
analyzer
• Click the Initialize button in Spectrum to initialize the software
• Click the Align button in Spectrum
• Check that resolution is at 8 cm-1
• Check that the gain is at 8.0
• Click the Beam button to make sure the it is connected to the left cell
• Click the Monitor button in Spectrum to check the energy level. An
energy reading of ∼ 600 is adequate; otherwise, the mirror needs to be
realigned or cleaned

74
• Open the TRIR for Windows Program
• Click on the File/Open Method menu in the TRIR program. Select the
PHCL method
A.1.2 NH3 Calibration Procedures
• Take air background with no NH3
• 5L/min air into empty reactor (32.7% channel 1 & 100%
channel 3)
• 25L/min dilution air (83.3% channel 4)
• Acquire FT-IR background by clicking Method/Background
menu in the TRIR program. Overwriting the existing file is ok
• Click Method/Start Run/Trigger menu in the TRIR program to
start run
• Hit the "A" key and left or right arrow keys to zoom in or out
of the region on the x-axis
• Hit the "A" key and up or down arrow keys to zoom in or out
of the region on the y axis
• Check that NH3 peaks at 970 and 930 cm-1 are absent
• Acquire another background, then start run again
• Turn on NH3 (1000 ppm standard) cylinder to ∼20 psi
• Turn channel 2 to starting the first calibration value (24 %) and blend
gas
• It will take five minutes to start detecting NH3 (ammonia spectrum
shown in Figure ), and wait for 5-7 minutes for each calibration
concentration, record the time at each concentration step change

75
• Once peak reaches steady state, calibrate for the next concentration by
adjusting the flow rates of NH3 or dilution air or both (Table)
• F5 to halt the run
• Shutdown by turning NH3 cylinder off and bleed NH3 out of the lines
• In the TRIR program, click the View Results/Contour Section menu to
view and save data.
• For each experiment, save a baseline contour section and a
measurement contour section. Save the data as a chromatogram file in
the C:\TRIR\Spectra directory on the hard drive. The baseline contour
will account for any drift in the analyzer during the course of the
experiment
• Baseline for NH3 is taken from 955-954 cm-1, and peak is taken from
978-955 cm-1
• Once the baseline and measurement chromatogram files are saved,
switch to the Spectrum for Windows software
• Open both the baseline and measurement chromatogram files within
Spectrum for Windows
• Click on the Auto X and Auto Y buttons to automatically adjust the
ranges
• Click on the Diff button to calculate the difference between the
measurement and the baseline
• Close the baseline and measurement chromatograms, leaving only the
difference chromatogram. This is a graph of integrated area versus
time. See Figure A-1

76
0
1000
2000
3000
4000
5000
6000
0 20 40 60 80 100Time (min)
Inte
grat
ed A
rea
(978
-955
cm
-1)
Figure A-1 NH3 Calibration Raw Data
• Save this difference file as a ASCII file for analysis in a spreadsheet
program
• Knowing the times of each step change, obtain the calibration equation
of concentration versus area. See example in Figure A-2
0
5
10
15
20
25
0 1000 2000 3000 4000 5000 6000
Integrated Area
NH
3 C
once
ntra
tion
(ppm
)
Figure A-2 NH3 Calibration Curve

77
Table A-1 NH3 Calibration
ppm Dilution Factor
Total Gas
Channel 4 % opening
(Dilution air)
Channel 2 % opening
(NH3) 1* 1000 30 83.33 12 2* 500 30 83.33 24 3 333.3 30 83.33 36 4* 250 30 83.33 48 5 200 30 83.33 60 6 166.7 30 83.33 72 7 142.9 30 83.33 84 8* 125 20 50.00 64 9 111.1 20 50.00 72
10* 100 20 50.00 80 11 90.9 10 16.67 44 12* 83.3 10 16.67 48 13 76.9 10 16.67 52 14 71.4 10 16.67 56 15 66.7 10 16.67 60 16* 62.5 10 16.67 64 17 58.8 10 16.67 68 18 55.6 10 16.67 72 19 52.6 10 16.67 76 20* 50 10 16.67 80
* indicate regularly calibrated concentrations
• Use this calibration equation to convert raw data (integrated area vs.
time) into concentration versus time.
A.2 Experimental Procedures and Data Acquisition
A.2.1 Solution Preparation
• Prepare MEA solutions gravimetrically
78
• Load MEA solutions to desired loading by sparging pure CO2 into the
MEA solution in the reactor
• To reach a loading of 0.4, first sparge CO2 for 35 minutes and check
loading with CO2 IR analyzer, then blend with unloaded MEA
solution of the same molality
• Pour 500 ml prepared solution into a volumetric flask. This solution
can be kept overnight without sigificant CO2 desorption
A.2.2 Data Acquisition
• Fill reactor with 300 ml of water
• Heat waterbath to 60 °C
• Fill condenser ice bath with ice water and turn on pump to fill
condenser
• Do not allow the condenser temperature to rise above 13 °C;
otherwise, either add more ice to the bath or increase the speed of the
pump
• Flow air into the reactor and acquire background
• Start run and acquire data for 10 minutes to make sure there is no NH3
present
• Halt run and acquire another background
• Dispose water and fill reactor with the appropriately prepared MEA
solution
• Flow oxidation gas (air, air with 2% CO2, or N2) into the reactor and
set valve to direct the flow dilution air to mix with the gas exiting the
reactor

79
• Start run to acquire experimental data. A typical spectrum is shown on
Figure 3.6.
• Zoom into the spectrum using "A" key and left or right arrow keys to
1200 to 900 cm-1 region to view the NH3 peaks. Adjust the y-
coordinate accordingly to view the height of the peak
• Wait 90 minutes for the first steady state with MEA and no additions.
Subsequent steady states with each injection of a new
chemical/concentration would take 90 to 120 minutes to reach.
• Inject chemical solutions using a plastic syringe with a 6" needle
through the injection port. See Figure 3.4.
• F5 to halt the run
• Proceed to contour section both the peak (978-955 cm-1) and the
baseline (955-954 cm-1) for NH3, and acquire a difference file in
Spectrum for Windows to enter into a spreadsheet program
• Calculate a rate in mM/hr of NH3 production for a given peak area:
For a calibration equation of the form: Ax2 + Bx + C,
( )solutionmL
rategasfactdilutionCBsAs)hr/mM(Rate2 ××++
=
• Check pH of the MEA using the pH meter
• Let the solution to reach room temperature before measuring pH
• Press Calibrate button to calibrate the pH meter with standard
buffer solutions of pH 7, 4 and 10
• Press Measure button to measure pH of solution
A.2.3 Shut-Down Procedures
• Cut the gas flow into the reactor and the dilution gas

80
• Turn off waterbath pump, condenser pump, and stir plate
• Clean reactor and condenser with water
• Rinse the exit line with some acetone to rid any
condensation/adsorption that might have occurred
• Dispose MEA solution in the appropriate amine waste container
• Turn off the main power switch for FT-IR
81
Appendix B
Experimental Data
This appendix provides an archive of experimental data collected. Some
of this data is presented as highlights in previous text, but the detailed data are
contained here. The data are presented here without discussion, and they are
organized chronologically. Each experiment is represented by a graph of NH3
production versus time. Graphs will illustrate the points of chemical injection.
Integrations are performed to yield the total NH3 produced from a chemical
injection. A table summarizing the details of the incremental additions of
chemicals for each experiment is provided. Tabular data consisting of ten to
twelve useful rates are also provided for each experiment.
All of these experiments were performed at 55°C with 5L/min of air or
nitrogen sparged into 500 ml of MEA solution.
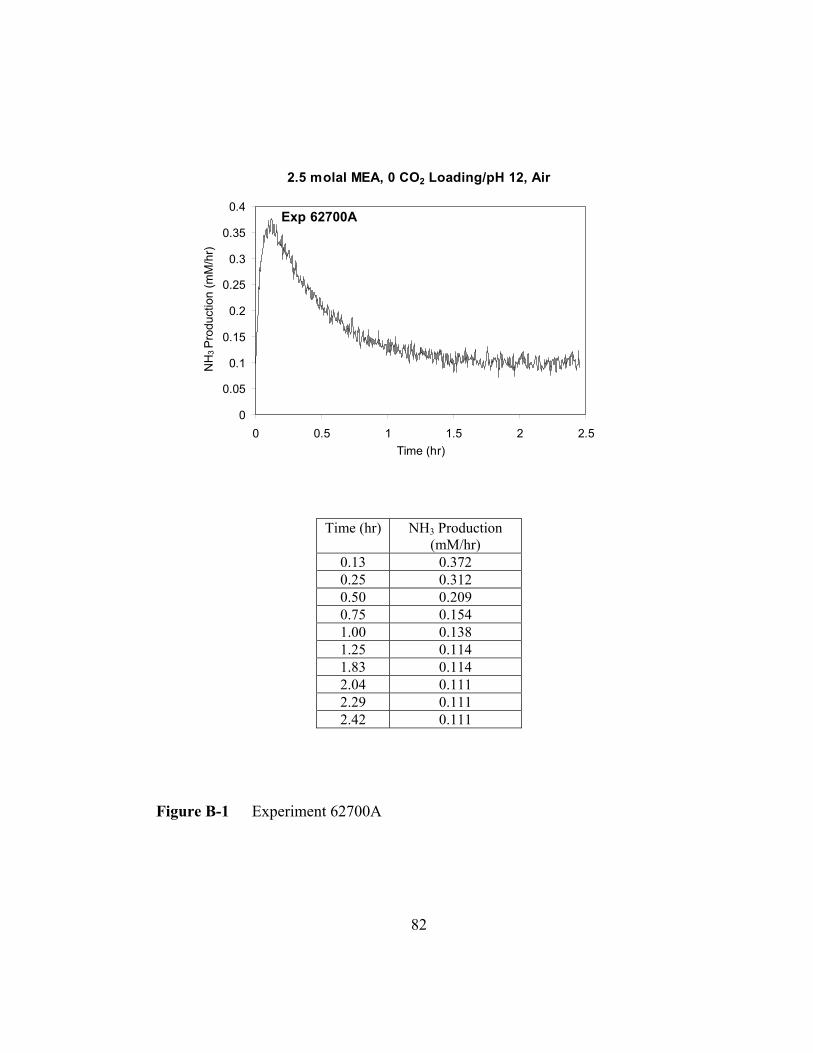
82
2.5 molal MEA, 0 CO2 Loading/pH 12, Air
0
0.05
0.1
0.15
0.2
0.25
0.3
0.35
0.4
0 0.5 1 1.5 2 2.5Time (hr)
NH
3 P
rodu
ctio
n (m
M/h
r)Exp 62700A
Time (hr) NH3 Production (mM/hr)
0.13 0.372 0.25 0.312 0.50 0.209 0.75 0.154 1.00 0.138 1.25 0.114 1.83 0.114 2.04 0.111 2.29 0.111 2.42 0.111
Figure B-1 Experiment 62700A
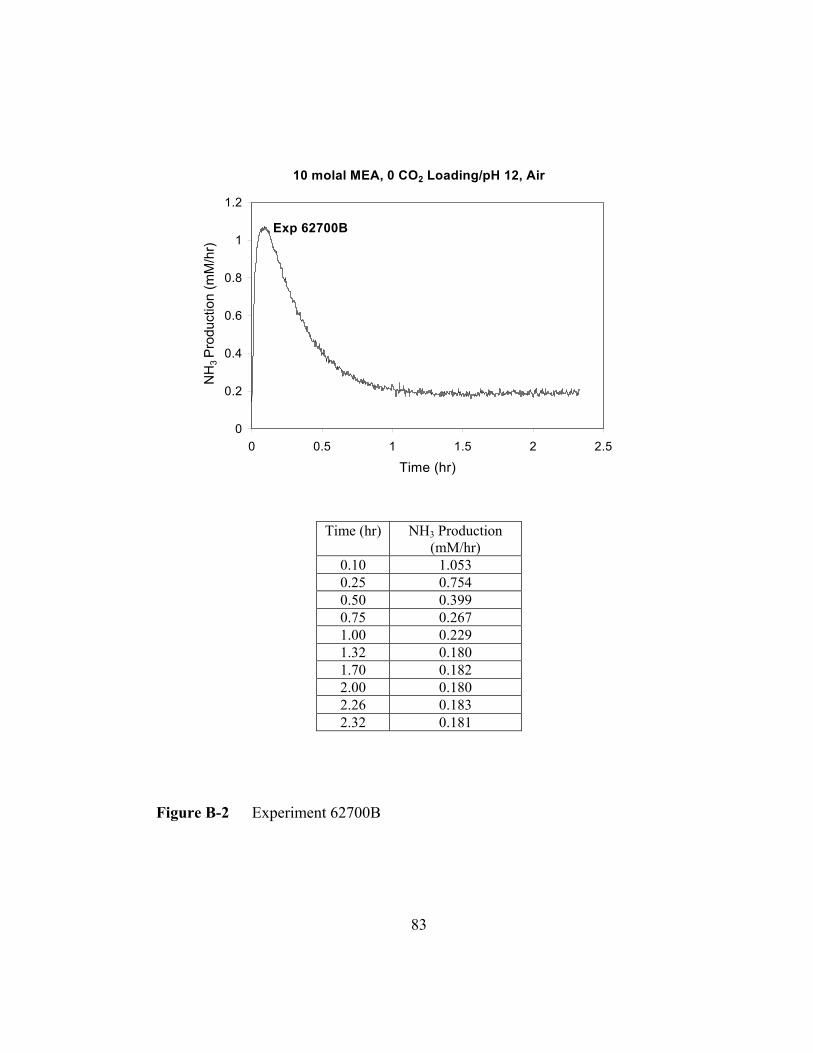
83
10 molal MEA, 0 CO2 Loading/pH 12, Air
0
0.2
0.4
0.6
0.8
1
1.2
0 0.5 1 1.5 2 2.5
Time (hr)
NH
3 P
rodu
ctio
n (m
M/h
r)Exp 62700B
Time (hr) NH3 Production
(mM/hr) 0.10 1.053 0.25 0.754 0.50 0.399 0.75 0.267 1.00 0.229 1.32 0.180 1.70 0.182 2.00 0.180 2.26 0.183 2.32 0.181
Figure B-2 Experiment 62700B

84
5 molal MEA, 0 CO2 Loading, N2
0
0.5
1
1.5
2
2.5
3
3.5
4
0 1 2 3 4 5Time (hr)
NH
3 Pro
duct
ion
(mM
/hr)
Fe+3 Fe+2
KMnO4
EDTA
Exp 70700
Reagent Injected Conc. (mM) Injection Time (hr) FeCl3 1 1.50 FeSO4 1 2.00
KMnO4 2 2.67 EDTA 10 3.58
[KMnO4] Injected
(mM ) Mole NH3 / Mole KMnO4 injected
2 0.97
Time (hr) NH3 Production (mM/hr)
0.13 0.470 0.48 0.228 1.52 0.008 2.03 0.003 2.68 0.007 2.75 3.644 3.15 2.120 3.55 0.944 3.92 0.492 4.39 0.267
Figure B-3 Experiment 70700

85
5 molal MEA, 0 CO2 Loading, Air
0
0.1
0.2
0.3
0.4
0.5
0.6
0.7
0.8
0 1 2 3 4 5Time (hr)
NH
3 P
rodu
ctio
n (m
M/h
r)
Inject Fe+3
Fe+2
EDTA
EDTA
Exp 71300
Reagent Injected Conc. (mM) Injection Time (hr) FeCl3 1 2.25 FeSO4 1 2.75 EDTA 3 2.92 EDTA 3 3.33
[FeSO4] Injected (mM ) Mole NH3 / Mole FeSO4 injected
1 0.124
Time (hr) NH3 Production (mM/hr)
0.13 0.569 0.50 0.321 1.29 0.133 2.00 0.132 2.75 0.139 2.82 0.665 3.08 0.504 3.43 0.402 4.02 0.338 4.46 0.343
Figure B-4 Experiment 71300
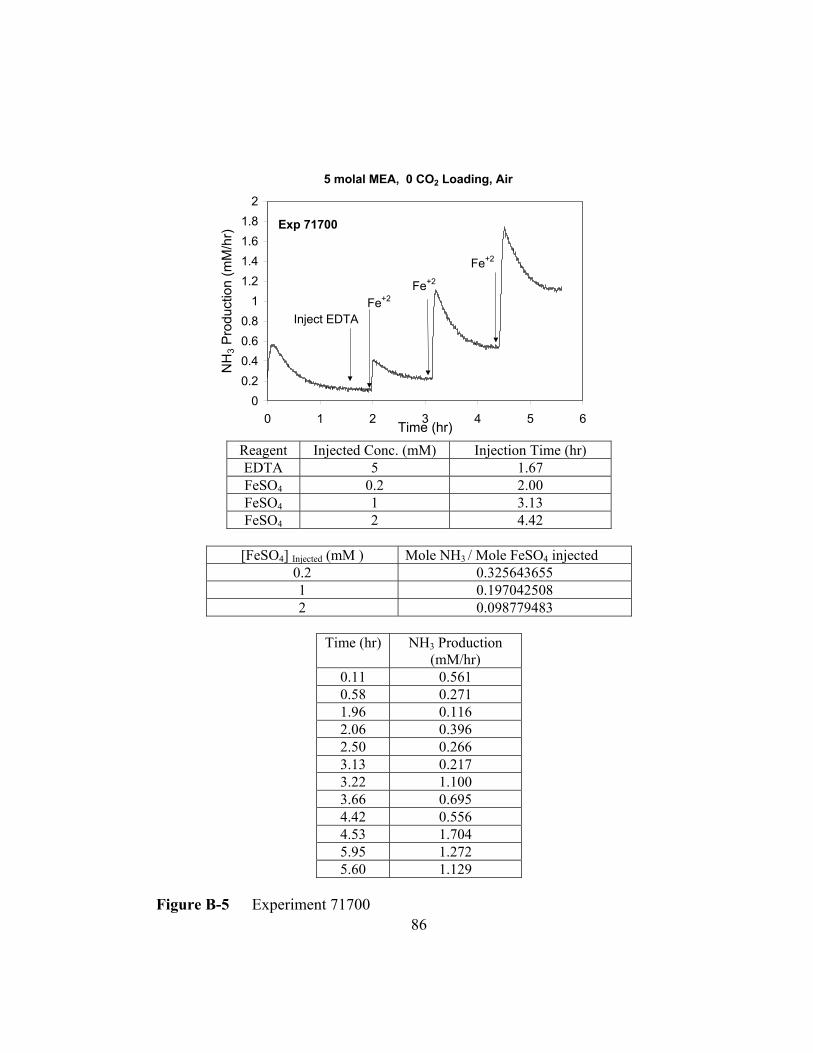
86
5 molal MEA, 0 CO2 Loading, Air
00.20.40.60.8
11.21.41.61.8
2
0 1 2 3 4 5 6Time (hr)
NH
3 Pro
duct
ion
(mM
/hr)
Inject EDTA Fe+2
Fe+2
Fe+2
Exp 71700
Reagent Injected Conc. (mM) Injection Time (hr) EDTA 5 1.67 FeSO4 0.2 2.00 FeSO4 1 3.13 FeSO4 2 4.42
[FeSO4] Injected (mM ) Mole NH3 / Mole FeSO4 injected
0.2 0.325643655 1 0.197042508 2 0.098779483
Time (hr) NH3 Production
(mM/hr) 0.11 0.561 0.58 0.271 1.96 0.116 2.06 0.396 2.50 0.266 3.13 0.217 3.22 1.100 3.66 0.695 4.42 0.556 4.53 1.704 5.95 1.272 5.60 1.129
Figure B-5 Experiment 71700
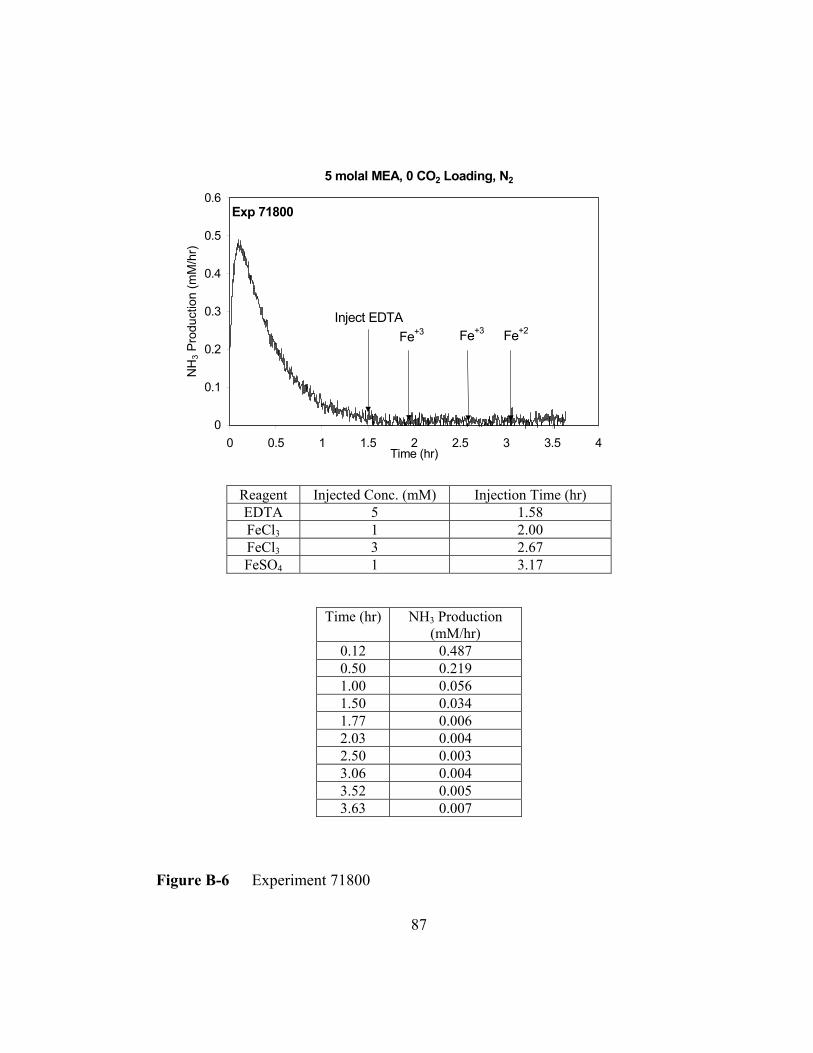
87
5 molal MEA, 0 CO2 Loading, N2
0
0.1
0.2
0.3
0.4
0.5
0.6
0 0.5 1 1.5 2 2.5 3 3.5 4Time (hr)
NH
3 Pro
duct
ion
(mM
/hr)
Inject EDTA Fe+3 Fe+3 Fe+2
Exp 71800
Reagent Injected Conc. (mM) Injection Time (hr) EDTA 5 1.58 FeCl3 1 2.00 FeCl3 3 2.67 FeSO4 1 3.17
Time (hr) NH3 Production (mM/hr)
0.12 0.487 0.50 0.219 1.00 0.056 1.50 0.034 1.77 0.006 2.03 0.004 2.50 0.003 3.06 0.004 3.52 0.005 3.63 0.007
Figure B-6 Experiment 71800
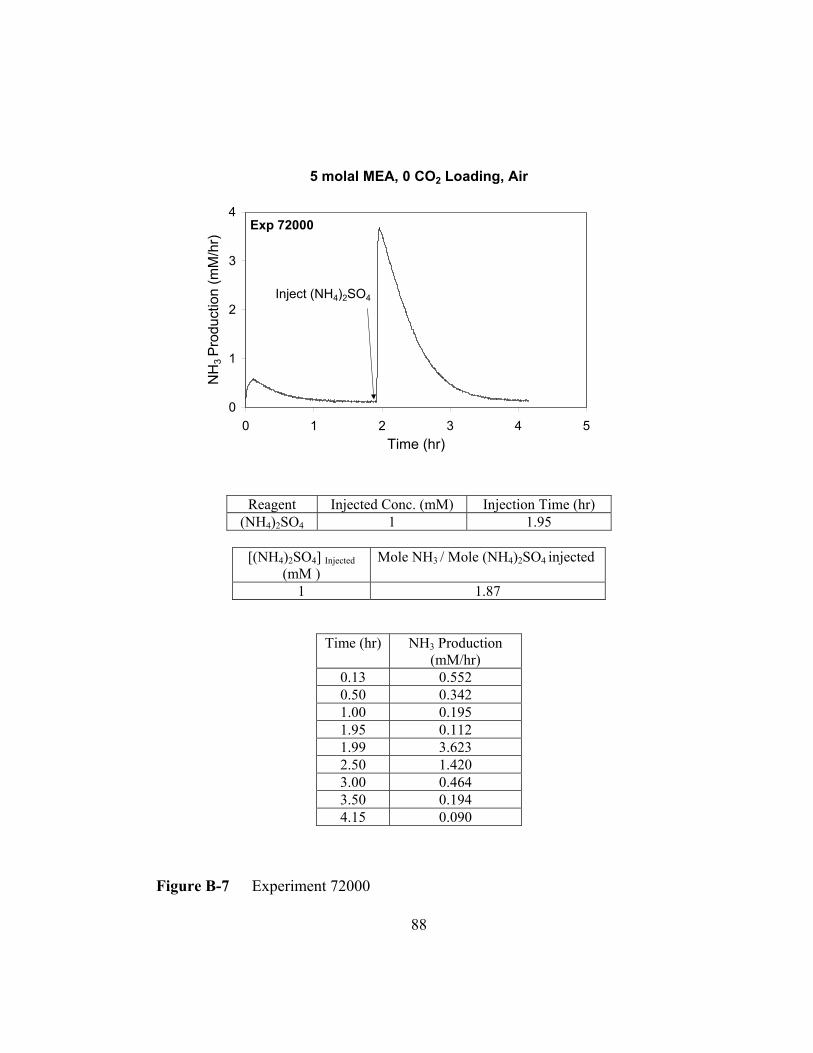
88
5 molal MEA, 0 CO2 Loading, Air
0
1
2
3
4
0 1 2 3 4 5Time (hr)
NH
3 P
rodu
ctio
n (m
M/h
r)
Inject (NH4)2SO4
Exp 72000
Reagent Injected Conc. (mM) Injection Time (hr) (NH4)2SO4 1 1.95
[(NH4)2SO4] Injected
(mM ) Mole NH3 / Mole (NH4)2SO4 injected
1 1.87
Time (hr) NH3 Production (mM/hr)
0.13 0.552 0.50 0.342 1.00 0.195 1.95 0.112 1.99 3.623 2.50 1.420 3.00 0.464 3.50 0.194 4.15 0.090
Figure B-7 Experiment 72000
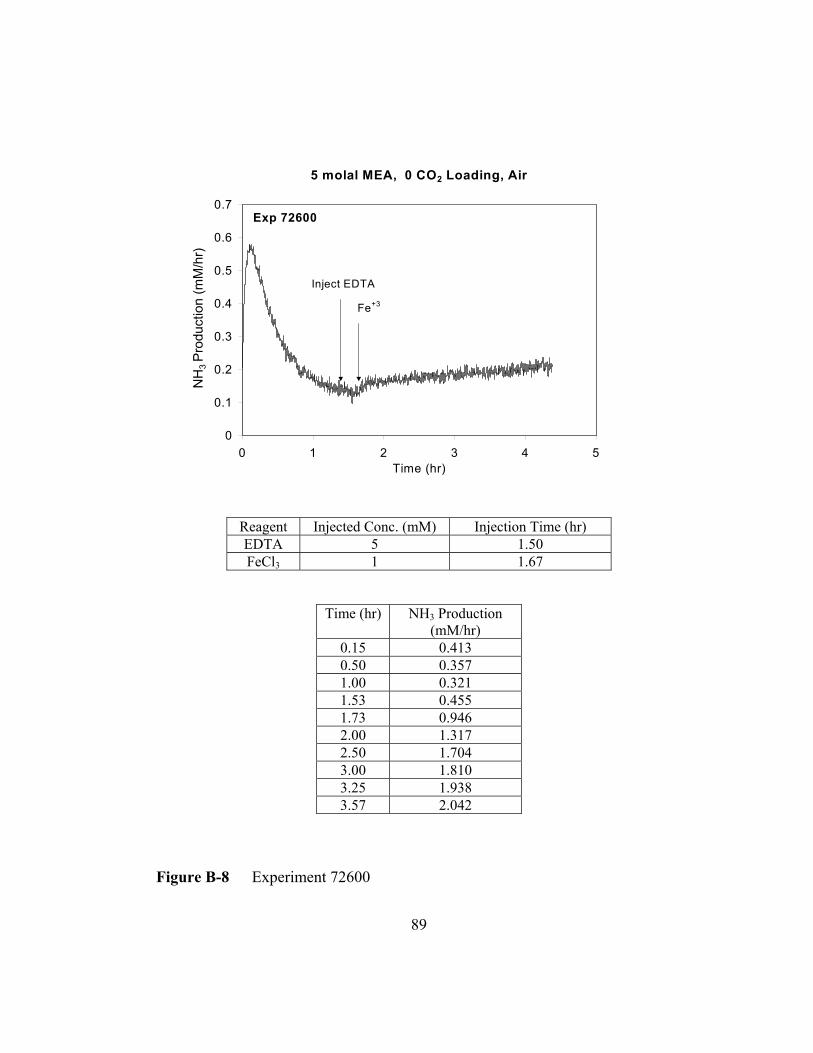
89
5 molal MEA, 0 CO2 Loading, Air
0
0.1
0.2
0.3
0.4
0.5
0.6
0.7
0 1 2 3 4 5Time (hr)
NH
3 P
rodu
ctio
n (m
M/h
r)
Fe+3
Inject EDTA
Exp 72600
Reagent Injected Conc. (mM) Injection Time (hr) EDTA 5 1.50 FeCl3 1 1.67
Time (hr) NH3 Production (mM/hr)
0.15 0.413 0.50 0.357 1.00 0.321 1.53 0.455 1.73 0.946 2.00 1.317 2.50 1.704 3.00 1.810 3.25 1.938 3.57 2.042
Figure B-8 Experiment 72600
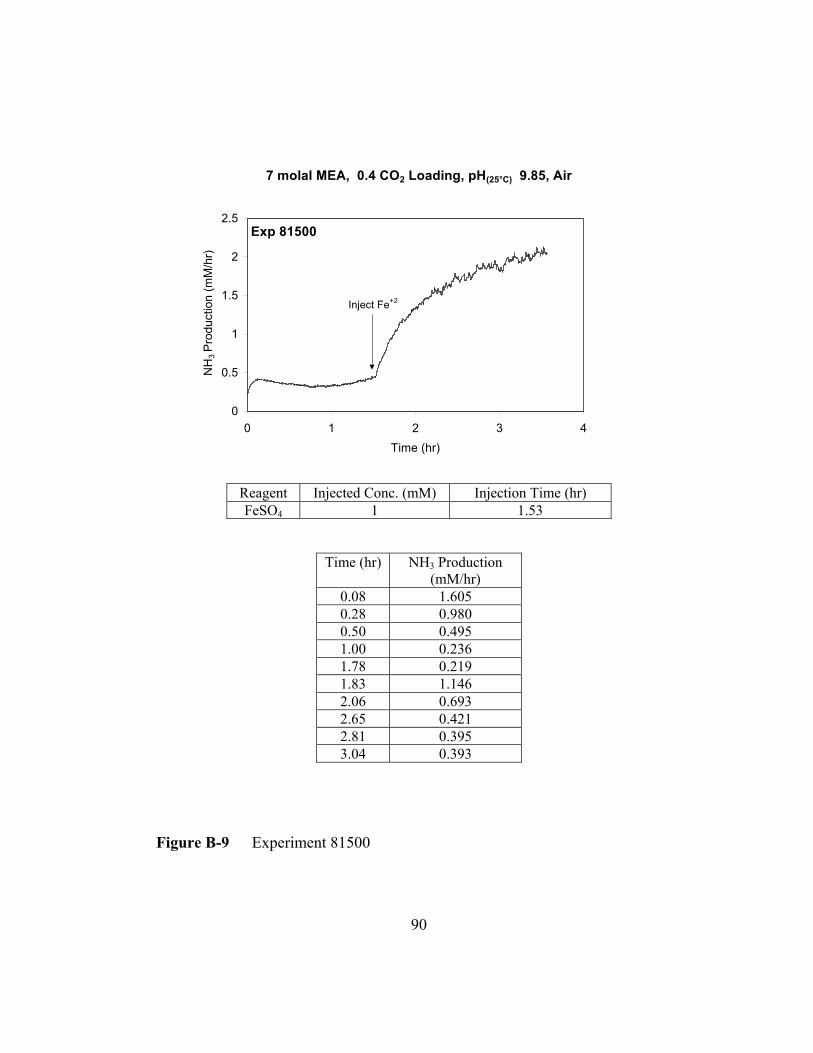
90
7 molal MEA, 0.4 CO2 Loading, pH(25°C) 9.85, Air
0
0.5
1
1.5
2
2.5
0 1 2 3 4Time (hr)
NH
3 P
rodu
ctio
n (m
M/h
r)
Inject Fe+2
Exp 81500
Reagent Injected Conc. (mM) Injection Time (hr) FeSO4 1 1.53
Time (hr) NH3 Production (mM/hr)
0.08 1.605 0.28 0.980 0.50 0.495 1.00 0.236 1.78 0.219 1.83 1.146 2.06 0.693 2.65 0.421 2.81 0.395 3.04 0.393
Figure B-9 Experiment 81500

91
12 molal MEA, 0 CO2 Loading, Air
0
0.2
0.4
0.6
0.8
1
1.2
1.4
1.6
1.8
0 0.5 1 1.5 2 2.5 3 3.5Time (hr)
NH
3 P
rodu
ctio
n (m
M/h
r)
Inject Fe+2
Exp 81600
Reagent Injected Conc. (mM) Injection Time (hr) FeSO4 1 1.78
[FeSO4]Injected (mM) Mole NH3/Mole FeSO4 injected
1 0.213821717
Time (hr) NH3 Production (mM/hr)
0.15 0.572 0.50 0.312 1.00 0.168 1.67 0.139 1.83 0.168 2.10 0.164 2.50 0.182 3.00 0.196 3.50 0.190 4.39 0.214
Figure B-10 Experiment 81600

92
7 molal MEA, Air, 0 CO2 Loading
0
0.1
0.2
0.3
0.4
0.5
0.6
0.7
0.8
0.9
1
0 0.5 1 1.5 2Time (hr)
NH
3 Pro
duct
ion
(mM
/hr)
Inject Formaldehyde
Exp 90800
Reagent Injected Conc. (mM) Injection Time (hr) Formaldehyde 2 1.17
Time (hr) NH3 Production (mM/hr)
0.12 0.884 0.25 0.675 0.50 0.385 0.75 0.251 1.00 0.181 1.17 0.148 1.18 0.085 1.27 0.138 1.40 0.157 1.55 0.152
Figure B-11 Experiment 90800

93
7 molal MEA, N2, 0 CO2 Loading
0
0.5
1
1.5
2
2.5
0 0.5 1 1.5 2 2.5 3 3.5Time (hr)
NH
3 Pro
duct
ion
(mM
/hr)
Inject Fe+2
H2O2
Exp 90900
Reagent Injected Conc. (mM) Injection Time (hr) FeSO4 1 1.58 H2O2 1 1.67
[H2O2] Injected (mM ) Mole NH3 / Mole H2O2 injected
1 1.0
Time (hr) NH3 Production (mM/hr)
0.14 0.756 0.50 0.260 1.00 0.060 1.53 0.006 1.63 0.001 1.73 2.247 2.00 0.946 2.50 0.200 2.75 0.098 3.04 0.050
Figure B-12 Experiment 90900

94
7 molal MEA, 0.4 CO2 Loading, pH(25°C) 9.96, Air
0
0.5
1
1.5
2
2.5
3
0 0.5 1 1.5 2 2.5 3 3.5Time (hr)
NH
3 Pro
duct
ion
(mM
/hr)
Inject Fe+3
Exp 91000
Reagent Injected Conc. (mM) Injection Time (hr) FeCl3 1 1.00
Time (hr) NH3 Production (mM/hr)
0.16 0.493 0.50 0.422 1.00 0.354 1.25 0.934 1.50 1.419 1.75 1.739 2.00 2.003 2.25 2.209 2.50 2.232 3.12 2.367
Figure B-13 Experiment 91000
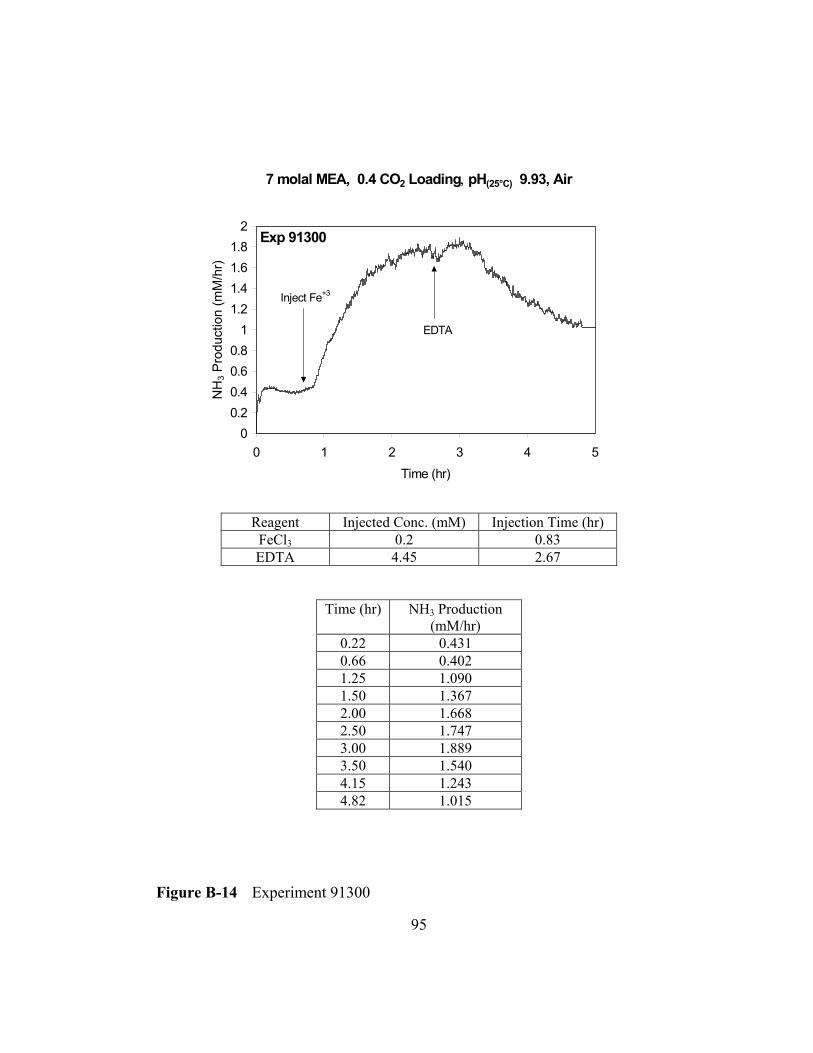
95
7 molal MEA, 0.4 CO2 Loading, pH(25°C) 9.93, Air
00.20.40.60.8
11.21.41.61.8
2
0 1 2 3 4 5Time (hr)
NH
3 Pro
duct
ion
(mM
/hr)
Inject Fe+3
EDTA
Exp 91300
Reagent Injected Conc. (mM) Injection Time (hr) FeCl3 0.2 0.83 EDTA 4.45 2.67
Time (hr) NH3 Production (mM/hr)
0.22 0.431 0.66 0.402 1.25 1.090 1.50 1.367 2.00 1.668 2.50 1.747 3.00 1.889 3.50 1.540 4.15 1.243 4.82 1.015
Figure B-14 Experiment 91300
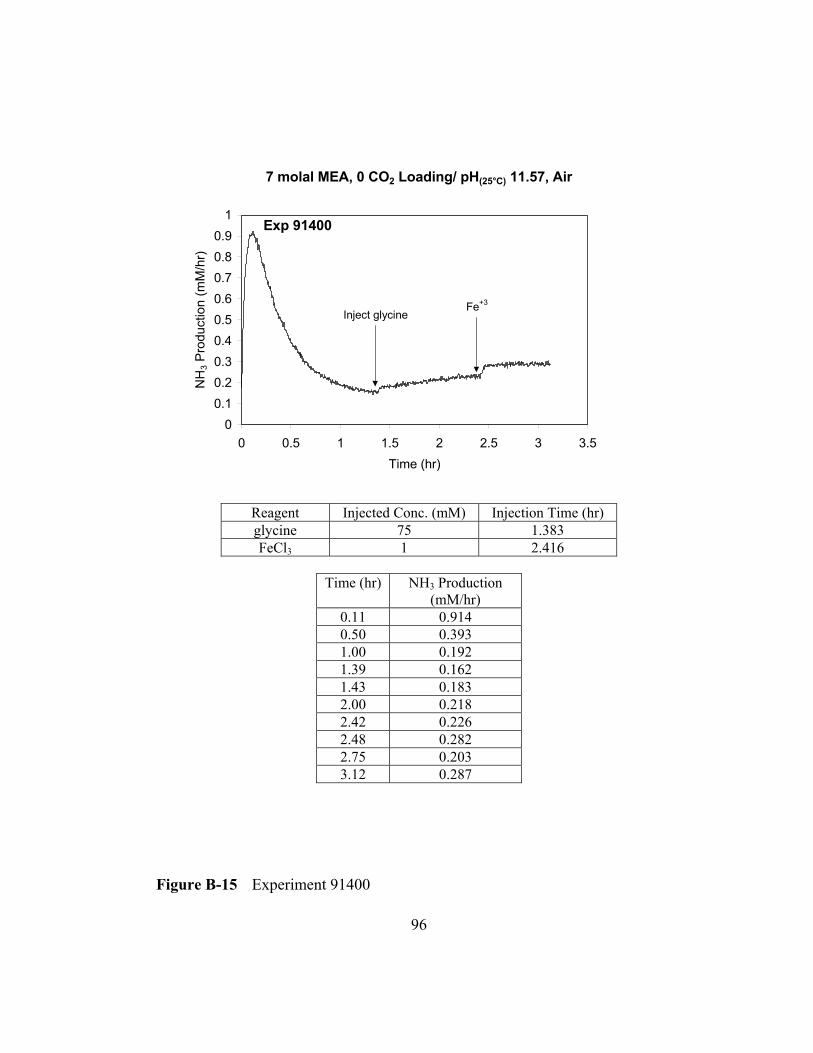
96
7 molal MEA, 0 CO2 Loading/ pH(25°C) 11.57, Air
00.10.20.30.40.50.60.70.80.9
1
0 0.5 1 1.5 2 2.5 3 3.5Time (hr)
NH
3 Pro
duct
ion
(mM
/hr)
Inject glycineFe+3
Exp 91400
Reagent Injected Conc. (mM) Injection Time (hr) glycine 75 1.383 FeCl3 1 2.416
Time (hr) NH3 Production
(mM/hr) 0.11 0.914 0.50 0.393 1.00 0.192 1.39 0.162 1.43 0.183 2.00 0.218 2.42 0.226 2.48 0.282 2.75 0.203 3.12 0.287
Figure B-15 Experiment 91400

97
7 molal MEA, 0.4 CO2 Loading/ pH(25°C) 10.05, Air
0
0.2
0.4
0.6
0.8
1
1.2
1.4
0 2 4 6 8 10Time (hr)
NH
3 Pro
duct
ion
(mM
/hr)
0.003 mM FeCl30.007 mM
0.02 mM0.07 mM
13 mM EDTA
Exp 91600
Reagent Injected Conc. (mM) Injection Time (hr) FeCl3 0.003 1.00 FeCl3 0.007 2.67 FeCl3 0.02 4.33 FeCl3 0.07 5.83 EDTA 13 7.33
Time (hr) NH3 Production
(mM/hr) 0.29 0.466 1.23 0.354 1.90 0.425 2.65 0.493 3.43 0.627 4.51 0.692 5.00 0.782 5.75 0.798 6.39 1.019 7.36 1.150 8.23 0.969 9.12 0.865
Figure B-16 Experiment 91600

98
7 molal MEA, 0 CO2 Loading/pH25 C 10.27, Air
0
0.1
0.2
0.3
0.4
0.5
0.6
0.7
0.8
0.9
0 1 2 3 4 5 6 7
Time (hr)
NH
3 Pro
duct
ion
(mM
/hr)
Fe+3
Fe+3
BicineExp 92000
Reagent Injected Conc. (mM) Injection Time (hr)
FeCl3 0.1 1.00 FeCl3 0.9 2.85 Bicine 86 5.167
Time (hr) NH3 Production (mM/hr)
0.14 0.519 1.00 0.183 1.32 0.321 2.05 0.347 2.89 0.412 3.22 0.565 4.00 0.633 5.02 0.768 5.50 0.527 6.40 0.334
Figure B-17 Experiment 92000

99
7 molal MEA, 0.4 CO2 Loading/pH(25°C) 10.05, Air
0
0.2
0.4
0.6
0.8
1
1.2
1.4
1.6
1.8
2
0 2 4 6 8Time (hr)
NH
3 Pro
duct
ion
(mM
/hr)
0.01 mM Fe+2
0.99 mM Fe+2
100 mM bicine
10 mM bicine
1 mM bicine
Exp 92200
Reagent Injected Conc. (mM) Injection Time (hr) FeSO4 0.01 1.3 FeSO4 0.99 3.025 Bicine 1 4.75 Bicine 9 5.167 Bicine 90 6.67
Time (hr) NH3 Production (mM/hr)
0.11 0.608 1.20 0.362 2.17 0.668 3.00 1.002 3.27 1.339 4.45 1.723 5.13 1.640 6.61 1.256 7.42 0.979 8.18 0.795
Figure B-18 Experiment 92200
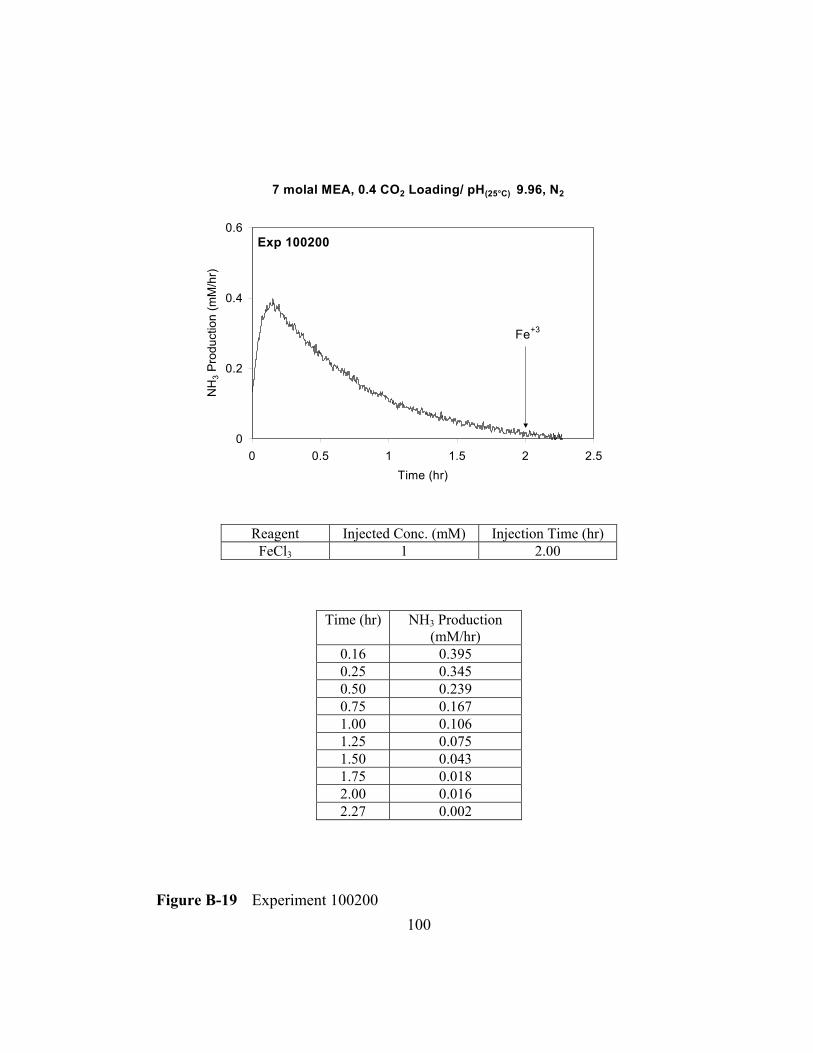
100
7 molal MEA, 0.4 CO2 Loading/ pH(25°C) 9.96, N2
0
0.2
0.4
0.6
0 0.5 1 1.5 2 2.5Time (hr)
NH
3 Pro
duct
ion
(mM
/hr)
Fe+3
Exp 100200
Reagent Injected Conc. (mM) Injection Time (hr) FeCl3 1 2.00
Time (hr) NH3 Production (mM/hr)
0.16 0.395 0.25 0.345 0.50 0.239 0.75 0.167 1.00 0.106 1.25 0.075 1.50 0.043 1.75 0.018 2.00 0.016 2.27 0.002
Figure B-19 Experiment 100200

101
7 molal MEA, 0.4 CO2 Loading/pH(25°C) 10, Air
0
0.5
1
1.5
2
2.5
0 1 2 3 4 5
Time (hr)
NH
3 Pro
duct
ion
(mM
/hr)
Fe+2
DEMEAExp 100300
Reagent Injected Conc. (mM) Injection Time (hr) FeSO4 1 1.167
DEMEA 100 2.6
Time (hr) NH3 Production (mM/hr)
0.14 0.175 0.53 0.253 1.16 0.362 1.50 0.971 2.00 1.496 2.61 1.760 2.70 2.279 3.20 1.948 3.78 1.719 4.17 1.656
Figure B-20 Experiment 100300

102
References Cited
Anbar, M., Neta, P., "A Compilation of Specific Biomolecular Rate Constants for the Reactions of Hydrated Electrons, Hydrogen Atoms and Hydoxyl Radicals with Inorganic and Organic Compounds in Aqueous Solutions," Int. J. App. Rad. Isotopes, 1967,18, 439-523, Asmus, K.D., Bonifacic, M., "Radical Reaction Rates in Liquids: Carbon-Centered Radicals," Landolt-Bornstein Vol 13b, Springer-Verlag Berlin, 1984. Audeh, C.A., Lindsay Smith, J.R., "Amine Oxidation. Part II. The Oxidation of Some Trialkylamines with Alkaline Potassium Hexacyanoferrate (III)," J. Chem. Soc. (B), 1970, 1280-1285. Bacon, T.R., Dupart, M.S., Rooney, P.C., "Oxygen's Role in Alkanolamine Degradation," Hydrocarbon Processing, July 1998, 109-113. Blachly, C.H. and Raver, H., " Stabilization of Monoethanolamine Solutions in Carbon Dioxide Scrubbers," U.S. Naval Research Laboratory, Rept. 6189 (December 1964) Blachly, C.H. and Raver, H., "Stabilization of Monoethanolamine Solutions in Carbon Dioxide Scrubbers," J. Chem. Eng. Data, 1966, Vol 11, No. 3, 401-403. Brown, E.R., Mazzarella, J.D., "Mechanism of Oxidation of Ferrous Polydentate Complexes by Dioxygen," J. Electroanal.Chem., 1987, 222, 173-192. Chisholm, P.N., "Dry Absorption of Hydrogen Chloride and Sulfur Dioxide by Calcium-Based Sorbents from Humidified Flue Gas," Ph.D. Dissertation, Department of Chemical Engineering, University of Texas at Austin, 1999. Christensen, J.J., Izatt, R.M., Wrathall, D.P., Hansen, L.D., "Thermodynamics of Proton Ionization in Dilute Aqueous Solutions. Part XI. pK, ∆H°, and ∆S° Values for Proton Ionization from Protonated Amines at 25°," J. Chem. Soc (A), 1969, 1212-1223. Cringel, D.C., Pearce, R.L., Dupart M.S., "Method for Maintaining Effective Corrosion Inhibitors in Gas Scrubbing Plant," U.S. Pat. 4,690,740, 1987.

103
Denisov, E.T., Mitskevich, N.I., Agabekov, V.E., "Liquid-Phase Oxidation of Oxygen-Containing Compounds," Consultant Bureau, New York, 1977. Dennis, W.H., Hull, L.A., Rosenblatt, D.H., "Oxidation of Amines, IV. Oxidative Degradation," J. Org. Chem., 1967, 32, 3783-3787. Ferris, J.P., Gerwe, R.D., Gapski, G.R., "Detoxication Mechanisms II. The Iron-Catalyzed Dealkylation of Tertiary Amine Oxide," J. Am. Chem. Soc., 1967, 89, 5370-5375. Ferris, J.P., Gerwe, R.D., Gapski, G.R., "Detoxication Mechanisms III. The Scope and Mechanism of the Iron-Catalyzed Dealkylation of Tertiary Amine Oxide," J. Org. Chem., 1968, 33, 3493-3498. Hall, W.D., Barron, J.G., "Solving Gas Treating Problems - A Different Approach," Presented at the Laurance Reid Gas Conditioning Conference, Norman, OK 1981. Howard, J.A., Scaiano, J.C., "Radical Reaction Rates in Liquids: Oxyl-, Peroxyl- and Related Radicals, Landolt-Bornstein Vol 13d, Springer-Verlag Berlin, 1984. Hull, L.A., Davis, G.T., Rosenblatt, D.H., "Oxidation of Amines. VII. Chemical and Electrochemical Correlations," J. Phys. Chem., 1969, 73, 2142-2146. Hull, L.A., Giordano, W.P., Rosenblatt, D.H., Davis, G.T., Mann, C.K., Milliken, S.B., "Oxidation of Amines. VIII. Role of the Cation Radical in the Oxidation of Triethylenediamine by Chlorine Dioxide and Hypochlorous Acid," J. Phys. Chem., 1969b, 73, 2147-2152. Hull, L.A., Davis, G.T., Rosenblatt, D.H., "Oxidation of Amines. IX. Correlation of Rate Constants for Reversible One-Electron Transfer in Amine Oxidation with Reactant Potentials," J. Am. Chem. Soc., 1969c, 91, 6247-6250. Kindrick, R.C., Atwood, K., Arnold, M.R., "The Relative Resistance to Oxidation of Commercially Available Amines," Girdler Report No. T2.15-1-30, in "Report: Carbon Dioxide Absorbents," Contract No. NObs-50023, by Girdler Corp., Gas Processes Division, Louisville, KY, for The Navy Department, Bureau of Ships, Washington 25, DC (Code 649P), June 1, 1950a. Kindrick, R.C., Reitmweier, R.E., Arnold, M.R., "A Prolonged Oxidation Test on Amine Solutions Resistant to Oxidation," Girdler Report No. T2.15-1-31, in

104
"Report: Carbon Dioxide Absorbents," Contract No. NObs-50023, by Girdler Corp., Gas Processes Division, Louisville, KY, for The Navy Department, Bureau of Ships, Washington 25, DC (Code 649P), May 25, 1950b. Lee, Y.J., Rochelle, G.T., "Oxidative Degradation of Organic Additives for Flue Gas Desulfurization: Products, Kinetics, and Mechanisms," Env. Sci. Tech., 1987, 21, 266-272. Lindsay Smith, J.R., Mead, L.A.V., "Amine Oxidation. Part VII. The Effect of Structure on the Reactivity of Alkyl Tertiary Amines towards Alkaline Potassium Hexacyanoferrate(III)," J. Chem. Soc. Perkin II, 1973, 206-210. Lindsay Smith, J.R., Mead, L.A.V., "Amine Oxidation. Part IX. Oxidation of Some Substituted Tertiary Alkylamines and Some N,N-dimethylphenethylamine with Potassium Hexacyanoferrate(III)," J. Chem. Soc. Perkin II, 1976, 1172-1176. Neta, P., Huie, R.E., Ross, A.B., "Rate Constants for Reactions of Inorganic Radicals in Aqueous Solutions," J. Phys. Chem. Ref. Data., 1988, 17, No. 3, 1027. Pearce, R.L., Process for Removal of Carbon Dioxide from Industrial Gases, U.S. Pat. 4,440,731, 1984. Pearce, R.L., Wolcott, R.A., Pauley, C.R., Process for the Recovery of CO2 from Flue Gases, U.S. Pat. 4,477,419, 1984. Rosenblatt, D.H., Hayes, A.J., Harrison, B.L., Streaty, R.A., Moore, K.A., "Oxidation of Amines. I. The Reaction of Chlorine Dioxide with Triethylamine in Aqueous Solutions," J. Org, Chem., 1963, 28, 2790-2794. Rosenblatt, D.H., Hull, L.A., De Luca, D.C., Davis, G.T., Weglein, R.C., Williams, H.K.R., "Oxidation of Amines. II. Substituent Effects in Chlorine Dioxide Oxidation," J. Am. Chem. Soc., 1967, 89, 1158-1163. Rosenblatt, D.H., Davis, G.T., Hull, L.A., Forber, G.D., " Oxidation of Amines. V. Duality of Mechanism in the Reactions of Aliphatic Amines with Permanganate," J. Org. Chem., 1968, 33, 1649-1650.

105
Russel, G.A. Peroxide Pathways to Autooxidation, p. 107-128 in Peroxide Reaction Mechanism ed. by J.O. Edwards, Interscience Publishers, New York, 1960. Sajus, L., Seree De Roch, I. The Liquid Phase Oxidation of Aldehydes, p. 89-124 in Comprehensive Chemical Kinetics, Vol 16, Liquid-Phase Oxidation, Elsevier Scientific Publishing Co., Amsterdam, 1980. Singh, V.N., Gangwar, M.C., Saxena, B.B.L., Singh, M.P., "Kinetics and Mechanism fo the Oxidation of Formaldehyde by Hexacyanoferrate (III) Ion," Can. J. Chem., 1969, 47, 1051-1056. Stumm, W., Lee, G.F., "Oxygenation of Ferrous Iron," Ind. Eng. Chem., 1961, 53, 143-146. Tamura, H., Goto, K., Nagayama, M., "Effect of Anions on the Oxygenation of Ferrous Iron in Neutral Solution," Inorg. Nucl. Chem., 1976, 38 113-117. Ulrich, R.K., "Sulfite Oxidation under Flue Gas Desulfurization Conditions: Enhanced Oxygen Absorption Catalyzed by Transition Metals," Ph.D. Dissertation, The University of Texas at Austin, 1983. Wolcott, R.A., Pearce, R.L., Pauley, C.R., "Process for the Recovery of CO2 from Flue Gases, U.S. Pat. 4,624,839, 1986.
106
Vita
Susan Chi was born on November 28, 1977 in Shanghai, China, the only
child of Eric Chi and Sue Wang. She graduated from The Texas Academy of
Mathematics and Science, a gifted program for high school students, in 1996
before attending The University of Texas at Austin. She graduated with Highest
Honors with a B.S. in Biochemistry in 1998. Shortly after graduation, she was
admitted on a full-fledged scholarship to Chemical Engineering graduate school
at The University of Texas at Austin. Upon completion of her M.S. degree, she
will begin her new job as a process engineer at MEMC Southwest in Sherman,
Texas.
Permanent Address: 3111 Parker Lane #357
Austin, TX 78741
This thesis was typed by the author.

107

![Creating Competitive Products Qian Wan [1], Raymond Chi-Wing Wong [1], Ihab F. Ilyas [2], M. Tamer Ozsu [2], Yu Peng [1] [1] Hong Kong University of Science](https://img.pdfslide.us/doc/110x75/56649d9e5503460f94a88883/creating-competitive-products-qian-wan-1-raymond-chi-wing-wong-1-ihab.jpg)


![· 2008-08-29 · 1 ䷀ 1. Qian [Pure Yang] (Qian Above Qian Below) Judgment Qian consists of fundamentality [yuan], prevalence [heng], fitness [li], and constancy [zhen]. Commentary](https://img.pdfslide.us/doc/110x75/5f7e394b66d623427a3654aa/2008-08-29-1-1-qian-pure-yang-qian-above-qian-below-judgment-qian-consists.jpg)