Embed Size (px)
Citation preview

Design and Analysis of Large Scale Log StudiesA CHI 2011 course
v11
Susan Dumais, Robin Jeffries, Daniel M. Russell, Diane Tang, Jaime TeevanCHI Tutorial, May, 2011
1
Introduction
Daniel M. Russell Google
2
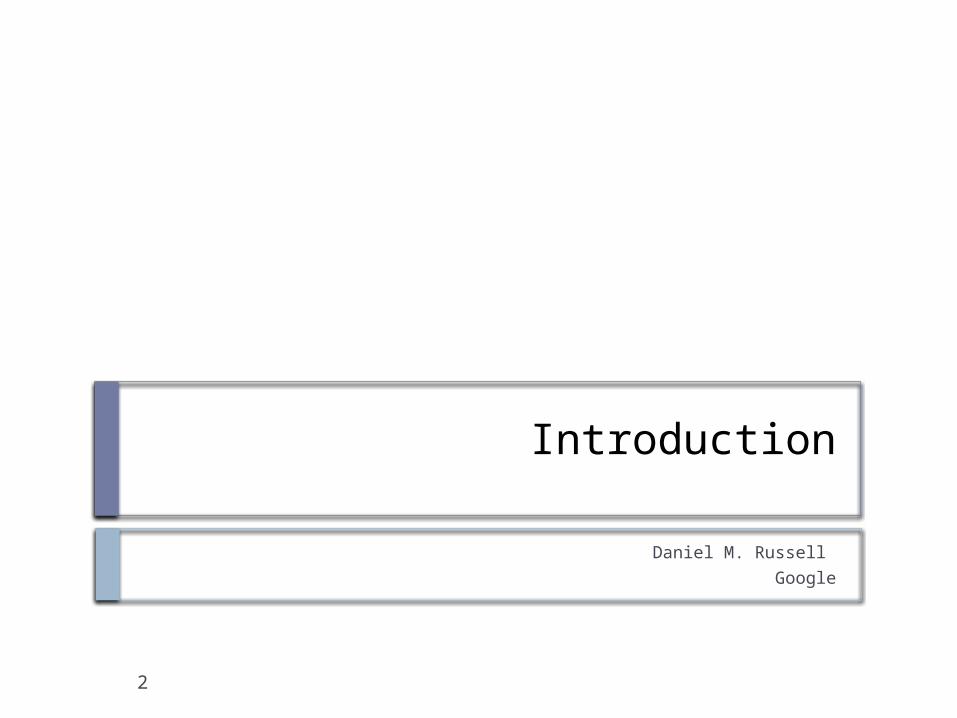
What Can We (HCI) Learn from Log Analysis?
Logs are the traces of human behavior … seen through the lenses of whatever sensors we have
Actual behaviors As opposed to recalled behavior As opposed to subjective impressions of behavior
3
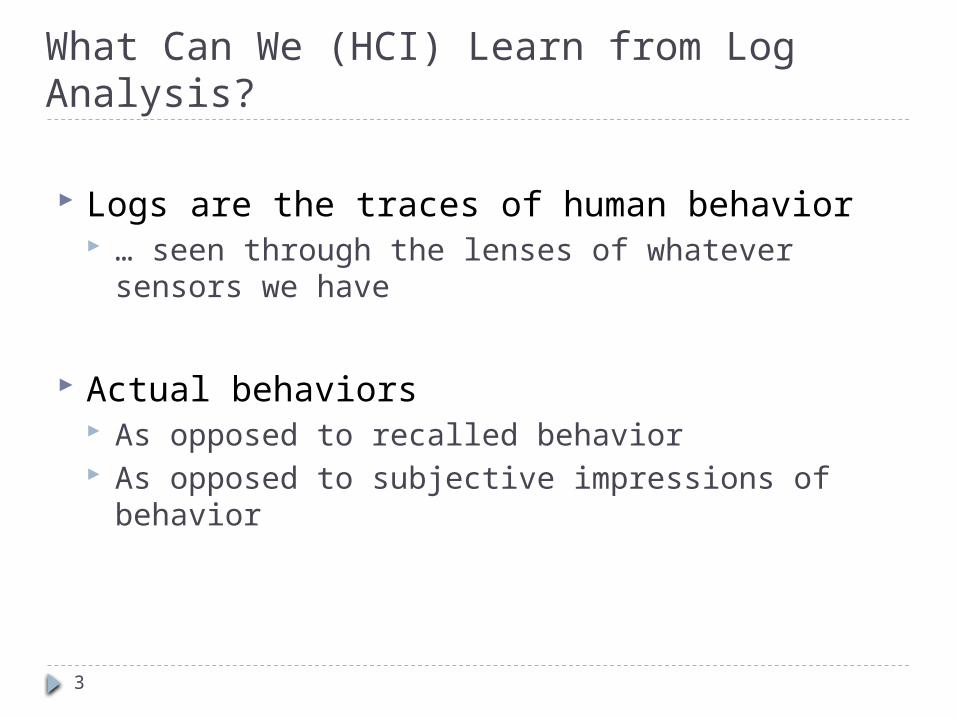
Benefits
Portrait of real behavior… warts & all … and therefore, a more complete, accurate picture of ALL behaviors, including
the ones people don’t want to talk about
Large sample size / liberation from the tyranny of small N Coverage (long tail) & Diversity
Simple framework for comparative experiments
Can see behaviors at a resolution / precision that was previously impossible
Can inform more focused experiment design 4
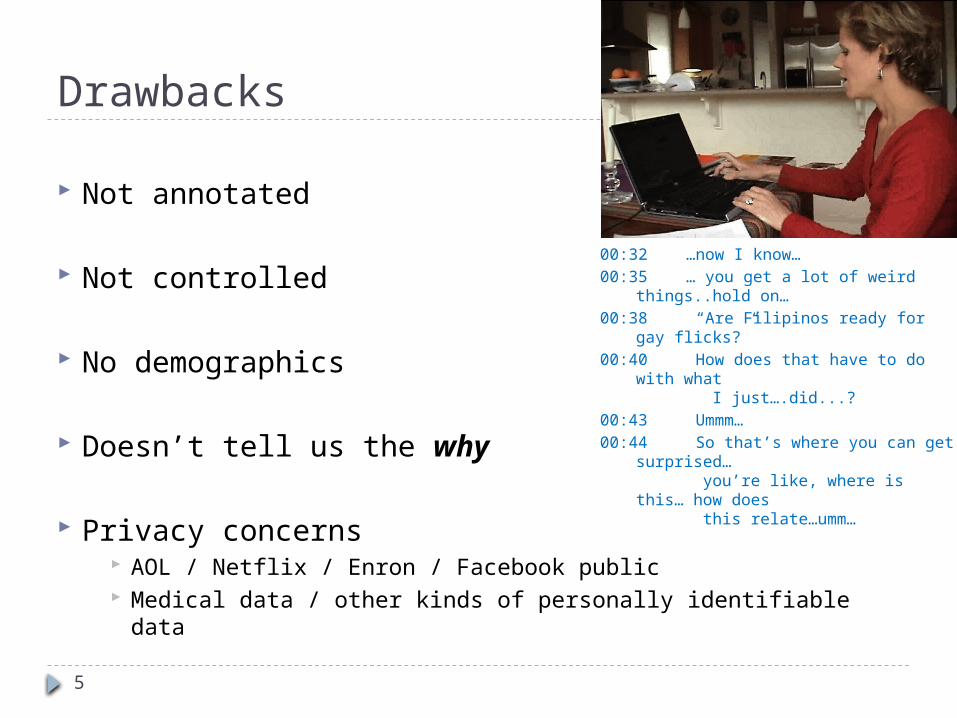
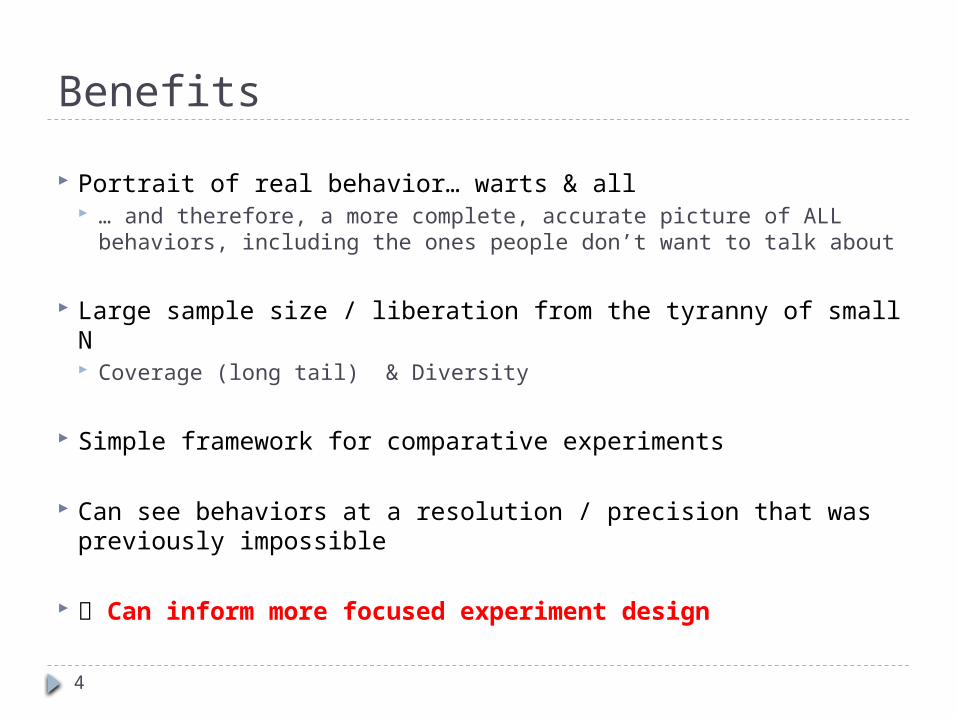
Drawbacks
Not annotated
Not controlled
No demographics
Doesn’t tell us the why
Privacy concerns AOL / Netflix / Enron / Facebook public Medical data / other kinds of personally identifiable data
5
00:32 …now I know… 00:35 … you get a lot of weird
things..hold on…00:38 “Are Filipinos ready for gay flicks?” 00:40 How does that have to do with
what I just….did...?
00:43 Ummm… 00:44 So that’s where you can get
surprised… you’re like, where is this… how does this relate…umm…
What Are Logs for This Discussion? User behavior events over time
User activity primarily on web Edit history Clickstream Queries Annotation / Tagging PageViews … all other instrumentable events (mousetracks, menu events….)
Web crawls (e.g., content changes) E.g., programmatic changes of content
6
How to Generate Logs
Use existing logged data Explore sources in your community (e.g., proxy logs) Work with a company (e.g., intern, visiting researcher) Construct targeted questions
Generate your own logs Focuses on questions of unique interest to you
Construct community resources Shared software and tools
Client side logger (e.g., VIBE logger) Shared data sets Shared experimental platform to deploy experiments (and to attract visitors) Other ideas?
7
Interesting Sources of Log Data
Anyone who runs a Web services
Proxy (or library) logs at your institution
Publically available social resources Wikipedia (content, edit history) Twitter Delicious, Flickr Facebook public data?
Others? GPS Virtual worlds Cell call logs
8
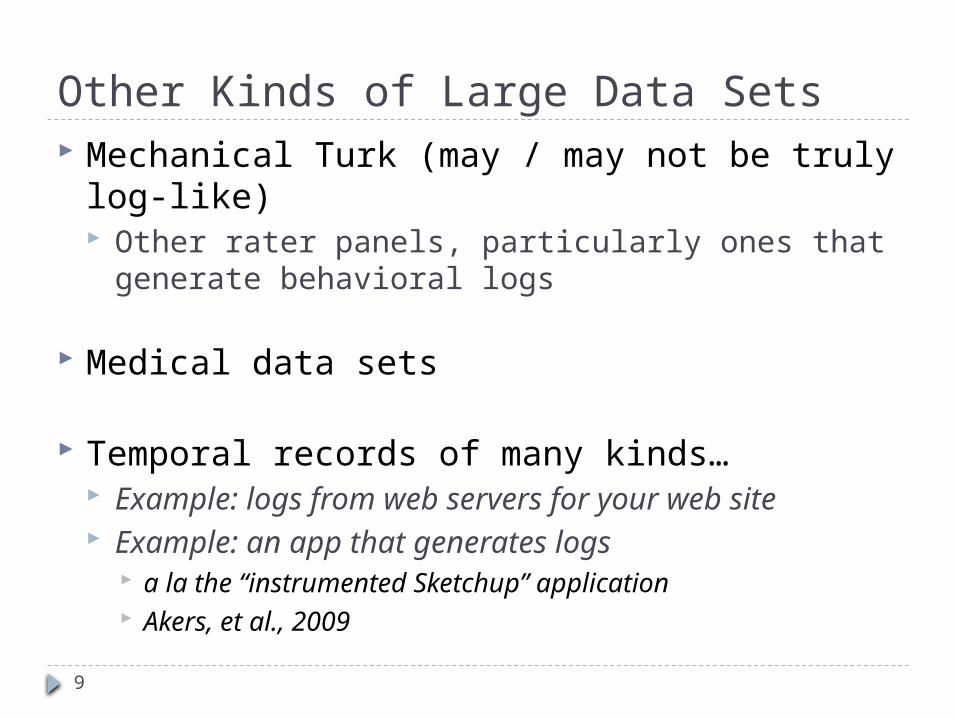
Other Kinds of Large Data Sets Mechanical Turk (may / may not be truly log-like)
Other rater panels, particularly ones that generate behavioral logs
Medical data sets
Temporal records of many kinds… Example: logs from web servers for your web site Example: an app that generates logs
a la the “instrumented Sketchup” application Akers, et al., 2009
9
Audience Discussion What kind of logs do you need to analyze?
What kinds of logs does your work generate?
Open Discussion
10
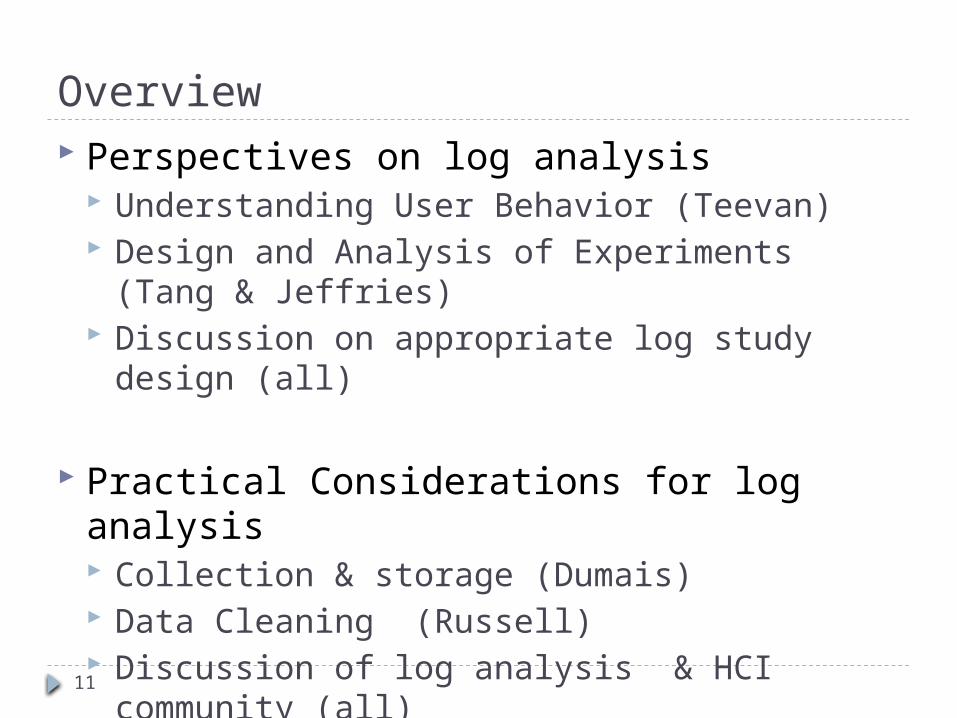
Overview Perspectives on log analysis
Understanding User Behavior (Teevan) Design and Analysis of Experiments (Tang & Jeffries) Discussion on appropriate log study design (all)
Practical Considerations for log analysis Collection & storage (Dumais) Data Cleaning (Russell) Discussion of log analysis & HCI community (all)
11
Section 1:Understanding User Behavior
Jaime Teevan & Susan DumaisMicrosoft Research
12
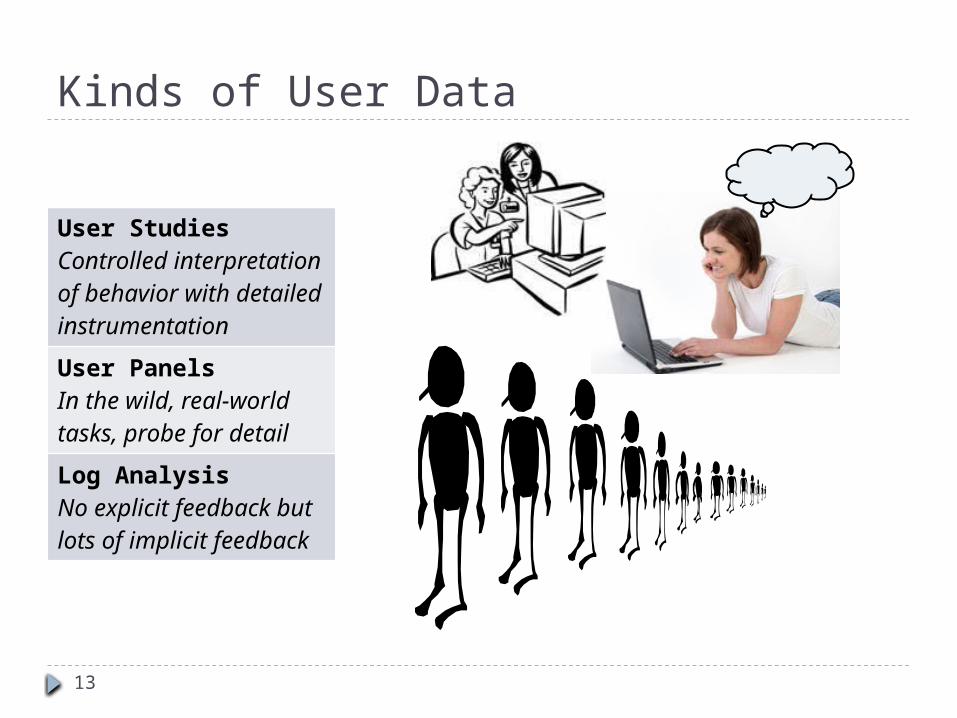
Kinds of User Data
13
User StudiesControlled interpretation of behavior with detailed instrumentation
User PanelsIn the wild, real-world tasks, probe for detail
Log AnalysisNo explicit feedback but lots of implicit feedback
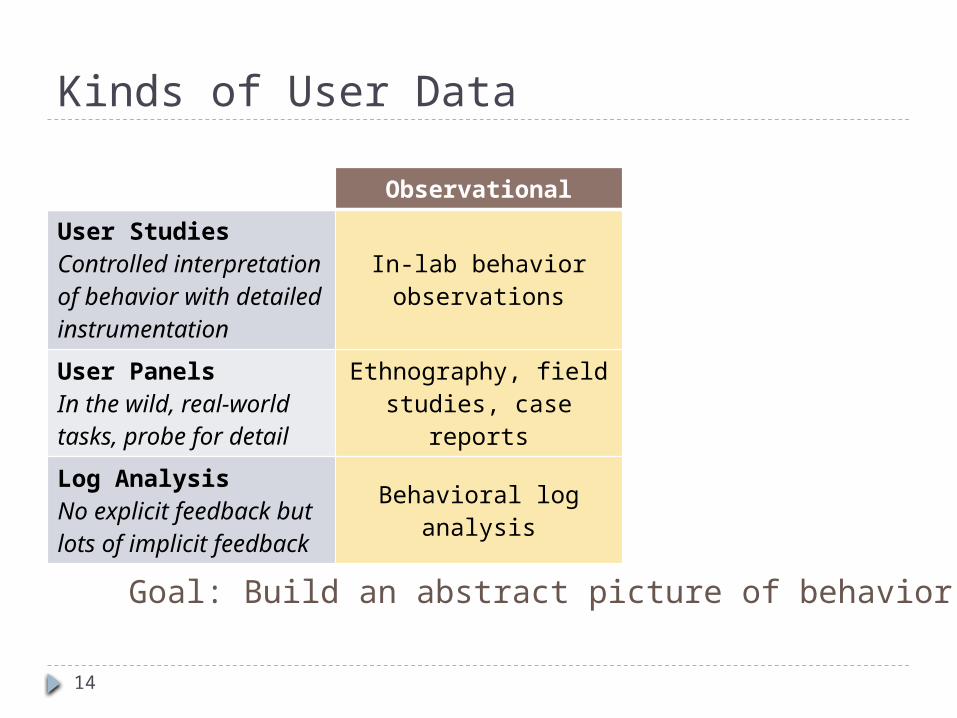
Kinds of User Data
Observational
User StudiesControlled interpretation of behavior with detailed instrumentation
In-lab behavior observations
User PanelsIn the wild, real-world tasks, probe for detail
Ethnography, field studies, case reports
Log AnalysisNo explicit feedback but lots of implicit feedback
Behavioral log analysis
14
Goal: Build an abstract picture of behavior
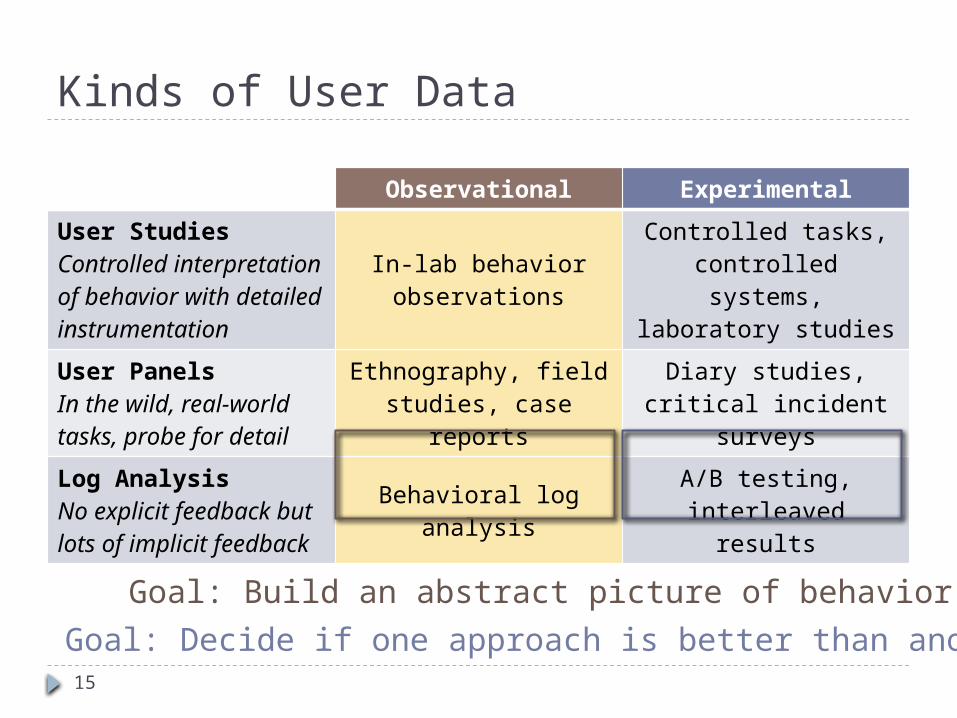
Kinds of User Data
Observational Experimental
User StudiesControlled interpretation of behavior with detailed instrumentation
In-lab behavior observations
Controlled tasks, controlled systems, laboratory studies
User PanelsIn the wild, real-world tasks, probe for detail
Ethnography, field studies, case reports
Diary studies, critical incident surveys
Log AnalysisNo explicit feedback but lots of implicit feedback
Behavioral log analysis A/B testing, interleaved results
15
Goal: Build an abstract picture of behaviorGoal: Decide if one approach is better than another
Web Service Logs
16
Government contractor
Recruiting
Academic field
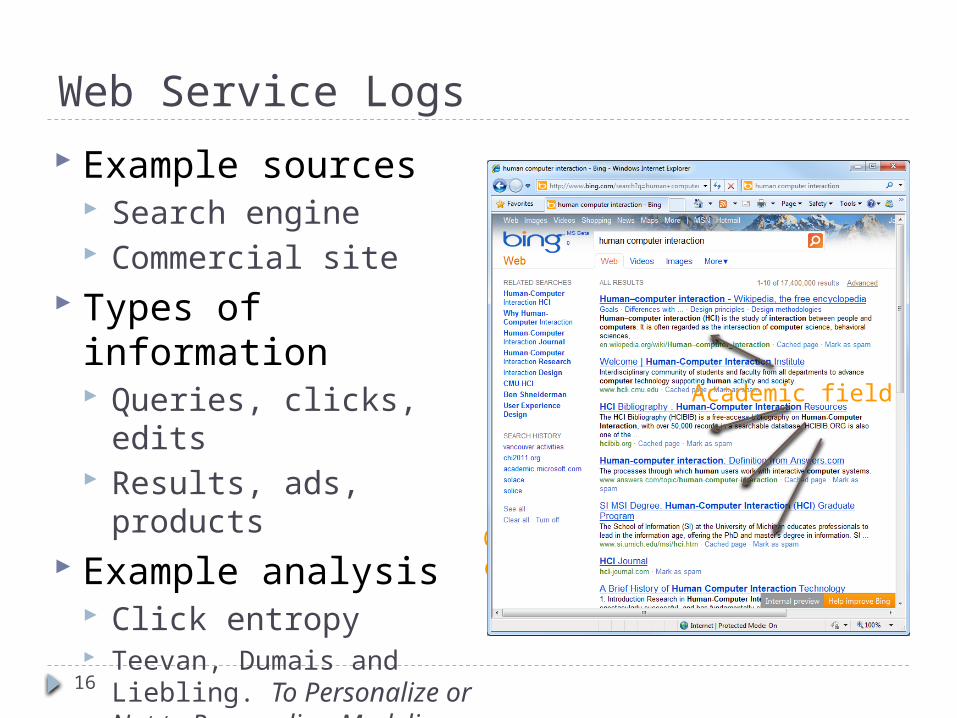
Example sources Search engine Commercial site
Types of information Queries, clicks, edits Results, ads, products
Example analysis Click entropy Teevan, Dumais and Liebling. To
Personalize or Not to Personalize: Modeling Queries with Variation in User Intent. SIGIR 2008
Web Browser Logs
17
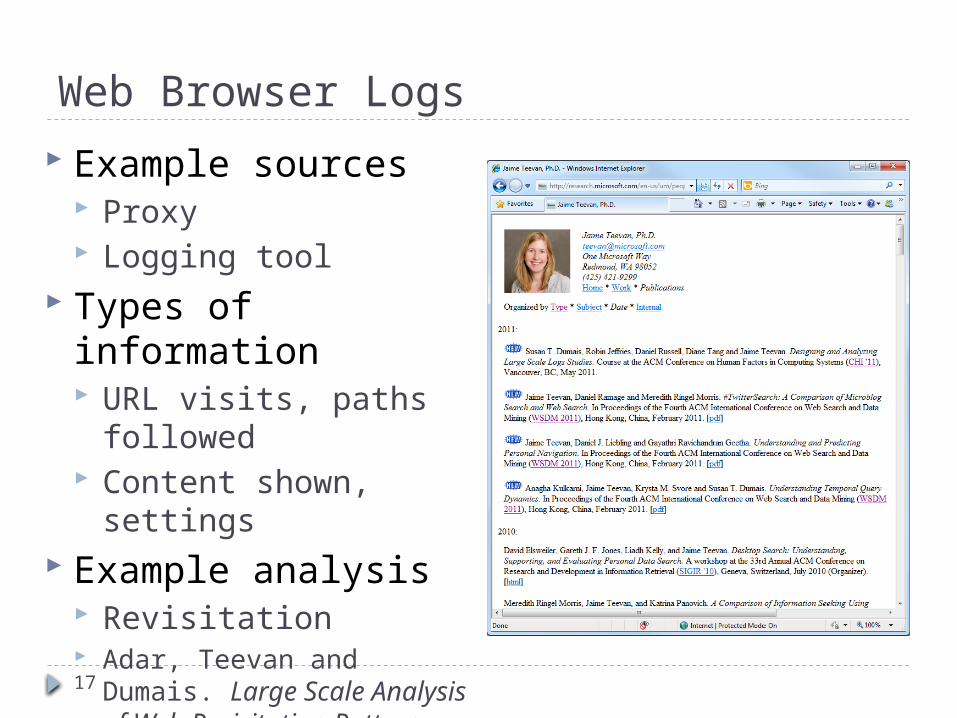
Example sources Proxy Logging tool
Types of information URL visits, paths followed Content shown, settings
Example analysis Revisitation Adar, Teevan and Dumais. Large
Scale Analysis of Web Revisitation Patterns. CHI 2008
Web Browser Logs
18
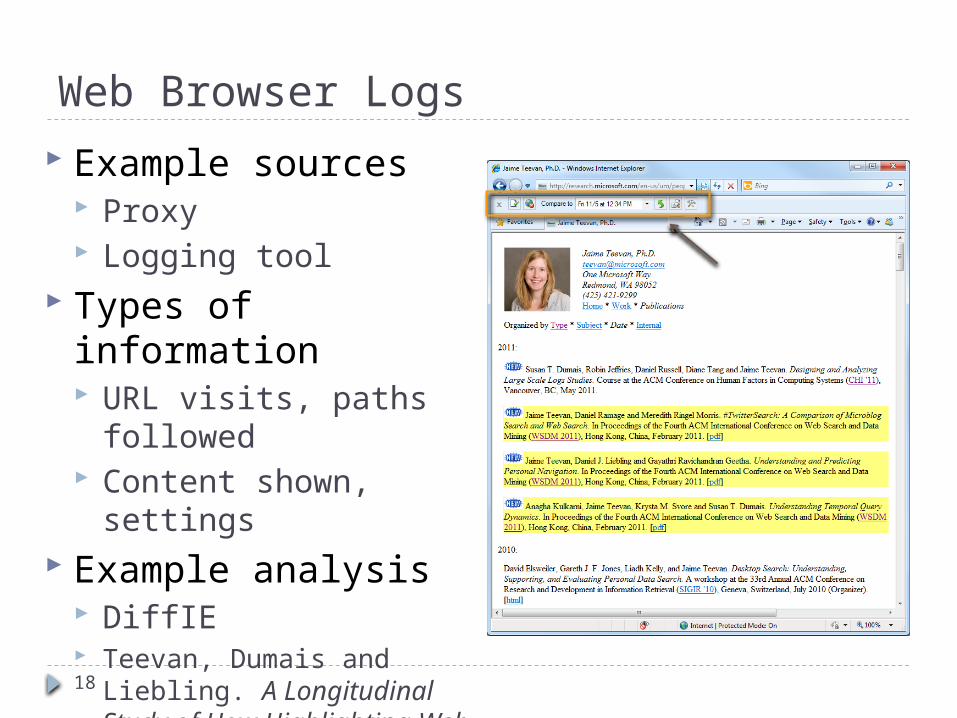
Example sources Proxy Logging tool
Types of information URL visits, paths followed Content shown, settings
Example analysis DiffIE Teevan, Dumais and Liebling. A
Longitudinal Study of How Highlighting Web Content Change Affects .. Interactions. CHI 2010
Rich Client-Side Logs
19
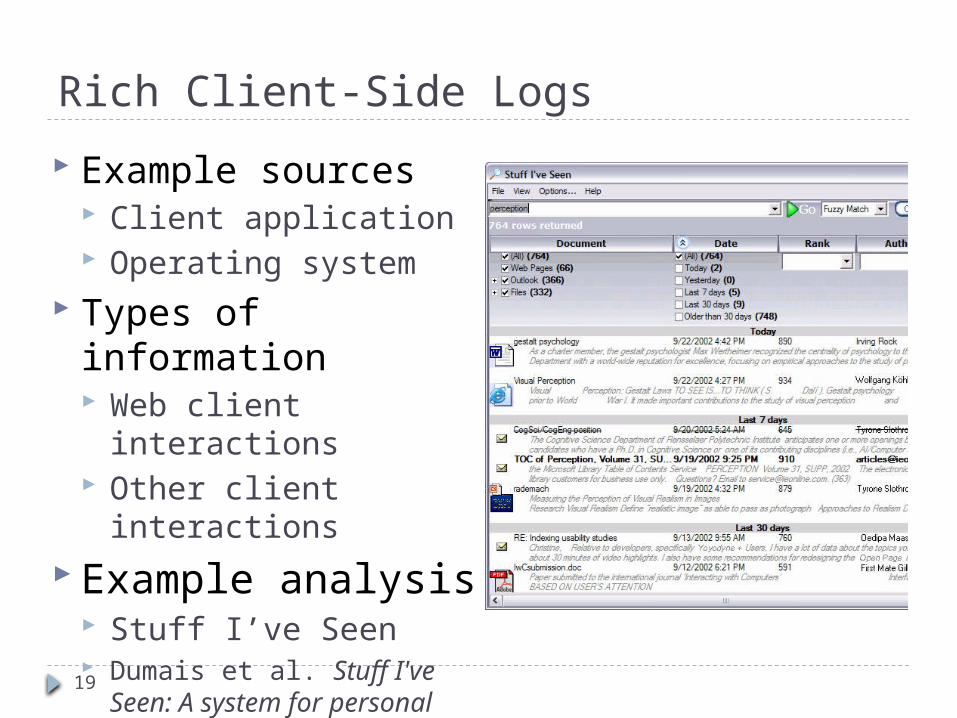
Example sources Client application Operating system
Types of information Web client interactions Other client interactions
Example analysis Stuff I’ve Seen Dumais et al. Stuff I've Seen: A
system for personal information retrieval and re-use. SIGIR 2003
Logs Can Be Rich and Varied
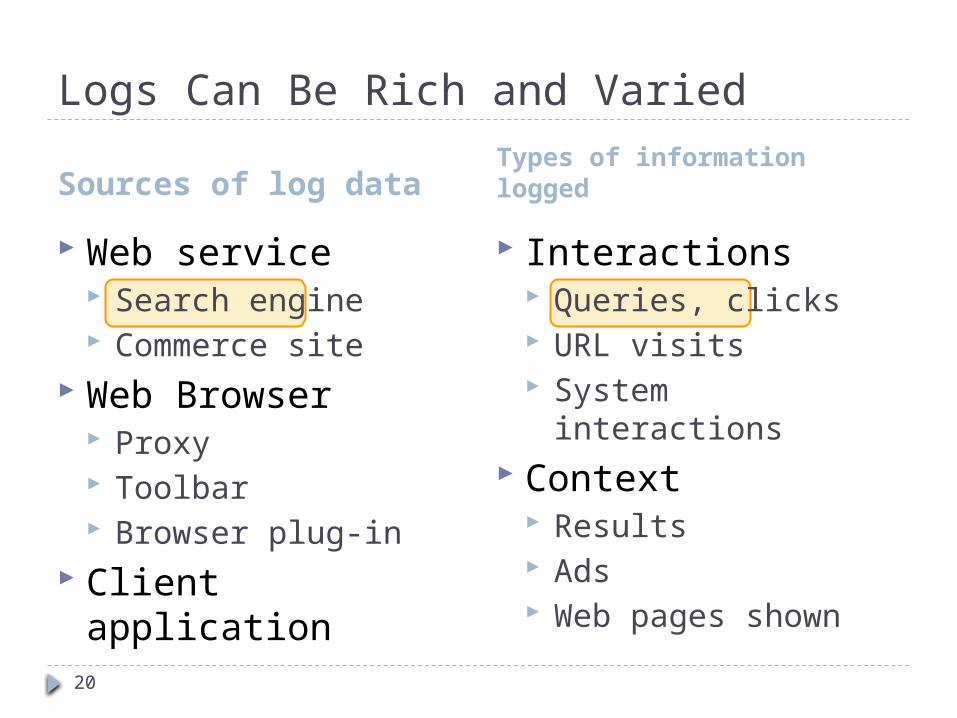
Sources of log data Types of information logged
Web service Search engine Commerce site
Web Browser Proxy Toolbar Browser plug-in
Client application
Interactions Queries, clicks URL visits System interactions
Context Results Ads Web pages shown
20
Using Log Data What can we learn from log analysis? What can’t we learn from log analysis? How can we supplement the logs?
21
Using Log Data What can we learn from log analysis?
Now: About people’s behavior Later: Experiments
What can’t we learn from log analysis? How can we supplement the logs?
22
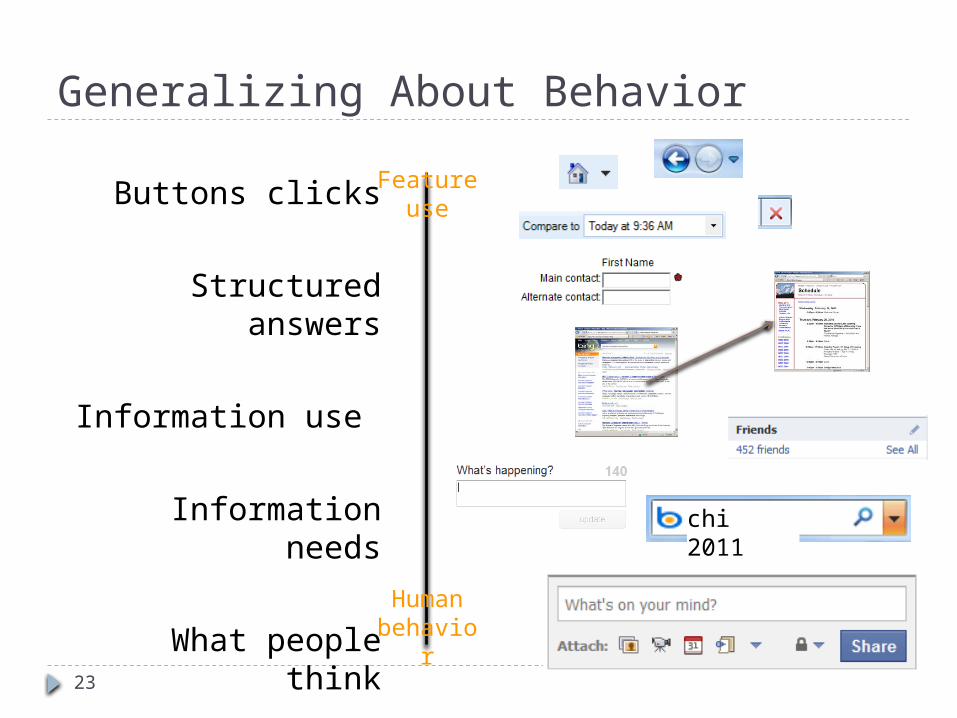
Generalizing About Behavior
Buttons clicks
Structured answers
Information use
Information needs
What people think
23
chi 2011
Human behavior
Featureuse
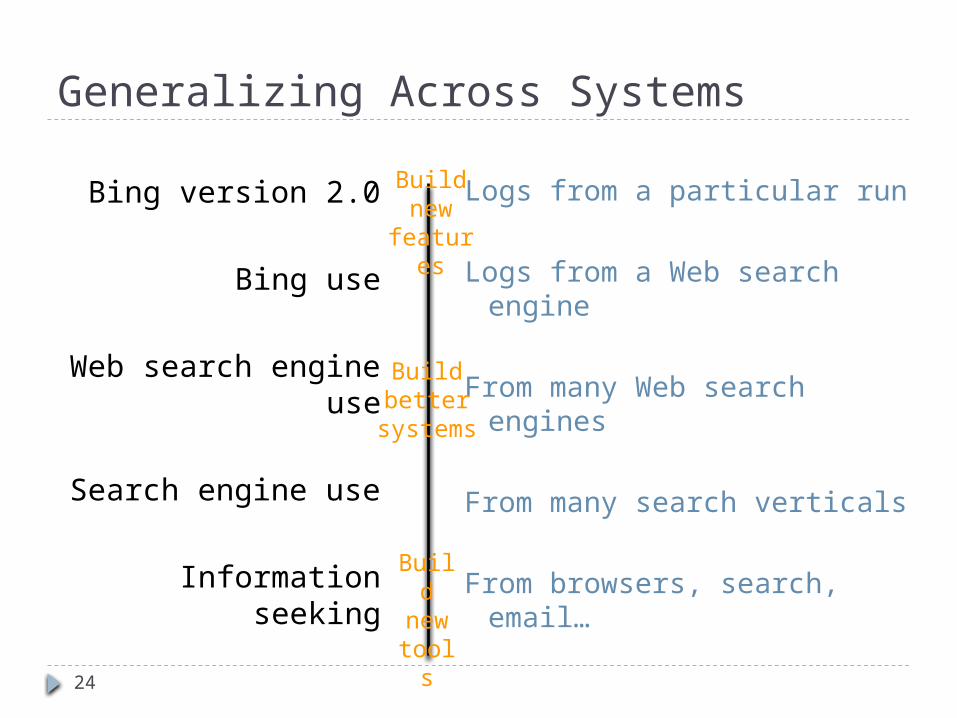
Generalizing Across Systems
Bing version 2.0
Bing use
Web search engine use
Search engine use
Information seeking
Logs from a particular run
Logs from a Web search engine
From many Web search engines
From many search verticals
From browsers, search, email…
24
Build new tools
Build better
systems
Build new
features
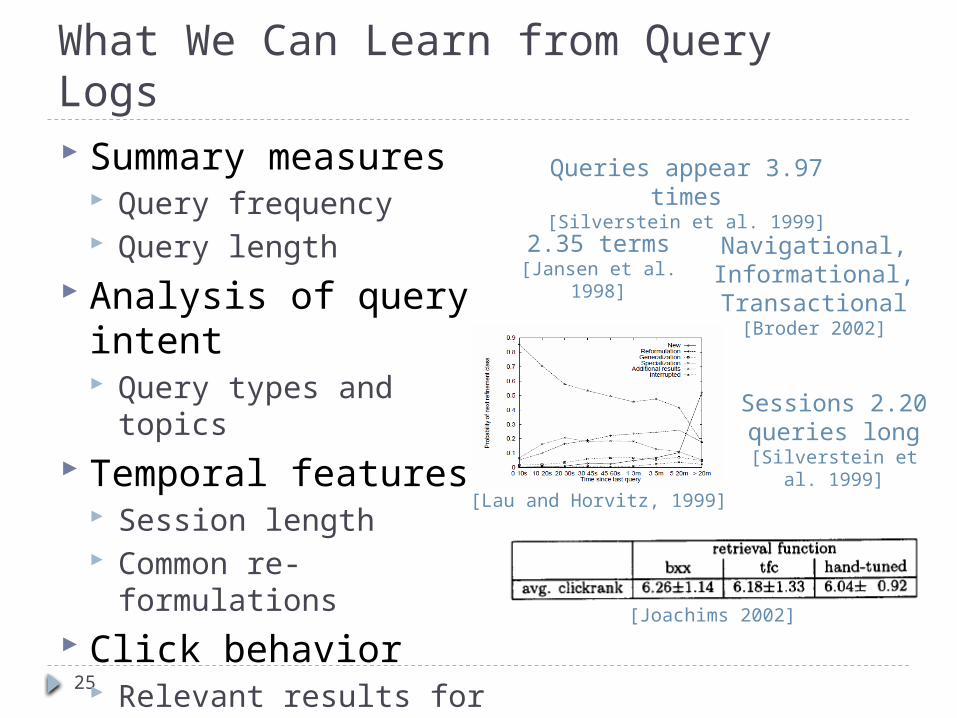
What We Can Learn from Query Logs
25
[Joachims 2002]
Sessions 2.20 queries long
[Silverstein et al. 1999]
[Lau and Horvitz, 1999]
Navigational, Informational, Transactional
[Broder 2002]
2.35 terms[Jansen et al. 1998]
Queries appear 3.97 times[Silverstein et al. 1999]
Summary measures Query frequency Query length
Analysis of query intent Query types and topics
Temporal features Session length Common re-formulations
Click behavior Relevant results for query Queries that lead to clicks
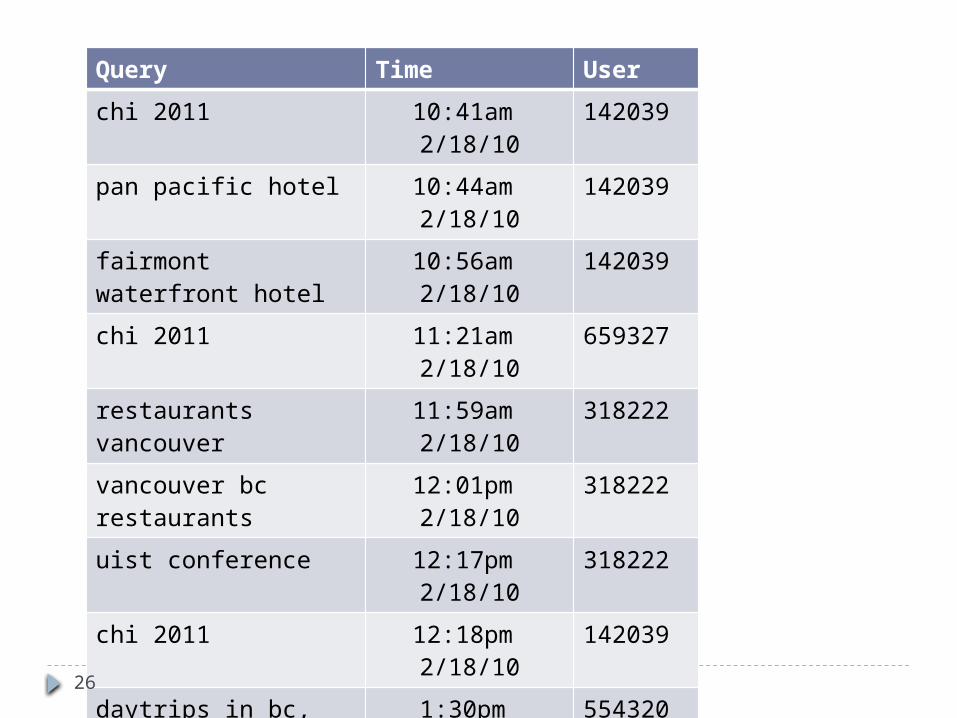
Query Time User
chi 2011 10:41am 2/18/10 142039
pan pacific hotel 10:44am 2/18/10 142039
fairmont waterfront hotel 10:56am 2/18/10 142039
chi 2011 11:21am 2/18/10 659327
restaurants vancouver 11:59am 2/18/10 318222
vancouver bc restaurants 12:01pm 2/18/10 318222uist conference 12:17pm 2/18/10 318222
chi 2011 12:18pm 2/18/10 142039
daytrips in bc, canada 1:30pm 2/18/10 554320
uist 2011 1:30pm 2/18/10 659327
chi program 1:48pm 2/18/10 142039
chi2011.org 2:32pm 2/18/10 435451
mark ackerman 2:42pm 2/18/10 435451
fairmont waterfront hotel 4:56pm 2/18/10 142039
chi 2011 5:02pm 2/18/10 142039
26
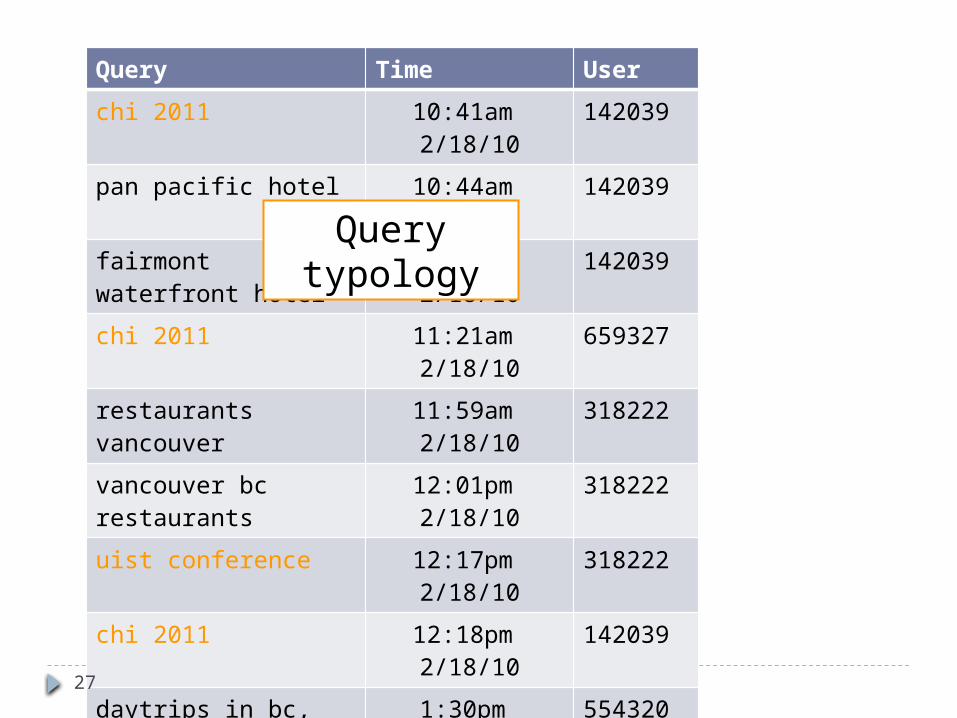
Query Time User
chi 2011 10:41am 2/18/10 142039
pan pacific hotel 10:44am 2/18/10 142039
fairmont waterfront hotel 10:56am 2/18/10 142039
chi 2011 11:21am 2/18/10 659327
restaurants vancouver 11:59am 2/18/10 318222
vancouver bc restaurants 12:01pm 2/18/10 318222uist conference 12:17pm 2/18/10 318222
chi 2011 12:18pm 2/18/10 142039
daytrips in bc, canada 1:30pm 2/18/10 554320
uist 2011 1:30pm 2/18/10 659327
chi program 1:48pm 2/18/10 142039
chi2011.org 2:32pm 2/18/10 435451
mark ackerman 2:42pm 2/18/10 435451
fairmont waterfront hotel 4:56pm 2/18/10 142039
chi 2011 5:02pm 2/18/10 142039
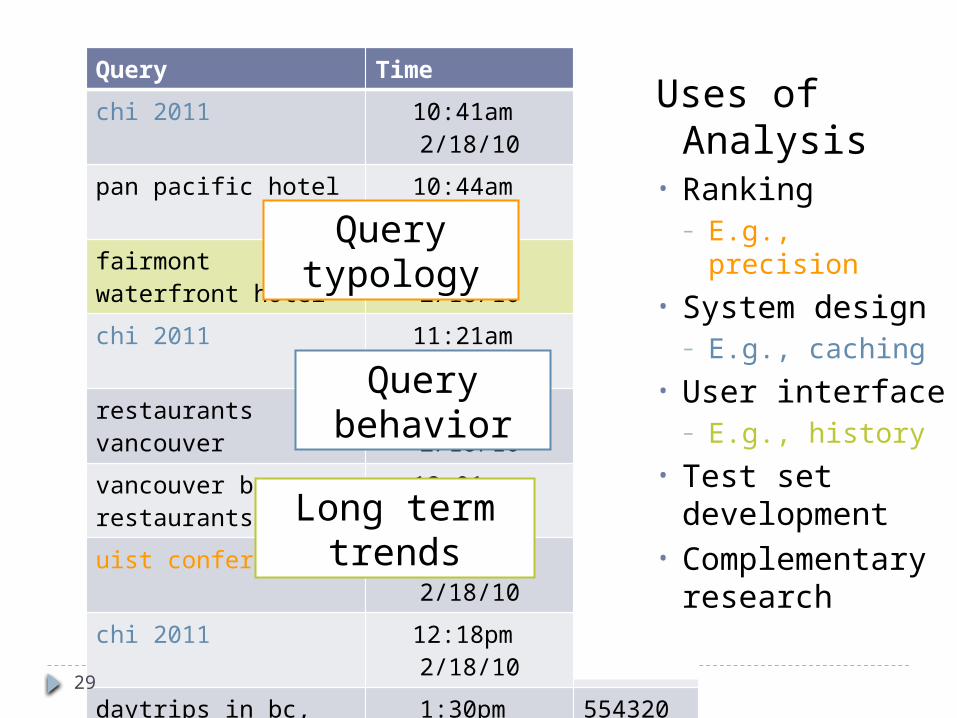
Query typology
27
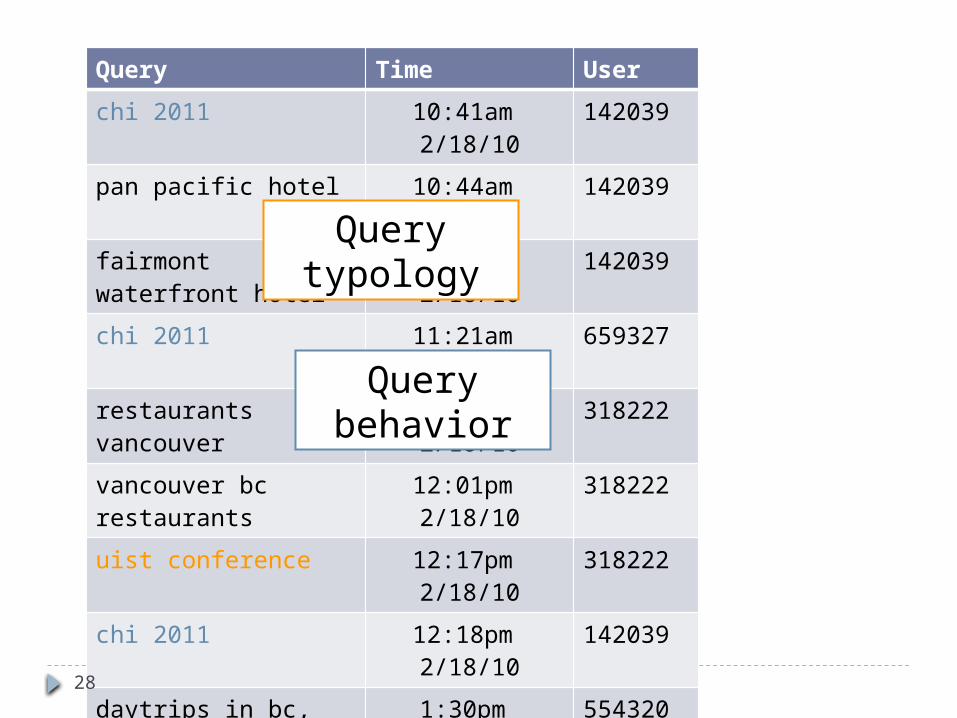
Query Time User
chi 2011 10:41am 2/18/10 142039
pan pacific hotel 10:44am 2/18/10 142039
fairmont waterfront hotel 10:56am 2/18/10 142039
chi 2011 11:21am 2/18/10 659327
restaurants vancouver 11:59am 2/18/10 318222
vancouver bc restaurants 12:01pm 2/18/10 318222
uist conference 12:17pm 2/18/10 318222
chi 2011 12:18pm 2/18/10 142039
daytrips in bc, canada 1:30pm 2/18/10 554320
uist 2011 1:30pm 2/18/10 659327
chi program 1:48pm 2/18/10 142039
chi2011.org 2:32pm 2/18/10 435451
mark ackerman 2:42pm 2/18/10 435451
fairmont waterfront hotel 4:56pm 2/18/10 142039
chi 2011 5:02pm 2/18/10 142039
Query behavior
Query typology
28
Query Time User
chi 2011 10:41am 2/18/10 142039
pan pacific hotel 10:44am 2/18/10 142039
fairmont waterfront hotel 10:56am 2/18/10 142039
chi 2011 11:21am 2/18/10 659327
restaurants vancouver 11:59am 2/18/10 318222
vancouver bc restaurants 12:01pm 2/18/10 318222uist conference 12:17pm 2/18/10 318222
chi 2011 12:18pm 2/18/10 142039
daytrips in bc, canada 1:30pm 2/18/10 554320
uist 2011 1:30pm 2/18/10 659327
chi program 1:48pm 2/18/10 142039
chi2011.org 2:32pm 2/18/10 435451
mark ackerman 2:42pm 2/18/10 435451
fairmont waterfront hotel 4:56pm 2/18/10 142039
chi 2011 5:02pm 2/18/10 142039
Long term trends
29
Uses of Analysis• Ranking
– E.g., precision• System design
– E.g., caching• User interface
– E.g., history• Test set
development• Complementary
research
Query behavior
Query typology
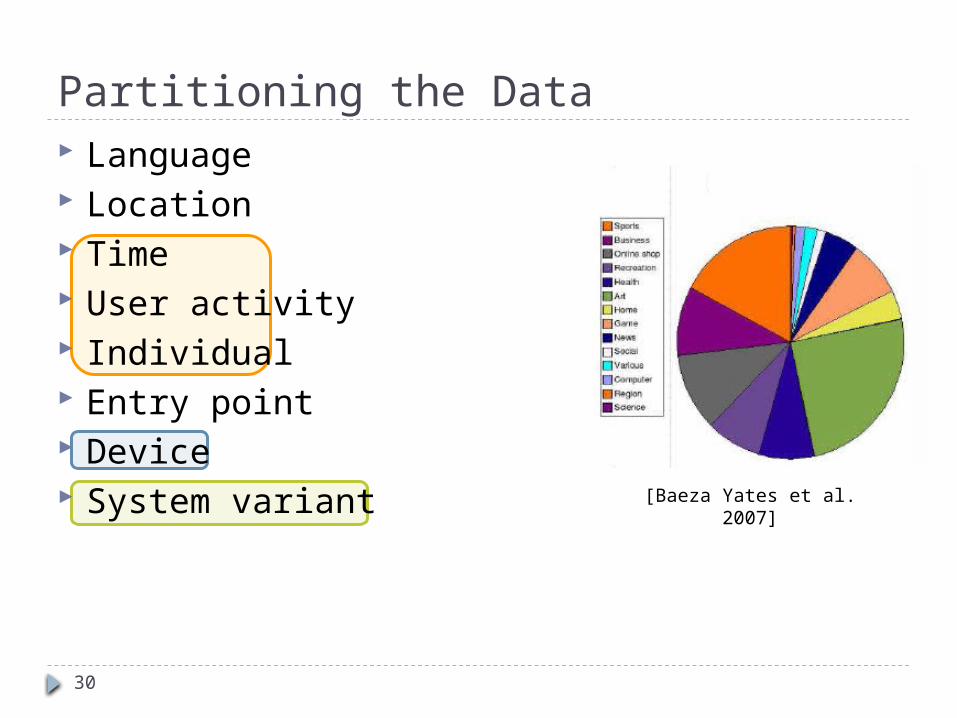
Partitioning the Data Language Location Time User activity Individual Entry point Device System variant
30
[Baeza Yates et al. 2007]
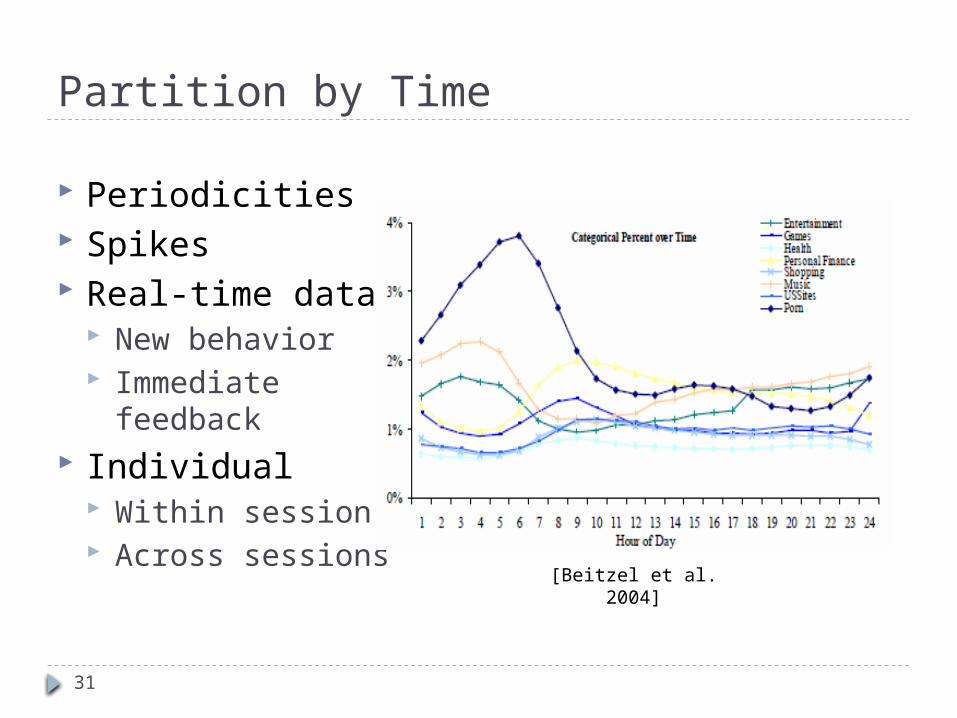
Partition by Time
Periodicities Spikes Real-time data
New behavior Immediate feedback
Individual Within session Across sessions
31
[Beitzel et al. 2004]
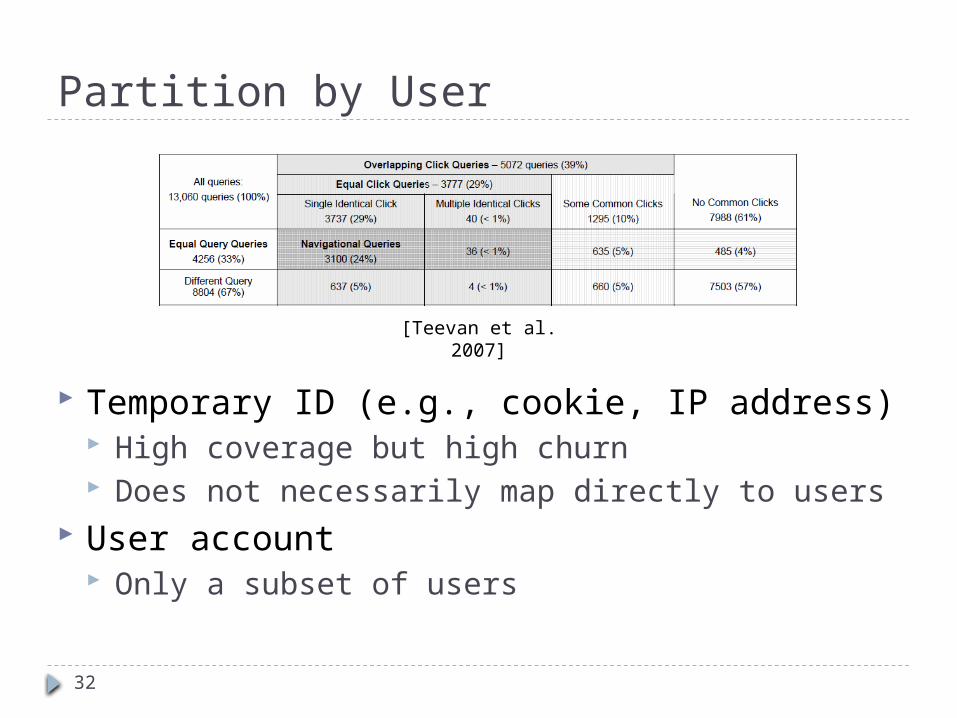
Partition by User
Temporary ID (e.g., cookie, IP address) High coverage but high churn Does not necessarily map directly to users
User account Only a subset of users
32
[Teevan et al. 2007]
What Logs Cannot Tell Us People’s intent People’s success People’s experience People’s attention People’s beliefs of what’s happening Limited to existing interactions Behavior can mean many things
33
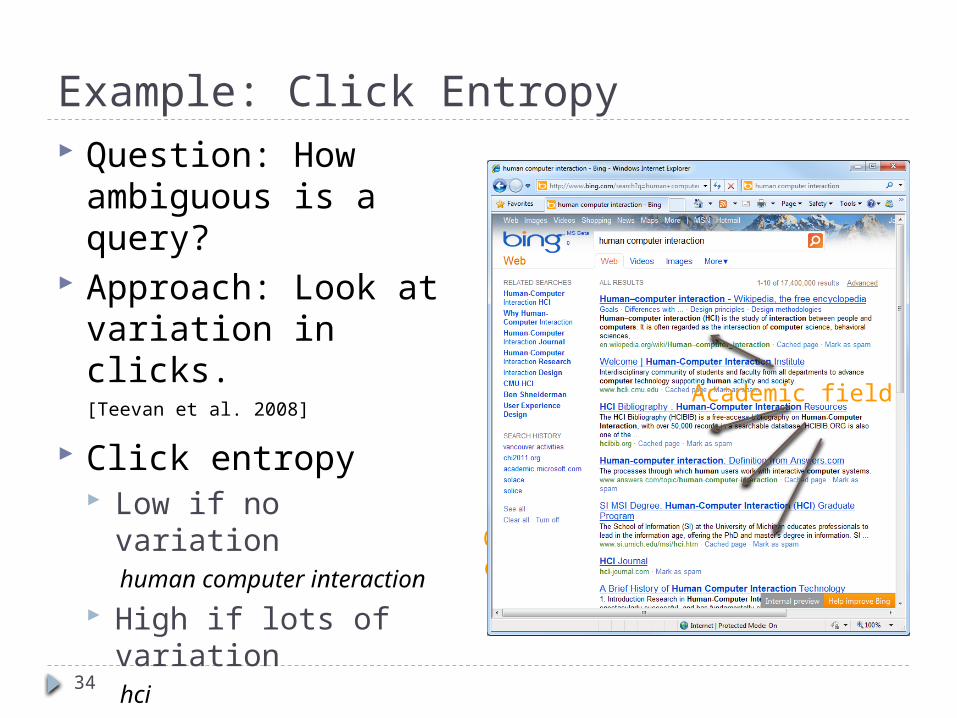
Example: Click Entropy Question: How ambiguous
is a query? Approach: Look at
variation in clicks.[Teevan et al. 2008]
Click entropy Low if no variation
human computer interaction High if lots of variation
hci
34
Government contractor
Recruiting
Academic field
Which Has Lower Variation in Clicks?
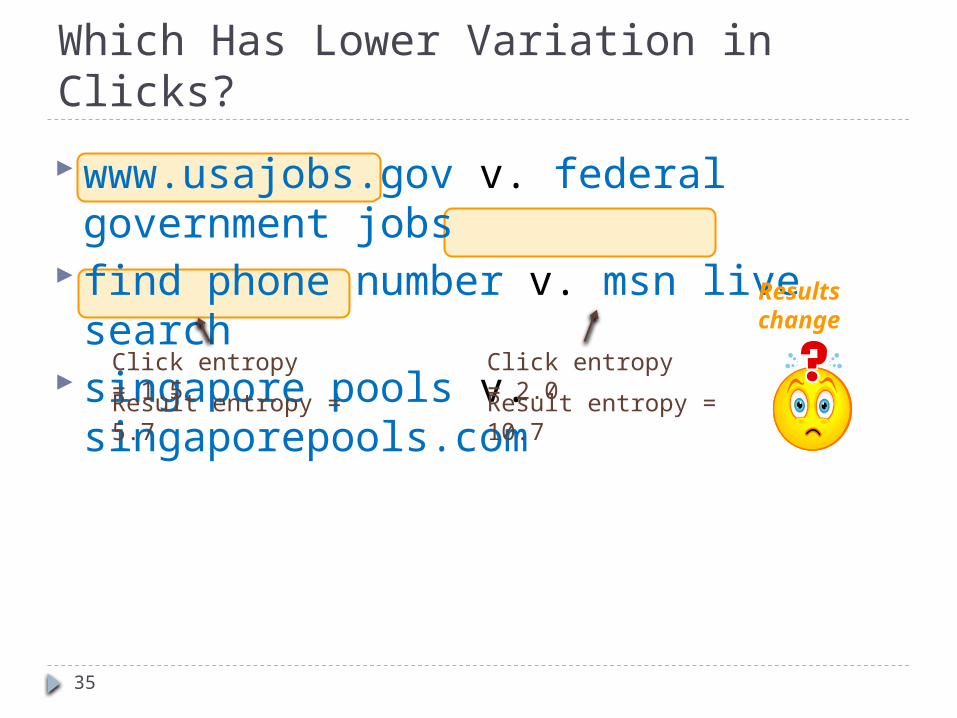
www.usajobs.gov v. federal government jobs find phone number v. msn live search singapore pools v. singaporepools.com
35
Click entropy = 1.5 Click entropy = 2.0
Result entropy = 5.7 Result entropy = 10.7
Results change
Results change
Which Has Lower Variation in Clicks?
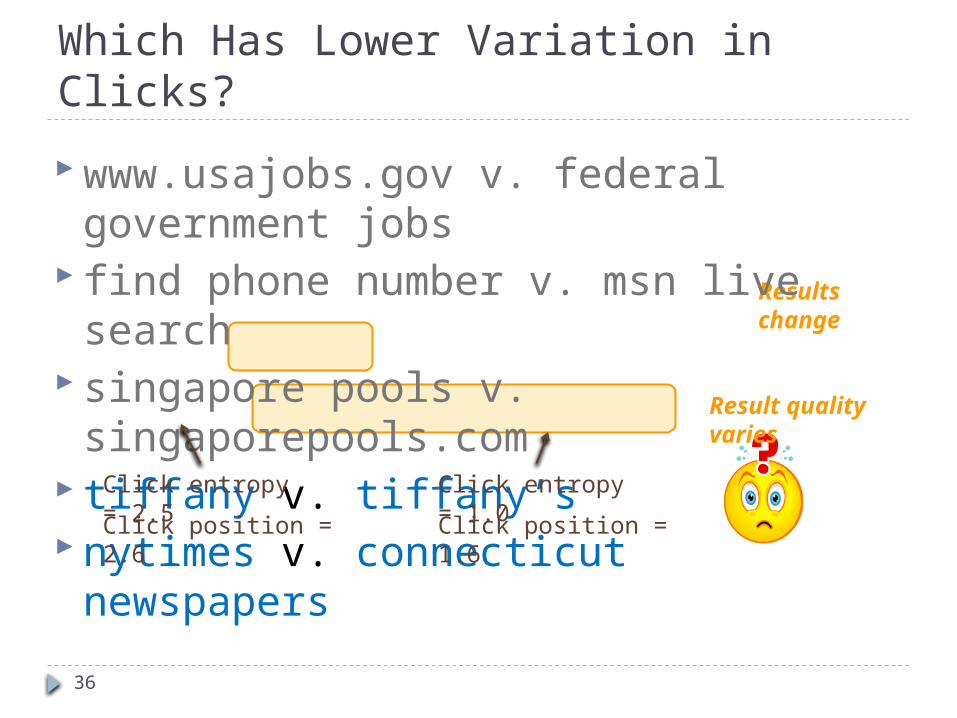
www.usajobs.gov v. federal government jobs find phone number v. msn live search singapore pools v. singaporepools.com tiffany v. tiffany’s nytimes v. connecticut newspapers
36
Click entropy = 2.5 Click entropy = 1.0
Click position = 2.6 Click position = 1.6
Result quality varies
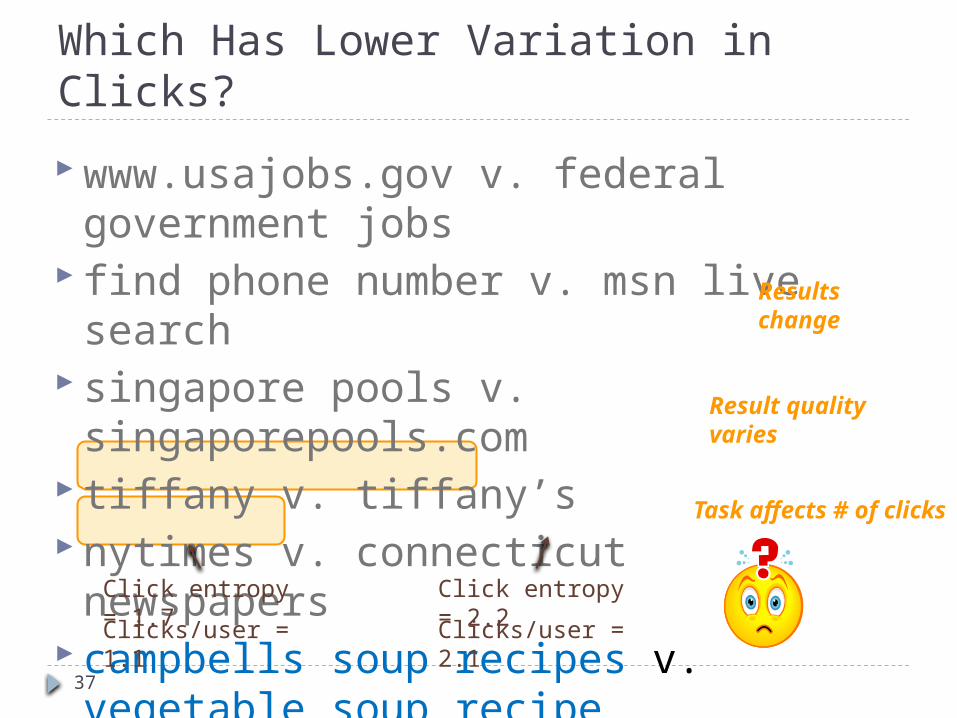
Which Has Lower Variation in Clicks?
www.usajobs.gov v. federal government jobs find phone number v. msn live search singapore pools v. singaporepools.com tiffany v. tiffany’s nytimes v. connecticut newspapers campbells soup recipes v. vegetable soup recipe soccer rules v. hockey equipment
37
Click entropy = 1.7 Click entropy = 2.2
Clicks/user = 1.1 Clicks/user = 2.1
Task affects # of clicks
Results change
Result quality varies
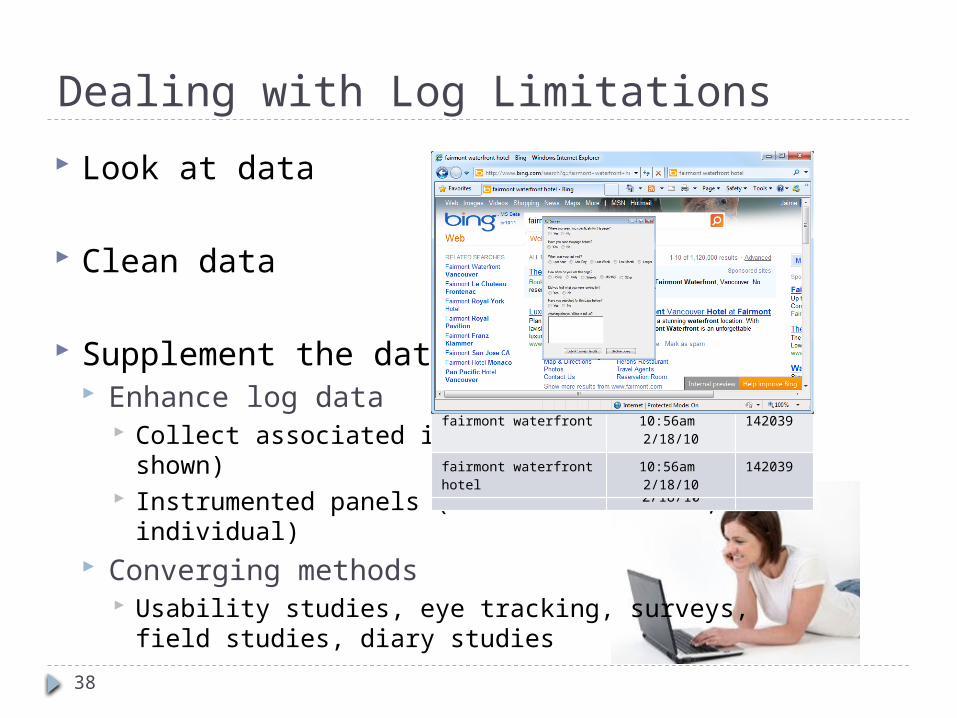
Dealing with Log Limitations
Look at data
Clean data
Supplement the data Enhance log data
Collect associated information (e.g., what’s shown) Instrumented panels (critical incident, by individual)
Converging methods Usability studies, eye tracking, surveys,
field studies, diary studies
38
Query Time User
chi 2011 10:41am 2/18/10 142039
pan pacific hotel 10:44am 2/18/10 142039
fairmont waterfront hotel 10:56am 2/18/10 142039
chi 2011 11:21am 2/18/10 659327
restaurants vancouver 11:59am 2/18/10 318222
vancouver bc restaurants 12:01pm 2/18/10 318222
uist conference 12:17pm 2/18/10 318222
Query Time User
chi 2011 10:41am 2/18/10 142039
pan pacific hotel 10:44am 2/18/10 142039
fair 10:55am 2/18/10 142039
fairmont 10:55am 2/18/10 142039
fairmont water 10:56am 2/18/10 142039
fairmont waterfront 10:56am 2/18/10 142039
fairmont waterfront hotel 10:56am 2/18/10 142039
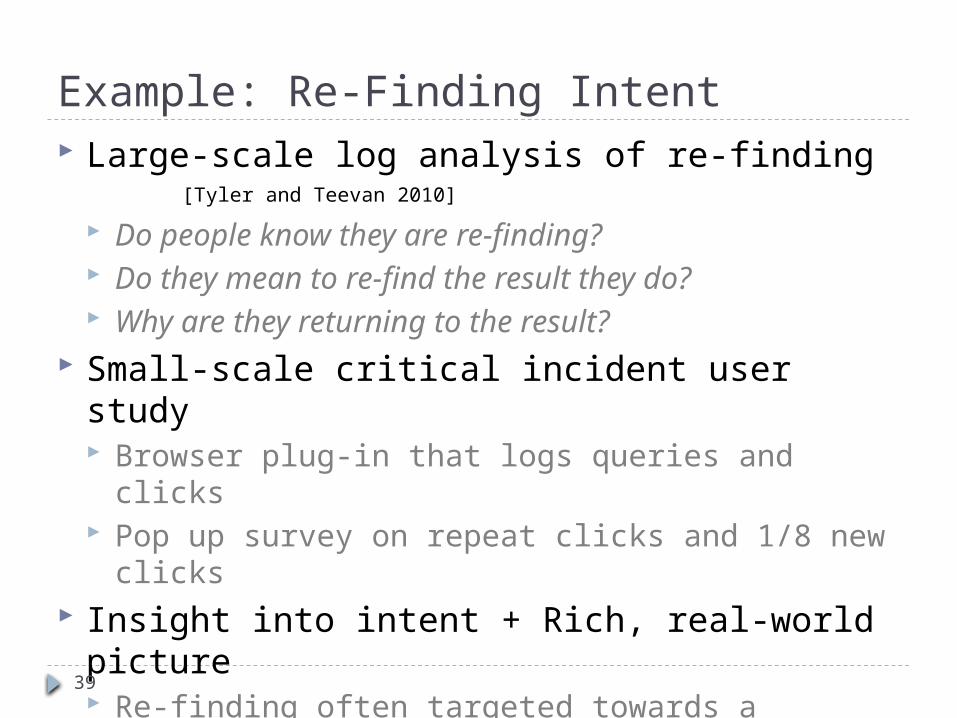
Example: Re-Finding Intent Large-scale log analysis of re-finding
[Tyler and Teevan 2010]
Do people know they are re-finding? Do they mean to re-find the result they do? Why are they returning to the result?
Small-scale critical incident user study Browser plug-in that logs queries and clicks Pop up survey on repeat clicks and 1/8 new clicks
Insight into intent + Rich, real-world picture Re-finding often targeted towards a particular URL Not targeted when query changes or in same session
39
Summary: Understanding User Behavior Log data gives a rich picture of real world behavior There are many potential sources of log data Partition the data to view interesting slices Recognize what the data can and cannot tell you Supplement logs with complementary data
40
Section 2: Design and Analysis of Experiments
Robin Jeffries & Diane Tang
41
What Do We Mean by an Experiment? A change to the user experience, directly or indirectly
Have a hypothesis Collect metrics to verify / nullify hypothesis
Measurability is key!
Running on a live (web) app; data coming in from real users, doing their own tasks
Multiple arms, each providing different experiences At minimum, the new experience and the original control Can be an entire space of parameters with multiple values
for each parameter
42 R
Example Changes and Hypotheses Visible changes:
Underlines: if I remove underlines, the page will be cleaner and easier to parse and users will find what they need faster
Left Nav: by adding links to subpages, users will be able to better navigate the site
Adding a new feature: the usage of this feature is better than what was previously shown in its place
Less visible changes: Ranking: if I change the order of the (search) results, users will
find what they are looking for faster (higher up on the page)
43 R
Why Do Experiments? To test your hypothesis
In reality (or ultimately): gather data to make an informed, data-driven decision
Little changes can have big impacts. You won't know until you measure it.
With big changes, who knows what will happen. Your intuition is not always correct
Law of unintended side effects: what you wanted to impact gets better, but something else gets worse. You want to know that.
44 R
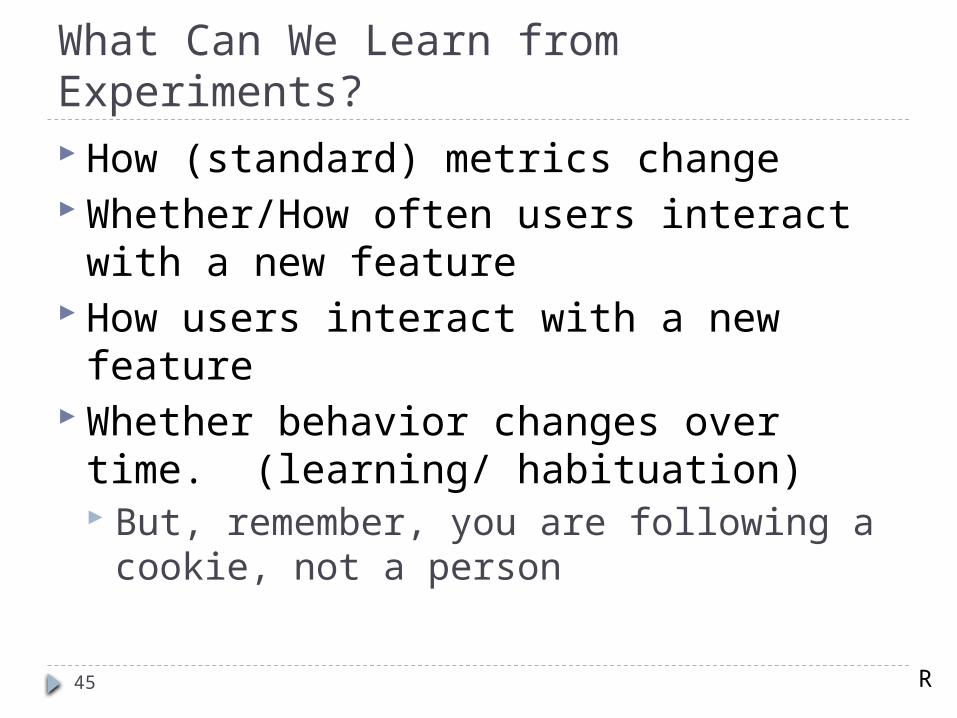
What Can We Learn from Experiments? How (standard) metrics change Whether/How often users interact with a new
feature How users interact with a new feature Whether behavior changes over time. (learning/
habituation) But, remember, you are following a cookie, not a
person
45 R
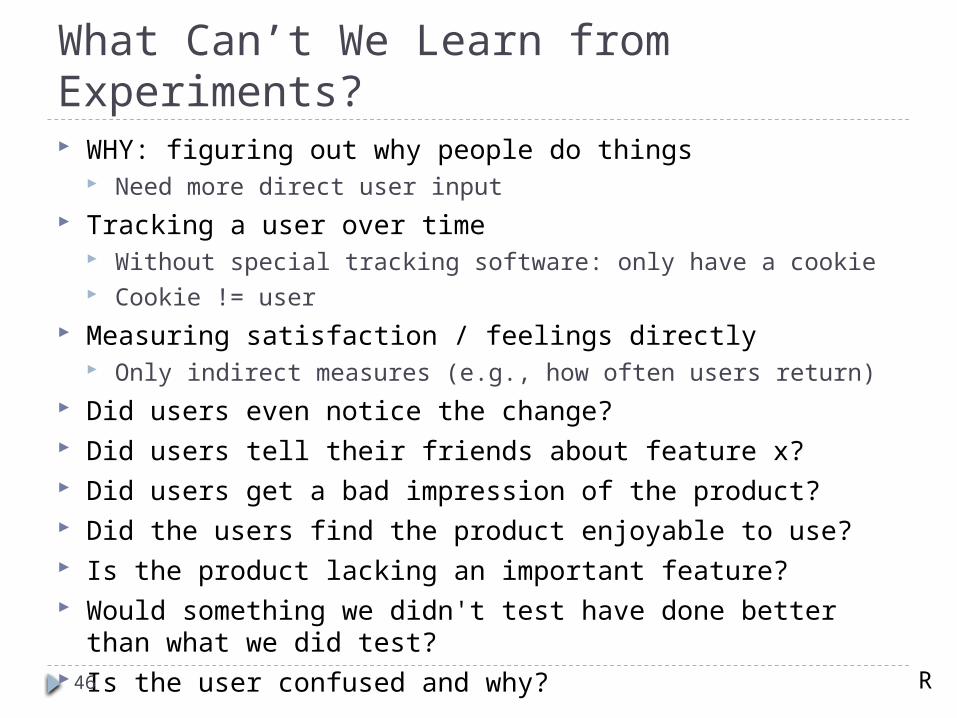
What Can’t We Learn from Experiments? WHY: figuring out why people do things
Need more direct user input Tracking a user over time
Without special tracking software: only have a cookie Cookie != user
Measuring satisfaction / feelings directly Only indirect measures (e.g., how often users return)
Did users even notice the change? Did users tell their friends about feature x? Did users get a bad impression of the product? Did the users find the product enjoyable to use? Is the product lacking an important feature? Would something we didn't test have done better than what we did test? Is the user confused and why?
46 R
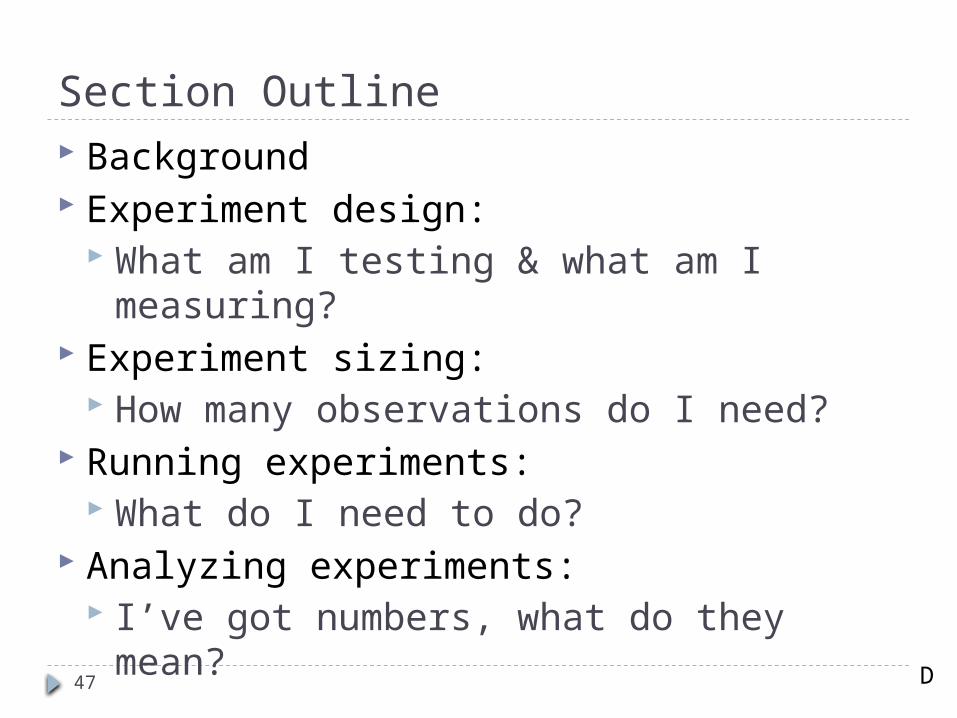
Section Outline Background Experiment design:
What am I testing & what am I measuring? Experiment sizing:
How many observations do I need? Running experiments:
What do I need to do? Analyzing experiments:
I’ve got numbers, what do they mean?
47 D
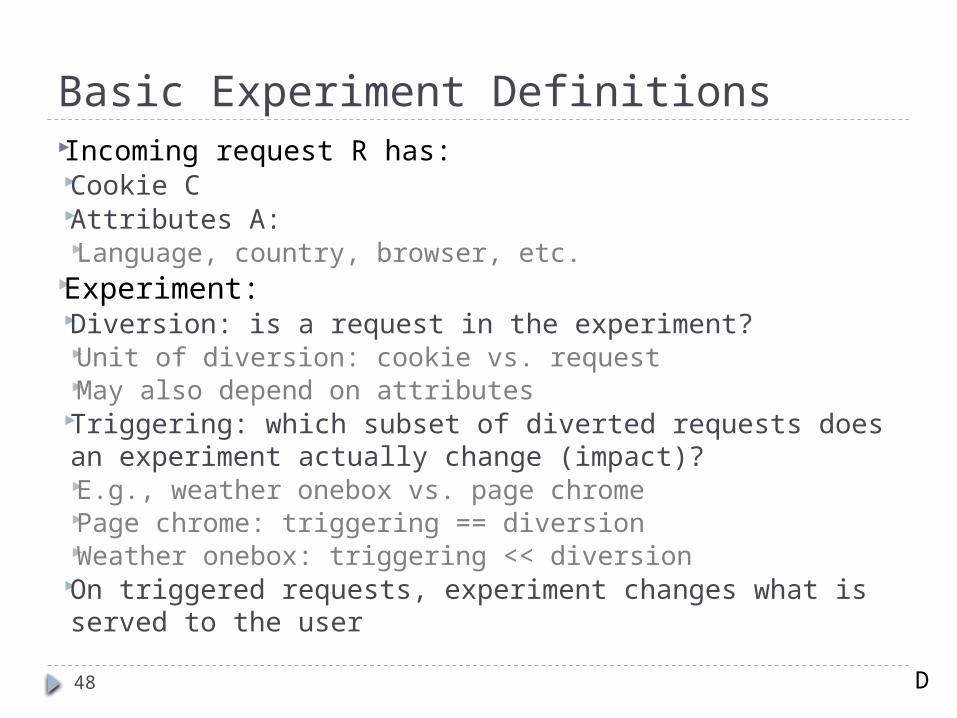
Basic Experiment Definitions Incoming request R has:
Cookie C Attributes A:
Language, country, browser, etc. Experiment:
Diversion: is a request in the experiment? Unit of diversion: cookie vs. request May also depend on attributes
Triggering: which subset of diverted requests does an experiment actually change (impact)? E.g., weather onebox vs. page chrome Page chrome: triggering == diversion Weather onebox: triggering << diversion
On triggered requests, experiment changes what is served to the user
48 D
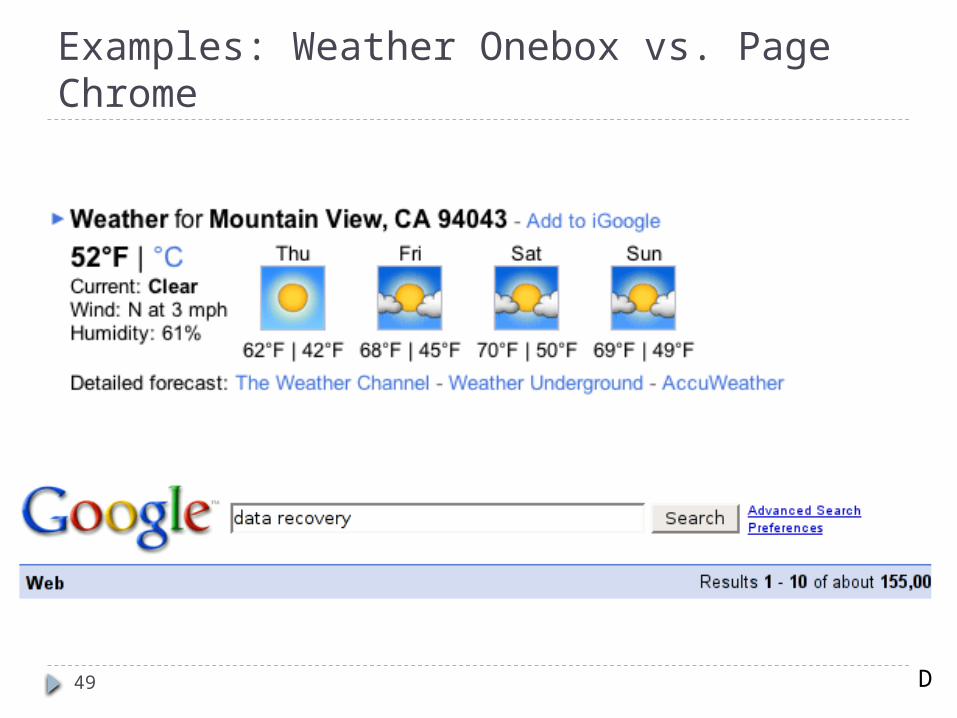
Examples: Weather Onebox vs. Page Chrome
49 D
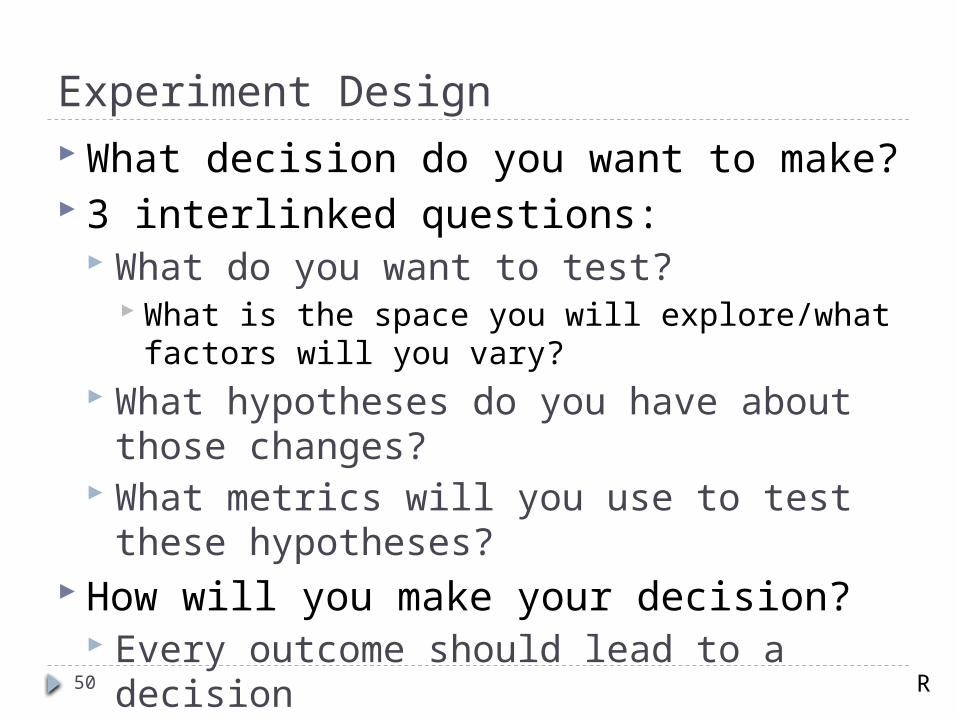
Experiment Design What decision do you want to make? 3 interlinked questions:
What do you want to test? What is the space you will explore/what factors will you
vary? What hypotheses do you have about those changes? What metrics will you use to test these hypotheses?
How will you make your decision? Every outcome should lead to a decision
50 R
Decisions, Goals, Underlying Assumptions
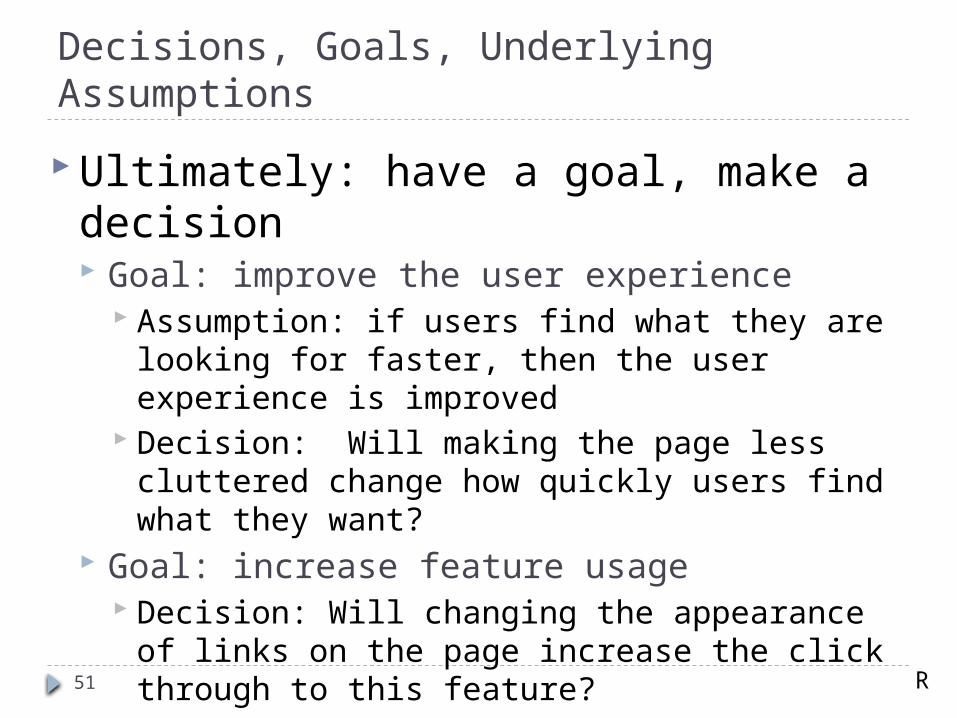
Ultimately: have a goal, make a decision Goal: improve the user experience
Assumption: if users find what they are looking for faster, then the user experience is improved
Decision: Will making the page less cluttered change how quickly users find what they want?
Goal: increase feature usage Decision: Will changing the appearance of links on the
page increase the click through to this feature? Goal: increase time on site
Decision: Will adding dancing hamsters to the page lead visitors to spend more time on the site?
51 R
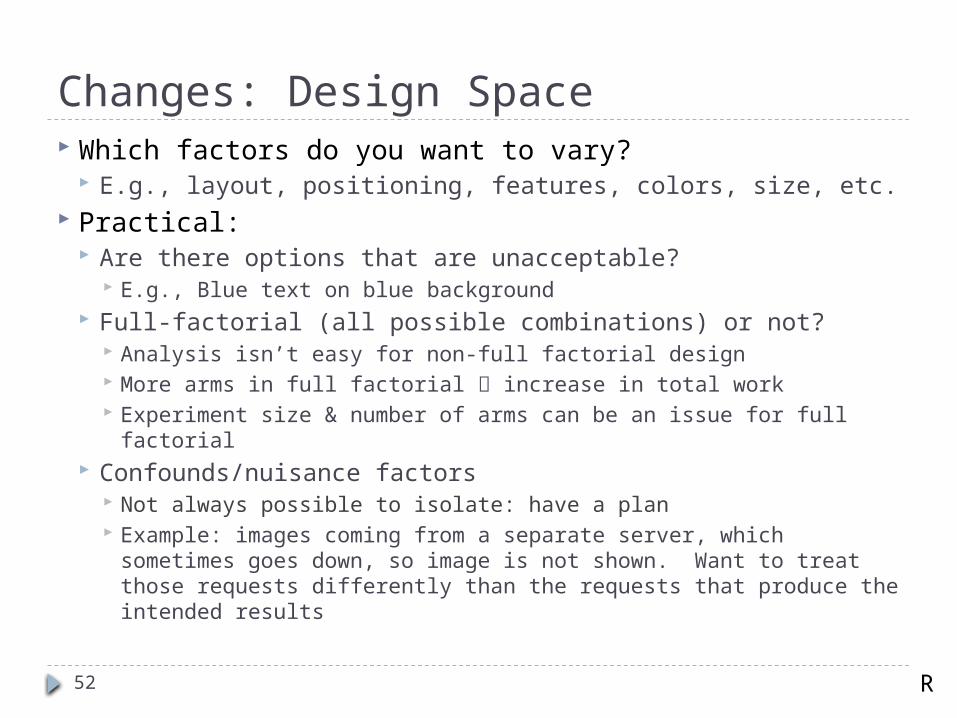
Changes: Design Space Which factors do you want to vary?
E.g., layout, positioning, features, colors, size, etc. Practical:
Are there options that are unacceptable? E.g., Blue text on blue background
Full-factorial (all possible combinations) or not? Analysis isn’t easy for non-full factorial design More arms in full factorial increase in total work Experiment size & number of arms can be an issue for full factorial
Confounds/nuisance factors Not always possible to isolate: have a plan Example: images coming from a separate server, which sometimes goes
down, so image is not shown. Want to treat those requests differently than the requests that produce the intended results
52 R
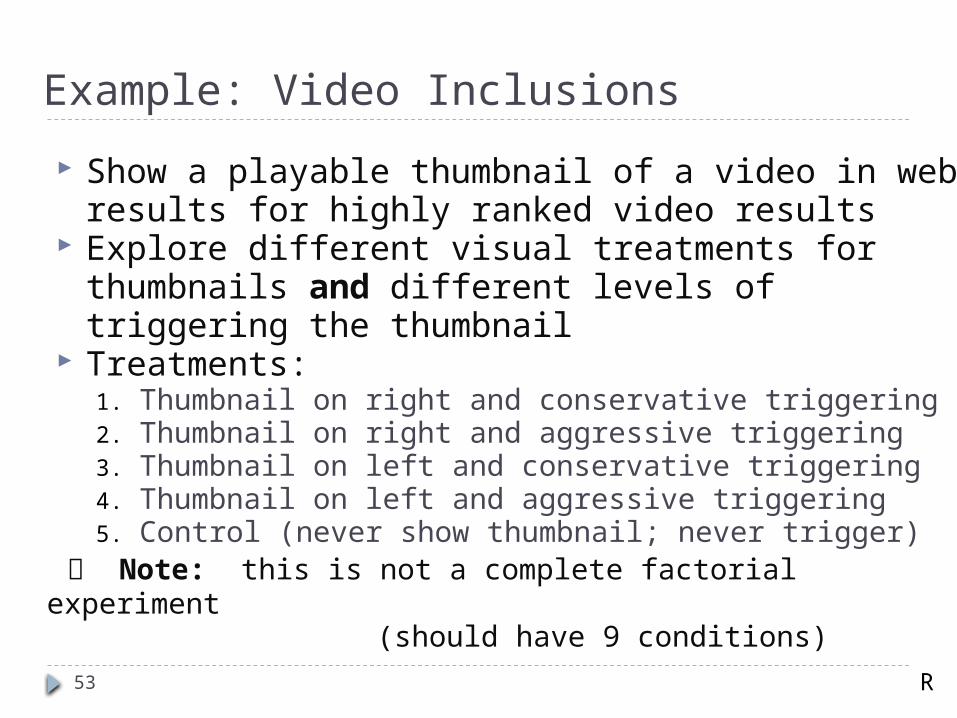
Example: Video Inclusions
Show a playable thumbnail of a video in web results for highly ranked video results
Explore different visual treatments for thumbnails and different levels of triggering the thumbnail
Treatments:1. Thumbnail on right and conservative triggering2. Thumbnail on right and aggressive triggering3. Thumbnail on left and conservative triggering4. Thumbnail on left and aggressive triggering5. Control (never show thumbnail; never trigger)
Note: this is not a complete factorial experiment (should have 9 conditions)
53 R
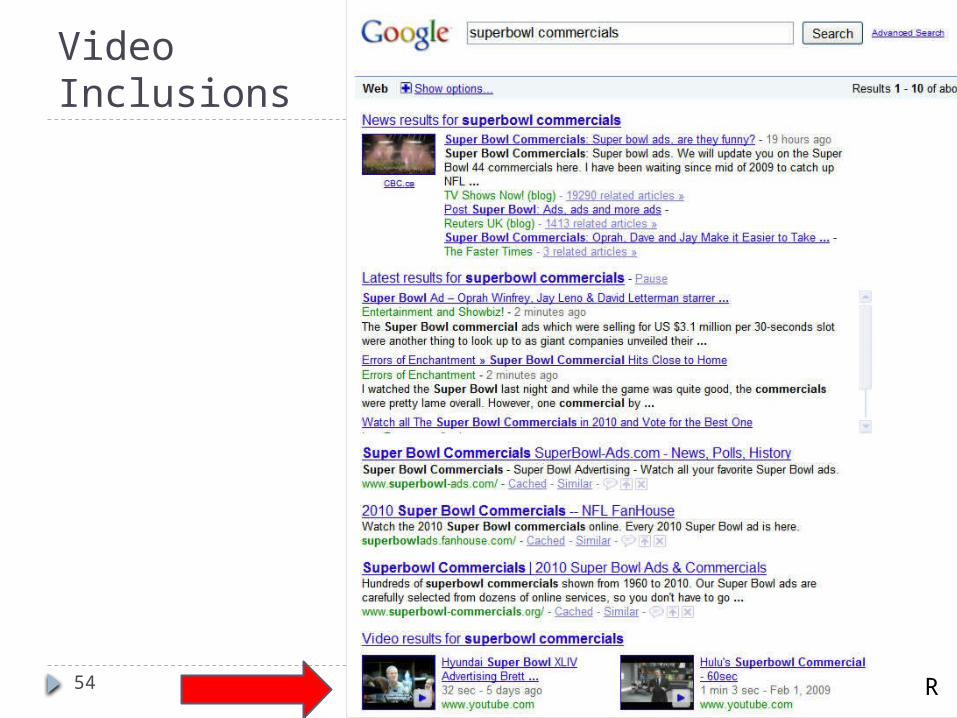
Video Inclusions
54 R
Hypotheses Given the proposed changes, what effects do you expect
to see? More concrete than “it will be cool” Will it impact what users do, how often they do it, how long it
will take, their satisfaction? How will you measure these changes?
What vs. why Hypotheses metrics
55 R
Metrics Which metrics?
Often lots of metrics What vs. why; need a suite of metrics to answer multiple questions Some matter all the time: overall usage, whole page parsing, etc. Some matter to your hypothesis:
“Increased feature usage”: click through rate, bounce rate, etc. “Easier to parse”: time to first action
Metrics may “disagree” Is TTR (time to result) faster, but success lower? Is TTR faster, but users never come back? Is TTR faster, but only for a subset of users (who overwhelm the metric)?
How big of a change in the metrics matter? Statistical vs. practical significance
56 R
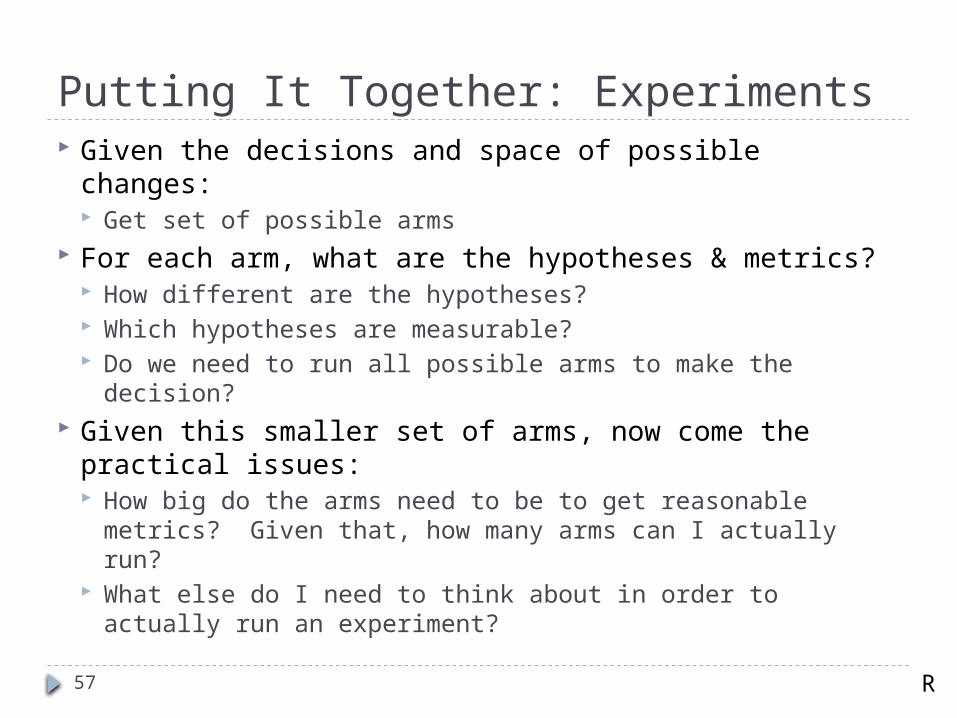
Putting It Together: Experiments Given the decisions and space of possible changes:
Get set of possible arms For each arm, what are the hypotheses & metrics?
How different are the hypotheses? Which hypotheses are measurable? Do we need to run all possible arms to make the decision?
Given this smaller set of arms, now come the practical issues: How big do the arms need to be to get reasonable metrics?
Given that, how many arms can I actually run? What else do I need to think about in order to actually run an
experiment?
57 R
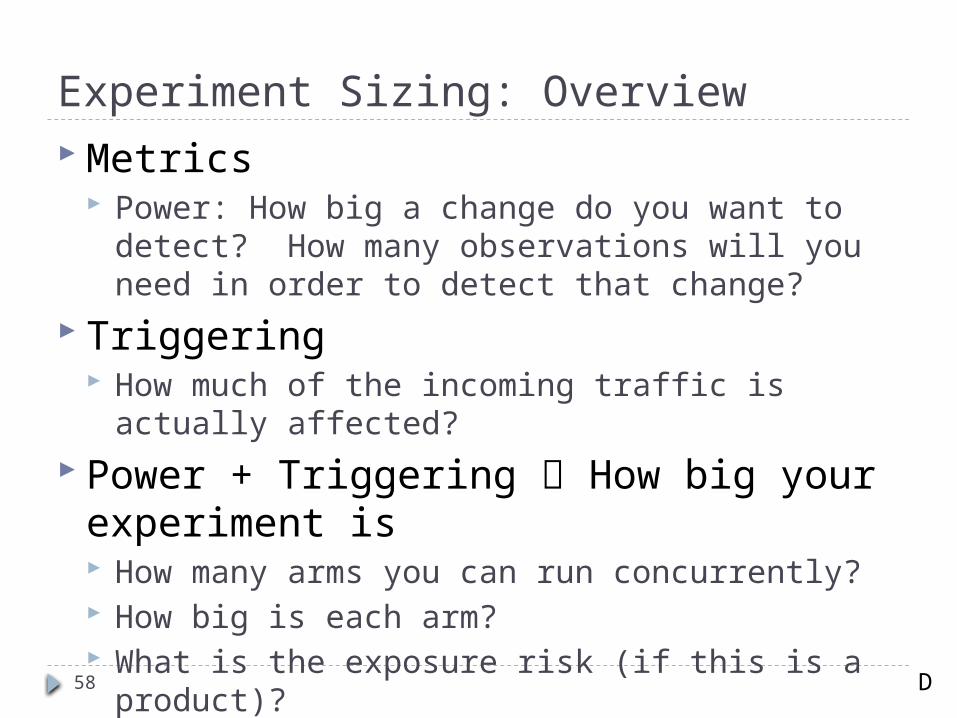
Experiment Sizing: Overview Metrics
Power: How big a change do you want to detect? How many observations will you need in order to detect that change?
Triggering How much of the incoming traffic is actually affected?
Power + Triggering How big your experiment is How many arms you can run concurrently? How big is each arm? What is the exposure risk (if this is a product)?
58 D
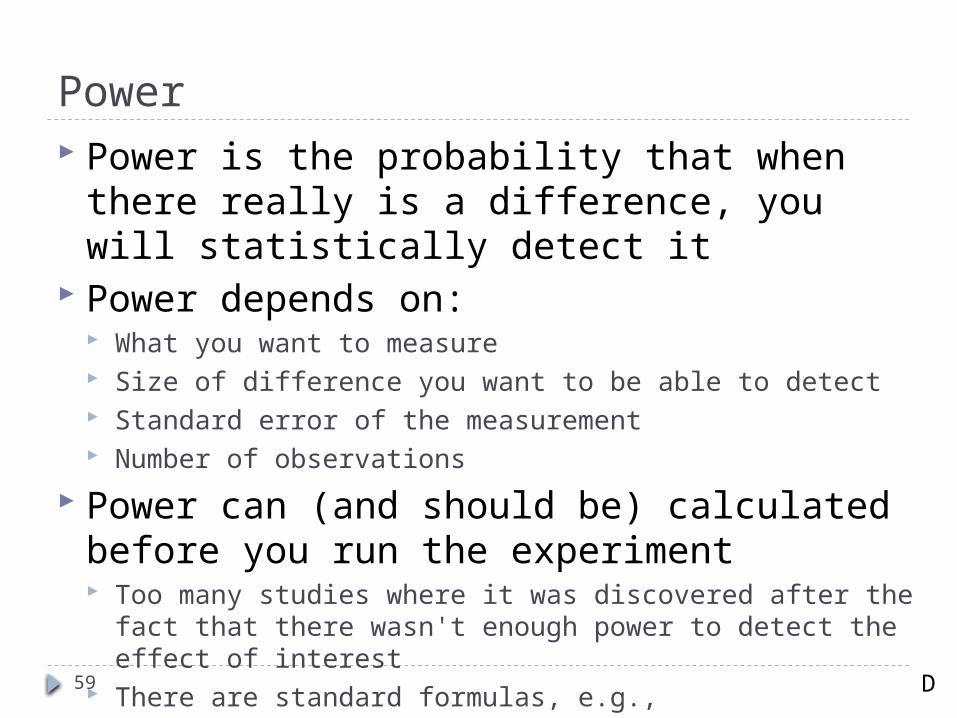
Power Power is the probability that when there really is a
difference, you will statistically detect it Power depends on:
What you want to measure Size of difference you want to be able to detect Standard error of the measurement Number of observations
Power can (and should be) calculated before you run the experiment Too many studies where it was discovered after the fact that there wasn't
enough power to detect the effect of interest There are standard formulas, e.g., en.wikipedia.org/wiki/Statistical_power
59 D
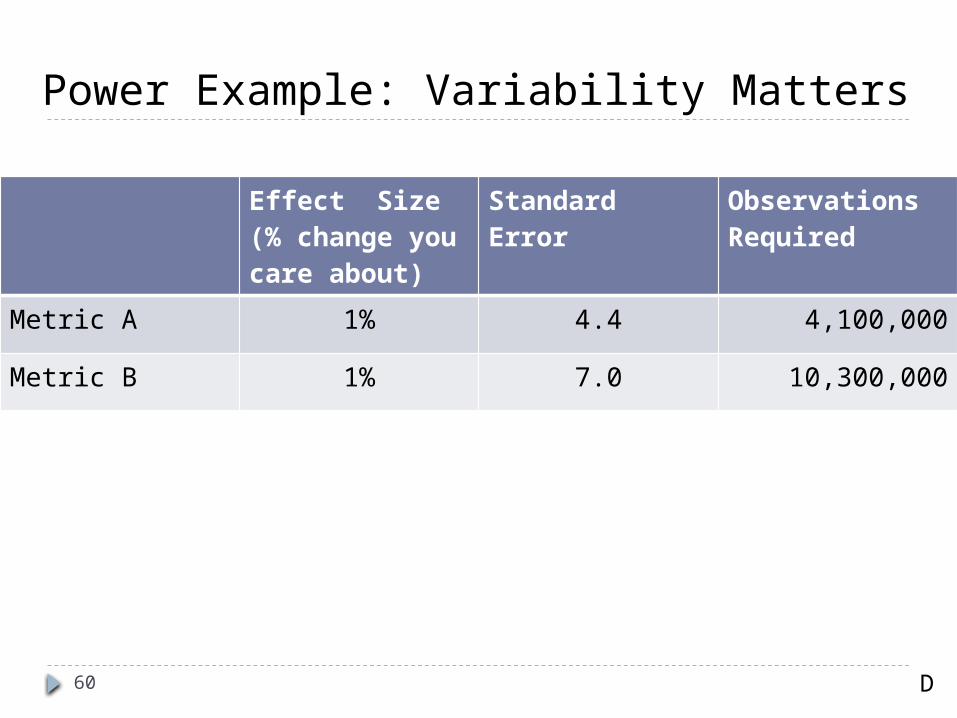
Power Example: Variability Matters
60
Effect Size (% change you care about)
Standard Error Observations Required
Metric A 1% 4.4 4,100,000
Metric B 1% 7.0 10,300,000
D
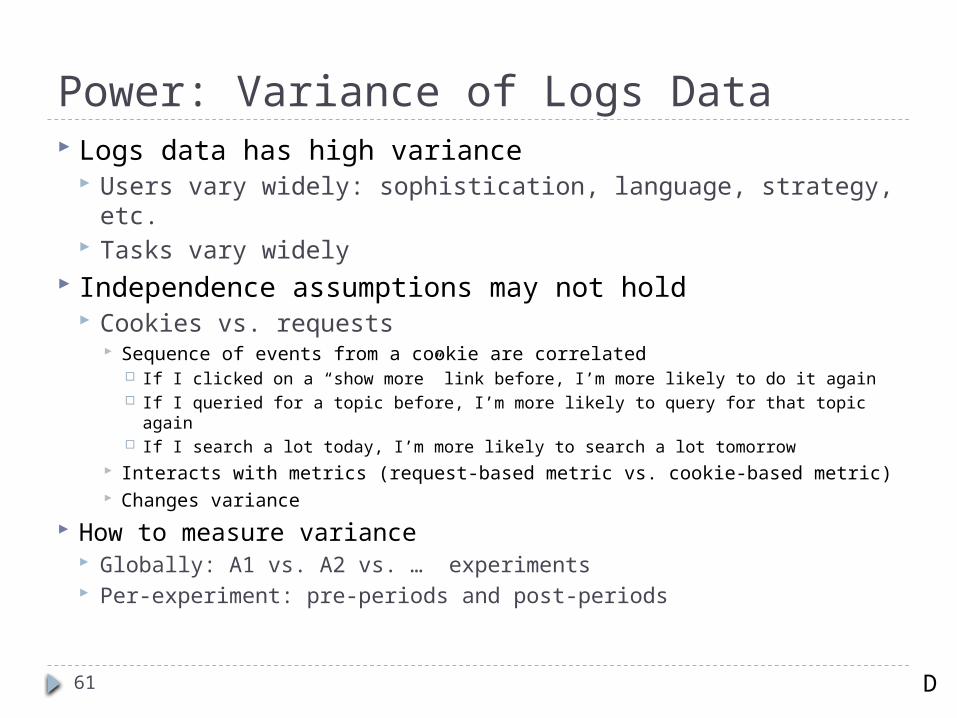
Power: Variance of Logs Data Logs data has high variance
Users vary widely: sophistication, language, strategy, etc. Tasks vary widely
Independence assumptions may not hold Cookies vs. requests
Sequence of events from a cookie are correlated If I clicked on a “show more” link before, I’m more likely to do it again If I queried for a topic before, I’m more likely to query for that topic again If I search a lot today, I’m more likely to search a lot tomorrow
Interacts with metrics (request-based metric vs. cookie-based metric) Changes variance
How to measure variance Globally: A1 vs. A2 vs. … experiments Per-experiment: pre-periods and post-periods
61 D
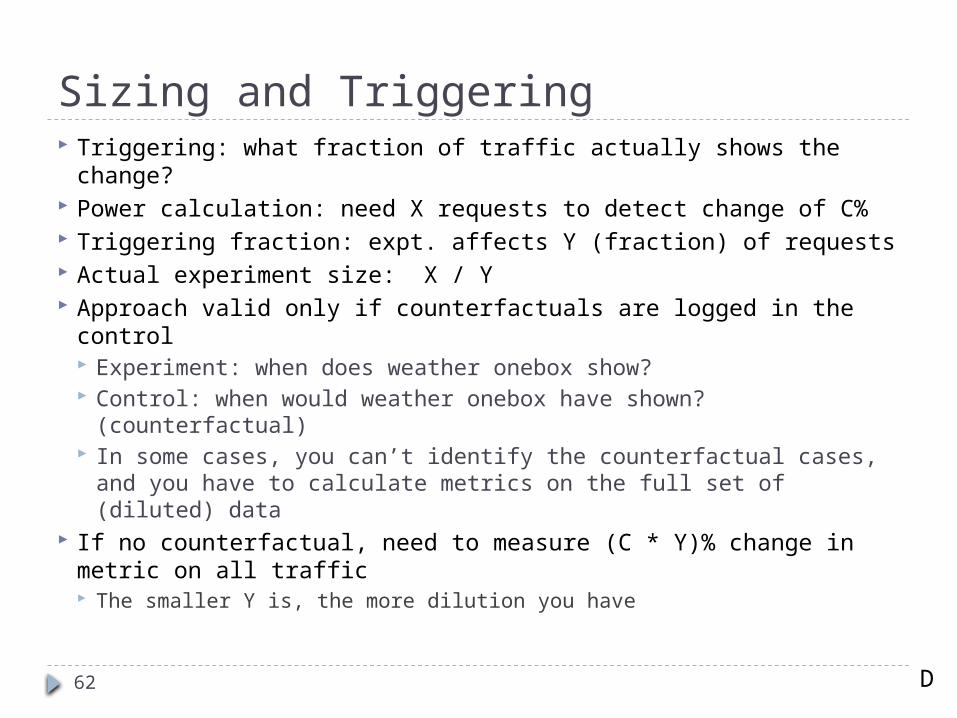
Sizing and Triggering Triggering: what fraction of traffic actually shows the change? Power calculation: need X requests to detect change of C% Triggering fraction: expt. affects Y (fraction) of requests Actual experiment size: X / Y Approach valid only if counterfactuals are logged in the control
Experiment: when does weather onebox show? Control: when would weather onebox have shown?
(counterfactual) In some cases, you can’t identify the counterfactual cases, and
you have to calculate metrics on the full set of (diluted) data If no counterfactual, need to measure (C * Y)% change in metric
on all traffic The smaller Y is, the more dilution you have
62 D
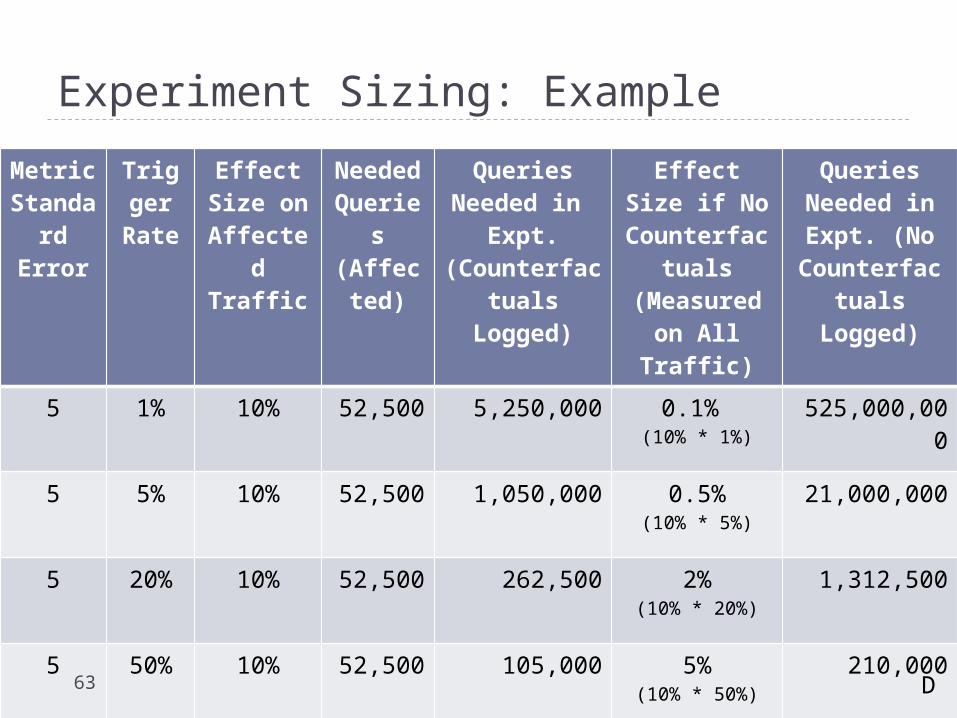
Experiment Sizing: Example
Metric Standard
Error
Trigger Rate
Effect Size on
Affected Traffic
Needed Queries
(Affected)
Queries Needed in Expt.
(Counterfactuals Logged)
Effect Size if No Counterfactuals
(Measured on All Traffic)
Queries Needed in Expt. (No
Counterfactuals Logged)
5 1% 10% 52,500 5,250,000 0.1% (10% * 1%)
525,000,000
5 5% 10% 52,500 1,050,000 0.5%(10% * 5%)
21,000,000
5 20% 10% 52,500 262,500 2%(10% * 20%)
1,312,500
5 50% 10% 52,500 105,000 5%(10% * 50%)
210,000
63 D
Sizing: Other Design Choices How long will you need to run your experiment, given your
sizing calculations? How many arms do you have? How much traffic can you devote to your experiment arms?
Power vs. risk trade-offs How many users are you willing to impact? (suppose it’s a terrible
user experience – how many users do you want to annoy?) Risk of exposure (for potential new products) Sequential vs. simultaneous arms
Sequential reduces risk, but introduces analysis issues such as seasonality and other timing issues (holidays, major weather event)
How many days? Shorter means faster, but units of weeks smooth out day of week
effects64 D
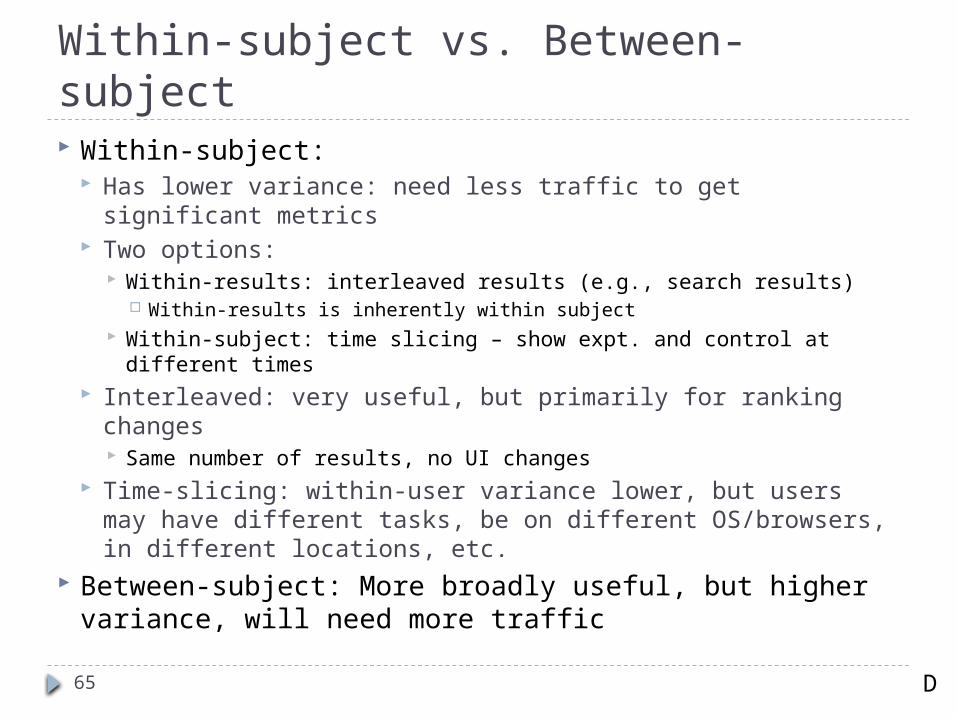
Within-subject vs. Between-subject Within-subject:
Has lower variance: need less traffic to get significant metrics Two options:
Within-results: interleaved results (e.g., search results) Within-results is inherently within subject
Within-subject: time slicing – show expt. and control at different times Interleaved: very useful, but primarily for ranking changes
Same number of results, no UI changes Time-slicing: within-user variance lower, but users may have
different tasks, be on different OS/browsers, in different locations, etc.
Between-subject: More broadly useful, but higher variance, will need more traffic
65 D
Running Experiments Selecting a population (diversion) Controls
66 R
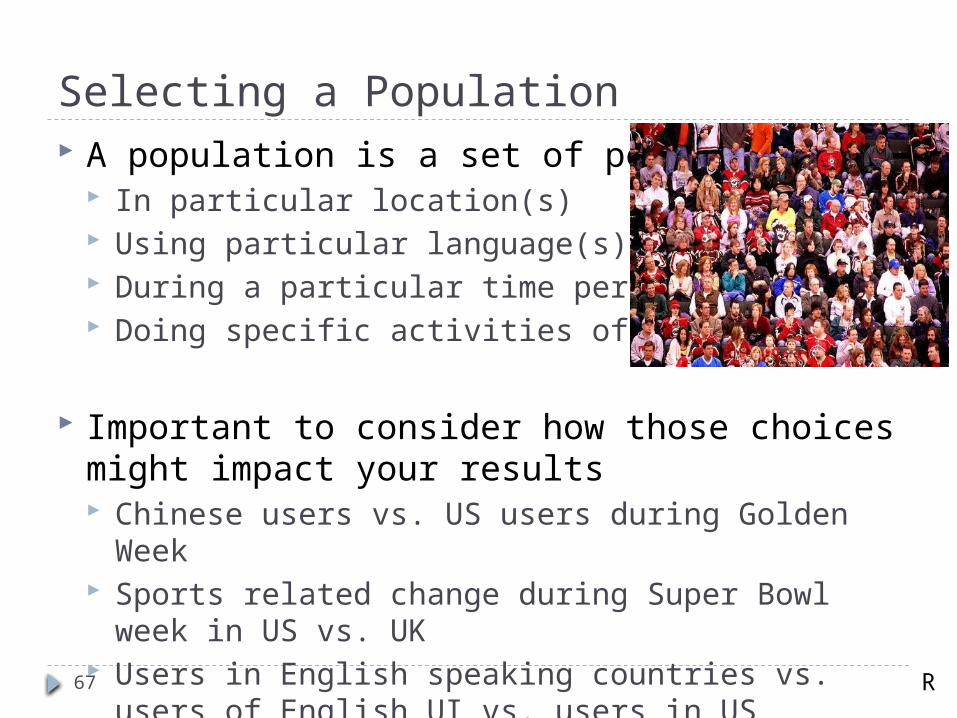
Selecting a Population A population is a set of people
In particular location(s) Using particular language(s) During a particular time period Doing specific activities of interest
Important to consider how those choices might impact your results Chinese users vs. US users during Golden Week Sports related change during Super Bowl week in US vs. UK Users in English speaking countries vs. users of English UI vs.
users in US67 R
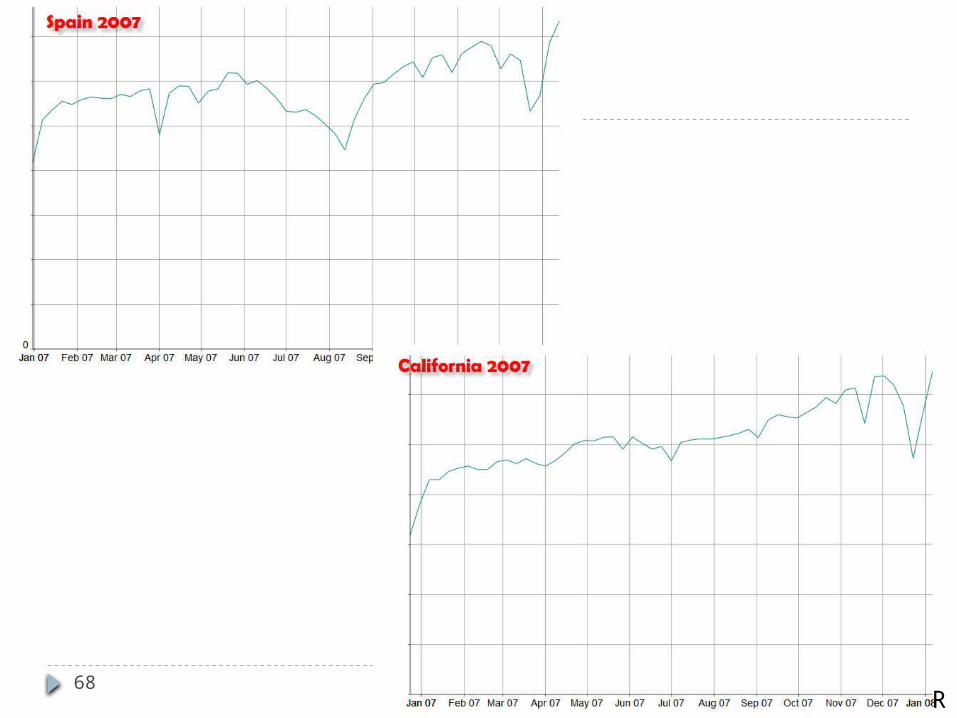
68R
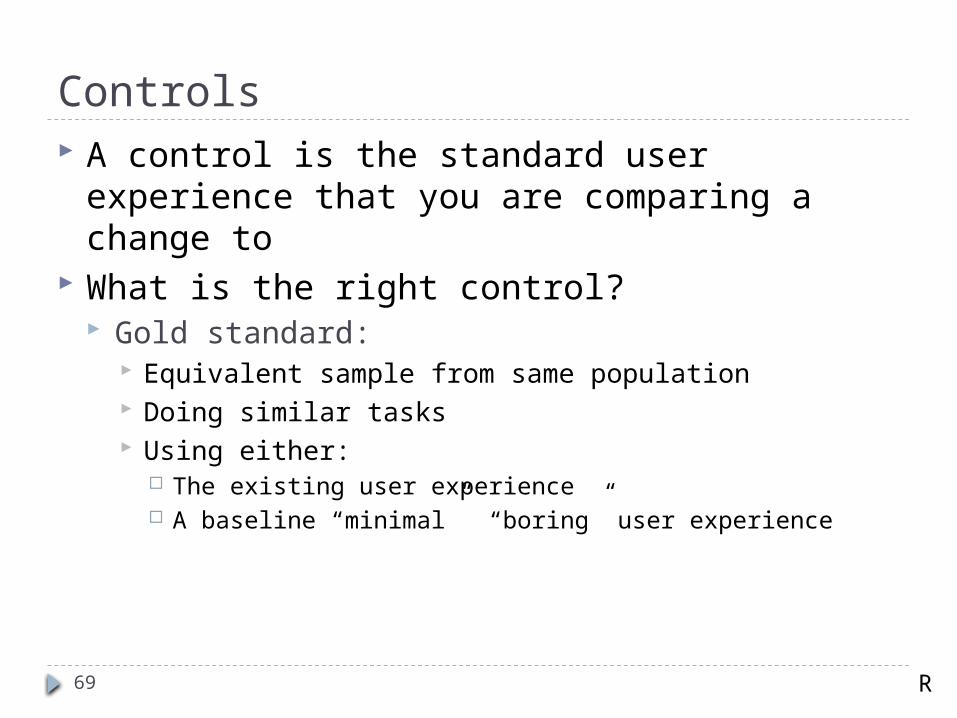
Controls A control is the standard user experience that you are
comparing a change to What is the right control?
Gold standard: Equivalent sample from same population Doing similar tasks Using either:
The existing user experience A baseline “minimal” “boring” user experience
69 R
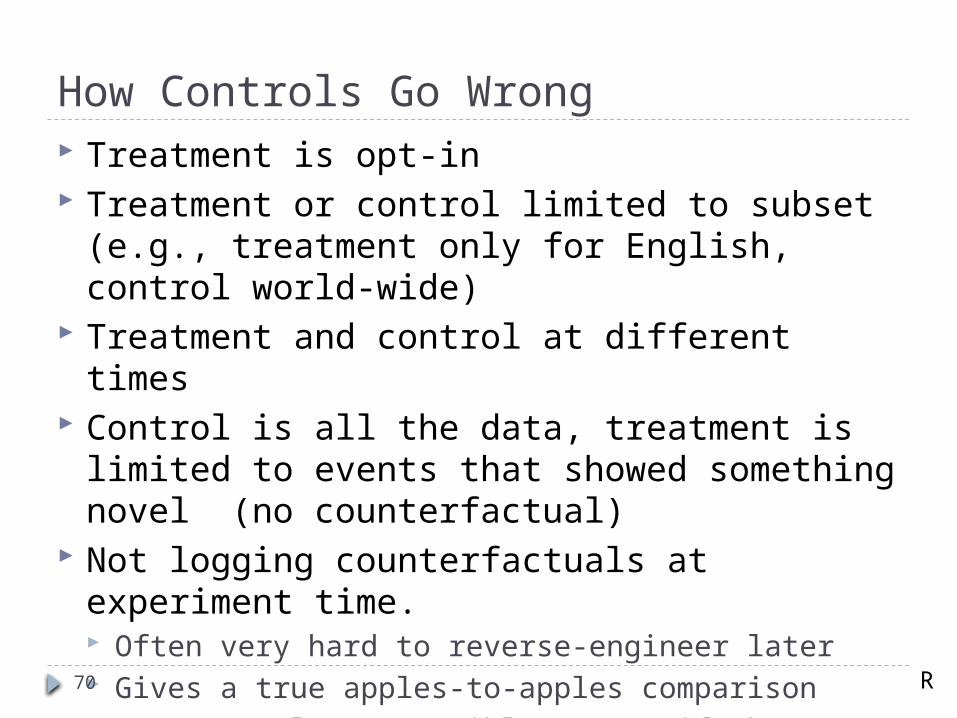
How Controls Go Wrong Treatment is opt-in Treatment or control limited to subset (e.g., treatment
only for English, control world-wide) Treatment and control at different times Control is all the data, treatment is
limited to events that showed something novel (no counterfactual)
Not logging counterfactuals at experiment time. Often very hard to reverse-engineer later Gives a true apples-to-apples comparison But, not always possible (e.g., if what-to-display decisions are
being made "on the fly")70 R
Analyzing Experiments Sanity checking Metrics, confidence intervals, slicing Mix vs. metric shifts
71 D
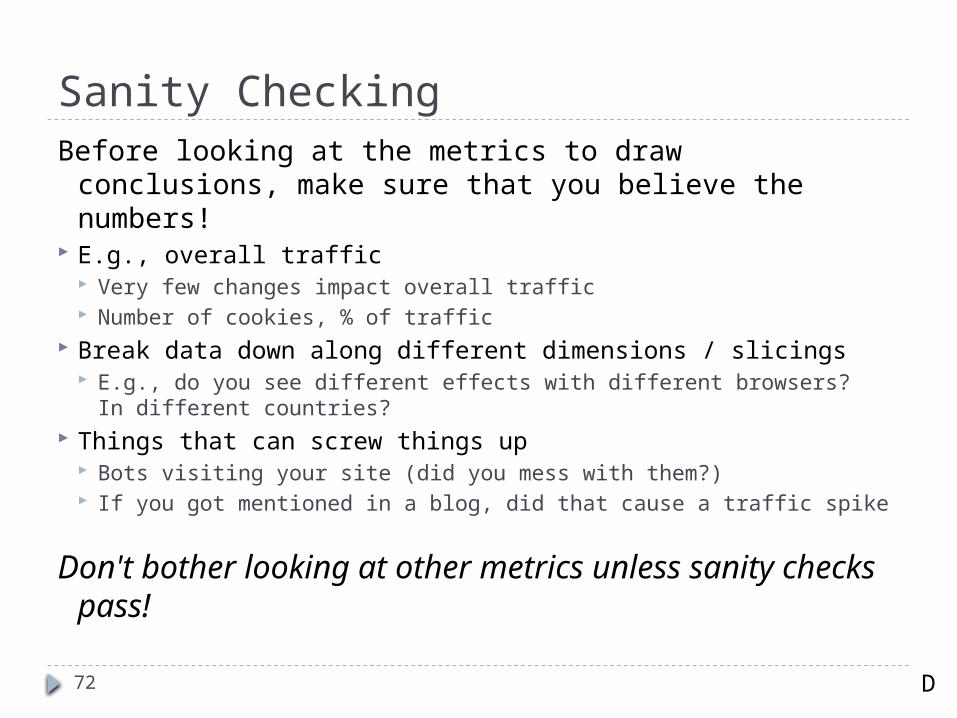
Sanity CheckingBefore looking at the metrics to draw conclusions, make sure
that you believe the numbers! E.g., overall traffic
Very few changes impact overall traffic Number of cookies, % of traffic
Break data down along different dimensions / slicings E.g., do you see different effects with different browsers? In different
countries? Things that can screw things up
Bots visiting your site (did you mess with them?) If you got mentioned in a blog, did that cause a traffic spike
Don't bother looking at other metrics unless sanity checks pass!
72 D
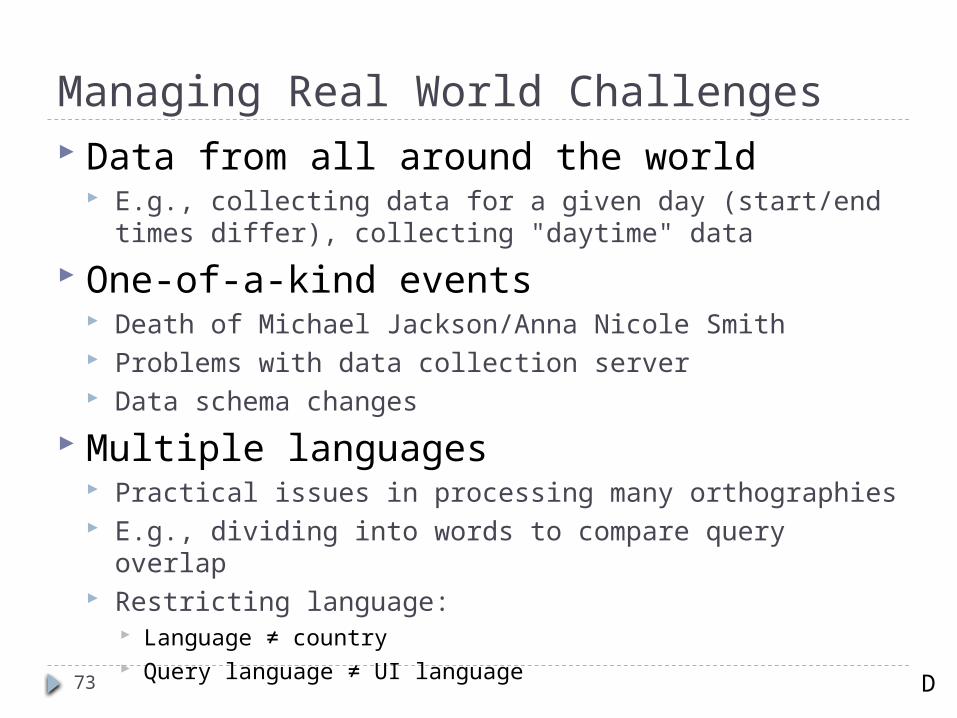
Managing Real World Challenges
73
Data from all around the world E.g., collecting data for a given day (start/end times differ), collecting
"daytime" data
One-of-a-kind events Death of Michael Jackson/Anna Nicole Smith Problems with data collection server Data schema changes
Multiple languages Practical issues in processing many orthographies E.g., dividing into words to compare query overlap Restricting language:
Language ≠ country Query language ≠ UI language
D
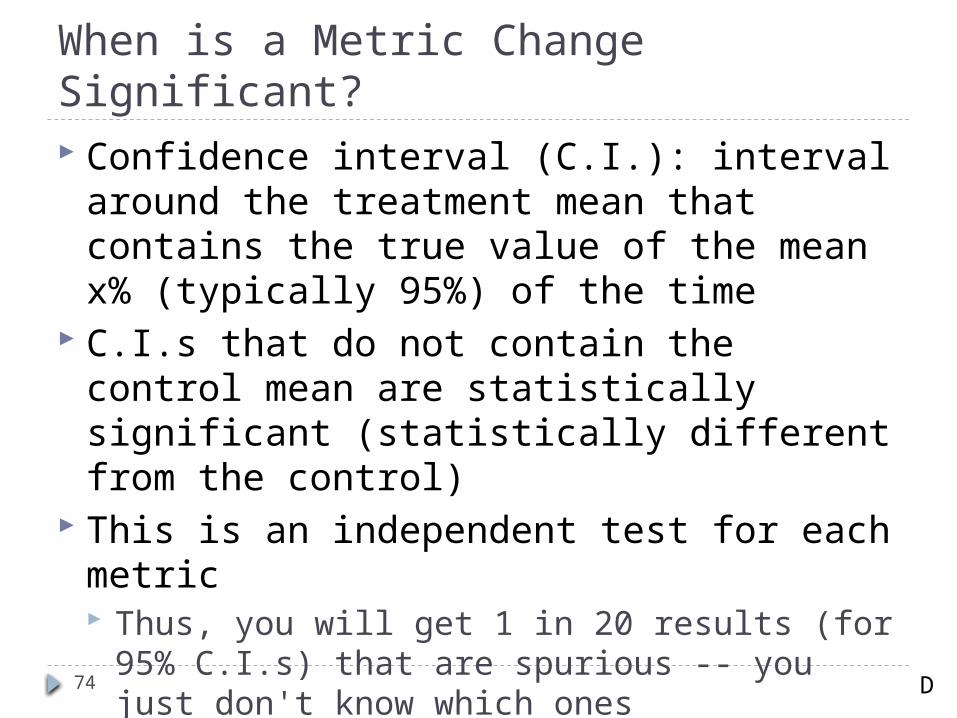
When is a Metric Change Significant?
74
Confidence interval (C.I.): interval around the treatment mean that contains the true value of the mean x% (typically 95%) of the time
C.I.s that do not contain the control mean are statistically significant (statistically different from the control)
This is an independent test for each metric Thus, you will get 1 in 20 results (for 95% C.I.s) that are
spurious -- you just don't know which ones C.I.s are not necessarily straightforward to compute.
D
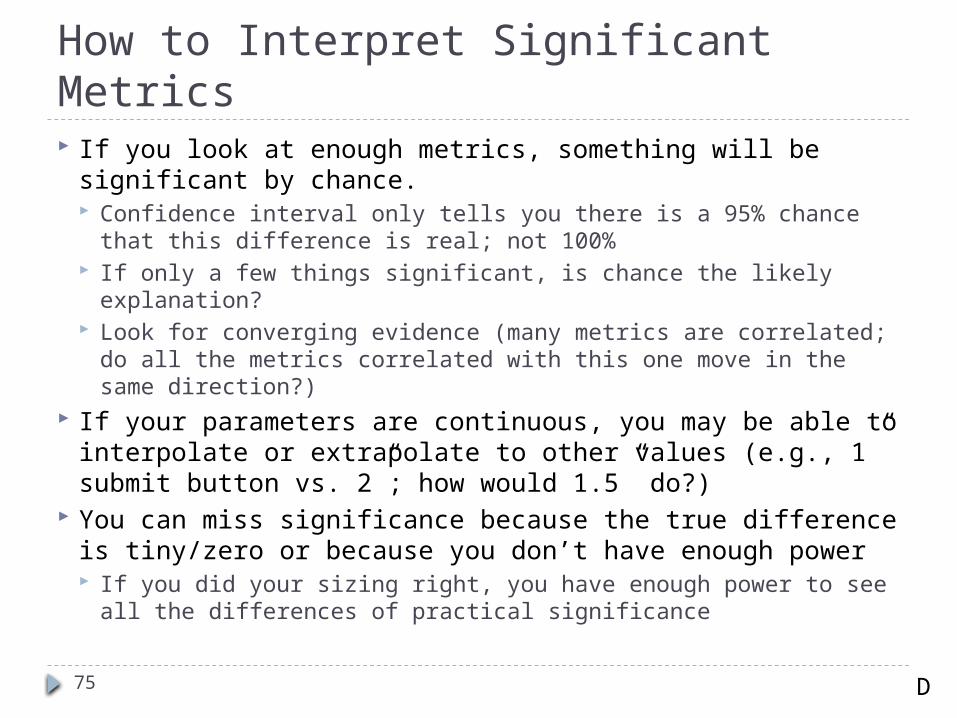
How to Interpret Significant Metrics If you look at enough metrics, something will be significant by
chance. Confidence interval only tells you there is a 95% chance that this
difference is real; not 100% If only a few things significant, is chance the likely explanation? Look for converging evidence (many metrics are correlated; do all the
metrics correlated with this one move in the same direction?) If your parameters are continuous, you may be able to interpolate
or extrapolate to other values (e.g., 1” submit button vs. 2”; how would 1.5” do?)
You can miss significance because the true difference is tiny/zero or because you don’t have enough power If you did your sizing right, you have enough power to see all the
differences of practical significance
75 D
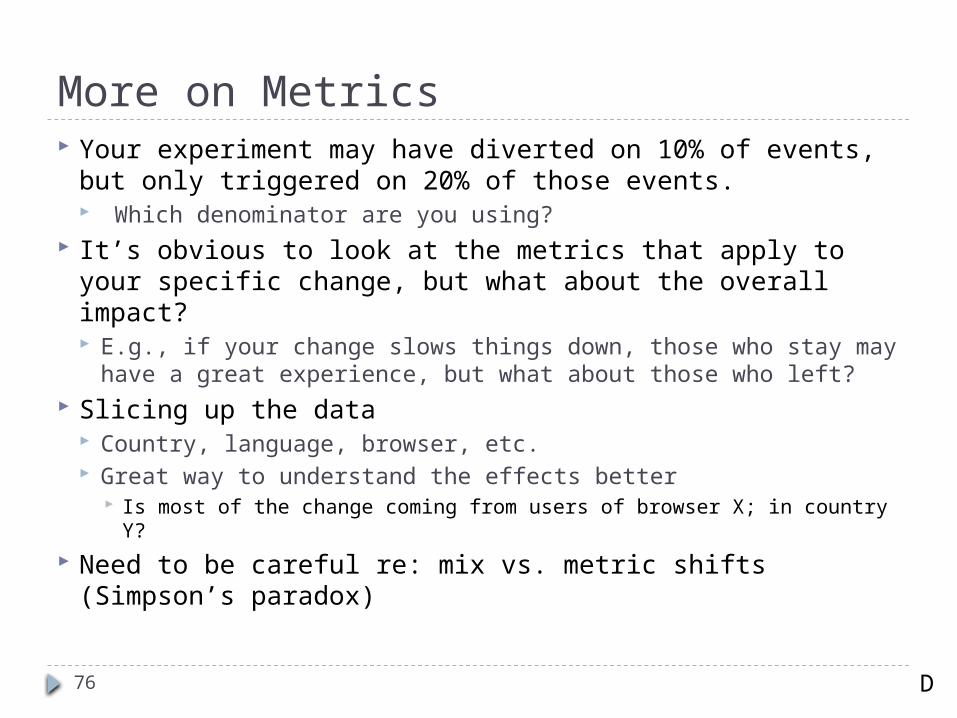
More on Metrics Your experiment may have diverted on 10% of events, but
only triggered on 20% of those events. Which denominator are you using?
It’s obvious to look at the metrics that apply to your specific change, but what about the overall impact? E.g., if your change slows things down, those who stay may have a
great experience, but what about those who left? Slicing up the data
Country, language, browser, etc. Great way to understand the effects better
Is most of the change coming from users of browser X; in country Y? Need to be careful re: mix vs. metric shifts (Simpson’s
paradox)76 D
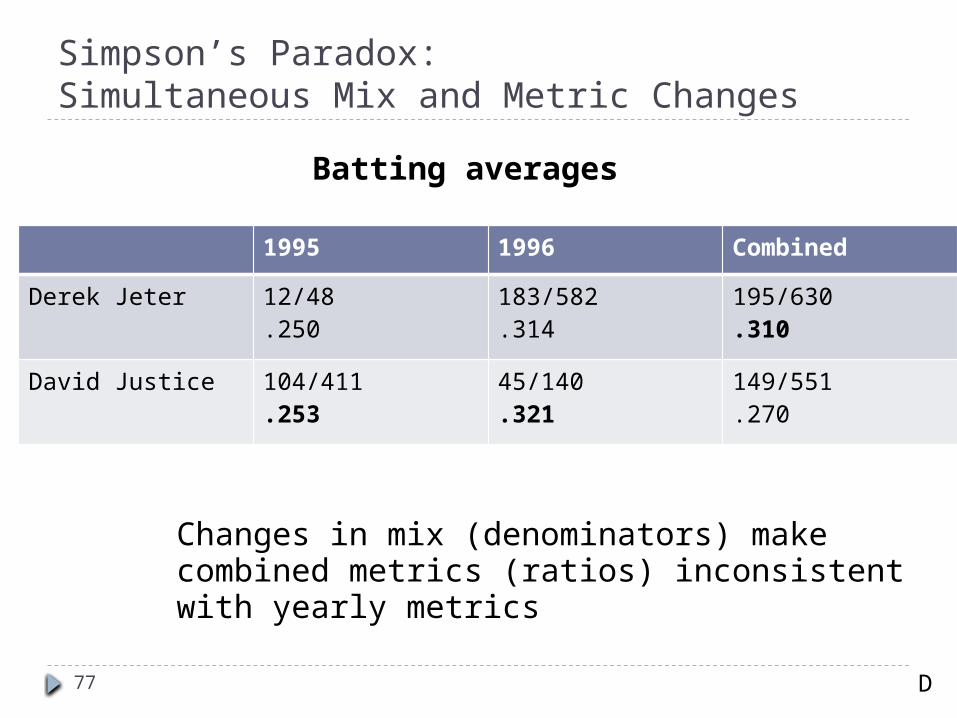
Simpson’s Paradox: Simultaneous Mix and Metric Changes
77
Changes in mix (denominators) make combined metrics (ratios) inconsistent with yearly metrics
Batting averages
1995 1996 Combined
Derek Jeter 12/48.250
183/582.314
195/630.310
David Justice 104/411.253
45/140.321
149/551.270
D
More on Simpson’s Paradox Neither the individual data (the yearly metrics) or the
combined data is inherently more correct It depends, of course, on what your hypothesis is
Once you have mix changes (changes to the denominators across subgroups), all metrics (changes to the ratios) are suspect Always compare your denominators across samples Maybe the point of the experiment was to produce a mix
change Can you restrict analysis to the data not impacted by the mix
change (the subset that didn't change)? Minimally, be up front about this in any writeup
78 D
Detailed Analysis Big Picture Not all effects will point the same direction
Take a closer look at the items going in the "wrong" direction Can you interpret them?
E.g., people are doing fewer next-pages because they are finding their answer on the first page
Could they be artifactual? What if they are real?
What should be the impact on your conclusions? on your decision?
Significance and impact are not the same thing Couching things in terms of % change vs. absolute change
helps A substantial effect size depends on what you want to do with
the data
79 D
Summary: Critical Steps When Designing Experiments Determine your hypotheses Decide on which metrics Size your experiment
Take the triggering fraction into account If at all possible, identify the counterfactual events in the
control Sanity check your data Make sure you have enough power to not miss effects of
interest; look for converging evidence to keep from acting on spuriously significant results
Don’t get bit by Simpson’s Paradox
80 R
Discussion
All
81
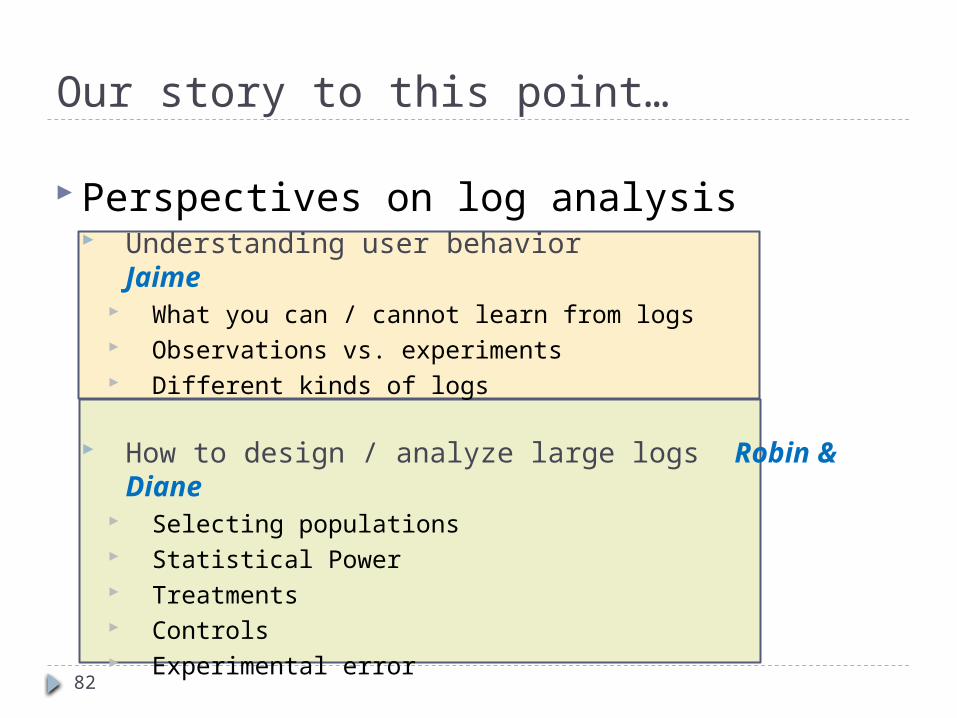
Our story to this point…
Perspectives on log analysis Understanding user behavior Jaime
What you can / cannot learn from logs Observations vs. experiments Different kinds of logs
How to design / analyze large logs Robin & Diane
Selecting populations Statistical Power Treatments Controls Experimental error
82
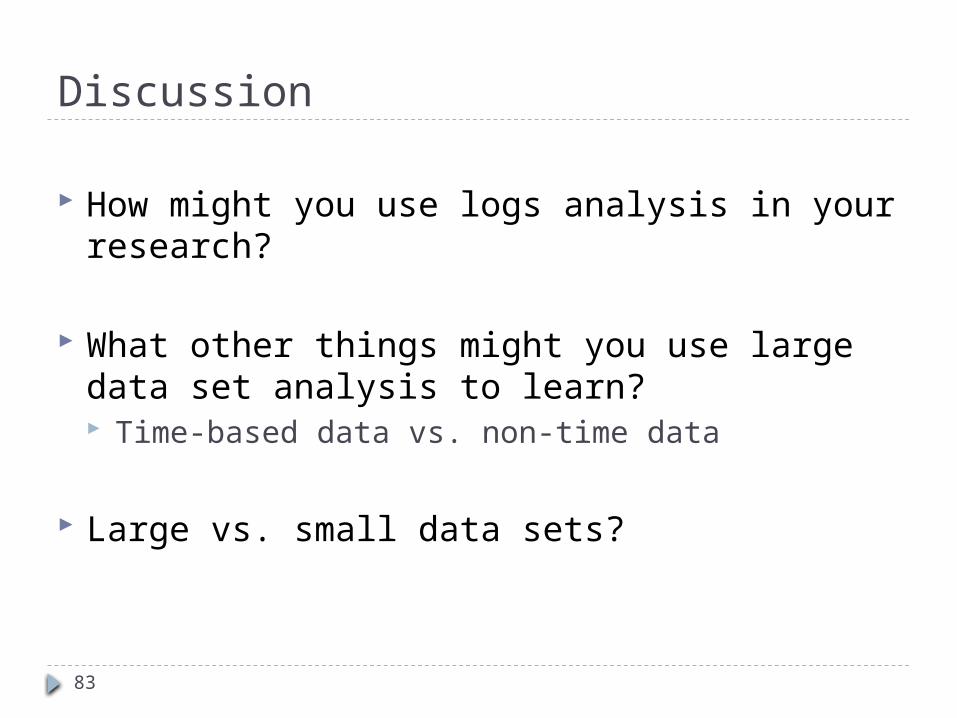
Discussion
How might you use logs analysis in your research?
What other things might you use large data set analysis to learn? Time-based data vs. non-time data
Large vs. small data sets?
83
Section 3: Practical Considerations for Log Analysis
84
Overview
Data collection and storage [Susan Dumais] Logging the data Storing the data Using the data responsibly
Data analysis [Daniel M. Russell] How to clean the data
Discussion: Log analysis and the HCI community
85
Section 3A:Data Collection, Storage and Use
Susan Dumais and Jaime TeevanMicrosoft Research
86
Overview
Logging the data Storing the data Using the data responsibly Building large-scale systems out-of-scope
87
dumais
beijing
sigir 2011
vancouver
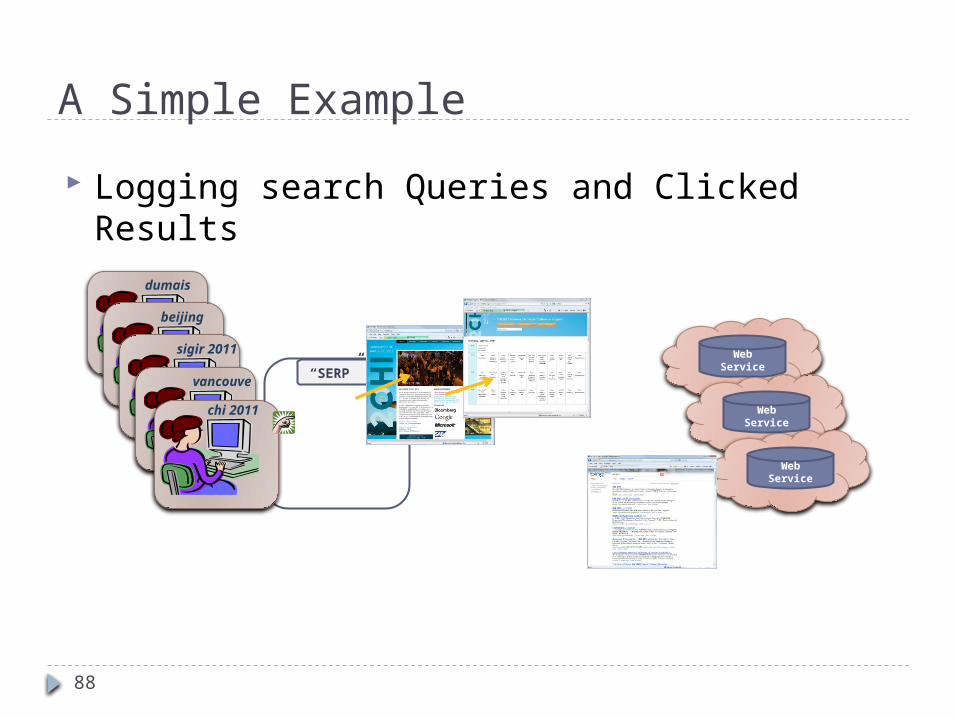
A Simple Example
Logging search Queries and Clicked Results
88
Web Service
Web Service
Web Service
“SERP”
chi 2011
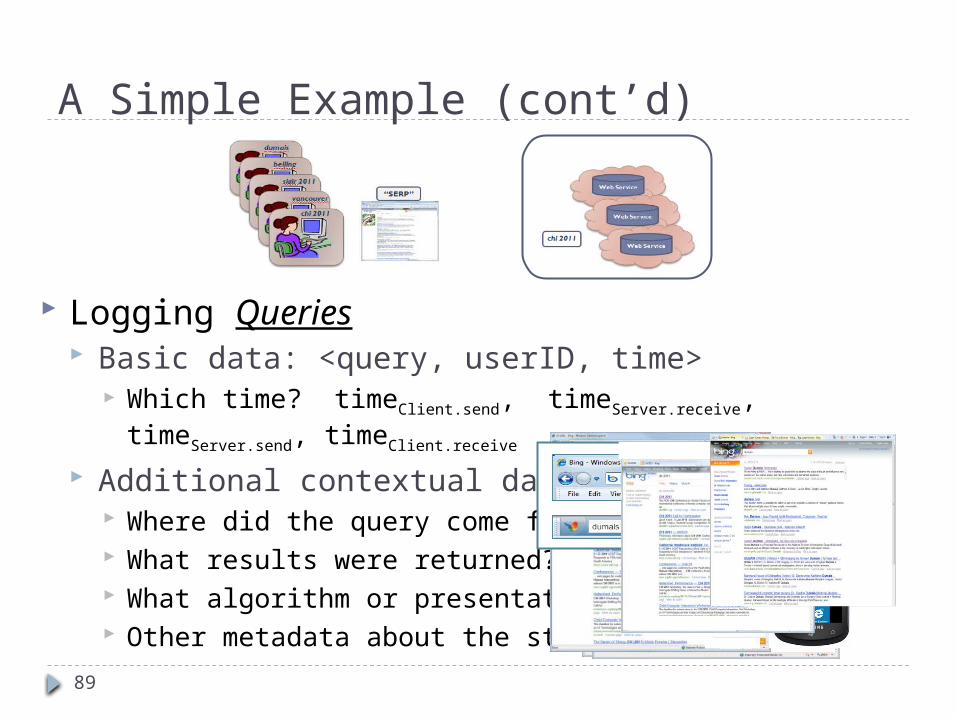
A Simple Example (cont’d)
Logging Queries Basic data: <query, userID, time>
Which time? timeClient.send, timeServer.receive, timeServer.send, timeClient.receive
Additional contextual data: Where did the query come from? What results were returned? What algorithm or presentation was used? Other metadata about the state of the system
89
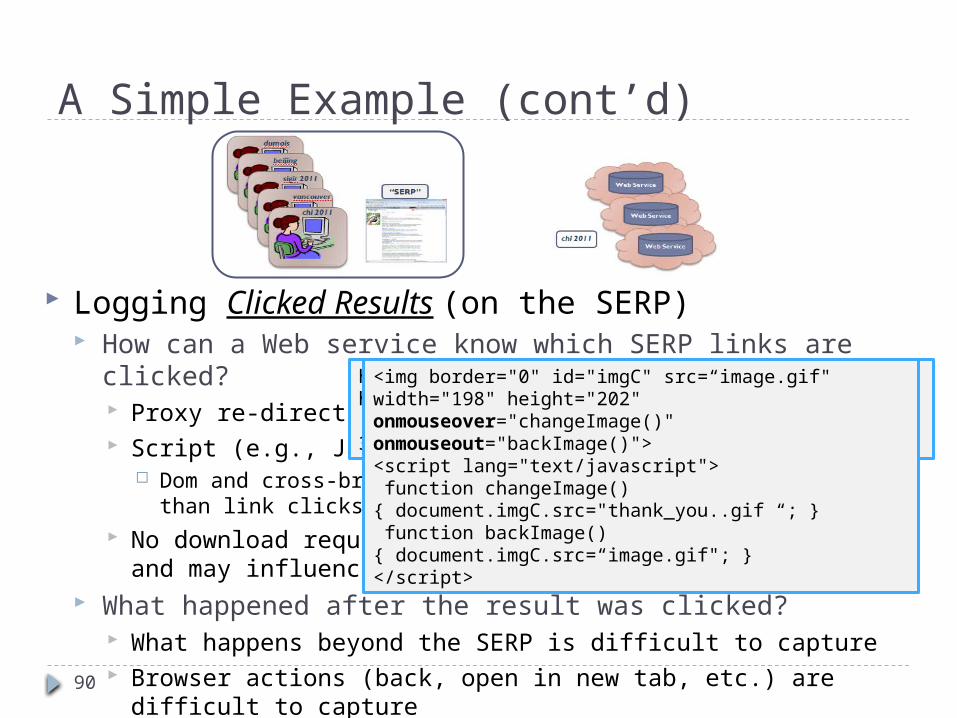
A Simple Example (cont’d)
Logging Clicked Results (on the SERP) How can a Web service know which SERP links are clicked?
Proxy re-direct Script (e.g., JavaScript)
Dom and cross-browser challenges, but can instrument more than link clicks No download required; but adds complexity and latency, and may influence user
interaction What happened after the result was clicked?
What happens beyond the SERP is difficult to capture Browser actions (back, open in new tab, etc.) are difficult to capture To better interpret user behavior, need richer client instrumentation
90
http://www.chi2011.org vs. http://redir.service.com/?q=chi2011&url=http://www.chi2011.org/&pos=3&log=DiFVYj1tRQZtv6e1FF7kltj02Z30eatB2jr8tJUFR
<img border="0" id="imgC" src=“image.gif" width="198" height="202" onmouseover="changeImage()" onmouseout="backImage()"><script lang="text/javascript"> function changeImage(){ document.imgC.src="thank_you..gif “; } function backImage(){ document.imgC.src=“image.gif"; }</script>
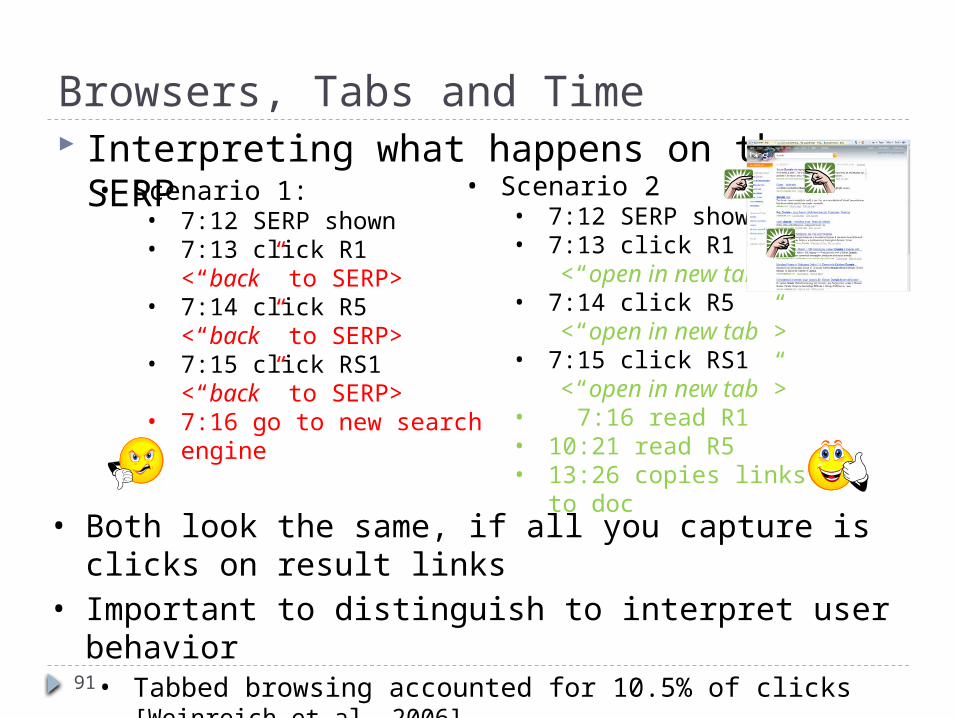
Browsers, Tabs and Time Interpreting what happens on the SERP
91
• Scenario 1:• 7:12 SERP shown• 7:13 click R1
<“back” to SERP>• 7:14 click R5
<“back” to SERP>• 7:15 click RS1
<“back” to SERP>• 7:16 go to new search engine
• Scenario 2• 7:12 SERP shown• 7:13 click R1
<“open in new tab”>• 7:14 click R5
<“open in new tab”>• 7:15 click RS1
<“open in new tab”>• 7:16 read R1• 10:21 read R5• 13:26 copies links to
doc• Both look the same, if all you capture is clicks on
result links• Important to distinguish to interpret user behavior
• Tabbed browsing accounted for 10.5% of clicks [Weinreich et al. 2006]
• 81% of observed search sequences are ambiguous [Viermetz et al. 2006]
Richer Client Instrumentation
Toolbar (or other client code) Richer logging (e.g., browser events, mouse/keyboard events,
screen capture, eye-tracking, etc.) Several HCI studies of this type [e.g., Kellar et al., Cutrell et al.] Importance of robust software, and data agreements
Instrumented panel A group of people who use client code regularly; may also
involve subsequent follow-up interviews Nice mix of in situ use (the what) and support for further probing
(the why) E.g., Curious Browser [Fox et al., next slide]
Data typically recorded on the client Still needs to get logged centrally on a server92
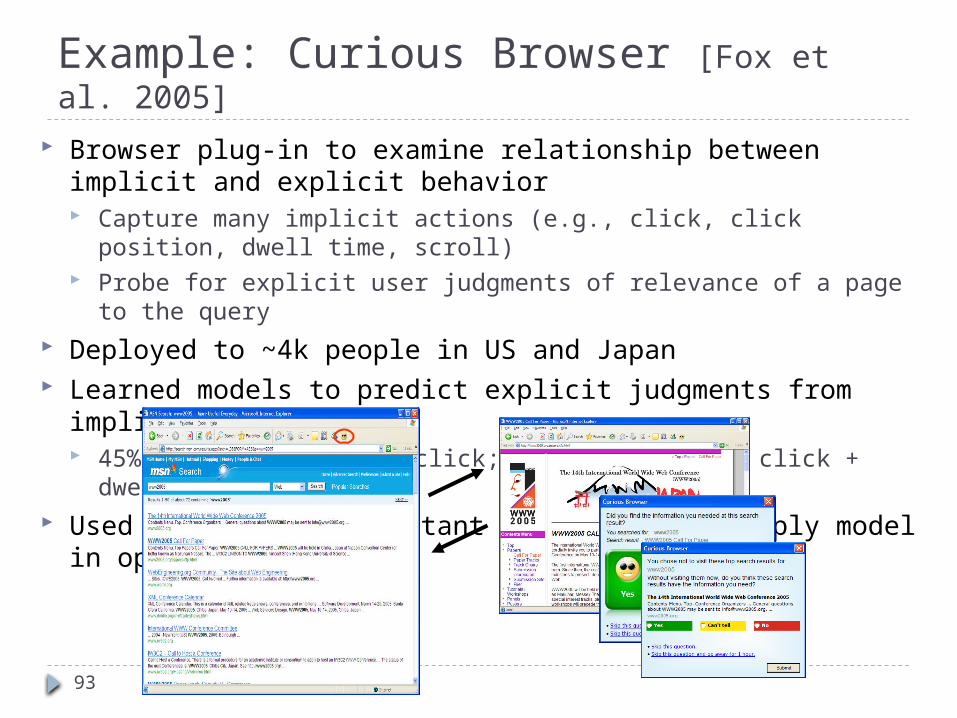
Example: Curious Browser [Fox et al. 2005]
Browser plug-in to examine relationship between implicit and explicit behavior Capture many implicit actions (e.g., click, click position, dwell time, scroll) Probe for explicit user judgments of relevance of a page to the query
Deployed to ~4k people in US and Japan Learned models to predict explicit judgments from implicit indicators
45% accuracy w/ just click; 75% accuracy w/ click + dwell + session Used to identify important features; then apply model in open loop setting
93
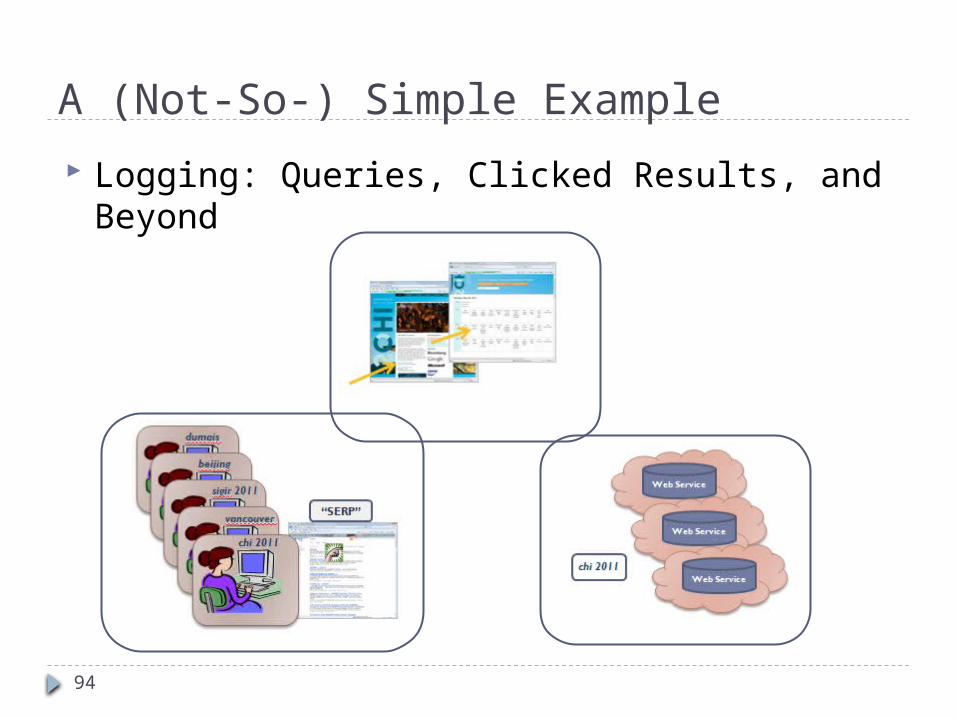
A (Not-So-) Simple Example
Logging: Queries, Clicked Results, and Beyond
94
Setting Up Server-side Logging
What to log? Log as much as possible But … make reasonable choices
Richly instrumented client experiments can provide some guidance Pragmatics about amount of data, storage required will also guide
What to do with the data? The data is a large collection of events, often keyed w/ time
E.g., <time, userID, action, value, context> Keep as much raw data as possible (and allowable) Post-process data to put into a more usable form
Integrating across servers to organize the data by time, userID, etc. Normalizing time, URLs, etc. Richer data cleaning [see next section]
95
A Few More Important Practical Issues
Time Scale Identifying “Users” Data Privacy and Security
96
Time (and Time Again)
Time Client time is closer to the user, but can be wrong or reset Server time includes network latencies, but controllable In both cases, need to synchronize time across multiple machines
Data integration Ensure that joins of data are all using the same basis (e.g., UTC vs. local
time)
Accurate timing data is critical for understanding the sequence of user activities, daily temporal patterns, etc.
97
Issues of Scale Data Collection
Storage requirements E.g., 1k bytes/record x 10 records/query x 100 mil queries/day = 1000 Gb/day
Network bandwidth Client to server; Data center to data center
Data Analysis What are MapReduce, Hadoop, Pig all about?
MapReduce – framework for processing huge datasets on compute clusters Key idea: partition problem into pieces which can be done in parallel Map: take input, and divide it into sub-problems which can be distributed Reduce: collect results, and combine them to get final answer
Hadoop - open-source implementation of MapReduce Pig - execution engine on top of Hadoop
Why would you want to use them? How can you use them?98
How is a User Identified?
Http cookies, IP address, temporary ID Provides broad coverage and easy to use, but … Multiple people use same machine Same person uses multiple machines (and browsers)
How many cookies did you use today? Lots of churn in these IDs
Jupiter Res (39% delete cookies monthly); Comscore (2.5x inflation) Login, or Download of client code (e.g., browser plug-in)
Better correspondence to people, but … Requires sign-in or download Results in a smaller and biased sample of people or data (who
remember to login, decided to download, etc.) Either way, loss of data99
Using the Data Responsibly
What data is collected and how it can be used? User agreements (terms of service) Emerging industry standards and best practices
Trade-offs More data:
More intrusive and potential privacy concerns, but also more useful for understanding interaction and improving systems
Less data: Less intrusive, but less useful
Risk, benefit, and trust
100
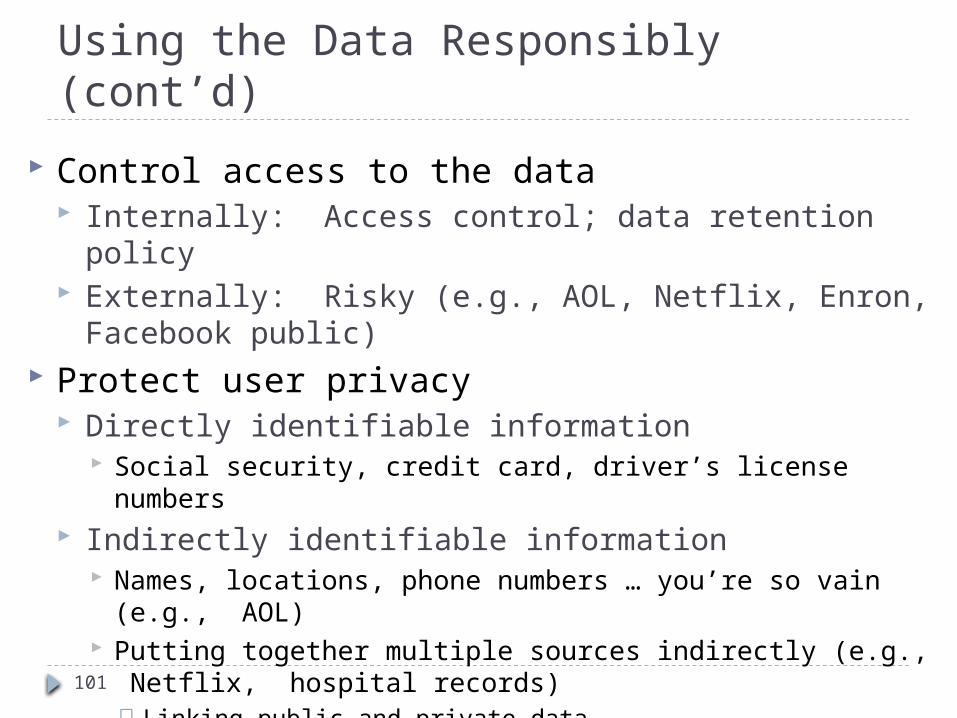
Using the Data Responsibly (cont’d)
Control access to the data Internally: Access control; data retention policy Externally: Risky (e.g., AOL, Netflix, Enron, Facebook public)
Protect user privacy Directly identifiable information
Social security, credit card, driver’s license numbers Indirectly identifiable information
Names, locations, phone numbers … you’re so vain (e.g., AOL) Putting together multiple sources indirectly (e.g., Netflix, hospital records)
Linking public and private data k-anonymity; Differential privacy; etc.
101
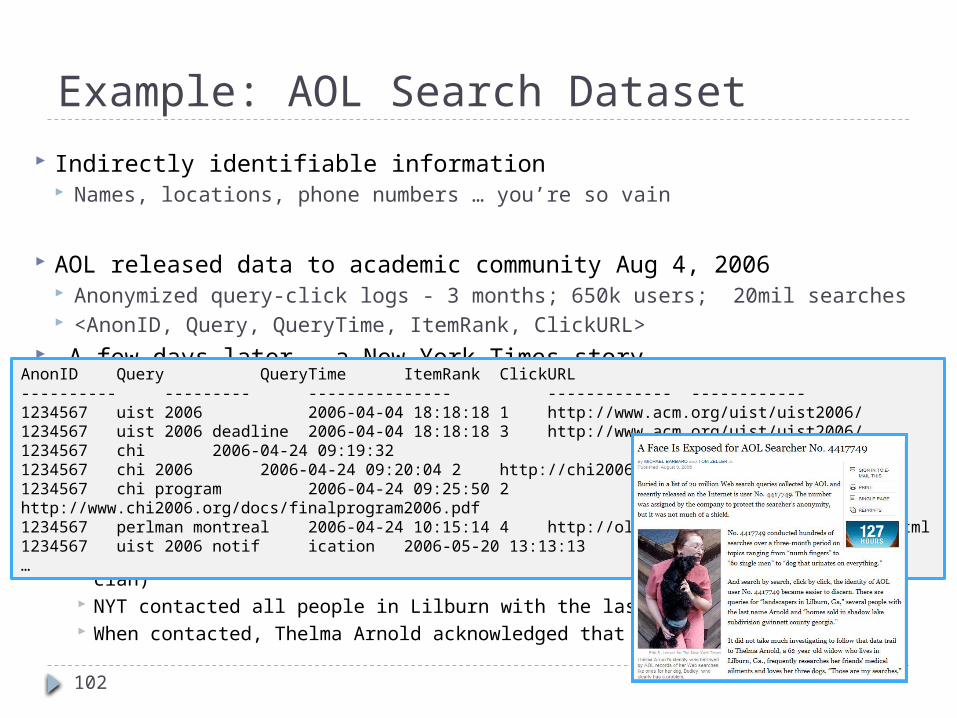
Example: AOL Search Dataset
Indirectly identifiable information Names, locations, phone numbers … you’re so vain
AOL released data to academic community Aug 4, 2006 Anonymized query-click logs - 3 months; 650k users; 20mil searches <AnonID, Query, QueryTime, ItemRank, ClickURL>
A few days later … a New York Times story A Face Is Exposed for AOL Searcher No. 4417749 (Aug 9, 2006)
Aug 21, 2006: Two employees fired; CTO resigns The road from ID 4417749 to Thelma Arnold, a 62 year old woman living
in GA Multiple queries for businesses and services in Lilburn, GA. (n ~ 11k people) Multiple queries for Jarrett Arnold (and other members of the Arnold clan) NYT contacted all people in Lilburn with the last name Arnold (n=14) When contacted, Thelma Arnold acknowledged that these were her queries
AnonID Query QueryTime ItemRank ClickURL---------- --------- --------------- ------------- ------------1234567 uist 2006 2006-04-04 18:18:18 1 http://www.acm.org/uist/uist2006/1234567 uist 2006 deadline 2006-04-04 18:18:18 3 http://www.acm.org/uist/uist2006/1234567 chi 2006-04-24 09:19:321234567 chi 2006 2006-04-24 09:20:04 2 http://chi2006.org1234567 chi program 2006-04-24 09:25:50 2http://www.chi2006.org/docs/finalprogram2006.pdf1234567 perlman montreal 2006-04-24 10:15:14 4 http://oldwww.acm.org/perlman/guide.html1234567 uist 2006 notif ication 2006-05-20 13:13:13…
102
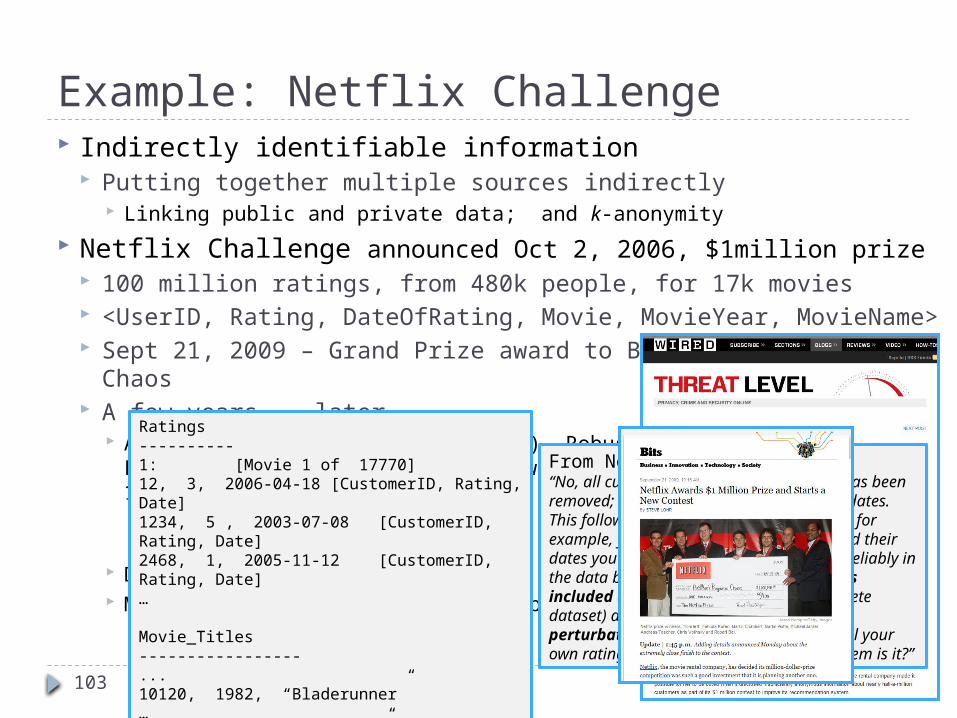
Example: Netflix Challenge Indirectly identifiable information
Putting together multiple sources indirectly Linking public and private data; and k-anonymity
Netflix Challenge announced Oct 2, 2006, $1million prize 100 million ratings, from 480k people, for 17k movies <UserID, Rating, DateOfRating, Movie, MovieYear, MovieName> Sept 21, 2009 – Grand Prize award to BellKor’s Pragmatic Chaos A few years … later
A. Narayanan, V. Shmatikov. (2008) Robust De-anonymization of Large Sparse Datasets. IEEE Symposium on Security and Privacy 2008, 111–125. Data de-anonymized using background knowledge from IMDB Robust to perturbations in data
Dec 17, 2009 – Doe v. Netflix Mar 12, 2010 – Second Netflix competition cancelled
Ratings----------1: [Movie 1 of 17770]12, 3, 2006-04-18 [CustomerID, Rating, Date]1234, 5 , 2003-07-08 [CustomerID, Rating, Date]2468, 1, 2005-11-12 [CustomerID, Rating, Date]…
Movie_Titles-----------------...10120, 1982, “Bladerunner”…17690, 2007, “The Queen”
From Netflix FAQ“No, all customer identifying information has been removed; all that remains are ratings and dates. This follows our privacy policy [. . . ] Even if, for example, you knew all your own ratings and their dates you probably couldn’t identify them reliably in the data because only a small sample was included (less than one tenth of our complete dataset) and that data was subject to perturbation. Of course, since you know all your own ratings that really isn’t a privacy problem is it?”
103
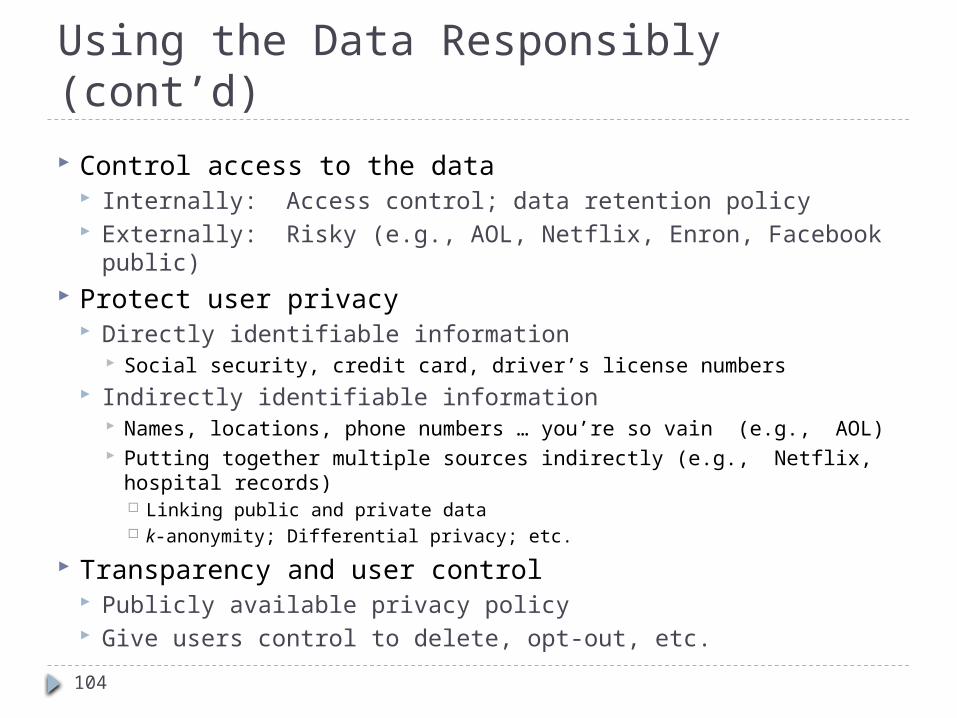
Using the Data Responsibly (cont’d)
Control access to the data Internally: Access control; data retention policy Externally: Risky (e.g., AOL, Netflix, Enron, Facebook public)
Protect user privacy Directly identifiable information
Social security, credit card, driver’s license numbers Indirectly identifiable information
Names, locations, phone numbers … you’re so vain (e.g., AOL) Putting together multiple sources indirectly (e.g., Netflix, hospital records)
Linking public and private data k-anonymity; Differential privacy; etc.
Transparency and user control Publicly available privacy policy Give users control to delete, opt-out, etc.
104
Summary Data collection and storage
Logging the data At the server On the results page Richer client-side logging
Storing the data Challenges of: time, scale, users
Using the data responsibly Controlling access to data Protecting privacy Providing transparency and user control
Data analysis [Daniel Russell] Cleaning the data
105
Section 3B: Data cleaning for large logs
Daniel M. Russell
106
Why Clean Log Data? The big false assumption: Isn’t log data intrinsically clean?
A: Nope.
107
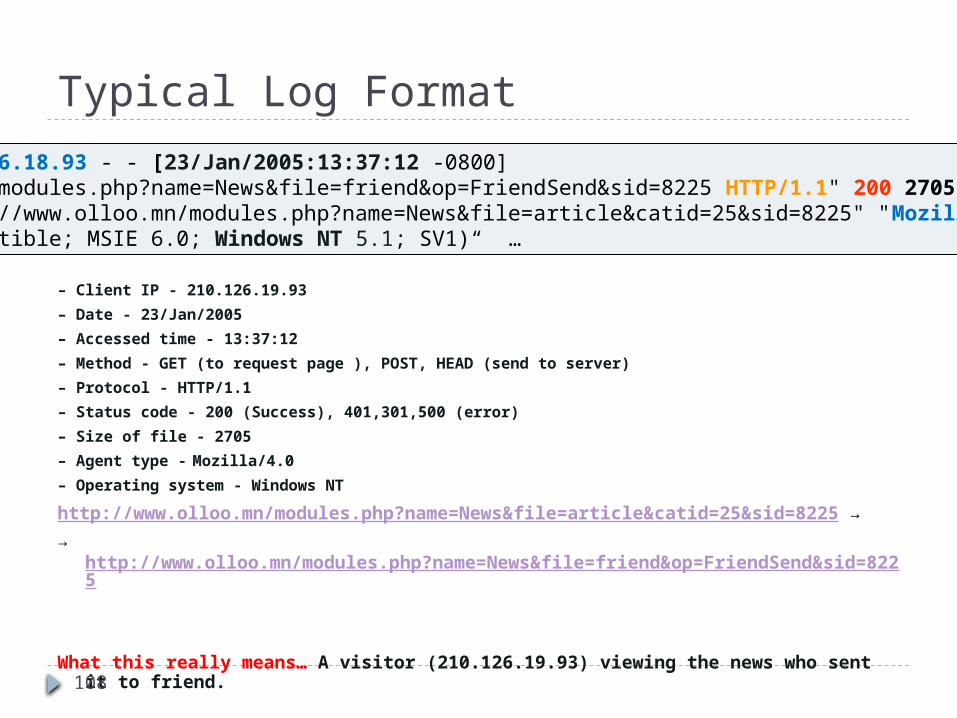
Typical Log Format
– Client IP - 210.126.19.93
– Date - 23/Jan/2005
– Accessed time - 13:37:12
– Method - GET (to request page ), POST, HEAD (send to server)
– Protocol - HTTP/1.1
– Status code - 200 (Success), 401,301,500 (error)
– Size of file - 2705
– Agent type - Mozilla/4.0
– Operating system - Windows NT
http://www.olloo.mn/modules.php?name=News&file=article&catid=25&sid=8225 → → http://www.olloo.mn/modules.php?name=News&file=friend&op=FriendSend&sid=8225
What this really means… A visitor (210.126.19.93) viewing the news who sent it to friend.
108
210.116.18.93 - - [23/Jan/2005:13:37:12 -0800]“GET /modules.php?name=News&file=friend&op=FriendSend&sid=8225 HTTP/1.1" 200 2705 "http://www.olloo.mn/modules.php?name=News&file=article&catid=25&sid=8225" "Mozilla/4.0 (compatible; MSIE 6.0; Windows NT 5.1; SV1)“ …
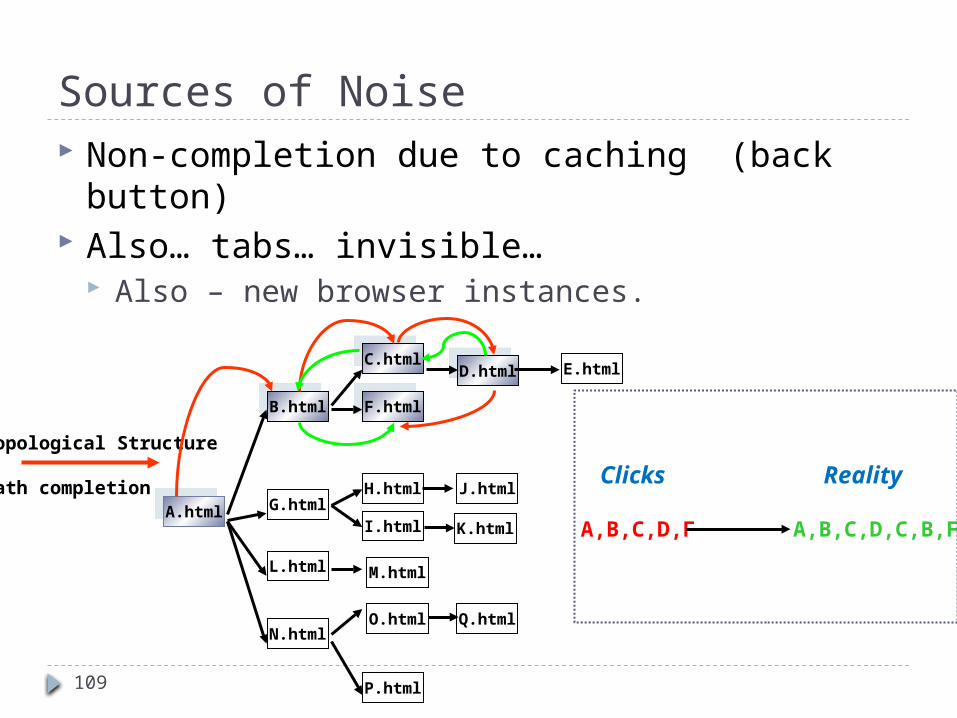
Sources of Noise Non-completion due to caching (back button) Also… tabs… invisible…
Also – new browser instances.
109
Topological Structure
Path completionA.htmlA.html
B.htmlB.html
G.html
L.html
C.htmlC.html
F.htmlF.html
N.html
D.htmlD.html E.html
H.html
I.html K.html
O.html
M.html
P.html
J.html
Q.html
A,B,C,D,F A,B,C,D,C,B,F
Clicks Reality
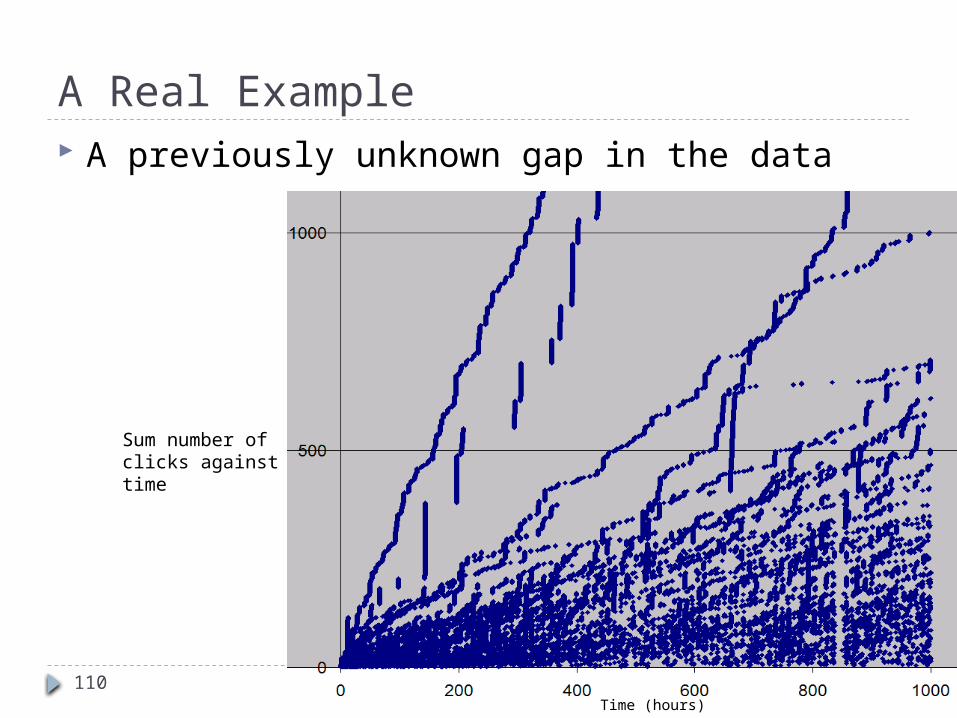
A Real Example A previously unknown gap in the data
110
Sum number of clicks againsttime
Time (hours)
What We’ll Skip… Often data cleaning includes
(a) Input / value validation (b) Duplicate detection / removal
We’ll assume you know how to do that
(c) Multiple clocks – syncing time across servers / clients
But… note that valid data definitions often shift out from under you. (See schema change later)
111
When Might You NOT Need to Clean Data? Examples:
When the data is going to be presented in ranks. Example: counting most popular queries. Then outliers
are either really obvious, or don’t matter
When you need to understand overall behavior for system purposes Example: traffic modeling for queries—probably don’t want to
remove outliers because the system needs to accommodate them as well!
112
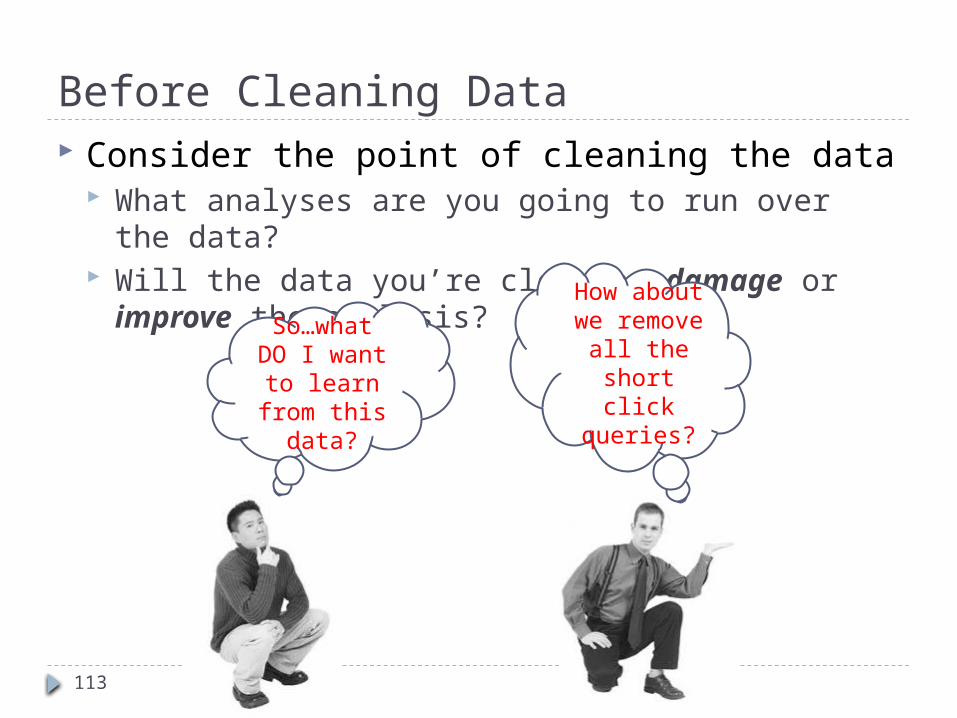
Before Cleaning Data Consider the point of cleaning the data
What analyses are you going to run over the data? Will the data you’re cleaning damage or improve the analysis?
113
So…what DO I want to learn from this
data?
How about we remove
all the short click queries?
Importance of Data Expertise Data expertise is important for understanding the data,
the problem and interpreting the results Often.. .background knowledge particular to the data or system:
“That counter resets to 0 if the number of calls exceeds N”. “The missing values are represented by 0, but the default amount is 0 too.”
Insufficient DE is a common cause of poor data interpretation
DE should be documented with the data metadata
114
Outliers Often indicative either of
Measurement error, or that the population has a heavy-tailed distribution.
Beware of distributions with highly non-normal distributions Be cautious when using tool or intuitions that assume a normal
distribution (or, when sub-tools or models make that assumption) A frequent cause of outliers is a mixture of two distributions, which
may be two distinct sub-populations
115
Outliers: Common Types from Search Quantity:
10K searches from the same cookie in one day Suspicious whole numbers: exactly 10,000 searches from
single cookie
116
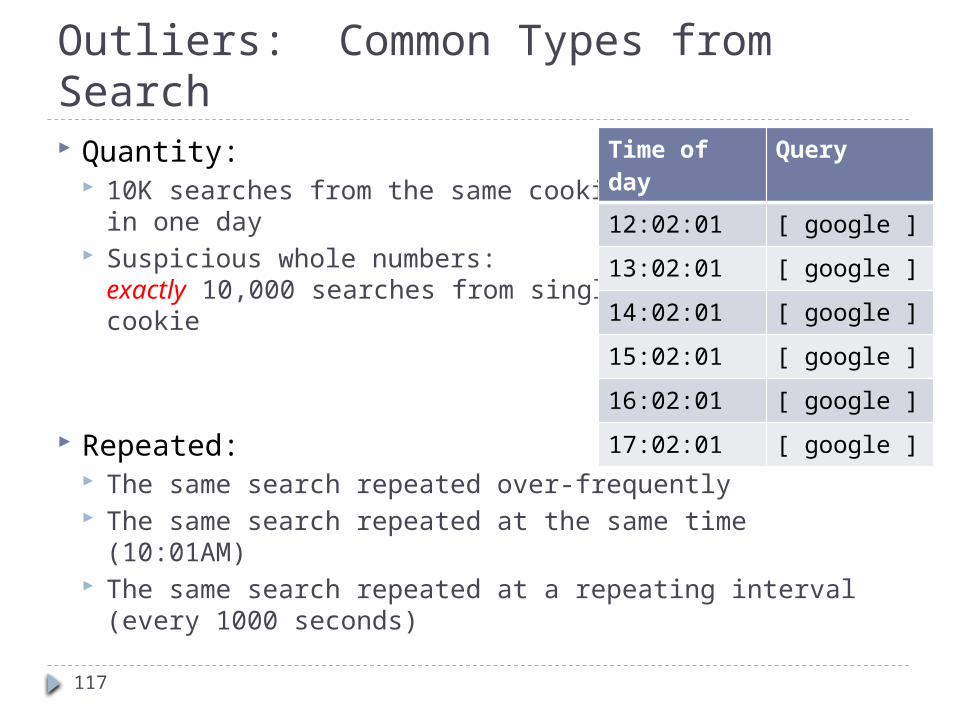
Outliers: Common Types from Search Quantity:
10K searches from the same cookie in one day
Suspicious whole numbers: exactly 10,000 searches from singlecookie
Repeated: The same search repeated over-frequently The same search repeated at the same time (10:01AM) The same search repeated at a repeating interval (every 1000
seconds)117
Time of day Query
12:02:01 [ google ]
13:02:01 [ google ]
14:02:01 [ google ]
15:02:01 [ google ]
16:02:01 [ google ]
17:02:01 [ google ]
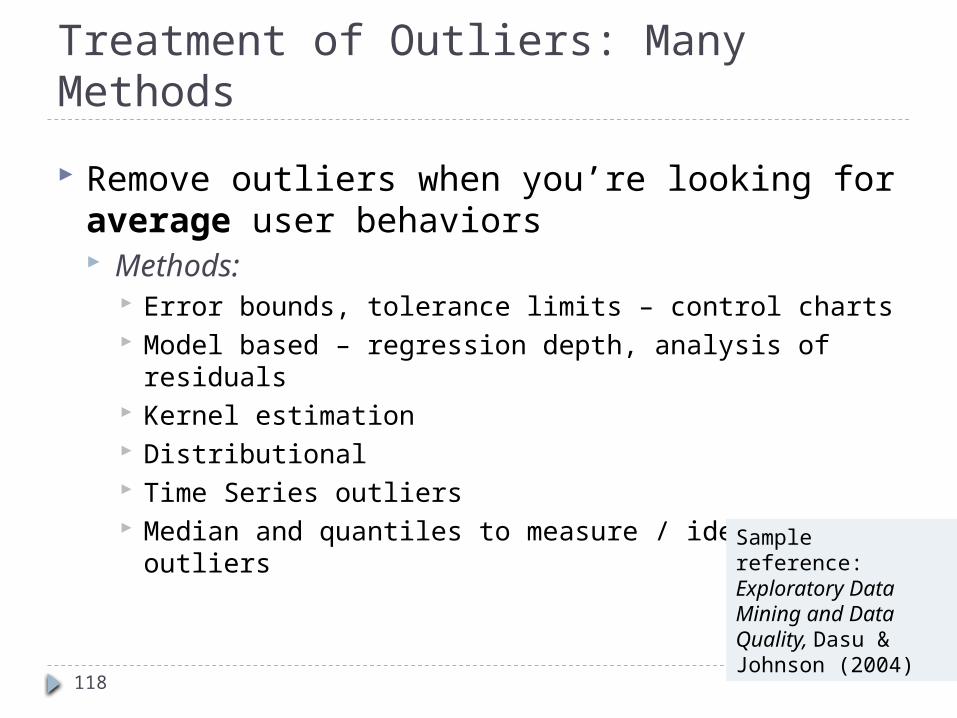
Treatment of Outliers: Many Methods
Remove outliers when you’re looking for average user behaviors Methods:
Error bounds, tolerance limits – control charts Model based – regression depth, analysis of residuals Kernel estimation Distributional Time Series outliers Median and quantiles to measure / identify outliers
118
Sample reference: Exploratory Data Mining and Data Quality, Dasu & Johnson (2004)
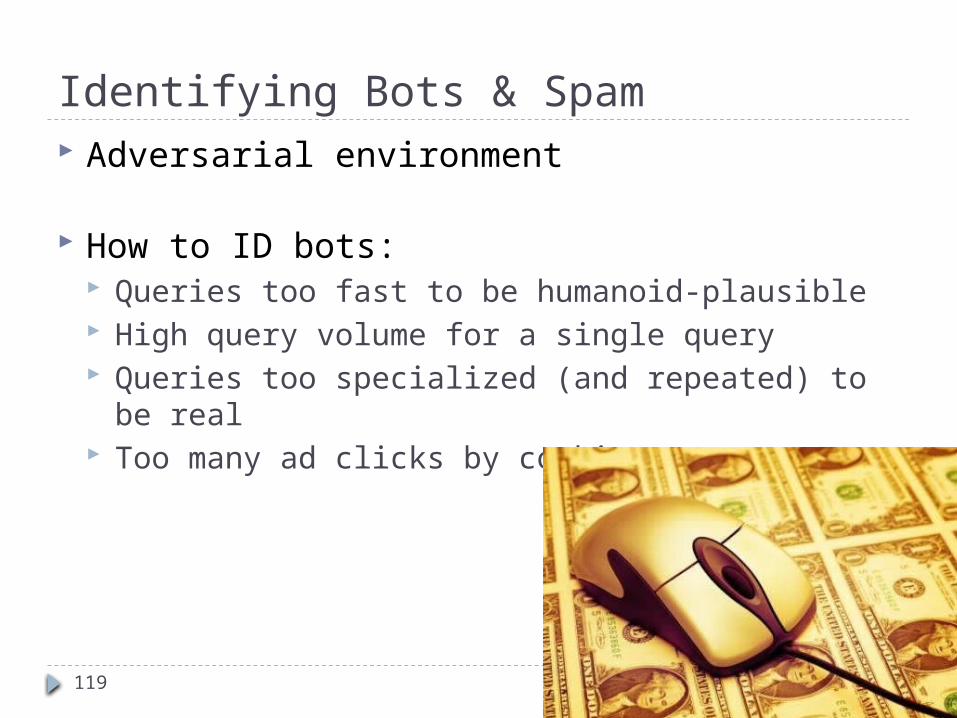
Identifying Bots & Spam Adversarial environment
How to ID bots: Queries too fast to be humanoid-plausible High query volume for a single query Queries too specialized (and repeated) to be real Too many ad clicks by cookie
119
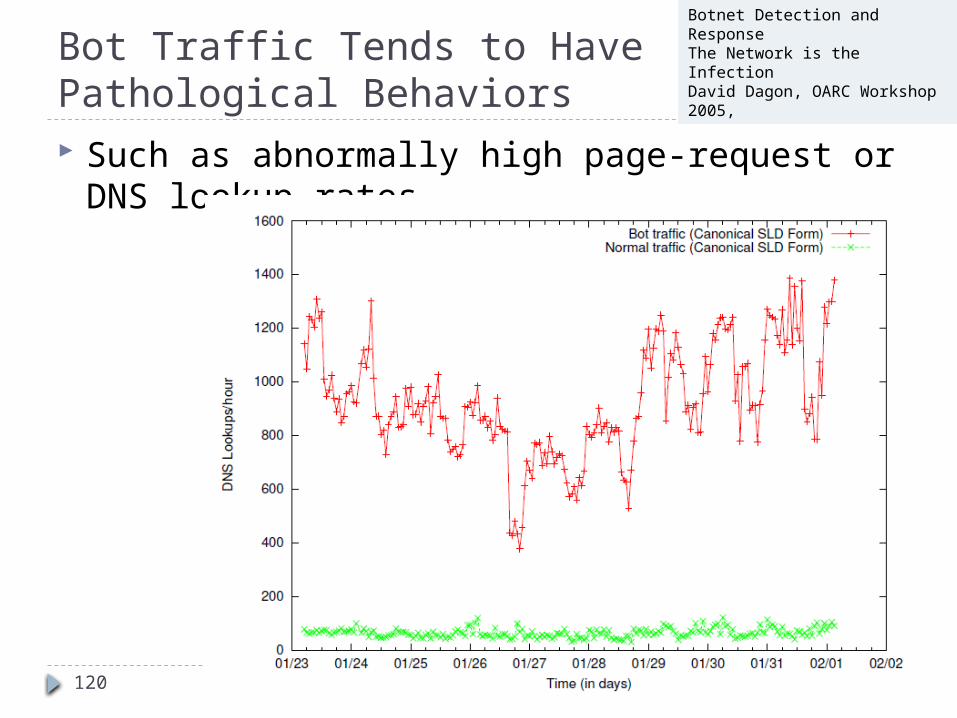
Bot Traffic Tends to Have Pathological Behaviors Such as abnormally high page-request or DNS lookup
rates
120
Botnet Detection and ResponseThe Network is the InfectionDavid Dagon, OARC Workshop 2005,
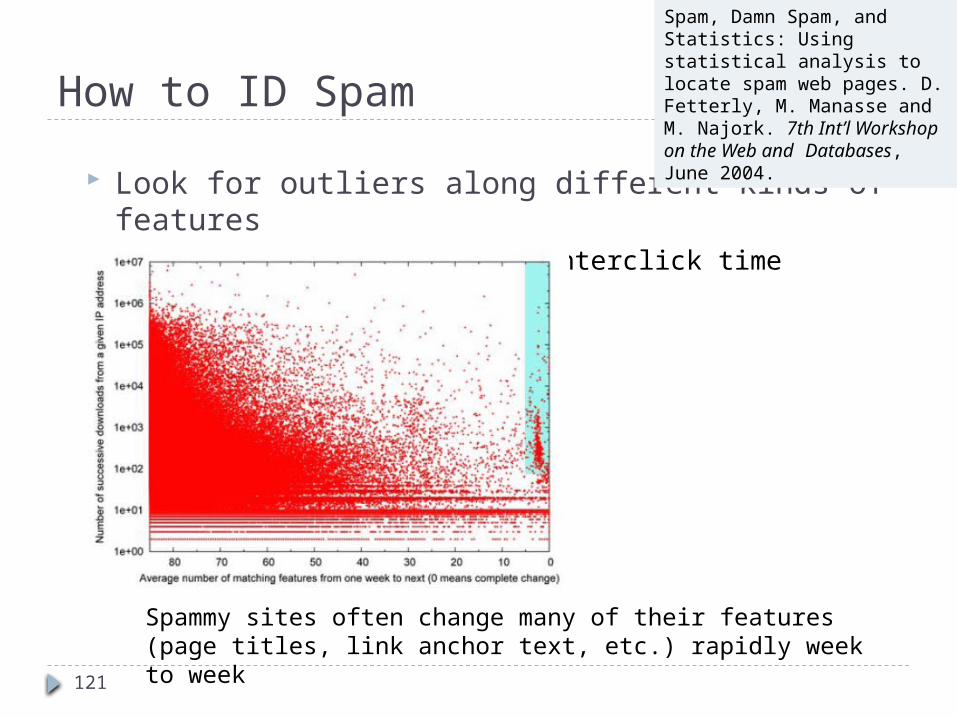
How to ID Spam
Look for outliers along different kinds of features Example: click rapidity, interclick time variability,
121
Spam, Damn Spam, and Statistics: Using statistical analysis to locate spam web pages. D. Fetterly, M. Manasse and M. Najork. 7th Int’l Workshop on the Web and Databases, June 2004.
Spammy sites often change many of their features (page titles, link anchor text, etc.) rapidly week to week
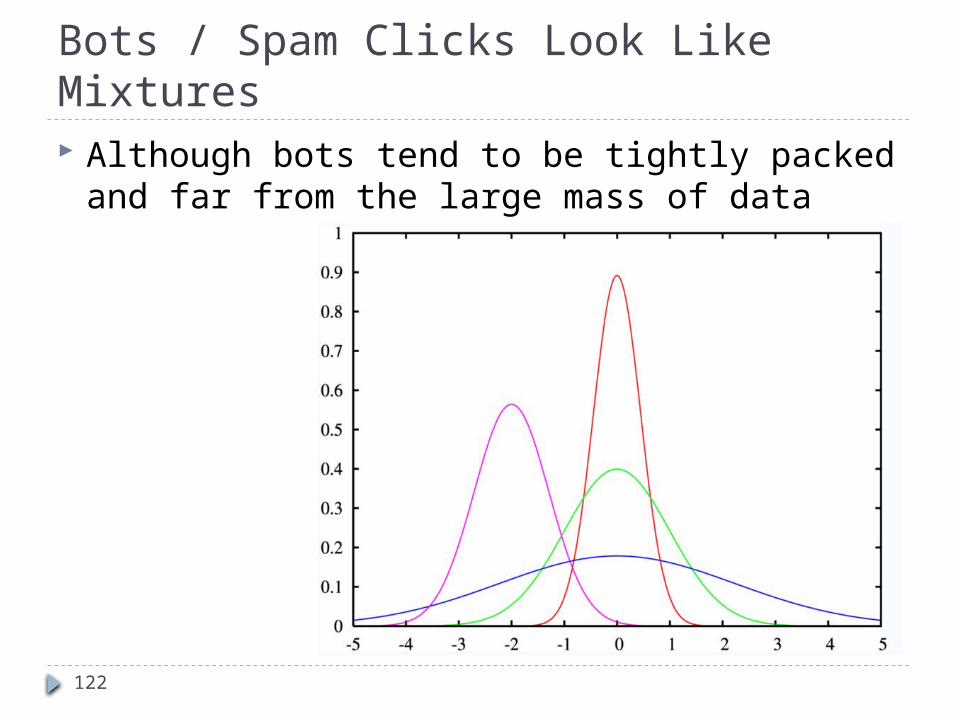
Bots / Spam Clicks Look Like Mixtures Although bots tend to be tightly packed and far from the
large mass of data
122
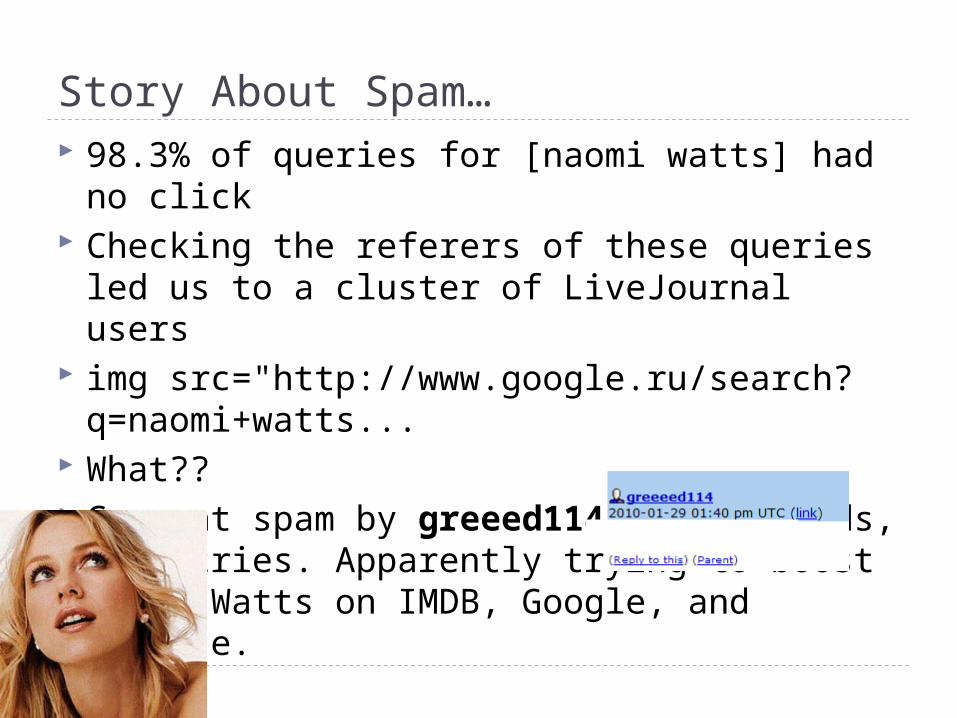
Story About Spam… 98.3% of queries for [naomi watts] had no click Checking the referers of these queries led us to a cluster
of LiveJournal users img src="http://www.google.ru/search?q=naomi+watts... What?? Comment spam by greeed114. No friends, no entries.
Apparently trying to boost Naomi Watts on IMDB, Google, and MySpace.
123
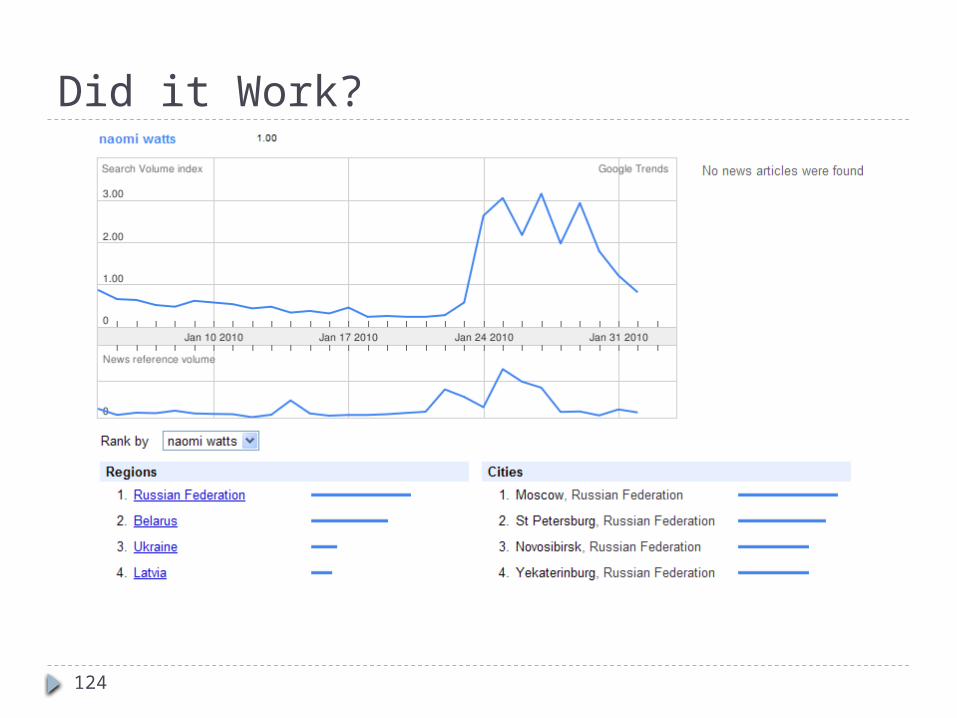
Did it Work?
124
Cleaning Heuristics: Be Sure to Account for Known Errors
Examples: Known data drops
e.g., when a server went down during data collection period – need to account for missing data
Known edge cases e.g., when errors occur at boundaries, such as timing cutoffs for
behaviors (when do you define a behavior such as a search session as “over”)
125
Simple Ways to Look for Outliers Simple queries are effective:
Select Field, count(*) as Cntfrom TableGroup by FieldOrder by Cnt Desc
Hidden NULL values at the head of the list, typos at the end of the list
Visualize your data Often can see data discrepancies that are difficult to note in
statistics
LOOK at a subsample… by hand. (Be willing to spend the time) 126
But Ultimately… Nearly all data cleaning operations are special purpose,
one-off kinds of operations
127
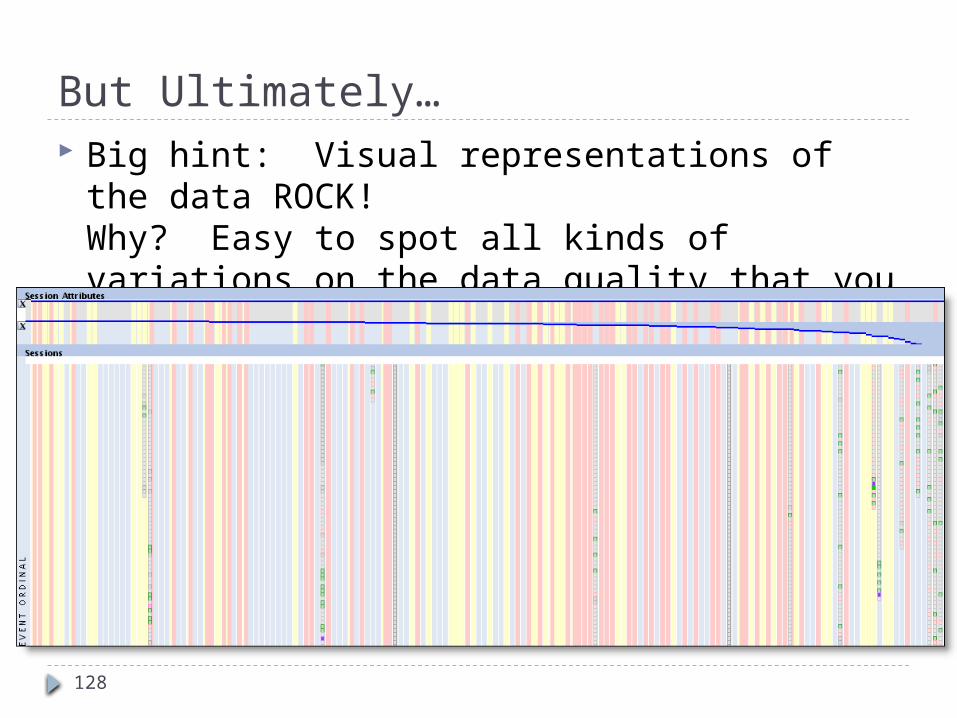
But Ultimately… Big hint: Visual representations of the data ROCK!
Why? Easy to spot all kinds of variations on the data quality that you might not anticipate a priori.
128
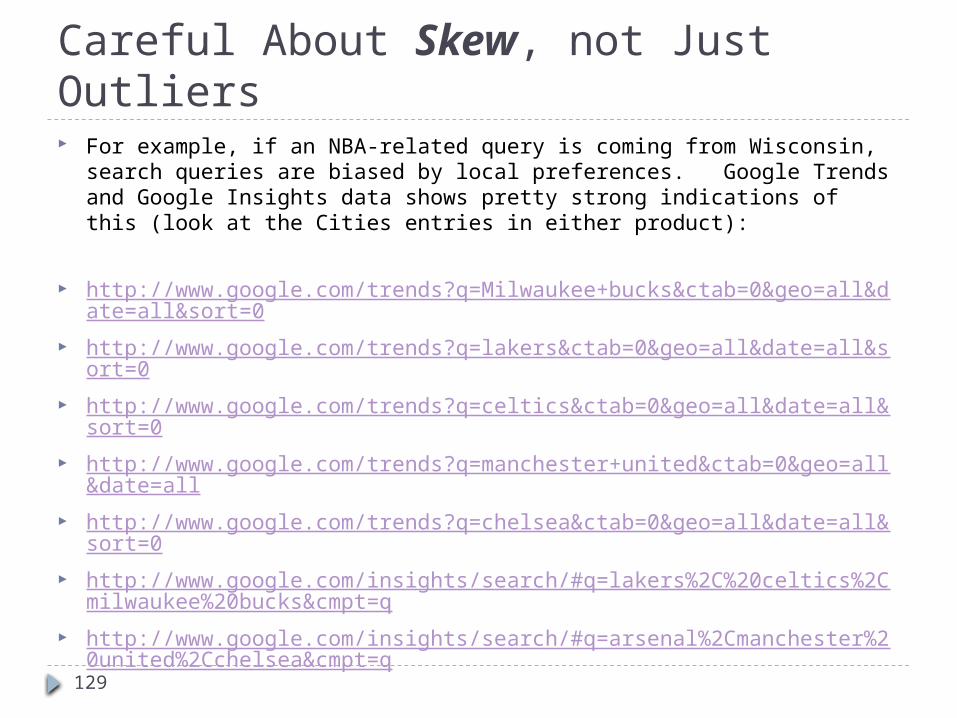
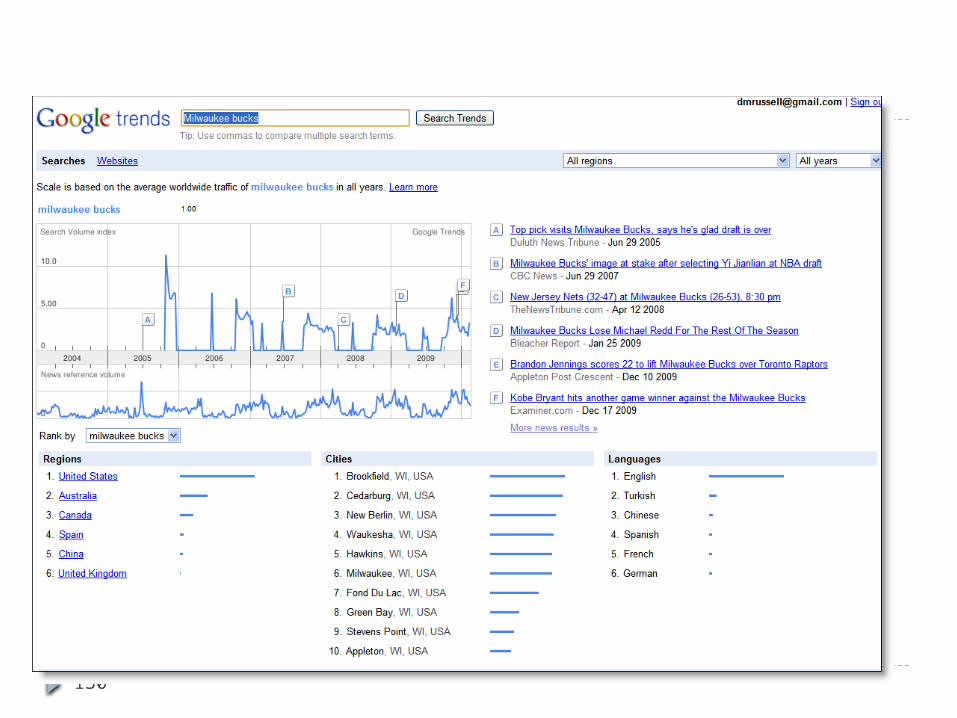
Careful About Skew, not Just Outliers
129
For example, if an NBA-related query is coming from Wisconsin, search queries are biased by local preferences. Google Trends and Google Insights data shows pretty strong indications of this (look at the Cities entries in either product):
http://www.google.com/trends?q=Milwaukee+bucks&ctab=0&geo=all&date=all&sort=0
http://www.google.com/trends?q=lakers&ctab=0&geo=all&date=all&sort=0
http://www.google.com/trends?q=celtics&ctab=0&geo=all&date=all&sort=0
http://www.google.com/trends?q=manchester+united&ctab=0&geo=all&date=all
http://www.google.com/trends?q=chelsea&ctab=0&geo=all&date=all&sort=0
http://www.google.com/insights/search/#q=lakers%2C%20celtics%2Cmilwaukee%20bucks&cmpt=q
http://www.google.com/insights/search/#q=arsenal%2Cmanchester%20united%2Cchelsea&cmpt=q
Using this data will generate some interesting correlations. For example, Ghana has a higher interest in Chelsea (because one of the Chelsea players is Ghanaian).
Similarly for temporal variations (see Robin’s query volume variation over the year)
130
Pragmatics Keep track of what data cleaning you do!
Add lots of metadata to describe what operations you’ve run (It’s too easy to do the work, then forget which cleaning operations you’ve already run.) Example: data cleaning story from ClimateGate –only the cleaned
data was available…
Add even more metadata so you can interpret this (clean) data in the future. Sad story: I’ve lost lots of work because I couldn’t remember what
this dataset was, how it was extracted, or what it meant… as little as 2 weeks in the past!!
131
Pragmatics BEWARE of truncated data sets!
All too common: you think you’re pulling data from Jan 1, 20?? – Dec 31, 20??, but you only get Jan 1 – Nov 17
BEWARE of censored / preprocessed data! Example: Has this data stream been cleaned-for-safe-search
before you get it? Story: Looking at queries that have a particular UI treatment. (Image
univeral triggering) We noticed the porn rate was phenomenally low. Why? Turns out that this UI treatment has a porn-filter BEFORE the UI treatment is applied, therefore, the data from the logs behavior was already implicitly run through a porn filter.
132
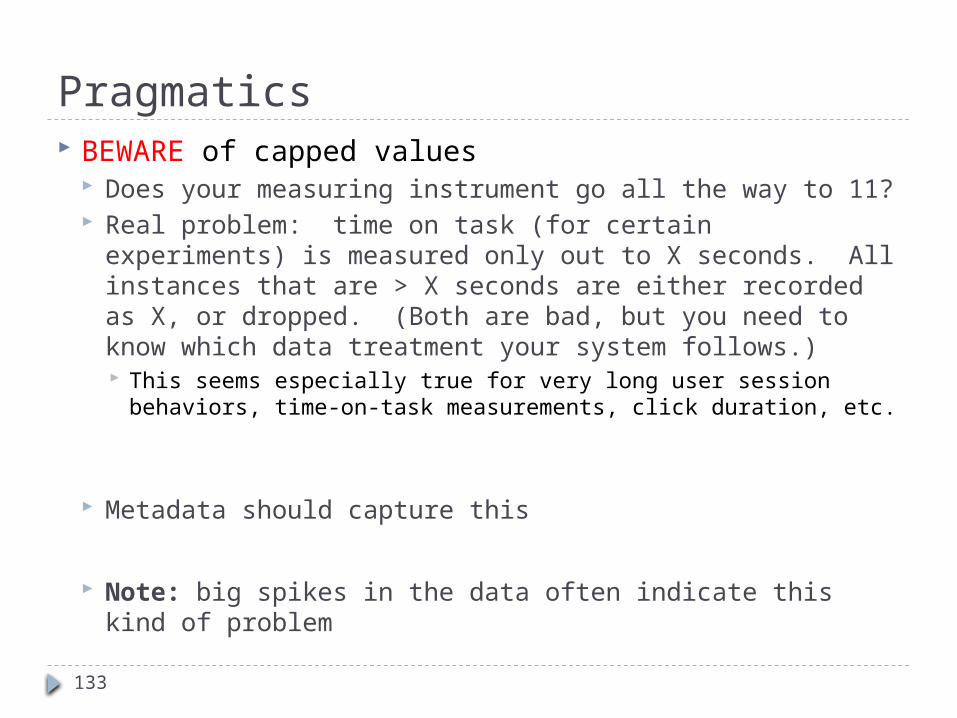
Pragmatics BEWARE of capped values
Does your measuring instrument go all the way to 11? Real problem: time on task (for certain experiments) is
measured only out to X seconds. All instances that are > X seconds are either recorded as X, or dropped. (Both are bad, but you need to know which data treatment your system follows.) This seems especially true for very long user session behaviors, time-
on-task measurements, click duration, etc.
Metadata should capture this
Note: big spikes in the data often indicate this kind of problem
133
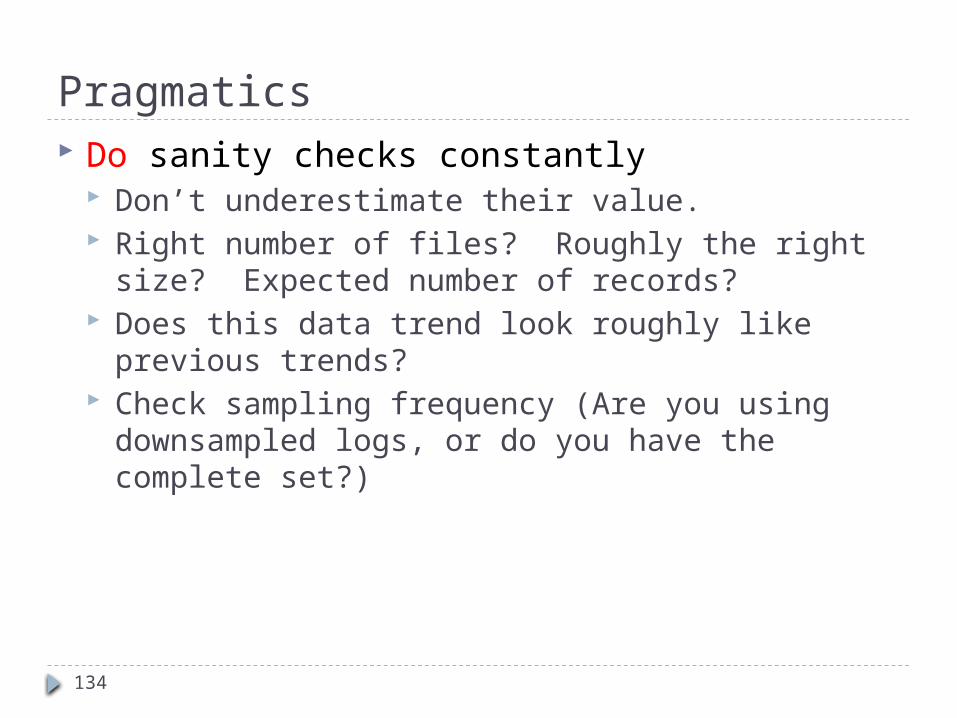
Pragmatics Do sanity checks constantly
Don’t underestimate their value. Right number of files? Roughly the right size? Expected
number of records? Does this data trend look roughly like previous trends? Check sampling frequency (Are you using downsampled logs,
or do you have the complete set?)
134
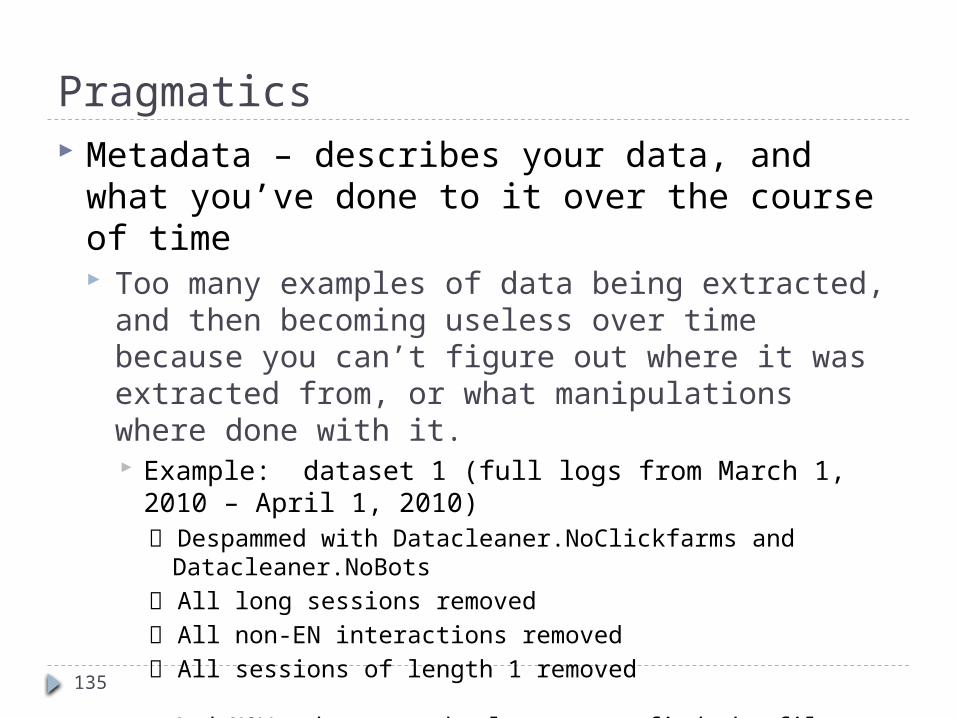
Pragmatics Metadata – describes your data, and what you’ve done to
it over the course of time Too many examples of data being extracted, and then
becoming useless over time because you can’t figure out where it was extracted from, or what manipulations where done with it. Example: dataset 1 (full logs from March 1, 2010 – April 1, 2010)
Despammed with Datacleaner.NoClickfarms and Datacleaner.NoBots All long sessions removed All non-EN interactions removed All sessions of length 1 removed
And NOW, three months later, you find the file. It’s labeled “Data.txt” Good luck.
135
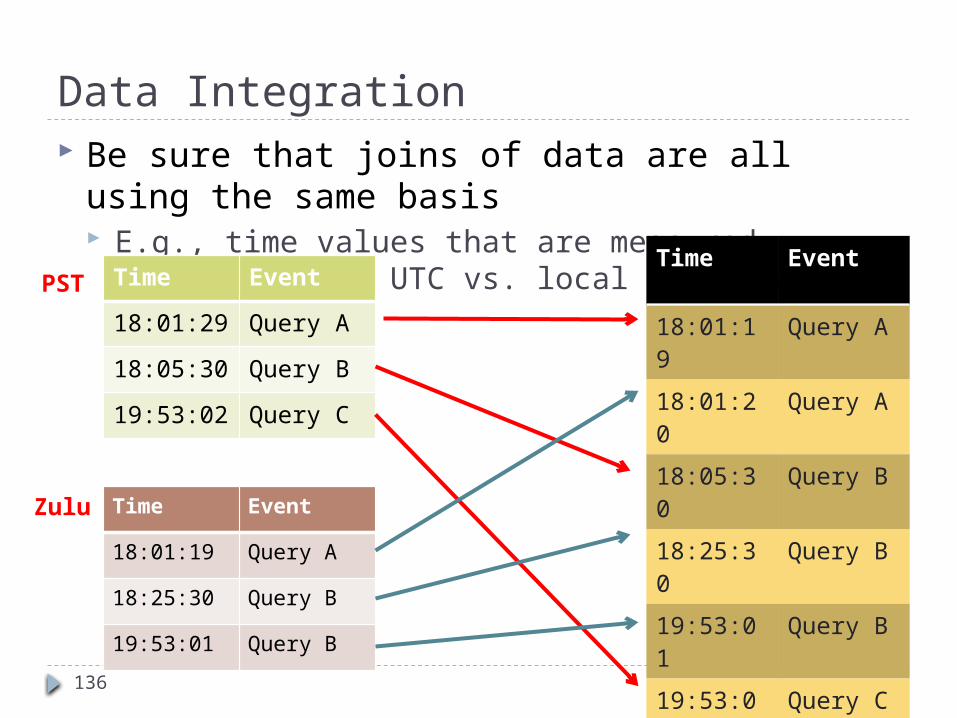
Data Integration Be sure that joins of data are all using the same basis
E.g., time values that are measured consistently – UTC vs. local timezone
136
Time Event
18:01:29 Query A
18:05:30 Query B
19:53:02 Query C
Time Event
18:01:19 Query A
18:25:30 Query B
19:53:01 Query B
Time Event
18:01:19 Query A
18:01:20 Query A
18:05:30 Query B
18:25:30 Query B
19:53:01 Query B
19:53:02 Query C
PST
Zulu
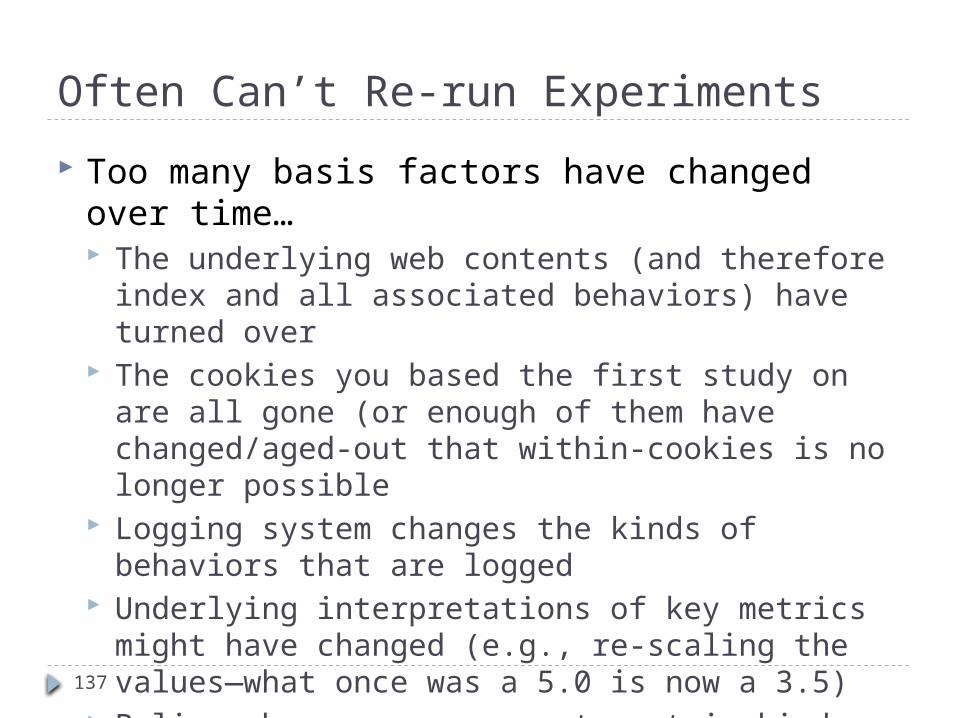
Often Can’t Re-run Experiments
Too many basis factors have changed over time… The underlying web contents (and therefore index and all
associated behaviors) have turned over The cookies you based the first study on are all gone (or
enough of them have changed/aged-out that within-cookies is no longer possible
Logging system changes the kinds of behaviors that are logged Underlying interpretations of key metrics might have changed
(e.g., re-scaling the values—what once was a 5.0 is now a 3.5) Policy changes may prevent certain kinds of data collection,
retention or interpretation
137
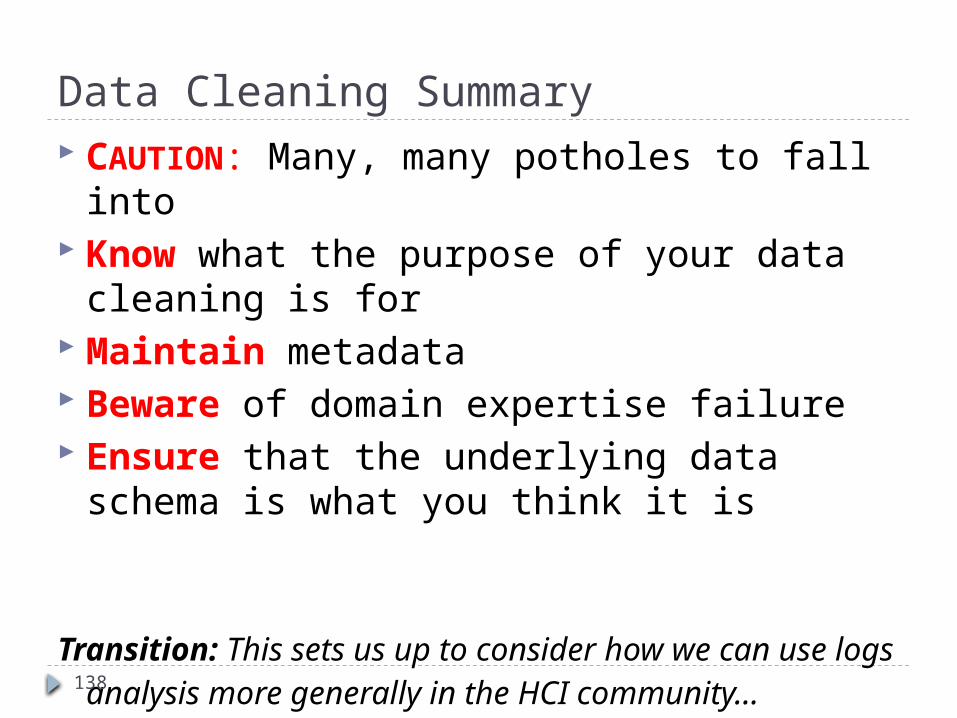
Data Cleaning Summary CAUTION: Many, many potholes to fall into Know what the purpose of your data cleaning is for Maintain metadata Beware of domain expertise failure Ensure that the underlying data schema is what you
think it is
Transition: This sets us up to consider how we can use logs analysis more generally in the HCI community…
138
Section 3C: Log Analysisand the HCI Community
All
139
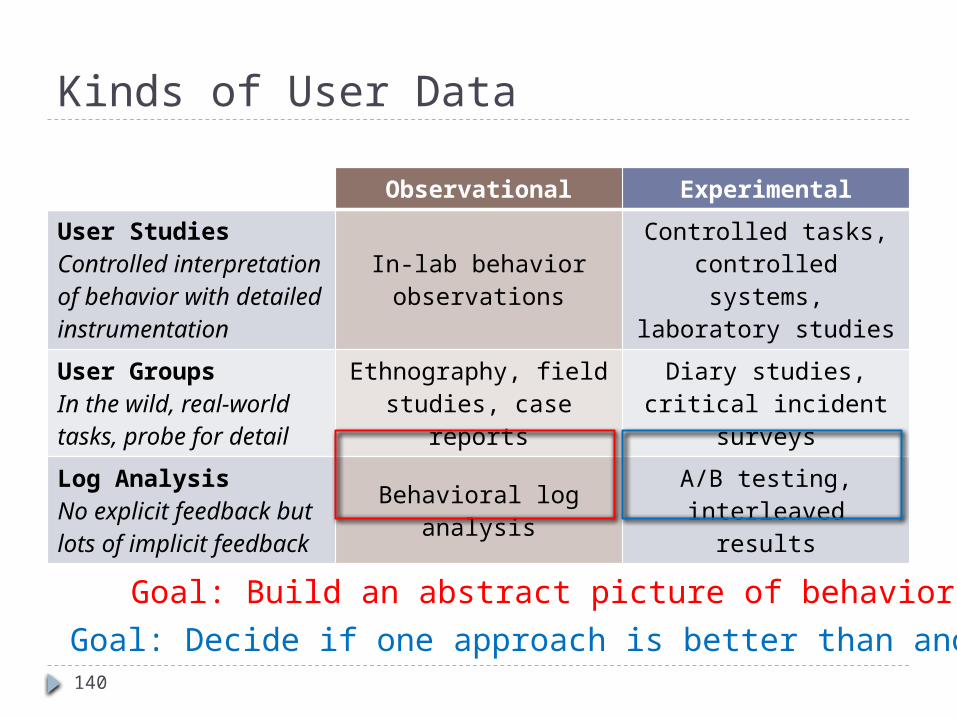
Kinds of User Data
Observational Experimental
User StudiesControlled interpretation of behavior with detailed instrumentation
In-lab behavior observations
Controlled tasks, controlled systems, laboratory studies
User GroupsIn the wild, real-world tasks, probe for detail
Ethnography, field studies, case reports
Diary studies, critical incident surveys
Log AnalysisNo explicit feedback but lots of implicit feedback
Behavioral log analysis A/B testing, interleaved results
140
Goal: Build an abstract picture of behaviorGoal: Decide if one approach is better than another
Discussion: Log Analysis and HCI Is log analysis relevant to HCI? How to present/review log analysis research
Observational Experimental
How to generate logs Sources of log data
141
Is Log Analysis Relevant to HCI?
“Know thy user” In situ large-scale log provide unique insights Real behavior
What kinds of things can we learn? Patterns of behavior (e.g., info seeking goals) Use of systems (e.g., how successful are people in using the
currrent vs. new system) Experimental comparison of alternatives
142
How to Present/Review Log Analysis Examples of successful log analysis papers
Several published logs analysis of observational type But fewer published reports of the experimental type
Determining if conclusions are valid Significance unlikely to be a problem Data cleanliness important Only draw supported claims (careful with intent)
143
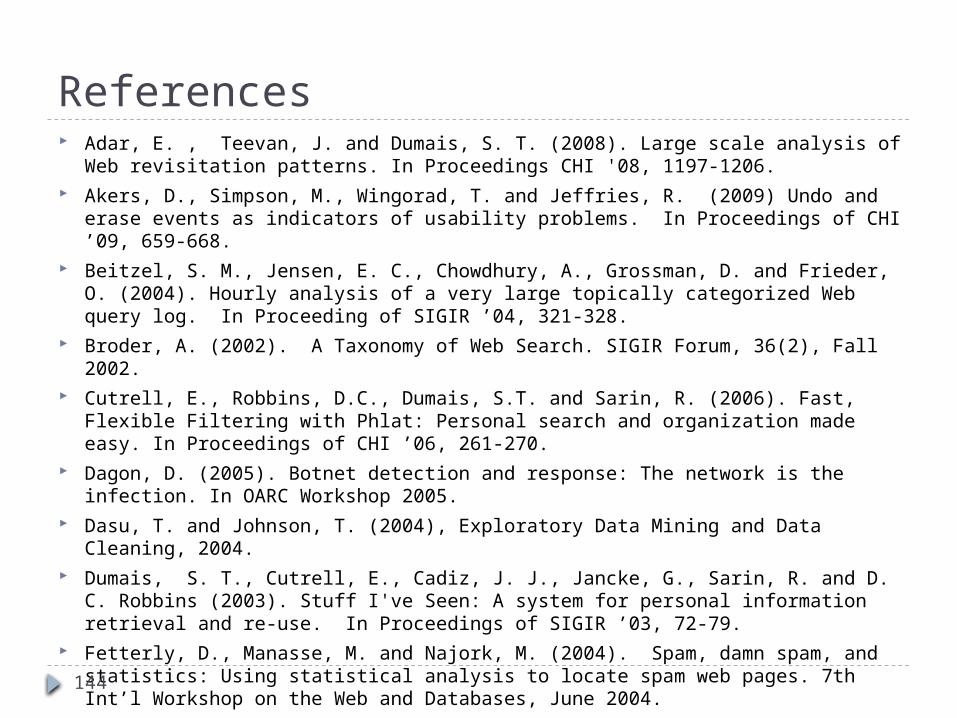
References Adar, E. , Teevan, J. and Dumais, S. T. (2008). Large scale analysis of Web revisitation patterns. In
Proceedings CHI '08, 1197-1206. Akers, D., Simpson, M., Wingorad, T. and Jeffries, R. (2009) Undo and erase events as indicators
of usability problems. In Proceedings of CHI ’09, 659-668. Beitzel, S. M., Jensen, E. C., Chowdhury, A., Grossman, D. and Frieder, O. (2004). Hourly analysis
of a very large topically categorized Web query log. In Proceeding of SIGIR ’04, 321-328. Broder, A. (2002). A Taxonomy of Web Search. SIGIR Forum, 36(2), Fall 2002. Cutrell, E., Robbins, D.C., Dumais, S.T. and Sarin, R. (2006). Fast, Flexible Filtering with Phlat:
Personal search and organization made easy. In Proceedings of CHI ’06, 261-270. Dagon, D. (2005). Botnet detection and response: The network is the infection. In OARC
Workshop 2005. Dasu, T. and Johnson, T. (2004), Exploratory Data Mining and Data Cleaning, 2004. Dumais, S. T., Cutrell, E., Cadiz, J. J., Jancke, G., Sarin, R. and D. C. Robbins (2003). Stuff I've
Seen: A system for personal information retrieval and re-use. In Proceedings of SIGIR ’03, 72-79.
Fetterly, D., Manasse, M. and Najork, M. (2004). Spam, damn spam, and statistics: Using statistical analysis to locate spam web pages. 7th Int’l Workshop on the Web and Databases, June 2004.
144
References Fox, S. , Karnawat, K. Mydland, M., Dumais, S. T. and White,T. (2005). Evaluating implicit
measures to improve Web search. ACM:TOIS, 23(2), 147-168. Jansen, B. J., Spink, A., Bateman, J. and Saracevic, T. (1998). Real life information retrieval: A
study of user queries on the web. SIGIR Forum, 32(1), 5 -17. Joachims, T. (2002). Optimizing search engines using clickthrough data. In Proceedings of KDD
’02. 133-142. Kohavi, R., Longbotham, R., Sommerfield, D. and Henne, R. M., (2009). Controlled
experiments on the Web: Survey and practical guide. Data Mining and Knowledge Discovery, 18(1), 140-181.
Kohavi, R., Longbotham, R. and Walker, T. (2010). Online experiments: Practical lessons. IEEE Computer, 43 (9), 82-85.
Kellar, M., Watters, C. and Shepherd, M. (2006). The impact of task on the usage of Web browser navigation mechanisms. In Proceedings of GI’06, 235-242.
Lau, T. and E. Horvitz, Patterns of search: Analyzing and modeling Web query refinement. In Proceedings of User Modeling ‘99, 119-128.
Narayanan, A. and Shmatikov, V. (2008). Robust de-anonymization of large sparse datasets. In Proceedings of IEEE Symposium on Security and Privacy, 111–125.
145
References Silverstein, C., Henzinger, M., Marais, H. and Moricz, M. (1999). Analysis of a very large Web
search engine query log. SIGIR Forum, 33 (1), 6-12. Tang, D., Agarwal, A. and O’Brien, D. (2010). Overlapping experiment Infrastructure: More,
better, faster experimentation. In Proceedings of KDD ’10, 17-26. Teevan, J., Adar, E., Jones, R. and Potts, M. (2007). Information re-retrieval: Repeat queries in
Yahoo's logs. In Proceedings of SIGIR '07, 151-158. Teevan, J., Dumais, S. T. and Liebling, D. J. (2008). To personalize or not to personalize:
Modeling queries with variation in user intent. In Proceedings SIGIR '08, 163-170. Teevan, J., Dumais, S. T. and Liebling, D. J. (2010). A longitudinal study of how highlighting
Web content change affects people's Web interactions. In Proceedings CHI '10, 1353-1356. Tyler, S. K. and Teevan, J. (2010). Large scale query log analysis of re-finding. In Proceedings
WSDM '10, 191-200. Viermetz, M., Stolz, C., Gedov, V. and Skubacz, M. (2006). Relevance and impact of tabbed
browsing behavior on web usage mining. In Proceedings of Web Intelligence, 262-269. Weinreich, H., Obendorf, H., Herder, E. and Mayer, M. (2006). Off the beaten tracks: Exploring
three aspects of web navigation. In Proceedings of WWW ’06, 133-142. Yates, B., Dupret, G. and Velasco, J. (2007). A study of mobile search queries in Japan. In Query
Log Analysis: Social And Technological Challenges. A workshop at WWW ‘07.
146