Embed Size (px)
Citation preview

`
Copyright
by
John DeCiucis Adamo
2018

`
The Thesis Committee for John DeCiucis Adamo
Certifies that this is the approved version of the following thesis:
On the Sustainability of Liquefied Natural Gas (LNG) as a Marine Fuel
in a Post-International Maritime Organization (IMO) 0.5% Sulfur Cap
Environment
APPROVED BY
SUPERVISING COMMITTEE:
Fred C. Beach, Supervisor
John C. Butler, Co-Supervisor
Richard J. Chuchla

`
On the Sustainability of Liquefied Natural Gas (LNG) as a Marine Fuel
in a Post-International Maritime Organization (IMO) 0.5% Sulfur Cap
Environment
by
John DeCiucis Adamo
Thesis
Presented to the Faculty of the Graduate School of
The University of Texas at Austin
in Partial Fulfillment
of the Requirements
for the Degrees of
Master of Science in Energy and Earth Resources
And
Master of Business Administration
The University of Texas at Austin
May 2018

iv
Acknowledgements
I would like to acknowledge my Thesis Committee, Dr. Fred Beach, Dr. John Butler,
and Mr. Richard Chuchla, for their enthusiasm and support during the research, analysis, and
writing phases of this thesis. I would like to thank my professors and peers in the McCombs
School of Business Full-Time MBA Program and the Jackson School of Geosciences Energy
and Earth Resources Program who have pushed me to become a better leader and energy
professional. I would like to thank all industry professionals in the shipping and LNG
communities who helped me understand the incredible opportunity for LNG to reduce long-
run operational costs and environmental impacts in the maritime industry. Lastly, I would like
to thank my incredible wife for her patience and encouragement not only during the writing
of this thesis but throughout the entire journey of graduate school.

v
Abstract
On the Sustainability of Liquefied Natural Gas (LNG) as a Marine Fuel
in a Post-International Maritime Organization (IMO) 0.5% Sulfur Cap
Environment
John DeCiucis Adamo, MSEER; MBA
The University of Texas at Austin, 2018
Supervisors: Fred C. Beach and John C. Butler
The International Maritime Organization (IMO), the leading regulatory body for the shipping
industry, recently finalized its decision to decrease the global sulfur cap for marine bunker
fuels from 3.5% to 0.5% effective January 2020 to reduce the shipping community’s
environmental impact. This decision will have significant impacts on shipowners, forcing
them to choose among a suite of options to comply with the new emissions limit, options with
substantial capital expenditure (CAPEX) or operational expenditure (OPEX) implications.
Among these options is using liquefied natural gas (LNG) as an alternative to low-sulfur fuel
oil or distillates and exhaust gas cleaning systems (EGCS). While LNG has been used in a
limited capacity as a marine fuel, mostly in passenger vessels (ferries) and LNG carriers from
the boil-off gas (BOG) in storage tanks, there are currently only 119 LNG-capable ships
operating globally (out of a merchant fleet of over 50,000). LNG fuel can effectively eliminate
nearly 100% of sulfur oxide (SOx) and particulate matter (PM) emissions, while reducing
nitrogen oxide (NOx) emissions up to 80% and greenhouse gas (GHG) emissions by up to
30%. LNG is also price competitive with other bunker fuel, making it an attractive alternative
both environmentally and economically.

vi
This thesis examines the business case for LNG-capable ships as a viable option to
meet the IMO’s sulfur cap. Specifically, the thesis compares the choice to invest in an LNG-
capable ship to investing in EGCS (enabling continued use of high-sulfur fuel oil) or using
compliant low-sulfur fuel oil or distillates (which still requires selective catalytic reduction
(SCR) or exhaust gas recirculation (EGR) systems to comply with NOx limits). The thesis
analyzes eight different vessel types across the three investment options and considers three
different fuel price scenarios, accounting for variation in CAPEX, OPEX, engine types, ship
utilization, and charter rates, for a total of 96 scenarios. Each scenario uses a discounted cash
flow (DCF) model to yield unique NPV, IRR, and payback for the investment. The thesis
demonstrates that LNG-capable vessels are competitive investments and, in some cases,
outperform other options to achieve compliance with SOx and NOx emissions limits.

vii
Table of Contents
List of Tables ....................................................................................................................................... ix List of Figures ....................................................................................................................................... x Chapter 1 – Introduction .................................................................................................................... 1
The LNG Industry .................................................................................................................... 1 What is Liquefied Natural Gas? ..................................................................................... 1
LNG Roles In Shipping ............................................................................................................ 1 IMO Emissions Rulings ............................................................................................................ 1 Thesis Statement ........................................................................................................................ 6
Chapter 2 – State of the LNG Industry ............................................................................................ 7 Macro-Level Supply & Demand Analysis .............................................................................. 7 Liquefaction And Regasification Capacity – Current & Projected ..................................... 9 LNG Prices ............................................................................................................................... 19
LNG Contract Structures ............................................................................................. 19 Effects of Liquidity on LNG Contracts and Pricing Structures ............................. 20 LNG Bunker Prices ....................................................................................................... 23
LNG Use As A Marine Fuel .................................................................................................. 23 Dual-Fuel and Gas Engine Technology Development............................................ 23 LNG Fuel Systems and Storage .................................................................................. 26 Environmental Benefits of LNG Fuel ....................................................................... 28
Chapter 3 – The Role of LNG as a Marine Fuel ........................................................................... 32 LNG-Fueled Ships – Current & Projected .......................................................................... 32
Examples of Company-Level Pursuit of LNG-Capable Ships ............................... 35 Financing Structures for LNG-Capable Ships and Other Emissions
Reductions Measures .......................................................................................... 39 Types Of Marine Fuels – Historical And Forecasted Volumes & Prices ........................ 41 The Chicken or The Egg – LNG Bunkering Networks .................................................... 47
Status of LNG Bunkering Networks .......................................................................... 48 Types of LNG Bunkering Solutions ........................................................................... 49 Regulatory and Safety Considerations for LNG Bunkering .................................... 52
Methods To Achieve IMO Sulfur Cap Compliance ........................................................... 55 Chapter 4 – The Business Case for LNG-Capable Ships ............................................................ 61
Methodology And Assumptions ............................................................................................ 61 Methodology .................................................................................................................. 61 Key Assumptions ........................................................................................................... 63
Results ........................................................................................................................................ 71 Base Case ........................................................................................................................ 73 EIA Case ......................................................................................................................... 73 Dynamic Case ................................................................................................................. 73
Sensitivity Analysis ................................................................................................................... 74 Base Case ........................................................................................................................ 76 EIA Case ......................................................................................................................... 76

viii
Dynamic Case ................................................................................................................. 76 Alternative Methodology ........................................................................................................ 78
Base Case ........................................................................................................................ 80 EIA Case ......................................................................................................................... 80 Dynamic Case ................................................................................................................. 80
Sensitivity Analysis ................................................................................................................... 80 Base Case ........................................................................................................................ 82 EIA Case ......................................................................................................................... 82 Dynamic Case ................................................................................................................. 82
Non-Compliance Considerations .......................................................................................... 84 Chapter 5 – Conclusion .................................................................................................................... 88
Summary Of Results ................................................................................................................ 88 Note on Assumptions, Shortfalls, & Areas Of Further Research .................................... 88
Appendices .......................................................................................................................................... 90 Appendix 1 – Assumptions and Model Control Page ........................................................ 90 Appendix 2 – Cost of Capital Analysis ................................................................................. 91 Appendix 3 – Price Decks ...................................................................................................... 93 Appendix 4 – Price Regression Analysis .............................................................................. 94 Appendix 5 – Business Case Analysis DCF ......................................................................... 95 Appendix 6 – Calorific Values & Conversion Factors ....................................................... 96 Appendix 7 – Fuel Cost Savings Methodology ................................................................... 97 Appendix 8 – @Risk Output Summary for Business Case Analysis DCF ..................... 98 Appendix 9 - @Risk Output Summary for Fuel Cost Savings and Net Payback to
LS Fuel Analysis ........................................................................................................... 101 Glossary ............................................................................................................................................. 103 References ......................................................................................................................................... 105

ix
List of Tables
Table 1: Summary of LNG Import and Export Terminal Capacity in North America (in
MTPA) ......................................................................................................................... 16 Table 2: Global Average LNG Netback Pricing Analysis .......................................................... 22 Table 3: LNG Bunker Pricing Estimate Based on Henry Hub ................................................. 23 Table 4: Otto and Diesel Cycle Features ....................................................................................... 24 Table 5: Gas Engine Technologies ................................................................................................. 24 Table 6: LNG Fuel Tanks Pros and Cons ..................................................................................... 27 Table 7: Environmental Benefits of LNG Fuel ........................................................................... 29 Table 8: GHG Emissions Profiles of Different Marine Fuels ................................................... 31 Table 9: LNG-Capable Newbuilds (Thousands of Gross Tons)............................................... 33 Table 10: Types of Marine Fuels .................................................................................................... 44 Table 11: Average Annual CO2-e Savings between 2018-2030 from Ship Speed Reduction 57 Table 12: Newbuild Prices for Multiple Configurations, $ in millions ..................................... 64 Table 13: Operational Expenses for Multiple Configurations, $ in millions ........................... 65 Table 14: Illustrative Utilization Factor Calculations .................................................................. 66 Table 15: Engine Type and Fuel Consumption Data .................................................................. 67 Table 16: 1-Year Time Charter Rate Equivalents by Vessel Type – 5-year Historical Average,
$/day ............................................................................................................................ 68 Table 17: Adjusted 1-Year Time Charter Rate Equivalents by Vessel Type, $/day ............... 68 Table 18: Illustrative Financing Structure and Cost of Capital Summary ................................ 69 Table 19: End of Useful Life Salvage Value, based on $/ldt ..................................................... 71

x
List of Figures
Figure 1: IMO Projections of CO2 Emissions from Maritime Transportation ......................... 2 Figure 2: Existing and Proposed Emissions Control Areas (ECA) for SOx, NOx, or Both .... 3 Figure 3: IMO Implementation of Fuel Oil Sulfur Limits ............................................................ 4 Figure 4: IMO Implementation of NOx Limits .............................................................................. 5 Figure 5: LNG Supply Forecast by Current Status ........................................................................ 7 Figure 6: LNG Export Capacity by Region 2005-2040 ................................................................. 8 Figure 7: LNG Import Capacity by Region 2005-2040................................................................. 9 Figure 8: Global Liquefaction Capacity and Utilization .............................................................. 10 Figure 9: Global Nominal Liquefaction Capacity as of January 2017 ....................................... 11 Figure 10: Types of Liquefaction Technologies ........................................................................... 12 Figure 11: North American Existing LNG Import/Export Terminals .................................... 13 Figure 12: North American Approved LNG Import/Export Terminals ................................ 14 Figure 13: North American Proposed LNG Export Terminals ................................................ 15 Figure 14: Major LNG Flows in 2016 ........................................................................................... 17 Figure 15: Global Receiving Terminal (Regasification) Capacity ............................................... 18 Figure 16: Regasification Terminal Import Capacity and Utilization Rate in 2016 and 2022 19 Figure 17: Duration of Sales and Purchase Agreements (SPAs) for LNG .............................. 20 Figure 18: LNG Landed Prices on a Netback Basis, January 2018, $/MMBtu ....................... 22 Figure 19: Number of World Merchant Fleet Ships .................................................................... 32 Figure 20: Number of Contracts and % LNG Newbuilds ......................................................... 34 Figure 21: LNG-capable ships by vessel type ............................................................................... 35 Figure 22: Marine Fuel Consumption, 2012 (MTPA) ................................................................. 41 Figure 23: Marine Fuel Consumption by Ship Type, 2012 ......................................................... 42 Figure 24: Merchant Fleet Vessel Types and Fuel Consumption, 2016 ................................... 43 Figure 25: LNG Bunker Fuel Demand at 2020 ............................................................................ 45 Figure 26: Historical Fuel Oil Prices against Oil and Natural Gas Hub Prices, $/MMBtu ... 46 Figure 27: LNG Bunkering Ports, Existing and Planned ........................................................... 48 Figure 28: LNG Supply Locations: In Operation, Decided, Under Discussion .................... 49 Figure 29: LNG Bunkering Solutions ............................................................................................ 50 Figure 30: Types of LNG Bunker Solutions ................................................................................. 52 Figure 31: CO2 Emissions Reduction Pathway 2015-2025 ......................................................... 58 Figure 32: Most Likely Pathways to Meet SOx (and NOx) Emissions Requirements ............. 59 Figure 33: Comparison of Scrubber and LNG Investments ...................................................... 60 Figure 34: Illustrative Business Case Analysis Framework w/ Key Assumptions .................. 62 Figure 35: Business Case Analysis Results for All Vessel Types and Price Scenarios ............ 72 Figure 36: Business Case Analysis Results at 50% ECA Time................................................... 75 Figure 37: Business Case Analysis Results at 100% ECA Time ................................................ 77 Figure 38: Investment Costs Results for All Vessel Types and Price Decks ........................... 79 Figure 39: Investment Costs Results at 50% ECA Time ............................................................ 81 Figure 40: Investment Costs Results at 100% ECA Time .......................................................... 83 Figure 41: Effect of Non-Compliance Penalty of $25,000/day and 100% ECA Time ......... 85

xi
Figure 42: Effect of Non-Compliance Penalty of $5,000/day and 100% ECA time ............. 87

1
Chapter 1 – Introduction
THE LNG INDUSTRY
What is Liquefied Natural Gas?
Liquefied Natural Gas (LNG) is natural gas in liquid form. To achieve this phase change,
natural gas must be cooled to -161°C (or approximately -260°F), resulting in a volume change
of approximately 600x. This allows natural gas to be more easily transported, typically by truck
or ship, to an import terminal where it is re-gasified and released into the pipeline network for
distribution. LNG is colorless and odorless and is only flammable when it reaches
concentrations between 4.5% and 16.5% in air; auto-ignition is extraordinarily rare, as a
temperature of 537°C is needed for that to occur (Foss 2012). In short, LNG is really a
competitor to the compressed natural gas (CNG) distributed through overland pipeline
networks.
LNG ROLES IN SHIPPING
LNG fuel historically has had a limited role in the shipping community. LNG carriers (the
vessels that transport LNG) have used LNG to power their propulsion systems, either fully
or in part though boil off gas (BOG). Non-LNG carriers have been slow to adopt LNG as a
fuel due to the technical challenges and additional cost of a dual-fuel ship with LNG capability
as well as the limited LNG bunkering networks (i.e. the storage and distribution systems of
the actual LNG bunker, or fuel) that currently exist. However, this is rapidly changing as the
maritime industry seeks less polluting alternatives to fuel oil.
IMO EMISSIONS RULINGS
The International Maritime Organization (IMO) is the leading regulatory body for the shipping
industry. It is responsible for setting standards related to ship design, safety, efficiency, and
environmental impacts. Just as the power sector has come under increasingly stringent
emissions standards, particularly related to sulfur oxides (SOx) and nitrogen oxides (NOx) but

2
also more recently with greenhouse gas emissions (GHG), the shipping industry is also
experiencing increasing attention on emissions. Figure 1 shows the projections of carbon
(CO2) emissions in multiple scenarios.
Figure 1: IMO Projections of CO2 Emissions from Maritime Transportation
(Source: Cames et al. 2015, p. 23)
Notwithstanding the projected increase of shipping-related carbon dioxide emissions, an
important greenhouse gas, from approximately 2.8% to over 10% of global CO2 emissions by
2050 (Wiseman 2016), the focus of the shipping community has been on reduction of SOx
and NOx in emission control areas (ECAs) to reduce pollution. As shown in in Figures 2 and
3, the IMO has instituted increasingly strict emissions standards on sulfur at a global scale
prompting the need for continual reduction in the sulfur content of fuel oils or increased

3
access to alternative fuels such as LNG to meet the new deadline of less than 0.5% sulfur by
2020 (MARPOL Annex VI Regulation 14).
Figure 2: Existing and Proposed Emissions Control Areas (ECA) for SOx, NOx, or Both
(Source: World Ocean Review 2015)
Even China is considering implementing ECAs in certain port areas in Pearl River Delta
(Hong Kong/Shenzhen and surrounding areas), the Yangtze River Delta (Shanghai and
surrounding areas) and Bohai Bay (Tianjin and surrounding areas). These ECAs are designated
by Chinese law only and are not part of the IMO’s MARPOL1 Annex VI designated areas. By
January 2019, all vessels operating within an ECA must use a fuel with a maximum sulfur
content of 0.5% (in alignment with the IMO). However, after 2020, Chinese authorities will
evaluate both the size of the ECAs and the potential benefits of 0.1% sulfur fuel or other
emissions reductions initiatives (NEPIA 2016).
1 MARPOL is the International Convention for the Prevention of Pollution from Ships

4
Figure 3: IMO Implementation of Fuel Oil Sulfur Limits
(Source: Lloyd’s Marine Register 2015, p. 6)
The IMO has also passed increasingly strict limitations on NOx emissions (MARPOL Annex
VI Regulation 13). As shown in Figure 4, Tier I and II limits apply globally and became
effective in 2000 and 2011, respectively, while Tier III limits apply only to vessels built after
January 1, 2016 and operate within North America and the Caribbean ECAs (Lloyd’s Marine
Register, April 2015, p. 8). Europe’s North Sea and Baltic Sea regions could also see
application of the Tier III limits by 2021 (DNV GL November 2017b, p. 4).

5
Figure 4: IMO Implementation of NOx Limits
(Source: DieselNet 2016)
The IMO recently finalized its decision to implement a global sulfur cap of 0.5% on all fuel
oils effective January 1, 2020, down from the 2012 level of 3.5%. The impact of this decision
is far-reaching: not only will low-sulfur distillates likely command an even greater premium
than fuel oil but also the growth of LNG availability could allow LNG capable newbuild ships
to compete. Even retrofitting current ships with exhaust gas cleaning systems (EGCS), which
comes with a significant price tag, is risky as some areas within ECAs neither allow the use of
fuel oil nor make it available in port (and can carry a significant fine if used). Thus, for the
shipowner, the investment in a dual-fuel vessel that is LNG-capable, or at a minimum LNG-
ready, is becoming more attractive.

6
THESIS STATEMENT
LNG as a marine fuel offers the shipowner community a sustainable fueling option that is
both cost effective and environmentally friendly. Given the projected supply of LNG and the
growing bunkering network worldwide, LNG fuel is a promising alternative for the global
shipping community that offers longer-term reduction in operational costs and superior
environmental performance. The following analysis will first review the macro-level trends in
LNG supply and demand, LNG-capable ship development, LNG bunkering solutions, and
marine fuel options; and, then evaluate the business case for using LNG-capable ships versus
other options to comply with emissions regulations. The goal is to determine if LNG-
capability is an attractive investment option, by how much LNG-capable ships could penetrate
the overall merchant fleet, and other factors that might limit larger-scale adoption.

7
Chapter 2 – State of the LNG Industry
MACRO-LEVEL SUPPLY & DEMAND ANALYSIS
At the end of 2016, 267 MTPA (million tonnes per annum) of LNG was traded globally. By
the end of 2017, global LNG supply trade increased to 294 MTPA, an annual growth of just
over 10% (which is faster than this century’s first decade) (IHS Markit December 2017, p. 4).
Further, liquefaction capacity could grow between 200 and 430 MTPA by 2040, to levels
between 470 and 720 MTPA depending on how the demand for natural gas develops (IHS
Markit August 2017, p. 34). As shown in Figure 5, liquefaction capacity is expected to plateau
in the early 2020’s, providing enough supply to meet current demand. However, by 2025, the
spread between supply and demand grows upwards of 250 MTPA by 2040, prompting another
wave of liquefaction projects needed to reach final investment decision (FID) in order to meet
demand in the latter half of the 2020s and into the 2030s.
Figure 5: LNG Supply Forecast by Current Status
(Source: IHS Markit August 2017, p. 53)

8
Another global LNG outlook study by Nexant has similar projections. As shown in Figure 6,
global LNG export capacity will reach about 900 billion standard cubic meters (Bscm), or
approximately 615 MTPA, at roughly 90% utilization to match demand for LNG imports. As
shown in Figure 7, on the import side, LNG regasification capacity could reach 800 Bscm (or
615 MTPA).
Figure 6: LNG Export Capacity by Region 2005-2040
(Source: Nexant 2017, p. 25)

9
Figure 7: LNG Import Capacity by Region 2005-2040
(Source: Nexant 2017, p. 24)
LIQUEFACTION AND REGASIFICATION CAPACITY – CURRENT & PROJECTED
According to Figure 8, nominal liquefaction capacity reached just under 340 MTPA in January
2017, with utilizations remaining well above 80%. Another 115 MTPA is under construction,
with most of that in the United States (57.6 MTPA) and Australia (31.1 MTPA). Liquefaction
capacity is expected to grow 35% by 2022 (IGU World LNG Report 2017).

10
Figure 8: Global Liquefaction Capacity and Utilization
(Source: IGU World LNG Report 2017, p. 20)
As shown in Figure 9, the two dominant LNG exporters are Qatar and Australia by significant
margins, with Algeria, Nigeria, Indonesia, and Malaysia in the next bracket of exporters. Russia
and the United States are currently marginal LNG exporters, but both plan to bring online
significant LNG export capacity. Russia will still deliver natural gas predominantly by pipeline,
but given competition from US and African LNG, it will leverage recent projects like Yamal
LNG to continue to put downward price pressure to compete with non-Russian LNG
imports. The United States is poised to bring on substantial capacity by the early 2020s, and,
as described in subsequent paragraphs, there could be up to four LNG export terminals in
operation in the US by the end of 2018. By 2020, the US will join Qatar and Australia as the
three dominant LNG exporters.

11
Figure 9: Global Nominal Liquefaction Capacity as of January 2017
(Source: IGU World LNG Report 2017, p. 21)
While the details of the liquefaction process are not the focus of this thesis, it is worth
mentioning the main technologies used to liquefy natural gas. As shown in Figure 10, there
are essentially two dominant technologies. First, Air Products C3MR, X, and C3MR/Split
MR processes account for nearly 80% of current liquefaction plants and 60% of the 115
MTPA under construction. Second, ConocoPhillips (CP) Optimized Cascade process
accounts for roughly 20% of current liquefaction plants but could see that market share grow
to about 30% (IGU World LNG Report 2017, p. 23). The AP C3MR process pre-cools natural
gas using propane and mixed refrigerants (MR) then utilizes a proprietary heat exchanger
technology in combination with other system components, which maximizes cooling
efficiency and offers economies of scale for large-scale liquefaction plants. On the other hand,
CP’s Cascade Process utilizes a proprietary step-down cooling process with a pure refrigerant
and compressors. This process is generally less capital intensive but not as efficient; it also
can have additional maintenance or other OPEX increases associated with the step-down
cooling components (Tusiani and Shearer 2016, pp. 320-324).

12
Figure 10: Types of Liquefaction Technologies
(Source: IGU World LNG Report 2017, p. 22)
North America, but particularly US, liquefaction capacity is projected to substantially increase
by the middle of next decade. As shown is Figure 11, there are currently 12 LNG import
terminals in the US (total of 18.835 billion cubic feet per day (Bcfd) or approximately 150
MTPA), 1 in Canada (1.0 Bcfd or approximately 8 MTPA), and 3 in Mexico (2.2 Bcfd or 17.5
MTPA). As of January 2018, there are 2 LNG export terminals operational with a total
capacity of 3 Bcfd (or approximately 24 MTPA).

13
Figure 11: North American Existing LNG Import/Export Terminals
(Source: FERC 2018)
There are also several approved import and export projects in the queue in North America.
As shown in Figure 12, there are 4 approved import terminals with a total capacity of 3.4 Bcfd
(or approximately 27 MTPA). In the US, there are 10 export terminals that have been
approved – 6 under construction with a total capacity of 8.95 Bcfd (or approximately 71.6
MTPA) and 4 not yet under construction with a total capacity of 6.79 Bcfd (or approximately
54.32 MTPA). Canada also has 4 approved export terminals not yet under construction with
a total capacity of 6.76 Bcfd (or approximately 54.08 MTPA).

14
Figure 12: North American Approved LNG Import/Export Terminals
(Source: FERC 2018)
Finally, as shown in Figure 13, there are 15 proposed LNG export terminals in the US, with
12 pending applications with FERC with a total capacity 21.782 Bcfd (or approximately 174.3
MTPA), 3 projects in pre-filing with FERC with a total capacity of 3.69 Bcfd (or approximately
29.5 MTPA), and 1 project proposed to the US Coast Guard (USCG)/US Department of
Transportation Maritime Administration (MARAD) with a total capacity of 1.8 Bcfd (or 14.4
MTPA). In western Canada, there are 2 proposed export terminals with a total capacity of
1.51 Bcfd (or approximately 12 MTPA).

15
Figure 13: North American Proposed LNG Export Terminals
(Source: FERC 2018)
The US is clearly trying to capitalize on the shale revolution by finding new markets for its
abundant gas resources, becoming a net exporter of natural gas and joining Australia and Qatar
as the top three players in the global LNG market. See Table 1 for a summary of North
American existing, approved, and proposed LNG facilities. To put US LNG export/import
capacity in the context of global gas markets, even if all this capacity was built it would
represent just a fraction of US and global natural gas demand. In 2016, global gas demand
was approximately 123,820 Bcf, or 339.23 Bcfd (IHS Markit August 2017, p. 25), with the US
at 74.22 Bcfd (EIA March 2018). Even if all the approved export facilities were brought
online, US LNG export nominal capacity would only amount to approximately 18.74 Bcfd,
with less than 10 Bcfd actually exported based on current utilization rates of 50%. With global

16
gas demand projected to increase to nearly 200,000 Bcf by 2040 (IHS Markit August 2017, p.
25), US LNG exports still represent a small fraction of overall gas demand.
Country Existing
Approved Proposed
Total Under
Construction
Not Under
Construction
FERC -
Pending
FERC
Pre-Filing
USCG /
MARAD
United
States
Import 150 3.2 24 -- -- -- 177.2
Export 24 71.6 54.32 174.3 29.5 14.4 368.12
Canada
Import 8 -- -- -- -- -- 8
Export -- -- 54.08 12 -- -- 66.08
Mexico
Import 17.5 -- -- -- -- -- 17.5
Export -- -- -- -- -- -- --
Total
Import 175.5 3.2 24 -- -- -- 202.7
Export 24 71.6 108.4 186.3 29.5 14.4 434.2
Table 1: Summary of LNG Import and Export Terminal Capacity in North America (in
MTPA)
(Source: FERC 2018)
The US is still in its infancy of exporting LNG, with Cheniere Energy’s Sabine Pass the only
operational exporter as of the end of 2017. As shown in Figure 14, much of global LNG trade
flows from Australia and Qatar, with Indonesia, Malaysia, and Russia distant seconds. Most
LNG is imported by China, India, Japan, and Korea, as well as Taiwan and the UK, countries
that either have poorly developed or no indigenous natural gas resources.

17
Figure 14: Major LNG Flows in 2016
(Source: GIIGNL 2017, p. 4)
As shown in Figure 15, global regasification capacity reached nearly 800 MTPA in January
2017; however, given that less 300 MTPA of LNG traded in 2017, receiving terminal
utilization remains under 40% as LNG continues to compete with pipeline gas. In addition,
although 82% of regasification facilities are currently located onshore, floating LNG (FLNG)
and floating storage and regasification units (FSRU) are becoming more attractive options to

18
receive LNG, as they have lower CAPEX and more flexibility to receive, reposition, and
distribute gas when needed (IGU World LNG Report 2017, pp. 46-52).
Figure 15: Global Receiving Terminal (Regasification) Capacity
(Source: IGU World LNG Report 2017, p. 46)
As shown in Figure 16, the two largest importers of natural gas are Japan and Korea, with
nearly 200 and 100 MTPA of regasification capacity, respectively, as of January 2017. This
capacity is not expected to be fully utilized, remaining in the 30% to 40% range, unless both
countries experience demand growth for natural gas that is not offset by growth in other
energy sources such as renewables, storage, or nuclear (for Japan). US import capacity will
likely stay somewhat steady, as the country expects to remain a net exporter of natural gas into
the mid-2020s. China and India will nearly double and triple regasification capacity,
respectively, as they look to source cleaner burning natural gas as a replacement for coal-fired
generation plants. These two countries also have higher regasification utilization rates, likely

19
to meet continuously the power demands of the two most populous nations. Lastly, Spain
and the UK will remain around 50 MTPA of capacity through mid-2020s.
Figure 16: Regasification Terminal Import Capacity and Utilization Rate in 2016 and 2022
(Source: IGU World LNG Report 2017, p. 48)
LNG PRICES
LNG Contract Structures
LNG delivered (or landed) prices are derived from a variety of methods, more commonly
based on either an oil-linked or natural gas hub-linked structure. If the former, the price is
based on a percentage of oil price plus the cost of liquefaction and transportation. If the latter,
the price is based on percentage of natural gas hub price plus the cost of liquefaction and
transportation. Some LNG contracts do have a hybrid structure (combining both oil and
natural gas-linked prices), but as natural gas markets, and hence LNG markets, become more
liquid, many contracts are using regional natural gas hub pricing as their basis. Hub-linked
contracts could reach over one-third of all LNG contracts by 2040 (IHS Markit August 2017,
p. 32).

20
Effects of Liquidity on LNG Contracts and Pricing Structures
As the LNG market matures and experiences a potential shift from regional trade activity to
more global trade activity, LNG contracts and pricing structures could change significantly.
For example, most LNG contracts have been on a long-term basis (upwards of 20 years) with
pricing typically reflecting either an oil-linked basis or a regional hub-linked basis. However,
as demonstrated in Figure 17, over the last five years contract duration has shifted to short
and medium-term contracts, with 20 of 30 contracts in 2017 below 5 years in length and an
average contract length of about 7 years. If this trend continues, the market could see short-
term, hub-based-contracts become the norm, particularly if oil prices rise faster than natural
gas prices.
Figure 17: Duration of Sales and Purchase Agreements (SPAs) for LNG
(Source: Poten & Partners January 2018)

21
One of the challenges with hub-based prices is the significant variation across geographies (see
Figure 18 for LNG landed prices on a netback basis2 as of January 2018). While North
America’s Henry Hub (HH), the UK’s National Balancing Point (NBP) and Europe’s Title
Transfer Facility (TTF), and Asia’s Japan-Korea Marker (JKM) are the most prominent
reference points for hub-based pricing, typically on a regional basis, the growing liquidity of
the LNG spot market could potentially create a more global pricing basis. Just as Singapore’s
IFO 380 or IFO 180 act as a global benchmark for fuel oil, the Singapore Exchange (SGX)
LNG benchmark could become a global benchmark for LNG prices. Another option could
be to take a “basket,” or weighted average, of hub prices to determine a global LNG price. A
global benchmark price for LNG likely will not happen until the market reaches a sufficient
level of liquidity, but even then, pricing LNG bunker will likely still be closely related to
regional LNG costs.
2 Netback Basis is defined as the natural gas price at market destinations less the costs of pipeline transportation,
regasification, transportation (shipping) and liquefaction.

22
Figure 18: LNG Landed Prices on a Netback Basis, January 2018, $/MMBtu
(Source: FERC 2018)
As shown in Table 2, since 2012 LNG netbacks have fallen significantly due to a glut in the
LNG market but started to recover in 2017 and are continuing to rise into 2018, a positive
trend for exporters seeking an arbitrage opportunity.
Table 2: Global Average LNG Netback Pricing Analysis
(Source: Bloomberg Intelligence 2018)

23
LNG Bunker Prices
LNG bunker price is a function of several costs associated with the full supply chain, from
natural gas production and procurement, through liquefaction and delivery to the bunkering
source, whether that be a truck, vessel, or storage tank in or near a berthing area. The most
practical way to price LNG bunker is to base it off natural gas hub prices and layer on
subsequent supply chain costs. Table 3 represents a baseline scenario for North American
(and other regions if Henry Hub basis is used) LNG bunker.
LNG Bunker Pricing Estimate (Henry Hub-based), Units in $/MMBtu
Henry Hub Price $3.00
Procurement Charge 15% of Hub ($0.45)
Liquefaction $3.00
Storage / Transport $1.00
Total pre-Delivery $7.45
Bunkering (Shore/Truck/Vessel) $3.00
Total at-Delivery $10.45
Table 3: LNG Bunker Pricing Estimate Based on Henry Hub
(Source: Harsema-Mensonides 2018)
Similar LNG bunker price build-outs could be done using the above format for different
regions. For the business case analysis discussed in a subsequent section, a Henry Hub basis
for LNG bunker is assumed.
LNG USE AS A MARINE FUEL
Dual-Fuel and Gas Engine Technology Development
Engine types suitable for LNG use include either gas only or dual-fuel engines. Gas only and
dual-fuel engines have only become commonplace in the last decade or so (particularly for
non-LNG Carrier vessels) as more shipowners want flexibility in fuel options as environmental

24
regulations became stricter. Pure gas engines run on the Otto cycle while dual-fuel run on
Diesel and Otto cycles when operating in those respective modes. The main manufacturers
of these engine types include Wärtsilä, MAN, Winterthur (WinGD), and Caterpillar (MAK).
Whether the engine is gas only or dual fuel, those that operate on four-stroke Otto cycle meet
IGF-Code requirements for the ‘inherently safe’ engine room (as it operates under low
pressure). However, two-stroke engines are more common and are available for both fuel
scenarios (DNV GL October 2015a). Tables 4 and 5 provide a summary of the Diesel and
Otto Cycle features as well as gas turbine and dual fuel engine technologies.
Cycle Fuel Injection Ignition
Otto Gas-air mix admitted to the
cylinder before the compression starts Typically, an electric spark or
injection of pilot oil
Diesel Fuel admitted to the cylinder first at the
end of the compression stroke Self-ignition of the fuel (compression ignition)
CC DF Gas mode – Otto cycle process
Diesel mode – Diesel cycle process
Gas mode – injection of pilot fuel oil into the compressed mixture of air/natural gas Diesel Mode – compression ignition
Diesel Cycle DF
Gas and diesel modes – fuel admitted to the cylinder first at the end of the
compression stroke
Gas mode – pilot fuel is injected and self-ignites; gas is then injected into the flame
from the pilot oil
Table 4: Otto and Diesel Cycle Features
(Source: Adapted from IMO 2016, p. 75)
Feature Pure Gas Turbine DF 2-Stroke DF 4-Stroke
Cycle Otto Otto/Diesel Otto
Gas Supply Low Pressure Low/High Pressure Low Pressure
Ignition Source Spark Plug Liquid Pilot Fuel Liquid Pilot Fuel
Table 5: Gas Engine Technologies
(Source: Adapted from IMO 2016, p. 75)
Wärtsilä. Wärtsilä is one of the leading manufacturers of 4-stroke dual-fuel (DF) engines. Its
engines provide maximum fuel flexibility with the ability to burn natural gas, marine diesel oil
(MDO), and heavy fuel oil (HFO), seamlessly switching between fuels without any loss of

25
power. Originally designed for use on LNG carriers, its DF engines are now being used on
cruise ships, Roll-on/Roll-off and Roll-on/Passenger (RoRo/RoPax) vessels, offshore
support vessels (OSVs), and ferries (most notably Viking Line). The DF engine family has
been operating for nearly 20 years, with over 1,300 engines at more than 12 million hours of
run time and are NOx Tier III compliant (thus no additional need for selective catalytic
reduction (SCR) or exhaust gas recirculation (EGR) systems – systems discussed in a later
section). The company also provides full ship designs for LNG-capable containerships,
oil/chemical tankers (up to Aframax or 111k-deadweight tonne (dwt) size), and LNG bunker
vessels and tugs (Wärtsilä 2018).
MAN. German marine engine manufacturer, MAN, also is a leading technology solutions
provider in the dual fuel specification. The company has both a two-stroke, low-speed, high-
pressure gas injection (ME-GI) version and a 4-stroke, medium speed dual-fuel engine. The
two-stroke engine builds upon the successful Tier II NOx compliant diesel engine platform by
adding a gas-injection capability that meets Tier III NOx standards in gas mode with the
addition of either a SCR or EGR. The 4-stroke engine configurations – the 35/44DF and
51/60DF – offer ultimate fuel flexibility with the ability to burn HFO, MDO, MGO, and
natural gas. In liquid fuel mode, the engine is Tier II NOx compliant, and in gas mode the
engine is fully Tier III NOx compliant. These engines are best suited for ferries, Roll-on/Roll-
off (RoRo), cruise ships, and OSVs (MAN 2018).
Winterthur G&D. Swiss marine engine manufacturer, WinGD, also provides LNG-capable
dual fuel engines to support cleaner engine options for shipowners. As mentioned above,
there are essentially two technology options for low-speed engines: either a ‘lean burn’ dual-
fuel (DF) gas engine at low-pressure utilizing the Otto cycle, or a gas-diesel engine at high-
pressure utilizing the diesel cycle. WinGD is a leading manufacturer in low-speed, low-
pressure DF Otto-cycle engines; its X-DF line, ranging from 4.775 to 63.840 MW, currently
has 43 orders for a range of vessel types, including four 15,000-dwt product tankers. WinGD
decided to pursue these engine types due to the reduced CAPEX, OPEX, and efficiencies of

26
a two-stroke, low-speed engine, as well as the elimination of the need for an SCR or EGR to
meet IMO Tier III NOx limits while operation in gas-mode (Tier II limits would be met only
in diesel mode, hence, the need for an SCR/EGR). CAPEX reductions are due to the
elimination of the need for high-pressure compressors plus an adequate supply base for parts.
Its X-DF line achieves efficiencies from three key components: the gas admission, pilot fuel,
and automation and control systems. Of note is the hydraulically actuated gas admission
valves (GAVs), which increases overall fuel delivery performance and functionality. The X-
DF engine has been tested for over 3000 hours in almost exclusively gas-mode on the MT
Ternsund (a 15,000-dwt chemical tanker), meeting or exceeding commercial expectations (Ott
2017).
Caterpillar (MAK). Lastly, MAK also provides DF technology for shipowners. Its M34DF
and M46DF engines offer Tier II and Tier III compliance in diesel and gas modes, respectively,
and can burn HFO, MDO, MGO, and LNG, eliminating the need for scrubber use in ECA
areas. The engines offer superior energy efficiency design index (EEDI) performance (this
concept is described in a later section) and an overall lower OPEX (Caterpillar 2018).
LNG Fuel Systems and Storage
There are three types of LNG tanks for marine use: Type A/membrane; Type B/spherical;
and Type C/cylindrical. Type A and B tanks are generally prismatic in shape and can more
easily be fitted to a ship’s hull. LNG carriers typically use membrane tanks or Type B tanks
(the spherical Moss Rosenberg design); however, both A and B tanks need a secondary barrier
to prevent release of LNG in the event of tank failure. Type C tanks do not require this
secondary barrier. In addition, Type C tanks can function under much higher pressures,
managing BOG issues more effectively than A or B tanks (World Ports Climate Initiative,
N.D.). Table 6 provides a summary of the three types of LNG tanks.

27
Tank Description Pressure Pros Cons
A
Prismatic tank, adjustable to hull
shape; full secondary barrier
<0.7 bar g
Space-efficient Boil-off gas handling
More complex fuel system High costs
B
Prismatic tank, adjustable to hull
shape; partial secondary barrier
<0.7 bar g
Space-efficient Boil-off gas handling
More complex fuel system High costs
Spherical tank; partial secondary barrier
Reliably proven in LNG carriers
Boil-off gas handling. More complex fuel system
C Pressure vessel,
cylindrical with dished ends
>2 bar g
Allows pressure increase Simple fuel system Little maintenance Easy installation
Lower costs
On board space requirements
Table 6: LNG Fuel Tanks Pros and Cons
(Source: Adapted from World Ports Climate Initiative, N.D.)
The most common LNG fuel tank aboard ships and for small-scale storage is the Type-C
LNG tank. These tanks are low cost, easy to scale, and can withstand pressures of up to 10
bar (roughly 10 atm). According to IGF Code, Type C tanks must have a minimum holding
time for BOG of 15 days, 21 days as per USCG rules (IMO 2016, p. 73). However, their
cylindrical shape makes it harder to accommodate in valuable ship space; add to that insulation
and the space requirement becomes even greater. In addition, since LNG has about 1.6 times
less energy than fuel oil per unit of volume, tanks need to be larger to accommodate this energy
density difference. Therefore, incorporating LNG fuel storage into retrofits or newbuilds
often results in a space requirement of 3-4 times what would be needed for fuel oil or marine
diesel (Harsema-Mensonides 2017).
Insulation is critical for the performance of Type C tanks and must combat against the effects
of conduction (minimize touch points), convection (maximize vacuum environment), and,
most importantly, radiation (ensure excellent insulation). Type C tanks have a choice of three
insulation materials. Polyurethane foam has the highest conductivity, so it needs to be quite

28
thick (~800mm) to achieve maximum insulation effects. Perlite (a bulk filler) is cheap but it
is notorious for settling because of its weight, creating voids in insulation. It also requires
about 250mm of thickness around the tank. Multilayer insulation (MLI) has become the
choice for mobile platforms, requiring only about 10-15mm thickness. MLI has the effect of
reducing total additional insulation weight by up to 25 tonnes per tank. Incorporation of
effective insulation is critical in LNG-capable newbuild design (Kogan 2017).
On the fuel delivery system side, several companies offer turnkey and customized solutions.
MAK offers fully integrated DF engines, fuel delivery, storage, and regasification systems.
MAN also offers LNG fuel delivery systems.
ACD USA – High-Pressure Fuel Delivery System. ACD is a leading provider of centrifugal and
reciprocating cryogenic fuel pump systems for LNG-fueled ships as part of its clean energy
solutions initiative. ACD’s pumps can support both low-pressure and high-pressure engine
types, as well as fuel delivery systems on LNG bunker vessels (ACD 2018).
TGE Marine Gas Engineering. TGE Marine is a leading provider of LNG fuel delivery systems.
It provides integrated solutions utilizing Type C storage tanks, and fuel gas systems for both
2-stroke and 4-stroke main engines including the four companies listed above. Vessel types
include tankers, containerships, very large ore carriers (VLOC), and RoRo/RoPax/ConRo
configurations. TGE also successfully completed the retrofitting of the Wes Amelie, a 1,000
twenty-foot equivalent unit (TEU) container feeder vessel that operates in the North and
Baltic Seas. This was one of the first successful conversions of a ship to LNG-capability, with
TGE providing components for the LNG fuel gas plant, storage tanks, and control and safety
systems (TGE Marine 2018).
Environmental Benefits of LNG Fuel
LNG fuel is one the cleanest burning fuels across the emission spectrum. As shown in Table
7, LNG emits virtually no SOx or particulate matter (PM), reduces NOx by up to 85% with a

29
low-pressure engine (meeting Tier III requirements) and up to 40% with a high-pressure
engine, and reduces CO2 emissions by up to 30%. While some LNG-capable engine
configurations will require NOx reduction technology, such as a selective catalytic reduction
(SCR) or an exhaust gas recirculation (EGR) system, there are 4-stroke (low-pressure) engines
that can meet Tier III NOx limits without other technology. However, low pressure, 2-stroke
engines are likely the way forward as larger ships integrate dual-fuel LNG capable technology.
Table 7: Environmental Benefits of LNG Fuel
(Source: DNV GL October 2015a, p. 33)
While the primary focus of this thesis is focused on technology options to reduce SOx, it is
worth mentioning some NOx reduction technologies as they are often complementary to SOx
emissions reduction solutions. As mentioned above, the two main NOx reduction
technologies are SCR and EGR. SCR technology works by injecting urea into the stack where
it reacts with exhaust on the surface of a catalyst (typically titanium or vanadium oxides). Since
the exhaust reacts external to the combustion process, engine efficiency is not compromised
but operational costs increase. EGR technology works primarily with two-stroke engines and
recirculates exhaust back through the combustion chamber, lowering the overall combustion
temperature, which reduces NOx by 70-80%. However, these systems do not address SOx and
PM directly, but rather with a water treatment process in addition to the scrubber, adding to
total operational costs. SCR technology is the most likely solution for reaching Tier III
compliance with 4-stroke engines, while SCR or EGR can apply to 2-stroke engines that burn
fuel oil or low sulfur distillates. However, LNG offers a Tier III solution without the need
for an SCR or EGR (Nishifuji 2017).

30
To meet SOx emissions targets, low sulfur distillates such as marine gasoil (MGO) will be the
likely options. However, this fuel type has several issues operating in existing engines such as
lower viscosity, poorer lubrication, lower flash and volatility points, and increased sediment
buildup in the cylinder. While there are several remedies to these issues, the use of exhaust
gas cleaning systems (EGCS), or scrubbers, has become the solution of choice for shipowners.
While they do have relatively high capital costs (+/- $5 million), scrubbers can reduce sulfur
content of emissions to the equivalent of using 0.1% sulfur fuel oil, which is consistent with
the ECA limit, while simultaneously reducing PM by 70-80%. Scrubbers are divided into two
categories – wet and dry. Wet scrubbers use treated water to clean exhaust gas and come in
open, closed, and hybrid loop systems, whereas dry scrubbers use a reactant like sodium or
calcium hydroxide to remove SOx. Wet scrubbers are more available but both types add
significant CAPEX and OPEX to a shipowner, especially in handling and disposal of waste.
Overall, scrubbers might be the most economical choice in a low fuel oil price and high
distillate price environment. However, as LNG-capable engines, fuel systems, and bunkering
networks develop, LNG fuel could gain greater market share because of its price
competitiveness and environmental benefits (Nishifuji 2017).
As shown in Table 8, LNG-capable vessels are also much more competitive in reducing GHG
emissions. LNG fuel can lower CO2-e emissions by up to 25-30%. However, one of the
critical issues facing dual-fuel engines is ‘methane slip,’ which is an imperfection in the Otto
cycle that allows methane to escape through the exhaust system unburned. Since methane has
a higher global warming potential than CO2, unmitigated methane slip can offset the GHG
reduction benefits of LNG-capable vessels. Engine manufacturers like Wärtsilä have achieved
significant improvements in its DF engine designs, minimizing methane slip to less than
6g/kWh, the level considered as competitive as other fuels (Ship and Bunker 2016).

31
Table 8: GHG Emissions Profiles of Different Marine Fuels
(Source: DNV GL October 2015a, p. 33)

32
Chapter 3 – The Role of LNG as a Marine Fuel
LNG-FUELED SHIPS – CURRENT & PROJECTED
In the current world merchant fleet, there are approximately 50,000 vessels in operation. As
shown in Figure 19, the overwhelming majority of vessels are cargo ships, followed by tankers
and containerships. A smaller percentage of vessels are Roll-on/Roll-off (Ro-Ro), which
include car carriers and ferries, and passenger ships like cruiseliners. LNG carriers, while
massive, represent a fraction of total number of ships but are instrumental in sustaining the
global LNG trade.
Figure 19: Number of World Merchant Fleet Ships
(Source: Statista 2017, p. 12)
In May 2015, DNV GL reported that there were 63 LNG-fueled ships in operation with 76
newbuilds on order (DNV GL October 2015a, pp. 40-43). At the end of 2016, there were 88
LNG-fueled ships operating with 98 newbuilds on order, with an additional 70 ships

33
designated as LNG-conversion ready. Most of these ships will operate in Northern European
and North American zones, where ECAs are very strict. However, 4 of the currently operating
ships and 22 newbuilds will operate globally. Industry experts estimate that by 2020 there
could be as many as 400 to 600 LNG-capable ships fully operational (Wold 2017)
In 2017, there were a total of 325 LNG-capable vessels, of which 229 were LNG carriers, with
the remaining hundred split among offshore service and cargo vessels, passenger vessels, and
other types of vessels. 110 LNG-capable newbuilds were on order (UNCTAD/RMT/2017,
p. 39). As shown in Table 9, LNG-capable ships are becoming increasingly attractive,
capturing more than 13% of the total orderbook in 2018 and beyond:
Table 9: LNG-Capable Newbuilds (Thousands of Gross Tons)
(Source: UNCTAD/RMT/2017, p. 38)

34
LNG procurement company Titan LNG also has predicted a surge in LNG newbuild orders
as LNG pricing becomes more competitive with other fuel types. As shown in Figure 20, in
2017, 11% of newbuild orders were for LNG-capable ships (Wainwright 2018).
Figure 20: Number of Contracts and % LNG Newbuilds
(Source: Titan LNG 2017)
The most recent numbers are even more positive. As shown in Figure 21, as of January 1,
2018, 119 LNG fueled ship were operating globally (excluding LNG carriers and inland
waterway vessels), with another 125 confirmed LNG-capable newbuilds and 114 LNG-ready
ships (i.e. ships that could be easily converted to LNG-capable). Car/passenger ferries and
oil/chemical tankers are the most prevalent LNG-fueled ships, with containerships, platform
supply vessels (PSVs), and cruise ships also becoming an attractive target for LNG capability,
primarily with dual-fuel engine configuration (DNV GL January 2018).

35
Figure 21: LNG-capable ships by vessel type
(Source: Adapted from DNV GL January 2018, p. 14)
Examples of Company-Level Pursuit of LNG-Capable Ships
At the international level, LNG-capable ships are becoming a more attractive option and major
shipowners are integrating this capability into their newbuild orders. For example, Sovcomflot
(SCF Group), a Russian company, has increased its LNG-capable newbuilding orders for
Aframax tankers to six. Each vessel is approximately 114,000 dwt priced at about $60 million
each, and are they are the first Aframax tankers to use LNG. Further, SCF has allegedly
considered transitioning most of its 60 Aframax vessels to LNG-capable by 2022 (Hine
November 23, 2017).
BP has stated it is pursuing two LNG-capable Very Large Crude Carriers (VLCCs) on 3-year
time charter with two one-year options. However, the LNG capability comes at a cost for
these unique vessels, with approximately a 25% premium above the typical newbuild cost of
$77 to $83 million. BP has considered retrofitting the vessels with open-loop exhaust gas
2 2
33
3
18
4 19
21
4 3 5 4103 2
14
21
152
1
364
2
9 115
0
10
20
30
40
50
LNG-Capable Ships by Vessel Type
Ships in Operation Ships on Order

36
cleaning systems (EGCS), or scrubbers, at a cost of $2.5 million per ship but uncertainty over
the potential significant premium of low sulfur fuel oil could erode its estimated one-year
payback (Hine November 16, 2017).
On the bulker vessel side, ESL Shipping will be receiving two 26,000-dwt newbuilds, which
will also be the world’s largest LNG-capable vessels in this class. ESL noted that it did not
consider scrubbers for these vessels as heavy fuel oil (HFO) is not allowed in Scandinavia due
to stringent ECA policies (Craig November 9, 2017).
Shipping giant CMA CGM, which recently has ordered up to eight 14,000 twenty-foot
equivalent units (TEU) container ships worth $850 million, is considering LNG capability for
these ships. On these ships, the premium for this capability is about 15 to 20%. However,
given that the company opted for LNG-capability on its new generation of nine ultra large
container vessels (ULCV) of 22,000 TEU, the smaller container ships may very well likely
follow suit (Ang and Hine, January 11, 2018). These ships, also known as the PERFECt
(Piston Engine Room Free Efficient Containership), intend to use a combined gas and steam
turbine engine for ship power and propulsion (Wold 2017).
Cruise ships have also been a target of opportunity for LNG fuel. As of early January 2017,
there were 11 LNG-capable cruise ships on order. These ships typically use between 30,000
to 50,000 tons per year of LNG, representing an estimated .3 to .5 MTPA of LNG each year,
a significant percentage of total marine fuel use from just a dozen or so ships (Wold 2017).
One of the largest cruise ship operators in North America, Carnival has seven LNG-capable
cruise ships on order for delivery between this year and 2022. This is a critical step for Carnival
as it diversifies its fleet away from using scrubbers (70 ships) or low-sulfur fuel (33 ships).
Carnival estimates its LNG ships will emit essentially zero SOx, reduce particulate matter (PM)
by 95 to 100%, reduce NOx by 85%, and lower CO2 by 25-28%. The two North American
operating LNG vessels are both 180,000 gt and will be fueled by a new LNG bunker barge
supplied by Shell (Hine and Juliano November 8, 2017). Further, Carnival’s Mediterranean

37
affiliate AIDA Cruises will also provide LNG fuel to two of its ships, the AIDAperla and
AIDAprima, utilizing truck to ship while in port and barge to ship while at sea from Shell
(Juliano November 27, 2017).
There are also two companies that are completely rethinking ship design for LNG capability.
First, Arista Shipping’s Forward LNG Project intends to be the largest and cleanest Bulk
Carrier. The ship is designed with Wärtsilä engines and GTT membrane tanks with a capacity
of 2500 m3, giving the ship a voyage endurance of 40 days and/or 14,000 nautical miles. The
ship can run completely on LNG and does not need any additional emissions reduction
equipment like scrubbers (for SOx) or SCR (for NOx) (Forward LNG 2017). Second, DNV
GL’s Piston Engine Room Free Efficient Containership (PERFECt) is designed in
conjunction with GTT and CMA CGM to support future Ultra Large Container Vessels
(ULCV) with 20,000+ TEU capacities. The design uses a combined cycle gas and steam
turbine (COGAS) electric propulsion engine that burns cleaner LNG and has greater
efficiencies than marine diesel engines (greater than 60% compared to 52%). The ship has
two 11,000 m3 membrane storage tanks, and despite being twice the size of conventional fuel
oil tanks, allows for the addition of 300 TEU spaces since no additional engine room is needed.
The CAPEX premium for this ship is between 20 and 25%; however, significant OPEX cost
reductions could be achieved by elimination of other emissions controls and cheaper LNG
fuel costs. In fact, the vessel achieves comparable paybacks to using scrubbers and SCRs
(DNV GL October 2015b).
Domestically, several Jones Act Vessel companies have already made or plan to make the
switch to LNG-capable vessels. Tote Maritime was one of the first-movers in this space with
its Marlin-class vessels. Delivered in late 2015 and early 2016, these container ships run almost
exclusively on LNG for their Jones Act Vessel trade between the US and Puerto Rico. The
ships are 100% American-made and are supported by LNG bunkering solutions out of
Jacksonville, FL (Tote N.D.).
38
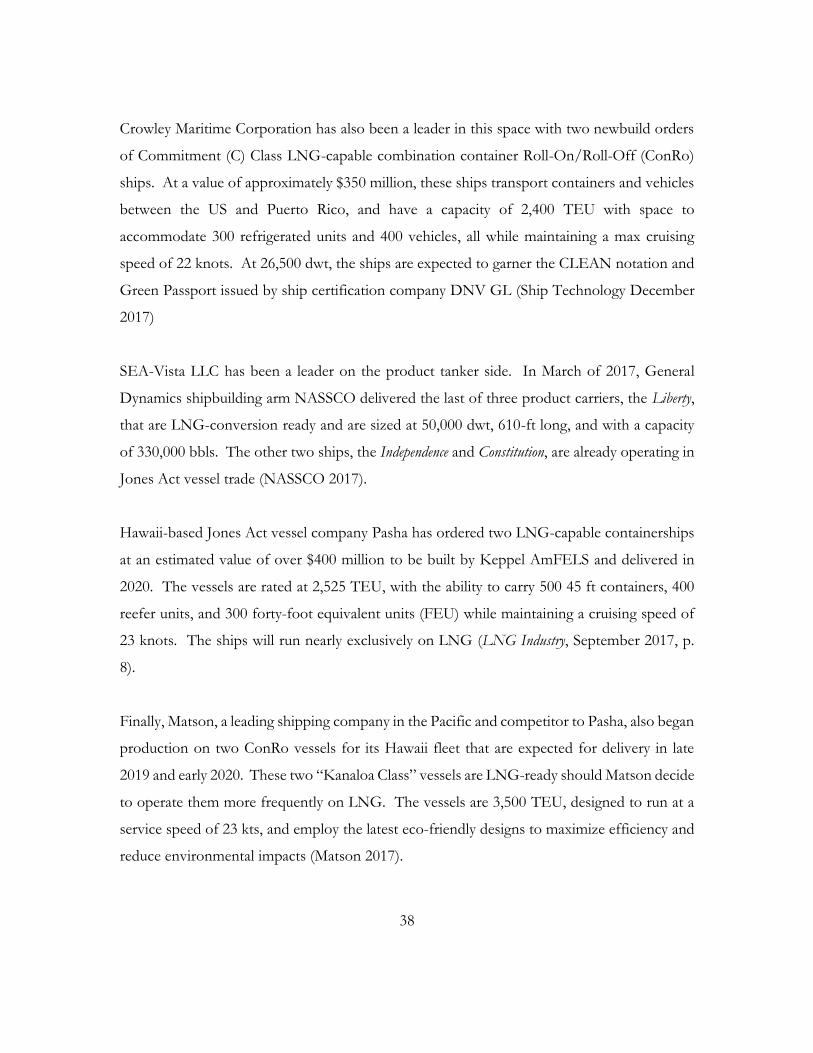
Crowley Maritime Corporation has also been a leader in this space with two newbuild orders
of Commitment (C) Class LNG-capable combination container Roll-On/Roll-Off (ConRo)
ships. At a value of approximately $350 million, these ships transport containers and vehicles
between the US and Puerto Rico, and have a capacity of 2,400 TEU with space to
accommodate 300 refrigerated units and 400 vehicles, all while maintaining a max cruising
speed of 22 knots. At 26,500 dwt, the ships are expected to garner the CLEAN notation and
Green Passport issued by ship certification company DNV GL (Ship Technology December
2017)
SEA-Vista LLC has been a leader on the product tanker side. In March of 2017, General
Dynamics shipbuilding arm NASSCO delivered the last of three product carriers, the Liberty,
that are LNG-conversion ready and are sized at 50,000 dwt, 610-ft long, and with a capacity
of 330,000 bbls. The other two ships, the Independence and Constitution, are already operating in
Jones Act vessel trade (NASSCO 2017).
Hawaii-based Jones Act vessel company Pasha has ordered two LNG-capable containerships
at an estimated value of over $400 million to be built by Keppel AmFELS and delivered in
2020. The vessels are rated at 2,525 TEU, with the ability to carry 500 45 ft containers, 400
reefer units, and 300 forty-foot equivalent units (FEU) while maintaining a cruising speed of
23 knots. The ships will run nearly exclusively on LNG (LNG Industry, September 2017, p.
8).
Finally, Matson, a leading shipping company in the Pacific and competitor to Pasha, also began
production on two ConRo vessels for its Hawaii fleet that are expected for delivery in late
2019 and early 2020. These two “Kanaloa Class” vessels are LNG-ready should Matson decide
to operate them more frequently on LNG. The vessels are 3,500 TEU, designed to run at a
service speed of 23 kts, and employ the latest eco-friendly designs to maximize efficiency and
reduce environmental impacts (Matson 2017).

39
Financing Structures for LNG-Capable Ships and Other Emissions Reductions
Measures
The focus on making more environmentally friendly ships has created challenges for
shipowners due to the additional capex and/or premiums of options. Therefore, financing
mechanisms exist to provide shipowners with lower cost capital as they pursue different
options for meeting more stringent emissions standards. In the US, the Department of
Transportation’s Maritime Administration (MARAD) runs the Federal Ship Financing
Program (FSFP) for Jones Act vessels, which is a generous program that allows up to 87.5%
of guaranteed debt financing over a term of 25 years, with interest rates typically matched to
a treasury note of the same tenor as the debt, and nominal program fees. To date, both Tote
and Crowley have leveraged the FSFP for their LNG-capable newbuilds, with total loan values
of $324.6 million and $362.7 million, respectively. It should be noted that these loan values
represent the maximum level of guaranteed debt financing (MARAD N.D.).
Internationally, particularly in Europe, financing programs have been established to green the
fleet. The European Investment Bank (EIB) has created two facilities to assist shipowners
finance either retrofits or newbuilds that address environmental quality constraints. First, the
European Fund for Strategic Initiatives (EFSI) Green Shipping Loan Program is a €250
million loan program targeting Atlantic and Mediterranean-based EU shipowners for
newbuild contracts. The program covers up to 50% of the investment cost and is expected
to assist a total investment portfolio of €500 million. The debt takes a senior secured structure.
Second, the Connecting Europe Facility (CEF), a new financial instrument designed to
support green shipping initiatives, is attempting to reverse the reluctance of lenders to finance
environmentally focused investments. Similar to the US FSFP, the CEF is a guarantee
program that can cover up to 100% of retrofit investments or up to 50% of newbuild
investments. The program has a value of €750 million and is expected to support up to €3
billion of investments at a senior or subordinated structure (Gaudet 2016).

40
Both financing programs represent critical government-sponsored support for the next era of
ships designed to address significant environmental issues. The business case analyses
discussed in subsequent chapters will utilize these programs to understand their impact on the
overall financial feasibility of different environmentally-based investment decisions.
In addition to traditional project finance structures and state-sponsored financing programs
like the Federal Ship Financing Program and the EIB Green Shipping Programme, there are
some alternative financing options for shipowners to assist in meeting increasingly strict
emissions regulations. One such alternative is called the Emissions Compliance Service
Agreement (ECSA), offered by an infrastructure development group called Clean Marine
Energy (CME). The ECSA brings third-party financing to a shipowner to eliminate the
upfront capital costs associated with installing scrubbers or even retrofitting a vessel to burn
cleaner fuels like LNG. CME recoups its investment by sharing a portion of the OPEX
savings, mostly from the perceived savings (the differential between high sulfur fuel oil and
low sulfur fuel oil/distillates) from continued use of non-compliant fuel oil in the case of a
scrubber installation until a required rate of return is met. At that point, all OPEX savings
would revert to the shipowner who would continue to benefit from those savings for the
remainder of ship life (Clean Marine Energy 2018).
Lastly, while no research indicates that this structure has been used, tax equity investments
might also be a way to help facilitate investments in “clean shipping.” Tax equity investments
have been used to finance utility scale solar and wind generation projects, offering an incentive
for a corporation with a large tax burden to monetize the investment tax credit (ITC) for solar
or production tax credit (PTC) for wind. While these tax credits are beginning to sunset for
power generation projects since costs are nearly at parity or in some cases cheaper than other
generation sources, a similar structure could be used in ship financing to help alleviate the
premium for emissions reductions investments, whether that be emissions controls for SOx
and NOx or a completely new ship that is LNG-capable. Subsidies for alternative energy
sources have come under increasing scrutiny the last few years so this approach would likely

41
require significant championing in government, financial institutions, and the shipowner
community.
TYPES OF MARINE FUELS – HISTORICAL AND FORECASTED VOLUMES & PRICES
In 2012, the global shipping community used approximately 300 million tonnes per year of
bunker fuel across several variants (See Figures 22 and 23). The most common types of
bunker fuel include heavy fuel oil (HFO), intermediate fuel oil (IFO), marine diesel oil (MDO),
marine gasoil (MGO), and low-sulfur variants of all three. Low sulfur distillates either have
1.0% sulfur or 0.1% sulfur; these fuels were made for compliance with stringent emission
control area (ECA) limits on the amount of allowable sulfur.
Figure 22: Marine Fuel Consumption, 2012 (MTPA)
(Source: Adapted from Concawe 2016, p. 4)
228
64
8
0
50
100
150
200
250
300
350
Marine Fuels
Marine Fuel Consumption, 2012
HFO MDO LNG

42
Figure 23: Marine Fuel Consumption by Ship Type, 2012
(Source: Adapted from Concawe 2016, p. 3)
A recent DNV GL study puts total marine fuel consumption for 2016 at roughly 233 to 256
million tonnes. As shown in Figure 24, containerships, bulkers, and tankers account for most
of the fuel use. This decrease from 2012 levels is likely due to several factors but could be
attributed to increased energy efficiency in ship design as well as decisions to reduce cruising
speeds to reduce fuel use and, in turn, emissions. In addition, since the price of oil plummeted
in 2014/2015, demand for shipping services decreased dramatically, causing an oversupply in
the market and decimating charter rates, which also likely contributed to an overall reduction
in total fuel use (DNV GL May 2017).
All other ships8%
Vehicle3% Offshore
3%
Cruise4%
LNG Carrier5%
Fishing5%
Chemical Tanker6%
RoRo and RoPax6%General Cargo
7%
Oil Tanker13%
Bulk Carrier18%
Containership22%
Marine Fuel Consumption (2012): 300 Mt (Global)

43
Figure 24: Merchant Fleet Vessel Types and Fuel Consumption, 2016
(Sources: Adapted from DNV GL November 2017a, p. 23; Statista 2017)
As noted above, there are essentially three major fuel types: fuel oil, marine gasoil (MGO),
and marine diesel oil (MDO). Within the fuel oil group, there are heavier and lighter variations,
with intermediate fuel oil (IFO) 380 and 180 (representing centistokes, or the unit of viscosity)
being the most common. IFO 380 is a blend of heavy fuel oil (HFO) and elements of light
oil, that creates a “cleaner” burning fuel. IFO 180 utilizes more marine gas oil, diesel oil, or
light cycle gas-oil blends to create a less viscous fuel oil. On the distillate side, MDO has a
lower cetane index than marine gasoil but a higher density, and usually contains a higher
amount of light cycle gasoil. Marine gas oil (MGO) is very similar to MDO but contains
negligible or no light cycle gasoil (Vermeire 2012, pp. 5-6). See Table 10 for a summary of
non-gaseous marine fuel types.
11,844
6,532 5,383
19,824
8,600
23%
16%
26%24%
11%
0%
5%
10%
15%
20%
25%
30%
0
5,000
10,000
15,000
20,000
25,000
Bulkers Tankers Containerships Other CargoVessels
All OtherVessels
% T
ota
l F
uel
Consu
mpti
on
Nu
mb
er o
f V
esse
lsMerchant Fleet Vessel Types and Fuel Consumption, 2016
Number of Vessels % Fuel Consumption

44
Industrial Name ISO Name Composition
Intermediate Fuel Oil 380 (IFO 380) MRG35 98% Residual Oil 2% Distillate Oil
Intermediate Fuel Oil 180 (IFO 180) RME 25 88% Residual Oil 12% Distillate Oil
Marine Diesel Oil DMB Distillate oil with trace of residual oil
Marine Gas Oil DMA 100% Distillate Oil
Table 10: Types of Marine Fuels
(Source: Adapted from EIA 2015, p. 9)
In 2016, the IMO proposed a plan to require all vessels larger than 5,000-gross tonnes to
report their annual fuel consumption to their flag state, which would then report this data to
the IMO Ship Fuel Consumption Database. The fuel reporting requirement may become
effective in 2018 and is intended to capture more accurately total fuel use by type across all
vessel classes to verify if efficiency and emissions reductions improvements are occurring
(Wiseman 2016). These classes of ships account for more than 85% of the merchant fleet’s
CO2 emissions, so accurately collecting this fuel data will inform future IMO decisions
regarding energy efficiency and emissions controls (Dufour 2016).
Projections of LNG bunker demand vary from as low as 3 MTPA to over 30 MTPA by 2020.
Figure 25 summarizes multiple industry estimates for LNG bunker penetration at the time the
IMO sulfur cap takes effect.

45
Figure 25: LNG Bunker Fuel Demand at 2020
(Source: Poten & Partners June 2017)
According to IHS Markit, LNG fuel could capture from 18% to more than 35% of total
marine fuel by 2040, compared to the less than 5% current market share (IHS Markit August
2017, p. 63). Given the liquefaction capacity scheduled to come on-line, the projected increase
in LNG-capable newbuilds, the growth of LNG bunkering networks, and the competitive
pricing of LNG well into the next decade, it is reasonable to predict that LNG could become
a significant portion of marine fuels globally.

46
On the price side, delivered cost of spot LNG had reached the $5.50 - $6.50/mmbtu range
due to low commodity prices, increased liquefaction capacity, and lower charter rates.
However, as demand increases there will be some upward pressure on LNG prices, which, in
turn, will increase the cost of LNG bunker (IGU World LNG Report 2017).
Figure 26: Historical Fuel Oil Prices against Oil and Natural Gas Hub Prices, $/MMBtu
(Source: Bloomberg Intelligence 2018)
Other low sulfur options, like MGO and low-sulfur and ultra-low sulfur distillates comply with
the new IMO regulation on a global scale but have historically traded at a substantial premium
to HFO. Since 2013, MGO premiums have ranged from $150 to $350 per tonne, while low
sulfur (LS) and ultra-low sulfur (ULS) options have traded between $50-$200 per tonne (DNV
GL October 2016). One market analysis showed that achieving compliance with the 0.5%

47
sulfur cap comes at substantial costs: by 2020 an estimated 195 million tonnes of HFO would
be displaced by 0.5% or less distillates, MGO or other fuel. At a lower-bound premium of
$30/tonne (for LS fuel oil) and an upperbound of $270/tonne (for MGO), this could cost the
shipping industry between $6 billion (without the cost of scrubbers) and over $50 billion
(Molloy 2016, p.7). This premium, with spreads projected to grow, make LNG a more
attractive long-term option. See Figure 26 for fuel price spreads.
THE CHICKEN OR THE EGG – LNG BUNKERING NETWORKS
While the technology exists for widespread adoption of either dual-fuel or pure-gas powered
ships, one of the biggest challenges the shipping community faces is the currently limited LNG
bunkering networks to make global operations seamless, turnkey, reliable, and consistently
cost competitive. However, the outlook for LNG bunkering networks looks promising. At
the end of 2017, LNG bunker was available in 57 locations, with over 70 more projects either
already underway or being considered. Most of the locations are in European ECAs, with
locations in Asia and North America more slowly following suit. Further, these numbers don’t
consider the availability of LNG bunker from trucks or bunker vessel delivery. In particular,
bunker vessel orders or retrofits are picking up steam, with 4 bunker vessels on order to service
particular locations and/or customers (Wold 2017).
The LNG Bunkering Network community faces a classic chicken or egg dilemma: LNG
bunker providers cannot build supply capability too quickly if there is not enough demand and
shipowners will not invest in LNG-capable ships without an adequate bunker network to
support operations. In the short-term, LNG bunkering will likely follow bi-lateral agreements
between suppliers and shipowners until the network matures and the market becomes more
liquid. A full review of all the technical, regulatory, and economic characteristics of LNG
bunkering networks is outside the scope of this thesis, but the following paragraphs highlight
major characteristics needed for development of mature LNG bunker supply.

48
Status of LNG Bunkering Networks
The most current estimates show there are 67 LNG bunker locations available today, with
another 61 decided or under consideration. As shown in Figures 27 and 28, most of these
locations are in Europe (62), Norway (23), and Asia (22), but North America plans to double
its locations to 12. Further, a variety of LNG bunkering solutions are currently operational or
being developed, with local storage, truck-to-ship, and tank-to-ship (at-shore loading) being
most popular.
Figure 27: LNG Bunkering Ports, Existing and Planned
(Source: Forward LNG 2017)

49
Figure 28: LNG Supply Locations: In Operation, Decided, Under Discussion
(Source: Adapted from DNV GL January 2018, p. 21)
Types of LNG Bunkering Solutions
As show in Figure 29, there are essentially three methods of LNG Bunkering: shore-to-ship;
truck-to-ship; and ship-to-ship. Shore-to-ship (SHS) bunkering enables a ship to be refueled
while in port at a berth. This is typically the cheapest option but until or unless liquefaction
capacity is built near ports where LNG-capable ships are likely to visit, it will likely not be the
most practical. Truck-to-ship (TTS) is a viable option for LNG bunkering for vessels that
have a very predictable schedule and volume requirement. However, for larger-scale
bunkering operations, the number of trucks required would likely make this inefficient and
costly. Ship-to-ship (STS) will likely become the most practical and efficient method as
bunkering networks become more established. While the capital cost of LNG bunker vessels
could potentially make LNG bunker less competitive initially, once the capacity is right-sized
delivery costs will likely stabilize and/or come down. Regulations will also need to address
the technical challenges of STS loading, which could delay at-scale implementation.
2615 13
5 4 4
12
2 5
6
24
6 4
20
10
20
30
40
50
60
70
Europe Norway Asia America Oceania MiddleEast
LNG Bunker Supply by Status
In Operation Decided Under Discussion

50
Figure 29: LNG Bunkering Solutions
(Source: DNV GL October 2015a, p. 38)
Surprisingly, the adoption of LNG bunker vessels has been slow (likely due to the technical
challenges of ship-to-ship loading). However, as shown in Figure 30, there are six bunker
vessels planned for operation in 2018 (DNV GL January 2018). Of note, Shell has positioned
itself as a market leader in LNG bunkering vessels, supplying Carnival cruise ships with LNG
via a 4,000-m3 LNG bunker barge (LBB) capable of refueling both at shore and at sea (Hine
and Juliano November 8, 2017). Skangas and Titan LNG have also teamed up to supply the
Rotterdam port area and Nordic area with LNG bunker via LNG bunker vessels that are
roughly 6,000-m3 in capacity (Hine November 9, 2017). Lastly, CMA CGM, one of the largest
shipowners in the world, has partnered with Total’s Marine Fuels Global Solutions to supply
its future massive ultra large containerships (ULCV) that have a capacity of up to 22,000 TEU.
Total is considering a long-term charter for a bunker vessel that can supply CMA CGM and
other customers in the European market (Total 2017).
LNG bunker vessels are beginning to be used as a cleaner alternative in the ECA regions of
the North and Baltic Seas. At the Port of Zeebrugge in Belgium, LNG fueling operations
have expanded from TTS to STS loading. The Engie Zeebrugge vessel is the first LNG bunker

51
vessel operating in the northern European region. The vessel has a bunkering capacity of
5,000 m3 stored in IMO Type C tanks, with a refueling rate of 600 m3 per hour. The vessel
itself is equipped with a dual fuel engine, capable of burning both LNG and low-sulfur MGO
or MDO (Standaert and Nous 2017). In the Port of Gothenburg in Sweden, Sirius Shipping
just recently deployed the Coralius, a 5,800 m3 LNG bunkering vessel capable of refueling at
1,000 m3 per hour and burning both LNG and MGO to meet strict emissions standards in the
Nordic areas (Sirius Shipping 2018).
In the Port of Rotterdam, STS LNG bunkering has taken hold as the port looks to grow its
offering of non-fuel oil bunker. The port now has a dedicated LNG bunker vessel, the
Cardissa, with two Type-C tanks at a total capacity of 6,500 m3 and fueling rate of 1,100 m3 per
hour. The vessel is loaded at the GATE Terminal, where three LNG storage tanks each with
a capacity of 180,000 m3 supply both LNG carriers as well as bunker vessels. The port has
been very proactive with the technical and regulatory issues with LNG bunkering, and, in the
absence of international guidance, has established its own regime. It also has incentivized the
use of LNG as a marine fuel by offering up to a 20% discount on port fees for ships that abide
by the Environmental Shipping Index (ESI) and opt for LNG in Rotterdam (SEA\LNG
2018).

52
Figure 30: Types of LNG Bunker Solutions
(Source: Adapted from DNV GL January 2018, p. 22)
In Jacksonville, FL, Crowley Maritime, Eagle LNG, and JAXPORT have partnered to ensure
seamless LNG bunker support for Crowley’s LNG-capable hybrid containership/roll-on/roll-
off (ConRo) vessels, El Coqui and El Taino, which will both be fully operational for its US-
Puerto Rico trade by the second half of 2018. LNG is provided by Eagle LNG’s Maxville
liquefaction plant and transported by truck to the Talleyrand marine LNG terminal (owned
by Crowley). The terminal has two LNG storage tanks at 1,000 m3 each (or 265,000 gallons).
Crowley’s ConRo vessels can be refueled at a rate of 1,800 to 2,400 gallons per minute directly
from shore (SEA\LNG 2018).
Regulatory and Safety Considerations for LNG Bunkering
In addition to the actual buildout of LNG bunkering capacity and networks (i.e. the storage
and means to distribute LNG bunker to the end-user), safety is of paramount importance to
LNG refueling operations. As such, the industry is subject to several regulatory and technical
safety requirements. Emergency release systems (ERS) are the industry standard for
48
1429
43
3
22
8
16
12
2
27
5
2013
5
0
20
40
60
80
100
120
LocalStorage
Bunker ShipLoadingFacility
Tank to Ship TruckLoading
Unknown
Types of LNG Bunker Supply Facilities

53
preventing unwanted damage to the transfer system and vessel, as well as ensuring safety.
Adequate fueling processes, and properly trained crews and operators are also critical to safe
refueling operations. There are several standards and technical guidelines that are currently
being utilized or being improved to meet the growing demand for LNG bunker. First,
ISO/TS 18683 ‘Guidelines for systems and installations for supply of LNG as fuel to ships’
has been in effect since 2015; however, a new standard under ISO 20519:2017 ‘ships and
marine technology – specification for bunkering of LNG fueled vessels’ offers updated
guidance on five core elements of LNG bunkering:3
a) hardware: liquid and vapor transfer systems;
b) operational procedures;
c) requirement for the LNG provider to provide an LNG bunker delivery note;
d) training and qualifications of personnel involved; and
e) requirements for LNG facilities to meet applicable ISO standards and local codes
Other guidelines have been internationally coordinated by the Society for Gas as a Marine Fuel
(SGMF), with a focus on standardization and interoperability of connectors. SGMF’s work
led to the establishment of ISO Working Group TC8/WG8, with a new standard for coupler
connection/disconnection, ISO/CD 21593,4 in the works. Lastly, cryogenic hoses are
governed by EN1474-2,5 ‘Installation & Equipment for Liquefied Natural Gas, Design &
Testing of Marine Transfer Systems’ (an European Union standard), and loading arms are
regulated by ISO 16904:2016,6 ‘Design and testing of LNG marine transfer arms for
conventional onshore terminals’ (Fusy and Morilhat 2017).
3 For more information, refer to ISO 20519:2017 located at https://www.iso.org/standard/68227.html
4 For more information, refer to ISO/CD 21593 located at https://www.iso.org/standard/71167.html
5 For more information, refer to EN1474-2 located at https://www.en-standard.eu/csn-en-1474-2-installation-
and-equipment-for-liquefied-natural-gas-design-and-testing-of-marine-transfer-systems-part-2-design-and-
testing-of-transfer-hoses/
6 For more information, refer to ISO 16904:2016 located at https://www.iso.org/standard/57892.html

54
Furthermore, the IMO’s Maritime Safety Committee has passed two guidelines directly related
to the storage of LNG and use of LNG as marine fuel: the IGC Code and IGF Code,
respectively. The IGC Code,7 or The International Code for the Construction and Equipment
of Ships Carrying Liquefied Gases in Bulk, applies to gas carriers built after July 1986. While
originally intended for LNG Carriers, the Code applies to small-scale LNG solutions such as
LNG bunkering vessels that could be used for refueling operations. The IGF Code,8 or
International Code of Safety for Ships using Gases or other Low-flashpoint Fuels, focuses on
ensuring safety of vessels that use low flashpoint fuels, with an emphasis on LNG. These
codes were designed to mitigate risks associated with boil-off-gas (BOG) and design of LNG-
capable engines from storage tank, through the fuel delivery system, to the engine (IMO 2018)
While much progress has been made in standardizing LNG bunkering, much work is left to
be done. Until then, states and ports will likely abide by standards that exist and implement
their own rules that ensure the safety of bunkering operation within their respective ports until
further guidance is released. For example, in the US, while FERC and the Pipeline and
Hazardous Materials Safety Administration (PHMSA) are the primary government
organizations responsible for the safety of LNG facilities and transport, the Coast Guard (part
of the Department of Homeland Security) is responsible for LNG bunkering operations and
has issued several policy letters providing guidance on LNG bunker and transfer safety.9
For ship-to-ship (STS) fueling, there are many concerns. First, the connection between ship
can be made by either a hose or marine loading arms. Hoses offer maximum flexibility but
have significant insulation shortfalls, degrade more quickly, and typically do not have adequate
7 For more information, refer to the IMO at
http://www.imo.org/en/OurWork/Safety/Cargoes/CargoesInBulk/Pages/IGC-Code.aspx
8 For more information, refer to the IMO at
http://www.imo.org/en/OurWork/Safety/SafetyTopics/Pages/IGF-Code.aspx
9 For more information, refer to the USCG Liquefied Gas Carrier National Center of Expertise located at
https://www.dco.uscg.mil/lgcncoe/fuel/alerts-policy-regs/

55
emergency release systems (ERS) in the event refueling needs to cease. On the other hand,
marine loading arms create rigid connections with adequate flexibility through swivel joints
and typically have ERS. However, these rigid systems are generally custom designed for the
vessel types they typically serve, making interoperability a challenge. Therefore, many new
bunkering systems involve a combination of loading arms and hoses to achieve maximum
flexibility and safety. At a minimum, these systems must have an ERS, ideally with an
emergency release coupler (ERC). The two-stage ERC is designed to detect hose anomalies,
shutting down flow at two ends of the transfer system (in order to prevent pressure buildup),
and then cause the release of the coupler if acceptable operational limits have been exceeded.
This design is critical to ensure safety but also to reduce the risk with STS refueling (Boot
2017). MIB Italiana, an Italian technology company, is implementing flexible hose transfer
solutions for both STS and ship-to-jetty (STJ) fueling operations. These fully integrated
systems employ an ERS with an ERC, managed by a hydraulic power/control unit (HPU) that
can isolate and release the hoses in an emergency (Chiodetto 2017).
For LNG refueling operations, a promising technology to minimize or eliminate the boil-off
gas (BOG) issue is a vacuum insulated pipeline (VIP). VIP appears to be the most promising
method to block heat conduction, convection, and radiation, reducing BOG by 10-15 times
more than other common insulation methods such as glass-foam or polyisocyanurate (PIR).
An example of VIP use is at Lysekil (Sweden), the largest LNG receiving terminal in
Scandinavia built for use by Skangas. This terminal supports LNG bunkering operations for
LNG-fueled ships in the Nordic region. Another example is Risavika (Norway), also for use
in LNG bunkering that supports ferry routes between Norway and Denmark. Overall, VIP
can effectively reduce OPEX by lowering BOG-associated costs (Admiraal 2017).
METHODS TO ACHIEVE IMO SULFUR CAP COMPLIANCE
The reduction of total fuel use and emissions have become front and center issues for the
shipping community. Several initiatives have been or are being pursued. First, the IMO
instituted in 2013 the Energy Efficiency Design Index (EEDI), a mandatory benchmark for

56
new ships that require annual improvements in efficiency to reach a 30% improvement from
a 2014 baseline. EEDI measures the CO2 reduction in grams CO2 per tonne mile. The Ship
Energy Efficiency Management Plan (SEEMP) is also a requirement for all ships and gives
shipowners guidance to improve energy efficiency while considering overall impacts to
implementation and operational costs. SEEMP gives shipowners a tool called the Energy
Efficiency Operational Indicator (EEOI) to monitor fuel efficiency of a vessel while
operational and captures the impacts of efficiency measures (MARPOL Annex VI N.D.).
Several non-fuel and non-engine energy efficiency measures have been implemented or
considered, including: air lubrication of a ship’s hull to reduce drag; a propeller attachment
that produces counter-swirls to the propeller (with estimated fuel savings of 2.5%); a DC Grid
system that optimizes engine speed at varying load levels (achieving fuel consumption savings
of 27%); adjusting the shape of a vessel’s bulbous bow; fuel oil emulsion; and even wind and
solar power positioned on the ship’s deck (Marine Insight 2017a).
Lloyd’s Register, a leading ship certification company, recently completed a zero-emissions
vessel (ZEV) study that looked at the use of alternative fuels such as hydrogen, biofuels,
methanol, or batteries to achieve net zero emissions. The study showed that the financial
feasibility of these ship types is not possible for the foreseeable future due to extremely high
capital costs (from 10% for biofuels and ammonia-based fuel cells, to upwards of 10000% for
battery electric) and lost revenue (the energy density issues of these alternative fuels require
more fuel storage and reduces cargo capacity). The study evaluated the application of these
different fuel types across bulk carriers (53,000 dwt), containerships (9,000 TEU), tankers
(110,000 dwt), cruise ships (3,000 dwt), and RoPax (2,250 dwt). The results of the study
showed the need for a carbon price upwards of $250-500 per tonne CO2-e for ZEVs to be
competitive with HFO-fueled ships. Thus, it is unlikely that these alternatives will be viable
for quite some time, making LNG-capability that much more attractive (Lloyd’s Register
2017).

57
A recent study done by consulting firm CE Delft analyzed the impact reduced service speed
could have on shipping emissions, particularly GHG emissions. The study used tankers,
bulkers, and containerships (the ships that consume the largest amount of fuel) as
representative vessel types. The sensitivity around reduced ship speed is the relationship
between speed, engine load, and fuel consumption. In general, a ship operates most efficiently
at roughly 85-90% of its maximum continuous rating (MCR). When a ship’s speed is reduced,
the engine loading could be reduced to the point where degradation of energy efficiency (i.e.
fuel consumption) outweighs the benefit of speed reduction. Nevertheless, as shown in Table
11, substantial CO2-e reductions could be achieved by reducing speed by 10-30% without
impacting engine efficiency or global trade (Faber 2017).
Million Tonnes 10% speed reduction
20% speed reduction
30% speed reduction
Containerships 34 62 85
Bulk Carriers 32 59 83
Tankers 10 19 25
Total 76 140 193
Table 11: Average Annual CO2-e Savings between 2018-2030 from Ship Speed Reduction
(Source: Adapted from Faber 2017, p. 10).
However, speed reductions are likely just a temporary solution to a more enduring problem.
Emissions reductions will require a combination of policy decisions (like speed reductions),
alternative fuels, and energy efficiency improvements (as per the EEDI) to reach significant
levels. As Figure 31 demonstrates, all of three of these components will contribute to a cleaner
shipping industry and reduce its contribution to anthropogenic global warming trends.

58
Figure 31: CO2 Emissions Reduction Pathway 2015-2025
(Source: DNV GL November 2017a, p. 63)
Notwithstanding the goal to reduce overall GHG emissions, the effort to reduce pollutants
like NOx and SOx is arguably more compelling in the near-term, particularly in ECAs but at a
global scale post-2020 (especially for SOx). Even if shipowners choose to burn low-sulfur
compliant fuel and avoid the need for scrubbers, they will still need NOx controls to achieve
Tier III compliance in ECAs. Further, if they choose to burn non-compliant fuel oil, they will
have to use some type of SOx controls like a scrubber. Thus, a shipowner is stuck with the
challenge of having increased CAPEX, OPEX, or both to meet emissions standards.
So, for a shipowner, the question remains: what’s the most cost-effective solution to meet all
the IMO’s regulations, particularly the 0.5% sulfur cap? The following chapter highlights the
business case analyses for the options in Figure 32, with the goal of determining the
competitiveness of LNG capability compared to other alternatives.

59
Figure 32: Most Likely Pathways to Meet SOx (and NOx) Emissions Requirements
(Source: Adapted from Poten & Partners November 2017)
The divide in the investment decisions is made clear by Figure 33. Shipowners appear to be
in two camps – either retrofit with scrubbers or build a new LNG-capable ship. Retrofitting
ships to be LNG-capable is feasible. In fact, German shipping company Wessels Reederei
had one of its 1,000 TEU container ships (Wes Amelie) retrofitted with dual-fuel technology
after the IMO passed stringent emission directives for the North and Baltic Seas in 2015 (Ship
Technology November 2017). However, given the significant technical challenges and costs
associated with retrofitting, this thesis only looks at a comparative analysis of investing
newbuilds that have SOx scrubbers and/or NOx controls, or are LNG-capable.
LS Fuel Oil; LS
Distillates
(MDO/MGO)
HFO + EGCS
(Scrubber)LNG
LS Fuel
Availability
Potential
High Price
Installation Cost;
waste-water disposal;
port use limitations
LNG
equipment
cost
LNG
bunkering
+ No extra fuel tanks
- Higher fuel costs
- Need SCR for Tier III NOx
- Low availability = higher
price
- Engine/fuel system issues
with lower
viscosity/lubricity
+ HFO bunker widely
available
+ Lower price
- CAPEX for
scrubbers (+/- $5
million
- Scrubber availability
- Waste water issues
+ Meets SOx, PM, and NOx Tier
III requirements
+ Low NG hub prices = low LNG
prices…for now
- CAPEX Premium (+/- 20%)
- Encroachment of cargo space
- LNG bunkering
- Pricing – regional or global
basis?
Issu
esP
ros
& c
on
sO
pti
on
s

60
Figure 33: Comparison of Scrubber and LNG Investments
(Source: DNV GL January 2018, p. 18)

61
Chapter 4 – The Business Case for LNG-Capable Ships
METHODOLOGY AND ASSUMPTIONS
Methodology
The analysis of the investment decision to pursue LNG-capability should include three key
components: economic benefits; environmental impacts; and operability considerations. One
of the key factors of LNG capability is the significant cost savings LNG can potentially
provide. As fuel cost is one of the major OPEX line items, reductions in fuel procurement
cost is a key driver for shipowner profitability. Further, LNG has the flexibility to be priced
in multiple ways, whether it be purely oil-linked, purely hub-based, or a hybrid of the two.
While oil-linked pricing provides the ability to hedge against a global oil price, hub-based
pricing tends to be more regional and hence more volatile. However, post-2020, LNG hub-
based price referencing could become more global, offering shipowners more flexibility in
LNG bunker contracting. Economic payback periods also need to be adjusted to account for
implementation of technology to meet emissions regulations, extending beyond the typical 5-
7 year period to 10-15 years to achieve longer-term return on investment (RoI).
Second, shipowners need to consider the full environmental benefits of LNG fuel. While its
reduction in SOx, PM, and NOx are measurable, LNG’s GHG emissions reduction is harder
to gauge. At the high-end, LNG can provide up to 25-30% reduction in CO2 emissions.
However, when analyzed on a full well-to-tank and tank-to-propeller basis, those reductions
are closer to 8-12% given the emissions associated with producing, gathering and processing,
and liquefying natural gas (see previous section on environmental benefits of LNG). The
larger concern is methane slip during engine operation, which can impact the overall GHG
emissions reductions in LNG-capable ships, though this is likely to be minimized with newer
engine designs.

62
Third, shipowners also need to evaluate the operability of LNG-capable ships, particularly as
it relates to impacts on other operational costs (OPEX), such as longer-than-expected wait
times in port and issues with boil off gas (BOG). The longer the wait in port, the more BOG
becomes an issue (unless a ship is equipped to fully burn or recirculate BOG) as pressure build
up inside the storage tanks requires venting. Regulations on BOG treatment might vary from
port to port so shipowners must factor in this risk while operating on LNG. Dual-fuel engines
could switch to burning fuel oil or low sulfur distillates but within ECAs ships must meet SOx
and NOx Tier III limits, which require additional equipment as described previously. Given
that most ships do not remain operational in port for longer than a few days and that LNG
storage tanks (Type C tanks) have stringent BOG rules (see previous section on tank types),
BOG likely will not become a critical issue in port.
Overall, the business case analysis framework that follows attempts to consider these factors
for a shipowner, with a primary focus on the quantifiable economic benefits of having an
LNG-capable vessel.
Figure 34: Illustrative Business Case Analysis Framework w/ Key Assumptions
Vessel Type
Capesize Bulker (>100k dwt)
CAPEX
Panamax Bulker (60-100k dwt)
Engine TypeOPEX
Aframax Tanker (80-120k dwt)
Utilization
VLCC (250-325k dwt)
Containership (2-6k TEU)
Containership (>10k TEU)
SOx Scrubber
LNG-Capable
Non-Fuel
Dry Dock
Fuel
Charterer Time
Owner Time
Days in Port/ECA
MAN 5/6/7 S/G50 ME-C8/9
MAN 6/7 S65 ME-C8
MAN 6S80 ME-C9
NOx Controls
W6X72DF
Tonnes per year
Charter Rates
5-year monthly average TCE
% Premium for “full kit”
WinGD X92DF
W6X62DF
Capital Structure
Federal Ship Financing Program (Jones Act Vessels)
European Investment Bank Green Shipping Programme

63
Key Assumptions
Vessel Types. The business case analysis evaluates 3 different vessel types at two different class
sizes. Bulk carriers include Panamax and Capesize vessels, tankers include Aframax and Very
Large Crude Carriers (VLCCs), and containerships include Panamax and Post-Panamax
vessels (>10k TEU) up to Ultra Large Container Vessels (ULCVs). Given that bulkers,
tankers, and containerships utilize the most fuel out of all merchant vessels, it seemed
appropriate to analyze these vessels types given the extent of their potential impact to overall
fuel consumption if acquiring LNG-capability. For Jones Act vessels, a Panamax
containership is used as a proxy to Tote’s Marlin Class 3,100 TEU containership and a
Handysize tanker is used as proxy to Sea-Vista’s 50,000-dwt product tanker.
CAPEX. Capital expenditures for each ship are calculated in most cases from historical
newbuild price averages. For Jones Act vessels, newbuild prices are calculated based on
financing information available on the MARAD website for those ships that utilized the
Federal Ship Financing Program (Title XI). Jones Act vessels generally have a substantial
premium over internationally-built vessels due to the stringent requirements of the Jones Act.
Newbuild prices are calculated for four scenarios: as-is (with no considerations for emissions);
NOx only (SCR to meet Tier III standards); SOx and NOx capable (both scrubbers and SCR
systems); and LNG-capable (dual-fuel engine). A range of capital expense for EGCS
(scrubbers) of approximately $3-8 million was assumed for different vessel types. NOx
controls are assumed to utilize a high-pressure SCR system, with costs ranging from $1.26 to
3.86 million depending on vessel type. LNG-capable vessels have an assumed 20% premium
to as-is vessels.10 CAPEX is depreciated on a 20-year straight-line basis.
10 The 20% premium is based on press releases, news articles, and interviews with shipping industry experts
discussed in previous sections.

64
Table 12: Newbuild Prices for Multiple Configurations, $ in millions
(Sources: Bloomberg Intelligence 2018 (for non-Jones Act Vessels), MARAD N.D. (for Jones
Act Vessels), MAN 2012 and DNV GL November 2017b (for SOx and NOx costs), Vis 2018
(for SOx costs))
OPEX. Operational costs are an aggregation of crew costs, stores, repairs and maintenance,
insurance, and administrative fees. OPEX also includes drydock costs but excludes fuel costs.
Fuel costs are treated as a separate cost as they are one of the critical factors in profitability
given their significant volatility. See below for a more detailed explanation of how fuel prices
are calculated. SCRs are assumed to add about $9/MWh and scrubbers are assumed to add
about $5/MWh when being used. LNG-capable ships are assumed to add about $500/day
from increased costs of training and fuel delivery system maintenance.
Vessel Type As-Is NOx Only SOx and NOx LNG-Capable
Panamax Bulker 26.82 28.08 31.08 32.18
Capesize Bulker 45.45 47.05 51.05 54.54
Aframax Tanker 48.46 49.72 54.72 58.16
VLCC Tanker 89.00 90.91 98.91 106.80
Panamax Containership 27.64 30.53 33.53 33.17
Post-Panamax Containership 61.42 65.28 73.28 73.71
Panamax Containership (Jones Act) 135.00 137.89 140.89 162.00
Handysize Tanker (Jones Act) 82.50 83.76 86.01 99.00

65
Table 13: Operational Expenses for Multiple Configurations, $ in millions
(Sources: Drewry Consultants 2018 (for As-Is), MARAD 2011 (for Jones Act As-Is Only),
MAN 2012 and Jeppesen 2016 (for SOx and NOx), Paglia 2013 (for LNG-capable))
Utilization. Utilization is essentially the percent of time a ship is under charter. For the analysis,
a vessel is assumed to be under time charter, with utilization rates between 50 to 90% based
on charterer use. Utilization also includes the percent of time in different operating modes
(which impacts fuel use of the main engine) as well as the percent of time in an ECA, which
impacts the total OPEX of SOx and NOx emission control equipment. Fields in yellow can
be sensitized to measure impact on overall profitability.
Vessel Type As-Is NOx Only SOx and NOx LNG-Capable
Panamax Bulker 2.22 2.35 2.43 2.41
Capesize Bulker 2.50 2.70 2.81 2.68
Aframax Tanker 3.04 3.18 3.26 3.22
VLCC Tanker 3.55 3.91 4.10 3.73
Panamax Containership 2.24 2.50 2.64 2.43
Post-Panamax Containership 3.27 4.15 4.64 3.45
Panamax Containership (Jones Act) 7.32 7.66 7.86 7.50
Handysize Tanker (Jones Act) 7.32 7.43 7.48 7.50

66
Table 14: Illustrative Utilization Factor Calculations
(Source: UNCTAD/RMT/2017 (for average time in port and port calls per week))
Engine Types. Engine data for each ship type was acquired from the main engine manufacturers’
technical manuals for dual fuel engine types (i.e. LNG-capable). The three OEMs used include
Wärtsilä, MAN, and WinGD. Fuel consumption is calculated for both fuel oil and LNG in
tonnes/day based on the specific fuel oil consumption (SFOC) or specific gas consumption
(SGC) when operating in Tier III dual fuel mode.
Utilization Factor (% on Voyage) 70%
Charterer Time 70%
Owner Time 30%
Hours on Charter 6132
Days on Charter 256
Average Days in Port 102
Average Port Calls per Week 1.5
Average Time in Port (Days) 1.36
Tanker 2
Bulker 2.72
Tanker 1.36
Containership 0.87
Ship Operating Mode
Cruising / at Sea 60%
Maneuvering 12%
In-Port 28%
Time in ECAs
% of Time 20%
Hours 1,226
Days 51

67
Table 15: Engine Type and Fuel Consumption Data
(Sources: Wärtsilä, MAN, and WinGD Engine Manuals)
Charter Rates. Charter rates are calculated based on historical averages for 1-yr time charter
rates equivalents (TCE), which are used as the primary source of revenue in the analysis. See
Table 16 for 1-yr TCE historical 5-year average. While various forms of charters exist (voyage,
time, and bareboat), most vessels are on time charter. While on time charter the shipowner
covers most OPEX except fuel. On a voyage, or spot, charter, the owner pays for most OPEX
including fuel. On a bareboat charter, all OPEX is covered by the charterer (Plomaritou and
Papadopoulos 2018). For Jones Act vessels, charter rates are calculated by reverse engineering
via a discounted cash flow (DCF) method and solving for the rate needed to attain a roughly
8% internal rate of return (IRR), given other data such as OPEX, fuel costs, capital structure,
among others. Since charter rates have been at near historical lows the last few years, the
analysis used Excel’s Goal Seek function to obtain the charter rate required in year 1 to achieve
its return on equity to ‘normalize’ returns to a more realistic payback period for the different
investment options. See Table 17 for these year 1 charter rates. While not perfect, these
charters serve as a proxy for Jones Act and international vessel revenue in the business case
analysis.
Vessel Type
Vessel Size
(dwt or
TEU)
Engine TypeEngine Size
(kW)
Average
Speed (kt)
SFOC
(HFO)
(g/kWh)
SGC (LNG)
(g/kWh)
Fuel Use
(t/day)
Gas Use
(t/day)
Panamax Bulker 75,000 MAN 6/7S50 ME-C8 9,470 14.5 171.5 142.5 39.0 32.4
Capesize Bulker 150,000 MAN 6/7S65 ME-C8 14,450 14.5 171 141.7 59.3 49.1
Aframax Tanker 111,000 W6X62DF 10,400 14.5 -- -- 41.2 31.3
VLCC Tanker 300,000 MAN 6S80 ME-C9 25,900 15.5 168 139.2 104.4 86.5
Panamax Containership 3,800 W6X72DF 18,200 16.2 -- -- 39.5 31.2
Post-Panamax Containership 10,000+ WinGD X82 DF 38,880 16.2 178.9 141.8 166.9 132.3
Panamax Containership (Jones Act) 3,100 MAN 6S80 ME-C9 25,000 22.5 168 139.2 100.8 83.5
Handysize Tanker (Jones Act) 50,000 MAN 5G50 ME-C9 7,700 14.5 170 140.8 31.4 26.0

68
Table 16: 1-Year Time Charter Rate Equivalents by Vessel Type – 5-year Historical Average,
$/day
(Sources: Bloomberg Intelligence 2018, Fearnleys 2012-2018)
Table 17: Adjusted 1-Year Time Charter Rate Equivalents by Vessel Type, $/day
(Source: Excel Goal Seek Function holding all other inputs constant)
Capital Structure and Cost of Capital. Two capital structures are used in the analysis. For
international ships, the EIB Green Shipping Programme is assumed at a 50/50 debt to equity
ratio. For Jones Act vessels, MARAD’s Federal Ship Financing Program (Title XI) is assumed
at up to 87.5% debt.
Vessel TypeDaily Charter Rate
(1-year Avg)
Daily Charter Rate
(Std Dev)
Panamax Bulker 8,771 2,006
Capesize Bulker 12,265 4,334
Aframax Tanker 17,504 5,178
VLCC Tanker 29,256 10,063
Panamax Containership 8,100 1,878
Post-Panamax Containership 23,142 5,365
Panamax Containership (Jones Act) 50,679 N/A
Handysize Tanker (Jones Act) 38,148 N/A
Panamax Bulker 23,500
Capesize Bulker 35,000
Aframax Tanker 35,000
VLCC Tanker 63,000
Panamax Containership 24,000
Post-Panamax Containership 61,500
Panamax Containership (Jones Act) 91,000
Handysize Tanker (Jones Act) 58,000

69
Table 18: Illustrative Financing Structure and Cost of Capital Summary
(Sources: Bloomberg Intelligence 2018, MARAD N.D., Gaudet 2016)
Cost of equity was determined by for each program by finding the average of company
comparables’ unlevered betas. Beta is a measure of a company’s volatility as compared to a
benchmark index or portfolio. Unlevered beta is calculated by:
βUnlevered = βLevered / (1+(1-τ)*(Debt/Equity))
where, τ equals the tax rate, and debt and equity are market values. Once the average unlevered
beta was calculated, beta was relevered according to the capital structure (i.e. debt to equity
ratio) using the equation above. Then the capital asset pricing model (CAPM) was used to
calculate the cost of equity by:
ke = krf + β*MRP
Financing Structure
Equity 13.75
% Equity 50.00%
Cost of Equity 15.17%
Debt 13.75
% Debt 50.00%
Cost of Debt 4.87%
Total CAPEX 27.50
Scrubber Premium 5.00
LNG-Capable Premium 20.00%
WACC 9.17%
Tax Rate 35.00%
Inflation 2.00%
Ship Company Location 2
Jones Act Vessel (US) 1
International 2

70
where ke equals the cost of equity, krf equals the risk-free rate (an appropriate treasury or
LIBOR rate), β equals the levered beta, and MRP equals the market risk premium (assumed
to be 6.0%). Cost of debt was determined by using either a proximal treasury rate for Jones
Act vessels or a proximal LIBOR rate plus approximately 150 bps for international vessels.
See Appendix 2 for a more detailed analysis.
Fuel Prices. Fuel prices are a key driver in the business case analysis. Several price decks are
used for each fuel type of fuel oil (IFO 380/180), LS distillates (MDO/MGO), and LNG.
The base case price deck assumes a constant growth at the inflation rate and uses Singapore
fuel prices as the benchmark, with LS distillates selling at 1.6x higher than fuel oil, which is
the approximate average of the premium over the last 5 years (Bloomberg Intelligence 2018).
The EIA price deck assumes delivered cost of fuel types for the transportation sector, with LS
distillates selling at approximately 2.0x fuel oil, representing a static upper-bound on LS
distillate prices (EIA February 2018). The dynamic price deck forecasts fuel prices based on a
mean reversion analysis (lag regression accounting for seasonality) of historical prices, and
these prices are simulated using @Risk. In all price decks, IFO180 has a 10% premium over
IFO380, and MGO has a 10% premium over MDO. LNG fuel prices are calculated using
Henry Hub as the basis and adding the costs of gas procurement, liquefaction, and delivery to
the bunkering vessel. For the base case, LNG prices are calculated from Henry Hub forward
prices and assume a 15% gas procurement fee, a $2-3/MMBtu liquefaction fee, and a $1-
3/MMBtu bunker delivery fee. For the EIA price deck, LNG price is the cost of delivered
gas to the transportation sector. In the dynamic price decks, Henry Hub prices are forecasted
via an @Risk simulation. See Appendices 3 and 4 for a more detailed analysis.
Salvage Value. Most ships have a useful life between 20-30 years, depending on several factors.
At the end of its useful life, shipowners typically scrap their vessels to capture the salvage value
of the metal. The analysis accounts for salvage value at the end of 30 years based on historical
values of light displacement tonnage (ldt), which is essentially the bare steel of the ship. Table
19 shows 5-year historical average salvage values by vessel class.

71
Table 19: End of Useful Life Salvage Value, based on $/ldt
(Source: Fearnleys 2012-2018)
RESULTS
The sections below summarize the results by vessel type for each price deck scenario. For the
base case and EIA case, static assumptions are used for the following variables: charterer time
(70%), average port calls per week (1 for bulker, 1.5 for tanker, 2 for containership),
cruising/at-sea mode (60%), ECA time (25%), scrubber premium ($3-8 million), LNG-
capable premium (20%). Debt to equity ratios also remain constant at 50/50 for international
vessels and 87.5/12.5 for Jones Act vessels (max leverage as per the FSFP Title XI program).
The key metric to consider is payback periods across the 3 investment options that meet IMO
emissions standards to gain insight on the competitiveness of each option.
Vessel Type DWT LDT $/LDT Scrap Value
Panamax Bulker 67,271 10,737 381 4,092,459
Capesize Bulker 142,495 19,164 415 7,956,810
Aframax Tanker 95,544 15,823 410 6,487,498
VLCC Tanker 276,730 38,305 430 16,471,150
Panamax Containership 42,678 14,918 386 5,760,706
Post-Panamax Containership 80,858 22,830 398 9,086,141
Panamax Containership (Jones Act) 42,678 14,918 386 5,760,706
Handysize Tanker (Jones Act) 38,368 8,201 368 3,019,535

72
Figure 35: Business Case Analysis Results for All Vessel Types and Price Scenarios
8.0 6.8
4.6
12.0
14.1
5.9
9.4
7.8
5.5
8.9 8.7
5.5
0.0
2.0
4.0
6.0
8.0
10.0
12.0
14.0
16.0
Base Case EIA Case Dynamic Case
Pay
bac
k (Y
ears
)Panamax Bulker Payback Comparison
As-Is NOx Only SOx and NOx LNG-Capable
8.1 7.0
3.6
11.7
13.7
4.2
9.3
7.8
4.1
9.0 8.8
4.2
0.0
2.0
4.0
6.0
8.0
10.0
12.0
14.0
16.0
Base Case EIA Case Dynamic Case
Pay
bac
k (Y
ears
)
Capesize Bulker Payback Comparison
As-Is NOx Only SOx and NOx LNG-Capable
8.1 6.9
13.2
10.1 10.4
18.7
9.2 7.7
16.2
9.0 8.2
15.8
0.0
5.0
10.0
15.0
20.0
Base Case EIA Case Dynamic Case
Pay
bac
k (Y
ears
)
Aframax Tanker Payback Comparison
As-Is NOx Only SOx and NOx LNG-Capable
8.2 7.1
10.5 11.2
13.1
16.0
9.2 7.9
12.8
9.0 8.8
12.7
0.0
5.0
10.0
15.0
20.0
Base Case EIA Case Dynamic CaseP
ayb
ack (Y
ears
)
VLCC Tanker Payback Comparison
As-Is NOx Only SOx and NOx LNG-Capable
8.1 6.9
12.2 13.1
15.0
18.9
10.2
8.3
17.2
8.8 8.5
15.1
0.0
5.0
10.0
15.0
20.0
Base Case EIA Case Dynamic Case
Pay
bac
k (Y
ears
)
Panamax Containership Payback Comparison
As-Is NOx Only SOx and NOx LNG-Capable
8.1 7.1
12.6
21.7
26.6
20.4
10.1 8.4
16.4
8.2 9.2
14.6
0.0
5.0
10.0
15.0
20.0
25.0
30.0
Base Case EIA Case Dynamic Case
Pay
bac
k (Y
ears
)
Post-Panamax Containership Payback Comparison
As-Is NOx Only SOx and NOx LNG-Capable
8.4
7.2
8.6
10.4 10.4 10.7
8.9
7.5
9.3 9.5 8.7
10.2
0.0
2.0
4.0
6.0
8.0
10.0
12.0
Base Case EIA Case Dynamic Case
Pay
bac
k (Y
ears
)
Panamax Containership (Jones Act Vessel) Payback Comparison
As-Is NOx Only SOx and NOx LNG-Capable
8.5
7.0
9.6 9.4 8.4
10.8
8.9
7.3
10.3 9.8
8.3
11.5
0.0
2.0
4.0
6.0
8.0
10.0
12.0
14.0
Base Case EIA Case Dynamic Case
Pay
bac
k (Y
ears
)
Handysize Tanker (Jones Act) Payback Comparison
As-Is NOx Only SOx and NOx LNG-Capable

73
Base Case
In the base case, LNG-capable vessels are competitive in all vessel types, except for the two
Jones Act vessels. LNG-capable vessels are more competitive than both low sulfur fuel and
scrubbers. The LNG-capable Jones Act containership is more competitive than low sulfur
fuel option, but not scrubbers.
EIA Case
In the EIA case, the results are more dramatic. Scrubbers become the most competitive
option for all vessel types. This is likely due to the larger differential between HFO and MGO,
making the payback to scrubbers even more attractive than LNG. However, LNG is still a
competitive option, particularly for the Panamax containership.
Dynamic Case
For the dynamic case, triangular distributions (min, most likely, max) are used for the following
variables: charterer time (50%, 70%, 90%), cruising/at-sea mode (50%, 60%, 70%), ECA time
(0%, 25%, 100%),), LNG-capable premium (10%, 20%, 25%), and equity-to-debt ratios for
Jones Act vessels (12.5%, 12.5%, 50%) and international vessels (10%, 50%, 50%). Charter
rates also have a triangular distribution based on the high and low time charter equivalent
(TCE) rates since 2000. Scrubber/SCR CAPEX and OPEX and average port calls per week
(1 for bulker, 1.5 for tanker, 2 for containership) remain constant. The payback figures are
the mean value for each ship configuration. See Appendix 8 for more detailed @Risk Outputs.
In the dynamic case, the results vary more noticeably than the previous two cases. First, LS
fuel cannot compete against scrubbers or LNG-capable in any case except the Handysize
tanker Jones Act vessel. Second, in the Bulker category, LNG-capable is equally competitive
as scrubbers for the Panamax bulker but just slightly less competitive for the Capesize bulker.
Third, both the Aframax Tanker and VLCC tanker achieve the most competitive results with
LNG-capable, though scrubbers are not far behind. Last, for both containerships LNG-
capable is by far the most competitive option likely due to lower fuel price and OPEX.

74
SENSITIVITY ANALYSIS
One of the primary driving factors for LNG-capable ship competitiveness is the percentage
of time a ship spends in an ECA, as this will increase the OPEX of scrubbers and/or SCR
systems. Therefore, the below sensitivity analysis tests the effects of ECA time at 50% and
100% compared to the baseline of 25% on the investment decision.

75
Figure 36: Business Case Analysis Results at 50% ECA Time
8.0 6.8
4.6
12.5
14.5
5.9
9.8
8.0
5.5
8.9 8.7
5.5
0.0
2.0
4.0
6.0
8.0
10.0
12.0
14.0
16.0
Base Case EIA Case Dynamic Case
Pay
bac
k (Y
ears
)Panamax Bulker Payback Comparison
As-Is NOx Only SOx and NOx LNG-Capable
8.1 7.0
3.6
12.1
14.1
4.2
9.6
8.1
4.1
9.0 8.8
4.2
0.0
2.0
4.0
6.0
8.0
10.0
12.0
14.0
16.0
Base Case EIA Case Dynamic Case
Pay
bac
k (Y
ears
)
Capesize Bulker Payback Comparison
As-Is NOx Only SOx and NOx LNG-Capable
8.1 6.9
13.2
10.3 10.6
18.7
9.4 7.8
16.2
9.0 8.2
15.8
0.0
5.0
10.0
15.0
20.0
Base Case EIA Case Dynamic Case
Pay
bac
k (Y
ears
)
Aframax Tanker Payback Comparison
As-Is NOx Only SOx and NOx LNG-Capable
8.2 7.1
10.5 11.6
13.4
16.0
9.5 8.1
12.8
9.0 8.8
12.7
0.0
5.0
10.0
15.0
20.0
Base Case EIA Case Dynamic CaseP
ayb
ack (Y
ears
)
VLCC Tanker Payback Comparison
As-Is NOx Only SOx and NOx LNG-Capable
8.1 6.9
12.2
14.1 15.8
18.9
11.0
8.8
17.2
8.8 8.5
15.1
0.0
5.0
10.0
15.0
20.0
Base Case EIA Case Dynamic Case
Pay
bac
k (Y
ears
)
Panamax Containership Payback Comparison
As-Is NOx Only SOx and NOx LNG-Capable
8.1 7.1
12.6
29.0 27.2
20.4
10.9 8.9
16.4
8.2 9.2
14.6
0.0
5.0
10.0
15.0
20.0
25.0
30.0
35.0
Base Case EIA Case Dynamic Case
Pay
bac
k (Y
ears
)
Post-Panamax Containership Payback Comparison
As-Is NOx Only SOx and NOx LNG-Capable
8.4
7.2
8.6
10.5 10.6 10.7
9.1
7.7
9.3 9.5 8.7
10.2
0.0
2.0
4.0
6.0
8.0
10.0
12.0
Base Case EIA Case Dynamic Case
Pay
bac
k (Y
ears
)
Panamax Containership (Jones Act Vessel) Payback Comparison
As-Is NOx Only SOx and NOx LNG-Capable
8.5
7.0
9.6 9.5 8.4
10.8
9.0
7.4
10.3 9.8
8.3
11.5
0.0
2.0
4.0
6.0
8.0
10.0
12.0
14.0
Base Case EIA Case Dynamic Case
Pay
bac
k (Y
ears
)
Handysize Tanker (Jones Act) Payback Comparison
As-Is NOx Only SOx and NOx LNG-Capable

76
Base Case
At 50% ECA time, LNG-capable is the most competitive option across all vessel types except
the Jones Act vessels.
At 100% ECA time, the results are even more dramatic. All LNG-capable ships, except the
Handysize tanker Jones Act vessel (which is almost as competitive as scrubbers). LNG-
capable bulkers and containerships notably outperform both LS fuel and scrubbers, with
tankers less significantly so. A key takeaway from the 100% ECA time analysis is that LNG-
capability might be the better option both inside and outside an ECA, as it would keep overall
OPEX and fuel costs lower by avoiding having to switch between compliant and non-
compliant fuels.
EIA Case
At 50% ECA time, scrubbers are more competitive than LNG-capable ships except in the
case of the Panamax containership.
At 100% ECA time, LNG-capability across all vessel classes approaches competitive parity
with scrubbers, particularly for bulkers and tankers. Both the Panamax and Post-Panamax
containerships end up being more competitive with LNG-capable than with scrubbers. Even
Jones Act vessels, particularly the Panamax containership, begin to approach parity with
scrubbers. Given how much time Jones Act vessels spend inside an ECA (since they are
traveling between US ports), LNG-capability may offer a better long-term solution than
scrubbers or LS fuel, particularly if liquefaction capacity and LNG bunkering continue to
expand in the US.
Dynamic Case
There are no changes to the dynamic case as changes in ECA time are reflected in the
simulation.

77
Figure 37: Business Case Analysis Results at 100% ECA Time
8.0 6.8
4.6
13.5
15.3
5.9
10.7
8.5
5.5
8.9 8.7
5.5
0.0
5.0
10.0
15.0
20.0
Base Case EIA Case Dynamic Case
Pay
bac
k (Y
ears
)Panamax Bulker Payback Comparison
As-Is NOx Only SOx and NOx LNG-Capable
8.1 7.0
3.6
12.9
14.8
4.2
10.4
8.5
4.1
9.0 8.8
4.2
0.0
2.0
4.0
6.0
8.0
10.0
12.0
14.0
16.0
Base Case EIA Case Dynamic Case
Pay
bac
k (Y
ears
)
Capesize Bulker Payback Comparison
As-Is NOx Only SOx and NOx LNG-Capable
8.1 6.9
13.2
10.7 10.9
18.7
9.9
8.1
16.2
9.0 8.2
15.8
0.0
5.0
10.0
15.0
20.0
Base Case EIA Case Dynamic Case
Pay
bac
k (Y
ears
)
Aframax Tanker Payback Comparison
As-Is NOx Only SOx and NOx LNG-Capable
8.2 7.1
10.5
12.3
14.0
16.0
10.3
8.5
12.8
9.0 8.8
12.7
0.0
5.0
10.0
15.0
20.0
Base Case EIA Case Dynamic CaseP
ayb
ack (Y
ears
)
VLCC Tanker Payback Comparison
As-Is NOx Only SOx and NOx LNG-Capable
8.1 6.9
12.2
16.9 17.4 18.9
13.3
9.8
17.2
8.8 8.5
15.1
0.0
5.0
10.0
15.0
20.0
Base Case EIA Case Dynamic Case
Pay
bac
k (Y
ears
)
Panamax Containership Payback Comparison
As-Is NOx Only SOx and NOx LNG-Capable
8.1 7.1
12.6
0.0
27.2
20.4
13.0
9.9
16.4
8.2 9.2
14.6
0.0
5.0
10.0
15.0
20.0
25.0
30.0
Base Case EIA Case Dynamic Case
Pay
bac
k (Y
ears
)
Post-Panamax Containership Payback Comparison
As-Is NOx Only SOx and NOx LNG-Capable
8.4
7.2
8.6
10.9 10.8 10.7 9.6
7.9
9.3 9.5 8.7
10.2
0.0
2.0
4.0
6.0
8.0
10.0
12.0
Base Case EIA Case Dynamic Case
Pay
bac
k (Y
ears
)
Panamax Containership (Jones Act Vessel) Payback Comparison
As-Is NOx Only SOx and NOx LNG-Capable
8.5
7.0
9.6 9.6 8.5
10.8
9.2
7.5
10.3 9.8
8.3
11.5
0.0
2.0
4.0
6.0
8.0
10.0
12.0
14.0
Base Case EIA Case Dynamic Case
Pay
bac
k (Y
ears
)
Handysize Tanker (Jones Act) Payback Comparison
As-Is NOx Only SOx and NOx LNG-Capable

78
ALTERNATIVE METHODOLOGY
The above analysis takes a total cost of ownership approach to evaluating the investment
options to meet IMO compliance. A simpler method would be to isolate the specific
investment option and compare its costs and paybacks to the as-is case (i.e. a shipowner does
nothing and continues to use non-compliant HFO). More specifically, the method would be
similar to the analysis of an energy efficiency project, whereby the OPEX savings (perceived
or real) from implementing an energy efficiency solution would amortize the upfront CAPEX
in reasonable (or acceptable) payback period. In this analysis, the investment in a scrubber or
LNG-capability would generate significant fuel cost savings compared to switching to LS fuel.
These fuel cost savings would then amortize the upfront CAPEX of a scrubber or LNG-
capable system. The unlevered cost of equity (i.e. the weighted average cost of capital or
WACC) is used as the discount rate, as the analysis assumes 100% equity financing, over 10
years. The analysis below demonstrates this methodology. All variables are static as per the
methodology described in the previous section. See Appendix 7 for a more detailed
description of the Fuel Cost Savings and Payback to LS Fuel method.

79
Figure 38: Investment Costs Results for All Vessel Types and Price Decks
13.3 15.0 11.1
23.5
39.2
20.3 16.4 18.1
14.4 18.3
26.4
16.7
0.0
10.0
20.0
30.0
40.0
50.0
Base Case EIA Case Dynamic CaseInve
stm
ent
Co
sts
($ m
illio
ns)
Panamax Bulker Investment Costs Comparison
As-Is LS Fuel Scrubber LNG-Capable
20.2 22.8 16.9
35.5
59.4
30.6 24.4
27.0 21.5
28.1
40.5
25.5
0.0
10.0
20.0
30.0
40.0
50.0
60.0
70.0
Base Case EIA Case Dynamic CaseInve
stm
ent
Co
sts
($ m
illio
ns)
Capesize Bulker Investment Costs Comparison
As-Is LS Fuel Scrubber LNG-Capable
13.7 15.4 11.8
24.1
40.3
21.5 18.6 20.3
17.0 21.4
29.1
19.9
0.0
10.0
20.0
30.0
40.0
50.0
Base Case EIA Case Dynamic CaseInve
stm
ent
Co
sts
($ m
illio
ns)
Aframax Tanker Investment Costs Comparison
As-Is LS Fuel Scrubber LNG-Capable
34.6 39.0 30.0
60.0
101.0
53.4 42.9
47.3 38.9
49.4
70.5
45.7
0.0
20.0
40.0
60.0
80.0
100.0
120.0
Base Case EIA Case Dynamic CaseInve
stm
ent
Co
sts
($ m
illio
ns)
VLCC Tanker Investment Costs Comparison
As-Is LS Fuel Scrubber LNG-Capable
13.0 14.7 11.5
25.1
40.5
23.4
16.4 18.1 15.4 17.6
25.1
16.6
0.0
10.0
20.0
30.0
40.0
50.0
Base Case EIA Case Dynamic Case
Inve
stm
ent
Co
sts
($ m
illio
ns)
Panamax Containership Investment Costs Comparison
As-Is LS Fuel Scrubber LNG-Capable
55.0 62.0 48.5
95.8
160.9
86.7 63.7 70.7
58.3 61.3
93.4
57.5
0.0
50.0
100.0
150.0
200.0
Base Case EIA Case Dynamic Case
Inve
stm
ent
Co
sts
($ m
illio
ns)
Post-Panamax Containership Investment Costs Comparison
As-Is LS Fuel Scrubber LNG-Capable
42.9 49.1 37.5
75.0
126.3
67.3 47.0 53.2
42.5
66.0
92.4
62.2
0.0
50.0
100.0
150.0
Base Case EIA Case Dynamic Case
Inve
stm
ent
Co
sts
($ m
illio
ns)
Panamax Containership (Jones Act Vessel) Investment Costs Comparison
As-Is LS Fuel Scrubber LNG-Capable
13.5 15.4 11.5
23.8
39.9
21.0 16.0 17.9
14.3
29.1
37.4
27.2
0.0
10.0
20.0
30.0
40.0
50.0
Base Case EIA Case Dynamic Case
Inve
stm
ent
Co
sts
($ m
illio
ns)
Handysize Tanker (Jones Act) Investment Costs Comparison
As-Is LS Fuel Scrubber LNG-Capable
80
Base Case
In the base case, all ships types that are LNG-capable are more competitive than LS fuel except
for the Handysize tanker (Jones Act Vessel). From a cost perspective, only the LNG-capable
Post-Panamax containership is more competitive than a scrubber.
EIA Case
In the EIA case, which is a higher fuel price environment, the scrubber is the most competitive
option by far across all vessel types. In addition, the payback periods for both scrubbers and
LNG-capable drop dramatically due to the higher LS fuel prices.
Dynamic Case
The dynamic case shows the mean values of the Investment Costs from an @Risk Simulation.
It assumes the same distribution for analyzed variables as the first methodology above. In this
case, for all ships LS fuel is the least competitive option except for the Handysize tanker (Jones
Act vessel). Only the LNG-capable Post-Panamax containership is more competitive than
scrubbers. See Appendix 9 for more detailed @Risk Outputs.
SENSITIVITY ANALYSIS

81
Figure 39: Investment Costs Results at 50% ECA Time
13.3 15.0 11.1
24.2
39.9
20.3 16.8 18.5
14.4 18.3
26.4
16.7
0.0
10.0
20.0
30.0
40.0
50.0
Base Case EIA Case Dynamic CaseInve
stm
ent
Cost
s ($
millions)
Panamax Bulker Investment Costs Comparison
As-Is LS Fuel Scrubber LNG-Capable
20.2 22.8 16.9
36.5
60.5
30.6 25.0
27.6 21.5
28.1
40.5
25.5
0.0
10.0
20.0
30.0
40.0
50.0
60.0
70.0
Base Case EIA Case Dynamic CaseInve
stm
ent
Cost
s ($
millions)
Capesize Bulker Investment Costs Comparison
As-Is LS Fuel Scrubber LNG-Capable
13.7 15.4 11.8
24.9
41.1
21.5 19.0 20.7
17.0 21.4
29.1
19.9
0.0
10.0
20.0
30.0
40.0
50.0
Base Case EIA Case Dynamic CaseInve
stm
ent
Cost
s ($
millions)
Aframax Tanker Investment Costs Comparison
As-Is LS Fuel Scrubber LNG-Capable
34.6 39.0 30.0
61.9
102.8
53.4 43.9
48.3 38.9
49.4
70.5
45.7
0.0
20.0
40.0
60.0
80.0
100.0
120.0
Base Case EIA Case Dynamic CaseInve
stm
ent
Cost
s ($
millions)
VLCC Tanker Investment Costs Comparison
As-Is LS Fuel Scrubber LNG-Capable
13.0 14.7 11.5
26.4
41.8
23.4
17.2 18.8 15.4 17.6
25.1
16.6
0.0
10.0
20.0
30.0
40.0
50.0
Base Case EIA Case Dynamic Case
Inve
stm
ent
Cost
s ($
millions)
Panamax Containership Investment Costs Comparison
As-Is LS Fuel Scrubber LNG-Capable
55.0 62.0 48.5
98.6
163.7
86.7 65.3 72.3
58.3 61.3
93.4
57.5
0.0
50.0
100.0
150.0
200.0
Base Case EIA Case Dynamic Case
Inve
stm
ent
Cost
s ($
millions)
Post-Panamax Containership Investment Costs Comparison
As-Is LS Fuel Scrubber LNG-Capable
42.9 49.1 37.5
77.3
128.6
67.3 48.3 54.5
42.5
66.0
92.4
62.2
0.0
50.0
100.0
150.0
Base Case EIA Case Dynamic Case
Inve
stm
ent
Co
sts
($ m
illio
ns)
Panamax Containership (Jones Act Vessel) Investment Costs Comparison
As-Is LS Fuel Scrubber LNG-Capable
13.5 15.4 11.5
24.6
40.7
21.0 16.4 18.3
14.3
29.1
37.4
27.2
0.0
10.0
20.0
30.0
40.0
50.0
Base Case EIA Case Dynamic Case
Inve
stm
ent
Co
sts
($ m
illio
ns)
Handysize Tanker (Jones Act) Investment Costs Comparison
As-Is LS Fuel Scrubber LNG-Capable

82
Base Case
At 50% ECA time, both LS fuel and scrubber costs increase, but only LNG-capable Post-
Panamax containerships are more competitive scrubbers, with Panamax containerships nearly
reaching parity with scrubbers.
At 100% ECA time, payback spreads between LNG-capable and scrubbers continue to
compress. Both LNG-capable containerships become more competitive than scrubbers from
a cost standpoint, and bulkers and tankers are approaching parity.
EIA Case
At 50% ECA time, scrubbers are the most competitive option across all vessel types.
At 100% ECA time, LNG-capable and scrubber spreads continue to compress, but scrubbers
remain the most competitive option in terms of costs and payback. However, LNG-capable
ships still largely outperform LS fuel from a cost perspective.
Dynamic Case
There are no changes to the dynamic case as changes in ECA time are reflected in the
simulation.

83
Figure 40: Investment Costs Results at 100% ECA Time
13.3 15.0 11.1
25.6
41.3
20.3 17.5 19.2
14.4 18.3
26.4
16.7
0.0
10.0
20.0
30.0
40.0
50.0
Base Case EIA Case Dynamic CaseInve
stm
ent
Cost
s ($
millions)
Panamax Bulker Investment Costs Comparison
As-Is LS Fuel Scrubber LNG-Capable
20.2 22.8 16.9
38.6
62.6
30.6 26.2
28.8 21.5
28.1
40.5
25.5
0.0
10.0
20.0
30.0
40.0
50.0
60.0
70.0
Base Case EIA Case Dynamic CaseInve
stm
ent
Cost
s ($
millions)
Capesize Bulker Investment Costs Comparison
As-Is LS Fuel Scrubber LNG-Capable
13.7 15.4 11.8
26.4
42.6
21.5 19.8 21.6 17.0
21.4
29.1
19.9
0.0
10.0
20.0
30.0
40.0
50.0
Base Case EIA Case Dynamic CaseInve
stm
ent
Cost
s ($
millions)
Aframax Tanker Investment Costs Comparison
As-Is LS Fuel Scrubber LNG-Capable
34.6 39.0 30.0
65.6
106.6
53.4 46.0
50.4 38.9
49.4
70.5
45.7
0.0
20.0
40.0
60.0
80.0
100.0
120.0
Base Case EIA Case Dynamic CaseInve
stm
ent
Cost
s ($
millions)
VLCC Tanker Investment Costs Comparison
As-Is LS Fuel Scrubber LNG-Capable
13.0 14.7 11.5
29.1
44.5
23.4 18.6 20.3
15.4 17.6
25.1
16.6
0.0
10.0
20.0
30.0
40.0
50.0
Base Case EIA Case Dynamic Case
Inve
stm
ent
Cost
s ($
millions)
Panamax Containership Investment Costs Comparison
As-Is LS Fuel Scrubber LNG-Capable
55.0 62.0 48.5
104.3
169.4
86.7 68.4 75.5
58.3 61.3
93.4
57.5
0.0
50.0
100.0
150.0
200.0
Base Case EIA Case Dynamic Case
Inve
stm
ent
Cost
s ($
millions)
Post-Panamax Containership Investment Costs Comparison
As-Is LS Fuel Scrubber LNG-Capable
42.9 49.1 37.5
82.0
133.3
67.3 50.9 57.1
42.5
66.0
92.4
62.2
0.0
50.0
100.0
150.0
Base Case EIA Case Dynamic Case
Inve
stm
ent
Co
sts
($ m
illio
ns)
Panamax Containership (Jones Act Vessel) Investment Costs Comparison
As-Is LS Fuel Scrubber LNG-Capable
13.5 15.4 11.5
26.0
42.1
21.0 17.2 19.1
14.3
29.1
37.4
27.2
0.0
10.0
20.0
30.0
40.0
50.0
Base Case EIA Case Dynamic Case
Inve
stm
ent
Co
sts
($ m
illio
ns)
Handysize Tanker (Jones Act) Investment Costs Comparison
As-Is LS Fuel Scrubber LNG-Capable

84
NON-COMPLIANCE CONSIDERATIONS
In the analyses above, the as-is ship configuration assumes that a shipowner does not invest
in a newbuild that considers emissions controls and continues to use non-compliant high-
sulfur fuel oil. While it is unlikely that a shipowner will not do anything to meet the new
emissions standards, there may be shipowners that will risk using non-compliant fuels for a
period of time after 2020 if they believe that enforcement will be lax or the costs of a potential
financial penalty are still not as much as switching to LS fuel or investing in scrubbers or LNG-
capability. It is still to be determined how the global 0.5% sulfur cap will be enforced (at the
international or state level), but current non-compliance penalties in existing ECAs can be
used as a proxy to determine how the costs of an as-is ship could be affected by continuing to
use a non-compliant fuel.
In the US, there is a maximum statutory penalty of $25,000 per day per violation for using a
non-compliant fuel without emissions controls (EPA 2015, p. 15). Assuming this value as an
upper-bound penalty for non-compliance, the analysis below shows how the costs of an as-is
ship become much less, if altogether not, competitive to other options that meet emissions
controls. The analysis assumes that the 0.5% sulfur cap essentially creates a global ECA, so
ships would be operating 100% of the time in an ECA. All other parameters are the same as
stated in the previous section on the Fuel Cost Savings Methodology in the static cases. Note:
only the base case and EIA case price scenarios were run for this non-compliance
consideration analysis.

85
Figure 41: Effect of Non-Compliance Penalty of $25,000/day and 100% ECA Time
47.0 48.7
11.1
25.6
41.3
20.3 17.5 19.2
14.4 18.3
26.4
16.7
0.0
10.0
20.0
30.0
40.0
50.0
60.0
Base Case EIA Case Dynamic CaseInve
stm
ent
Cost
s ($
millions)
Panamax Bulker Investment Costs Comparison
As-Is LS Fuel Scrubber LNG-Capable
53.9 56.5
16.9
38.6
62.6
30.6 26.2
28.8 21.5
28.1
40.5
25.5
0.0
10.0
20.0
30.0
40.0
50.0
60.0
70.0
Base Case EIA Case Dynamic CaseInve
stm
ent
Cost
s ($
millions)
Capesize Bulker Investment Costs Comparison
As-Is LS Fuel Scrubber LNG-Capable
47.3 49.1
11.8
26.4
42.6
21.5 19.8 21.6 17.0
21.4
29.1
19.9
0.0
10.0
20.0
30.0
40.0
50.0
60.0
Base Case EIA Case Dynamic CaseInve
stm
ent
Cost
s ($
millions)
Aframax Tanker Investment Costs Comparison
As-Is LS Fuel Scrubber LNG-Capable
68.3 72.7
30.0
65.6
106.6
53.4 46.0
50.4 38.9
49.4
70.5
45.7
0.0
20.0
40.0
60.0
80.0
100.0
120.0
Base Case EIA Case Dynamic CaseInve
stm
ent
Cost
s ($
millions)
VLCC Tanker Investment Costs Comparison
As-Is LS Fuel Scrubber LNG-Capable
46.7 48.4
11.5
29.1
44.5
23.4 18.6 20.3
15.4 17.6
25.1
16.6
0.0
10.0
20.0
30.0
40.0
50.0
60.0
Base Case EIA Case Dynamic Case
Inve
stm
ent
Cost
s ($
millions)
Panamax Containership Investment Costs Comparison
As-Is LS Fuel Scrubber LNG-Capable
88.6 95.7
48.5
104.3
169.4
86.7 68.4 75.5
58.3 61.3
93.4
57.5
0.0
50.0
100.0
150.0
200.0
Base Case EIA Case Dynamic Case
Inve
stm
ent
Cost
s ($
millions)
Post-Panamax Containership Investment Costs Comparison
As-Is LS Fuel Scrubber LNG-Capable
86.2 92.3
37.5
82.0
133.3
67.3 50.9 57.1
42.5
66.0
92.4
62.2
0.0
50.0
100.0
150.0
Base Case EIA Case Dynamic Case
Inve
stm
ent
Co
sts
($ m
illio
ns)
Panamax Containership (Jones Act Vessel) Investment Costs Comparison
As-Is LS Fuel Scrubber LNG-Capable
56.7 58.7
11.5
26.0
42.1
21.0 17.2 19.1 14.3
29.1 37.4
27.2
0.0
20.0
40.0
60.0
80.0
Base Case EIA Case Dynamic Case
Inve
stm
ent
Co
sts
($ m
illio
ns)
Handysize Tanker (Jones Act) Investment Costs Comparison
As-Is LS Fuel Scrubber LNG-Capable

86
As shown in Figure 42, there is an extreme financial effect of the non-compliance penalty at
the $25,000 per day level. For all ship types, except the Post-Panamax Containership, the As-
Is ship configuration becomes very uncompetitive to the other three options that meet
emission controls. For the Post-Panamax Containership, the LS fuel option remains slightly
more expensive but that is likely due to the amount of fuel this type of vessel consumes
annually. As shown in Figure 43, at a much more conservative estimate of a non-compliance
penalty at $5,000/day, the scrubber and LNG-capable options become more competitive than
the As-Is ship for nearly all ship types in the base case price scenario. Scrubbers appear to be
the more competitive option in the EIA case price scenario.
While it is still uncertain how the IMO will enforce compliance with the global 0.5% sulfur
cap, recent amendments to MARPOL Annex VI approved by the Marine Environment
Protection Committee (MEPC) 72 continue to put non-compliant fuel oil on the ropes.
MEPC approved amendments that would ban the carriage of non-compliant fuel altogether
unless the ship utilized an EGCS (scrubber). Additionally, mandatory data collection for fuel
oil consumption becomes effective January 2019, which has a dual purpose of tracking
compliant fuel oil usage as well as compliance with EEDI requirements (IMO April 2018).
While the use of a scrubber can fulfill compliance with the new emissions controls, the
significant upfront CAPEX, additional OPEX, and uncertainty about non-compliant fuel
prices post-2020 creates a dubious long-term investment option for shipowners. Further,
several marine fuel providers like Exxon, Shell, and BP have already announced commitments
to supply the market with LS compliant fuel oil in addition to existing LS distillates like
MDO/MGO. Time will tell what the premium on these compliant fuels will be as well as how
quickly they can be available in ports at a global scale. Nevertheless, the strong trend towards
cleaner fuel likely makes continued use of non-compliant fuel with a scrubber less attractive
than switching to compliant fuel, particularly if non-compliant fuel prices begin to climb. This
gives LNG-capable ships yet another opportunity to compete in the long-run as the shipping
community transitions towards a cleaner fleet.

87
Figure 42: Effect of Non-Compliance Penalty of $5,000/day and 100% ECA time
20.0 21.7
11.1
25.6
41.3
20.3 17.5 19.2
14.4 18.3
26.4
16.7
0.0
10.0
20.0
30.0
40.0
50.0
Base Case EIA Case Dynamic CaseInve
stm
ent
Cost
s ($
millions)
Panamax Bulker Investment Costs Comparison
As-Is LS Fuel Scrubber LNG-Capable
27.0 29.6
16.9
38.6
62.6
30.6 26.2
28.8 21.5
28.1
40.5
25.5
0.0
10.0
20.0
30.0
40.0
50.0
60.0
70.0
Base Case EIA Case Dynamic CaseInve
stm
ent
Cost
s ($
millions)
Capesize Bulker Investment Costs Comparison
As-Is LS Fuel Scrubber LNG-Capable
20.4 22.1
11.8
26.4
42.6
21.5 19.8 21.6 17.0
21.4
29.1
19.9
0.0
10.0
20.0
30.0
40.0
50.0
Base Case EIA Case Dynamic CaseInve
stm
ent
Cost
s ($
millions)
Aframax Tanker Investment Costs Comparison
As-Is LS Fuel Scrubber LNG-Capable
41.3 45.8
30.0
65.6
106.6
53.4 46.0
50.4 38.9
49.4
70.5
45.7
0.0
20.0
40.0
60.0
80.0
100.0
120.0
Base Case EIA Case Dynamic CaseInve
stm
ent
Cost
s ($
millions)
VLCC Tanker Investment Costs Comparison
As-Is LS Fuel Scrubber LNG-Capable
19.7 21.4
11.5
29.1
44.5
23.4 18.6 20.3
15.4 17.6
25.1
16.6
0.0
10.0
20.0
30.0
40.0
50.0
Base Case EIA Case Dynamic Case
Inve
stm
ent
Cost
s ($
millions)
Panamax Containership Investment Costs Comparison
As-Is LS Fuel Scrubber LNG-Capable
61.7 68.7 48.5
104.3
169.4
86.7 68.4 75.5
58.3 61.3
93.4
57.5
0.0
50.0
100.0
150.0
200.0
Base Case EIA Case Dynamic Case
Inve
stm
ent
Cost
s ($
millions)
Post-Panamax Containership Investment Costs Comparison
As-Is LS Fuel Scrubber LNG-Capable
51.6 57.7 37.5
82.0
133.3
67.3 50.9 57.1
42.5
66.0
92.4
62.2
0.0
50.0
100.0
150.0
Base Case EIA Case Dynamic Case
Inve
stm
ent
Co
sts
($ m
illio
ns)
Panamax Containership (Jones Act Vessel) Investment Costs Comparison
As-Is LS Fuel Scrubber LNG-Capable
22.1 24.0
11.5
26.0
42.1
21.0 17.2 19.1
14.3
29.1
37.4
27.2
0.0
10.0
20.0
30.0
40.0
50.0
Base Case EIA Case Dynamic Case
Inve
stm
ent
Co
sts
($ m
illio
ns)
Handysize Tanker (Jones Act) Investment Costs Comparison
As-Is LS Fuel Scrubber LNG-Capable

88
Chapter 5 – Conclusion
SUMMARY OF RESULTS
The above analysis demonstrates that LNG as a marine fuel is a competitive option for a
shipowner not only to meet IMO regulations but also for long-term sustainability (i.e. overall
emissions reductions) goals. In all scenarios LNG-capability achieves competitive financial
results. However, containerships appear to be the most promising vessel types for LNG-
capability, outcompeting scrubbers and even LS fuel at times. This is likely due to several
factors, including fuel consumption profiles, time spent in port/ECAs, and other OPEX
considerations. Time spent in an ECA as well as the price differentials between HFO and
MGO and LNG and MGO are major factors for how competitive an LNG-capable vessel is
against other options. In addition, in some cases, LNG-capable bulkers (Panamax) and tankers
(VLCC) are more competitive than scrubbers. It is worth noting that at the time of writing of
this thesis, Arista Shipping (mentioned in an earlier section) just signed a Letter of Intent (LoI)
with a Chinese shipyard to build up to 20 LNG-capable 84,000-dwt bulk carriers,11 a major
movement in this vessel type and a strong indicator that momentum for LNG-capable ships
is strong.
NOTE ON ASSUMPTIONS, SHORTFALLS, & AREAS OF FURTHER RESEARCH
The assumptions used in this analysis were intended to provide a high-level, generalized
analysis across certain vessel types. However, it is noted that the benefit of switching to an
LNG-capable vessel is more likely to be accurate on a case-by-case basis and depends on
potentially significant variation in assumptions, including include vessel design, financing
terms, OPEX, fuel prices and consumption, utilization, and charter rates. The dynamic case
11 See https://worldmaritimenews.com/archives/249255/yangzijiang-to-build-project-forwards-20-lng-fueled-
bulkers/ for more information

89
and sensitivity analysis attempted to capture that uncertainty and still demonstrate that the
LNG-capable option is viable at a statistically significant level.
The shortfalls of this analysis include: 1) how macro-level changes in fuel type supply and
demand could impact prices in the future, though the dynamic pricing scenario did try to
capture the variation that could occur in the future; 2) the limited data around ship utilization,
average annual fuel consumption, and the relationship between charter rates and bunker
prices. Most of this data is held closely by shipowners so generalizing these assumptions in
the analysis may miss some of the nuances in how ships are chartered and utilized; and 3)
understanding how quickly LNG bunkering networks will develop, which at a macro-level can
better illustrate the ‘chicken and egg’ problem shipowners face when deciding to switch to
LNG-capable ships. The increasing availability and accessibility of LNG bunker are strong
signals to shipowners that having an LNG-capable ship is an advantage, which could have a
cascading effect on engine manufacturers and ship designers and potentially drive the premium
for LNG-capability down to even more competitive levels.
Further areas of research include types of financing structures that could be developed to make
LNG-capable newbuilds more attractive (i.e. an investment tax credit, low-cost debt, etc.); the
most cost-effective bunkering solutions to ensure LNG price competitiveness with other fuels;
the cost of non-compliance at a global scale and the impact on the decision to invest in cleaner
options; and new vessel, engine, fuel system, and storage designs that will reduce the CAPEX
premium for an LNG-capable vessel.

90
Appendices
APPENDIX 1 – ASSUMPTIONS AND MODEL CONTROL PAGE
$ in
millions
unle
ss o
ther
wis
e note
d
Ves
sel
Typ
eC
on
fig
ura
tion
sC
AP
EX
OP
EX
En
gin
e T
ype
En
gin
e Siz
e (k
W)
Fu
el C
on
sum
pti
on
Dail
y C
hart
er R
ate
(5-
year
Avg
)
To D
CF
Act
ive
Sel
ctio
ns
C
hoose
==
>7
42
Ves
sel
Typ
eP
anam
ax C
onta
iner
ship
(Jo
nes
Act
)P
anam
ax B
ulk
erA
s-Is
135.
007.
32M
AN
6S80
ME
-C9
2500
0F
uel
Use
(t/
day
)10
0.80
50.6
8
CA
PE
X16
2.00
Cap
esiz
e B
ulk
erN
Ox
Only
137.
897.
60G
as U
se (
t/day
)83
.52
OP
EX
7.68
Afr
amax
Tan
ker
SO
x an
d N
Ox
142.
897.
75
Fu
el C
on
sum
pti
on
83.5
2V
LC
C T
anke
rL
NG
-Cap
able
162.
007.
68
Ch
art
er R
ate
50.6
8P
anam
ax C
onta
iner
ship
Ch
art
er R
ate
Std
Dev
N/A
UL
CV
Conta
iner
ship
Pan
amax
Conta
iner
ship
(Jo
nes
Act
)
Han
dys
ize
Tan
ker
(Jones
Act
)
Fu
el i
n U
se f
or
Pri
ce D
eck
5<
==
Choose
LN
G
Pri
ce D
eck
Sce
nari
o1
<=
=C
hoose
Bas
e C
ase
Uti
liza
tion
Fact
or
(% o
n V
oya
ge)
70%
Fin
an
cin
g S
tru
ctu
re
Char
tere
r T
ime
70%
<=
=C
han
ge (
Kee
p b
etw
een 5
0-90
%)
Equity
20.2
5
Ow
ner
Tim
e30
%%
Equity
12.5
0%<
==
Chan
ge (
Kee
p b
etw
een 1
0-50
%)
Hours
on C
har
ter
6132
Cost
of
Equity
23.3
8%
Day
s on C
har
ter
256
Deb
t14
1.75
Aver
age
Day
s in
Port
102
% D
ebt
87.5
0%
Aver
age
Port
Cal
ls p
er W
eek
1.5
<=
=C
han
ge (
Kee
p b
etw
een 1
and 2
)C
ost
of
Deb
t2.
71%
Aver
age
Tim
e in
Port
(D
ays)
1.36
Tota
l C
AP
EX
162.
00
Tan
ker
2<
==
Choose
Scr
ubbe
r P
rem
ium
5.00
<=
=C
han
ge (
Kee
p b
etw
een 3
-7)
1B
ulk
er2.
72L
NG
-Cap
able P
rem
ium
20.0
0%<
==
Chan
ge (
Kee
p b
etw
een 1
0-25
%)
2T
anke
r1.
36
3C
onta
iner
ship
0.87
WA
CC
4.46
%
% L
oad
/F
uel
Use
Sh
ip O
per
ati
ng
Mod
e
100%
Cru
isin
g / a
t Sea
60%
<=
=C
han
ge (
Kee
p b
etw
een 5
0-70
%)
Tax
Rat
e35
.00%
20%
Man
euver
ing
12%
Infl
atio
n2.
00%
0%In
-Port
28%
<=
=T
ry t
o k
eep a
round 2
5%
Sh
ip C
om
pan
y L
oca
tion
1
Tim
e in
EC
As
Jones
Act
Ves
sel
(US)
1
% o
f T
ime
20%
<=
=C
han
ge (
Can
go 0
% t
o 1
00%
)In
tern
atio
nal
2
Hours
1,22
6
Day
s51
Dep
reci
ati
on
Sch
edu
le3
<=
=C
hoose
(5-
yrs
MA
CR
S D
efau
lt)
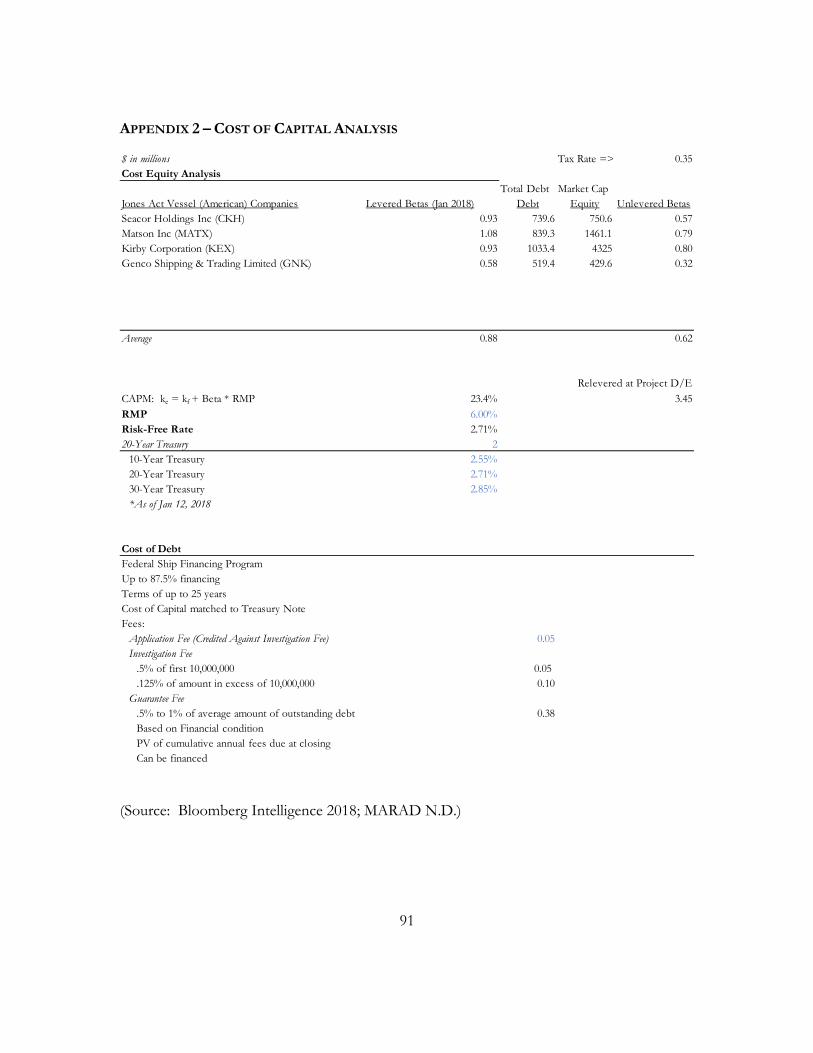
91
APPENDIX 2 – COST OF CAPITAL ANALYSIS
(Source: Bloomberg Intelligence 2018; MARAD N.D.)
$ in millions Tax Rate => 0.35
Cost Equity Analysis
Total Debt Market Cap
Jones Act Vessel (American) Companies Levered Betas (Jan 2018) Debt Equity Unlevered Betas
Seacor Holdings Inc (CKH) 0.93 739.6 750.6 0.57
Matson Inc (MATX) 1.08 839.3 1461.1 0.79
Kirby Corporation (KEX) 0.93 1033.4 4325 0.80
Genco Shipping & Trading Limited (GNK) 0.58 519.4 429.6 0.32
Average 0.88 0.62
Relevered at Project D/E
CAPM: ke = kf + Beta * RMP 23.4% 3.45
RMP 6.00%
Risk-Free Rate 2.71%
20-Year Treasury 2
10-Year Treasury 2.55%
20-Year Treasury 2.71%
30-Year Treasury 2.85%
*As of Jan 12, 2018
Cost of Debt
Federal Ship Financing Program
Up to 87.5% financing
Terms of up to 25 years
Cost of Capital matched to Treasury Note
Fees:
Application Fee (Credited Against Investigation Fee) 0.05
Investigation Fee
.5% of first 10,000,000 0.05
.125% of amount in excess of 10,000,000 0.10
Guarantee Fee
.5% to 1% of average amount of outstanding debt 0.38
Based on Financial condition
PV of cumulative annual fees due at closing
Can be financed

92
(Source: Bloomberg Intelligence 2018, Gaudet 2016)
Cost of Equity Analysis
Total Debt Market Cap
International Companies Levered Betas (Jan 2018) Debt Equity Unlevered Betas
Diana Shipping Inc (DSX) 1.58 622.1 383.1 0.77
Costamare Inc (CMRE) 2.85 1223.2 667.6 1.30
Maersk 0.92 17513 34310.2 0.69
Teekay Tankers Ltd (TNK) 1.66 797 297.7 0.61
Navios Maritime Partners (NMM) 2.05 493.5 307.7 1.00
Ship Finance International Limited (SFL) 1.42 2018.5 1497.6 0.76
Scorpio Bulkers (SALT) 4.06 715.6 574.7 2.24
Capital Product Partners LP (CPLP) 1.69 454.3 384.4 0.96
Average 2.03 1.04
Re-levered at 50/50 D/E
Cost of Equity 15.17% 1.72
RMP 6.00%
Risk-free Rate 4.87%
15yr 3
5yr 3.20%
10yr 3.37%
15yr 3.37%
Lending fee 1.50%
Cost of Debt
European Investment Bank Green Shipping Program
Up to 50% of newbuilding
Up to 100% of green retrofit

93
APPENDIX 3 – PRICE DECKS
Yea
r20
1820
1920
2020
2120
2220
2320
2420
2520
4620
4720
4820
4920
50
Fu
el i
n U
se
3248
6.78
490.
9449
0.83
493.
0441
5.30
417.
5642
0.16
396.
1849
8.56
508.
5351
8.70
529.
0853
9.66
Base
Case
IFO
380
365.
9737
3.29
380.
7638
8.37
396.
1440
4.06
412.
1442
0.38
637.
1664
9.91
662.
9067
6.16
689.
69
IFO
180
402.
5741
0.62
418.
8342
7.21
435.
7544
4.47
453.
3646
2.42
700.
8871
4.90
729.
1974
3.78
758.
65
MD
O54
1.92
552.
7656
3.81
575.
0958
6.59
598.
3261
0.29
622.
5094
3.50
962.
3798
1.61
1,00
1.25
1,02
1.27
MG
O59
6.11
608.
0362
0.19
632.
6064
5.25
658.
1667
1.32
684.
751,
037.
851,
058.
601,
079.
771,
101.
371,
123.
40
LN
G48
6.78
490.
9449
0.83
493.
0441
5.30
417.
5642
0.16
396.
1849
8.56
508.
5351
8.70
529.
0853
9.66
EIA
Case
IFO
380
330.
7836
8.76
372.
1443
7.57
506.
4652
2.64
521.
4552
2.28
651.
7265
5.40
660.
4866
1.42
666.
01
IFO
180
363.
8640
5.63
409.
3548
1.32
557.
1157
4.90
573.
5957
4.51
716.
8972
0.94
726.
5372
7.56
732.
61
MD
O86
0.03
870.
7998
8.99
1,03
8.61
1,05
5.50
1,07
2.19
1,10
0.44
1,11
2.70
1,27
9.27
1,28
3.32
1,28
6.35
1,27
9.22
1,28
1.30
MG
O94
6.03
957.
871,
087.
891,
142.
471,
161.
051,
179.
411,
210.
481,
223.
971,
407.
191,
411.
651,
414.
981,
407.
141,
409.
43
LN
G75
5.64
752.
8175
4.12
720.
6271
0.89
708.
7574
2.12
737.
4268
6.46
688.
5669
2.43
695.
5269
9.85
Dyn
am
ic
IFO
380
351.
9233
5.60
324.
9631
7.94
313.
2731
0.13
308.
0230
6.60
303.
6230
3.62
303.
6230
3.62
303.
62
IFO
180
353.
7736
9.16
357.
4634
9.74
344.
5934
1.15
338.
8333
7.26
333.
9933
3.99
333.
9933
3.99
333.
98
MD
O52
2.79
500.
7448
6.53
477.
2747
1.18
467.
1646
4.49
462.
7245
9.17
459.
1745
9.17
459.
1745
9.17
MG
O58
5.01
552.
8053
4.34
523.
5551
7.18
513.
3951
1.13
509.
7850
7.75
507.
7550
7.75
507.
7550
7.75
LN
G39
9.42
403.
3640
4.64
405.
0440
5.18
405.
2240
5.23
405.
2340
5.24
405.
2440
5.24
405.
2440
4.72

94
APPENDIX 4 – PRICE REGRESSION ANALYSIS
Aug-
1730
6.71
5.73
5.72
Sep
-17
322.
645.
785.
73
Oct
-17
349.
865.
865.
78
Nov-1
734
9.99
5.86
5.86
Dec
-17
365.
975.
905.
86SU
MM
AR
Y O
UTP
UT
- SI
NG
380
Jan-1
836
3.80
5.90
5.90
Feb
-18
361.
725.
895.
90R
egre
ssio
n St
atis
tics
Mar
-18
359.
715.
895.
89M
ulti
ple
R0.
9782
9998
Apr-
1835
7.77
5.88
5.89
R S
quar
e0.
9570
7085
May
-18
355.
915.
875.
88A
djus
ted
R S
quar
e0.
9564
5758
Jun-1
835
4.12
5.87
5.87
Stan
dard
Err
or
0.09
4529
45
Jul-
1835
2.39
5.86
5.87
Obs
erva
tio
ns72
Aug-
1835
0.72
5.86
5.86
Sep
-18
349.
125.
865.
86A
NO
VA
Oct
-18
347.
575.
855.
86df
SSM
SF
Sign
ific
ance
F
Nov-1
834
6.08
5.85
5.85
Reg
ress
ion
113
.945
1802
13.9
4518
0215
60.5
9376
1.35
96E-
49
Dec
-18
344.
645.
845.
85R
esid
ual
700.
6255
0719
0.00
8935
82
Jan-1
934
3.26
5.84
5.84
Tota
l71
14.5
7068
74
Feb
-19
341.
925.
835.
84
Mar
-19
340.
635.
835.
83Co
effi
cien
tsSt
anda
rd E
rror
t St
atP-
valu
eLo
wer
95%
Upp
er 9
5%Lo
wer
95.
0%U
pper
95.
0%
Apr-
1933
9.39
5.83
5.83
Inte
rcep
t0.
1817
6677
0.14
7532
281.
2320
4747
0.22
2053
91-0
.112
4770
80.
4760
1062
-0.1
1247
708
0.47
6010
62
May
-19
338.
195.
825.
83LN
SIN
G38
0 La
g0.
9681
9916
0.02
4508
6739
.504
3511
1.35
96E-
490.
9193
1816
1.01
7080
160.
9193
1816
1.01
7080
16
Jun-1
933
7.03
5.82
5.82
Jul-
1933
5.91
5.82
5.82
Aug-
1933
4.84
5.81
5.82
Sep
-19
333.
805.
815.
81

95
APPENDIX 5 – BUSINESS CASE ANALYSIS DCF
Vessel Type Panamax Containership (Jones Act) 0 1 2 3 4 5 24 25 26
Year 2018 2019 2020 2021 2022 2023 2024 2043 2044 2045
Revenue 52.7 53.8 54.9 56.0 57.1 83.1 84.8 86.5
Charter Revenue 52.7 53.8 54.9 56.0 57.1 83.1 84.8 86.5
Other Revenue (Demurrage)
Gross Margin 0.0 0.0 52.7 53.8 54.9 56.0 57.1 83.1 84.8 86.5
Gross Margin % 100% 100% 100% 100% 100% 100% 100% 100%
Depreciation (51.8) (31.1) (18.7) (18.7) (9.3) 0.0 0.0 0.0
OPEX 0.0 0.0 (14.2) (14.4) (13.5) (13.7) (13.9) (18.4) (18.7) (19.1)
Non-Fuel Cost (7.7) (7.8) (8.0) (8.2) (8.3) (12.1) (12.4) (12.6)
Fuel Cost (6.5) (6.6) (5.5) (5.6) (5.6) (6.3) (6.4) (6.5)
EBIT 0.0 0.0 (13.3) 8.3 22.7 23.6 33.8 64.8 66.1 67.4
Interest (3.8) (2.9) (2.0) (1.1) (0.2) 0.0 0.0 0.0
EBT 0.0 0.0 (17.2) 5.4 20.7 22.5 33.6 64.8 66.1 67.4
Taxes 0.0 0.0 0.0 (1.9) (7.2) (7.9) (11.8) (22.7) (23.1) (23.6)
Net Income 0.0 0.0 (17.2) 3.5 13.5 14.6 21.9 42.1 42.9 43.8
Plus: Depreciation 0.0 0.0 51.8 31.1 18.7 18.7 9.3 0.0 0.0 0.0
Less: CAPEX (162.0)
Less: Change in WC
Plus: After-Tax Salvage Value
FCFE Ante-Debt Repayment (162.0) 34.7 34.6 32.1 33.3 31.2 42.1 42.9 43.8
Plus: Proceeds from Debt 141.75
Less: Payments on Debt (34.7) (34.6) (32.1) (33.3) (7.1) -- -- --
FCFE Post-Debt Repayment $0.0 ($20.3) $0.0 $0.0 $0.0 $0.0 $24.1 $42.1 $42.9 $43.8
CFCC $0.0 ($20.3) ($20.3) ($20.3) ($20.3) ($20.3) $3.8 $676.3 $719.3 $763.1
Payback Calcs n/m n/m n/m n/m 0.84 15.06 15.75 16.42
NPV 35.30
IRR 39%
Payback 4.84
Invest? Yes
Debt Schedule
Interest Expense 3.8 2.9 2.0 1.1 0.2 0.0 0.0 0.0
Debt Balance
FSFP Loan
Beginning 142 107 72 40 7 -- -- --
Change (35) (35) (32) (33) (7) -- -- --
End 142 107 72 40 7 -- -- -- --

96
APPENDIX 6 – CALORIFIC VALUES & CONVERSION FACTORS
Calorific Values (in MMBtu, gross):
MMBtu/tonne MMBtu/bbl MMBtu/m3
LNG 53.4 3.82 24.0
LPG (r) 47.3 4.52 28.5
LPG (p) 47.3 4.13 25.9
MGO 43.4 -- --
MDO 43.1 -- --
LFO 41.6 -- --
HFO 40.0 -- --
Oil 39.68 5.80 --
Coal 27.3 -- --
(Source: IGU 2012)
Conversion Factors:
Multiply by Tonnes LNG
m3 LNG Nm3 gas ft3 gas MMBtu boe
Tonnes LNG
-- 2.222 1,300 45,909 53.38 9.203
m3 LNG 0.450 -- 585 20,659 24.02 4.141
m3 gas 0.0007692 0.0017 -- 35.31 0.0411 0.0071
ft3 gas 0.00002178 0.000048 0.0283 -- 0.0012 0.0002005
MMBtu 0.0187 0.0416 24.36 860.1 -- 0.1724
boe 0.1087 0.2415 141.3 4,989 5.8 --
(Source: IGU 2012)

97
APPENDIX 7 – FUEL COST SAVINGS METHODOLOGY
0 1 2 3 4 5 26 27 28 29 30
2019 2020 2021 2022 2023 2024 2045 2046 2047 2048 2049
CAPEX 16.5
OPEX 0.2 0.2 0.2 0.2 0.2 0.2 0.2 0.2 0.2 0.2
Fuel Use (tonnes) 4,149.1 4,149.1 4,149.1 4,149.1 4,149.1 4,149.1 4,149.1 4,149.1 4,149.1 4,149.1
Fuel Cost 2.0 2.0 2.0 2.0 1.7 1.9 2.0 2.0 2.1 2.1
Total Costs 16.5 2.2 2.2 2.2 2.2 1.9 2.1 2.2 2.2 2.3 2.3
PV of Costs $29.10
Payback Calculation
CAPEX (16.5)
OPEX (0.2) (0.2) (0.2) (0.2) (0.2) (0.2) (0.2) (0.2) (0.2) (0.2)
Fuel Use (tonnes) 5,870.1 5,870.1 5,870.1 5,870.1 5,870.1 5,870.1 5,870.1 5,870.1 5,870.1 5,870.1
Fuel Savings 0.6 0.7 0.8 0.8 1.3 3.0 3.0 3.1 3.2 3.2
Total Costs (16.5) 0.5 0.5 0.6 0.6 1.2 2.8 2.9 2.9 3.0 3.0
CFCF (16.5) (16.0) (15.5) (15.0) (14.3) (13.2) 33.1 35.9 38.8 41.8 44.9
Net Payback to LS Fuel 12.57
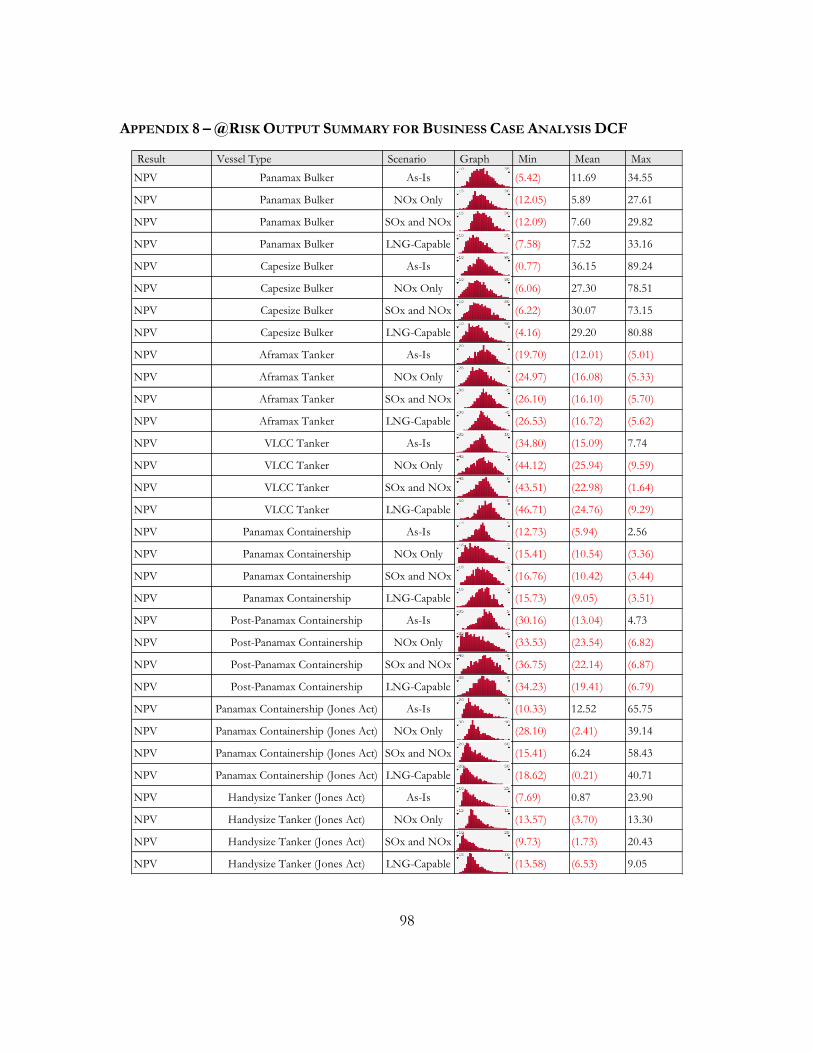
98
APPENDIX 8 – @RISK OUTPUT SUMMARY FOR BUSINESS CASE ANALYSIS DCF
Result Vessel Type Scenario Graph Min Mean Max
NPV Panamax Bulker As-Is (5.42) 11.69 34.55
NPV Panamax Bulker NOx Only (12.05) 5.89 27.61
NPV Panamax Bulker SOx and NOx (12.09) 7.60 29.82
NPV Panamax Bulker LNG-Capable (7.58) 7.52 33.16
NPV Capesize Bulker As-Is (0.77) 36.15 89.24
NPV Capesize Bulker NOx Only (6.06) 27.30 78.51
NPV Capesize Bulker SOx and NOx (6.22) 30.07 73.15
NPV Capesize Bulker LNG-Capable (4.16) 29.20 80.88
NPV Aframax Tanker As-Is (19.70) (12.01) (5.01)
NPV Aframax Tanker NOx Only (24.97) (16.08) (5.33)
NPV Aframax Tanker SOx and NOx (26.10) (16.10) (5.70)
NPV Aframax Tanker LNG-Capable (26.53) (16.72) (5.62)
NPV VLCC Tanker As-Is (34.80) (15.09) 7.74
NPV VLCC Tanker NOx Only (44.12) (25.94) (9.59)
NPV VLCC Tanker SOx and NOx (43.51) (22.98) (1.64)
NPV VLCC Tanker LNG-Capable (46.71) (24.76) (9.29)
NPV Panamax Containership As-Is (12.73) (5.94) 2.56
NPV Panamax Containership NOx Only (15.41) (10.54) (3.36)
NPV Panamax Containership SOx and NOx (16.76) (10.42) (3.44)
NPV Panamax Containership LNG-Capable (15.73) (9.05) (3.51)
NPV Post-Panamax Containership As-Is (30.16) (13.04) 4.73
NPV Post-Panamax Containership NOx Only (33.53) (23.54) (6.82)
NPV Post-Panamax Containership SOx and NOx (36.75) (22.14) (6.87)
NPV Post-Panamax Containership LNG-Capable (34.23) (19.41) (6.79)
NPV Panamax Containership (Jones Act) As-Is (10.33) 12.52 65.75
NPV Panamax Containership (Jones Act) NOx Only (28.10) (2.41) 39.14
NPV Panamax Containership (Jones Act) SOx and NOx (15.41) 6.24 58.43
NPV Panamax Containership (Jones Act) LNG-Capable (18.62) (0.21) 40.71
NPV Handysize Tanker (Jones Act) As-Is (7.69) 0.87 23.90
NPV Handysize Tanker (Jones Act) NOx Only (13.57) (3.70) 13.30
NPV Handysize Tanker (Jones Act) SOx and NOx (9.73) (1.73) 20.43
NPV Handysize Tanker (Jones Act) LNG-Capable (13.58) (6.53) 9.05

99
IRR Panamax Bulker As-Is 12% 32% 85%
IRR Panamax Bulker NOx Only 3% 25% 58%
IRR Panamax Bulker SOx and NOx 6% 26% 62%
IRR Panamax Bulker LNG-Capable 11% 26% 64%
IRR Capesize Bulker As-Is 17% 43% 104%
IRR Capesize Bulker NOx Only 16% 37% 102%
IRR Capesize Bulker SOx and NOx 16% 37% 103%
IRR Capesize Bulker LNG-Capable 16% 36% 83%
IRR Aframax Tanker As-Is 2% 9% 17%
IRR Aframax Tanker NOx Only -11% 3% 11%
IRR Aframax Tanker SOx and NOx -10% 6% 13%
IRR Aframax Tanker LNG-Capable -2% 6% 12%
IRR VLCC Tanker As-Is 4% 13% 23%
IRR VLCC Tanker NOx Only -13% 6% 18%
IRR VLCC Tanker SOx and NOx 0% 10% 18%
IRR VLCC Tanker LNG-Capable 3% 10% 18%
IRR Panamax Containership As-Is -7% 10% 22%
IRR Panamax Containership NOx Only -13% 0% 17%
IRR Panamax Containership SOx and NOx -14% 4% 16%
IRR Panamax Containership LNG-Capable -8% 7% 15%
IRR Post-Panamax Containership As-Is -10% 10% 24%
IRR Post-Panamax Containership NOx Only -14% -2% 16%
IRR Post-Panamax Containership SOx and NOx -13% 5% 16%
IRR Post-Panamax Containership LNG-Capable -12% 8% 18%
IRR Panamax Containership (Jones Act) As-Is 11% 18% 27%
IRR Panamax Containership (Jones Act) NOx Only 6% 14% 24%
IRR Panamax Containership (Jones Act) SOx and NOx 9% 16% 27%
IRR Panamax Containership (Jones Act) LNG-Capable 9% 14% 24%
IRR Handysize Tanker (Jones Act) As-Is 10% 15% 23%
IRR Handysize Tanker (Jones Act) NOx Only 7% 13% 20%
IRR Handysize Tanker (Jones Act) SOx and NOx 9% 14% 20%
IRR Handysize Tanker (Jones Act) LNG-Capable 8% 12% 17%

100
Payback Panamax Bulker As-Is 1.55 4.61 17.87
Payback Panamax Bulker NOx Only 1.70 5.88 18.95
Payback Panamax Bulker SOx and NOx 1.93 5.54 19.84
Payback Panamax Bulker LNG-Capable 1.95 5.55 16.36
Payback Capesize Bulker As-Is 1.34 3.58 9.12
Payback Capesize Bulker NOx Only 1.52 4.23 10.01
Payback Capesize Bulker SOx and NOx 1.54 4.10 9.69
Payback Capesize Bulker LNG-Capable 1.63 4.23 9.90
Payback Aframax Tanker As-Is 8.28 13.17 27.39
Payback Aframax Tanker NOx Only 10.22 18.65 30.79
Payback Aframax Tanker SOx and NOx 10.24 16.21 35.97
Payback Aframax Tanker LNG-Capable 10.36 15.83 29.32
Payback VLCC Tanker As-Is 5.88 10.55 19.47
Payback VLCC Tanker NOx Only 7.71 15.98 30.78
Payback VLCC Tanker SOx and NOx 7.06 12.85 26.20
Payback VLCC Tanker LNG-Capable 7.50 12.70 21.22
Payback Panamax Containership As-Is 5.61 12.25 30.37
Payback Panamax Containership NOx Only 8.40 18.94 35.49
Payback Panamax Containership SOx and NOx 7.75 17.15 318.82
Payback Panamax Containership LNG-Capable 7.85 15.07 30.85
Payback Post-Panamax Containership As-Is 5.97 12.57 30.89
Payback Post-Panamax Containership NOx Only 9.42 20.38 30.97
Payback Post-Panamax Containership SOx and NOx 7.28 16.37 97.84
Payback Post-Panamax Containership LNG-Capable 7.71 14.61 30.64
Payback Panamax Containership (Jones Act) As-Is 5.79 8.59 12.54
Payback Panamax Containership (Jones Act) NOx Only 7.03 10.66 18.44
Payback Panamax Containership (Jones Act) SOx and NOx 6.40 9.34 16.50
Payback Panamax Containership (Jones Act) LNG-Capable 7.32 10.16 14.12
Payback Handysize Tanker (Jones Act) As-Is 7.62 9.63 13.03
Payback Handysize Tanker (Jones Act) NOx Only 8.46 10.85 15.02
Payback Handysize Tanker (Jones Act) SOx and NOx 7.90 10.26 13.61
Payback Handysize Tanker (Jones Act) LNG-Capable 9.07 11.52 14.44

101
APPENDIX 9 - @RISK OUTPUT SUMMARY FOR FUEL COST SAVINGS AND NET PAYBACK
TO LS FUEL ANALYSIS
Result Vessel Type Scenario Graph Min Mean Max
Simple PV Costs Panamax Bulker As-Is $4.82 $11.11 $22.81
Simple PV Costs Panamax Bulker LS Fuel $11.24 $20.27 $34.05
Simple PV Costs Panamax Bulker Scrubber $8.24 $14.45 $27.39
Simple PV Costs Panamax Bulker LNG-Capable $12.30 $16.66 $22.36
Simple PV Costs Capesize Bulker As-Is $7.34 $16.90 $34.70
Simple PV Costs Capesize Bulker LS Fuel $16.82 $30.56 $51.52
Simple PV Costs Capesize Bulker Scrubber $12.02 $21.47 $41.17
Simple PV Costs Capesize Bulker LNG-Capable $18.82 $25.48 $34.43
Simple PV Costs Aframax Tanker As-Is $5.13 $11.82 $24.27
Simple PV Costs Aframax Tanker LS Fuel $11.92 $21.53 $36.18
Simple PV Costs Aframax Tanker Scrubber $10.27 $17.02 $31.59
Simple PV Costs Aframax Tanker LNG-Capable $14.41 $19.93 $26.74
Simple PV Costs VLCC Tanker As-Is $13.01 $29.95 $61.51
Simple PV Costs VLCC Tanker LS Fuel $29.01 $53.36 $90.51
Simple PV Costs VLCC Tanker Scrubber $22.14 $38.90 $73.85
Simple PV Costs VLCC Tanker LNG-Capable $33.81 $45.69 $62.06
Simple PV Costs Panamax Containership As-Is $4.99 $11.48 $23.57
Simple PV Costs Panamax Containership LS Fuel $13.57 $23.40 $37.45
Simple PV Costs Panamax Containership Scrubber $8.51 $15.41 $29.88
Simple PV Costs Panamax Containership LNG-Capable $12.31 $16.60 $22.26
Simple PV Costs Post-Panamax Containership As-Is $21.09 $48.51 $99.61
Simple PV Costs Post-Panamax Containership LS Fuel $47.28 $86.75 $146.93
Simple PV Costs Post-Panamax Containership Scrubber $31.37 $58.34 $114.53
Simple PV Costs Post-Panamax Containership LNG-Capable $39.77 $57.55 $78.57
Simple PV Costs Panamax Containership (Jones Act) As-Is $16.30 $37.47 $78.53
Simple PV Costs Panamax Containership (Jones Act) LS Fuel $37.11 $67.27 $113.75
Simple PV Costs Panamax Containership (Jones Act) Scrubber $21.07 $42.46 $87.73
Simple PV Costs Panamax Containership (Jones Act) LNG-Capable $45.75 $62.25 $84.60
Simple PV Costs Handysize Tanker (Jones Act) As-Is $5.01 $11.53 $24.16
Simple PV Costs Handysize Tanker (Jones Act) LS Fuel $11.77 $21.04 $35.35
Simple PV Costs Handysize Tanker (Jones Act) Scrubber $7.73 $14.31 $28.24
Simple PV Costs Handysize Tanker (Jones Act) LNG-Capable $18.67 $27.20 $36.46

102
Simple Net Payback Panamax Bulker As-Is
Simple Net Payback Panamax Bulker LS Fuel 30.00 30.00 30.00
Simple Net Payback Panamax Bulker Scrubber 0.50 4.50 103.95
Simple Net Payback Panamax Bulker LNG-Capable 0.91 10.58 112.09
Simple Net Payback Capesize Bulker As-Is
Simple Net Payback Capesize Bulker LS Fuel 30.00 30.00 30.00
Simple Net Payback Capesize Bulker Scrubber 0.44 4.01 213.41
Simple Net Payback Capesize Bulker LNG-Capable 1.00 10.14 276.35
Simple Net Payback Aframax Tanker As-Is
Simple Net Payback Aframax Tanker LS Fuel 30.00 30.00 30.00
Simple Net Payback Aframax Tanker Scrubber 0.83 6.00 31.38
Simple Net Payback Aframax Tanker LNG-Capable 1.40 13.66 73.92
Simple Net Payback VLCC Tanker As-Is
Simple Net Payback VLCC Tanker LS Fuel 30.00 30.00 30.00
Simple Net Payback VLCC Tanker Scrubber 0.49 4.48 107.05
Simple Net Payback VLCC Tanker LNG-Capable 1.08 12.27 2428.77
Simple Net Payback Panamax Containership As-Is
Simple Net Payback Panamax Containership LS Fuel 30.00 30.00 30.00
Simple Net Payback Panamax Containership Scrubber 0.49 4.96 54.28
Simple Net Payback Panamax Containership LNG-Capable 0.88 9.82 121.32
Simple Net Payback Post-Panamax Containership As-Is
Simple Net Payback Post-Panamax Containership LS Fuel 30.00 30.00 30.00
Simple Net Payback Post-Panamax Containership Scrubber 0.31 3.21 148.33
Simple Net Payback Post-Panamax Containership LNG-Capable 0.45 5.02 229.99
Simple Net Payback Panamax Containership (Jones Act) As-Is
Simple Net Payback Panamax Containership (Jones Act) LS Fuel 30.00 30.00 30.00
Simple Net Payback Panamax Containership (Jones Act) Scrubber 0.19 2.41 80.35
Simple Net Payback Panamax Containership (Jones Act) LNG-Capable 1.61 13.70 45.12
Simple Net Payback Handysize Tanker (Jones Act) As-Is
Simple Net Payback Handysize Tanker (Jones Act) LS Fuel 30.00 30.00 30.00
Simple Net Payback Handysize Tanker (Jones Act) Scrubber 0.46 4.30 203.23
Simple Net Payback Handysize Tanker (Jones Act) LNG-Capable 3.51 24.55 74.42

103
Glossary
Aframax Tanker: an oil tanker between 80,000 and 120,000 dwt (UNCTAD/RMT/2017, p.
ix)
Boil off gas (BOG): LNG that vaporizes in storage tanks that must be vented (flared),
combusted (used for power generation purposes), or reliquefied (IGU 2017, p. 37)
Capesize Bulk Carrier: a bulk carrier above 100,000 dwt (UNCTAD/RMT/2017, p. ix)
Centistoke (CSt): the SI unit of kinematic viscosity in mm2/s (Vermeire 2012, p. 13)
ConRo: The ConRo stands for containership/roll-on/roll-off and is a hybrid of the two.
This vessel stows vehicles below the decks and stacks containers above the decks (Marine
Insight 2017b)
Deadweight tonnage (dwt): measure of how much weight a ship can safely carry
(Plomaritou and Papadopoulos 2018, p. 729)
Forty-Foot Equivalent Units (FEU): unit of volume based on the volume of forty-foot
ISO containers; FEUs are often stacked on top of 2 TEUs (Arista Shipping 2017)
Handysize Product Tanker: an oil or chemical product tanker between 30,000 and 50,000
dwt (Plomaritou and Papadopoulos 2018, p. 738)
Jones Act: referring to US-flag vessels subject to the Merchant Marine Act of 1920, which
stipulates that all product shipping between US ports must be on a Jones Act vessel (built,
owned, and operated by US citizens) (MARAD N.D.)
Knots: rate of speed in nautical miles per hour (Plomaritou and Papadopoulos 2018, p. 741)
Light displacement tonnage (ldt): weight of the ship consisting of the hull, machinery,
equipment, and spare parts; measure of the scrap value of the ship at the end of commercial
life (Plomaritou and Papadopoulos 2018, p. 742)
Nautical mile: nautical distance measuring one minute of latitude, or 1/60th of a degree of
latitude, equal to 1852 meters (Arista Shipping 2017)
NOx: referring to emissions inclusive of nitrogen oxides, pollutants that contribute to smog
and acid rain (EPA 2018)

104
Panamax Bulker: a bulk carrier ranging from 60,000 to 100,000 dwt
(UNCTAD/RMT/2017, p. ix)
Panamax Containership: a containership with a capacity of approximately 3,000 to 5,000
TEU; able to cross the old lock system of the Panama Canal (Ultra-large container vessel;
generally, 15,000 TEU or greater (Plomaritou and Papadopoulos 2018, p. 150;
UNCTAD/RMT/2017, p. ix)
PM: referring to pollutant particles that can cause serious health effects (EPA 2018)
Post-Panamax Containership: a containership with a capacity of approximately 5,000 to
15,000 TEU; able to cross the new lock system of the Panama Canal; vessels between 14,000
and 15,000 TEU are also referred to as Neo-Panamax (UNCTAD/RMT/2017, p. ix)
Ro-Ro: Ro-ro stands for roll-on/roll-off. These vessels are used to transport wheeled cargo.
These ships do not use a crane to load or unload cargo (Marine Insight 2017b)
Ro-Pax: Ro-Pax stands for roll on/roll off passenger. These vessels have both freight vehicle
transport and passenger accommodation. Vessels with more than 500 passengers are
considered cruise ferries (Marine Insight 2017b)
SOx: referring to emissions inclusive of sulfur oxides, pollutants that cause acid rain and
contribute to particulate matter formation (EPA 2018)
Twenty-Foot Equivalent Units (TEU): unit of volume based on the volume of twenty-
foot ISO container (Arista Shipping 2017)
VLCC: VLCC is an acronym for very large crude carrier. It is a vessel that carries crude oil,
generally greater than 200,000 dwt (UNCTAD/RMT/2017, p. ix)
ULCV: Ultra-large container vessel; generally, 15,000 TEU or greater (Plomaritou and
Papadopoulos 2018, p. 147)

105
References
ACD. 2018. “ACD’s strength in LNG fueling is showing.” Accessed January 2018.
<https://www.acdllc.com/wp-content/uploads/2016/07/2013-Summer-ACD-
ACDs-strength-in-LNG-fueling-is-showing.pdf>
Admiraal, Erik. March 2017. “VIP, the new standard for LNG transfer?” LNG Industry, pp.
77-80.
Ang, Irene and Hine, Lucy. January 11, 2018. “CMA CGM returns to yards with LNG
fuel on table.” Tradewinds. Accessed January 2018.
<http://www.tradewindsnews.com/gas/1409787/cma-cgm-returns-to-yards-with-
lng-fuel-on-the-table>
Arista Shipping. 2017. “Chartering Abbreviations and Meanings.” Accessed March 2018.
<http://docs.wixstatic.com/ugd/f9914d_9bc21655d7514b6f
8ee57ccdc6347265.pdf>
Bloomberg. 2018. “LNG Netback Prices; Vessel Prices & Charter Rates; Regional Hub
Natural Gas Prices; Bunker Fuel Prices; and Shipping Company Comps.” Bloomberg
Intelligence. Accessed January-March 2018.
Boot, Robin. October 2017. “Tried and Tested: an effective approach to safe and reliable
ship to ship LNG bunkering.” LNG Industry, pp. 37-40.
Cames, Martin et al. November 2015. “Emission Reduction Targets for
International Aviation and Shipping.” Directorate-General for Internal Policies,
European Parliament.
Caterpillar. 2018. “MAKTM Dual Fuel.” Accessed January 2018.
<https://www.cat.com/en_US/by-industry/marine/dual-fuel.html>
Chiodetto, Luca. April 2017. “Integrating the Interface: the importance of integrated
system components ensuring safety and reliability in LNG transfer systems.” LNG
Industry, pp. 41-44.
Clean Marine Energy. Personal Interview. 2 Feb 2018.

106
Compass Maritime. 2017-2018. “Compass Maritime Weekly Report.”
<http://www.compassmar.com/Compass_Maritime_Weekly_Market_Reports.
html>
Concawe. September 19, 2016. “Marine Fuel Facts.” Accessed January 2018.
<https://www.concawe.eu/wp-
content/uploads/2017/01/marine_factsheet_web.pdf>
Craig, Roderick. November 9, 2017. “LNG duo sets new benchmark for market.” Accessed
December 2017. <http://www.tradewindsnews.com/drycargo/1378263/lng-duo-
sets-new-benchmark-for-the-market>
DieselNet. October 2016. “International: IMO Marine Engine Regulations.” Accessed
March 2018. <https://www.dieselnet.com/standards/inter/imo.php>
DNV GL. October 2015a. “In Focus – LNG as Ship Fuel.” DNV GL – Maritime.
DNV GL. October 2015b. “LNG fueled PERFECt – Piston Engine Room Free Efficient
Containership.” DNV GL – Maritime.
DNV GL. October 2016. “Global Sulfur Cap 2020 – Know the different choices and
challenges for on-time compliance.” DNV GL – Maritime.
DNV GL. May 2017. “Low Carbon Shipping Towards 2050.” DNV GL – Maritime.
DNV GL. November 2017a. “Forecast to 2050 – Energy Transition Outlook 2017.” DNV
GL – Maritime.
DNV GL. November 2017b. “NOx Tier III Update – Choices and Challenges for On-time
Compliance.” DNV GL – Maritime.
DNV GL. January 2018. “LNGi Status Update: Comprehensive insights on worldwide
LNG bunkering availability and market data on LNG as fuel for ships.” LNGi
Maritime.
Drewry Shipping Consultants Limited. November 2017. “Ship Operating Costs:
Annual Review and Forecast, 2017/18.”

107
Dufour, Julien. February 12, 2016. “EU MRV vs. IMO fuel consumption data collection
system.” Accessed January 3, 2018. <http://www.verifavia-shipping.com/shipping-
carbon-emissions-verification/press-media-eu-mrv-vs-imo-fuel-consumption-data-
collection-system-155.php>
Energy Information Administration (EIA). June 2015. “Marine Fuel Choice for Ocean-
Going Vessels within Emissions Control Areas.”
<https://www.eia.gov/analysis/studies/transportation/marinefuel/pdf/marine_fuel
.pdf>
Energy Information Administration (EIA). February 2018. “Energy Prices by Sector and
Source.” Accessed February 7, 2018.
<https://www.eia.gov/outlooks/aeo/data/browser/#/?id=3-
AEO2018®ion=10&cases=ref2018~highmacro~lowmacro~highprice~lowprice
~highrt~lowrt&start=2016&end=2050&f=A&linechart=ref2018->
Energy Information Administration (EIA). March 30, 2018. “Natural Gas Consumption by
End Use.” Accessed April 1, 2018.
<https://www.eia.gov/dnav/ng/ng_cons_sum_dcu_nus_a.htm>
Environmental Protection Agency (EPA). January 15, 2015. “EPA Penalty Policy for
Violations by Ships of the Sulfur in Fuel Standard and Related Provisions. Accessed
February 2018. <https://www.epa.gov/sites/production/files/2015-
03/documents/marinepenaltypolicy.pdf>
Environmental Protection Agency (EPA). March 8, 2018. “Criteria Air Pollutants.” Accessed
March 28, 2018. <https://www.epa.gov/criteria-air-pollutants>
Faber, Jasper et al. October 18, 2017. “Regulation Speed: a short-term measure to reduce
maritime GHG emissions.” CE Delft, Publication Code 17.7L90.155.
Fearnleys. 2012-2018. “Fearnley’s Weekly Briefs – Tankers, Dry Bulk, Newbuilding,
Demolition, and Market Brief.” Accessed March 2018.
<http://www.fearnleys.no/weekly_issue/view>

108
Federal Energy Regulatory Commission (FERC). 2018. “North American Existing,
Approved, and Proposed LNG Import/Export Terminals, as of 24-Jan-2018.”
Accessed March 15, 2018. <https://www.ferc.gov/industries/gas/indus-act/lng/lng-
existing.pdf>
FERC. 2018. “World LNG Estimated Landed Prices, Jan-18.” Accessed March 15, 2018.
<https://www.ferc.gov/market-oversight/mkt-gas/overview/ngas-ovr-lng-wld-pr-
est.pdf>
Forward LNG. “The Revolutionary Project Forward Bulk Carrier.” Accessed January 4, 2018.
<http://www.forwardlng.org/the-ship>
Foss, Michelle Michot. June 2012. “Introduction to LNG – an overview on liquefied natural
gas (LNG), its properties, the LNG industry and safety considerations.” Center for
Energy Economics, The University of Texas at Austin.
Fusy, Joel and Morilhat, Eric. September 2017. “Up to standard – the importance of safety
and standardized guidelines in the development of LNG bunkering systems.” LNG
Industry, pp. 25-28.
Gaudet, Francois. September 28, 2016. “EIB’s Green Shipping Programmes.”
Presentation at the “Motorways of the Sea Workshop.” Brussels.
Harsema-Mensonides, Alexander. October 2017. “LNG as a transportation fuel.” LNG
Industry, pp. 13-16.
Harsema-Mensonides, Alexander – Director of Marine Business Development, Braemar
Engineering. Personal Interview. 26 Jan 2018.
Hine, Lucy. November 9, 2017. “Titan Teams with Skangas on LNG Bunkering.” Tradewinds.
Accessed December 2017. <http://www.tradewindsnews.com/gas/1381057/titan-
teams-with-skangas-on-lng-bunkering>
Hine, Lucy. November 16, 2017. “BP Seeks 2020-compliant VLCCs for time-charter.”
Tradewinds. Accessed December 2017.
<http://www.tradewindsnews.com/tankers/1383312/bp-seeks-2020-compliant-
vlccs-for-time-charter>

109
Hine, Lucy. November 23, 2017. “Sovcomflot ups LNG-fueled Aframax order by two.”
Tradewinds. Accessed December 2017.
<http://www.tradewindsnews.com/gas/1386959/sovcomflot-ups-lng-fuelled-
aframax-order-by-two>
Hine, Lucy and Juliano, Michael. November 8, 2017. “Carnival signs US cruiseship LNG
fueling deal with Shell.” Tradewinds. Accessed December 2017.
<http://www.tradewindsnews.com/passengerships/1379670/carnival-signs-us-
cruiseship-lng-fuelling-deal-with-shell>
IHS Markit. August 2017. “Long-Term LNG Outlook.”
IHS Markit. December 22, 2017. “LNG Market Briefing: Fourth Quarter 2017 Review and
Outlook.”
International Gas Union (IGU). 2012. “Natural Gas Conversion Pocketbook.”
International Gas Union (IGU). 2017. “IGU World LNG Report – 2017 Edition.”
International Group of Liquefied Natural Gas Importers (GIIGNL). 2017. “The LNG
Industry in 2016.” GIIGNL Annual Report.
International Maritime Organization (IMO). 2016. “Studies on the feasibility and use of
LNG as a fuel for shipping.” Suffolk: Micropress Printers.
International Maritime Organization (IMO). 2018. “Maritime Safety.” Accessed February
10, 2018. <http://www.imo.org/en/OurWork/Safety/Pages/Default.aspx>
International Maritime Organization. April 13, 2018. “Marine Environment Protection
Committee (MEPC), 72nd Session, 9-13 April 2018.” Accessed April 20, 2018.
<http://www.imo.org/en/MediaCentre/MeetingSummaries/MEPC/Pages/MEPC-
72nd-session.aspx>
Jeppesen, Michael. December 2016. “Tier III is Now!” Accessed February 2018.
<https://greece.mandieselturbo.com/docs/librariesprovider11/techncial-update-
2016/1-tier-iii-is-now-by-michael-jeppessen.pdf?sfvrsn=2>

110
Juliano, Michael. November 27, 2017. “AIDA Cruises to begin using LNG in Mediterranean
ports.” Tradewinds. Accessed December 2017.
<http://www.tradewindsnews.com/passengerships/1389104/aida-cruises-to-begin-
using-lng-in-mediterranean-ports>
Kogan, Anatoli. March 2017. “Cryogenic insulation – a vital component.” LNG Industry, pp.
77-80.
Lloyd’s Register Group Ltd. April 2015. “Your options for emissions compliance:
Guidance for shipowners and operators on the Annex VI SOx and NOx
regulations.” Lloyd’s Register.
Lloyd’s Register Group Ltd. 2017. “Zero-Emission Vessels 2030: How do we get there?”
Lloyd’s Register.
MAN Diesel & Turbo (MAN). 2012. “Costs and Benefits of LNG as Ship Fuel for Container
Vessels.” Accessed January 2018. <https://www.mandieselturbo.com/docs/default-
source/shopwaredocuments/costs-and-benefits-of-
lng3739431d863f4f5695c4c81f03ac752c.pdf?sfvrsn=3>
MAN Diesel & Turbo (MAN). 2018. “Marine Engine: IMO Tier II and Tier III Programme,
2018.” Accessed March 2018.
<https://marine.mandieselturbo.com/docs/librariesprovider6/marine-engine-
programmes/marine-engine-imo-tier-ll-and-tier-lll-programme.pdf?sfvrsn=10>
Marine Insight. October 7, 2017a. “7 Technologies to Reduce Fuel Consumption of
Ships.” Accessed January 8, 2018. <https://www.marineinsight.com/tech/7-
technologies-to-reduce-fuel-consumption-of-ships/>
Marine Insight. October 7, 2017b. “What are Ro-Ro Ships?” Accessed January 8, 2018.
<https://www.marineinsight.com/types-of-ships/what-are-ro-ro-ships/>
Maritime Administration (MARAD). N.D. “Federal Ship Financing Program.” Accessed
December 12, 2017. <https://www.marad.dot.gov/ships-and-shipping/federal-ship-
financing-title-xi-program-homepage/>
MARAD. September 2011. “Comparison of US and Foreign-Flag Operating Costs.”

111
MARPOL Annex VI. N.D. “MARPOL Annex VI NOx Technical Code & SOx explained.”
Accessed February 10, 2018.
<https://www.marpol-annex-vi.com/marpol-annex-vi/>
MARPOL Annex VI. N.D. “EEDI & SEEMP.” Accessed February 10, 2018.
<https://www.marpol-annex-vi.com/eedi-seemp/>
Matson. November 29, 2017. “Matson Begins Production on New "Kanaloa Class" Ships
for Hawaii.” Accessed January 6, 2018. <https://investor.matson.com/news-
releases/news-release-details/matson-begins-production-new-kanaloa-class-ships-
hawaii>
Molloy, Ned. October 2016. “The IMO’s 2020 Sulfur Cap – What a 2020 Sulfur-
Constrained World Means for Shipping Lines, Refineries, and Bunker Suppliers.”
S&P Global Platts.
NASSCO. March 2, 2017. “General Dynamics NASSCO Delivers Final ECO Class
Tanker Constructed for SEA-Vista LLC.” Accessed January 6, 2018.
<https://nassco.com/press-releases/2017-press-releases/general-dynamics-nassco-
delivers-final-eco-class-tanker-constructed-for-sea-vista-llc/>
NEPIA. January 2016. “New Emissions Control Areas in China.” Accessed January 20,
2018. <http://www.nepia.com/insights/signals-online/regulation/new-emission-
control-areas-in-china/new-emission-control-areas-in-china/>
Nexant. April 2017. “Global LNG Outlook – Medium and Long Term.”
Nishifuji, Koichi. March 2017. “Lowering emissions – a discussion of alternative fuels and
NOx and SOx emission reduction technologies.” LNG Industry, pp. 25-29.
Ott, Marcel. March 2017. “Meeting expectations – an analysis of the use of LNG as a fuel
for marine low-speed engines.” LNG Industry, pp. 43-47.
Paglia, Enrico. May 21, 2013. “LNG in Figures: an economic overview on the use of LNG
as a marine fuel.” Shanghai: Banchero Costa Research.
Plomaritou, Evi and Papadopoulos, Anthony. 2018. Shipbroking and Chartering Practice, 8th
Edition. New York: Informal Law from Routledge.

112
Poten & Partners. June 2017. “IMO’s 2020 Sulfur-Cap Deadline Leaves Question on
Bunker Fuel Supply.” Houston.
Poten & Partners. November 2017. “LNG Marine Fuel Opportunities in Light of IMO
Decision.” Houston.
Poten & Partners. January 2018. “LNG Market Transformation.” Houston.
SEA\LNG. February 2018. “Case Study – LNG Bunkering Infrastructure: Shore-to-Ship
LNG Bunkering in Jacksonville.” Accessed March 1, 2018. <https://sea-
lng.org/wp-content/uploads/2018/01/FINAL_SEALNG-case-study_Eagle-
LNG_Shore-to-ship-LNG-bunkering-in-Jacksonville.pdf>
SEA\LNG. February 2018. “Case Study – LNG Bunkering Infrastructure: Ship-to-Ship
Bunkering in the Port of Rotterdam.” Accessed March 1, 2018. <https://sea-
lng.org/wp-content/uploads/2018/01/FINAL_SEALNG-case-study_PoR-
Shell_Ship-to-shore-bunkering-in-the-Port-of-Rotterdam.pdf>
Ship and Bunker. November 16, 2016. “Wartsila Defends GHG Credentials of LNG
Bunkers.” Accessed March 18, 2018.
<https://shipandbunker.com/news/world/225933-wartsila-defends-ghg-
credentials-of-lng-bunkers>
Ship Technology. November 24, 2017. “Wes Amelie Container Ship Conversion.”
Accessed January 8, 2018. <http://www.ship-technology.com/projects/wes-amelie-
container-ship-conversion/>
Ship Technology. December 8, 2017. “VT Halter Marine launches Crowley’s new ConRo
vessel.” Accessed January 8, 2018. <http://www.ship-technology.com/news/vt-
halter-marine-launches-crowleys-new-conro-vessel/>
Sirius Shipping. 2018. “Flexi-Sirius Builds an LNG-Tanker.” Accessed March 20, 2018.
<http://www.siriusshipping.eu/project/flexi-sirius-builds-an-lng-tanker/>
Standaert, Kwinten and Nous, Dirk. April 2017. “Developments at Zeebrugge – small scale
LNG bunkering services at the Zeebrugge LNG terminal in Belgium.” LNG Industry,
pp. 22-26.

113
Statista. 2017. “Ocean Shipping – Statista Dossier.” Accessed January 2018.
<https://www-statista-com.ezproxy.lib.utexas.edu/study/10146/ocean-shipping-
statista-dossier/>
TGE Marine. 2018. “LNG as Fuel.” Accessed January 2018.
<http://www.tge-marine.com/36-0-LNG-as-fuel.html>
Titan LNG. December 21, 2017. “Adoption of LNG as Marine Fuel Significantly Accelerated
in 2017.” Accessed January 2018.
<http://titan-lng.com/en/adoption-lng-marine-fuel-significantly-accelerated-
2017/>
Total. December 4, 2017. “Strategic Agreement between Total and CMA CGM on
Liquefied Natural Gas Fuel Supply for CMA CGM Newbuild Container Ships.”
Accessed January 12, 2018. <http://www.marinefuels.total.com/news/04-
december-2017.html>
Tote Maritime (Tote). N.D. “Introducing the World’s First LNG-Powered Containerships.”
Accessed December 12, 2017. <http://www.toteinc.com/about/lng/>
Tusiani, Michael D. and Shearer, Gordon. 2016. “LNG – Fuel for a Changing World: A
Non-technical Guide.” Tulsa: PennWell Corporation, 2nd Edition.
United Nations Commission on Trade and Development (UNCTAD/RMT/2017).
“Review of Maritime Transport 2017.” New York and Geneva: United Nations.
Vermeire, Monique B. June 2012. “Everything You Need to Know About Marine Fuels.”
Ghent: Chevron Global Marine Products.
Vis, R. January 10, 2018. “Viability of Scrubbers for Different Vessel Types.” Ship and
Bunker. Accessed March 2018.
<https://shipandbunker.com/news/features/industry-insight/173331-industry-
insight-viability-of-scrubbers-for-different-type-of-vessels>
Wainwright, Dale. January 2, 2018. “LNG-ready ships made up 11% of 2017 orders.”
Tradewinds. Accessed January 2018.
<http://www.tradewindsnews.com/gas/1404791/lng-ready-ships-made-up-11-
percent-of-2017-orders>

114
Wärtsilä. 2018. “Merchant Vessels Ship Designs Datasheets.” Accessed January 2018.
<https://www.wartsila.com/products/marine-oil-gas/ship-design/merchant>
Winterthur Gas & Diesel (WinGD). 2018. “Low-Speed Engines 2018.” Accessed March
2018.
<https://www.wingd.com/media/2632/final-wingd-engine-booklet-2018_lr.pdf>
Wiseman, Virginia. April 25, 2016. “IMO Approves Mandatory Fuel Consumption Data
Collection for Ships.” Accessed January 15, 2018. <http://sdg.iisd.org/news/imo-
approves-mandatory-fuel-consumption-data-collection-for-ships/>
Wold, Martin. January 2017. “A brighter future for LNG as marine fuel.” LNG Industry,
pp. 26-30.
World Ocean Review. 2015. “Sustainable Use of Our Oceans – Making Ideas Work.”
Accessed January 2018.
<https://worldoceanreview.com/en/wor-4/hope-for-the-oceans/protecting-the-
seas-is-possible/>
World Ports Climate Initiative (WPCI). N.D. “LNG Tank Types.” Accessed January 2018.
<http://lngbunkering.org/lng/technical-solutions/tank-types>