Embed Size (px)
Citation preview

Copyright and use of this thesis
This thesis must be used in accordance with the provisions of the Copyright Act 1968.
Reproduction of material protected by copyright may be an infringement of copyright and copyright owners may be entitled to take legal action against persons who infringe their copyright.
Section 51 (2) of the Copyright Act permits an authorized officer of a university library or archives to provide a copy (by communication or otherwise) of an unpublished thesis kept in the library or archives, to a person who satisfies the authorized officer that he or she requires the reproduction for the purposes of research or study.
The Copyright Act grants the creator of a work a number of moral rights, specifically the right of attribution, the right against false attribution and the right of integrity.
You may infringe the author’s moral rights if you:
- fail to acknowledge the author of this thesis if you quote sections from the work
- attribute this thesis to another author
- subject this thesis to derogatory treatment which may prejudice the author’s reputation
For further information contact the University’s Director of Copyright Services
sydney.edu.au/copyright

Page | 1
The Impact of Co-location on the Quality of a Satellite Market:
Evidence from the Singapore Exchange
Esther Yoon Kyeong Lee
A dissertation submitted in fulfilment
of the requirements for the degree of
Master of Philosophy
Discipline of Finance
Faculty of Business and Economics
University of Sydney

Page | 2
COPYRIGHT AND USE OF THIS THESIS This thesis must be used in accordance with the provisions of the Copyright Act 1968. Reproduction of material protected by copyright may be an infringement of copyright and copyright owners may be entitled to take legal action against persons who infringe their copyright. Section 51 (2) of the Copyright Act permits an authorized officer of a university library or archives to provide a copy (by communication or otherwise) of an unpublished thesis kept in the library or archives, to a person who satisfies the authorized officer that he or she requires the reproduction for the purposes of research or study. The Copyright Act grants the creator of a work a number of moral rights, specifically the right of attribution, the right against false attribution and the right of integrity. You may infringe the author’s moral rights if you: - fail to acknowledge the author of this thesis if you quote sections from the work - attribute this thesis to another author - subject this thesis to derogatory treatment which may prejudice the author’s reputation For further information contact the University’s Director of Copyright Services sydney.edu.au/copyright

Page | 3
CERTIFICATE OF ORIGINALITY
I certify that this thesis has not already been submitted for any degree and is not being
submitted as part of candidature for any other degree.
I also certify that the thesis has been written by me and that any help that I have received
in preparing this thesis, and all sources used, have been acknowledged in this thesis.
Signature of Candidate
.………………………
Esther Lee

Page | 4
Table of Contents
LIST OF TABLES.................................................................................................................................... 6
LIST OF FIGURES.................................................................................................................................. 7
SYNOPSIS ................................................................................................................................................ 8
1. INTRODUCTION .............................................................................................................................. 10
2. LITERATURE REVIEW AND HYPOTHESIS DEVELOPMENT ............................................. 17
2.1 Algorithmic and High Frequency Trading ..................................................................................... 17
2.1.1 Description of Algorithmic and High Frequency Trading .................................................. 17
2.1.2 Types of High Frequency Trading Strategies ..................................................................... 22
2.1.3 Co-location Facilities .......................................................................................................... 26
2.2 Impact of Algorithmic and High Frequency Trading on Market Quality....................................... 30
2.3 Cross-listed Securities .................................................................................................................... 35
2.4 Hypothesis Development ................................................................................................................ 42
3. INSTITUTIONAL DETAILS ........................................................................................................... 45
4. DATA AND RESEARCH DESIGN ................................................................................................. 47
4.1 Data ................................................................................................................................................. 47
4.2 Variable Measurements .................................................................................................................. 52
4.2.1 Measures of High Frequency Trading Activity ................................................................... 52
4.2.2 Measures of Market Quality ............................................................................................... 53
4.3 Univariate and Multivariate Analysis ............................................................................................. 56
4.3.1 Univariate Analysis ............................................................................................................. 56
4.3.2 Multivariate Analysis of High Frequency Trading ............................................................. 57

Page | 5
4.3.3 Multivariate Analysis of Liquidity ...................................................................................... 60
5. RESULTS ............................................................................................................................................ 64
5.1 Univariate Results ........................................................................................................................... 64
5.1.1 Two-sample T-Test ............................................................................................................. 66
5.1.2 Paired T-Test ....................................................................................................................... 69
5.2 Multivariate Results ........................................................................................................................ 76
5.2.1 High Frequency Trading ..................................................................................................... 76
5.2.2 Liquidity .............................................................................................................................. 83
6. CONCLUSION ................................................................................................................................... 92
REFERENCES ....................................................................................................................................... 94
APPENDICES ...................................................................................................................................... 101

Page | 6
List of Tables
Table 4-1 Market Structure and Contract Specifications of SGX Futures Contracts .............................. 49
Table 4-2 Market Structure and Contract Specifications of Control Futures Contracts .......................... 51
Table 5-1 Annual Trading Volumes ......................................................................................................... 65
Table 5-2 Descriptive Statistics for SGX Futures Contracts .................................................................... 67
Table 5-3 Descriptive Statistics of Daily Log Ratios ............................................................................... 70
Table 5-4 Contract-Specific High Frequency Trading Regression .......................................................... 77
Table 5-5 Market-Wide High Frequency Trading Regression ................................................................. 79
Table 5-6 Combined High Frequency Trading Regression ...................................................................... 81
Table 5-7 Contract-Specific Liquidity Regression ................................................................................... 84
Table 5-8 Market-Wide Liquidity Regression ......................................................................................... 87
Table 5-9 Combined Liquidity Regression .............................................................................................. 90
Table A-1 Descriptive Statistics for SGX Futures Contracts (Exclusion of Five Trading Days) .......... 101
Table A-2 Descriptive Statistics of Daily Log Ratios (Exclusion of Five Trading Days) ..................... 103
Table A-3 Contract-Specific High Frequency Trading Regression (Exclusion of Five Trading Days) 104
Table A-4 Market-Wide High Frequency Trading Regression (Exclusion of Five Trading Days) ....... 105
Table A-5 Combined High Frequency Trading Regression (Exclusion of Five Trading Days) ............ 106
Table A-6 Contract-Specific Liquidity Regression (Exclusion of Five Trading Days) ......................... 108
Table A-7 Market-Wide Liquidity Regression (Exclusion of Five Trading Days) ............................... 110
Table A-8 Combined Liquidity Regression (Exclusion of Five Trading Days) .................................... 112

Page | 7
List of Figures
Figure 5-1 Relative Trading Volume ....................................................................................................... 71
Figure 5-2 Relative Volatility ................................................................................................................... 74
Page | 8
SYNOPSIS
On 18 April 2011, the Singapore Exchange (SGX) introduced co-location services to its equities and
derivatives markets. This infrastructural improvement was part of a $250 million initiative aimed at
improving the speed of market access and promoting high frequency trading (HFT). Using intraday data
time- stamped in milliseconds, the impact that this microstructure change has on the market quality and
the level of high frequency trading of SGX’s equity-index futures exchange are assessed. This bourse
provides a unique setting to research high frequency trading as it is an offshore satellite exchange where
futures contracts written on foreign market indices are traded. It therefore has cross-border linkages
with home exchanges that trade the same or similar futures contracts, as they are both driven by the
same fundamentals (Covrig, Ding and Low, 2004; Hsieh, 2004).1 An alternative theory i.e. the order
diversion hypothesis posits that dual-listed securities compete for order flow and therefore the cross-
listing of futures contracts cause a migration of trading interest from home bourses into satellite bourses.
This thesis also assesses whether structural improvements on offshore markets are beneficial or
detrimental to home markets.
Increases in the pervasiveness of high frequency trading (HFT) are observed for the Nikkei 225 and
MSCI Taiwan index futures contracts. HFT levels in the CNX Nifty and the FTSE China A50 index
futures contracts, however, decline following the infrastructural change. The results suggest that co-
location services attract more trading interest from high frequency traders on dual-listed stock index
futures exchanges if there are cross-border profit opportunities i.e. markets with alternative trading
venues that are largely accessible to foreigners. Capital controls and the stringent regulatory framework
for overseas investors on the National Stock Exchange of India and the China Financial Futures
Exchange restrict foreign participation in these markets. This conjecture is supported by the empirical
evidence that suggests that HFT trading takes place across borders. An increase in high frequency
trading activity on the alternative venue is shown to increase high frequency trading on Singapore’s 1 Satellite market refers to the exchange that trades futures contracts that are written on foreign market indices. Home market refers to the exchange that trade futures contracts written on domestic market indices.

Page | 9
equity-index futures exchange. This result is consistent across all futures contracts and proxies
examined. It suggests that dual-listed futures markets do not compete for HFT order flow but market
participants on stock index futures bourses engage in cross-border trading strategies.
The impacts co-location services have on the qualities of the Nikkei 225 and the MSCI Taiwan index
futures markedly differ. Co-location services generate more trading activity, improve the liquidity and
ease the volatility of the Nikkei 225 index futures market. The quality of the MSCI Taiwan index
futures market, however, deteriorates as evident by the decrease in trading activity, decline in liquidity
and increase in price volatility. The disparate response to co-location services may reflect the different
types of trading prevailing in the futures contracts. Hagströmer and Nordén (2013) put forward the
argument that HFTs are a heterogeneous group of traders. How different groups of HFT traders affect
the market quality of financial bourses is contingent upon the type of trading strategies utilised. The
results of this thesis suggest that the Nikkei 225 index futures market is characterised by liquidity-
supplying passive HFTs while the MSCI Taiwan index futures market is characterised by liquidity-
demanding active HFTs.
This thesis also finds that liquidity changes on the alternative trading venue explain liquidity changes on
Singapore's stock-index futures exchange. A decrease (increase) in the bid-ask spread (depth) of the
home market contract leads to a decrease (increase) in the bid-ask spread (depth) of the respective
satellite market contract. This finding is consistent with prior literature that document commonality in
liquidity across financial bourses (Chordia, Roll and Subrahmanyam, 2000; Domowitz, Hansch and
Wang, 2005; Karolyi, Lee and Dijk, 2012) and for the stock index futures markets (Frino, Mollica and
Zhou, 2014). Finally, results suggest that low latency trading on Singapore’s derivatives exchange is
contingent upon underlying market conditions. High frequency trading is found to be negatively related
to price volatility across all futures contracts examined. This finding, which is consistent with Brogaard
(2010), suggests that low latency traders are less active in the market during volatile conditions.

Page | 10
1. INTRODUCTION
On May 6 2010, the US equity markets saw its second largest point swing of 1010.14 points in the Dow
Jones industrial. Amid negative market sentiment, the index had declined by over 300 points by early
afternoon. At 2:42pm, the index fell sharply by a further 600 points over a 5 min period to subsequently
recover most of its 600 point loss by 3:07pm. This stock market crash, known as the Flash Crash of
2010, brought about wide-spread speculation and investigation over the role high frequency trading
systems (HFT) had on this market disruption. A report published jointly by the U.S. Securities and
Exchange Commission and the Commodity Futures Trading Commission on 30 September 2010 report
that while HFTs did not cause the Flash Crash, their trading activities exacerbated the extreme price
movements and liquidity shortages that took place on the day.2
The Flash Crash was initiated by a single mutual fund that employed volume but not price or time
constraints to execute the sale of 75,000 E-mini futures contracts (SEC and CFTC, 2010). The
prevailing market conditions and the algorithms used by this mutual fund caused this sell-off to be
completed within 20 minutes, causing a significant drop in prices. HFTs exacerbated this price
movement by submitting large quantities of sell orders to reduce their net long positions. Furthermore,
the market activities of cross-market arbitrageurs caused the prices of the SPYDR futures contract and
individual stocks to plummet correspondingly. At 2:45pm trading on the Chicago Mercantile Exchange
was halted. During the period following the trading halt, while some traders eased their liquidity
provision many collectively withdrew from the equities market causing a liquidity shortage. The events
that took place on May 6, 2010 highlight the susceptibility of exchanges’ computerised environment to
market destabilisations. Algorithmic and high frequency trading practices were brought to the public's
attention and consequently scrutinised by regulatory bodies, academics and policy makers.
2 ‘Findings Regarding the Market Events of May 6, 2010’ was published jointly by the U.S Securities and Exchange Commission and the U.S. Commodity and Futures Trading Commission on 30 September 2010.

Page | 11
High frequency trading, the practice of trading at extremely fast speeds, is a controversial area in
finance. While a line of research documents its beneficial impact on market quality (e.g. Brogaard, 2010;
Hendershott, Jones and Menkveld, 2011; Riordan and Storkenmaier, 2012; Hagströmer and Nordén,
2013), other studies find that it degrades the quality of financial exchanges (Kirilenko, Kyle, Samadi
and Tuzun, 2011; Jarrow and Protter, 2012; Boehmer, Fong and Wu, 2012; Lee, 2013). At its extreme,
as seen by the Flash Crash of 2010, they potentially contribute to the destabilisation of financial
exchanges (SEC and CFTC, 2010). Furthermore, the fairness that a subgroup of traders has faster access
to exchanges and real-time market data is questioned (Barrales, 2012; Angel and McCabe, 2013). It
raises questions of whether HFTs benefit a segment of the market to the detriment of other participants
and therefore creates a two-tiered market. Furthermore, their trading practices have come under scrutiny
as having faster market access raises the possibility of inequitable advantages and market manipulation.
High frequency trading, the focus of this thesis, is currently the subject of much debate.
The general consensus is that high frequency trading has a beneficial impact on market liquidity and
price discovery. Prior to the advent of direct market access, liquidity provision was predominately
carried out by market makers who had contractual agreements with exchanges to quote binding bid and
offer prices. Developments in electronic trading that facilitated other traders to directly access the limit
order book saw the role of liquidity provision extend to high frequency traders (HFT). Studies that
examine the impact of low latency trading on market liquidity find evidence of narrower bid-ask
spreads and improved market depth (Brogaard, 2010; Riordan and Storkenmaier, 2012; Hasbrouck and
Saar, 2013; Menkveld, 2013). Furthermore, arbitrage trading strategies that are employed by low
latency traders reduce transient price disturbances and therefore improve price discovery (Brogaard,
2010; Hendershott and Riordan, 2014; Hasbrouck and Saar, 2013). There is less agreement, however, in
empirical literature regarding its effects on price volatility. While studies such as Hasbrouck and Saar
(2013) and Hagströmer and Nordén (2013) report marked declines, Boehmer, Fong and Wu (2012) and

Page | 12
Kirilenko, Kyle, Samadi and Tuzun (2011) show that high frequency trading and, more broadly,
automated trading lead to an increase in volatility. This thesis assesses price, liquidity and trading
activity variables to determine the effects a microstructure change, aimed at attracting HFT activity,
have on the market quality of a satellite bourse.
High frequency trading is potentially detrimental during adverse market or trading conditions. As
opposed to designated market makers who have an obligation to post firm quotes, HFTs have discretion
over the timing and location of their trades. Brogaard (2010) finds that on the U.S. equities market,
moderate declines in high frequency trading levels arise when volatility increases. If trading levels are
contingent upon the market environment, changes in HFT activity during periods of unfavourable
conditions may degrade the quality of financial bourses. It is found that the collective withdrawal of
traders contributed to the liquidity shortage in the equities market during the Flash Crash (SEC and
CFTC, 2010; Kirilenko, Kyle, Samadi and Tuzun, 2011). Furthermore, due to the magnitude and speed
of trading that takes place, HFT systems may exacerbate risks by accelerating the propagation of trading
errors or illegal trades. The greater correlation between computer-initiated orders than human-initiated
orders (Chaboud, Chiquoine, Hjalmarsson and Vega, 2014) suggests the greater susceptibility of risk
transmissions. By regressing high frequency trading proxies on price volatility, Brogaard’s finding
(2010) that HFT participation rates are contingent upon market conditions, is reassessed in the context
of Singapore’s equity-index futures exchange.
The fairness of low latency trading remains a highly contentious issue. High frequency trading is found
to be profitable with approximately $3 billion of trading profits generated annually on NASDAQ
(Brogaard, 2010). However, whether these trading profits are derived from fair, equitable means is
debatable. Proponents argue that traditional investors benefit from the positive externalities of HFTs and
therefore the practice of trading at high speeds is not necessarily unfair (Angel and McCabe, 2013).
Narrower bid-ask spreads due to greater HFT presence reduce the implicit cost of trading for other

Page | 13
market participants (Hendershott, Jones and Menkveld, 2011; Riordan and Storkenmaier, 2012;
Hasbrouck and Saar, 2013). Furthermore, the arbitrage activities of low latency traders reduce
mispricings and improve the efficiency at which prices are determined (Brogaard, 2010; Hendershott
and Riordan, 2014; Chaboud, Chiquoine, Hjalmarsson and Vega, 2014). High frequency trading is,
therefore, not necessarily unfair to long-term investors as they derive benefits from improvements to the
quality of markets (Hasbrouck and Saar, 2013).
Critics of high frequency trading put forward the argument that trading venues where a segment of the
market has faster access to the limit order book and real-time market data is inherently unfair. It gives a
subgroup of traders speed advantages over other market participants and therefore profit opportunities
to the detriment of slower traders (Jarrow and Protter, 2012; McInish and Upson, 2011). Furthermore,
low latency traders impose adverse selection costs to competing traders (Biais, Foucault and Moinas,
2013). Critics of HFT also argue that the fast market access may be used for market manipulation.
Predatory algorithmic strategies such as spoofing and order triggering artificially inflates or deflates
prices. These strategies generate profits for high frequency trading systems at the expense of slower
traders who buy or sell assets at less favourable prices (Angel and McCabe, 2013). Empirical research
conducted by Brogaard (2010), however, finds that front-running, a type of predatory trading strategy is
not systematically employed by HFTs on the US equities market.
The level of high frequency trading across financial markets varies due to differences in their market
microstructure and regulatory framework. In the United States and Western Europe, high frequency
trading accounts for a substantial proportion of their equity activity.3 Algorithmic trading is thought to
be responsible for as much as 73% of trading volume in the United States in 2009 (Hendershott, Jones
and Menkveld, 2011). These markets are conducive to HFT activity as they have become highly
fragmented. To capture the market share of a particular stock, trading venues compete for order flow by
3 According to Brogaard (2010), the trade participation rate of HFT firms for his sample of NASDAQ and NYSE‐listed stocks is 74%. In a more recent study conducted by Carion (2013) with the same dataset, HFT traders contribute to 68.3% of the dollar trading volume.

Page | 14
lowering transaction fees. Low trading costs and multiple venues at which price discrepancies can be
profited from are reasons for its pervasiveness in the US and Europe. Trading in these areas is becoming
increasingly fragmented due to the establishment of alternative trading venues such as Chi-X and BATS.
According to a report published by the U.S. Securities and Exchange Commission, the New York Stock
Exchange’s market share of equity trading was significantly higher in January 2005. 4 Approximately
79.1% of its listed shares’ aggregate trading volume was transacted on the exchange. By October 2009,
the bourse’s market share had declined to 25.1%.
The overall prevalence of HFT in the equity markets of the Asia-Pacific region, however, has remained
low, with the exception of Japan and Australia.5 This is due to a lack of competing exchanges and
comparatively higher transaction costs, making high frequency trading strategies unprofitable.6 Despite
low participation rates in equity markets, it has a larger presence in Asia’s derivatives bourses due to
their lower levies and less stringent regulatory environment.7 In Korea, as opposed to the equities
market, taxes are not imposed on transactions on the KOSPI 200 index futures market. Consequently,
greater HFT activity takes place on the futures market in Korea than on the equities market. According
to Lee (2013), 24% of trading activity and 32% of quoting activity on the Korean stock index futures
market are attributable to low latency activity. He suggests that index futures markets may be a popular
trading venue for high frequency traders due to their greater liquidity (Lee, 2013). Similarly, HFT
activity on Singapore’s derivatives market, the institutional setting of this thesis, accounts for
approximately 30% of their trading volume while on its equities market levels are minimal. The
fragmentation of stock-index futures trading across multiple bourses is likely to be a contributing factor
for its sizeable HFT levels on SGX’s derivatives market.
4 This report is titled, “Concept Release on Equity Market Structure” and was published by the U.S. SEC in 2010. 5 A report conducted by the Schroders report that the proportion of HFT in the Asia‐Pacific markets (excluding Australia and Japan) is 12% of the total value traded. 6 Market participants in Hong Kong and South Korea incur a stamp duty tax of 0.1% and 0.3% respectively. 7 Foreign HFT participation in China and India’s derivatives markets are low due to capital controls that restrict onshore access by foreigners.

Page | 15
Singapore’s derivatives market provides a unique setting to research high frequency trading as it is an
offshore satellite bourse where futures contracts written on foreign market indices are traded. The same
or similar equity-index futures contracts are also listed on domestic trading venues. Extant literature
suggests that the listing of a security across multiple exchanges may be beneficial or detriment to the
market quality of competing markets. An offshore trading venue could potentially reduce the demand
for an asset on a domestic bourse (Domowitz, Glen and Madhavan, 1998). When cross-listed securities
markets compete for the same order flow, a microstructural improvement on one of the rival markets
may cause an outflow of orders on the competing trading venue, consequently deteriorating its market
quality. Alternatively, greater intermarket competition may reduce bid-ask spreads or prompt alternative
markets to make policy changes to attract order flow (Foucault and Menkveld, 2008). Furthermore, as
identical financial instruments listed on multiple exchanges are driven by the same fundamentals, they
are informationally-linked (Booth, Lee and Tse, 1996; Hua and Chen, 2007; Chen and Gau, 2009).
Arbitrage profit opportunities exist when prices deviate from their relative values (Board and Sutcliffe,
1996). The multiple listing of an asset may positively impact the market quality of all exchanges due to
cross-border trading activities (Board and Sutcliffe, 1996).
Given the unique characteristics of cross-listed securities bourses, this thesis aims to address the
following research questions:
i) Does the introduction of co-location services increase the incidence of high frequency
trading on an off-shore market?
ii) Does market quality improve subsequent to the implementation of co-location facilities on
equity-index futures exchanges?
iii) How does a microstructure improvement on an off-shore bourse impact the market quality of
its related domestic bourse?
iv) Do high frequency traders reduce their participation levels during periods of greater
volatility?
Page | 16
The remainder of this thesis is structured as follows. Chapter 2 provides a review of prior literature
regarding algorithmic trading, high frequency trading and cross-listed securities markets. Chapter 3
presents an outline of the institutional details of Singapore’s equity-index futures exchange. Chapter 4
describes the data and the research design employed in this thesis. Chapter 5 presents the results of both
the univariate and multivariate analysis. Chapter 6 concludes by discussing the key findings of the
research.

Page | 17
2. LITERATURE REVIEW AND HYPOTHESIS DEVELOPMENT
2.1. Algorithmic and High Frequency Trading
2.1.1 Description of Algorithmic and High Frequency Trading
Algorithmic trading or automated trading (AT) refers to the use of computerised systems and algorithms
to make and execute trading strategies on bourses with electronic access. Pre-programmed algorithms
analyse market data to determine the optimal time to enter the market and other variables including the
type, price and quantity of the orders to be submitted. Algorithmic trading is classified into two broad
categories: agency algorithmic trading and proprietary algorithmic trading (Hagströmer and Nordén,
2013). Agency trading refers to the purchase and sale of securities initiated by agents on behalf of their
clients. It is employed by buy-side institutional investors to mitigate the market risk and execution costs
of their clients’ orders. To minimise the impact that a large trade has on a security’s price, it is often
divided into smaller parcels and traded over a period of time or routed to multiple trading venues.
Algorithms are customarily used in this instance to compute when and where each parcel should be
executed for the best price possible. Proprietary algorithmic trading, on the other hand, is undertaken by
technologically advanced financial institutions to generate profits by directly trading with their own
capital. A class of proprietary algorithmic traders are high frequency traders (Hasbrouck and Saar,
2013).
High frequency trading (HFT) is a subset of algorithmic trading where the submissions, amendments
and cancellations of automated trading instructions take place at rapid speeds. Through proprietary
trading strategies, advanced computerised systems and fast access to financial markets, positions are
established or liquidated within fractions of a second, typically milliseconds. While other types of
trading seek to generate a significant abnormal return for every transaction executed, HFTs aim to
capitalise on marginal profit opportunities and to accumulate profits by trading frequently. Various
trading strategies are implemented by HFT systems to identify and trade on incremental profit

Page | 18
opportunities in the market. They include arbitrage trading, market making, order discovery strategies
and order triggering strategies. These types of trading are not recent developments but existing,
traditional strategies executed at high speeds using low latency technology (Angel and McCabe, 2013).
Further discussions on HFT strategies are provided in Section 2.1.2. In response to the growing
prevalence of high speed trading in financial markets, policy makers have upgraded the microstructure
of exchanges. The implementation of co-location facilities is a structural change made by exchanges to
increase the speed at which traders can access the limit order book and therefore to generate more
trading interest from HFTs. This innovation in low latency technology will be discussed in Section 2.1.3.
As high frequency trading is a recent development in electronic trading, there has yet to be a universally
accepted definition of it. The U.S. Securities and Exchange Commission characterises HFTs as
proprietary entities that involve:8
the use of extraordinarily high speed and sophisticated computer programs for generating,
routing and executing orders;
the use of co-location services and individual data feeds offered by exchanges and others to
minimise network and other type of latencies;
very short time-frames for establishing and liquidating positions;
the submission of numerous orders that that are cancelled shortly after submissions;
ending the trading day in as close to a flat position as possible (that is, not carrying significant,
unhedged positions overnight).
Definitions of high frequency trading (HFT) provided in literature are congruous to the definitions
outlined by the U.S Securities and Exchange Commission and other regulatory bodies.9 Firstly, a
8 This definition of high frequency traders was provided by the U.S. Securities and Exchange Commission in a 2010 publication titled “Concept Release on Equity Market Structure.” 9 Documents released by other regulatory bodies including the Committee of European Securities Regulators (2010), the Australian Securities and Investment Commission (2010), the Authority for the Financial Markets (2010) and the European Commission (2010) provide definitions of high frequency trading.

Page | 19
distinctive characteristic of HFTs is the extremely fast speed at which they move into and out of
positions in the market. Speed is a defining factor for low latency market participants as profits are
generated by being faster than competing traders. This speed is known as latency. According to
Hasbrouck and Saar (2013), latency is defined as the time it takes to learn about an event, generate a
response and have the exchange act on the response. The latency at which high speed traders execute
orders is extremely low and markedly lower than other market participants (Chaboud, Chiquione,
Hjalmarsson and Vega, 2014; Hagströmer and Nordén, 2013; Hasbrouck and Saar, 2013). For example,
a major HFT market participant on Chi-X and Euronext has access to an effective trading speed of 1ms
(Menkveld, 2013). Disparities in latencies across groups of market participants are documented in
literature (Hagströmer and Nordén, 2013; Hasbrouck and Saar, 2013). In August 2011, compared to a
minimum latency of 0.96ms that non-HFTs trade at, the minimum trading speed of HFTs is 0.36ms on
the NASDAQ-OMX Stockholm (Hagströmer and Nordén, 2013). Similarly, the most sophisticated high
speed traders have access to latencies of 2-3ms on NASDAQ. Response times for humans, however, are
substantially slower at approximately 200ms (Kosinski, 2012; Hasbrouck and Saar, 2013).
High frequency trading is also characterised by very brief holding periods and the liquidation of
investment positions prior to a trading day’s close. On NASDAQ-OMX, the average duration of limit
orders for non-HFTs is 20,434ms in August 2011. In comparison, significantly shorter holding periods
of 2,774ms are reported for HFT market participants during the same month (Hagströmer and Nordén,
2013). Furthermore, average limit order duration is found to be a function of market conditions and
trading strategy types. An analysis of HFT holding periods find that it is significantly shorter during
periods of greater volatility. The need to update quotes faster and more frequently when there are large
variations in prices may be a reason for the shorter limit order durations. Furthermore, low latency
traders such as market making HFTs that adopt a more passive trading strategy have longer holding

Page | 20
periods. These market participants do not rely on active trading and therefore their trading strategies are
characterised by longer limit order durations (Hagströmer and Nordén, 2013).
High frequency traders liquidate most of their inventory positions prior to a trading session’s close.10
Empirical studies that examine the trading behaviour of HFTs at a markets close find evidence of
overnight exposure minimisation. On the Chi-X and Euronext, a major HFT market maker liquidates his
entire inventory position on 69.8% of trading days (Menkveld, 2013). Similarly, a significant 42% of
low latency traders on the KOSPI 200 index futures market end the trading day with a zero inventory
position. The net inventory levels of the remaining 56% are marginally negative or positive (Lee, 2013).
The trading strategies of HFTs on the NASDAQ-OMX Stockholm is also characterised by low
overnight positions (Hagströmer and Nordén, 2013). However, they find that net positions at the
markets close are, on average, non-zero. This may be attributable to cross-market HFT trading activities
that take place across multiple trading venues and multiple trading sessions. Finally, an analysis of
investment positions during the trading day shows that while high frequency traders alternate between
long and short net positions numerous times during a trading session, other market participants seldom
change their net positions (Brogaard, 2010).
Another prominent characteristic of HFTs is their quoting intensity. While other types of trading aim to
generate significant abnormal returns for every trade executed, the purpose of high frequency trading is
to capitalise on marginal profit opportunities in the market and to accumulate profits by trading
frequently. HFT strategies are usually order-intensive and characterised by large quantities of order
submissions, amendments and cancellations. Consequently, order to trade ratios are widely employed in
literature to differentiate HFT market activity from non-HFT market activity (Brogaard, 2010;
Hendershott, Jones and Menkveld, 2011; Boehmer, Fong and Wu, 2012; Frino, Mollica and Webb,
10 Investment positions held overnight incur clearing and capital expenses.

Page | 21
2014). Evidence of high quoting intensity is found on the KOSPI 200 index futures market where order
cancellations constitute 33% of quoting activity (Lee, 2013). An examination of quoting intensity on the
NASDAQ-OMX Stockholm finds that order to trade ratios of HFTs are significantly higher during
volatile market conditions (Hagströmer and Nordén, 2013). This suggests that contrary to the findings
of Brogaard (2010), high speed traders do not reduce their presence during uncertain market conditions.
Trading strategies that are commonly implemented by high speed market participants are explored
further in Section 2.1.2.
High frequency trading involves the use of co-location or proximity services to buy or sell highly liquid
securities (Gomber, Arndt, Lutat and Uhle, 2011). Hendershott, Jones and Menkveld (2011) show that
on the New York Stock Exchange, active and liquid stocks generate the most trading interest from
HFTs. Furthermore, Lee (2013) suggests that the greater liquidity of futures markets and consequently
the ease at which market participants can establish and liquidate positions are reasons for its attraction
among HFTs. However, Hagströmer and Nordén (2013) suggest that the preference for liquid securities
differ across groups of high frequency traders. Liquidity suppliers such as market makers profit from the
bid-ask spread while liquidity demanders such as opportunistic traders pay the differential in prices.
Securities with narrow bid-ask spreads therefore incentivise liquidity consumptions but makes the
provision of liquidity more expensive. The converse holds for securities characterised by wider bid-ask
spreads. Hagströmer and Nordén (2013) shows that on the NASDAQ-OMX Stockholm, market making
is significantly higher in stocks that have wider bid-ask spreads. Therefore, different HFT trading
strategies require different levels of market liquidity. Finally, as speed is defining factor for high
frequency traders, co-location or proximity services are utilised to remain competitive. This innovation
in market microstructure will be discussed further in Section 2.1.3.

Page | 22
2.1.2 Types of High Frequency Trading Strategies
Hagströmer and Nordén (2013) suggest that high frequency market participants are a heterogeneous
group of traders. While market makers are predominately liquidity suppliers, opportunistic traders such
as arbitrageurs or directional traders primarily consume liquidity. Consequently, the impact that they
have on the market quality of financial exchanges differ. This highlights the importance of
understanding the nature of trading strategies commonly utilised by high frequency traders. Most HFT
trading strategies are not newly developed but are existing, traditional mandates executed at high speeds
using low latency technology (Angel and McCabe, 2013). An empirical analysis of the range of
strategies implemented by HFTs on the U.S. equities market finds that they focus on a smaller set of
trading strategies than non-HFTs (Brogaard, 2010). HFT trading are categorised into three subgroups:
market making, arbitrage trading and directional trading. This section of the thesis provides a
description of the different types of trading.
Market makers facilitate trading in a security by continuously providing firm bid and ask quotes
throughout the trading day. Their business model is to trade in large volumes and to generate
incremental profits from the bid-ask spread. Prior to the advent of direct market access, liquidity
provision was predominately carried out by market makers who had contractual agreements with
exchanges to quote binding bid and offer prices. Developments in electronic trading that facilitated
other traders to directly access the limit order book saw the role of liquidity provision extend to HFTs.
Prior literature find that market-making HFTs constitute a significant proportion of an exchanges low
latency activity (Hagströmer and Nordén, 2013; Menkveld, 2013). A majority of high frequency trades
in Swedish large capitalisation stocks are transacted by market makers. Specifically, market makers
account for 7.15% and 62.8% of the exchange’s HFT trading volume during normal and volatile market
conditions, respectively (Hagströmer and Nordén, 2013). Furthermore, a major high frequency trader

Page | 23
who has captured a significant 64.4% and 8.1% market share of Chi-X and Euronext, respectively
functions primarily as a multi-venue market maker.
A comparison of trading strategies show that market making HFTs is characterised by greater quoting
intensity and faster trading speeds than other categories of low latency traders. In August 2011, the
minimum latency of market makers is found to be 0.1ms on NASDAQ-OMX Stockholm. Opportunistic
traders, conversely, experience a minimum latency of 0.6ms over this period (Hagströmer and Nordén
2013). This heterogeneity in latencies may be attributable to the different nature of the trading strategies.
Opportunistic HFTs adopt active trading strategies and therefore face less risk of being adversely
selected. Market-making HFTs, however, partake in passive trading and therefore face additional risks
of trading with faster, more informed market participants. The ability to update quotes faster is therefore
more critical for market making HFTs. Consequently this group of traders may trade at faster speeds.
The competition among liquidity providers may also be a reason for the lower latency.
Arbitrage strategies involve identifying and trading on temporary price discrepancies that arise across
related assets or financial markets. When a mispricing has been detected in the market, arbitrageurs sell
the overvalued asset and purchased the undervalued asset. These trading activites place upward pressure
on the undervalued asset and downward pressure on the overvalued asset, thereby correcting the
mispricing. As financial markets are extensively monitored by many traders, arbitrage opportunities are
temporary and short-lived. Consequently, due to the succinct time periods at which profitable
mispricings materialise in financial markets, HFT strategies and low latency technologies are required
to establish positions at high speeds. Studies find that high frequency arbitrageurs are more active in
volatile market conditions (Brogaard, 2010; Hagströmer and Nordén, 2013). The greater deviations in
prices may give rise to greater profitable mispricings and therefore generate more trading interest from
HFTs. However, Chaboud, Chiquione, Hjalmarsson and Vega (2014) document that the advent of
algorithmic trading has led to a significant decline in triangular arbitrageur opportunities in foreign
exchange markets confirming that arbitrage opportunities are limited.

Page | 24
Directional trading involves the analysis of current available information to anticipate future market
movements. The type of information used to infer market or company activity determines the legality of
this trading strategy. In most jurisdictions, the use of price sensitive, non-public information breaches
insider trading regulations. In Singapore, Sections 218 and 219 of the Securities and Futures Act
prohibit insider trading on Singapore's capital markets. However, order anticipations strategies based on
public information are arguably ethical (Angel and McCabe, 2013). The following section will discuss
both the legal and illegal types of directional trading implemented by HFTs.
The arrival of new, material information regarding a security’s price causes the market’s consensus of
its value to be revised. Prices usually decrease or increase following the arrival of unexpected negative
or positive news, respectively. News reaction strategies involve the analysis of publicly available
information including news releases, company announcements or analysts’ forecasts to predict and trade
on expected price movements. Before the information is fully reflected in the securities’ price, profit
opportunities arise for fasts traders. Previous studies find that the information is impounded into prices
soon after its arrival (Ederington and Lee, 1993; Fleming and Remolona, 1997). A more recent study by
Carrion (2013) show that the efficiency at which market information regarding order flow and market-
wide returns is incorporated into prices is higher due to high frequency traders. In highly efficient
markets where the speed of price adjustment is fast, market participants require low latency technology
for news reaction strategies.
Order discovery strategies are utilised by HFTs to detect latent liquidity or trading activity in financial
markets. This strategy involves “pinging” the market through the submission and cancellation of orders
for the purpose of uncovering large institutional orders that have yet to be filled. When a high frequency
trader infers that a large block trade is taking place, he then trades in the same direction as a block trade
in anticipation of significant price movements. A large buy order places upward pressure on a securities
price. To minimise its impact, it is often divided into smaller packages and traded over a period of time
or routed to alternative trading venues. HFTs that detect the existence of a block trade submit buy orders

Page | 25
to profit from the expected increase in price. As opposed to front running, anticipatory trading strategies
that detects latent market activity based on public information is beneficial to financial markets as they
improve the efficiency at which prices are determined (Angel and McCabe, 2013).
A controversial area in the practice of trading at high speeds is the possibility of market manipulation
through predatory trading strategies. Predatory strategies utilise insider information or market
manipulation to generate illegal trading profits. This type of trading inflates or deflates prices or trading
volumes to induce other market participants to buy or sell at less favourable conditions. In Singapore,
market manipulation is outlawed under the Section 197 of the Securities and Futures Act, which
prohibit:
(a) creation of a false or misleading appearance of active trading in any securities on a securities
exchange in Singapore;
(b) creation of a false or misleading appearance with respect to the market for the price of any
securities on a securities exchange in Singapore;
(c) affecting the price of securities by way of purchase or sale that do not involve a change in
the beneficial ownership of those securities;
(d) affecting the price of securities by means of any fictitious transactions of devices.
Order triggering strategies, spoofing, wash sales and quote stuffing are types of illegal market
manipulation. These types of unconstitutional trading activities artificially inflate or deflate prices or
trading volumes to the detriment of slower traders. Order triggering strategies involve the deliberate
manipulation of prices to induce other market participants to trade. HFTs may short sale a security and
consequently cause its price to decline. Other market participants may view this decline as an indication
of adverse changes in a securities’ fundamentals and therefore may choose to sell the security. This
causes a further decline in its price which in turn may trigger stop orders or liquidate margin accounts.
The HFT then covers the short position and generate a profit from the artificially deflated prices.
Page | 26
Spoofing refers to the submission of orders with the intention of cancelling prior to its execution. Wash
sales involve the simultaneous purchase and sale of a security to create the false impression of buying
and selling pressures. Finally, quote stuffing refers to the submission and cancellation of large quantities
of orders to slow competing traders down and therefore reduce their competitive edge. Previous studies
suggest that while market making and arbitrage activity improve market quality, predatory trading
practices have a detrimental impact on financial exchanges. The disparate impact that different trading
strategies have on the quality of financial bourses is explored in Sections 2.2.1 and 2.2.2.
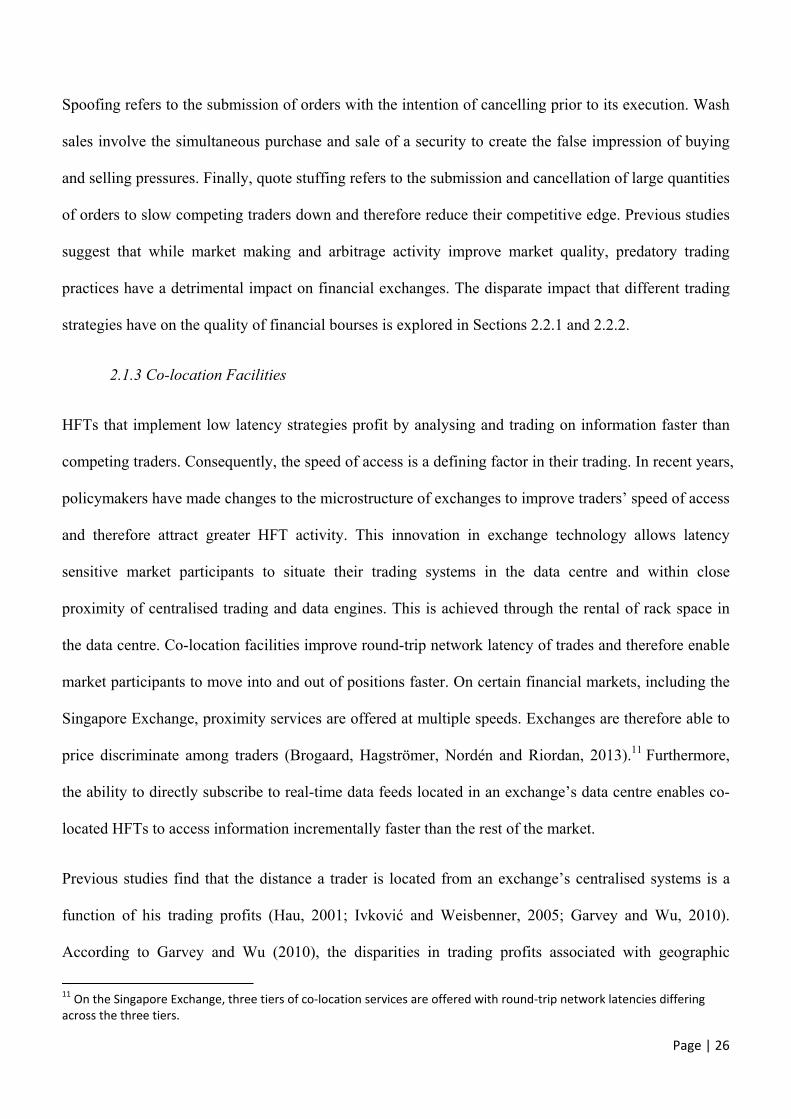
2.1.3 Co-location Facilities
HFTs that implement low latency strategies profit by analysing and trading on information faster than
competing traders. Consequently, the speed of access is a defining factor in their trading. In recent years,
policymakers have made changes to the microstructure of exchanges to improve traders’ speed of access
and therefore attract greater HFT activity. This innovation in exchange technology allows latency
sensitive market participants to situate their trading systems in the data centre and within close
proximity of centralised trading and data engines. This is achieved through the rental of rack space in
the data centre. Co-location facilities improve round-trip network latency of trades and therefore enable
market participants to move into and out of positions faster. On certain financial markets, including the
Singapore Exchange, proximity services are offered at multiple speeds. Exchanges are therefore able to
price discriminate among traders (Brogaard, Hagströmer, Nordén and Riordan, 2013).11 Furthermore,
the ability to directly subscribe to real-time data feeds located in an exchange’s data centre enables co-
located HFTs to access information incrementally faster than the rest of the market.
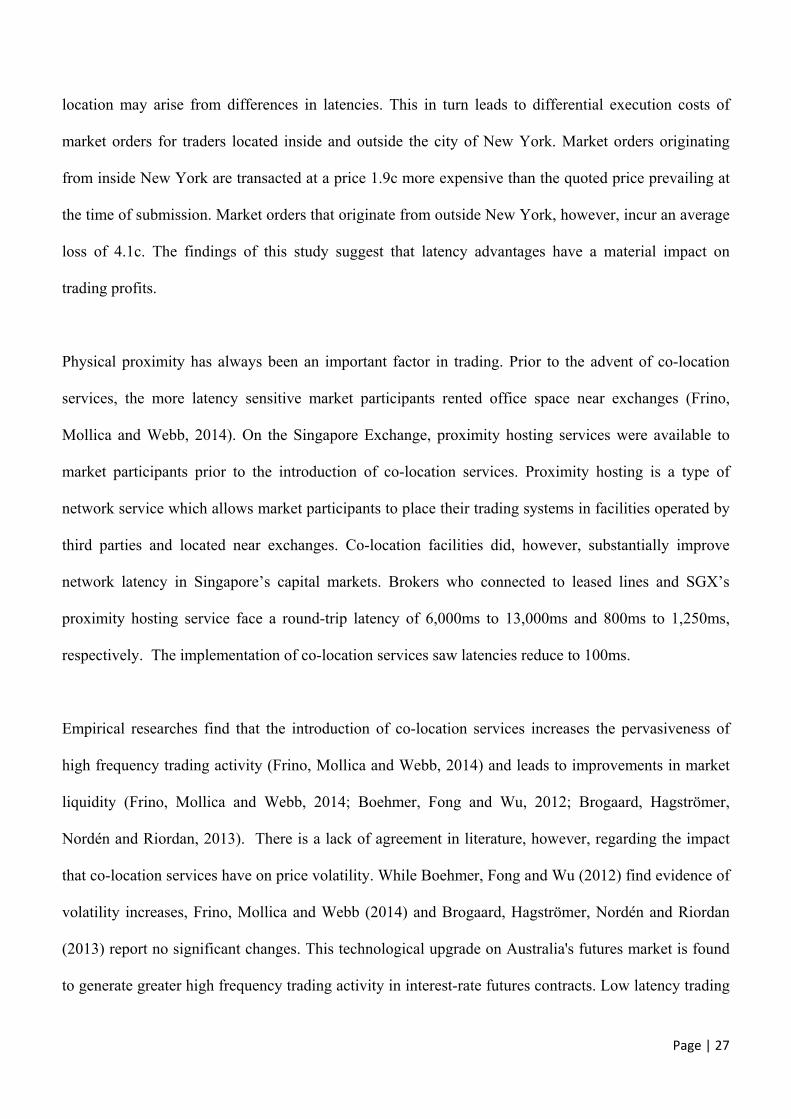
Previous studies find that the distance a trader is located from an exchange’s centralised systems is a
function of his trading profits (Hau, 2001; Ivković and Weisbenner, 2005; Garvey and Wu, 2010).
According to Garvey and Wu (2010), the disparities in trading profits associated with geographic
11 On the Singapore Exchange, three tiers of co‐location services are offered with round‐trip network latencies differing across the three tiers.
Page | 27
location may arise from differences in latencies. This in turn leads to differential execution costs of
market orders for traders located inside and outside the city of New York. Market orders originating
from inside New York are transacted at a price 1.9c more expensive than the quoted price prevailing at
the time of submission. Market orders that originate from outside New York, however, incur an average
loss of 4.1c. The findings of this study suggest that latency advantages have a material impact on
trading profits.
Physical proximity has always been an important factor in trading. Prior to the advent of co-location
services, the more latency sensitive market participants rented office space near exchanges (Frino,
Mollica and Webb, 2014). On the Singapore Exchange, proximity hosting services were available to
market participants prior to the introduction of co-location services. Proximity hosting is a type of
network service which allows market participants to place their trading systems in facilities operated by
third parties and located near exchanges. Co-location facilities did, however, substantially improve
network latency in Singapore’s capital markets. Brokers who connected to leased lines and SGX’s
proximity hosting service face a round-trip latency of 6,000ms to 13,000ms and 800ms to 1,250ms,
respectively. The implementation of co-location services saw latencies reduce to 100ms.
Empirical researches find that the introduction of co-location services increases the pervasiveness of
high frequency trading activity (Frino, Mollica and Webb, 2014) and leads to improvements in market
liquidity (Frino, Mollica and Webb, 2014; Boehmer, Fong and Wu, 2012; Brogaard, Hagströmer,
Nordén and Riordan, 2013). There is a lack of agreement in literature, however, regarding the impact
that co-location services have on price volatility. While Boehmer, Fong and Wu (2012) find evidence of
volatility increases, Frino, Mollica and Webb (2014) and Brogaard, Hagströmer, Nordén and Riordan
(2013) report no significant changes. This technological upgrade on Australia's futures market is found
to generate greater high frequency trading activity in interest-rate futures contracts. Low latency trading

Page | 28
activity in the equity-index futures contract, however, decline significantly. Frino, Mollica and Webb
(2014) attribute this to a tax on cash market equity message traffic that was introduced around the time
of the infrastructural change. High frequency trading in the cash market is more expensive due to the tax,
the profitability of cross-market arbitrage activities is reduced and consequently high frequency trading
levels decline.
Liquidity improvements arising from the introduction or upgrade of co-location facilities is documented
in literature (Frino, Mollica and Webb, 2014; Boehmer, Fong and Wu, 2012; Brogaard, Hagströmer,
Nordén and Riordan, 2013). On the ASX, bid-ask spreads narrow and market depth increase
significantly for interest rate futures contracts. Equity-index futures contracts also experience
improvements in liquidity, despite an evident decline in HFT levels. They conjecture that co-location
services improve the speed at which HFTs and other market participants are able to supply liquidity and
therefore have a positive impact on spreads and market depth. Boehmer, Fong and Wu (2012) use the
introduction of co-location services as an instrumental variable to assess the causality of algorithmic
trading on the liquidity of equities market. They find that liquidity improvements are most pronounced
for stocks characterised by high price or low volatility. Conversely, less expensive or more volatile
stocks experience mild increases in liquidity. Greater algorithmic trading on small capitalisation stocks,
however, deteriorates market liquidity.
10G Premium Co-location Services was introduced on NASDAQ-OMX which enable existing co-
located HFTs to upgrade to faster trading speeds. Brogaard, Hagströmer, Nordén and Riordan (2013)
study this microstructure change and suggest that there are two opposing impacts on liquidity that arise
from the availability of lower latency. Market participants who trade at faster speeds have the capacity
to adjust more quickly to market events. Consequently, they have an informational advantage over
slower traders and impose adverse selection costs to their competitors. This is consistent with

Page | 29
theoretical models of Biais, Foucult and Moinas (2013) and Martinez and Rosu (2011). Faster trading
speeds, conversely, encourage liquidity provision and improve the management of inventory, thereby
have a positive impact on market liquidity. Overall, bid-ask spreads narrow and market depth increase
following the upgrade of co-location services. The results suggest that while there are negative impacts
on liquidity of slower, competing traders, the market benefits from overall improvements in liquidity.
While empirical studies show that the introduction of co-location services improve liquidity, there is
less agreement regarding its impact on price volatility. Boehmer, Fong and Wu (2012) find that
volatility is exacerbated by greater proliferation of algorithmic trading on global equities markets.
Brogaard, Hagströmer, Nordén and Riordan (2013) and Frino, Mollica and Webb (2014), however, find
no evidence of volatility changes in Swedish large capitalisation stocks or Australian futures contracts,
respectively. Boehmer, Fong and Wu (2012) test for the source of the volatility increase and find that it
is not associated with the greater efficiency at which prices are determined in the market i.e. faster price
discovery. They conclude that the evident increase in volatility is not derived from positive sources.
Brogaard, Hagströmer, Nordén and Riordan (2013) show that the greater willingness and ability of high
speed traders to hold inventory are reasons for the resilience of price volatility from co-location service
upgrades. If more inventories are held by a group of traders, large market orders that consume liquidity
can be absorbed without correspondingly large price impacts. Therefore, the non-permanent component
of volatility may be reduced. Furthermore, improvements in inventory management capacity may also
contribute to a decrease in price pressures and thereby also reduce the non-permanent component of
volatility (Hendershott and Menkveld, 2013; Brogaard, Hagströmer, Nordén and Riordan (2013). How
algorithmic and high frequency traders affect the liquidity and volatility of financial markets are
explored further in Sections 2.2.1 and Sections 2.2.2.

Page | 30
2.2. Impact of Algorithmic and High Frequency Trading on Market Quality
The impact that high frequency trading and, more generally, algorithmic trading has on the market
quality of financial exchanges are subject to ongoing research. The general consensus in empirical
literature is that they have a positive impact on market liquidity (Brogaard, 2010; Hendershott, Jones
and Menkveld, 2011; Riordan and Storkenmaier, 2012; Hasbrouck and Saar, 2013). Heterogeneity in
liquidity impacts, however, arise across different characteristics of securities (Hendershott, Jones and
Menkveld, 2011; Boehmer, Fong and Wu, 2012; Riordan and Storkenmaier, 2012), market conditions
(Hasbrouck and Saar, 2013), trading strategies (Hagströmer and Nordén, 2013) and financial exchanges
(Lee, 2013). The impacts of algorithmic and high frequency trading systems on price volatility are less
conclusive. While a line of studies find evidence of volatility increases (Boehmer, Fong and Wu, 2013;
still Kirilenko, Kyle, Samadi, Tuzun, 2011), other researches suggest it has a mitigating effect on price
volatility (Brogaard, 2010; Hagströmer and Nordén, 2013; Hasbrouck and Saar, 2013). Finally, other
studies find volatility levels to be insensitive to algorithmic and high frequency trading (Lee, 2013;
Chaboud, Chiquione, Hjalmarsson and Vega, 2014 and Frino, Mollica and Webb, 2014).
Prior to the advent of direct market access, liquidity provision was predominately carried out by market
makers who have affirmative obligations to quote binding bid and offer prices.12 Developments in
electronic trading that facilitate other traders to directly access the limit order book saw the role of
liquidity provision extend to HFTs. The greater competition among a larger group of liquidity providers
may narrow bid-ask spreads and therefore improve market liquidity (Hendershott, Jones and Menkveld,
2011). Improvements in liquidity attributable to algorithmic and high frequency trading are extensively
documented in literature. Hendershott, Jones and Menkveld (2011) show that increased levels of
automated trading following the introduction of autoquoting on the New York Stock Exchange
significantly reduced quoted and effective bid-ask spreads. The reduction in spreads, however, is found
12 Market making scheme are not in place on the Singapore Exchange.

Page | 31
to be driven by a decline in the adverse selection component of the spreads’ costs. Similarly, Menkveld
(2013) shows that the market activity of a major HFT trader on the Chi-X and Euronext is pivotal to the
50% reduction in the bid-ask spreads in Dutch stocks. Finally, Hasbrouck and Saar (2013) find that a
one standard deviation in their proxy for low latency activity leads to a 26% and 32% decrease in bid-
ask spreads during volatile and normal market conditions, respectively.
Studies find that the increased algorithmic and high frequency trading levels have different liquidity
impacts across different characteristics of securities. Hendershott, Jones and Menkveld (2011) find that
liquidity improvements are concentrated in large-capitalisation stocks. Similarly, Boehmer, Fong and
Wu (2012) examine the introduction of co-location facilities on international equities markets. This
microstructure event is used as an instrumental variable to examine the causality of algorithmic trading
on market liquidity. Analogous to Hendershott, Jones and Menkveld (2011), greater increases in
liquidity levels are observed for high price or low volatility stocks. Less expensive or more volatile
stocks experience mild increases in liquidity. Small capitalisation stocks, however, report deterioration
in liquidity attributable to greater automated trading. They suggest that in a more volatility market, limit
orders are more expensive and this may discourage liquidity provision. Elevated levels of volatility are
more prevalent in stocks that are small, low-priced or volatile. Conversely, Riordan and Storkenmaier
(2012) assess how a technological enhancement on the Deustche Bourse that reduces network latency
from 50ms to 10ms affects the bid-ask spreads of stocks. They find that liquidity improvements are
most evident in small and medium-sized stocks. Analogous to Hendershott, Jones and Menkveld (2011),
reductions in quoted and effective spreads arise from a decline in adverse selection costs. Both papers
conjecture that increased automated or high-speed trading reduce the competition for liquidity provision.
However, Hendershott, Jones and Menkveld (2011) note that although liquidity suppliers are capturing
some of the surplus for themselves, as evident by the increase in realised spreads, the market power of
computerised systems appear to decline.

Page | 32
The magnitudes of liquidity changes from low latency market activity are shown to differ across market
conditions. Hasbrouck and Saar (2013) examine how increased low latency trading affects the quality of
financial exchanges under different market conditions on NASDAQ. Two sample periods are examined.
During October 2007, prevailing market conditions are normal. The market conditions of June 2008 are
characterised by uncertainty and high volatility. They find an increase in the low latency trading leads to
improvements in market quality during both sub-periods. Bid-ask spreads significantly decline, best
depth and total market depth increase and short-term volatility ease. The magnitudes of the changes in
market quality variables are greater during June 2008. During this period, bid-ask spreads narrow, depth
increase and short-term volatility ease to a greater extent than during normal market conditions. They
conjecture that low latency provide positive externalities more during stressed conditions.
Hagströmer and Nordén (2013) suggest that differences in the type of trading strategies of HFTs have
differential impact on market quality. Liquidity suppliers such as market makers profit from the bid-ask
spread while liquidity demanders such as opportunistic traders pay the differential in prices. Securities
with narrow bid-ask spreads therefore incentivise liquidity consumptions but makes the provision of
liquidity more expensive. The converse holds for securities characterised by wider bid-ask spreads.
Hagströmer and Nordén (2013) shows that on the NASDAQ-OMX Stockholm, market making is
significantly higher in stocks that have wider bid-ask spreads. Carrion (2013) finds analogous results to
that of Hagströmer and Nordén (2013). They find that HFTs engage in more liquidity provision during
periods of low liquidity but consume liquidity during periods of high liquidity. That is, on NASDAQ,
effective spreads are narrower by 0.7 basis points when the low-latency traders consume liquidity but
0.3 basis points wider when the low-latency market traders provide liquidity. Furthermore, liquidity-
demanding and liquidity-supplying traders may have a different impact on bid-ask spreads and market
depth levels (Hendershott, Jones and Menkveld, 2011). They suggest that greater competition among

Page | 33
liquidity providers should improve bid-ask spreads. If liquidity-demanding automated traders, however,
prevail in the market, their trading activities may improve or deteriorate spreads.
Chaboud, Chiquione, Hjalmarsson and Vega (2014), suggest that there is greater correlation between
computer-generated orders than human-initiated orders. The greater degree of correlation between the
market activities of computerised systems may be attributable to their pre-programming. There may be
more common components in their responses to market events among automated traders. Greater
pervasiveness of algorithmic and high frequency trading in financial markets may, therefore, exacerbate
price volatility. Another reason for AT and HFT-induced volatility increases is provided by Boehmer,
Fong and Wu (2012). Prior studies find that the efficiency at which prices are determined in markets
improve due to algorithmic and high frequency trading activities (Brogaard, 2010; Hendershott and
Riordan, 2014; Hasbrouck and Saar, 2013). Boehmer, Fong and Wu (2012) argue that an exacerbation
of volatilities may arise from greater speeds of price adjustment i.e. improved price discovery. They
examine an extensive sample of 40 equity markets over a nine-year period and find that algorithmic
trading are positively correlated to volatility levels. Furthermore, exacerbations in volatility are more
pronounced for stocks that are characterised by small market capitalisation, low price and high volatility.
They find that observed increase in volatility, however, is not derived from improved price discovery.
During extreme market conditions, high frequency traders are found to exacerbate volatility. An
examination of the Flash Crash on May 6 2010 shows that although high frequency traders did not
cause the event, their aggressive trading activities contributed to the volatility in the market that day.
(Kirilenko, Kyle, Samadi, Tuzun, 2011). High frequency traders are found to have aggressively traded
in the price direction of the E-mini index futures contract and therefore amplified variations in prices.
Results provided by Kirilenko, Kyle, Samadi, Tuzun (2011) suggest that during adverse market
conditions, high frequency traders may have a detrimental impact on market volatility.

Page | 34
Conversely, Brogaard (2010), Hagströmer and Nordén (2013) and Hasbrouck and Saar (2013) present
evidence of volatility improvements arising from greater algorithmic and high frequency trading.
Hagströmer and Nordén (2013) examine trading in the 30 large-capitalisation Swedish stocks and finds
that market-making HFTs have a mitigating impact on price volatility. In markets concentrated by
market making-HFTs, an increase in high-speed trading reduces price volatility. Hasbrouck and Saar
(2013) find analogous results on the NASDAQ. Increased low latency activity ease price volatility
during both normal market conditions and volatile market conditions. The decline in price volatility is
greater in magnitude during periods of greater uncertainty and volatility and for small-capitalisation
stocks during this period. Hasbrouck and Saar (2013) suggests that during periods characterised by
greater variation in prices, arbitrage HFT strategies are more profitable. Increased prevalence of
arbitrage activities that trade away price deviations and therefore revert prices back to equilibrium has a
mitigating impact on volatility.
Finally, a line of studies find no evidence of volatility changes attributable to automated or high
frequency trading (Chaboud, Chiquione, Hjalmarsson and Vega, 2014; Brogaard, Hagströmer, Nordén
and Riordan, 2013; Lee, 2013; Frino, Mollica and Webb, 2014). Chaboud, Chiquione, Hjalmarsson and
Vega (2014) find that a more significant proportion of price variations arise from human-initiated orders
as opposed to computer-generated trades. Brogaard, Hagströmer, Nordén and Riordan (2013) show that
the greater willingness and ability of high speed traders to hold inventory are reasons for the resilience
of price volatility from co-location service upgrades. If more inventories are held by a group of traders,
large market orders that consume liquidity can be absorbed without correspondingly large price impacts.
Therefore, the non-permanent component of volatility may be reduced. Furthermore, improvements in
inventory management capacity may also contribute to a decrease in price pressures and thereby also
reduce the non-permanent component of volatility (Hendershott and Menkveld, 2013; Brogaard,
Hagströmer, Nordén and Riordan (2013). Finally, Lee (2013) suggest that in a market characterised by
high liquidity, low latency and low levels of volatility, price volatility is resilient to changes in high

Page | 35
frequency trading levels. More generally, they find that HFTs do not materially impact the quality of
active, liquid markets.
2.3. Cross-listed Securities
The dynamics of related financial bourses have generated much interest among academics (e.g. Garbade
and Silber, 1979; Koontz, Garcia and Hudson, 1990; Board and Sutcliffe, 1996; Domowitz, Glen and
Madhavan, 1998; Pennings and Leuthold, 2001). With the increasing globalisation of financial markets
and the greater efficiency of intermarket information flows, exchanges have become more related.
Given the backdrop of greater interconnectedness across bourses, this section of the literature review
examines cross-listed securities markets. An analysis of the short run price behaviour of cross-listed
assets finds that it is a function of intermarket trading and information flows (Garbade and Silber, 1979).
Information flows and the relative rates of price discovery are pertinent issues in cross-listing studies
(Fleming, Ostdiek and Whaley, 1996; Hauser, Tanchuma and Yaari, 1998; Xu and Fung, 2002; Covrig,
Ding and Low, 2004; Hsieh, 2004) as identical financial instruments listed on multiple exchanges are
driven by the same source of information. Intermarket trading, another determinant of short run price
behaviour, is described in literature as either competing (Domowitz, Glen and Madhavan, 1998;
Chowdhry and Nanda, 1991; Parlour and Seppi, 2003) or mutually beneficial (Lau and McInish, 2002;
Frino, Harris, Lepone and Wong, 2013). If cross-listed exchanges compete for the same order flow, as
theorised by the Order Flow Diversion Hypothesis, the establishment of alternative venues or a
microstructural improvement on one of the financial bourses may potentially cause a migration of
trading interest or a change in intermarket dynamics.
A line of study contends that trading across cross-listed security bourses is competing in nature.
Exchanges that trade the same financial instrument are substitute markets that compete for the same
order flow (Domowitz, Glen and Madhavan, 1998; Chowdhry and Nanda, 1991; Parlour and Seppi,
2003). However, while cross-listed equity index securities are written on the same underlying asset,

Page | 36
they differ by microstructural and regulatory factors and therefore are not perfect substitutes (Board and
Sutcliffe, 1996). The Order Flow Diversion Hypothesis (Domowitz, Glen and Madhavan, 1998)
supports the view that cross-listed financial exchanges are differentiated by market-specific factors and
that a more conducive market structure attracts trading interest at the expense of alternative trading
venues. This suggests that the existence or the establishment of an alternative market places downward
pressure in the demand for that asset on an incumbent exchange. Differences in contract specification
such as delivery month, margin requirements, contract size, trading hours and tick size may be material
in determining the relative demand for trading across cross-listed equity-index futures markets.
Regulatory regimes such as price limits, accessibility to foreigners, trading halts and position limits also
potentially differentiate exchanges that trade cross-listed financial instruments (Board and Sutcliffe,
1996). Finally, the location of financial exchanges potentially affects the level of trading interest. The
greater proximity of home markets to the source of information and local knowledge may influence a
market participant’s trading decision (Webb, Muthuswamy and Segara, 2007).
Differential trading costs across competing markets is found to be a significant determinant of the
relative trading and rates of price discovery that takes place on these exchanges (Roope and Zubruegg,
2002; Chou and Lee, 2002; Hsieh, 2004). According to the Trading Cost Hypothesis (Fleming, Ostdiek
and Whaley, 1996), informed traders gravitate towards markets that are characterised by lower trading
costs to maximise their profits from trading on their information. Consequently, the market with the
more competitive trading cost should reflect information first i.e. lead in price discovery. Furthermore, a
reduction in trading costs on one of the cross-listed security exchanges should change the relative
efficiency at which price is determined across these markets. According to Garbade and Silber (1979),
disparities in price discovery efficiencies give rise to dominant and satellite markets. Price leadership
takes place on the dominant bourse whereas satellite markets depend on dominant markets as a primary
source of information (Garbade and Silber, 1979).

Page | 37
Empirical studies substantiate the hypothesis that trading costs play a determining role in intermarket
competition across cross-listed securities exchanges. Chou and Lee (2002) examine the dominant and
satellite markets of the Taiwan stock index futures and assesses the impact that trading costs have on
these exchanges’ relative rates of price discovery. A 2.5 basis point reduction in transaction tax on the
Taiwan Futures Exchange (TAIFEX) is found to significantly improve the speed at which information is
impounded into prices compared to the Singapore Exchange (SGX). Furthermore, this microstructural
change on the TAIFEX coincides with a substantial increase in trading volume and improvement in
liquidity. Quoted and effective spreads on TAIFEX became significantly smaller than those on SGX.
Hsieh (2004) examines a series of regulatory changes on the TAIFEX to determine its impact on the
relative information efficiencies. Across dominant and satellite markets. Four types of policy changes
are assessed in this study including a shortening of call frequencies, a change in position limits, a
reduction in transaction tax and an extension in trading hours. Anomalous to the findings of Chou and
Lee (2002), trading cost changes is identified as the only policy amendment to affect the relative price
discovery efficiencies across the TAIFEX and SGX.
The degree of stringency in an exchange’s regulatory regime also determines the relative trading that
takes place across competing cross-listed securities markets (Subrahmanyam, 1994; Berkman and
Steenbeek, 1998). Earlier studies examine the role of price limits in determining the flow of trading
interest across satellite and dominant bourses (Subrahmanyam, 1994; Berkman and Steenbeek, 1998).
According to Subrahmanyam (1994), liquidity traders have the discretion to choose when and where to
execute their trades. If the price is close to the price limit and the discretionary trader has the possibility
to switch to a satellite market, he will switch if the cost of not being able to trade is sufficiently high. As
a result, trading volume and volatility migrate from the dominant market to the satellite market when
the price of a security on a dominant market approaches its price limit. Berkman and Steenbeek (1998)
provide empirical evidence to substantiate the model theorised by Subrahmanyam (1994). While
stringent price limits apply for the Nikkei 225 index futures contract traded on the Osaka Stock

Page | 38
Exchange (OSE), a more lenient price limit is imposed for the same contract traded on the Singapore
Mercantile Exchange (SIMEX). The study finds that when the likelihood of reaching the price limit on
the increases, more trading migrates to SIMEX. The migration of order flow to the less stringent
regulatory environment facilitates efficient price formation on the Osaka Stock Exchange (Berkman and
Steenbeek, 1998).
If rivalry for order flow exists between cross-listed securities bourses, as theorised by the Order Flow
Diversion Hypothesis (Domowitz, Glen and Madhavan, 1998), the cross-listing of a financial
instrument may potentially impair the market quality of an incumbent exchange. Domowitz, Glen and
Madhavan (1998) argue that two opposing factors determine the overall impact of listing a security on
multiple bourses i.e. order flow migration and intermarket competition. In transparent exchanges, the
cross-listing of a financial instrument leads to enhanced market quality. As the existence of an
alternative trading venue promotes foreign participation by overseas investors who otherwise would not
trade, there is an upward adjustment in the aggregate number of market participants. Consequently, the
liquidity and precision of public information in both exchanges improve. When intermarket price
information is difficult to obtain, the listing of an asset on multiple bourses causes an outflow of
informative orders from the domestic trading venue. This leads to a deterioration in liquidity and
exacerbates price volatility. In an intermediate case, two opposing changes take place on the domestic
bourse. While bid-ask spreads improve due to greater cross-market competition, the outflow of
informative orders impairs liquidity and exacerbates price volatility (Domowitz, Glen and Madhavan,
1998). They argue that the relative degree of these two opposing effects determines the overall impact
of cross-listing a financial instrument.
Consistent with the idea that the cross-listing of a security causes competition across financial
exchanges are empirical studies that document adverse changes to a market due to the establishment of
competing bourses. Huang and Stoll (1996) find that the development of electronic trading systems in
the early 1990s including ASX, Instinet, Medoff and Posit coincides with a significant widening of bid-

Page | 39
ask spreads on the NYSE and NASDAQ. This empirical finding supports the Spread-sensitive-
uninformed-order-flow hypothesis (Harris, McInish and Wood, 2002). It argues that the development of
alternative trading venues with comparatively competitive trading costs causes a migration of
uninformed order flow by spread sensitive traders. A consequence of lower uninformed order flow is
that the market would then less likely attract information traders (Benveniste and Wilhelm, 1992).
Recently, the establishment of alternative trading venues such as Chi-X and BATS has fragmented
trading in the U.S. and Western Europe. According to a report published by the U.S. Securities and
Exchange Commission, the New York Stock Exchange’s market share of equity trading was
significantly higher in January 2005. Approximately 79.1% of its listed shares’ aggregate trading
volume was transacted on the exchange. By October 2009, the bourse’s market share declined to 25.1%.
While a line of studies describe the relationship between cross-listed securities markets to be competing
in nature (Domowitz, Glen and Madhavan, 1998; Chou and Lee, 2002), an opposing view is that they
are mutually beneficial and that the development of an alternative trading venue has a positive impact
on incumbent markets (Ding, Harris, Lau and McInish, 1999; Covrig, Ding and Low, 2004; Xu and
Fung, 2002). This is evident in the price formation process that takes place across cross-listed security
markets. Information linkages exist across different market centres that trade the same or similar assets
(Fleming, Ostdiek and Whaley, 1996; Hauser, Tanchuma and Yaari, 1998; Xu and Fung, 2002; Covrig,
Ding and Low, 2004; Hsieh, 2004). As cross-listed futures markets are driven by the same fundamentals,
they should be closely related to the common efficient price and co-integrated with a single stochastic
trend (Booth, Lee and Tse, 1996; Hua and Chen, 2007; Chen and Gau, 2009). Studies that examine the
informational linkages across satellite and dominant exchanges find that satellite markets play a
significant role in the price formation process (Ding, Harris, Lau and McInish, 1999; Covrig, Ding and
Low, 2004). The Singapore Exchange is found to contribute to 42% of the futures and 33% of the total
price discovery that takes place across the Tokyo Stock Exchange, the Osaka Stock Exchange and the
Singapore Exchange. This level of contribution to the overall price formation of the Nikkei 225 is

Page | 40
greater than the proportion of their market share (Covrig, Ding and Low, 2004). Furthermore, an
analysis of China-backed stocks dual-listed on financial exchanges located in Hong Kong and New
York finds that there exists significant mutual feedback of information between these markets (Xu and
Fung, 2002). Roope and Zurbruegg (2002) empirically demonstrate that price leadership for the Taiwan
equity index futures market originates in the offshore market.
The existence of multiple trading venues may have a beneficial impact on the volumes of all competing
markets due to the arbitrage trading that takes place across informationally-linked financial instruments.
An analysis of cross-listed futures contracts finds evidence of a mutually beneficial relationship
between the daily turnovers of the off-shore and domestic markets. That is, there exists a significantly
positive relationship between the turnovers of cross-listed Japan, India and Taiwan index futures
contracts (Frino, Harris, Lepone and Wong, 2014). As described in Board and Sutcliffe (1996), cross-
listed equity-index futures contracts that are written on the same market index and have a common
expiration date must have the same value at delivery. Discrepancies in their value at expiration give rise
to spread arbitrage profit opportunities. As the cost of trading futures is substantially lower than the cost
of a basket of shares in the index, prices of cross-listed futures contracts will more likely be kept in line
through spread arbitrage, rather than by trading the underlying. Consequently, multiple listing of a
futures contract could potentially lead to an increase in the volumes of all exchanges due to intermarket
trading (Board and Sutcliffe, 1996). Furthermore, an improvement to the contract specification of a
financial instrument traded on one financial exchange may not necessarily detriment the demand for the
same asset on a competing market but rather promote trading on both bourses.
Microstructural improvements on a competing financial exchange may concurrently improve both
markets due to increased competition (Foucault and Menkveld, 2008). Studies find that the intermarket
competition that arises from the fragmentation of order flow may not necessarily be detrimental to
incumbent markets (Foucault and Menkveld, 2008). Foucault and Menkveld (2008) examine the cross-
listing of Dutch equities arising from the establishment of an alternative trading venue i.e. EuroSETS by

Page | 41
the London Stock Exchange. Prior to the inception of EuroSETS, trading in Dutch equities was
concentrated on the NSC, a limit order bourse operated by Euronext. They find that the market depth of
the consolidated limit order book improves significantly subsequent to the establishment of the entrant
trading venue. Interestingly, the liquidity of the incumbent bourse also increases following the cross-
listing of Dutch equities. The observed improvement in market depth coincides with a reduction in limit
order fees by the NSC following the entrant of the EuroSETS. It suggests that the greater demand of
stocks arising from reduced fees on the incumbent market exceeds the migration of order flow to the
alternative trading venue. Cross listing of securities is, therefore, not necessarily adverse to liquidity
levels of the incumbent exchange, as it promotes intermarket competition and therefore prompts
policymakers to respond accordingly. The findings of Foucault and Menkveld (2008) suggests that
disparities in market microstructure across cross-listed securities bourses is material to intermarket
competition and therefore the relative trading that takes place on these financial exchanges.
Overall, extant literature suggests that the listing of a security across multiple exchanges may be
beneficial or detrimental to the market quality of incumbent bourses. The establishment of an alternative
trading venue could potentially reduce the demand for an asset on an existing bourse (Domowitz, Glen
and Madhavan, 1998). When cross-listed security markets compete for the same order flow and
intermarket price information is difficult to obtain, the development of a trading venue may cause an
outflow of orders on incumbent bourses. This would consequently lead to a deterioration of its market
quality. Alternatively, greater intermarket competition may reduce bid-ask spreads or prompt incumbent
markets to make policy changes to attract order flow (Foucault and Menkveld, 2008). Furthermore, as
identical financial instruments listed on multiple exchanges are driven by the same fundamentals, they
are informationally-linked (Booth, Lee and Tse, 1996; Hua and Chen, 2007; Chen and Gau, 2009).
Arbitrage profit opportunities exist when prices deviate from their relative values (Board and Sutcliffe,
1996). Consequently, the multiple listing of an asset may positively impact the market quality of all
exchanges due to cross-border trading activities (Board and Sutcliffe, 1996). This thesis examines the

Page | 42
role of microstructural improvements, namely the introduction of co-location services, on the
relationship between cross-listed equity-index futures markets.
2.4. Hypothesis Development
This section uses the literature reviewed in earlier sections of this chapter to develop several hypotheses
that are tested in this dissertation. Policymakers introduce co-location facilities to attract HFT orders in
the market by reducing the distance and therefore the time it takes for orders to reach financial bourses.
Previous studies find that the implementation of co-location facilities have a positive impact on HFT
levels on futures markets (Frino, Mollica and Webb, 2014) and equity markets (Boehmer, Fong and Wu,
2012). If the Singapore’s equity-index futures market is conducive to low latency trading, an
introduction of co-location services should lead to greater HFT demand. This leads to the first
hypothesis:
H1: High frequency trading levels increase when co-location services are introduced.
The general agreement in empirical literature is that increased HFT participation in financial exchanges
narrow bid-ask spreads (Brogaard, 2010; Hendershott, Jones and Menkveld, 2011; Riordan and
Storkenmaier, 2012; Hasbrouck and Saar, 2013). Hendershott, Jones and Menkveld (2011) hypothesis
that liquidity-demanding and liquidity-supplying traders have a disparate impact on spreads. The greater
competition among liquidity providers should lead to an improvement in spreads. When liquidity-
demanding algorithmic traders, however, prevail in the market, their trading activities may narrow or
widen spreads. If the implementation of co-location services on SGX gives rise to an inflow of HFT
orders and the high frequency traders on this bourse are predominately liquidity-suppliers, bid-ask
spreads should narrow significantly.

Page | 43
H2; Bid-ask spreads narrow when co-location services are introduced.
Existing literature document improvements in market depth arising from changes in the availability of
latency speed. Following the introduction of co-location services (Frino, Mollica and Webb, 2014;
Boehmer, Fong and Wu, 2012) and structural upgrades to faster trading speeds (Brogaard, Hagströmer,
Nordén and Riordan, 2013), market depth is found to improve. Considering existing literature, the
following hypotheses are tested for Singapore’s equity-index futures contracts:
H3: Best depth improves when co-location services are introduced.
H4: Total depth improves when co-location services are introduced.
A financial exchange with low trading costs and fragmented order flow should attract greater HFT
activity subsequent to the implementation of co-location facilities. High frequency trading strategies are
often characterised by frequent submission, amendments and cancellations of orders (Aldridge, 2009;
Brogaard, 2010). If a large proportion of the order submissions are either amended or cancelled prior to
transaction, heightened HFT activity attributable to the introduction of co-location services does not
necessarily lead to greater trading activity. The following hypothesis is tested by assessing the variables:
transactions, trading volume and open interest.
H5: Trading activity remains unchanged when co-location services are introduced.
Singapore’s equity-index futures markets are informationally-linked to other equity, futures and options
exchanges if they are driven by the same source of information. This gives rise to arbitrage profits when
prices deviate from fundamental values or statistical intermarket relationships. As Hasbrouck and Saar
(2013) explains increased prevalence of arbitrage activities that trade away price deviations and
therefore revert prices back to equilibrium has a mitigating impact on price volatility. If the availability
of lower latency speeds on Singapore’s stock index futures exchange promotes arbitrage trading, then

Page | 44
the introduction of co-location services should reduce market volatility. This rationale gives rise to the
following hypothesis:
H6: Price volatility decreases when co-location services are introduced.
Whether cross-listed financial exchanges compete for order flow or are mutually beneficially is debated
in extant literature (e.g. Board and Sutcliffe, 1996; Fleming, Ostdiek and Whaley, 1996; Domowitz,
Glen and Madhavan, 1998). If Singapore’s equity-index futures bourses and its respective home bourses
are of a competing nature, a migration of HFT order flows from the dominant to the satellite market
may take place following the infrastructural improvement on SGX. However, if significant cross-border
HFT activity takes place, correlated changes in high frequency trading levels across financial markets
may take place. To determine the nature of intermarket trading dynamics in the context of high
frequency trading and cross-listed securities exchanges, the following hypothesis is tested:
H7: HFT order flow migrates from the dominant market to the satellite market when co-location services are introduced on the satellite market.

Page | 45
3. INSTITUTIONAL DETAILS
On 18 April 2011, the Singapore Exchange introduced co-location facilities to its equities and
derivatives markets.13 This infrastructural development allows latency-sensitive market participants to
situate their trading systems in the same data centre as the exchange’s trading, market data and clearing
engines. The central trading engine of SGX’s derivatives market is the Quotation and Execution System
for the Trading of the Derivatives Market (QUEST-DT). An order message submitted to the exchange
travels from a trading participant’s order management system (OMS) to a QUEST-DT network gateway
and finally onto the central trading system, QUEST-DT. The physical proximity of OMS to both
QUEST-DT and real-time market data, improves a trader’s speed of access and therefore reduces the
time it takes for co-located market participants to trade and execute trading decisions.
Prior to the introduction of co-location services, traders had the option of connecting to the exchange
via an approved network service provider or directly through SGX’s managed network service.14
Network service providers are third parties who have existing connections to QUEST-DT and that sell
their network access to traders. Proximity hosting, a type of network service, allows market participants
to place their trading systems in facilities located near exchanges and operated by third parties. The
proximity hosting facility for SGX is managed by Singapore’s telecommunications conglomerate,
Singtel. Alternatively, market participants have the option to connect directly via leased lines. For this
method of access, subscribers purchase bandwidth ranging from 512 Kbps to 6 Mbps and their network
connections are managed by the exchange.
The decrease in the distance between traders’ servers and both the exchange’s central matching engine
and real-time data feeds improves the round-trip network latency of trades i.e. the time it takes for
information to travel from OMS to QUEST-DT and back. As Frino, Mollica and Webb (2014) suggest
13 The adoption of co‐location facilities is part of a $250 million initiative that was put into effect by the Singapore exchange to improve the speed of market accessibility. The opening of a new data centre and the implementation of a new trading engine for its equities market which took place on 11 April 2011 and 15 August 2011, respectively, were the other two microstructure changes that made up this initiative. 14 These services are still available for non‐colocated market participants.

Page | 46
latency is a function of three factors: the distance between a broker’s office and the exchange, the
quality of the infrastructure in which a broker is located in and the quality of the infrastructure provided
by the telecommunications supplier. Brokers who connect through leased lines and SGX’s proximity
hosting service incur a round-trip network latency of 6,000 to 13,000µs and 800 to 1,250µs,
respectively.15 The introduction of co-location services substantially improved this to less than 100µs.
The price of hiring rack space in the exchange's data centre, inclusive of power supply, ranges from
S$ 4,500 per month. All co-located members are provided with 4KVA of power supply per rack.
Furthermore, market participants that trade on Singapore’s derivatives market are subjected to a clearing
fee, a trading access fee and a GST tax. The clearing fee and the access trading fee amount to 0.04%
and 0.0075% of the traded contract’s value, respectively.16 A GST of 7% is charged on clearing fees,
trading access fees and any brokerage fees incurred.
The Singapore Exchange's derivatives market is an order driven market and operates under a continuous
auction system during regular trading hours. It provides a trading platform for the exchange-listed
products: equity index futures and options, interest rate futures and options, foreign-exchange futures,
commodities futures and a dividend index futures contract. For Singapore’s equity-index futures market,
trading takes place during the day (T session) and during the evening (T+1 session). A pre-opening
period and a pre-closing period are held prior to and following each trading session, respectively.
During these periods, orders can be submitted, amended and cancelled but are not matched. A non-
cancel phase concludes both periods during which orders are matched at a single price.17
15 Round‐trip latency refers to the total time it takes for information to be transmitted from OMS to QUEST‐DT and back. 16 There is a cap of S$200 for clearing fees. 17 For further institutional details of SGX’s equity‐index futures market, refer to Table 4‐1.

Page | 47
4. DATA AND RESEARCH DESIGN
4.1. Data
To assess the impact that co-location services have on Singapore’s futures market, intraday tick data
time-stamped in milliseconds is analysed. This dataset is sourced from Thomson Reuters and provides
trade and order book information for each of the contracts examined. Specifically, it contains the price
and volume of every transaction and the bid price, bid volume, ask price and ask volume for the ten best
price levels. These variables are used to compute trading activity, high frequency trading and liquidity
metrics (refer to Section 6 for further information). Daily open interest data, which provides information
on the quantity of futures contracts that remain unsettled from the previous trading session, is also
retrieved from Thomson Reuters and used in the analysis.
A sample period extending from 18 October 2010 to 17 October 2011 is studied, which coincides with a
six-month event window around the implementation of co-location services. As financial institutions
may not have made the transition to the new facility immediately following its launch, a one-year
sample period is also analysed. The sample is restricted to trades in the nearest to maturity contracts and
that occur during the day session. This excludes trades that take place during the pre-opening and pre-
closing periods. To preclude maturity effects from confounding the analysis, expiration day
observations are omitted from the sample.18
This thesis compares the behaviour of HFT activity and market quality around the introduction of co-
location services for the four most liquid equity-index futures traded on Singapore’s derivatives market
(SGX). The Singapore Exchange’s Nikkei 225 Index Futures, MSCI Taiwan Index Futures, CNX Nifty
Index Futures and the FTSE China A50 Index Futures are examined in this research. For the purpose of
assessing how satellite markets respond to infrastructure improvements differently from home markets,
18 Expiration day effects of Singapore’s stock index futures contracts are documented in literature (Chung and Hseu, 2008; Hsieh and Ma, 2009).

Page | 48
the domestic stock index futures i.e. the MSCI Singapore Index Futures is also included in the study.19
Table 4-1 documents the market structure and contract specifications of the five treatment contracts.
For robustness, data for the Nikkei 225 Index Futures listed on the Osaka Stock Exchange (OSE), the
Taiwan Stock Index listed on the Taiwan Futures Exchange (TAIFEX), the CNX Nifty Index listed on
the National Stock Exchange of India (NSE) and the China Shanghai Shenzhen 300 Stock Index listed
on the China Financial Futures Exchange (CFFEX), are collected. These futures constitute the control
sample as they are written on the same or similar assets as the treatment sample but co-location facilities
were not introduced on 18 April 2011 in the financial markets of these contracts. They provide an
indication of the market quality and HFT intensity in bourses with no infrastructure changes at the time
Singapore introduced their co-location facilities.20 While three of the four control contracts expire
during both serial and quarterly months, the Nikkei 225 (OSE) trade only on a quarterly cycle. The
contract months of the Nikkei 225 (SGX), however, are both serial and quarterly. Preliminary analysis
of the Nikkei (SGX) shows that trading activity in contracts that expire during the non-quarterly months
is very thin. Therefore, these contracts are omitted from the treatment sample. Table 4-2 documents the
market structure and contract specifications of the four control contracts.
19 The MSCI Singapore Index Futures (SiMSCI) is one of two domestic stock index futures traded on the Singapore Exchange. The other futures contract i.e. the Straits Times Index Futures is thinly traded. 20 During the period of analysis, co‐location facilities were available on the Osaka Stock Exchange and the National Stock Exchange of India. It was not available on the Taiwan Futures Exchange or the China Financial Futures Exchange.

Page | 49
Table 4-1 Market Structure and Contract Specifications of SGX Futures Contracts
This table reports the market structure and contract specifications of the Nikkei 225 Index Futures, MSCI Taiwan Index Futures, CNX Nifty Index Futures and the FTSE China A50 Index Futures traded on the Singapore Exchange. For each contract, the underlying stock index, multiplier, minimum price fluctuation, contract months, trading hours, price limits, settlement procedure, position limit and trading costs are provided.
Exchange Singapore Exchange Singapore Exchange Singapore Exchange Singapore Exchange Singapore Exchange
Underlying Stock Index Nikkei 225 Index MSCI Taiwan IndexSM CNX Nifty Index FTSE China A50 Index MSCI Singapore Free IndexSM
Multiplier ¥500 US$100 US$2 US$1 S$200
Minimum Price Outright: 5 index points (¥2500) 0.1 index points (US$10) 0.5 index point (US$1) 5 index point (US$5) 0.1 index point (S$20)
Fluctuation Strategy Trades: 1 index point (¥500)
Contract Months 6 nearest serial months 2 nearest serial months 2 nearest serial months 2 nearest serial months 2 nearest serial months
20 nearest quarterly months 12 nearest quarterly months 4 nearest quarterly months 4 nearest quarterly months 4 nearest quarterly months
Trading Hours T Session: T Session: T Session: T Session: T Session:
Pre -Opening 07.30-07.43 Pre -Opening 08.30-08.43 Pre –Opening 08:45-08:58 Pre -Opening 08:45-08:58 Pre –Opening 08:15-08:28
Non -Cancel Period 07:43-07:45 Non -Cancel Period 08:43-08:45 Non -Cancel Period 08:58-09:00 Non -Cancel Period 08:58-09:00 Non -Cancel Period 08:28-08:30
Opening 07:45-14:25 Opening 08:45-13:45 Opening 09:00-18:10 Opening 09:00-15:55 Opening 08:30-17:10
Pre-Closing 14:25-14:29 Pre-Closing 13:45-13:49 Pre-Closing 18:10-18:14 Pre-Closing 15:55-15:59 Pre-Closing 17:10-17:14
Non-Cancel Period 14: 29-14:30 Non -Cancel Period 13:49-13:50 Non -Cancel Period 18:14-18:15 Non -Cancel Period 15:59-16:00 Non -Cancel Period 17:14-17:15
T+1 Session: T+1 Session: T+1 Session: T+1 Session: T+1 Session:
Pre –Opening 15:00-15:13 Pre -Opening 14:20-14:33 Pre –Opening 19:00-19:13 Pre -Opening 16:30-16:38 Pre -Opening 18:00–18:13
Non -Cancel Period 15:13-15:15 Non -Cancel Period 14:33-14:35 Non -Cancel Period 19:13-19:15 Non -Cancel Period 16:38-16:40 Non -Cancel Period 18:13–18:15
Opening 15:15-02:00 Opening 14:35-02:00 Opening 19:15-02:00 Opening 16:40-02:00 Opening 18:15-02:00
Pre-Closing N.A. Pre-Closing N.A. Pre-Closing NA Pre-Closing N.A. Pre-Closing N.A.
Non-Cancel Period N.A. Non -Cancel Period N.A. Non -Cancel Period NA Non -Cancel Period N.A. Non -Cancel Period N.A.
Price Limits Below 7,000 pts:* Initial 7% Initial 10% Initial 10% Final 15%
Initial 1,000 points Intermediate 10% Intermediate 15% Final 15%
Intermediate 1,500 points Final 15% Final 20%
Final 2,000 points
7,000 pts to below 10,000 pts
Initial N.A.
Intermediate 1,500 points
Final 2,000 points
10,000 pts and above:
Initial N.A.
Intermediate N.A.
Final /-2,000 points
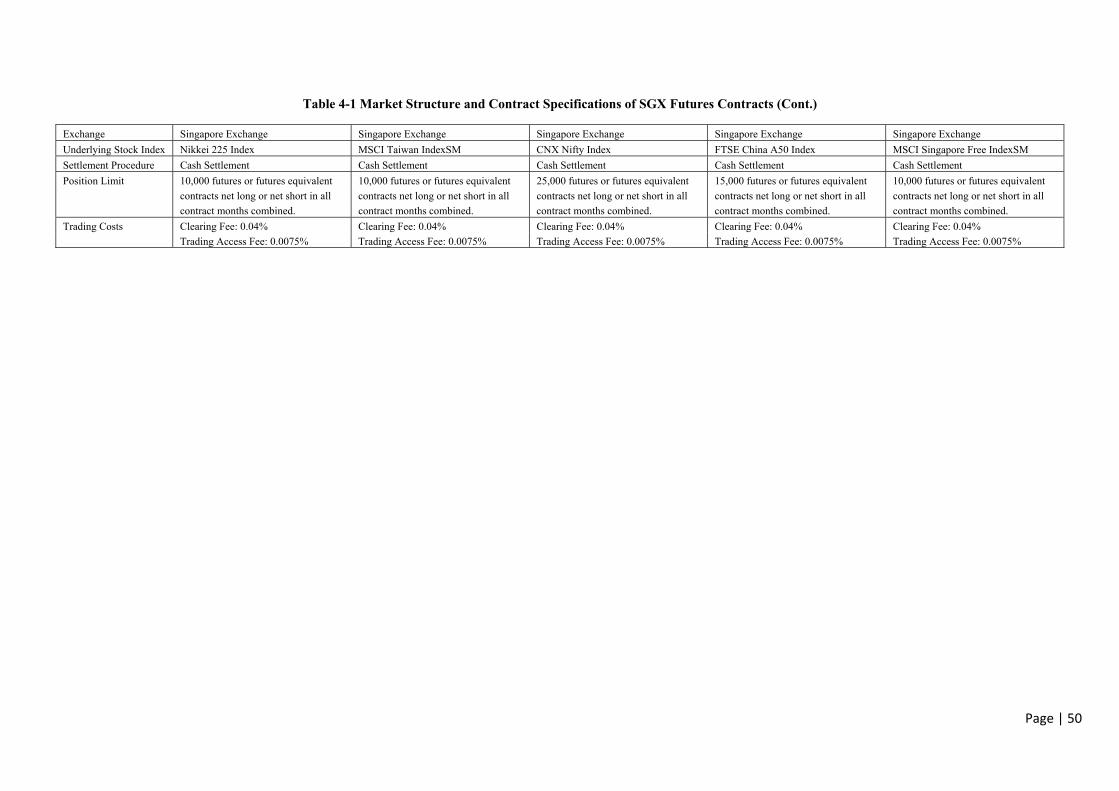
Page | 50
Table 4-1 Market Structure and Contract Specifications of SGX Futures Contracts (Cont.)
Exchange Singapore Exchange Singapore Exchange Singapore Exchange Singapore Exchange Singapore Exchange
Underlying Stock Index Nikkei 225 Index MSCI Taiwan IndexSM CNX Nifty Index FTSE China A50 Index MSCI Singapore Free IndexSM
Settlement Procedure Cash Settlement Cash Settlement Cash Settlement Cash Settlement Cash Settlement
Position Limit 10,000 futures or futures equivalent 10,000 futures or futures equivalent 25,000 futures or futures equivalent 15,000 futures or futures equivalent 10,000 futures or futures equivalent
contracts net long or net short in all contracts net long or net short in all contracts net long or net short in all contracts net long or net short in all contracts net long or net short in all
contract months combined. contract months combined. contract months combined. contract months combined. contract months combined.
Trading Costs Clearing Fee: 0.04% Clearing Fee: 0.04% Clearing Fee: 0.04% Clearing Fee: 0.04% Clearing Fee: 0.04%
Trading Access Fee: 0.0075% Trading Access Fee: 0.0075% Trading Access Fee: 0.0075% Trading Access Fee: 0.0075% Trading Access Fee: 0.0075%

Page | 51
Table 4-2 Market Structure and Contract Specifications of Control Futures Contracts
This table reports the market structure and contract specifications of the Nikkei 225 Index Futures listed on the Osaka Stock Exchange, Taiwan Stock Index listed on the Taiwan Futures Exchange, CNX Nifty listed on the National Stock Exchange of India and the China Shanghai Shenzhen 300 Stock Index listed on the China Financial Futures Exchange. For each contract, the underlying stock index, multiplier, minimum price fluctuation, contract months, trading hours, price limits, settlement procedure, position limit and trading costs are provided.
Exchange Osaka Stock Exchange Taiwan Futures Exchange National Stock Exchange of India China Financial Futures Exchange
Underlying Stock Index Nikkei 225 Index TAIEX Index CNX Nifty Index CSI 300 Index
Multiplier ¥1000 NT$200 Re. 1 CNY 300
Min Price Fluctuation 0.01 index points (¥10) 1 index point (NT$200) 0.5 index point (Rs.0.05) 0.2 index point (CNY 60)
Contract Months Jun and Dec: 10 nearest contract months 2 nearest serial months 3 nearest serial months 2 nearest serial months
Mar and Sep: 3 nearest contract months 3 nearest quarterly months 2 nearest quarterly months
Trading Hours Day Session: Regular Trading Days: Regular Trading Days: Regular Trading Days:
Pre -Opening 08:00-09:00 Trading Hours 08:45-13:45 Normal Market 09:15-15:30 First Session 09:15-11:30
Opening Auction 9:00 Setup Cutoff Time 16:15 Second Session 13:00-15:15
Regular Session 09:00-15:10 Trade Modification 16:15
Pre-Closing 15:10-15:15
Closing Auction 15:15
Night Session:
Pre -Opening 16:15-16:30
Opening Auction 16:30
Regular Session 16:30-02:55
Pre-Closing 02:55-03:00
Closing Auction 3:00
Price Limits Normal 8% Daily Price limit 7% Daily Price limit 10% Daily Price limit 10%
1st Expansion 12%
2nd Expansion 16%
Settlement Procedure Cash Settlement Cash Settlement Cash Settlement Cash Settlement
Position Limit N.A. Individual: 5000 Higher of Rs.500 crores or 15% of the Unilater position limit: 100 Lots
Institution: 10000 total open interest
Proprietary Trader: 30000
Trading Costs Clearing Fee (Proprietary): ¥20 Transaction Fee: NT$12 Transactions Tax: 0.01% (SELL only) Trading Fee: CNY 30
Clearing Fee (Customer): ¥20 Clearing Fee: NT$8 Transaction Charges: 0.00185%
Trading Fee (Proprietary): ¥70 Settlement Fee: NT$8 SEBI Turnover Charges : 0.0001%
Trading Fee (Customer): ¥110 Futures Transaction Tax: 0.002% Stamp Duty: 0.002%

Page | 52
4.2. Variable Measurements
4.2.1. Measures of High Frequency Trading Activity
This dissertation compares the behaviour of high frequency trading activity and market quality around
the commencement of co-location services on the Singapore Exchange. Firstly, three measures of high
frequency trading are employed to examine changes in its prevalence around this structural
improvement. Messages per minute, order to trade ratio and algo trade (Hendershott, Jones and
Menkveld, 2011) are used to quantify the level of high frequency trading (HFT) intensity in the control
and treatment samples. As the dataset does not contain proprietary information, it is not feasible to
directly observe HFT transactions or differentiate them from non-HFT transactions. The above proxies
are therefore used to infer HFT activity.
Messages per minute refers to the aggregate number of new order submissions, modifications and order
cancellations taken place over a one-minute time interval. In the market depth data retrieved from
Thomson Reuters, each line denotes a new order or the revision of an existing order and therefore
represents message traffic. Messages per minutes for contract i is calculated as the total number of
message traffic on day t divided by the number of one-minute intervals during that trading day.
. ( 1 )
Order to trade ratio measures the quoting intensity of a financial market and is computed as the
aggregate number of messages for contract i on day t divided by the total number of trades executed
over that trading day. High frequency trading strategies are often characterised by frequent submission,
amendments and cancellations of limit orders (Aldridge, 2009; Brogaard; 2010). Therefore, an increase
in order to trade ratios may be indicative of greater HFT activity.
. ( 2 )

Page | 53
Algo trade, which was first introduced by Hendershott, Jones and Menkveld (2011), quantifies market
wide algorithmic trading activity (AT) by standardising electronic message traffic by trading volume.
As it is standardised by the quantity of futures contracts traded during a given period, changes in algo
trade reflect changes in the submission and cancellations of limit orders. This proxy for AT therefore
largely captures algorithmic liquidity supply (Hendershott, Jones and Menkveld, 2011). In this
dissertation, algo trade is calculated as the negative of the trading volume for contract i on day t divided
by the aggregate number of messages transmitted over that trading day.
) ( 3 )
4.2.2. Measures of Market Quality
Various measures of market quality are analysed to assess changes in the behaviour of liquidity, trading
activity and price volatility around the implementation of co-location facilities. To assess changes in
market liquidity, proportional spreads, tick spreads, time-weighted spreads, best depth and total depth of
each treatment contract is benchmarked against its respective control contract. The proportional bid-ask
spread is computed as the difference between the ask price and the bid price divided by the midpoint
price.21 The midpoint price is the average of the ask price and the bid price. Daily proportional spread
for contract i on day t is calculated as the average of all proportional spreads j prevailing during that day
session.
∑ , , , ,
. , , , ,, , / ( 4 )
Tick spread refers to the bid-ask spread of a security as a proportion of its minimum price increment. It
is calculated as the difference between the ask price and the bid price divided by the minimum tick size
of the contract examined. For details on the tick size and tick value of each stock index futures contract
in the treatment sample and the control sample, refer to Table 4-1 and 4-2, respectively. Daily tick
21 Bid price and ask price refer to the best prevailing bid price and the best prevailing ask price, respectively.

Page | 54
spread for contract i on trading day t is computed as the average of all tick spreads j prevailing during
that day session.
∑ , , , ,
, , / ( 5 )
The final measure of quoted bid-ask spread employed in this study is the time-weighted spread
(McInish and Wood, 1992). This measure weights each proportional bid-ask spread h of the contract
analysed by the percentage of time it remains prevailing in the order book. It is calculated over one-
minute intervals and the weighting of each quote revision is computed as the percentage of time it
remains ‘alive’ during its respective interval. Daily time-weighted spread for contract i on day t is
calculated as the average of all one-minute spreads prevailing j during that trading day.
∑ , ,, , / ( 6 )
, , ∑ , , , , , ,
, , , ( 7 )
The other dimension of liquidity that is assessed in this study is quoted depth. It reflects the ability of a
financial market to sustain sizeable market orders without substantially impacting the security’s price.
In this study, best depth and total depth are used to quantify the degree of depth in the market. Best
depth is measured as the aggregate number of contracts available at the best prevailing bid price and the
best prevailing ask price. Using tick market data, daily best depth for contract i on day t is computed as
the average of all observations j over that trading day.
∑ , ,, , , , / ( 8 )
Total visible depth refers to the aggregate number of contracts available in the limit order book on both
the bid and ask sides. The tick dataset utilised in this study contains market depth information for the
ten best price levels. Therefore, the measure of total depth includes the volume at the ten best prevailing
Page | 55
bid prices and the ten best prevailing ask prices. Daily total depth for contract i on day t is computed as
the average of all observations j over the day session.
∑ , , / ( 9 )
To examine changes in trading activity around the commencement of co-location services, the average
daily number of trades, the average daily trading volume, the average daily trade size and open interest
are compared before and after the event. While the daily number of trades for contract i on day t
measures the average frequency of transactions, the daily trading volume for contract i on day t
measures the average number of contracts transacted during that trading day.
Average trade size is the average dollar value of each transaction that takes place during a particular
trading session.22 It is calculated as the aggregate daily trading value for contract i on day t divided by
the total number of trades transacted over that day session. The traded value of a transaction j is
calculated as the price of the transaction j multiplied by both the quantity of the transaction j and the
multiplier of the contract i. For details on the multiplier of each equity index futures contract in the
treatment sample and the control sample, refer to Table 4-1 and 4-2, respectively.
. ( 1 0 )
∑ , , , , , , ( 1 1 )
Open interest refers to the quantity of outstanding futures contracts that were not executed or did not
expire during the previous session of trading. It provides an indication of the level of trading intensity in
the futures market. Daily open interest data for each of the contracts in the treatment and control
samples is obtained from Thomson Reuters.
22 The Nikkei 225 (SGX) and (OSE) are denominated in yen, the CNX Nifty is denominated reminbi in and the CSI 300 Index is denominated in yuan. Refer to Table 4‐1 and Table 4‐2 for further details.

Page | 56
Finally, to study the impact that the introduction of co-location services have on the volatility of satellite
markets, the behaviour of price volatility around its implementation is assessed. Price volatility for
contract i on day t is measured as the natural log of the highest traded price divided by the lowest traded
price during that trading day (Parkinson, 1980).
ln
( 1 2 )
4.3. Univariate and Multivariate Analysis
4.3.1. Univariate Analysis
Changes in the pervasiveness of HFT activity and the level of market quality are statistically tested
using the daily measures described in 4.2.1 and 4.2.2. Firstly, the data is partitioned into two sub-
periods: the pre-event period and the post-event period. The pre-event period extends from 18 October
2010 to 17 April 2011 and the post-event period extends from 18 April 2011 to 17 October 2011. For
every equity-index futures contract included in the analysis, each daily measure of HFT activity and
market liquidity are averaged over their respective sub-periods. Subsequently, a two-sample t-test is
conducted for each daily measure to assess whether the means are statistically different between the
sub-periods. The futures contract in both the treatment group and the control group are examined.
Paired t tests are conducted to evaluate the relative market behaviour of the treatment sample relative to
the control sample around the implementation of co-location services. The daily HFT and market
quality variables for each treatment contract is normalised by that of its respective control contract. 23
An analysis of the daily ratios find that the normality assumption is not met for all metrics examined.
Therefore, the natural logarithm of each daily ratio is calculated.24
( 1 3 )
23 The paired t‐test is not performed for the MSCI Singapore Free Index (SiMSCI) as it does not have a control contract. 24 The absolute value of each daily algo trade ratio is computed before the natural logarithm is applied.

Page | 57
( 1 4 )
For every HFT and market quality measure, the daily log ratio is averaged across their respective sub-
period. A two-sample t-test is then conducted to assess whether the difference in the two means are
significantly different from zero. The purpose of the paired t-test is to identify changes in the relative
market behaviour from the pre-event period to the post-event period. By doing so, market-wide factors
that affect both sub-samples are controlled for.25
4.3.2. Multivariate Analysis of High Frequency Trading
Multivariate analysis of high frequency trading activity (HFT) is conducted to control for the variables
additional to the introduction of co-location services that explain variations in the level of HFT activity
in a financial market. A system of regression models is estimated to control for the explanatory
variables that have been identified to have a material impact on HFT intensity. In doing so, the effect of
the exchange’s infrastructure improvement is isolated from extraneous influences. The first set of
regression models control for the contract-specific factors price volatility and open interest (Frino,
Webb and Mollica, 2014).
Studies find that a security’s price volatility affects its level of high frequency trading activity (Brogaard,
2010; Zhang, 2010; Kirilenko, Kyle, Samadi and Tuzun, 2011). Zhang (2010) empirically demonstrates
that high frequency trading is positively correlated with stock price volatility. Conversely, Brogaard
(2010) finds that HFT levels on the US equities market moderately decline when volatility increases. To
preclude variations in HFT activity due to changes in price volatility from confounding the analysis, this
variable is controlled for.
Hagströmer and Nordén (2013) find that market makers, a type of HFT trader, are more prevalent in
stocks that are characterised by high trading activity. Brogaard (2010), on the other hand, provide
25 The market for a cross‐listed equity‐index futures contract includes both the home market and the satellite markets.

Page | 58
empirical evidence to support that HFTs prefer to enter the market during periods of low trading activity
on the US equities market. Changes in trading activity, therefore, are shown to have a material impact
on HFT levels (Brogaard, 2010). Consequently, analogous to Frino, Mollica and Webb (2014), open
interest is employed in the analysis as a control. In the futures market, open interest is indicative of the
market’s trading activity and liquidity (Wang, Yau and Baptiste, 1997).
The following regression models are estimated for each treatment contract:
, , , ,
, ( 1 5 )
, , , ,
, ( 1 6 )
, , , , , ( 1 7 )
The dependent variables of the first set for the multivariate HFT analysis are Messages per Minuteit,
Ln(Order to Trade)it and Algo Tradeit.26 Analyses of order-to-trade ratios show that the data exhibits
right skewness for selected contracts and therefore this variable is logarithmically transformed. These
dependent variables are regressed on following three independent variables. Colocationit is a dummy
variable which equals 1 if the observation takes place during the pre-event period, and 0 otherwise.
Open Interestit refers to the quantity of futures contracts that have not been settled during the previous
session of trading. Price Volatilityit is the natural logarithm of the ratio highest traded price of the day
session to the lowest traded price. The three equations are estimated individually for the Nikkei 225
Index, MSCI Taiwan Index, CNX Nifty Index, FTSE China A50 Index and the MSCI Singapore Index
futures contracts listed on the Singapore Exchange.
Arbitrage, a type of high frequency trading strategy, attempts to capitalise on price discrepancies across
financial instruments and markets. As the treatment contract and its respective control contract are
written on the same or similar underlying stock index, arbitrage opportunities arise when there are
prices differ across locations (Brennan and Schwartz, 1990). In this case, a market participant may
26 Refer to Sections 4.2.1 and 4.2.2 for further details on these HFT proxies.

Page | 59
choose to enter both markets. Therefore, HFT activity on the home market may explain variations in the
HFT activity on the satellite market. Furthermore, as both markets compete for order flow (Covrig,
Ding and Low, 2004), changes in the HFT activity of one exchange may affect that of the other
exchange. Consequently, the level of high frequency trading on the home market is controlled for in the
analysis.
The following regression models are estimated for each treatment contract:
, , ,
, (18)
, , ,
, (19)
, , , , (20)
The response variables for the second set of regression models are analogous to the first set and are
detailed in section 4.2.1. Each dependent variable is regressed on the co-location dummy variable,
which is explained above, and its respective control market variable. Control Messages per Minutei,t
refers to the control market’s daily average number of messages per minutes, Ln (Control Order to
Trade)i,t, measures the natural logarithm of the control market’s daily average order-to-trade ratio and
Algo Tradei,t quantifies the control market’s daily average number of normalised messages. 27
The Singapore Exchange’s equity-index futures market are informationally-linked to other bourses that
trade the same or similar stock index futures contracts, as they are driven by the same fundamentals
(Covrig, Ding and Low, 2004; Hsieh, 2004). As international linkages exist across these markets, the
volatility and the trading activity of home markets are related to that of its satellite market (Booth, Lee
and Tse, 1996; Fung, Leung and Xu, 2001; Chng, 2004). Consequently, variations in the price volatility
and trading activity of the control contract may explain that of the treatment contract which, in turn,
27 The Nikkei 225 Index Futures traded on the Osaka Stock Exchange is the control contract for the Nikkei 225 Index Futures (SGX). The Taiwan Stock Index Futures traded on the Taiwan Futures Exchange is the control contract for the MSCI Taiwan Index Futures (SGX). The CNX Nifty Index Futures traded on the National Stock Exchange of India is the control contract for the CNX Nifty Index Futures (SGX). The China Shanghai Shenzhen 300 Stock Index Futures traded on the China Financial Futures Exchange is the control contract for the FTSE China A50 Index Futures (SGX).

Page | 60
explains the variations in its HFT level. Therefore, the home market’s open interest and price volatility
are controlled for in the following regression models of the multivariate analysis.
, , , ,
, , , ( 2 1 )
, , , ,
, , , ( 2 2 )
, , , ,
, , , ( 2 3 )
The dependent variables of the final set for the multivariate HFT analysis are analogous to the previous
sets. The explanatory variables for each multiple regression model in this set are the price volatility and
open interest of both the treatment and its respective control contract and a colocation dummy variable.
Control Open Interesti,t refers to the number of outstanding futures contracts on the control market and
Control Price Volatilityi,t measures the price volatility of the control contract. The remaining variables
in this analysis are explained in the above sections.
For each multiple regression model that examines the Nikkei 225 Index Futures, a dummy variable
Earthquakei,t is included in the analysis. This variable equals 1 if the observation takes place before the
Tōhoku Earthquake on 11 March 2011, and 0 otherwise.28 This natural disaster had a material impact on
the high frequency trading activity of Singapore’s Nikkei 225 market and therefore it is controlled for in
the multivariate analysis.
4.3.3.Multivariate Analysis of Liquidity
According to Copeland and Galai (1983), liquidity providers set a bid-ask spread that trade-offs inflows
expected to be gained from liquidity-motivated market participants and outflows expected to be lost to
informed traders.29 They theorise that the bid-ask spread of a security is positively related to its price
volatility and negatively related to its trading volume. Price volatility quantifies the risk borne by
market makers per unit of time. Consequently, during periods of greater volatility, they demand greater 28 On 11 March 2011, an earthquake of magnitude 9.0 struck Tōhoku in Japan. Analysis of this event shows that it had a significant impact on the high frequency trading activity and market quality of both Singapore’s Nikkei 225 and Japan’s Nikkei 225 futures markets. 29 Other theoretical models of bid‐ask spreads are described in Demsetz (1968) and Stoll (1978).

Page | 61
compensation in the form of wider bid-ask spreads. As volatility and trading activity are determinants of
liquidity, (Demsetz, 1968; Copeland and Galai, 19830) and to isolate the impact of co-location facilities
on liquidity, these variables are controlled for. Analogous to Frino, Mollica and Webb (2014), open
interest is employed to control for trading activity in this multivariate analysis of the futures market.
The following regression models are estimated for each treatment contract:
, , ,
, ( 2 4 )
, , ,
, ( 2 5 )
, , ,
, ( 2 6 )
, , , ( 2 7 )
, , , ( 2 8 )
The dependent variables of the first set of regression models for the multivariate liquidity analysis
include three measures of bid-ask spreads and two measures of market depth. Ln (Prop Spread)it
denotes the natural logarithm of the daily average proportional spread, Ln (Tick Spread)it denotes the
natural logarithm of the daily average tick spread and Ln (TW Spread)it denotes the natural logarithm of
the daily average time-weighted spread. To correct for the right skewness present in the bid-ask spreads
of selected contracts, all three measures are logarithmically transformed. Best Depthit refers to the daily
average number of contracts available at the best bid and ask prices and Total Depthit the daily average
number of contracts available in the visible limit order book. These response variables are regressed on
the explanatory variables Colocationit, Open Interestit and Price Volatilityit.30
The above regression
models are estimated individually for the Singapore Exchange’s Nikkei 225 Index, MSCI Taiwan Index,
CNX Nifty Index, MSCI Singapore Index and the FTSE China A50 Index futures contracts.
Previous studies find evidence of commonality in liquidity in financial markets and across exchanges
(Chordia, Roll and Subrahmanyam, 2000; Karolyi, Lee and Dijk, 2002). If commonality in liquidity
exists between SGX and the home markets, then changes in the bid-ask spread and depth of the home
30 An explanation of these variables is provided in section 4.3.2.

Page | 62
market contracts would explain changes in the liquidity of the satellite market. To control for any
commonality in liquidity across exchanges, the bid-ask spreads and the depth measures of the control
contracts are included as explanatory variables in the regression analysis.
The following regressions are estimated:
, , , , ( 2 9 )
, , , , ( 3 0 )
, , , , ( 3 1 )
, , , , ( 3 2 )
, , , , ( 3 3 )
The second set of regression models employ the same dependent variables as the first set and are
described in the previous section. Each dependent variable is regressed on a co-location dummy
variable, which is explained in section 4.2.3, and its respective control market variable. Ln (Control
Prop Spread)it , Ln (Control Tick Spread)it and Ln (Control TW Spread)it refers to the natural
logarithms of the daily average proportional spread, tick spread and time-weighted spread, respectively,
for the control contract. Control Best Depthi,t, measures the control market’s daily average best depth
and Control Total Depthi,t, measures the control market’s daily average total depth. 31
As with the multivariate analysis of high frequency trading, the volatility and trading activity of the
home markets are controlled for in the final set of regression models. The international linkage that
exists across financial markets that trade the same or similar equity-index futures contracts is the reason
for its inclusion in the regression analysis. Refer to section 4.3.2 for further details.
The following regressions are estimated:
, , , ,
, , , ( 3 4 )
, , , ,
31 The Nikkei 225 Index Futures traded on the Osaka Stock Exchange is the control contract for the Nikkei 225 Index Futures (SGX). The Taiwan Stock Index Futures traded on the Taiwan Futures Exchange is the control contract for the MSCI Taiwan Index Futures (SGX). The CNX Nifty Index Futures traded on the National Stock Exchange of India is the control contract for the CNX Nifty Index Futures (SGX). The China Shanghai Shenzhen 300 Stock Index Futures traded on the China Financial Futures Exchange is the control contract for the FTSE China A50 Index Futures (SGX).

Page | 63
, , , ( 3 5 )
, , , ,
, , , ( 3 6 )
, , , ,
, , , ( 3 7 )
, , , ,
, , , ( 3 8 )
The dependent variables for the final set of the multivariate liquidity analysis are analogous to the two
previous sets. The explanatory variables are the price volatility and open interest of both the treatment
and its respective control contract and a colocation dummy variable. These variables are detailed in the
preceding sections.

Page | 64
5. RESULTS 32
5.1. Univariate Results
Table 5-1 presents the annual trading volumes of the stock index futures traded on both the satellite and
home exchanges. A comparison of volume levels of the Nikkei 225 index futures shows that the
Singapore Exchange (SGX) captures the majority of market activity in this contract. Furthermore, it
demonstrates that SGX’s market share of this contract has increased steadily over the past five years.
The majority of trading in Taiwan’s equity-index futures contracts, however, takes place on the home
market. SGX accounts for approximately a third of this market’s trading volume and this proportion has
remained steady over the past five years. Trading in the CNX Nifty Index Futures, on the other hand, is
concentrated on the National Stock Exchange of India and less than 1% of this contract’s total annual
volume is transacted on the satellite market. Finally, since its inception in 2010, the China Financial
Futures Exchange has captured the majority of the market for stock index futures contracts of China.33
Volume levels of China-SGX, however, have increased substantially over the past five years. There was
an abrupt drop in demand for this contract in 2009 with only one contract traded during the entire year.
An increase in its demand saw its proportion increase from 1% in 2010 to over 7% in 2012. From the
above results, it is evident that while SGX accounts for a significant proportion of the market share for
Japan and Taiwan’s equity-index futures. Trading in India and China’s equity-index futures, however,
are dominated on their home exchanges.
32 For clarity and comparability, each equity index futures contract discussed in the results section will be referred to by the origin of their underlying index. Japan‐SGX, Taiwan‐SGX, India‐SGX and China‐SGX denotes the Singapore Exchange’s Nikkei 225 Index Futures, MSCI Taiwan Index Futures, CNX Nifty Index Futures and CSI 300 Index Futures contracts, respectively. Japan‐OSE, Taiwan‐TAIFEX, India‐NSE and China‐CCFEX refers to the Nikkei 225 Index Futures denotes the Osaka Stock Exchange, the Taiwan Stock Exchange Index Futures traded on the Taiwan Futures Exchange, the CNX Nifty Index Futures traded on the National Stock Exchange of India and the China Shanghai Shenzhen 300 Index Futures traded on the China Financial Futures Exchange, respectively. 33 The China Shanghai Shenzhen 300 stock index futures was introduced on 16 April 2010.

Page | 65
Table 5-1 Annual Trading Volume
This table reports the annual trading volumes for Singapore Exchange’s Nikkei 225 futures index, MSCI Taiwan futures index, CNX Nifty futures index and China A50 futures index. It also reports the annual trading volumes for the Nikkei 225 index futures traded on the Osaka Stock Exchange, the Taiwan Stock Exchange index futures traded on the Taiwan Futures Exchange, the CNX Nifty index futures traded on the National Stock Exchange of India and the China Shanghai Shenzhen 300 index futures traded on the China Financial Futures Exchange. The period of analysis extends from 2008 to 2009. The proportion of the total trading volume that the satellite market accounts for is provided.34
Year Japan Taiwan India China
SGX OSE Percent SGX TAIFEX Percent SGX NSE Percent SGX CFFEX Percent
2008 24,042,341 31,521,576 43.27% 11,680,971 20,295,484 36.53% 4,279,900 9,207,490,500 0.05% 21,214
2009 23,863,146 19,926,216 54.50% 11,922,906 25,388,243 31.96% 3,999,830 8,532,876,650 0.05% 1
2010 27,983,249 17,813,909 61.10% 14,414,688 26,411,482 35.31% 9,443,424 6,703,637,450 0.14% 508,319 45,945,151 1.09%
2011 28,254,637 14,707,842 65.77% 16,139,858 31,905,250 33.59% 12,614,413 6,429,529,250 0.20% 2,657,774 50,684,480 4.98%
2012 26,878,858 14,355,666 65.19% 15,112,942 25,417,975 37.29% 12,075,282 4,133,695,900 0.29% 8,499,337 105,174,949 7.48%
34 The trading volumes reported in this table are not adjusted for contract size.

Page | 66
5.1.1. Two-Sample T-Test
Table 5-2 presents the descriptive statistics of the treatment sample. During the six months following
the introduction of co-location facilities, liquidity improvements are observed for the India-SGX and
China-SGX contracts. The liquidity of the Japan-SGX and Taiwan-SGX contracts decline over this
period, as evident by the significantly wider bid-ask spreads and lower market depth. Results for the
Singapore-SGX generally indicate that there is greater liquidity in this contract. Total depth, however,
declines significantly at a 5% level. These observed changes in liquidity may be driven by factors other
than the introduction of co-location services. Therefore, further analysis is required where other
determinants of liquidity are controlled for.
Changes in the trading activities of most contracts are largely in line with its liquidity levels. During the
post-event period, trading activity is greater for the India-SGX and the Singapore-SGX contracts but
lower for the Japan-SGX contract. There is some evidence of greater trading activity for the China-SGX
contract, as shown by a significant increase in open interest levels. Increases in the number of trades or
trading volume, however, are not observed for this contract. Despite a marked decline in the liquidity of
the Taiwan-SGX contract, its trading activity is significantly higher in the post-event period.
Order to trade and algo trade ratios suggest a greater level of HFT activity in the Japan-SGX contract
but lower levels in the Taiwan-SGX and China-SGX contracts. The results suggest that high frequency
trading in the India-SGX remains unchanged across sub-periods. Brogaard (2010) finds that on the U.S.
equities market, moderate declines in high frequency trading levels arise when volatility increases. That
is, volatility and other exogenous factors may have a material impact on low latency activity and
therefore drive these observed changes. Further analyses that address these issues are conducted and
presented in Sections 5.1.2, 5.2.1 and 5.4.1.

Page | 67
Table 5-2 Descriptive Statistics for SGX Futures Contracts
This table reports the descriptive statistics of proportional spreads, tick spreads, time-weighted spreads, best depth, total depth, messages per minutes, order to trade ratio, algo trade, the number of trades, trading volume, trade size, open interest and price volatility. The analysis is based on daily observations over a 6 months event window around the implementation of co-location facilities. For information on the market quality and high frequency trading measures refer to sections 4.2.1 and 4.2.2. The results for Nikkei 225 Index (SGX) are reported in Panel A, MSCI Taiwan Index (SGX) in Panel B, CNX Nifty Index (SGX) in Panel C, FTSE China A50 Index (SGX) in Panel D and MSCI Singapore Free Index (SGX) in Panel E. The pre-event period extends from 18 October 2010 to 17 April 2011 and the post-event period extends from 18 April 2011 to 17 October 2011. Reported are t-statistics and p-values comparing the means of the pre and post periods.
Prop Tick TW Best Total Messages OTT Algo Trades Volume Trade Open Volatility Spread Spread Spread Depth Depth per Minute Ratio Trade Size Interest
Panel A: Nikkei 225 Index (SGX)
Pre 0.000502 0.002015 0.000501 344 5,386 50.52 1.35 -3.98 16,816 84,556 25,914,030 223,372 0.0192289 Post 0.000549 0.002044 0.000548 300 5,176 48.67 1.47 -3.37 14,659 68,617 21,400,304 205,685 0.0183484 Difference 0.000047 0.000029 0.000047 -44 -210 -1.85 0.12 0.62 -2,158 -15,939 -4,513,726 -17,686 -0.0008805 T-statistics 8.77 2.23 8.92 -3.40 -1.02 -1.23 2.33 4.45 -1.90 -3.06 -7.70 -5.26 -0.43 P-value <.0001 0.026 <.0001 0.001 0.310 0.219 0.021 <.0001 0.059 0.003 <.0001 <.0001 0.670
Panel B: MSCI Taiwan Index (SGX)
Pre 0.000340 0.010443 0.000339 125 2,483 86.36 2.05 -1.66 13,778 43,920 99,548 149,567 0.0148165 Post 0.000367 0.010552 0.000366 104 2,021 91.44 1.88 -1.85 15,641 51,635 96,362 166,972 0.0232743 Difference 0.000026 0.000109 0.000027 -21 -462 5.08 -0.16 -0.19 1,863 7,715 -3,186 17,404 0.0084578 T-statistics 6.88 2.92 6.96 -6.30 -8.23 4.07 -2.74 -2.18 2.80 2.86 -0.72 4.11 5.84 P-value <.0001 0.004 <.0001 <.0001 <.0001 <.0001 0.007 0.030 0.006 0.005 0.473 <.0001 <.0001
Panel C: CNX Nifty Index (SGX)
Pre 0.000278 1.603061 0.000440 20 280 66.24 3.93 -0.98 10,052 35,094 40,179 195,332 0.0208684 Post 0.000269 1.423481 0.000390 21 256 71.28 3.68 -1.01 11,637 39,741 35,712 247,514 0.0221573 Difference -0.000009 -0.179579 -0.000050 0 -24 5.04 -0.24 -0.03 1,585 4,647 -4,467 52,182 0.0012889 T-statistics -0.86 -3.60 -3.86 1.09 -5.35 4.19 -1.58 -0.47 2.96 1.54 -2.19 10.04 0.99 P-value 0.393 0.000 0.000 0.278 <.0001 <.0001 0.115 0.635 0.003 0.126 0.030 <.0001 0.322
Panel D: FTSE China A50 Index (SGX)
Pre 0.001024 9.872810 0.001414 51 618 39.39 16.77 -0.43 1,062 6,354 295,589 26,912 0.0220157 Post 0.000843 7.418469 0.001175 56 811 35.48 12.81 -0.54 1,196 7,110 255,924 45,923 0.0195383 Difference -0.000182 -2.454341 -0.000239 5 193 -3.91 -3.96 -0.11 134 757 -39,665 19,011 -0.0024774 T-statistics -8.20 -12.54 -6.63 3.55 10.37 -5.72 -4.11 -3.25 1.90 1.45 -3.39 13.06 -1.59 P-value <.0001 <.0001 <.0001 0.001 <.0001 <.0001 <.0001 0.001 0.059 0.148 0.001 <.0001 0.114

Page | 68
Table 5-2 Descriptive Statistics for SGX Futures Contracts (Cont.)
Prop Tick TW Best Total Messages OTT Algo Trades Volume Trade Open Volatility Spread Spread Spread Depth Depth per Minute Ratio Trade Size Interest
Panel E: MSCI Singapore Index (SGX)
Pre 0.000324 0.006016 0.000331 17 302 38.76 3.59 -0.50 5,729 9,799 131,029 45,629 0.0132600 Post 0.000346 0.005923 0.000347 19 281 50.92 3.20 -0.50 8,675 13,330 109,117 44,521 0.0197047 Difference 0.000022 -0.000094 0.000016 2 -21 12.16 -0.39 0.00 2,945 3,530 -21,911 -1,109 0.0064447 T-statistics 6.54 -2.95 4.30 3.16 -2.33 10.60 -5.74 0.02 9.10 4.44 -2.42 -0.89 5.96 P-value <.0001 0.004 <.0001 0.002 0.021 <.0001 <.0001 0.985 <.0001 <.0001 0.016 0.376 <.0001

Page | 69
5.1.2 Paired T-Test
Table 5-3 presents the descriptive statistics of the daily log ratios.35 A significant increase indicates that
the log difference between the treatment contract and its respective control contract has increased across
sub-periods. This analysis, therefore, controls for broad market movements that affect both dual-listed
futures contracts. Improvements in bid-ask spreads are most evident for the India-SGX and China-SGX
contracts with all three measures reporting a significant decline at the 1% and 5% levels, respectively.
The market depth of India-SGX correspondingly increases in the post-event period while the market
depth of China-SGX reports a decline. There is some evidence to suggest that bid-ask spreads are
narrower for the Japan-SGX and Taiwan-SGX contracts. Furthermore, both the best and total depth
measures suggest greater market depth levels for the Taiwan-SGX contract. Although market-wide
factors are accounted for in this analysis, other contract specific determinants of liquidity have not been
controlled for. Therefore, further analysis using a multivariate regression framework is conducted and
presented in Sections 5.2.2 and 5.4.2.
As the log ratios of algo trade are calculated from absolute values, a negative change across sub-periods
suggests greater HFT activity. The results for the two normalised measures of message traffic show that
high frequency trading increase in the Japan-SGX and Taiwan-SGX contracts but decrease in the India-
SGX and China-SGX contracts. Interestingly, while HFTs have a presence in the Japan-OSE and
Taiwan-TAIFEX home markets, the India-NSE and China-CFFEX home markets are largely
inaccessible to HFT foreigners due to regulatory and tax reasons. This suggests that a structural
improvement aimed at promoting low latency trading is most effective on dual-listed futures markets
where there are profit opportunities from cross-border trading. The robustness of these results are tested
and presented in Sections 5.2.1, 5.3 and 5.4.1.
35 For the discussion of log ratios, the ratios will be referred to by their satellite market.

Page | 70
Table 5-3 Descriptive Statistics of Daily Log Ratios
This table reports the descriptive statistics of the daily log ratios for the variables: proportional spreads, tick spreads, time-weighted spreads, best depth, total depth, messages per minutes, order to trade ratio, algo trade, the number of trades, trading volume, trade size, open interest and price volatility. For further information on the market quality and high frequency measures assessed see sections 4.2.1 and 4.2.2. Daily log ratios are calculated as the natural log of daily measures for each treatment contract divided by the daily measures of its respective control contract. Panel A provides the results for the Nikkei 225 Index (SGX) and its control contract, the Nikkei 225 Index (OSE). Panel B provides the results for the MSCI Taiwan Index (SGX) and its control contract, the Taiwan Stock Index (TAIFEX). Panel C provides the results for the CNX Nifty Index (SGX) and its control contract, the CNX Nifty Index (NSE). Panel D provides the results for the FTSE China A50 Index (SGX) and its control contract, the China Shanghai Shenzhen 300 Stock Index (CFFEX). The event window extends 6 months around the implementation of co-location facilities with the pre-event period extending from 18 October 2010 to 17 April 2011 and the post-event period extending from 18 April 2011 to 17 October 2011. Reported are t-statistics and p-values for comparing the means of the pre-event and post-event periods.
Prop Tick TW Best Total Messages OTT Algo Trades Volume Trade Open Volatility Spread Spread Spread Depth Depth per Minute Ratio Trade Size Interest
Panel A: Japan [Nikkei 225 Index (SGX) / Nikkei 225 Index (OSE)]
Pre -0.68545 0.70084 -0.68257 -1.08867 -0.87952 -1.12026 -2.18321 1.32412 1.31529 0.45620 -1.55229 -0.37137 1.11356 Post -0.68747 0.69880 -0.68669 -0.95642 -0.91845 -0.50771 -1.93328 1.00179 1.50317 0.57168 -1.62465 -0.30457 1.01750 Difference -0.00202 -0.00204 -0.00412 0.13225 -0.03893 0.61255 0.24993 -0.32233 0.18788 0.11548 -0.07236 0.06679 -0.09606 T-statistics -1.76 -1.75 -2.70 8.32 -2.34 15.82 8.50 -10.16 10.44 6.76 -4.05 8.10 -3.78 P-Value 0.080 0.081 0.007 <.0001 0.020 <.0001 <.0001 <.0001 <.0001 <.0001 <.0001 <.0001 0.000
Panel B: Taiwan [MSCI Taiwan Index (SGX) / Taiwan Stock Index (TAIFEX)]
Pre 0.91007 0.56924 0.91342 1.11306 1.63339 -0.71452 0.35314 -0.15036 -1.06766 -0.86489 -3.82698 0.93507 1.39104 Post 0.89816 0.54983 0.89856 1.25169 1.75434 -0.65925 0.54826 -0.26225 -1.20751 -0.92150 -3.75116 1.02332 1.56270 Difference -0.01191 -0.01941 -0.01486 0.13863 0.12095 0.05527 0.19512 -0.11189 -0.13984 -0.05661 0.07582 0.08825 0.17165 T-statistics -1.48 -2.39 -1.77 5.69 4.06 5.68 9.21 -2.85 -6.07 -1.47 2.18 1.87 2.54 P-Value 0.141 0.018 0.078 <.0001 <.0001 <.0001 <.0001 0.005 <.0001 0.144 0.031 0.063 0.012
Panel C: India [CNX Nifty Index (SGX) / CNX Nifty Index (NSE)]
Pre 0.99987 1.91577 1.44600 -4.73587 -3.57093 0.12910 1.19347 -7.06815 -0.71094 -6.58562 -9.09388 -4.77235 1.28951 Post 0.89299 1.80875 1.25320 -4.54892 -3.42686 0.20506 1.10142 -6.86966 -0.53489 -6.30313 -8.98751 -4.52686 1.28376 Difference -0.10688 -0.10702 -0.19279 0.18695 0.14407 0.07596 -0.09205 0.19848 0.17605 0.28249 0.10638 0.24549 -0.00575 T-statistics -5.64 -5.65 -6.31 8.31 8.02 6.30 -2.61 3.64 4.15 5.27 2.15 11.89 -0.06 0P-Value <.0001 <.0001 <.0001 <.0001 <.0001 <.0001 0.010 0.000 <.0001 <.0001 0.032 <.0001 0.955
Panel D: China [FTSE China A50 Index (SGX) / China Shanghai Shenzhen 300 Stock Index (CFFEX)]
Pre 2.13579 8.92984 2.45197 1.18507 1.82973 -1.04663 2.53171 -2.58212 -3.27026 -3.32067 -1.44506 0.24738 1.11246 Post 2.06593 8.86703 2.37667 1.06584 1.80574 -1.14960 2.26502 -2.36648 -3.13003 -3.23149 -1.48909 0.54558 1.26032 Difference -0.06986 -0.06280 -0.07530 -0.11923 -0.02399 -0.10296 -0.26669 0.21564 0.14022 0.08917 -0.04403 0.29820 0.14786 T-statistics -2.39 -2.17 -2.14 -2.89 -0.50 -5.27 -4.46 2.36 2.01 0.89 -0.77 3.05 1.41 P-Value 0.018 0.031 0.033 0.004 0.619 <.0001 <.0001 0.019 0.046 0.373 0.440 0.003 0.161
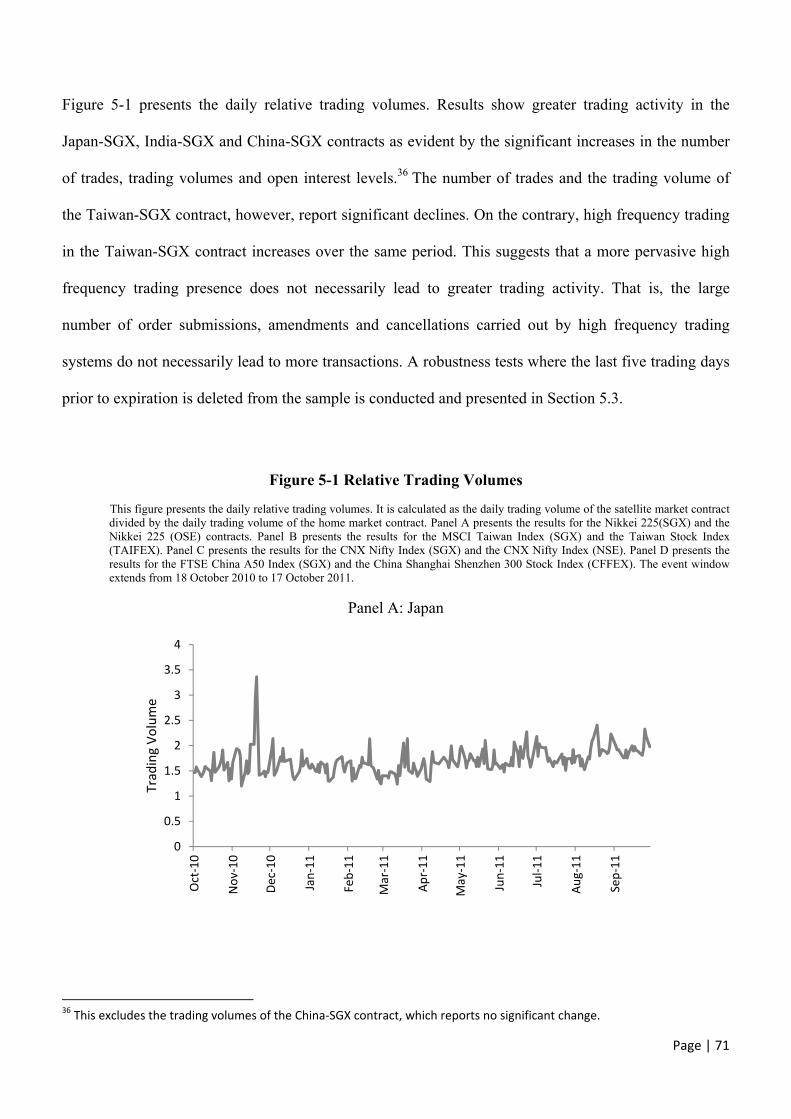
Page | 71
Figure 5-1 presents the daily relative trading volumes. Results show greater trading activity in the
Japan-SGX, India-SGX and China-SGX contracts as evident by the significant increases in the number
of trades, trading volumes and open interest levels.36 The number of trades and the trading volume of
the Taiwan-SGX contract, however, report significant declines. On the contrary, high frequency trading
in the Taiwan-SGX contract increases over the same period. This suggests that a more pervasive high
frequency trading presence does not necessarily lead to greater trading activity. That is, the large
number of order submissions, amendments and cancellations carried out by high frequency trading
systems do not necessarily lead to more transactions. A robustness tests where the last five trading days
prior to expiration is deleted from the sample is conducted and presented in Section 5.3.
Figure 5-1 Relative Trading Volumes
This figure presents the daily relative trading volumes. It is calculated as the daily trading volume of the satellite market contract divided by the daily trading volume of the home market contract. Panel A presents the results for the Nikkei 225(SGX) and the Nikkei 225 (OSE) contracts. Panel B presents the results for the MSCI Taiwan Index (SGX) and the Taiwan Stock Index (TAIFEX). Panel C presents the results for the CNX Nifty Index (SGX) and the CNX Nifty Index (NSE). Panel D presents the results for the FTSE China A50 Index (SGX) and the China Shanghai Shenzhen 300 Stock Index (CFFEX). The event window extends from 18 October 2010 to 17 October 2011.
Panel A: Japan
36 This excludes the trading volumes of the China‐SGX contract, which reports no significant change.
0
0.5
1
1.5
2
2.5
3
3.5
4
Oct‐10
Nov‐10
Dec‐10
Jan‐11
Feb‐11
Mar‐11
Apr‐11
May‐11
Jun‐11
Jul‐11
Aug‐11
Sep‐11
Trading Volume

Page | 72
Panel B: Taiwan
Panel C: India
Panel D: China
0
0.2
0.4
0.6
0.8
1
1.2
1.4
Oct‐10
Nov‐10
Dec‐10
Jan‐11
Feb‐11
Mar‐11
Apr‐11
May‐11
Jun‐11
Jul‐11
Aug‐11
Sep‐11
Trading Volume
0
0.001
0.002
0.003
0.004
0.005
0.006
0.007
0.008
Oct‐10
Nov‐10
Dec‐10
Jan‐11
Feb‐11
Mar‐11
Apr‐11
May‐11
Jun‐11
Jul‐11
Aug‐11
Sep‐11
Trading Volume
0
0.1
0.2
0.3
0.4
0.5
0.6
0.7
0.8
Oct‐10
Nov‐10
Dec‐10
Jan‐11
Feb‐11
Mar‐11
Apr‐11
May‐11
Jun‐11
Jul‐11
Aug‐11
Sep‐11
Trading Volume

Page | 73
Panel E: Singapore
Figure 5-2 presents the daily relative trading volumes. Consistent with the findings of Hagströmer and
Nordén (2013) and Hasbrouck and Saar (2013), the price volatility of the Japan-SGX contract declines
significantly. The price volatility of the Taiwan-SGX contract, on the contrary, increases significantly
over the same period. As reported earlier, both contracts exhibit greater high frequency trading levels
following the introduction of co- location services. The directionally different impact that this
microstructural change has on volatility levels may reflect the different types of trading strategies
employed in these two contracts. Hagströmer and Nordén (2013) find that market making HFTs ease
volatility while the causality of opportunistic HFT on volatility cannot be established. Results suggest
that there is greater market making presence in the Japan-SGX contract than in the Taiwan-SGX contrac.
Therefore greater HFT activity mitigates price volatility in the Japan-SGX contract. A multivariate
analysis of liquidity in Sections 5.2.2 and 5.4.2 examines this issue further. No significant changes are
observed for the price volatility of India-SGX and China-SGX.
0
5000
10000
15000
20000
25000
30000
35000
40000
45000
Oct‐10
Nov‐10
Dec‐10
Jan‐11
Feb‐11
Mar‐11
Apr‐11
May‐11
Jun‐11
Jul‐11
Aug‐11
Sep‐11
Trading Volume

Page | 74
Figure 5-2 Relative Volatility
This figure presents the daily relative volatility. It is calculated as the daily volatility of the satellite market contract divided by the daily volatility of the home market contract. Panel A presents the results for the Nikkei 225(SGX) and the Nikkei 225 (OSE) contracts. Panel B presents the results for the MSCI Taiwan Index (SGX) and the Taiwan Stock Index (TAIFEX). Panel C presents the results for the CNX Nifty Index (SGX) and the CNX Nifty Index (NSE). Panel D presents the results for the FTSE China A50 Index (SGX) and the China Shanghai Shenzhen 300 Stock Index (CFFEX). The event window extends from 18 October 2010 to 17 October 2011.
Panel A: Japan
Panel B: Taiwan
0
0.5
1
1.5
2
2.5
Oct‐10
Nov‐10
Dec‐10
Jan‐11
Feb‐11
Mar‐11
Apr‐11
May‐11
Jun‐11
Jul‐11
Aug‐11
Sep‐11
Price Volatility
0
0.5
1
1.5
2
2.5
3
3.5
4
4.5
Oct‐10
Nov‐10
Dec‐10
Jan‐11
Feb‐11
Mar‐11
Apr‐11
May‐11
Jun‐11
Jul‐11
Aug‐11
Sep‐11
Price Volatility

Page | 75
Panel C: India
Panel D: China
Panel E: Singapore
0
0.5
1
1.5
2
2.5
3
3.5
4
Oct‐10
Nov‐10
Dec‐10
Jan‐11
Feb‐11
Mar‐11
Apr‐11
May‐11
Jun‐11
Jul‐11
Aug‐11
Sep‐11
Price Volatility
0
1
2
3
4
5
6
7
8
9
Oct‐10
Nov‐10
Dec‐10
Jan‐11
Feb‐11
Mar‐11
Apr‐11
May‐11
Jun‐11
Jul‐11
Aug‐11
Sep‐11
Price Volatility
0
0.01
0.02
0.03
0.04
0.05
0.06
0.07
Oct‐10
Nov‐10
Dec‐10
Jan‐11
Feb‐11
Mar‐11
Apr‐11
May‐11
Jun‐11
Jul‐11
Aug‐11
Sep‐11
Price Volatility

Page | 76
5.2. Multivariate Results
5.2.1 High Frequency Trading
Table 5-4 presents the coefficients for the contract-specific regressions examining high frequency
trading. After controlling for open interest and price volatility, the results suggest that HFT activity on
the India-SGX and the China-SGX contracts decline significantly. This is consistent with the conjecture
put forward earlier that stock index futures markets with limited cross-market profit opportunities do not
attract greater high frequency trading activity after co-location facilities are introduced. The increase in
the number of messages per minute and algo trade ratio for the Singapore-SGX contract suggests that
there may have been an increase in high frequency trading. However, the negative coefficient of the
ln(order to trade) ratio provides evidence to support otherwise. The results for the Singapore-SGX
contract are, therefore, inconclusive. Similarly, the results for the Japan-SGX and Taiwan-SGX
contracts do not lead to meaningful conclusions. Further analysis is therefore conducted for a more
detailed insight into the impact that co-location services have on low latency activity. Interestingly, the
coefficients for the variable price volatility are negative and significant at the 1% level.37 It suggests that
high frequency trading is contingent upon market conditions and that on equity index futures exchanges
HFTs reduce their presence in the market when price volatility increases. This finding is consistent with
Brogaard (2010).
37 The coefficients for the variable price volatility are significant at the 1% level for all futures contracts except for the China‐SGX contract where it is significant at the 5% level.

Page | 77
Table 5-4 Contract-Specific High Frequency Trading Regression
This table reports the coefficients for the following regressions: , , , , , , , , , , , , , , , where Messages per Minuteit represents the daily average number of messages submitted over a one-minute interval, Ln (Order to Trade)it represents the log of the daily average number of messages per trade and Algo Tradeit represents the daily average number of messages that has been standardised by trading volume. Colocationit takes the value of 1 after the introduction of co-location services and, 0 otherwise. Open Interestit refers to the number of outstanding contracts from the previous session of trading and Price Volatilityit is calculated as the natural logarithm of the day’s highest traded price proportional to its lowest traded price. Results for the Singapore Exchange’s SiMSCI, Nikkei 225, MSCI Taiwan, CNX Nifty and FTSE ChinaA50 are reported. The period of analysis extends from 18 October 2010 to 17 October 2011.
SiMSCI (SGX) Nikkei 225 (SGX) MSCI Taiwan (SGX) CNX Nifty (SGX) FTSE China A50 (SGX)
Panel A: Messages Per Minute Coefficient T-Stat P-Value Coefficient T-Stat P-Value Coefficient T-Stat P-Value Coefficient T-Stat P-Value Coefficient T-Stat P-Value
Intercept 20.582 10.60 <.0001 30.081 8.21 <.0001 73.129 30.28 <.0001 59.054 28.05 <.0001 37.358 34.11 <.0001 Colocation 7.949 9.37 <.0001 -4.003 -2.54 0.012 -0.182 -0.17 0.867 6.036 6.31 <.0001 -3.266 -3.62 0.000 Open Interest 198.660 4.72 <.0001 50.560 3.07 0.002 34.010 2.29 0.023 3.030 0.30 0.766 -12.450 -0.41 0.685 Price Volatility 687.616 14.12 <.0001 402.974 13.98 <.0001 553.396 12.53 <.0001 315.767 7.78 <.0001 109.240 3.83 0.000 Earthquake 6.657 4.12 <.0001 Adj. R Squared 0.683 0.584 0.458 0.351 0.161 Panel B: Ln (Order to Trade) Intercept 1.393 36.20 <.0001 0.453 6.21 <.0001 1.026 19.44 <.0001 1.358 15.30 <.0001 2.891 32.84 <.0001 Colocation -0.036 -2.11 0.036 0.081 2.59 0.010 0.068 2.86 0.005 -0.121 -3.00 0.003 -0.257 -3.55 0.001 Open Interest 0.824 0.99 0.325 0.029 0.09 0.929 -0.702 -2.16 0.032 1.410 3.30 0.001 -0.691 -0.28 0.779 Price Volatility -12.375 -12.81 <.0001 -8.723 -15.19 <.0001 -15.801 -16.36 <.0001 -14.952 -8.74 <.0001 -6.629 -2.89 0.004 Earthquake -0.071 -2.22 0.028 Adj. R Squared 0.484 0.568 0.561 0.256 0.111 Panel C: Algo Trade Intercept -1.313 -18.99 <.0001 -2.579 -6.30 <.0001 -2.889 -18.75 <.0001 -2.558 -18.43 <.0001 -0.590 -11.30 <.0001 Colocation 0.082 2.73 0.007 -0.048 -0.27 0.786 -0.130 -1.88 0.062 -0.518 -8.21 <.0001 -0.285 -6.62 <.0001 Open Interest 20.390 13.59 <.0001 -3.000 -1.63 0.104 11.150 11.75 <.0001 9.550 14.25 <.0001 8.740 5.98 <.0001 Price Volatility -9.165 -5.28 <.0001 -44.178 -13.73 <.0001 -30.173 -10.71 <.0001 -13.542 -5.06 <.0001 -3.228 -2.37 0.018 Earthquake 0.556 3.09 0.002 Adj. R Squared 0.437 0.491 0.541 0.470 0.178
Page | 78
Table 5-5 presents the coefficients for the market-wide regressions examining high frequency trading.
After controlling for high frequency trading activity on the alternative trading venues, the results are
more consistent across the normalised message traffic measures. The coefficients for the co-location
dummy variable suggests that the infrastructural change has a positive impact on HFT levels in the
Japan-SGX and Taiwan-SGX contracts but a negative impact in the India-SGX and China-SGX
contracts. These results are consistent with the findings of Table 5-3. They support the conjecture that
co-location services increase low latency trading activity in markets where there are cross-border profit
opportunities i.e. markets with alternative venues that have HFT presence. While there is active HFT
participation on the Osaka Stock Exchange and the Taiwan Futures Exchange, the China Financial
Futures Exchange and the National Stock Exchange of India are largely inaccessible to HFT foreigners
due to regulatory and tax reasons. Therefore, co-location facilities do not generate more trading interest
among HFTs in the India-SGX or the China-SGX contracts but significantly increases high frequency
trading in the Japan-SGX and the Taiwan-SGX contracts. Evidence of cross-border trading is provided
by the variables: control messages per minute, ln(control order to trade) and control algo trade. The
coefficients of all three measures are positive and statistically significant at the 1% level.38 This result is
consistent across all futures contracts examined. It suggests that an increase in high frequency trading
on the alternative trading venue leads to an increase in high frequency trading on Singapore’s stock
index futures market. The findings suggest that low latency traders on dual-listed futures markets do not
compete for HFT order flow but engage in cross-border trading on both markets.
38 Except for the coefficient of the variable control algo trade for the China‐SGX contract which is significant at the 5% level.
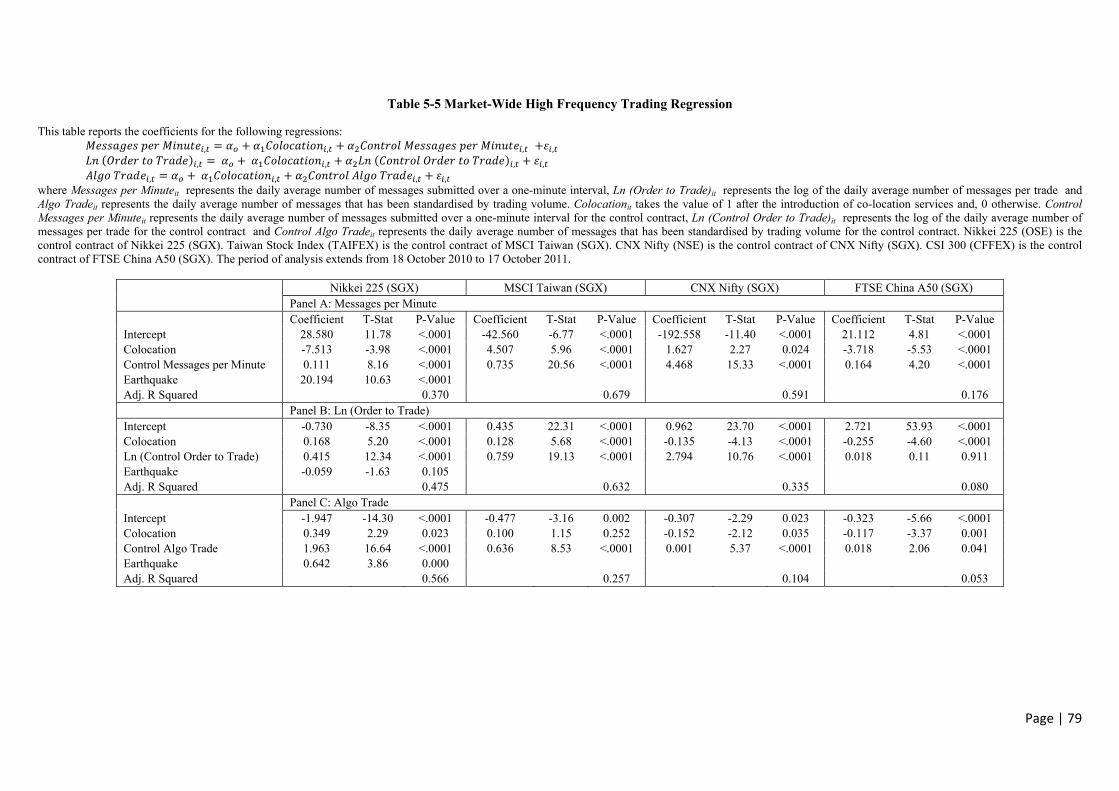
Page | 79
Table 5-5 Market-Wide High Frequency Trading Regression
This table reports the coefficients for the following regressions: , , , , , , , , , , , , where Messages per Minuteit represents the daily average number of messages submitted over a one-minute interval, Ln (Order to Trade)it represents the log of the daily average number of messages per trade and Algo Tradeit represents the daily average number of messages that has been standardised by trading volume. Colocationit takes the value of 1 after the introduction of co-location services and, 0 otherwise. Control Messages per Minuteit represents the daily average number of messages submitted over a one-minute interval for the control contract, Ln (Control Order to Trade)it represents the log of the daily average number of messages per trade for the control contract and Control Algo Tradeit represents the daily average number of messages that has been standardised by trading volume for the control contract. Nikkei 225 (OSE) is the control contract of Nikkei 225 (SGX). Taiwan Stock Index (TAIFEX) is the control contract of MSCI Taiwan (SGX). CNX Nifty (NSE) is the control contract of CNX Nifty (SGX). CSI 300 (CFFEX) is the control contract of FTSE China A50 (SGX). The period of analysis extends from 18 October 2010 to 17 October 2011.
Nikkei 225 (SGX) MSCI Taiwan (SGX) CNX Nifty (SGX) FTSE China A50 (SGX)
Panel A: Messages per Minute Coefficient T-Stat P-Value Coefficient T-Stat P-Value Coefficient T-Stat P-Value Coefficient T-Stat P-Value
Intercept 28.580 11.78 <.0001 -42.560 -6.77 <.0001 -192.558 -11.40 <.0001 21.112 4.81 <.0001 Colocation -7.513 -3.98 <.0001 4.507 5.96 <.0001 1.627 2.27 0.024 -3.718 -5.53 <.0001 Control Messages per Minute 0.111 8.16 <.0001 0.735 20.56 <.0001 4.468 15.33 <.0001 0.164 4.20 <.0001 Earthquake 20.194 10.63 <.0001 Adj. R Squared 0.370 0.679 0.591 0.176 Panel B: Ln (Order to Trade) Intercept -0.730 -8.35 <.0001 0.435 22.31 <.0001 0.962 23.70 <.0001 2.721 53.93 <.0001 Colocation 0.168 5.20 <.0001 0.128 5.68 <.0001 -0.135 -4.13 <.0001 -0.255 -4.60 <.0001 Ln (Control Order to Trade) 0.415 12.34 <.0001 0.759 19.13 <.0001 2.794 10.76 <.0001 0.018 0.11 0.911 Earthquake -0.059 -1.63 0.105 Adj. R Squared 0.475 0.632 0.335 0.080 Panel C: Algo Trade Intercept -1.947 -14.30 <.0001 -0.477 -3.16 0.002 -0.307 -2.29 0.023 -0.323 -5.66 <.0001 Colocation 0.349 2.29 0.023 0.100 1.15 0.252 -0.152 -2.12 0.035 -0.117 -3.37 0.001 Control Algo Trade 1.963 16.64 <.0001 0.636 8.53 <.0001 0.001 5.37 <.0001 0.018 2.06 0.041 Earthquake 0.642 3.86 0.000 Adj. R Squared 0.566 0.257 0.104 0.053

Page | 80
Table 5-6 presents the coefficients for the combined regressions examining high frequency trading.
After controlling for open interest, price volatility, open interest of the control market and the price
volatility of the control market, the results for the Japan-SGX and China-SGX contracts are consistent
with earlier set of regression models. The coefficients of the co-location dummy variable for the
Taiwan-SGX and India-SGX contracts are, however, not consistent across HFT measures. The results
for this set of regression models demonstrates that high frequency trading activity on alternative markets
are an important factor in explaining changes in HFT levels on Singapore's equity-index futures market.
Its material impact on the treatment contracts’ HFT activity necessitates its inclusion in the regression
analysis.
Finally, previous studies find evidence of abnormal trading activity on Singapore’s derivatives market
close to a contract’s expiration due to investors’ rollover activities (Chung and Hseu, 2008). A
robustness test is conducted where five trading days prior to a contract’s maturity is deleted from the
sample and the regression models are refitted. The results from the robustness test are presented in
Table A-1 to Table A-8. Specifically, the results for the contract-specific, market-wide and combined
regressions examining high frequency trading are reported in Table A-3, Table A-4 and Table A-5.
After controlling for high frequency trading activity on the alternative trading venues, the results of the
robustness test confirm the findings of Table 5-5. That is, the introduction of co-location services on
Singapore’s equity-index futures market leads to an increase in high frequency trading in the Japan-
SGX and Taiwan-SGX contracts but a decrease in the India-SGX and China-SGX contracts.

Page | 81
Table 5-6 Combined High Frequency Trading Regression
This table reports the coefficients for the following regressions: , , , , , , , , , , , , , , , , , , , , , where Messages per Minuteit represents the daily average number of messages submitted over a one-minute interval, Ln (Order to Trade)it represents the log of the daily average number of messages per trade and Algo Tradeit represents the daily average number of messages that has been standardised by trading volume. Colocationit takes the value of 1 after the introduction of co-location services and, 0 otherwise. Open Interestit refers to the number of outstanding contracts from the previous session of trading and Price Volatilityit is calculated as the natural logarithm of the day’s highest traded price proportional to its lowest traded price. Control Open Interestit refers to the number of outstanding contracts from the previous session of trading for the control contract and Control Price Volatilityit is calculated as the natural logarithm of the day’s highest traded price proportional to its lowest traded price for the control contract. Nikkei 225 (OSE) is the control contract of Nikkei 225 (SGX). Taiwan Stock Index (TAIFEX) is the control contract of MSCI Taiwan (SGX). CNX Nifty (NSE) is the control contract of CNX Nifty (SGX). CSI 300 (CFFEX) is the control contract of FTSE China A50 (SGX). The period of analysis extends from 18 October 2010 to 17 October 2011.
Nikkei 225 (SGX) MSCI Taiwan (SGX) CNX Nifty (SGX) FTSE China A50 (SGX)
Panel A: Messages per Minute Coefficient T-Stat P-Value Coefficient T-Stat P-Value Coefficient T-Stat P-Value Coefficient T-Stat P-Value
Intercept 27.365 6.56 <.0001 89.550 21.20 <.0001 64.467 21.89 <.0001 31.727 20.60 <.0001 Colocation -2.972 -1.83 0.069 1.101 1.12 0.265 3.835 3.54 0.001 -3.287 -3.70 0.000 Open Interest 0.094 0.00 0.998 27.190 2.05 0.042 43.050 2.91 0.004 11.200 0.40 0.693 Price Volatility 70.619 0.59 0.557 192.238 2.73 0.007 132.267 2.82 0.005 1.704 0.05 0.959 Control Open Interest 44.190 1.84 0.067 -281.180 -4.55 <.0001 -0.643 -3.44 0.001 103.880 2.43 0.016 Control Price Volatility 337.609 2.80 0.006 518.418 5.95 <.0001 299.659 5.74 <.0001 232.675 6.13 <.0001 Earthquake 6.339 3.97 <.0001 Adj. R Squared 0.602 0.570 0.453 0.312 Panel B: Ln (Order to Trade) Intercept 0.410 4.85 <.0001 0.958 9.73 <.0001 1.187 9.21 <.0001 3.075 23.12 <.0001 Colocation 0.087 2.65 0.009 0.052 2.28 0.024 -0.050 -1.06 0.292 -0.284 -3.70 0.000 Open Interest -0.279 -0.46 0.646 -0.609 -1.97 0.050 0.126 0.19 0.846 -1.400 -0.57 0.568 Price Volatility -4.528 -1.86 0.064 -8.964 -5.46 <.0001 -8.876 -4.33 <.0001 -0.762 -0.27 0.788 Control Open Interest 0.338 0.69 0.488 1.200 0.83 0.407 0.021 2.53 0.012 -1.490 -0.40 0.688 Control Price Volatility -4.359 -1.78 0.076 -10.108 -4.98 <.0001 -9.971 -4.37 <.0001 -11.936 -3.65 0.000 Earthquake -0.063 -1.95 0.053 Adj. R Squared 0.570 0.605 0.324 0.159

Page | 82
Table 5-6 Combined High Frequency Trading Regression (Cont.)
Nikkei 225 (SGX) MSCI Taiwan (SGX) CNX Nifty (SGX) FTSE China A50 (SGX)
Panel C: Algo Trade Coefficient T-Stat P-Value Coefficient T-Stat P-Value Coefficient T-Stat P-Value Coefficient T-Stat P-Value Intercept -4.167 -9.68 <.0001 -2.625 -8.88 <.0001 -2.735 -13.72 <.0001 -0.502 -6.24 <.0001 Colocation 0.340 2.03 0.044 -0.148 -2.15 0.032 -0.428 -5.84 <.0001 -0.288 -6.20 <.0001 Open Interest -22.190 -7.18 <.0001 11.280 12.14 <.0001 7.910 7.91 <.0001 8.380 5.66 <.0001 Price Volatility -39.165 -3.16 0.002 -16.239 -3.30 0.001 -2.929 -0.92 0.357 -1.281 -0.75 0.454 Control Open Interest 18.240 7.38 <.0001 -4.420 -1.02 0.308 0.026 2.06 0.040 -1.400 -0.63 0.531 Control Price Volatility -7.163 -0.58 0.565 -21.089 -3.46 0.001 -18.202 -5.15 <.0001 -4.127 -2.08 0.038 Earthquake 0.649 3.95 0.000 Adj. R Squared 0.584 0.562 0.528 0.190

Page | 83
5.2.2. Liquidity
Table 5-7 presents the coefficients for the contract-specific regressions examining market liquidity.
Evidently, liquidity improvements are observed for the India-SGX and the China-SGX contracts,
despite declines in high frequency trading activity. Bid-ask spreads narrow for the India-SGX and
China-SGX contracts and the market depth measures of the China -SGX contract increase significantly.
Total depth levels of the India-SGX contract, however, report a significant decline. Frino, Mollica and
Webb (2013) find similar anomalous results for the SPI futures contract on the Australian Securities
Exchange. They suggest that co-location services may improve the efficiency with which market
participants are able to make markets, thereby increasing market liquidity, without additional high
frequency trading activity.
Conversely, the market liquidity of the Taiwan-SGX contract decline significantly despite greater HFT
levels. Bid-ask spreads widened significantly and both the best depth and total depth report lower levels.
A possible explanation for this result may be found in Hendershott, Jones and Menkveld (2011) and
Hagströmer and Nordén (2013). Hagströmer and Nordén (2013) put forward the argument that high
frequency market participants are a heterogeneous group of traders. Consequently, the impact that they
have on the market quality of financial bourses is contingent upon the trading strategies they utilise.
While HFT traders that employ market-making strategies primarily supply liquidity, those that employ
opportunistic strategies predominately demand liquidity (Hagströmer and Nordén, 2013). The evident
decline in liquidity, despite increased high frequency trading activity may reflect the type of traders
prevailing in the Taiwan-SGX market. HFTs in this contract may be primarily liquidity-demand,
opportunistic traders. Therefore a greater presence of HFTs causes a decline in market liquidity.
Furthermore, earlier results suggest that there is an overall decline in market quality. Price volatility is
significantly higher (Table 5-3 and Figure 5-2) and trading volumes are significantly lower (Table 5-3
and Figure 5-1) in the Taiwan-SGX contract. This is consistent with high frequency traders
implementing more opportunistic trading strategies than beneficial strategies such as market making.

Page | 84
Table 5-7 Contract-Specific Liquidity Regression
This table reports the coefficients for the following regressions: , , , , , , , , , , , , , , , , , , where Ln (Prop Spread)it represents the natural logarithm of the daily average proportional spread, Ln(Tick Spread)it represents the natural logarithm of the daily average tick spread and Ln(TW Spread)it represents the natural logarithm of the daily average time-weighted spread. Best Depthit refers to the daily average number of contracts available at the best bid and ask prices and Total Depthit refers to the daily average number of contracts available in the visible limit order book. Colocationit takes the value of 1 after the introduction of co-location services and, 0 otherwise. Open Interestit refers to the number of outstanding contracts from the previous session of trading and Price Volatilityit is calculated as the natural logarithm of the day’s highest traded price proportional to its lowest traded price. Results for the Singapore Exchange’s SiMSCI, Nikkei 225, MSCI Taiwan, CNX Nifty and FTSE ChinaA50 contracts are reported. The period of analysis extends from 18 October 2010 to 17 October 2011
SiMSCI Nikkei 225 MSCI Taiwan CNX Nifty FTSE China A50 Panel A: Ln (Proportional Spread) Coefficient T-Stat P-Value Coefficient T-Stat P-Value Coefficient T-Stat P-Value Coefficient T-Stat P-Value Coefficient T-Stat P-Value Intercept -8.137 -402.41 <.0001 -7.532 -295.09 <.0001 -7.993 -372.63 <.0001 -8.206 -152.63 <.0001 -6.956 -191.55 <.0001 Colocation 0.035 3.95 0.000 0.018 1.62 0.106 0.043 4.41 <.0001 -0.073 -2.97 0.003 -0.169 -5.65 <.0001 Open Interest 0.884 2.01 0.045 -0.498 -4.34 <.0001 -0.357 -2.70 0.007 -0.510 -1.97 0.051 -0.686 -0.67 0.500 Price Volatility 4.561 8.99 <.0001 1.700 8.47 <.0001 4.111 10.48 <.0001 4.954 4.78 <.0001 3.301 3.49 0.001 Earthquake 0.061 5.39 <.0001 Adj. R Squared 0.400 0.564 0.453 0.150 0.268 Panel B: Ln (Tick Spread) Intercept -5.126 -401.99 <.0001 -6.222 -2472.70 <.0001 -4.542 -553.66 <.0001 0.527 10.63 <.0001 2.288 68.50 <.0001 Colocation -0.022 -3.96 0.000 -0.007 -6.16 <.0001 0.007 1.90 0.058 -0.144 -6.40 <.0001 -0.221 -8.02 <.0001 Open Interest -0.046 -0.17 0.867 0.017 1.52 0.131 -0.208 -4.11 <.0001 -0.660 -2.76 0.006 -2.690 -2.88 0.004 Price Volatility 1.027 3.21 0.002 0.510 25.77 <.0001 0.778 5.19 <.0001 3.027 3.17 0.002 2.631 3.02 0.003 Earthquake 0.007 6.76 <.0001 Adj. R Squared 0.066 0.813 0.185 0.291 0.468 Panel C: Ln (Time-weighted Spread) Intercept -8.119 -354.47 <.0001 -7.535 -294.17 <.0001 -7.996 -373.02 <.0001 -7.728 -110.68 <.0001 -6.695 -147.49 <.0001 Colocation 0.020 1.98 0.049 0.019 1.73 0.085 0.044 4.51 <.0001 -0.143 -4.50 <.0001 -0.213 -5.69 <.0001 Open Interest 1.030 2.07 0.039 -0.496 -4.31 <.0001 -0.366 -2.77 0.006 -0.371 -1.10 0.272 1.370 1.08 0.282 Price Volatility 4.175 7.26 <.0001 1.664 8.26 <.0001 4.106 10.47 <.0001 2.476 1.84 0.067 3.436 2.91 0.004 Earthquake 0.060 5.29 <.0001 Adj. R Squared 0.277 0.560 0.455 0.134 0.201

Page | 85
Table 5-7 Contract-Specific Liquidity Regression (Cont.)
SiMSCI Nikkei 225 MSCI Taiwan CNX Nifty FTSE China A50 Panel D: Best Depth Coefficient T-Stat P-Value Coefficient T-Stat P-Value Coefficient T-Stat P-Value Coefficient T-Stat P-Value Coefficient T-Stat P-Value Intercept 3.039 43.18 <.0001 5.845 50.31 <.0001 4.839 74.13 <.0001 2.840 54.58 <.0001 3.905 97.39 <.0001 Colocation 0.137 4.47 <.0001 0.480 9.61 <.0001 -0.136 -4.64 <.0001 -0.008 -0.36 0.723 0.068 2.06 0.041 Open Interest -3.550 -2.33 0.021 0.657 1.26 0.210 0.588 1.46 0.145 0.735 2.93 0.004 1.620 1.45 0.150 Price Volatility -6.220 -3.52 0.001 -4.651 -5.09 <.0001 -8.175 -6.85 <.0001 0.010 0.01 0.992 -1.842 -1.76 0.079 Earthquake -0.634 -12.39 <.0001 Adj. R Squared 0.123 0.523 0.314 0.033 0.080 Panel E: Total Depth Intercept 6.140 98.07 <.0001 8.450 74.95 <.0001 7.982 148.15 <.0001 5.755 147.84 <.0001 6.347 146.72 <.0001 Colocation -0.028 -1.03 0.303 0.572 11.79 <.0001 -0.127 -5.24 <.0001 -0.054 -3.06 0.002 0.189 5.31 <.0001 Open Interest -7.620 -5.61 <.0001 1.370 2.71 0.007 -0.215 -0.65 0.519 -0.597 -3.18 0.002 4.720 3.90 0.000 Price Volatility -8.060 -5.13 <.0001 -5.550 -6.26 <.0001 -9.885 -10.03 <.0001 -0.438 -0.58 0.560 -3.560 -3.16 0.002 Earthquake -0.609 -12.28 <.0001 Adj. R Squared 0.259 0.549 0.470 0.149 0.380
Page | 86
Table 5-8 presents the coefficients for the market-wide regressions examining market liquidity. After
controlling for the liquidity of alternative trading venues, the results for the Taiwan-SGX, India-SGX
and the China-SGX contracts are largely in line with the results presented in Table 5-7. The liquidity of
the Japan-SGX contract shows significant improvements as evident by the narrowing of bid-ask spreads
and greater market depth levels. Earlier, it is shown that high frequency trading activity in this contract
increases following the introduction of co-location facilities. The improvement in liquidity, therefore,
suggests that the HFTs in the Japan-SGX contract are primarily liquidity-supplying market makers.
Finally, coefficients for the variables Ln(Control Prop Spread), Ln(Control Tick Spread), Ln(Control
Time-Weighted Spread), Control Best Depth and Control Total Depth variables are positive and
statistically significant. These results are observed for all treatment contracts. This suggests that
liquidity levels on Singapore’s futures market exhibit positive relationships with liquidity levels on
alternative trading venues. Correlated changes in liquidity are consistent with prior literature that
document commonality in liquidity across financial markets (Chordia, Roll and Subrahmanyam, 2000;
Domowitz, Hansch and Wang, 2005; Karolyi, Lee and Dijk, 2012) and for the stock index futures
markets (Frino, Mollica and Zhou, 2014).

Page | 87
Table 5-8 Market-Wide Liquidity Regression
This table reports the coefficients for the following regressions: , , , , , , , , , , , , , , , , , , , , where Ln (Prop Spread)it represents the natural logarithm of the daily average proportional spread, Ln(Tick Spread)it represents the natural logarithm of the daily average tick spread and Ln(TW Spread)it represents the natural logarithm of the daily average time-weighted spread. Best Depthit refers to the daily average number of contracts available at the best bid and ask prices and Total Depthit refers to the daily average number of contracts available in the visible limit order book. Colocationit takes the value of 1 after the introduction of co-location services and, 0 otherwise. Ln (Control Prop Spread)it represents the natural logarithm of the daily average proportional spread for the control contract, Ln(Control Tick Spread)it represents the natural logarithm of the daily average tick spread for the control contract and Ln(Control TW Spread)it represents the natural logarithm of the daily average time-weighted spread for the control contract. Best Depthit refers to the daily average number of contracts available at the best bid and ask prices and Total Depthit refers to the daily average number of contracts available in the visible limit order book. Nikkei 225 (OSE) is the control contract of Nikkei 225 (SGX). Taiwan Stock Index (TAIFEX) is the control contract of MSCI Taiwan (SGX). CNX Nifty (NSE) is the control contract of CNX Nifty (SGX). CSI 300 (CFFEX) is the control contract of FTSE China A50 (SGX). The period of analysis extends from 18 October 2010 to 17 October 2011.
Nikkei 225 (SGX) MSCI Taiwan (SGX) CNX Nifty (SGX) FTSE China A50 (SGX)
Panel A: Ln (Proportional Spread) Coefficient T-Stat P-Value Coefficient T-Stat P-Value Coefficient T-Stat P-Value Coefficient T-Stat P-Value Intercept -0.348 -5.34 <.0001 -2.561 -11.88 <.0001 -1.815 -2.72 0.007 -4.370 -8.88 <.0001 Colocation -0.015 -9.53 <.0001 0.021 3.59 0.000 -0.102 -5.59 <.0001 -0.156 -6.86 <.0001 Ln (Control Prop Spread) 1.049 111.56 <.0001 0.610 25.18 <.0001 0.694 9.56 <.0001 0.280 5.15 <.0001 Earthquake 0.012 6.76 <.0001 Adj. R Squared 0.989 0.784 0.328 0.313 Panel B: Ln (Tick Spread) Intercept 18.455 12.14 <.0001 -3.677 -28.90 <.0001 1.272 10.07 <.0001 3.751 10.62 <.0001 Colocation -0.010 -7.44 <.0001 0.005 1.51 0.134 -0.137 -7.23 <.0001 -0.230 -9.79 <.0001 Ln (Control Tick Spread) 3.570 16.22 <.0001 0.172 6.96 <.0001 0.557 6.46 <.0001 0.222 4.18 <.0001 Earthquake 0.008 5.53 <.0001 Adj. R Squared 0.651 0.201 0.362 0.474 Panel C: Ln (Time-weighted Spread) Intercept -0.305 -3.09 0.002 -2.711 -12.82 <.0001 -5.662 -6.98 <.0001 -4.760 -7.29 <.0001 Colocation -0.017 -6.96 <.0001 0.021 3.56 0.000 -0.166 -6.23 <.0001 -0.171 -5.78 <.0001 Ln (Control T-weighted Spread) 1.055 74.21 <.0001 0.593 24.98 <.0001 0.227 2.57 0.011 0.202 2.79 0.006 Earthquake 0.010 3.89 0.000 Adj. R Squared 0.976 0.783 0.147 0.195

Page | 88
Table 5-8 Market-Wide Liquidity Regression (Cont.)
Nikkei 225 (SGX) MSCI Taiwan (SGX) CNX Nifty (SGX) FTSE China A50 (SGX)
Panel D: Best Depth Coefficient T-Stat P-Value Coefficient T-Stat P-Value Coefficient T-Stat P-Value Coefficient T-Stat P-Value Intercept -0.111 -0.45 0.655 2.557 17.38 <.0001 1.382 1.76 0.079 3.612 29.10 <.0001 Colocation 0.134 4.34 <.0001 0.007 0.29 0.769 0.062 2.42 0.016 0.079 2.96 0.003 Control Best Depth 0.858 24.42 <.0001 0.609 15.37 <.0001 0.208 2.05 0.042 0.109 2.40 0.017 Earthquake -0.031 -0.79 0.430 Adj. R Squared 0.850 0.597 0.018 0.088 Panel E: Total Depth Intercept 0.807 2.42 0.016 5.139 22.48 <.0001 4.186 5.31 <.0001 5.711 31.65 <.0001 Colocation 0.141 4.18 <.0001 -0.071 -2.95 0.004 -0.049 -1.99 0.048 0.241 8.07 <.0001 Control Total Depth 0.825 23.62 <.0001 0.432 11.69 <.0001 0.157 1.83 0.068 0.150 3.81 0.000 Earthquake -0.203 -5.86 <.0001 Adj. R Squared 0.843 0.525 0.124 0.361

Page | 89
Table 5-9 presents the coefficients for the combined regressions examining market liquidity. After
controlling for open interest, price volatility, open interest of the control market and the price volatility
of the control market, the results are largely in line with the findings of the previous regression models.
Significantly narrower bid-ask spreads are observed for the Japan-SGX, India-SGX and China-SGX
contracts. The bid-ask spreads of the Taiwan-SGX contract, however, widen following the introduction
of co-location services. The best depth and total depth correspondingly increase in the Japan-SGX and
China-SGX contracts but decrease in the Taiwan-SGX contract. Significant changes in market depth are
not observed for the India-SGX contract. Finally, a robustness test is conducted where five trading days
prior to a contract’s maturity is deleted from the sample and the regression models are refitted. For the
results of the contract-specific, market-wide and combined regression analyses of market liquidity, refer
to Table A-6, Table A-7 and Table A-8.

Page | 90
Table 5-9 Combined Liquidity Regression
This table reports the coefficients for the following regressions: , , , , , , , , , , , , , , , , , , , , , , , , , , , , , , , , , , , where Ln (Prop Spread)it represents the natural logarithm of the daily average proportional spread, Ln(Tick Spread)it represents the natural logarithm of the daily average tick spread and Ln(TW Spread)it represents the natural logarithm of the daily average time-weighted spread. Best Depthit refers to the daily average number of contracts available at the best bid and ask prices and Total Depthit refers to the daily average number of contracts available in the visible limit order book. Colocationit takes the value of 1 after the introduction of co-location services and, 0 otherwise. Open Interestit refers to the number of outstanding from the previous session of trading and Price Volatilityit is calculated as the natural logarithm of the day’s highest traded price proportional to its lowest traded price. Control Open Interestit refers to the number of outstanding contracts from the previous session of trading for the control contract and Control Price Volatilityit is calculated as the natural logarithm of the day’s highest traded price proportional to its lowest traded price for the control contract. Nikkei 225 (OSE) is the control contract of Nikkei 225 (SGX). Taiwan Stock Index (TAIFEX) is the control contract of MSCI Taiwan (SGX). CNX Nifty (NSE) is the control contract of CNX Nifty (SGX). CSI 300 (CFFEX) is the control contract of FTSE China A50 (SGX). The period of analysis extends from 18 October 2010 to 17 October 2011.
Nikkei 225 (SGX) MSCI Taiwan (SGX) CNX Nifty (SGX) FTSE China A50 (SGX)
Panel A: Ln (Proportional Spread) Coefficient T-Stat P-Value Coefficient T-Stat P-Value Coefficient T-Stat P-Value Coefficient T-Stat P-Value Intercept -7.591 -268.91 <.0001 -7.901 -190.10 <.0001 -8.238 -100.24 <.0001 -6.955 -126.00 <.0001 Colocation 0.034 3.11 0.002 0.045 4.60 <.0001 -0.064 -2.10 0.037 -0.140 -4.40 <.0001 Open Interest -1.300 -6.44 <.0001 -0.363 -2.78 0.006 -0.673 -1.63 0.104 -0.759 -0.75 0.455 Price Volatility 0.106 0.13 0.897 4.802 6.94 <.0001 5.011 3.83 0.000 0.862 0.74 0.463 Control Open Interest 0.747 4.60 <.0001 -1.560 -2.57 0.011 0.003 0.51 0.611 -2.010 -1.31 0.191 Control Price Volatility 1.561 1.92 0.057 -1.142 -1.33 0.184 0.101 0.07 0.945 4.488 3.30 0.001 Earthquake 0.062 5.70 <.0001 Adj. R Squared 0.606 0.467 0.143 0.298 Panel B: Ln (Tick Spread) Intercept -6.225 -2171.40 <.0001 -4.547 -282.20 <.0001 0.439 5.82 <.0001 2.304 45.31 <.0001 Colocation -0.006 -5.15 <.0001 0.007 1.99 0.047 -0.118 -4.26 <.0001 -0.192 -6.53 <.0001 Open Interest -0.027 -1.34 0.183 -0.211 -4.16 <.0001 -1.130 -2.98 0.003 -2.830 -3.03 0.003 Price Volatility 0.331 4.01 <.0001 0.469 1.75 0.082 3.430 2.86 0.005 0.465 0.43 0.667 Control Open Interest 0.040 2.45 0.015 0.077 0.33 0.743 0.008 1.59 0.113 -2.300 -1.63 0.104 Control Price Volatility 0.180 2.18 0.031 0.467 1.41 0.161 -0.171 -0.13 0.898 3.891 3.11 0.002 Earthquake 0.007 6.74 <.0001 Adj. R Squared 0.820 0.185 0.292 0.489

Page | 91
Table 5-9 Combined Liquidity Regression (Cont.)
Nikkei 225 (SGX) MSCI Taiwan (SGX) CNX Nifty (SGX) FTSE China A50 (SGX)
Panel C: Ln (Time-weighted Spread) Coefficient T-Stat P-Value Coefficient T-Stat P-Value Coefficient T-Stat P-Value Coefficient T-Stat P-Value Intercept -7.595 -268.49 <.0001 -7.904 -190.43 <.0001 -7.802 -73.36 <.0001 -6.735 -96.54 <.0001 Colocation 0.036 3.25 0.001 0.045 4.69 <.0001 -0.126 -3.21 0.002 -0.195 -4.85 <.0001 Open Interest -1.320 -6.49 <.0001 -0.371 -2.84 0.005 -0.678 -1.27 0.205 1.500 1.17 0.245 Price Volatility 0.080 0.10 0.922 4.858 7.03 <.0001 1.573 0.93 0.354 1.172 0.79 0.430 Control Open Interest 0.762 4.69 <.0001 -1.570 -2.58 0.011 0.005 0.75 0.451 -0.489 -0.25 0.801 Control Price Volatility 1.549 1.90 0.059 -1.232 -1.44 0.151 2.123 1.13 0.261 4.415 2.57 0.011 Earthquake 0.061 5.62 <.0001 Adj. R Squared 0.603 0.470 0.133 0.218 Panel D: Best Depth Intercept 6.242 50.49 <.0001 4.789 38.41 <.0001 2.775 34.97 <.0001 3.872 62.54 <.0001 Colocation 0.377 7.83 <.0001 -0.151 -5.20 <.0001 0.010 0.35 0.729 0.042 1.17 0.243 Open Interest 5.730 6.45 <.0001 0.675 1.72 0.087 0.401 1.01 0.315 1.820 1.60 0.111 Price Volatility -0.647 -0.18 0.856 -1.649 -0.79 0.428 0.195 0.15 0.877 -0.247 -0.19 0.851 Control Open Interest -4.760 -6.70 <.0001 0.884 0.48 0.628 0.005 1.08 0.280 2.410 1.41 0.161 Control Price Volatility -3.604 -1.01 0.314 -9.666 -3.76 0.000 0.076 0.05 0.957 -2.737 -1.80 0.074 Earthquake -0.650 -13.74 <.0001 Adj. R Squared 0.601 0.352 0.029 0.090 Panel E: Total Depth Intercept 8.826 74.13 <.0001 8.041 77.12 <.0001 5.671 96.42 <.0001 6.293 94.79 <.0001 Colocation 0.471 10.16 <.0001 -0.133 -5.49 <.0001 -0.027 -1.27 0.207 0.152 3.97 <.0001 Open Interest 6.320 7.40 <.0001 -0.174 -0.53 0.597 -1.080 -3.66 0.000 5.040 4.13 <.0001 Price Volatility 1.172 0.34 0.733 -5.764 -3.32 0.001 0.494 0.53 0.598 -1.454 -1.03 0.304 Control Open Interest -4.620 -6.75 <.0001 -0.980 -0.64 0.521 0.008 2.10 0.036 3.570 1.94 0.054 Control Price Volatility -6.420 -1.87 0.063 -6.213 -2.89 0.004 -1.160 -1.11 0.267 -3.543 -2.17 0.031 Earthquake -0.620 -13.63 <.0001 Adj. R Squared 0.628 0.486 0.162 0.395

Page | 92
6. CONCLUSION
On 18 April 2011, the Singapore Exchange introduced co-location facilities to its derivatives and
equities market to promote high frequency trading and enhance market accessibility. This infrastructural
development allows latency-sensitive market participants to situate their trading systems in the same
data centre as the exchange’s trading, market data and clearing engines. The physical proximity of a
trader’s order management system to the exchange’s engines increases the speed of access and therefore
reduces the time it takes for traders to execute their trading decisions. High frequency trading is a
controversial issue as there is a lack of agreement in empirical literature regarding its impact on market
quality. While a line of research document its beneficial impact on market quality (e.g. Brogaard, 2010;
Hendershott, Jones and Menkveld, 2011; Riordan and Storkenmaier, 2012; Hagströmer and Nordén,
2013), other studies find that it degrades the quality of financial exchanges (Kirilenko, Kyle, Samadi
and Tuzun, 2011; Jarrow and Protter, 2012; Boehmer, Fong and Wu, 2012; Lee, 2013).
This thesis examines how the introduction of co-location services impacts high frequency trading and
market quality on the Singapore’s stock-index futures market. Increases in the pervasiveness of HFT
trading are observed for the Nikkei 225 and MSCI Taiwan index futures contracts. HFT presence in the
CNX Nifty and the CSI 300 index futures contracts, however, decline following the infrastructural
change. The results suggest that co-location services attract more trading interest from high frequency
traders on dual-listed stock index futures markets if there are cross-border profit opportunities i.e.
markets with alternative trading venues that have HFT presence. Furthermore, analogous to Menkveld
(2013), this thesis presents evidence of cross-border HFT trading. An increase in high frequency trading
activity on the alternative venue is found to increase high frequency trading on Singapore’s stock index
futures market. This result is consistent across all futures contracts and proxies examined. It suggests
that dual-listed futures contracts do not compete for HFT order flow but market participants on stock
index futures bourses engage in cross-border arbitrage trading strategies.

Page | 93
The impacts that co-location services have on the market quality of the two futures contracts that exhibit
significant increases in HFT activity, differ. Co-location services generate more trading activity,
improve the liquidity and ease the volatility of the Nikkei 224 index futures market. The market quality
of the MSCI Taiwan index futures market, however, deteriorates as evident by the decrease in trading
activity, decline in liquidity and increase in price volatility. The different response to co-location
services may reflect the different types of trading prevailing in the futures contracts. Hagströmer and
Nordén (2013) put forward the argument that HFT market participants are a heterogeneous group of
traders. Therefore, the impact that they have on the market quality of financial bourses is contingent
upon the trading strategies they utilise. The results suggest that HFTs in the Nikkei 225 index futures
contract are primarily liquidity-supplying market makers while HFTs in the MSIC Taiwan index futures
contract are primarily liquidity-demanding opportunistic traders.
This thesis also finds that changes in the liquidity of the alternative trading venue explain changes in the
liquidity of Singapore's stock-index futures market. A decrease (increase) in the bid-ask spread (depth)
of the home market contract leads to a decrease (increase) in the bid-ask spread (depth) of the satellite
market contract. This finding is consistent with prior literature that document commonality in liquidity
across financial markets (Chordia, Roll and Subrahmanyam, 2000; Domowitz, Hansch and Wang, 2005;
Karolyi, Lee and Dijk, 2012) and for the stock index futures markets (Frino, Mollica and Zhou, 2014).
Finally, results suggest that high frequency trading on Singapore's derivatives market is contingent upon
prevailing market conditions. That is, HFTs reduce their presence in the market when price volatility
increases. This finding, which is consistent with Brogaard (2010), has important policy implications as
it suggests that low latency market participants are less active during unfavourable conditions. The
collective withdrawal of traders is found to have contributed to the liquidity shortage in the equities
market during the Flash Crash (SEC and CFTC, 2010). It may a factor to consider when exchanges
implement new policies pertaining to HFT.
Page | 94
REFERENCES
Angel, J. J. and D. McCabe, 2013, Fairness in financial markets: The case of high frequency trading, Journal of Business Ethics 112, 585-595.
Aldridge, I., 2009, Measuring accuracy of trading strategies, Journal of Trading 4, 17-25.
Barrales, E. O., 2012, Lessons from the Flash Crash for the regulation of high frequency traders, Fordham Journal of Corporate & Financial Law 17, 1195-1262.
Benveniste, L., A. Marcus and W. Wilhelm, 1992, What’s special about the specialist?, Journal of Financial Economics 32, 61-86.
Berkman, H. and O.W. Steenbeek, 1998, The influence of daily price limits on trading in Nikkei futures, The Journal of Futures Markets 18, 265-279.
Biais, B., T. Foucault and S. Moinas, 2013, Equilibrium fast trading, Working paper, University of Toulouse.
Board, J. and C. Sutcliffe, 1996, The dual listing of stock index futures: Arbitrage, spread arbitrage, and currency risk, The Journal of Futures Markets 16, 29-54.
Boehmer, E., K. Y. L. Fong and J. Wu, 2012, Algorithmic trading and changes in firms’ equity capital, FIRN Research Paper.
Boehmer, E., R. Jennings and L. Wei, 2007, Public disclosure and private decisions: The case of equity market quality, Review of Financial Studies 20, 315-358.
Booth, G. G., T. Lee and Y. Tse, 1996, International linkages in Nikkei Stock Index futures markets, Pacific-Basin Finance Journal 4, 59-76.
Brennan, M. J. and E. S. Schwartz, 1990, Arbitrage in stock index futures, Journal of Business 63, S7-S31.

Page | 95
Brogaard, J. A., 2010, High frequency trading and its impact on market quality, Working paper, Northwestern University School of Law.
Brogaard, J. A., B. Hagströmer, L. Nordén and R. Riordan, 2013, Trading fast and slow: Colocation and Market Quality, Working paper.
Carrion, Allen, 2013, Very fast money: High frequency trading on the NASDAQ, Journal of Financial Markets 16, 680-711.
CFTC and SEC, 2010, Findings regarding the market events of May 6, 2010: Report of the staffs of the CFTC and SEC to the Joint Advisory Committee on Emergency Regulatory Issues, September 30, 2010.
Chaboud, A., B. Chiquoine, E. Hjalmarsson and C. Vega, 2014, Rise of the machines: Algorithmic trading in the foreign exchanges market, Journal of Finance, forthcoming.
Chen, Y.L. and Y.F. Gau, 2009, Tick sizes and relative rates of price discovery in stock, futures, and options markets: Evidence from the Taiwan Stock Exchange, The Journal of Futures Markets 29, 74-93.
Chng, M. T., 2004, A model of price discovery and market design: Theory and empirical evidence, Journal of Futures Markets 24, 1107-1146.
Chordia, T., R. Roll and A. Subrahmanyam, 2000, Commonality in liquidity, Journal of Financial Economics 56, 3-28.
Chou, R. and J.H. Lee, 2002, The relative efficiencies of price execution between the Singapore Exchange and the Taiwan Futures Exchange, The Journal of Futures Markets 22, 173-196.
Chowdhry, B. and V. Nanda, 1991, Multimarket trading and market liquidity, Review of Financial Studies 4, 483-511.
Chung, H. and M.M Hseu, 2008, Expiration day effects of Taiwan index futures: The case of the Singapore and Taiwan futures exchanges, Journal of International Financial Markets, Institutions and Money, 18, 107-120.

Page | 96
Copeland, T. E., and D. Galai, 1983, Information effects on the bid-ask spread, Journal of Finance 38, 1457-1469.
Covrig, V., D. K. Ding and B. S. Low, 2004, The contribution of a satellite market to price discovery: Evidence from the Singapore exchange, Journal of Futures Markets 24, 981-1004.
Demsetz, H., 1968, The cost of transacting, The Quarterly Journal of Economics 82, 33-53.
Ding, D.K., F.H. Harris, S.T. Lau and T.H. McInish, 1999, An investigation of price discovery in informationally-linked markets: Equity trading in Malaysia and Singapore, Journal of Multinational Financial Management 9, 317-329.
Domowitz, I., J. Glen and A. Madhavan, 1998, International cross-listing and order flow migration: Evidence from an emerging market, The Journal of Finance 53, 2001-2027.
Domowitz, I., O. Hansch and X. Wang, Liquidity commonality and return co-movement, Journal of Financial Markets 8, 351-376.
Ederington, L. H. and J. H. Lee, 1993, How markets process information: News releases and volatility, Journal of Finance 48, 1161-1191.
Fleming, J., B. Ostdiek and R.E. Whaley, 1996, Trading costs and the relative rates of price discovery in stock, futures and options markets, Journal of Futures Market 16, 353-387.
Fleming, M. J. and E. M. Remolona, 1997, What moves the bond market?, Economic Policy Review 3, 31-50.
Foucault, T. and A. J. Menkveld, 2008, Competition for order flow and smart order routing systems, Journal of Finance 63, 119-158.
Frino, A., F.H. Harris, A. Lepone and J.B. Wong, 2013, The relationship between satellite and home market volumes: Evidence from cross-listed Singapore futures contracts, Pacific-Basin Finance Journal 24, 301-311.

Page | 97
Frino, A., V. Mollica and R. I. Webb, 2014, The impact of co‐location of securities exchanges’ and traders’ computer servers on market liquidity, Journal of Futures Markets 34, 20-33
Frino, A., V. Mollica and Z. Zhou, 2013, Commonality in liquidity across international borders: Evidence from futures markets, Journal of Futures Markets 34, 807-818.
Fung, H. G., W. K. Leung and X. E. Xu, 2001, Information role of U.S. futures trading in a global financial market, Journal of Futures Markets 21, 1071-1090.
Garbade, K.D. and W.L. Silber, 1979, Dominant and satellite markets: A study of dually-traded securities, The Review of Economics and Statistics 61, 455-460.
Garvey, R. and F. Wu, 2010, Speed, distance, and electronic trading: New evidence on why location matters, Journal of Financial Markets 13, 367-396.
Gomber, P., B. Arndt, M. Lutat and T. Uhle, 2011, High frequency trading, Working paper, Goethe University Frankfurt.
Hagströmer, B. and L. Nordén, 2013, The diversity of high frequency traders, Journal of Financial Markets 16, 741-770.
Harris, F.H., T.H. McInish and R.A. Wood, 2002, Security price adjustment across exchanges: An investigation of common factor components for Dow stocks, Journal of Financial Markets 5, 277-308.
Hasbrouck, J. and G. Saar, 2013, Low-latency trading, Journal of Financial Markets 16, 646-679.
Hau, H., 2001, Location matters: An examination of trading profits, Journal of Finance 56, 1959-1983.
Hua, R. and B. Chen, 2007, International linkages of the Chinese futures markets, Applied Financial Economics 17, 1275-1287.
Hauser, S., Y. Tanchuma and U. Yaari, 1998, International transfer of pricing information between dually listed stocks, The Journal of Financial Research 21, 139-157.

Page | 98
Hendershott, T., C. M. Jones and A. J. Menkveld, 2011, Does algorithmic trading improve liquidity?, Journal of Finance 66, 1-33.
Hendershott, T. and R. Riordan, 2013, Algorithmic trading and the market for liquidity, Journal of Financial and Quantitative Analysis 48, 1001-1024.
Hendershott,T. and R. Riordan, 2014, High frequency trading and price discovery, Review of Financial Studies, Forthcoming.
Hsieh, S.F. and T. Ma, 2009, Expiration-day effects: Does settlement price matter?, International Review of Economics and Finance 18, 290-300.
Hsieh, W.G., 2004, Regulatory changes and information competition: The case of Taiwan index futures, The Journal of Futures Markets 24, 399-412.
Huang, R. and H. Stoll, 1996, Dealer versus auction markets: A paired comparison of execution costs on NASDAQ and the NYSE, Journal of Financial Economics 41, 313-358.
Ivković, Z. and S. Weisbenner, 2005, Local does as local is: Information content of the geography of individual investors’ common stock investments, Journal of Finance 60, 267-306.
Jarrow, R. A. and P. Protter, 2012, A dysfunctional role of high frequency trading in electronic markets, International Journal of Theoretical and Applied Finance 15, 1250022-1-1250022-15.
Karolyi, G. A., K. H. Lee and M. A. van Dijk, 2012, Understanding commonality in liquidity around the world, Journal of Financial Economics 105, 82-112.
Kirilenko, A. A., A. S. Kyle, M. Samadi and T. Tuzun, 2011, The Flash Crash: The impact of high frequency trading on an electronic market, Working paper.
Koontz, S.R., P. Garcia and M.A. Hudson, 1990, Dominant-satellite relationships between live cattle cash and futures markets, The Journal of Futures Markets 10, 123-136.
Kosinski, R.J., 2012, A literature review on reaction time, Working paper, Clemson University.

Page | 99
Lau, S.T. and T. McInish, 2002, Cross-listings and home market trading volume: The case of Malaysia and Singapore, Journal of Financial Research 25, 477-484.
Lee, E. J., 2013, High frequency trading in the Korean index futures market, Journal of Futures Markets, forthcoming.
Martinez, V. H. and I. Rosu, 2013, High frequency traders, news and volatility, Working paper.
McInish, T. H. and J. Upson, 2011, Strategic liquidity supply in a market with fast and slow traders, Working paper, University of Memphis.
McInish, T. H. and R. A. Wood, 1992, An analysis of intraday patterns in bid/ask spreads for NYSE stocks, Journal of Finance 47, 753-764.
Menkveld, A. J., 2013, High frequency traders and the new market makers, Journal of Financial Markets 16, 712-740.
Parkinson, M., 1980, The extreme value method for estimating the variance of the rate of return, Journal of Business 53, 61-66.
Parlour, C. A. and D.J. Seppi, 2003, Liquidity-based competition for order flow, Review of Financial Studies 16, 301-343.
Pennings, J.M.E., R.M. Leuthold, 2001, Introducing new futures contracts: Reinforcement versus Cannibalism, Journal of International Money Finance 20, 659-675.
Riordan, R. and A. Storkenmaier, 2012, Latency, liquidity and price discovery, Journal of Financial Markets 15, 416-437.
Roope, M. and R. Zurbruegg, 2002, The intra-day price discovery process between the Singapore Exchange and Taiwan Futures Exchange, The Journal of Futures Markets 22, 219-240.
Subrahmanyam, A., 1994, Circuit breakers and market volatility: A theoretical perspective, The Journal of Finance, 49, 237-254.

Page | 100
Stoll, H. R., 1978, The supply of dealer services in securities markets, Journal of Finance 33, 1133-1151.
Wang, G. H. K., J. Yau and T. Baptiste, 1997, Trading volume and transaction costs in futures markets, Journal of Futures Markets 17, 757-780.
Webb, R.I., J. Muthuswamy and R. Segara, 2007, Market microstructure effects on volatility at the TAIFEX, Journal of Futures Markets 27, 1219-1243.
Xu, X.E. and H.G. Fung, 2002, Information flows across markets: Evidence from China-backed stocks dual-listed in Hong Kong and New York, The Financial Review 37, 563-588.
Zhang, F., 2010, High frequency trading, stock volatility, and price discovery, Working paper, Yale School of Management.
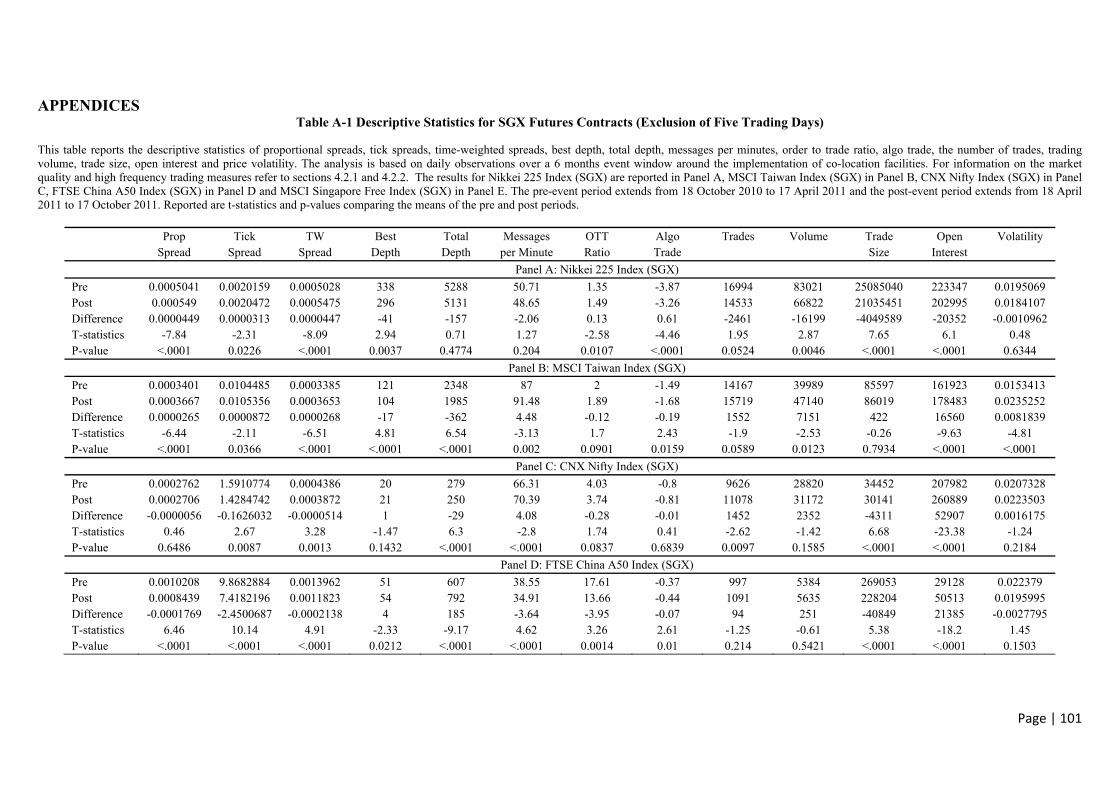
Page | 101
APPENDICES Table A-1 Descriptive Statistics for SGX Futures Contracts (Exclusion of Five Trading Days)
This table reports the descriptive statistics of proportional spreads, tick spreads, time-weighted spreads, best depth, total depth, messages per minutes, order to trade ratio, algo trade, the number of trades, trading volume, trade size, open interest and price volatility. The analysis is based on daily observations over a 6 months event window around the implementation of co-location facilities. For information on the market quality and high frequency trading measures refer to sections 4.2.1 and 4.2.2. The results for Nikkei 225 Index (SGX) are reported in Panel A, MSCI Taiwan Index (SGX) in Panel B, CNX Nifty Index (SGX) in Panel C, FTSE China A50 Index (SGX) in Panel D and MSCI Singapore Free Index (SGX) in Panel E. The pre-event period extends from 18 October 2010 to 17 April 2011 and the post-event period extends from 18 April 2011 to 17 October 2011. Reported are t-statistics and p-values comparing the means of the pre and post periods.
Prop Tick TW Best Total Messages OTT Algo Trades Volume Trade Open Volatility Spread Spread Spread Depth Depth per Minute Ratio Trade Size Interest
Panel A: Nikkei 225 Index (SGX)
Pre 0.0005041 0.0020159 0.0005028 338 5288 50.71 1.35 -3.87 16994 83021 25085040 223347 0.0195069 Post 0.000549 0.0020472 0.0005475 296 5131 48.65 1.49 -3.26 14533 66822 21035451 202995 0.0184107 Difference 0.0000449 0.0000313 0.0000447 -41 -157 -2.06 0.13 0.61 -2461 -16199 -4049589 -20352 -0.0010962 T-statistics -7.84 -2.31 -8.09 2.94 0.71 1.27 -2.58 -4.46 1.95 2.87 7.65 6.1 0.48 P-value <.0001 0.0226 <.0001 0.0037 0.4774 0.204 0.0107 <.0001 0.0524 0.0046 <.0001 <.0001 0.6344
Panel B: MSCI Taiwan Index (SGX)
Pre 0.0003401 0.0104485 0.0003385 121 2348 87 2 -1.49 14167 39989 85597 161923 0.0153413 Post 0.0003667 0.0105356 0.0003653 104 1985 91.48 1.89 -1.68 15719 47140 86019 178483 0.0235252 Difference 0.0000265 0.0000872 0.0000268 -17 -362 4.48 -0.12 -0.19 1552 7151 422 16560 0.0081839 T-statistics -6.44 -2.11 -6.51 4.81 6.54 -3.13 1.7 2.43 -1.9 -2.53 -0.26 -9.63 -4.81 P-value <.0001 0.0366 <.0001 <.0001 <.0001 0.002 0.0901 0.0159 0.0589 0.0123 0.7934 <.0001 <.0001
Panel C: CNX Nifty Index (SGX)
Pre 0.0002762 1.5910774 0.0004386 20 279 66.31 4.03 -0.8 9626 28820 34452 207982 0.0207328 Post 0.0002706 1.4284742 0.0003872 21 250 70.39 3.74 -0.81 11078 31172 30141 260889 0.0223503 Difference -0.0000056 -0.1626032 -0.0000514 1 -29 4.08 -0.28 -0.01 1452 2352 -4311 52907 0.0016175 T-statistics 0.46 2.67 3.28 -1.47 6.3 -2.8 1.74 0.41 -2.62 -1.42 6.68 -23.38 -1.24 P-value 0.6486 0.0087 0.0013 0.1432 <.0001 <.0001 0.0837 0.6839 0.0097 0.1585 <.0001 <.0001 0.2184
Panel D: FTSE China A50 Index (SGX)
Pre 0.0010208 9.8682884 0.0013962 51 607 38.55 17.61 -0.37 997 5384 269053 29128 0.022379 Post 0.0008439 7.4182196 0.0011823 54 792 34.91 13.66 -0.44 1091 5635 228204 50513 0.0195995 Difference -0.0001769 -2.4500687 -0.0002138 4 185 -3.64 -3.95 -0.07 94 251 -40849 21385 -0.0027795 T-statistics 6.46 10.14 4.91 -2.33 -9.17 4.62 3.26 2.61 -1.25 -0.61 5.38 -18.2 1.45 P-value <.0001 <.0001 <.0001 0.0212 <.0001 <.0001 0.0014 0.01 0.214 0.5421 <.0001 <.0001 0.1503

Page | 102
Table A-1 Descriptive Statistics for SGX Futures Contracts (Exclusion of Five Trading Days) (Cont.)
Prop Tick TW Best Total Messages OTT Algo Trades Volume Trade Open Volatility Spread Spread Spread Depth Depth per Minute Ratio Trade Size Interest
Panel E: MSCI Singapore Index (SGX)
Pre 0.0003236 0.0060184 0.0003296 17 282 39.62 3.61 -0.38 5816 7888 100443 48682 0.0131952 Post 0.0003477 0.0059371 0.0003484 18 272 51.51 3.19 -0.43 8826 11698 90823 47393 0.0201596 Difference 0.000024 -0.0000813 0.0000188 2 -10 11.88 -0.41 -0.04 3010 3810 -9621 -1289 0.0069644 T-statistics -6.25 2.23 -4.72 -2.51 1.14 -9.58 5.27 3.47 -7.86 -6.98 7.79 1.59 -5.37 P-value <.0001 0.0274 <.0001 0.0129 0.2542 <.0001 <.0001 0.0006 <.0001 <.0001 <.0001 0.114 <.0001

Page | 103
Table A-2 Descriptive Statistics of Daily Log Ratios (Exclusion of Five Trading Days)
This table reports the descriptive statistics of the daily log ratios for the variables: proportional spreads, tick spreads, time-weighted spreads, best depth, total depth, messages per minutes, order to trade ratio, algo trade, the number of trades, trading volume, trade size, open interest and price volatility. For further information on the market quality and high frequency measures assessed see sections 4.2.1 and 4.2.2. Daily log ratios are calculated as the natural log of daily measures for each treatment contract divided by the daily measures of its respective control contract. Panel A provides the results for the Nikkei 225 Index (SGX) and its control contract, the Nikkei 225 Index (OSE). Panel B provides the results for the MSCI Taiwan Index (SGX) and its control contract, the Taiwan Stock Index (TAIFEX). Panel C provides the results for the CNX Nifty Index (SGX) and its control contract, the CNX Nifty Index (NSE). Panel D provides the results for the FTSE China A50 Index (SGX) and its control contract, the China Shanghai Shenzhen 300 Stock Index (CFFEX). The event window extends 6 months around the implementation of co-location facilities with the pre-event period extending from 18 October 2010 to 17 April 2011 and the post-event period extending from 18 April 2011 to 17 October 2011. Reported are t-statistics and p-values for comparing the means of the pre-event and post-event periods.
Prop Tick TW Best Total Messages OTT Algo Trades Volume Trade Open Volatility Spread Spread Spread Depth Depth per Minute Ratio Trade Size Interest
Panel A: Japan [Nikkei 225 Index (SGX) / Nikkei 225 Index (OSE)]
Pre -0.68521 0.70108 -0.68207 -1.10336 -0.88468 -1.13183 -2.1829 1.31142 1.30684 0.43536 -1.56468 -0.37681 1.10996 Post -0.68733 0.69894 -0.68656 -0.96345 -0.92517 -0.51348 -1.92587 0.99912 1.48997 0.56322 -1.61991 -0.31033 1.018 Difference -0.00212 -0.00214 -0.0045 0.13991 -0.0405 0.61835 0.25703 -0.3123 0.18313 0.12786 -0.05522 0.06648 -0.09196 T-statistics 1.69 1.69 2.7 -8.91 2.32 -15.2 -8.41 9.66 -9.83 -8.57 3.07 -8.54 3.48 P-value 0.0935 0.0941 0.0078 <.0001 0.0216 <.0001 <.0001 <.0001 <.0001 <.0001 0.0024 <.0001 0.0007
Panel B: Taiwan [MSCI Taiwan Index (SGX) / Taiwan Stock Index (TAIFEX)]
Pre 0.92353 0.58286 0.92649 1.06061 1.54611 -0.72522 0.32432 -0.23503 -1.04954 -0.96025 -3.94032 0.98752 1.46471 Post 0.90166 0.55287 0.9011 1.22868 1.69317 -0.66838 0.54915 -0.35088 -1.21753 -1.01926 -3.83933 1.09612 1.57021 Difference -0.02186 -0.02999 -0.02539 0.16807 0.14706 0.05684 0.22483 -0.11585 -0.16799 -0.05901 0.10099 0.1086 0.10551 T-statistics 1.97 2.69 2.2 -4.75 -3.62 -4.15 -7.52 3.84 5.04 1.78 -4.97 -6.03 -1.06 P-value 0.052 0.0085 0.0304 <.0001 0.0004 <.0001 <.0001 0.0002 <.0001 0.0788 <.0001 <.0001 0.2914
Panel C: India [CNX Nifty Index (SGX) / CNX Nifty Index (NSE)]
Pre 0.99212 1.90807 1.43796 -4.72286 -3.57033 0.12688 1.23477 -7.21475 -0.75519 -6.73517 -9.19918 -4.73784 1.19889 Post 0.88403 1.79959 1.23325 -4.53362 -3.44566 0.19947 1.12619 -6.98571 -0.5671 -6.42662 -9.07887 -4.49889 1.31119 Difference -0.10809 -0.10847 -0.2047 0.18923 0.12466 0.07258 -0.10858 0.22905 0.18809 0.30855 0.12031 0.23895 0.1123 T-statistics 5.25 5.27 5.57 -7.29 -6.25 -5.04 2.98 -5.33 -4.23 -7.81 -2.92 -16.99 -2.25 P-value <.0001 <.0001 <.0001 <.0001 <.0001 <.0001 0.0033 <.0001 <.0001 <.0001 0.004 <.0001 0.0257
Panel D: China [FTSE China A50 Index (SGX) / China Shanghai Shenzhen 300 Stock Index (CFFEX)]
Pre 2.23532 9.02879 2.53769 1.05951 1.64921 -1.10784 2.69672 -2.92859 -3.49656 -3.72843 -1.62677 0.10229 1.01485 Post 2.07864 8.88079 2.37479 0.99166 1.68954 -1.16502 2.34034 -2.59978 -3.2198 -3.47924 -1.64576 0.56929 1.24616 Difference -0.15668 -0.148 -0.1629 -0.06785 0.04033 -0.05718 -0.35638 0.32881 0.27676 0.24919 -0.01899 0.46701 0.23131 T-statistics 5.39 5.11 3.84 1.8 -1.11 2.14 4.59 -3.98 -3.2 -2.88 0.35 -9.62 -2.44 P-value <.0001 <.0001 0.0002 0.075 0.2713 0.0346 <.0001 0.0001 0.0018 0.0048 0.7282 <.0001 0.0166

Page | 104
Table A-3 Contract-Specific High Frequency Trading Regression (Exclusion of Five Trading Days)
This table reports the coefficients for the following regressions: , , , , , , , , , , , , , , , where Messages per Minuteit represents the daily average number of messages submitted over a one-minute interval, Ln (Order to Trade)it represents the log of the daily average number of messages per trade and Algo Tradeit represents the daily average number of messages that has been standardised by trading volume. Colocationit takes the value of 1 after the introduction of co-location services and, 0 otherwise. Open Interestit refers to the number of outstanding contracts from the previous session of trading and Price Volatilityit is calculated as the natural logarithm of the day’s highest traded price proportional to its lowest traded price. Results for the Singapore Exchange’s SiMSCI, Nikkei 225, MSCI Taiwan, CNX Nifty and FTSE ChinaA50 are reported. The period of analysis extends from 18 October 2010 to 17 October 2011.
SiMSCI (SGX) Nikkei 225 (SGX) MSCI Taiwan (SGX) CNX Nifty (SGX) FTSE China A50 (SGX)
Panel A: Messages Per Minute
Coefficient T-Stat P-Value Coefficient T-Stat P-Value Coefficient T-Stat P-Value Coefficient T-Stat P-Value Coefficient T-Stat P-Value Intercept 21.007 5.33 <.0001 25.512 6.24 <.0001 99.080 9.66 <.0001 31.599 5.39 <.0001 33.017 16.50 <.0001 Colocation 7.649 8.11 <.0001 -3.292 -2.02 0.0445 3.064 1.55 0.1241 -1.181 -0.69 0.4915 -2.847 -1.62 0.1079 Open Interest 207.180 2.47 0.0143 71.500 3.88 0.0001 -128.980 -2.05 0.0429 126.900 4.42 <.0001 36.510 0.58 0.5627 Price Volatility 646.519 12.38 <.0001 394.511 13.39 <.0001 477.702 7.77 <.0001 401.126 8.19 <.0001 197.172 4.00 0.0001 Earthquake 6.675 4.03 <.0001 Adj. R Squared 0.6915 0.6001 0.4287 0.4732 0.1496
Panel B: Ln (Order to Trade)
Intercept 1.416 17.06 <.0001 0.406 5.05 <.0001 1.152 5.27 <.0001 1.934 8.20 <.0001 3.574 24.42 <.0001 Colocation -0.038 -1.91 0.0576 0.097 3.03 0.0028 0.101 2.41 0.0178 0.008 0.12 0.9075 0.078 0.60 0.5466 Open Interest 0.388 0.22 0.8265 0.267 0.74 0.4624 -1.490 -1.11 0.2682 -1.110 -0.96 0.3381 -17.360 -3.78 0.0003 Price Volatility -12.319 -11.19 <.0001 -8.806 -15.19 <.0001 -15.910 -12.15 <.0001 -16.759 -8.50 <.0001 -13.058 -3.62 0.0005 Earthquake -0.076 -2.34 0.0202 Adj. R Squared 0.5110 0.5905 0.5894 0.3219 0.3194
Panel C: Algo Trade
Intercept -0.363 -8.67 <.0001 -2.929 -8.06 <.0001 -0.296 -0.68 0.4974 -0.480 -2.17 0.0311 -0.051 -0.90 0.3727 Colocation 0.005 0.53 0.5956 0.094 0.65 0.5177 0.216 2.58 0.0113 0.011 0.18 0.8588 0.056 1.12 0.2667 Open Interest 1.350 1.51 0.1320 -0.714 -0.44 0.6638 -3.960 -1.49 0.1404 -0.217 -0.20 0.8417 -7.070 -3.95 0.0001 Price Volatility -6.595 -11.90 <.0001 -45.130 -17.22 <.0001 -37.589 -14.45 <.0001 -13.179 -7.14 <.0001 -4.910 -3.49 0.0007 Earthquake 0.412 2.80 0.0057 Adj. R Squared 0.4863 0.6202 0.6751 0.2285 0.2947

Page | 105
Table A-4 Market-Wide High Frequency Trading Regression (Exclusion of Five Trading Days)
This table reports the coefficients for the following regressions: , , , , , , , , , , , , where Messages per Minuteit represents the daily average number of messages submitted over a one-minute interval, Ln (Order to Trade)it represents the log of the daily average number of messages per trade and Algo Tradeit represents the daily average number of messages that has been standardised by trading volume. Colocationit takes the value of 1 after the introduction of co-location services and, 0 otherwise. Control Messages per Minuteit represents the daily average number of messages submitted over a one-minute interval for the control contract, Ln (Control Order to Trade)it represents the log of the daily average number of messages per trade for the control contract and Control Algo Tradeit represents the daily average number of messages that has been standardised by trading volume for the control contract. Nikkei 225 (OSE) is the control contract of Nikkei 225 (SGX). Taiwan Stock Index (TAIFEX) is the control contract of MSCI Taiwan (SGX). CNX Nifty (NSE) is the control contract of CNX Nifty (SGX). CSI 300 (CFFEX) is the control contract of FTSE China A50 (SGX). The period of analysis extends from 18 October 2010 to 17 October 2011.
Nikkei 225 (SGX) MSCI Taiwan (SGX) CNX Nifty (SGX) FTSE China A50 (SGX)
Panel A: Messages Per Minute
Coefficient T-Stat P-Value Coefficient T-Stat P-Value Coefficient T-Stat P-Value Coefficient T-Stat P-Value Intercept 26.027 9.97 <.0001 -37.041 -4.55 <.0001 -265.790 -12.05 <.0001 -133.450 -5.08 <.0001 Colocation -6.925 -3.60 0.0004 4.602 4.46 <.0001 1.263 1.62 0.1068 -1.193 -1.37 0.1727 Control Messages per Minute 0.122 8.55 <.0001 0.698 15.08 <.0001 5.713 15.06 <.0001 1.498 6.53 <.0001 Earthquake 21.236 10.83 <.0001 Adj. R Squared 0.3984 0.7047 0.6312 0.3021
Panel B: Ln (Order to Trade)
Intercept -0.774 -8.34 <.0001 0.398 13.18 <.0001 1.037 25.24 <.0001 2.660 20.22 <.0001 Colocation 0.174 5.27 <.0001 0.163 4.82 <.0001 -0.159 -4.62 <.0001 -0.365 -4.43 <.0001 Ln (Control Order to Trade) 0.432 12.16 <.0001 0.800 13.53 <.0001 2.635 9.55 <.0001 1.266 1.45 0.1488 Earthquake -0.052 -1.38 0.1704 Adj. R Squared 0.4938 0.6415 0.3511 0.1412
Panel C: Algo Trade
Intercept -1.875 -13.90 <.0001 0.134 1.37 0.1726 -0.328 -5.49 <.0001 -0.275 -3.80 0.0002 Colocation 0.387 2.71 0.0072 0.227 3.89 0.0002 -0.107 -3.30 0.0012 -0.114 -3.67 0.0004 Control Algo Trade 1.953 16.03 <.0001 0.873 17.74 <.0001 0.000 8.45 <.0001 0.011 1.01 0.3145 Earthquake 0.555 3.47 0.0006 Adj. R Squared 0.5790 0.7580 0.2854 0.0980

Page | 106
Table A-5 Combined High Frequency Trading Regression (Exclusion of Five Trading Days)
This table reports the coefficients for the following regressions: , , , , , , , , , , , , , , , , , , , , , where Messages per Minuteit represents the daily average number of messages submitted over a one-minute interval, Ln (Order to Trade)it represents the log of the daily average number of messages per trade and Algo Tradeit represents the daily average number of messages that has been standardised by trading volume. Colocationit takes the value of 1 after the introduction of co-location services and, 0 otherwise. Open Interestit refers to the number of outstanding contracts from the previous session of trading and Price Volatilityit is calculated as the natural logarithm of the day’s highest traded price proportional to its lowest traded price. Control Open Interestit refers to the number of outstanding contracts from the previous session of trading for the control contract and Control Price Volatilityit is calculated as the natural logarithm of the day’s highest traded price proportional to its lowest traded price for the control contract. Nikkei 225 (OSE) is the control contract of Nikkei 225 (SGX). Taiwan Stock Index (TAIFEX) is the control contract of MSCI Taiwan (SGX). CNX Nifty (NSE) is the control contract of CNX Nifty (SGX). CSI 300 (CFFEX) is the control contract of FTSE China A50 (SGX). The period of analysis extends from 18 October 2010 to 17 October 2011.
Nikkei 225 (SGX) MSCI Taiwan (SGX) CNX Nifty (SGX) FTSE China A50 (SGX)
Panel A: Messages per Minute
Coefficient T-Stat P-Value Coefficient T-Stat P-Value Coefficient T-Stat P-Value Coefficient T-Stat P-Value Intercept 23.791 5.31 <.0001 107.662 9.86 <.0001 42.312 6.92 <.0001 30.448 9.19 <.0001 Colocation -2.406 -1.43 0.1529 2.390 1.29 0.1996 -2.408 -1.38 0.1684 -2.625 -1.49 0.1392 Open Interest 14.760 0.39 0.6962 -74.090 0.39 0.6962 157.980 5.44 <.0001 43.060 0.69 0.4911 Price Volatility 45.295 0.37 0.7125 90.336 0.84 0.4025 108.269 1.28 0.2027 62.578 0.83 0.4111 Control Open Interest 45.050 1.56 0.1196 -295.500 -2.08 0.0402 -0.755 -3.73 0.0003 56.970 0.50 0.6174 Control Price Volatility 357.327 2.90 0.0041 559.185 4.23 <.0001 378.872 3.86 0.0002 177.019 2.37 0.0199 Earthquake 6.437 3.91 0.0001 Adj. R Squared 0.6173 0.5120 0.5393 0.1810
Panel B: Ln (Order to Trade)
Intercept 0.410 4.57 <.0001 0.958 9.73 <.0001 1.896 7.19 <.0001 3.874 15.71 <.0001 Colocation 0.091 2.70 0.0074 0.052 2.28 0.0240 0.004 0.06 0.9545 0.116 0.88 0.3788 Open Interest 0.672 0.89 0.3749 -0.609 -1.97 0.0500 -1.140 -0.91 0.3626 -16.480 -3.55 0.0006 Price Volatility -4.416 -1.80 0.0739 -8.964 -5.46 <.0001 -14.064 -3.85 0.0002 -14.037 -2.49 0.0144 Control Open Interest -0.299 -0.52 0.6055 1.200 0.83 0.4070 0.002 0.27 0.7889 -13.060 -1.54 0.1257 Control Price Volatility -4.510 -1.83 0.0691 -10.108 -4.98 <.0001 -3.657 -0.86 0.3889 0.564 0.10 0.9195 Earthquake -0.071 -2.17 0.0313 Adj. R Squared 0.5939 0.6050 0.3171 0.3219

Page | 107
Table A-5 Combined High Frequency Trading Regression (Exclusion of Five Trading Days) (Cont.)
Nikkei 225 (SGX) MSCI Taiwan (SGX) CNX Nifty (SGX) FTSE China A50 (SGX)
Panel C: Algo Trade
Coefficient T-Stat P-Value Coefficient T-Stat P-Value Coefficient T-Stat P-Value Coefficient T-Stat P-Value Intercept -3.645 -9.24 <.0001 0.035 0.08 0.9358 -0.308 -1.26 0.2104 -0.119 -1.23 0.2210 Colocation 0.280 1.89 0.0596 0.209 2.84 0.0055 -0.038 -0.55 0.5843 0.050 0.98 0.3305 Open Interest -12.460 -3.75 0.0002 -4.180 -1.71 0.0908 0.570 0.49 0.6254 -7.190 -3.95 0.0001 Price Volatility -38.724 -3.58 0.0004 -17.295 -4.04 0.0001 -11.781 -3.47 0.0007 -5.495 -2.48 0.0147 Control Open Interest 10.260 4.04 <.0001 -4.690 -0.83 0.4096 -0.013 -1.65 0.0999 2.650 0.80 0.4257 Control Price Volatility -7.304 -0.67 0.5016 -29.558 -5.61 <.0001 -2.445 -0.62 0.5353 0.898 0.41 0.6818 Earthquake 0.493 3.41 0.0008 Adj. R Squared 0.6441 0.7544 0.2343 0.2868

Page | 108
Table A-6 Contract-Specific Liquidity Regression (Exclusion of Five Trading Days)
This table reports the coefficients for the following regressions: , , , , , , , , , , , , , , , , , , where Ln (Prop Spread)it represents the natural logarithm of the daily average proportional spread, Ln(Tick Spread)it represents the natural logarithm of the daily average tick spread and Ln(TW Spread)it represents the natural logarithm of the daily average time-weighted spread. Best Depthit refers to the daily average number of contracts available at the best bid and ask prices and Total Depthit refers to the daily average number of contracts available in the visible limit order book. Colocationit takes the value of 1 after the introduction of co-location services and, 0 otherwise. Open Interestit refers to the number of outstanding contracts from the previous session of trading and Price Volatilityit is calculated as the natural logarithm of the day’s highest traded price proportional to its lowest traded price. Results for the Singapore Exchange’s SiMSCI, Nikkei 225, MSCI Taiwan, CNX Nifty and FTSE ChinaA50 contracts are reported. The period of analysis extends from 18 October 2010 to 17 October 2011
SiMSCI Nikkei 225 MSCI Taiwan CNX Nifty FTSE China A50
Panel A: Ln (Proportional Spread)
Coefficient T-Stat P-Value Coefficient T-Stat P-Value Coefficient T-Stat P-Value Coefficient T-Stat P-Value Coefficient T-Stat P-Value
Intercept -8.238 -193.15 <.0001 -7.509 -264.62 <.0001 -7.572 -84.40 <.0001 -8.354 -50.81 <.0001 -6.972 -108.50 <.0001 Colocation 0.047 4.60 <.0001 0.013 1.12 0.2634 0.101 5.82 <.0001 -0.122 -2.54 0.0118 -0.206 -3.66 0.0004 Open Interest 3.080 3.39 0.0009 -0.597 -4.66 <.0001 -2.860 -5.20 <.0001 0.195 0.24 0.8085 -0.414 -0.21 0.8378 Price Volatility 3.841 6.79 <.0001 1.747 8.54 <.0001 3.201 5.96 <.0001 5.168 3.76 0.0002 4.716 2.98 0.0036 Earthquake 0.058 5.08 <.0001 Adj. R Squared 0.4378 0.5531 0.5003 0.1518 0.3472
Panel B: Ln (Tick Spread)
Intercept -5.117 -187.51 <.0001 -6.224 -
2224.10<.0001 -4.392 -132.02 <.0001 0.497 3.29 0.0012 2.383 41.97 <.0001
Colocation -0.021 -3.21 0.0016 -0.006 -5.59 <.0001 0.022 3.40 0.0010 -0.163 -3.69 0.0003 -0.174 -3.50 0.0007 Open Interest -0.228 -0.39 0.6953 0.025 1.95 0.0526 -1.090 -5.35 <.0001 -0.502 -0.68 0.4990 -6.020 -3.37 0.0010 Price Volatility 1.069 2.95 0.0036 0.513 25.41 <.0001 0.521 2.61 0.0103 3.016 2.39 0.0180 3.756 2.68 0.0085 Earthquake 0.007 6.44 <.0001 Adj. R Squared 0.0595 0.8231 0.2617 0.2965 0.5868
Panel C: Ln (Time-weighted Spread)
Intercept -8.249 -184.55 <.0001 -7.511 -263.86 <.0001 -7.578 -84.00 <.0001 -7.589 -34.82 <.0001 -6.781 -77.64 <.0001 Colocation 0.035 3.23 0.0015 0.014 1.22 0.2228 0.101 5.80 <.0001 -0.119 -1.86 0.0642 -0.278 -3.63 0.0004 Open Interest 3.760 3.96 0.0001 -0.597 -4.64 <.0001 -2.850 -5.16 <.0001 -1.180 -1.10 0.2709 2.340 0.85 0.3960 Price Volatility 3.489 5.89 <.0001 1.711 8.33 <.0001 3.202 5.93 <.0001 3.955 2.17 0.0312 6.768 3.14 0.0022 Earthquake 0.057 4.98 <.0001 Adj. R Squared 0.3692 0.5477 0.4983 0.1569 0.2623

Page | 109
SiMSCI Nikkei 225 MSCI Taiwan CNX Nifty FTSE China A50
Panel D: Best Depth
Coefficient T-Stat P-Value Coefficient T-Stat P-Value Coefficient T-Stat P-Value Coefficient T-Stat P-Value Coefficient T-Stat P-Value Intercept 2.866 18.65 <.0001 5.869 45.22 <.0001 3.276 14.32 <.0001 2.729 18.02 <.0001 3.690 50.64 <.0001 Colocation 0.144 3.90 0.0001 0.470 9.09 <.0001 -0.327 -7.42 <.0001 -0.027 -0.60 0.5489 -0.129 -2.02 0.0457 Open Interest -0.183 -0.06 0.9553 0.513 0.88 0.3823 9.900 7.06 <.0001 1.310 1.77 0.0791 9.550 4.17 <.0001 Price Volatility -6.183 -3.03 0.0028 -4.729 -5.05 <.0001 -4.762 -3.48 0.0007 -0.623 -0.49 0.6229 -2.245 -1.25 0.2140 Earthquake -0.620 -11.80 <.0001 Adj. R Squared 0.0868 0.5255 0.4854 0.0204 0.1745
Panel E: Total Depth
Intercept 5.728 45.43 <.0001 8.442 67.11 <.0001 6.873 36.38 <.0001 5.554 51.49 <.0001 5.980 96.46 <.0001 Colocation 0.027 0.89 0.3763 0.569 11.34 <.0001 -0.247 -6.79 <.0001 -0.122 -3.88 0.0001 -0.120 -2.20 0.0299 Open Interest 0.600 0.22 0.8233 1.370 2.42 0.0165 6.200 5.35 <.0001 0.441 0.84 0.4049 17.150 8.81 <.0001 Price Volatility -9.997 -5.98 <.0001 -5.682 -6.26 <.0001 -7.634 -6.75 <.0001 -1.109 -1.23 0.2199 -3.852 -2.52 0.0132 Earthquake -0.596 -11.69 <.0001 Adj. R Squared 0.1807 0.5551 0.5710 0.1888 0.6139

Page | 110
Table A-7 Market-Wide Liquidity Regression (Exclusion of Five Trading Days)
This table reports the coefficients for the following regressions: , , , , , , , , , , , , , , , , , , , , where Ln (Prop Spread)it represents the natural logarithm of the daily average proportional spread, Ln(Tick Spread)it represents the natural logarithm of the daily average tick spread and Ln(TW Spread)it represents the natural logarithm of the daily average time-weighted spread. Best Depthit refers to the daily average number of contracts available at the best bid and ask prices and Total Depthit refers to the daily average number of contracts available in the visible limit order book. Colocationit takes the value of 1 after the introduction of co-location services and, 0 otherwise. Ln (Control Prop Spread)it represents the natural logarithm of the daily average proportional spread for the control contract, Ln(Control Tick Spread)it represents the natural logarithm of the daily average tick spread for the control contract and Ln(Control TW Spread)it represents the natural logarithm of the daily average time-weighted spread for the control contract. Best Depthit refers to the daily average number of contracts available at the best bid and ask prices and Total Depthit refers to the daily average number of contracts available in the visible limit order book. Nikkei 225 (OSE) is the control contract of Nikkei 225 (SGX). Taiwan Stock Index (TAIFEX) is the control contract of MSCI Taiwan (SGX). CNX Nifty (NSE) is the control contract of CNX Nifty (SGX). CSI 300 (CFFEX) is the control contract of FTSE China A50 (SGX). The period of analysis extends from 18 October 2010 to 17 October 2011.
Nikkei 225 (SGX) MSCI Taiwan (SGX) CNX Nifty (SGX) FTSE China A50 (SGX)
Panel A: Ln (Proportional Spread)
Coefficient T-Stat P-Value Coefficient T-Stat P-Value Coefficient T-Stat P-Value Coefficient T-Stat P-Value
Intercept -0.332 -4.82 <.0001 -2.435 -7.76 <.0001 -1.293 -1.76 0.0799 0.392 0.27 0.7898 Colocation -0.015 -9.03 <.0001 0.016 1.85 0.0668 -0.107 -5.32 <.0001 -0.169 -5.62 <.0001 Ln (Control Prop Spread) 1.052 105.82 <.0001 0.623 17.68 <.0001 0.752 9.42 <.0001 0.798 4.97 <.0001 Earthquake 0.012 6.48 <.0001 Adj. R Squared 0.9883 0.7938 0.3926 0.4317
Panel B: Ln (Tick Spread)
Intercept 20.317 12.97 <.0001 -3.543 -19.82 <.0001 1.369 9.86 <.0001 5.896 5.30 <.0001 Colocation -0.010 -7.06 <.0001 -0.001 -0.10 0.9170 -0.137 -6.49 <.0001 -0.226 -5.79 <.0001 Ln (Control Tick Spread) 3.840 16.94 <.0001 0.198 5.69 <.0001 0.629 6.62 <.0001 0.535 3.24 0.0016 Earthquake 0.008 5.07 <.0001 Adj. R Squared 0.6821 0.2341 0.4233 0.5685
Panel C: Ln (Time-weighted Spread)
Intercept -0.297 -2.84 0.0050 -2.577 -8.32 <.0001 -5.928 -6.42 <.0001 -0.990 -0.47 0.6383 Colocation -0.016 -6.57 <.0001 0.016 1.79 0.0769 -0.180 -5.68 <.0001 -0.187 -4.21 <.0001 Ln (Control T-weighted Spread) 1.056 70.02 <.0001 0.607 17.48 <.0001 0.199 1.98 0.0498 0.613 2.66 0.0090 Earthquake 0.010 3.61 0.0004 Adj. R Squared 0.9740 0.7904 0.1558 0.2403

Page | 111
Table A-7 Market-Wide Liquidity Regression (Exclusion of Five Trading Days) (Cont.)
Nikkei 225 (SGX) MSCI Taiwan (SGX) CNX Nifty (SGX) FTSE China A50 (SGX)
Panel D: Best Depth
Coefficient T-Stat P-Value Coefficient T-Stat P-Value Coefficient T-Stat P-Value Coefficient T-Stat P-Value Intercept -0.305 -1.29 0.1977 2.561 11.75 <.0001 2.821 3.11 0.0022 2.749 4.51 <.0001 Colocation 0.115 3.95 0.0001 0.024 0.67 0.5037 0.044 1.57 0.1174 0.029 0.58 0.5648 Control Best Depth 0.883 26.38 <.0001 0.598 10.31 <.0001 0.022 0.18 0.8540 0.406 1.90 0.0606 Earthquake 0.009 0.25 0.8052 Adj. R Squared 0.8748 0.5837 0.0085 0.0729
Panel E: Total Depth
Intercept 0.650 1.84 0.0667 5.122 16.60 <.0001 5.072 6.07 <.0001 3.502 6.08 <.0001 Colocation 0.125 3.56 0.0004 -0.057 -1.78 0.0773 -0.087 -3.39 0.0009 0.136 2.96 0.0038 Control Total Depth 0.841 22.73 <.0001 0.425 8.57 <.0001 0.060 0.66 0.5103 0.607 4.98 <.0001 Earthquake -0.188 -5.24 <.0001 Adj. R Squared 0.8445 0.5534 0.1869 0.4535

Page | 112
Table A-8 Combined Liquidity Regression (Exclusion of Five Trading Days)
This table reports the coefficients for the following regressions: , , , , , , , , , , , , , , , , , , , , , , , , , , , , , , , , , , , where Ln (Prop Spread)it represents the natural logarithm of the daily average proportional spread, Ln(Tick Spread)it represents the natural logarithm of the daily average tick spread and Ln(TW Spread)it represents the natural logarithm of the daily average time-weighted spread. Best Depthit refers to the daily average number of contracts available at the best bid and ask prices and Total Depthit refers to the daily average number of contracts available in the visible limit order book. Colocationit takes the value of 1 after the introduction of co-location services and, 0 otherwise. Open Interestit refers to the number of outstanding from the previous session of trading and Price Volatilityit is calculated as the natural logarithm of the day’s highest traded price proportional to its lowest traded price. Control Open Interestit refers to the number of outstanding contracts from the previous session of trading for the control contract and Control Price Volatilityit is calculated as the natural logarithm of the day’s highest traded price proportional to its lowest traded price for the control contract. Nikkei 225 (OSE) is the control contract of Nikkei 225 (SGX). Taiwan Stock Index (TAIFEX) is the control contract of MSCI Taiwan (SGX). CNX Nifty (NSE) is the control contract of CNX Nifty (SGX). CSI 300 (CFFEX) is the control contract of FTSE China A50 (SGX). The period of analysis extends from 18 October 2010 to 17 October 2011.
Nikkei 225 (SGX) MSCI Taiwan (SGX) CNX Nifty (SGX) FTSE China A50 (SGX)
Panel A: Ln (Proportional Spread)
Coefficient T-Stat P-Value Coefficient T-Stat P-Value Coefficient T-Stat P-Value Coefficient T-Stat P-Value Intercept -7.582 -262.06 <.0001 -7.435 -74.30 <.0001 -8.316 -45.58 <.0001 -6.808 -67.58 <.0001 Colocation 0.034 3.18 0.0017 0.093 5.51 <.0001 -0.113 -2.17 0.0316 -0.163 -3.04 0.0030 Open Interest -1.980 -8.12 <.0001 -2.430 -4.32 <.0001 0.174 0.20 0.8408 0.663 0.35 0.7272 Price Volatility 0.107 0.13 0.8931 3.837 3.90 0.0002 1.309 0.52 0.6054 -1.779 -0.77 0.4419 Control Open Interest 1.180 6.34 <.0001 -3.440 -2.64 0.0096 -0.002 -0.35 0.7295 -9.440 -2.73 0.0074 Control Price Volatility 1.612 2.03 0.0441 -0.969 -0.80 0.4260 5.286 1.81 0.0728 7.887 3.47 0.0008 Earthquake 0.064 6.03 <.0001 Adj. R Squared 0.6301 0.5309 0.1581 0.4367
Panel B: Ln (Tick Spread)
Intercept -6.227 -
2037.60<.0001 -4.406 -114.61 <.0001 0.446 2.66 0.0085 2.506 27.56 <.0001
Colocation -0.005 -4.58 <.0001 0.022 3.44 0.0009 -0.134 -2.82 0.0054 -0.141 -2.91 0.0044 Open Interest -0.039 -1.51 0.1335 -1.120 -5.20 <.0001 -0.865 -1.09 0.2787 -5.190 -3.04 0.0030 Price Volatility 0.324 3.87 0.0001 0.289 0.76 0.4468 -0.164 -0.07 0.9437 -1.323 -0.64 0.5262 Control Open Interest 0.053 2.68 0.0079 0.325 0.65 0.5178 0.005 0.83 0.4103 -7.120 -2.28 0.0244 Control Price Volatility 0.191 2.27 0.0239 0.341 0.73 0.4656 4.591 1.71 0.0896 6.181 3.01 0.0033 Earthquake 0.007 6.57 <.0001 Adj. R Squared 0.8321 0.2557 0.3040 0.6282

Page | 113
Table A-8 Combined Liquidity Regression (Exclusion of Five Trading Days) (Cont.)
Nikkei 225 (SGX) MSCI Taiwan (SGX) CNX Nifty (SGX) FTSE China A50 (SGX)
Panel C: Ln (Time-weighted Spread)
Coefficient T-Stat P-Value Coefficient T-Stat P-Value Coefficient T-Stat P-Value Coefficient T-Stat P-Value Intercept -7.585 -261.71 <.0001 -7.435 -74.12 <.0001 -7.621 -31.33 <.0001 -6.753 -46.44 <.0001 Colocation 0.036 3.31 0.0011 0.094 5.50 <.0001 -0.096 -1.39 0.1667 -0.253 -3.28 0.0014 Open Interest -2.000 -8.17 <.0001 -2.410 -4.27 <.0001 -1.450 -1.25 0.2116 2.970 1.08 0.2807 Price Volatility 0.075 0.09 0.9250 3.861 3.91 0.0002 1.015 0.30 0.7636 1.197 0.36 0.7196 Control Open Interest 1.190 6.40 <.0001 -3.580 -2.74 0.0073 0.003 0.38 0.7070 -3.340 -0.67 0.5051 Control Price Volatility 1.607 2.02 0.0451 -1.005 -0.83 0.4102 4.199 1.08 0.2837 7.021 2.14 0.0349 Earthquake 0.063 5.93 <.0001 Adj. R Squared 0.6268 0.5318 0.1538 0.2822
Panel D: Best Depth
Intercept 6.277 48.66 <.0001 3.445 13.22 <.0001 2.589 15.44 <.0001 3.777 30.56 <.0001 Colocation 0.355 7.34 <.0001 -0.335 -7.57 <.0001 -0.002 -0.04 0.9642 -0.122 -1.86 0.0654 Open Interest 7.820 7.19 <.0001 10.270 7.00 <.0001 0.825 1.04 0.3019 9.700 4.17 <.0001 Price Volatility -0.694 -0.20 0.8447 -1.667 -0.65 0.5174 1.479 0.64 0.5253 -1.416 -0.50 0.6176 Control Open Interest -6.290 -7.58 <.0001 -3.790 -1.11 0.2677 0.010 1.83 0.0683 -3.390 -0.80 0.4253 Control Price Volatility -3.739 -1.05 0.2935 -4.548 -1.44 0.1530 -2.541 -0.94 0.3465 -1.254 -0.45 0.6542 Earthquake -0.658 -13.89 <.0001 Adj. R Squared 0.6267 0.4956 0.0317 0.1656
Panel E: Total Depth
Intercept 8.860 73.17 <.0001 6.984 32.43 <.0001 5.432 46.10 <.0001 5.990 57.03 <.0001 Colocation 0.447 9.87 <.0001 -0.252 -6.89 <.0001 -0.107 -3.20 0.0016 -0.126 -2.26 0.0258 Open Interest 9.060 8.88 <.0001 6.390 5.27 <.0001 0.080 0.14 0.8862 16.980 8.60 <.0001 Price Volatility 1.031 0.31 0.7563 -4.697 -2.22 0.0290 2.058 1.26 0.2092 -1.838 -0.76 0.4461 Control Open Interest -6.590 -8.45 <.0001 -2.310 -0.82 0.4121 0.009 2.21 0.0287 0.343 0.10 0.9243 Control Price Volatility -6.483 -1.95 0.0530 -4.299 -1.65 0.1025 -4.081 -2.16 0.0324 -2.585 -1.09 0.2783 Earthquake -0.631 -14.20 <.0001 Adj. R Squared 0.6719 0.5793 0.2197 0.6108