Embed Size (px)
Citation preview
European Journal of Contemporary Education, 2018, 7(1)
97
Copyright © 2018 by Academic Publishing House Researcher s.r.o. All rights reserved. Published in the Slovak Republic
European Journal of Contemporary Education
E-ISSN 2305-6746
2018, 7(1): 97-117
DOI: 10.13187/ejced.2018.1.97
www.ejournal1.com
WARNING! Article copyright. Copying,
reproduction, distribution, republication (in whole
or in part), or otherwise commercial use of the
violation of the author(s) rights will be pursued on
the basis of international legislation. Using the
hyperlinks to the article is not considered a violation
of copyright. Psychometric properties of the RMARS Scale in High School Students Arturo García-Santillán a , *, Valerie Martínez-Rodríguez a, Josefina C. Santana b
a UCC Business School at Universidad Cristóbal Colón, Veracruz, Mexico b School of Communication, Universidad Panamericana, Guadalajara, Mexico
Abstract The purpose of this study was to determine if there is a structure of variables that allows us to
understand the level of Anxiety towards Mathematics in high school students from the municipalities of Zacatal and Jamapa, Veracruz, Mexico. This was based on the seminal works of Richardson and Suinn [1972], who developed the Mathematics Anxiety Rating Scale (MARS) instrument with 98 items. This was later modified by Alexander and Martray [1989] to develop the Revised Mathematics Anxiety Rating Scale (RMARS) with only 25 items. For this study, the test was applied to a sample of 200 high school students of first, third and fifth semesters. The reliability of the test was α: 0.934 per item and 0.693 per dimension, which suggests acceptable validity and consistency in terms of what Hair, et al. point out [1979]. For the test of the H1 and H2 hypotheses, Exploratory Factor Analysis with extraction of the Principal Components and the Chi2
c> Chi2t> statistic suggest that, as a whole, the dimensions of the RMARS scale explain
mathematical anxiety. In addition, they indicate that anxiety towards mathematics classes is greater than anxiety towards exams and mathematical tasks; all this accounts for 74 % of the assimilable variance. For H3, the ANOVA test is used to show if there is a difference in means. The results suggest that there are no differences by Gender, Age. Or School Grade, although the MATHTEST dimension in Gender, showed differences in variances.
Keywords: beliefs, attitudes, emotions, mathematical anxiety, mathematical exams, numerical tasks, mathematical courses, MARS and RMARS scales.
1. Background One of the policies promoted by the Organization for Economic Cooperation and
Development (OECD) is the achievement of economic growth in the field of employment, as well as a better standard of living in member countries. Derived from the above is the Program for the
* Corresponding author E-mail addresses: [email protected] (A. García-Santillán)
European Journal of Contemporary Education, 2018, 7(1)
98
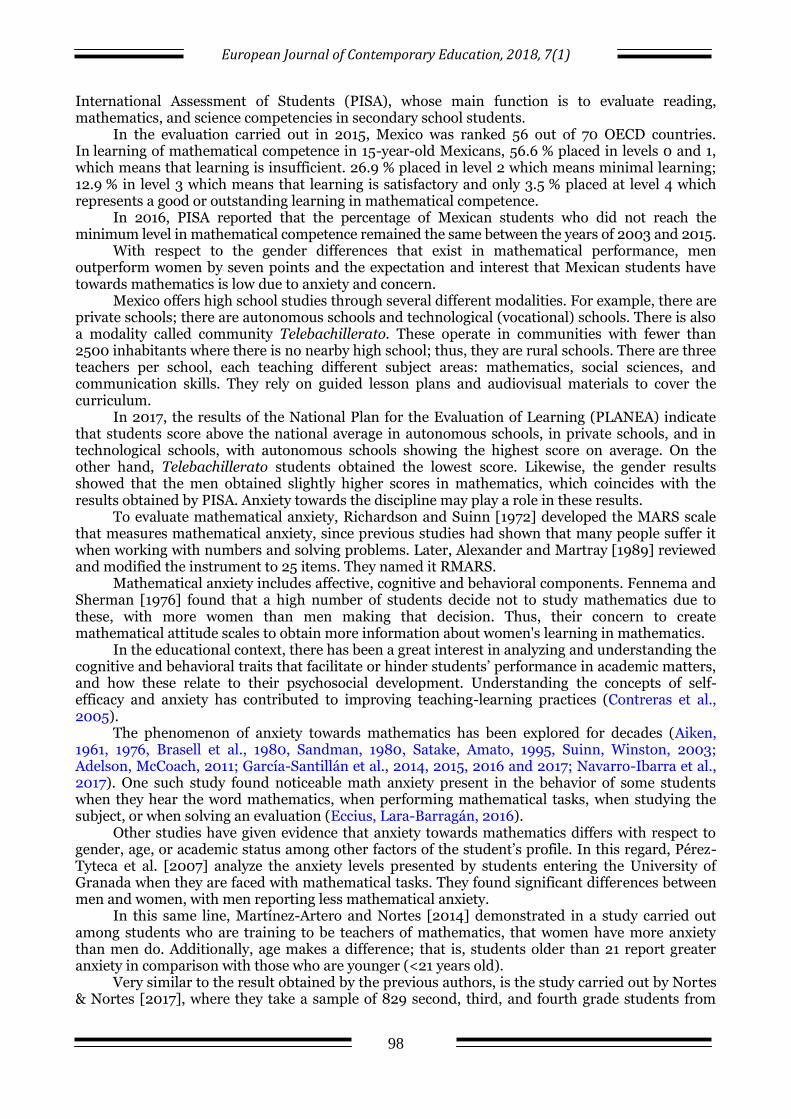
International Assessment of Students (PISA), whose main function is to evaluate reading, mathematics, and science competencies in secondary school students.
In the evaluation carried out in 2015, Mexico was ranked 56 out of 70 OECD countries. In learning of mathematical competence in 15-year-old Mexicans, 56.6 % placed in levels 0 and 1, which means that learning is insufficient. 26.9 % placed in level 2 which means minimal learning; 12.9 % in level 3 which means that learning is satisfactory and only 3.5 % placed at level 4 which represents a good or outstanding learning in mathematical competence.
In 2016, PISA reported that the percentage of Mexican students who did not reach the minimum level in mathematical competence remained the same between the years of 2003 and 2015.
With respect to the gender differences that exist in mathematical performance, men outperform women by seven points and the expectation and interest that Mexican students have towards mathematics is low due to anxiety and concern.
Mexico offers high school studies through several different modalities. For example, there are private schools; there are autonomous schools and technological (vocational) schools. There is also a modality called community Telebachillerato. These operate in communities with fewer than 2500 inhabitants where there is no nearby high school; thus, they are rural schools. There are three teachers per school, each teaching different subject areas: mathematics, social sciences, and communication skills. They rely on guided lesson plans and audiovisual materials to cover the curriculum.
In 2017, the results of the National Plan for the Evaluation of Learning (PLANEA) indicate that students score above the national average in autonomous schools, in private schools, and in technological schools, with autonomous schools showing the highest score on average. On the other hand, Telebachillerato students obtained the lowest score. Likewise, the gender results showed that the men obtained slightly higher scores in mathematics, which coincides with the results obtained by PISA. Anxiety towards the discipline may play a role in these results.
To evaluate mathematical anxiety, Richardson and Suinn [1972] developed the MARS scale that measures mathematical anxiety, since previous studies had shown that many people suffer it when working with numbers and solving problems. Later, Alexander and Martray [1989] reviewed and modified the instrument to 25 items. They named it RMARS.
Mathematical anxiety includes affective, cognitive and behavioral components. Fennema and Sherman [1976] found that a high number of students decide not to study mathematics due to these, with more women than men making that decision. Thus, their concern to create mathematical attitude scales to obtain more information about women's learning in mathematics.
In the educational context, there has been a great interest in analyzing and understanding the cognitive and behavioral traits that facilitate or hinder students’ performance in academic matters, and how these relate to their psychosocial development. Understanding the concepts of self-efficacy and anxiety has contributed to improving teaching-learning practices (Contreras et al., 2005).
The phenomenon of anxiety towards mathematics has been explored for decades (Aiken, 1961, 1976, Brasell et al., 1980, Sandman, 1980, Satake, Amato, 1995, Suinn, Winston, 2003; Adelson, McCoach, 2011; García-Santillán et al., 2014, 2015, 2016 and 2017; Navarro-Ibarra et al., 2017). One such study found noticeable math anxiety present in the behavior of some students when they hear the word mathematics, when performing mathematical tasks, when studying the subject, or when solving an evaluation (Eccius, Lara-Barragán, 2016).
Other studies have given evidence that anxiety towards mathematics differs with respect to gender, age, or academic status among other factors of the student’s profile. In this regard, Pérez-Tyteca et al. [2007] analyze the anxiety levels presented by students entering the University of Granada when they are faced with mathematical tasks. They found significant differences between men and women, with men reporting less mathematical anxiety.
In this same line, Martínez-Artero and Nortes [2014] demonstrated in a study carried out among students who are training to be teachers of mathematics, that women have more anxiety than men do. Additionally, age makes a difference; that is, students older than 21 report greater anxiety in comparison with those who are younger (<21 years old).
Very similar to the result obtained by the previous authors, is the study carried out by Nortes & Nortes [2017], where they take a sample of 829 second, third, and fourth grade students from

European Journal of Contemporary Education, 2018, 7(1)
99
future primary school teachers. Their findings show significant differences in gender aspects where the level of mathematical anxiety in academic courses is higher in women than in men.
Likewise, a study by Agüero, Meza, Suárez and Schmidt [2017] with a sample of 3,725 students at the secondary level in public school in Costa Rica, found statistically significant differences in relation to mathematical anxiety by gender, since women apparently have higher levels of anxiety towards mathematics than men do. In addition, another interesting data finding is related to the variable degree of education. The study identified that the level of anxiety differs with respect to the students of the third grade versus those who are in other grades, the latter being the students who showed slightly higher levels of anxiety.
Thus, this study aims to answer the following research questions: How do tests, tasks and courses, all of them associated with mathematics, constitute factors that generate anxiety in the student? Does anxiety differ according to gender, age or degree of study?
General Objective: ● Evaluate how tests, tasks and math courses generate anxiety in the student. Specific objectives: ● Identify which of the three factors explain mathematical anxiety in Telebachillerato
students in the municipalities of Zacatal and Jamapa, Veracruz. ● Analyze if there are significant differences by gender, age and school grade that explain
mathematical anxiety. Working hypothesis: H1 Examinations, assignments and math courses constitute a structure of latent variables
that generate anxiety in the student. H2 There is at least one factor that explains mathematical anxiety in Telebachillerato
students in the municipalities of Zacatal and Jamapa, Veracruz. H3 There are significant differences by gender, age and school grade in the elements that
explain mathematical anxiety. 2. Literature review This section seeks to explain from theory how the construct of mathematical anxiety has been
defined, from the dimensions of beliefs, emotions and attitudes towards exams, tasks and courses. These last three are an essential part of this research.
When Aiken [1961] decides to investigate the effect of attitudes in mathematics, he discovers that they are related to factors of intelligence and achievement, but not to variables such as temperament. In a later study [1976], this author states that changes in attitude toward mathematics imply an interaction between the characteristics of teachers and students, giving greater emphasis to the behavior that is had in the classroom and the didactic techniques that are used for the teaching of mathematics.
In 1968, Dutton and Blum selected a sample of 342 students to apply an assessment and know what they thought of mathematics. They found that students did not like to work with math problems outside of school, nor did they like to commit arithmetical errors. Most agreed that the best way to accomplish this was to avoid arithmetic whenever possible, since they indicated that mathematics was not useful in daily life and that arithmetic was a waste of time.
In seminal studies by Richardson and Suinn [1972], mathematical anxiety involves feelings of tension and anxiety that interfere with the use of numbers and the solution of mathematical problems in daily life and in academic situations. Their MARS scale consists of 98 statements, which gave rise to six factors: general evaluation anxiety, daily numerical anxiety, passive observation anxiety, performance anxiety, mathematical test anxiety and problem solving anxiety.
Later, Suinn et al. [1972], mention a study by Richardson with a sample of 400 university students. He discovered that 28 % showed high levels of tension associated with mathematical situations or the use of numbers and that more than a third of them sought help through therapy in a counseling center, explaining that the reason for consultation was related to mathematics.
Benz [1978] complements the above, stressing that mathematical anxiety was seen as a psychological problem. Psychologists became very much in demand to help design and implement plans for improvement, which included techniques for the general management of anxiety,
European Journal of Contemporary Education, 2018, 7(1)
100
modification of irrational beliefs and negative attitudes towards mathematics. The aim was to develop more positive attitudes and self-concepts.
Later, McLeod [1988] studied emotions and feelings about mathematics, analyzed the intervention of attitudes, and found that affective influences in the solution of problems vary in intensity (magnitude) and direction (positive or negative).
In the correlational analysis of Bessant [1995], the author indicated that the interaction between the attitude towards mathematical anxiety and the MARS scale factors depends on the level of anxiety with respect to the experience one has regarding it. It was also found that learning was significant to a specific type of anxiety, to attitudes and to factors of giving instructions. Likewise, the result confirmed the functionality of using teaching-learning theory and instruments to analyze the relationship between the cognitive and affective components in mathematical anxiety.
The results of the meta-analysis research developed by Ma [1999] can be understood as a relationship between mathematical anxiety and performance. Thus, it can be understood as a psychological issue derived from emotional reaction that has beliefs, attitudes, and sensations such as the panic and fear that arise when presented with mathematics.
In this order of ideas, Gil, Blanco, and Guerrero [2005] indicate that positive and negative attitudes have traditionally been studied. However, these authors complement the research with concepts of emotional literacy, which in mathematics education is oriented to the affects, beliefs, attitudes, emotions and feelings as a determining factor to learn, understand and perform in the discipline of mathematics.
Studies conducted by Sánchez, Segovia and Miñán [2011] indicate that teachers’ negative attitudes and anxiety can be transmitted to their students. They cite Johnson's [1981] work, and highlight that in his research, the professor’s attitude will be reflected in the attitude of the students towards arithmetic and if the attitude is negative, it will cause anxiety and fear. For that reason García-Santillán, Escalera-Chávez and Venegas-Martínez [2013] consider it necessary for the professor to do the work of improving emotional issues so that the student avoids paralyzing himself when he is studying mathematics.
It is important to distinguish between mathematical attitude and attitude towards mathematics. The former refers to the cognitive capacity that the person has; for example, analysis, problem solving, cognitive openness, critical thinking, etc. and the latter has to do with affective capacity, that is, the value and satisfaction that this subject generates (Palacios et al., 2014).
A recent study carried out by Navarro-Ibarra, García-Santillán, Cuevas, and Ansaldo [2017] found a high level of anxiety between mathematics courses and numerical tasks. The students showed less anxiety when they were in mathematics class than when an evaluation was applied and less anxiety between the numerical tasks and the evaluations. They also identified that mathematical attitude is greater when there is a correlation between affective commitment and mathematical confidence followed by the correlation between a commitment behavior and mathematical confidence. Finally, they discovered that the correlation that exists between the affective commitment and the commitment behavior was slightly lower.
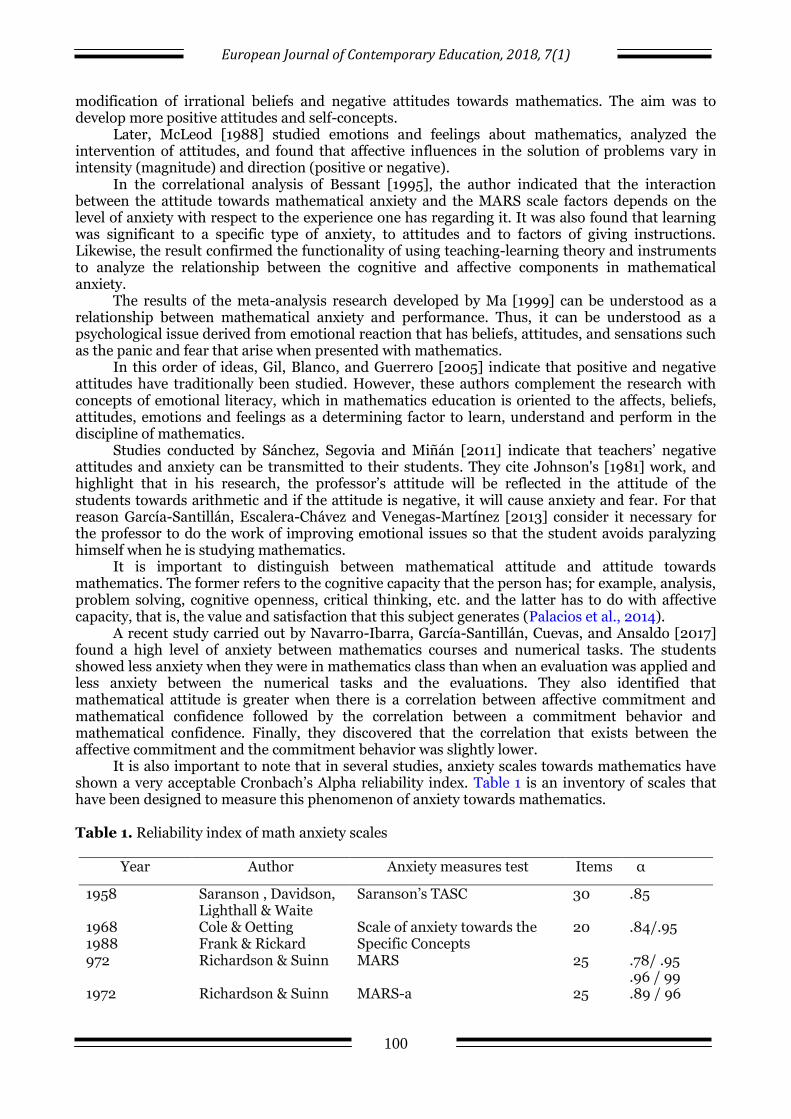
It is also important to note that in several studies, anxiety scales towards mathematics have shown a very acceptable Cronbach’s Alpha reliability index. Table 1 is an inventory of scales that have been designed to measure this phenomenon of anxiety towards mathematics.
Table 1. Reliability index of math anxiety scales
Year Author Anxiety measures test Items α
1958 Saranson , Davidson, Lighthall & Waite
Saranson’s TASC 30 .85
1968 1988
Cole & Oetting Frank & Rickard
Scale of anxiety towards the Specific Concepts
20 .84/.95
972 Richardson & Suinn MARS 25 .78/ .95 .96 / 99
1972 Richardson & Suinn MARS-a 25 .89 / 96
European Journal of Contemporary Education, 2018, 7(1)
101
1973 Sztela Debilitating anxiety towards mathematics scale
10 .83
1975 Spielberger & Guerrero
State-Trait Inventory (IDARE-RE) Pre and Post Experimental
20 .75 / 95
1978 Sepie & Keelin Mathematics anxiety scale 20 .90 1980 Cruise & Wilkins Statistics anxiety scale 51 .67 /.94 1981 Meece Mathematics anxiety
questionnaire 19 .81
1982 Plake & Parker MASC 22 .97 1989 Alexander & Martray SMARS 25 .71 2007 Muñoz & Mato Mathematics anxiety scale 24 .71
Source: prepared with data from García-Santillán et al. [2017].
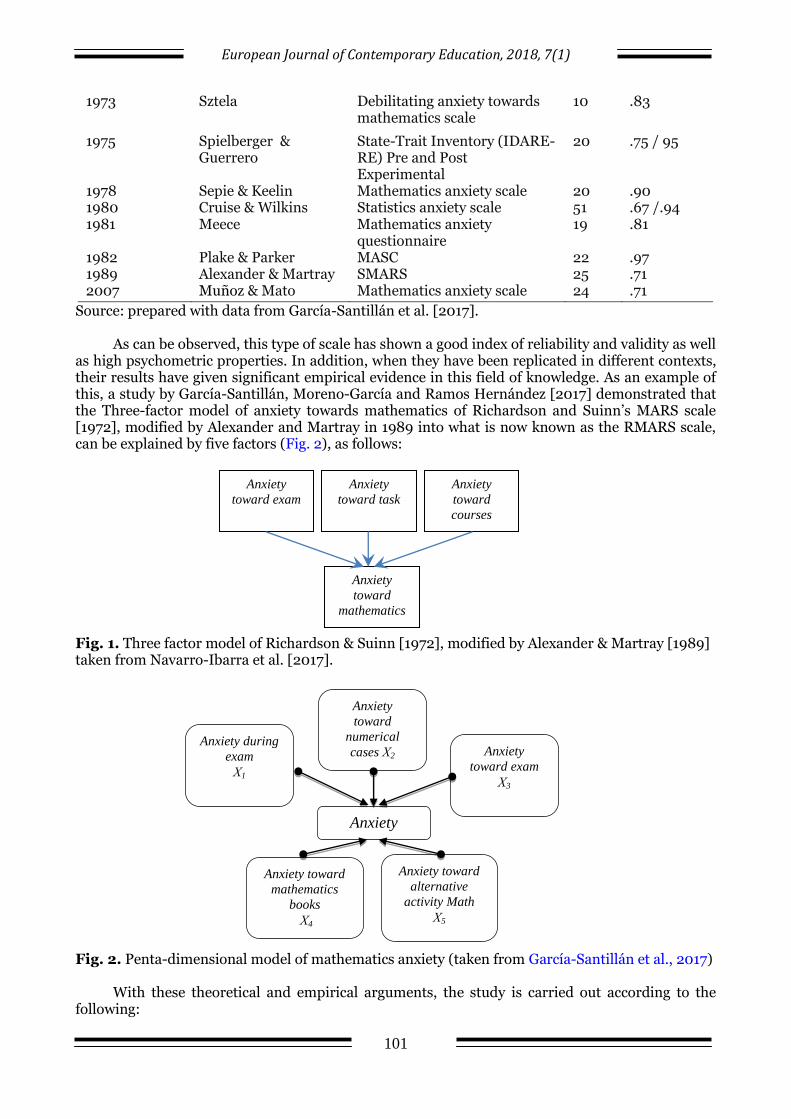
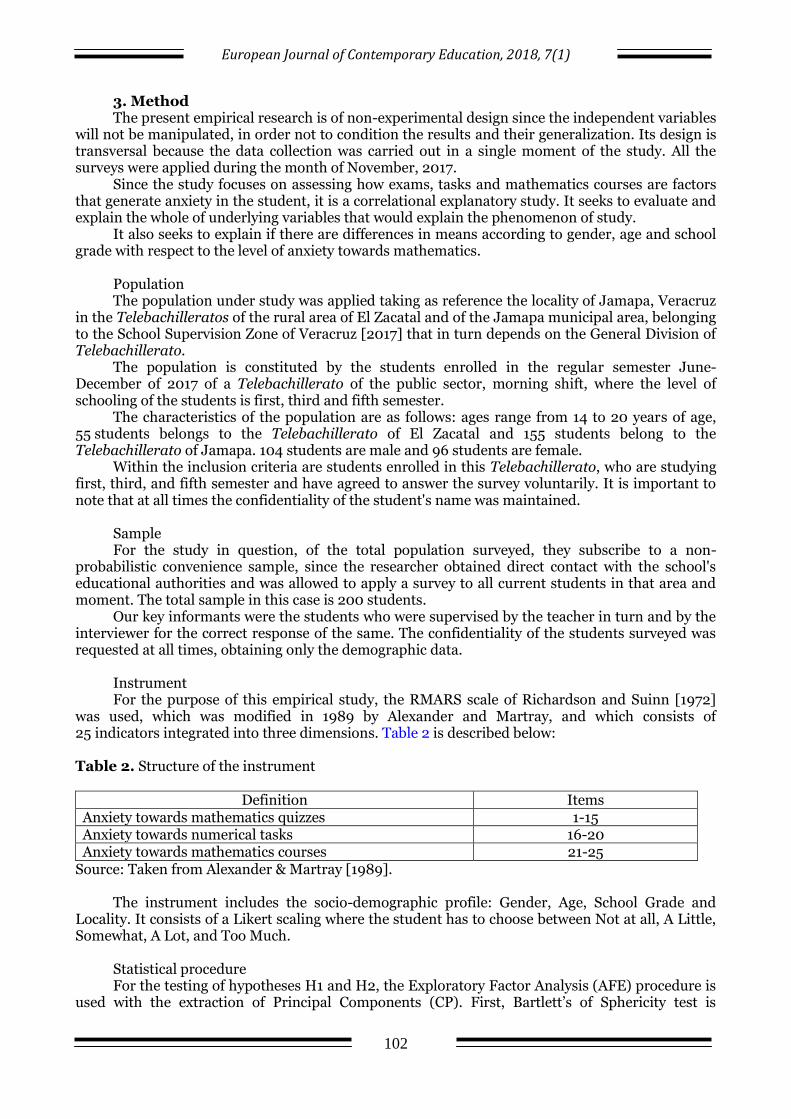
As can be observed, this type of scale has shown a good index of reliability and validity as well as high psychometric properties. In addition, when they have been replicated in different contexts, their results have given significant empirical evidence in this field of knowledge. As an example of this, a study by García-Santillán, Moreno-García and Ramos Hernández [2017] demonstrated that the Three-factor model of anxiety towards mathematics of Richardson and Suinn’s MARS scale [1972], modified by Alexander and Martray in 1989 into what is now known as the RMARS scale, can be explained by five factors (Fig. 2), as follows: Fig. 1. Three factor model of Richardson & Suinn [1972], modified by Alexander & Martray [1989] taken from Navarro-Ibarra et al. [2017]. Fig. 2. Penta-dimensional model of mathematics anxiety (taken from García-Santillán et al., 2017)
With these theoretical and empirical arguments, the study is carried out according to the
following:
Anxiety
toward exam
Anxiety
toward task
Anxiety
toward
courses
Anxiety
toward
mathematics
Anxiety during
exam
Χ1
Anxiety
toward
numerical
cases Χ2 Anxiety
toward exam
Χ3
Anxiety toward
mathematics
books
Χ4
Anxiety toward
alternative
activity Math
Χ5
Anxiety
European Journal of Contemporary Education, 2018, 7(1)
102
3. Method The present empirical research is of non-experimental design since the independent variables
will not be manipulated, in order not to condition the results and their generalization. Its design is transversal because the data collection was carried out in a single moment of the study. All the surveys were applied during the month of November, 2017.
Since the study focuses on assessing how exams, tasks and mathematics courses are factors that generate anxiety in the student, it is a correlational explanatory study. It seeks to evaluate and explain the whole of underlying variables that would explain the phenomenon of study.
It also seeks to explain if there are differences in means according to gender, age and school grade with respect to the level of anxiety towards mathematics.
Population The population under study was applied taking as reference the locality of Jamapa, Veracruz
in the Telebachilleratos of the rural area of El Zacatal and of the Jamapa municipal area, belonging to the School Supervision Zone of Veracruz [2017] that in turn depends on the General Division of Telebachillerato.
The population is constituted by the students enrolled in the regular semester June-December of 2017 of a Telebachillerato of the public sector, morning shift, where the level of schooling of the students is first, third and fifth semester.
The characteristics of the population are as follows: ages range from 14 to 20 years of age, 55 students belongs to the Telebachillerato of El Zacatal and 155 students belong to the Telebachillerato of Jamapa. 104 students are male and 96 students are female.
Within the inclusion criteria are students enrolled in this Telebachillerato, who are studying first, third, and fifth semester and have agreed to answer the survey voluntarily. It is important to note that at all times the confidentiality of the student's name was maintained.
Sample For the study in question, of the total population surveyed, they subscribe to a non-
probabilistic convenience sample, since the researcher obtained direct contact with the school's educational authorities and was allowed to apply a survey to all current students in that area and moment. The total sample in this case is 200 students.
Our key informants were the students who were supervised by the teacher in turn and by the interviewer for the correct response of the same. The confidentiality of the students surveyed was requested at all times, obtaining only the demographic data.
Instrument For the purpose of this empirical study, the RMARS scale of Richardson and Suinn [1972]
was used, which was modified in 1989 by Alexander and Martray, and which consists of 25 indicators integrated into three dimensions. Table 2 is described below:
Table 2. Structure of the instrument
Definition Items Anxiety towards mathematics quizzes 1-15 Anxiety towards numerical tasks 16-20 Anxiety towards mathematics courses 21-25
Source: Taken from Alexander & Martray [1989].
The instrument includes the socio-demographic profile: Gender, Age, School Grade and Locality. It consists of a Likert scaling where the student has to choose between Not at all, A Little, Somewhat, A Lot, and Too Much.
Statistical procedure For the testing of hypotheses H1 and H2, the Exploratory Factor Analysis (AFE) procedure is
used with the extraction of Principal Components (CP). First, Bartlett’s of Sphericity test is
European Journal of Contemporary Education, 2018, 7(1)
103
calculated from the transformation of the correlation matrix of the determinant, the same determinant that allows us to identify the power of the correlations according to the following:
1
1 2 111 (2 5) ln log( )
6 6
p
R j
j
pd n p R n
Where: N = sample size, ln = natural logarithm, (j=1,…, p) values pertaining to R, R= correlations
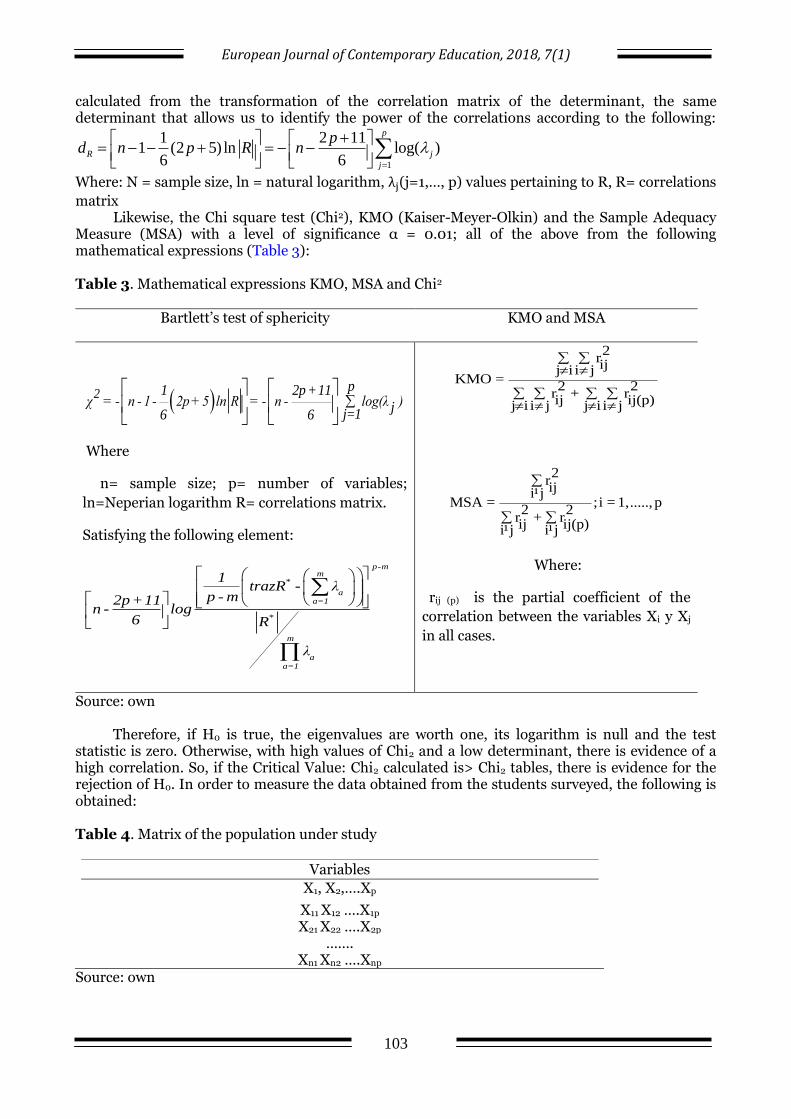
matrix Likewise, the Chi square test (Chi2), KMO (Kaiser-Meyer-Olkin) and the Sample Adequacy
Measure (MSA) with a level of significance α = 0.01; all of the above from the following mathematical expressions (Table 3): Table 3. Mathematical expressions KMO, MSA and Chi2
Bartlett’s test of sphericity KMO and MSA
2p1 2p+11
χ = - n - 1- 2p+5 ln R = - n - log(λ )jj=16 6
Where
n= sample size; p= number of variables;
ln=Neperian logarithm R= correlations matrix.
Satisfying the following element:
p-mm
*
aa=1
*
m
aa=1
1trazR - λ
p - m2p+11n - log
6 R
λ
2rijj i i j
KMO =2 2
r + rij ij(p)j i i j j i i j
2riji¹j
MSA = ;i = 1,....., p2 2
r + rij ij(p)i¹j i¹j
Where:
rij (p) is the partial coefficient of the
correlation between the variables Xi y Xj
in all cases.
Source: own
Therefore, if H0 is true, the eigenvalues are worth one, its logarithm is null and the test statistic is zero. Otherwise, with high values of Chi2 and a low determinant, there is evidence of a high correlation. So, if the Critical Value: Chi2 calculated is> Chi2 tables, there is evidence for the rejection of H0. In order to measure the data obtained from the students surveyed, the following is obtained: Table 4. Matrix of the population under study
Variables
X1, X2,….Xp
X11 X12 ….X1p
X21 X22 ….X2p
……. Xn1 Xn2 ….Xnp
Source: own
European Journal of Contemporary Education, 2018, 7(1)
104
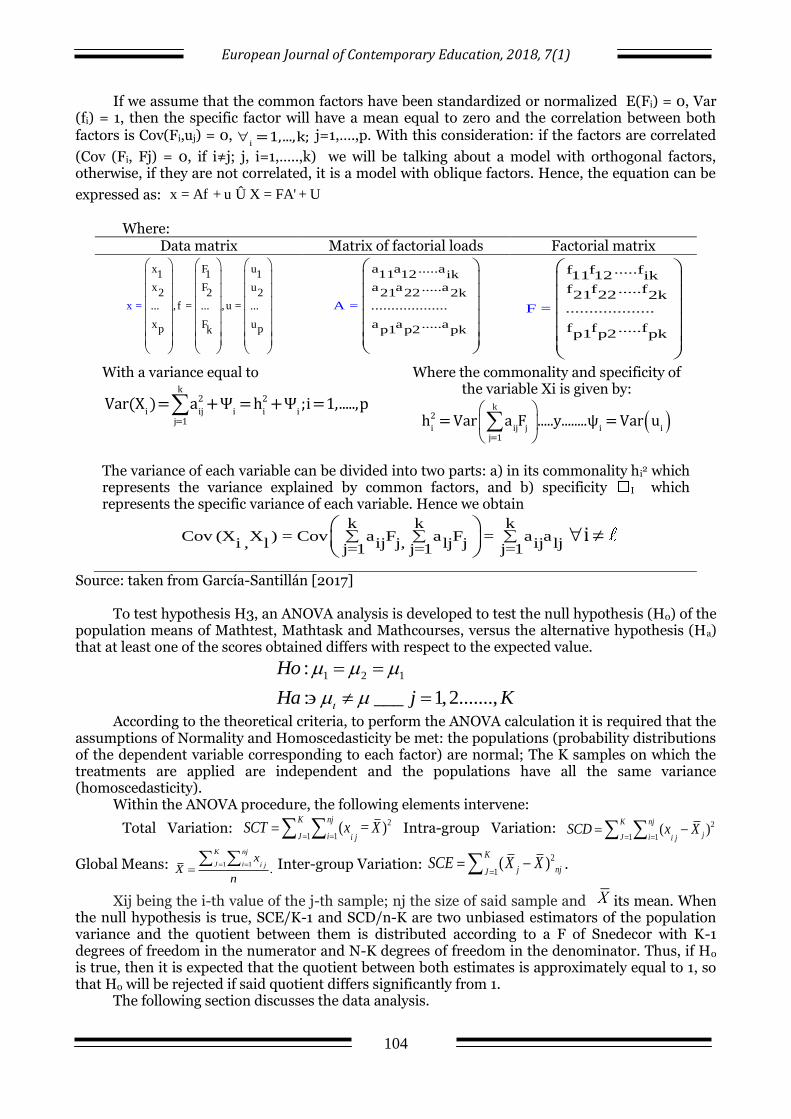
If we assume that the common factors have been standardized or normalized E(Fi) = 0, Var (fi) = 1, then the specific factor will have a mean equal to zero and the correlation between both factors is Cov(Fi,uj) = 0,
i=1,...,k; j=1,….,p. With this consideration: if the factors are correlated
(Cov (Fi, Fj) = 0, if i≠j; j, i=1,…..,k) we will be talking about a model with orthogonal factors, otherwise, if they are not correlated, it is a model with oblique factors. Hence, the equation can be
expressed as: x = Af + u Û X = FA' + U
Where: Data matrix Matrix of factorial loads Factorial matrix
x F u1 1 1
x F u2 2 2
, f = ,u =... ... ..x .
x F up pk
=
a a .....a11 12 ik
a a .....a21 22 2k
...................
a a .....ap1 p2 p
A =
k
f f .....f11 12 ik
f f .....f21 22 2k
...................
f f .....fp1 p2 p
F =
k
With a variance equal to
k
2 2
i ij i i ij=1
Var(X )= a +Ψ =h +Ψ ;i=1,.....,p
Where the commonality and specificity of the variable Xi is given by:
k
2
i ij j i ij=1
h =Var a F .....y........ψ =Var u
The variance of each variable can be divided into two parts: a) in its commonality hi2 which
represents the variance explained by common factors, and b) specificity I which represents the specific variance of each variable. Hence we obtain
k k k
Cov (X X ) = Cov a F a F = a ai , l ij j, lj j ij ljj=1 j=1 j=1
i
Source: taken from García-Santillán [2017]
To test hypothesis H3, an ANOVA analysis is developed to test the null hypothesis (H0) of the population means of Mathtest, Mathtask and Mathcourses, versus the alternative hypothesis (Ha) that at least one of the scores obtained differs with respect to the expected value.
1 2 1:
: ___ 1,2.......,
Ho
Ha j K
According to the theoretical criteria, to perform the ANOVA calculation it is required that the assumptions of Normality and Homoscedasticity be met: the populations (probability distributions of the dependent variable corresponding to each factor) are normal; The K samples on which the treatments are applied are independent and the populations have all the same variance (homoscedasticity).
Within the ANOVA procedure, the following elements intervene:
Total Variation: 2
1 1( )
K nj
J i i jSCT x X
Intra-group Variation: 2
1 1( )
K nj
jJ i i jSCD x X
Global Means: 1 1.
K nj
J i i jx
Xn
Inter-group Variation:
2
1( )
K
j njJSCE X X
.
Xij being the i-th value of the j-th sample; nj the size of said sample and its mean. When the null hypothesis is true, SCE/K-1 and SCD/n-K are two unbiased estimators of the population variance and the quotient between them is distributed according to a F of Snedecor with K-1 degrees of freedom in the numerator and N-K degrees of freedom in the denominator. Thus, if H0 is true, then it is expected that the quotient between both estimates is approximately equal to 1, so that H0 will be rejected if said quotient differs significantly from 1.
The following section discusses the data analysis.
European Journal of Contemporary Education, 2018, 7(1)
105
4. Data analysis To answer the main research question and thereby achieve the purpose of the study, we
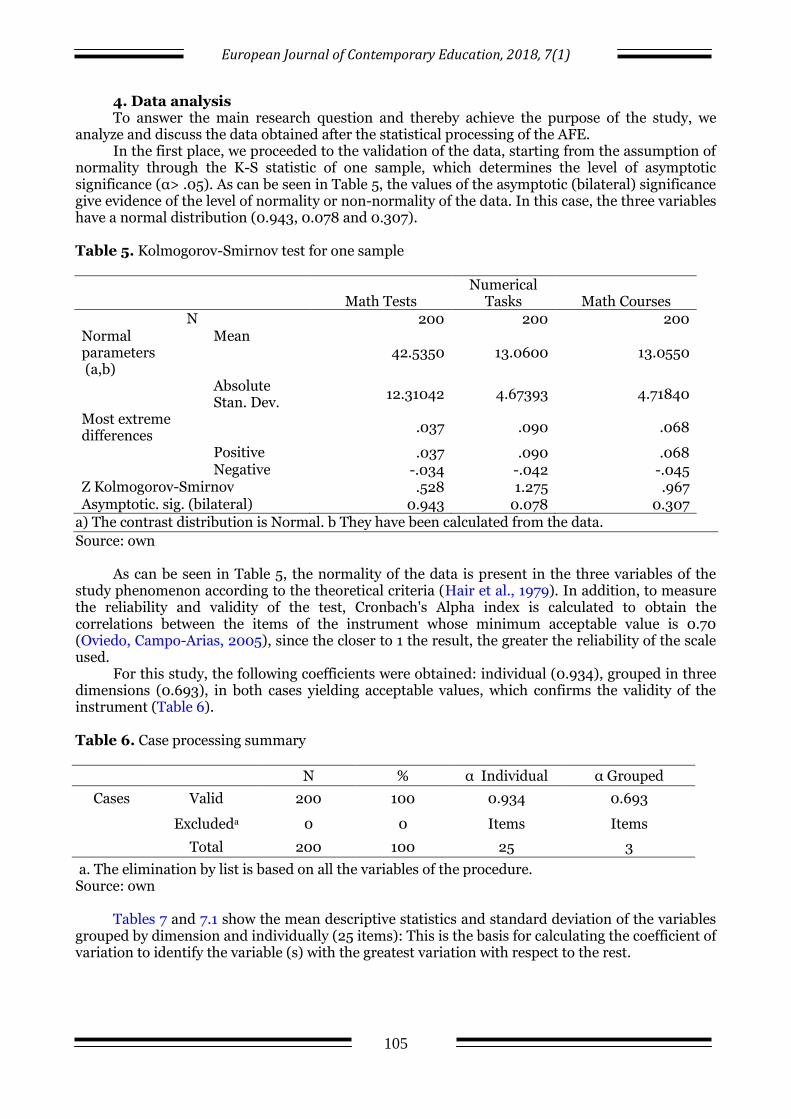
analyze and discuss the data obtained after the statistical processing of the AFE. In the first place, we proceeded to the validation of the data, starting from the assumption of
normality through the K-S statistic of one sample, which determines the level of asymptotic significance (α> .05). As can be seen in Table 5, the values of the asymptotic (bilateral) significance give evidence of the level of normality or non-normality of the data. In this case, the three variables have a normal distribution (0.943, 0.078 and 0.307).
Table 5. Kolmogorov-Smirnov test for one sample
Math Tests Numerical
Tasks Math Courses N 200 200 200
Normal parameters (a,b)
Mean 42.5350 13.0600 13.0550
Absolute Stan. Dev.
12.31042 4.67393 4.71840
Most extreme differences
.037 .090 .068
Positive .037 .090 .068 Negative -.034 -.042 -.045 Z Kolmogorov-Smirnov .528 1.275 .967 Asymptotic. sig. (bilateral) 0.943 0.078 0.307
a) The contrast distribution is Normal. b They have been calculated from the data.
Source: own
As can be seen in Table 5, the normality of the data is present in the three variables of the study phenomenon according to the theoretical criteria (Hair et al., 1979). In addition, to measure the reliability and validity of the test, Cronbach's Alpha index is calculated to obtain the correlations between the items of the instrument whose minimum acceptable value is 0.70 (Oviedo, Campo-Arias, 2005), since the closer to 1 the result, the greater the reliability of the scale used.
For this study, the following coefficients were obtained: individual (0.934), grouped in three dimensions (0.693), in both cases yielding acceptable values, which confirms the validity of the instrument (Table 6). Table 6. Case processing summary
N % α Individual α Grouped
Cases Valid 200 100 0.934 0.693
Excludeda 0 0 Items Items
Total 200 100 25 3
a. The elimination by list is based on all the variables of the procedure. Source: own
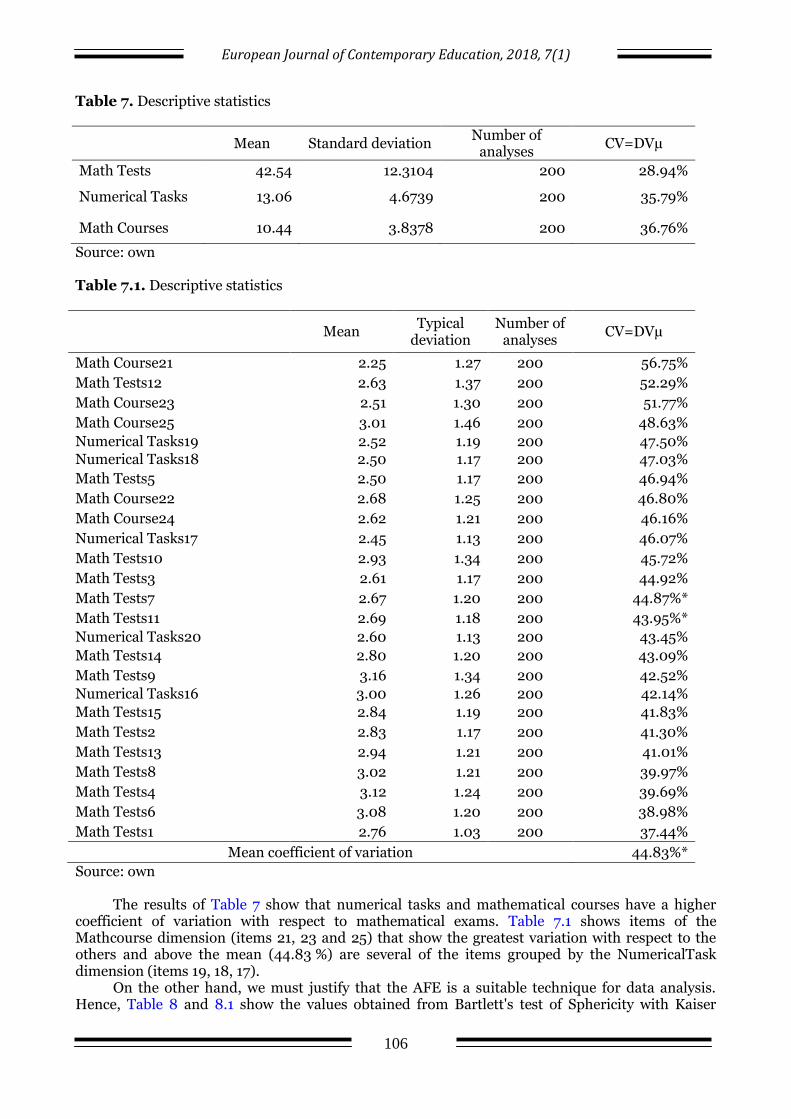
Tables 7 and 7.1 show the mean descriptive statistics and standard deviation of the variables
grouped by dimension and individually (25 items): This is the basis for calculating the coefficient of variation to identify the variable (s) with the greatest variation with respect to the rest.
European Journal of Contemporary Education, 2018, 7(1)
106
Table 7. Descriptive statistics
Mean Standard deviation Number of
analyses CV=DVµ
Math Tests 42.54 12.3104 200 28.94%
Numerical Tasks 13.06 4.6739 200 35.79%
Math Courses 10.44 3.8378 200 36.76%
Source: own Table 7.1. Descriptive statistics
Mean Typical
deviation Number of
analyses CV=DVµ
Math Course21 2.25 1.27 200 56.75%
Math Tests12 2.63 1.37 200 52.29%
Math Course23 2.51 1.30 200 51.77%
Math Course25 3.01 1.46 200 48.63%
Numerical Tasks19 2.52 1.19 200 47.50%
Numerical Tasks18 2.50 1.17 200 47.03%
Math Tests5 2.50 1.17 200 46.94%
Math Course22 2.68 1.25 200 46.80%
Math Course24 2.62 1.21 200 46.16%
Numerical Tasks17 2.45 1.13 200 46.07%
Math Tests10 2.93 1.34 200 45.72%
Math Tests3 2.61 1.17 200 44.92%
Math Tests7 2.67 1.20 200 44.87%*
Math Tests11 2.69 1.18 200 43.95%*
Numerical Tasks20 2.60 1.13 200 43.45%
Math Tests14 2.80 1.20 200 43.09%
Math Tests9 3.16 1.34 200 42.52%
Numerical Tasks16 3.00 1.26 200 42.14%
Math Tests15 2.84 1.19 200 41.83%
Math Tests2 2.83 1.17 200 41.30%
Math Tests13 2.94 1.21 200 41.01%
Math Tests8 3.02 1.21 200 39.97%
Math Tests4 3.12 1.24 200 39.69%
Math Tests6 3.08 1.20 200 38.98%
Math Tests1 2.76 1.03 200 37.44%
Mean coefficient of variation 44.83%*
Source: own
The results of Table 7 show that numerical tasks and mathematical courses have a higher coefficient of variation with respect to mathematical exams. Table 7.1 shows items of the Mathcourse dimension (items 21, 23 and 25) that show the greatest variation with respect to the others and above the mean (44.83 %) are several of the items grouped by the NumericalTask dimension (items 19, 18, 17).
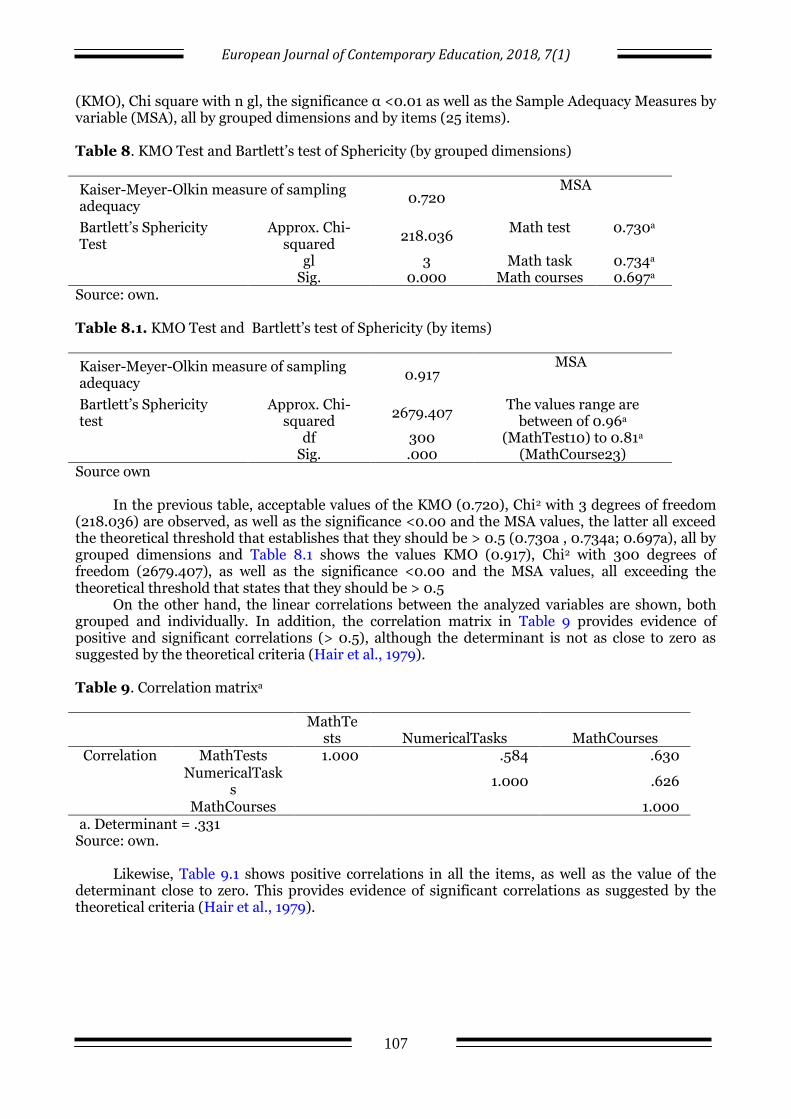
On the other hand, we must justify that the AFE is a suitable technique for data analysis. Hence, Table 8 and 8.1 show the values obtained from Bartlett's test of Sphericity with Kaiser
European Journal of Contemporary Education, 2018, 7(1)
107
(KMO), Chi square with n gl, the significance α <0.01 as well as the Sample Adequacy Measures by variable (MSA), all by grouped dimensions and by items (25 items).
Table 8. KMO Test and Bartlett’s test of Sphericity (by grouped dimensions)
Kaiser-Meyer-Olkin measure of sampling adequacy
0.720 MSA
Bartlett’s Sphericity Test
Approx. Chi-squared
218.036 Math test 0.730a
gl 3 Math task 0.734a Sig. 0.000 Math courses 0.697a
Source: own. Table 8.1. KMO Test and Bartlett’s test of Sphericity (by items)
Kaiser-Meyer-Olkin measure of sampling adequacy
0.917 MSA
Bartlett’s Sphericity test
Approx. Chi-squared
2679.407 The values range are
between of 0.96a (MathTest10) to 0.81a
(MathCourse23) df 300
Sig. .000 Source own
In the previous table, acceptable values of the KMO (0.720), Chi2 with 3 degrees of freedom
(218.036) are observed, as well as the significance <0.00 and the MSA values, the latter all exceed the theoretical threshold that establishes that they should be > 0.5 (0.730a , 0.734a; 0.697a), all by grouped dimensions and Table 8.1 shows the values KMO (0.917), Chi2 with 300 degrees of freedom (2679.407), as well as the significance <0.00 and the MSA values, all exceeding the theoretical threshold that states that they should be > 0.5
On the other hand, the linear correlations between the analyzed variables are shown, both grouped and individually. In addition, the correlation matrix in Table 9 provides evidence of positive and significant correlations (> 0.5), although the determinant is not as close to zero as suggested by the theoretical criteria (Hair et al., 1979).
Table 9. Correlation matrixa
MathTe
sts NumericalTasks MathCourses Correlation MathTests 1.000 .584 .630
NumericalTasks
1.000 .626
MathCourses 1.000 a. Determinant = .331
Source: own.
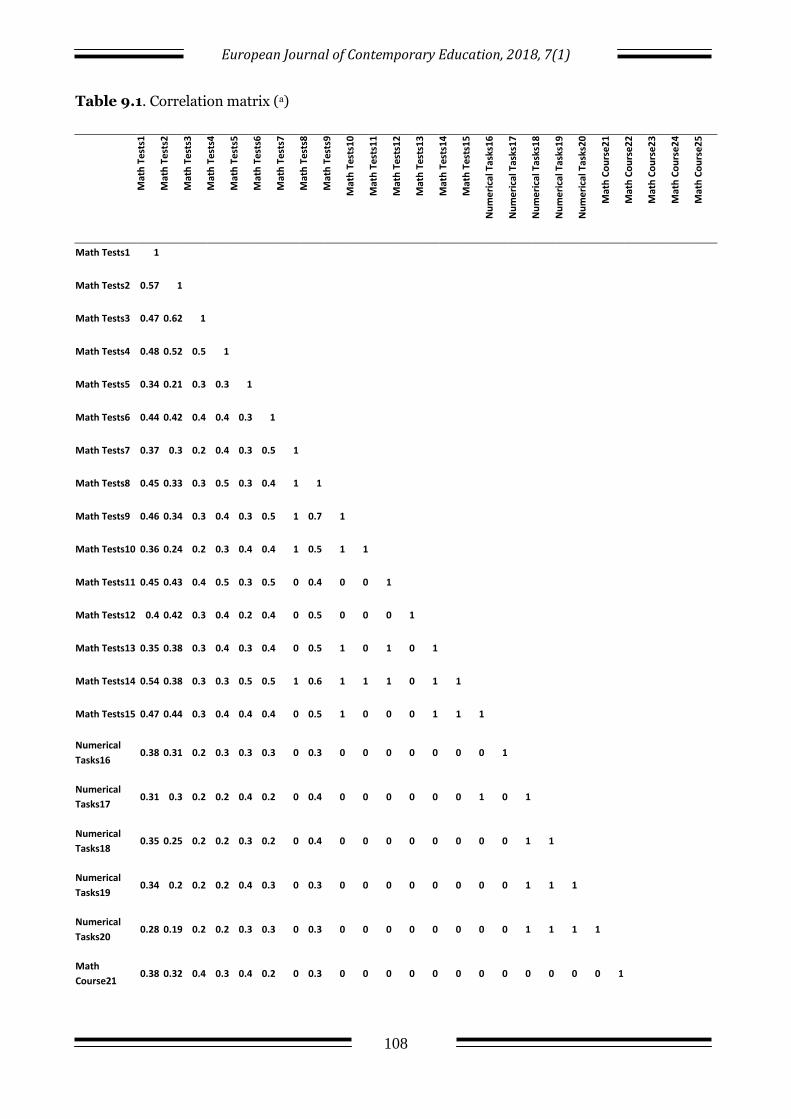
Likewise, Table 9.1 shows positive correlations in all the items, as well as the value of the determinant close to zero. This provides evidence of significant correlations as suggested by the theoretical criteria (Hair et al., 1979).
European Journal of Contemporary Education, 2018, 7(1)
108
Table 9.1. Correlation matrix (a)
Mat
h T
ests
1
Mat
h T
ests
2
Mat
h T
ests
3
Mat
h T
ests
4
Mat
h T
ests
5
Mat
h T
ests
6
Mat
h T
ests
7
Mat
h T
ests
8
Mat
h T
ests
9
Mat
h T
ests
10
Mat
h T
ests
11
Mat
h T
ests
12
Mat
h T
ests
13
Mat
h T
ests
14
Mat
h T
ests
15
Nu
me
rica
l Tas
ks1
6
Nu
me
rica
l Tas
ks1
7
Nu
me
rica
l Tas
ks1
8
Nu
me
rica
l Tas
ks1
9
Nu
me
rica
l Tas
ks2
0
Mat
h C
ou
rse
21
Mat
h C
ou
rse
22
Mat
h C
ou
rse
23
Mat
h C
ou
rse
24
Mat
h C
ou
rse
25
Math Tests1 1
Math Tests2 0.57 1
Math Tests3 0.47 0.62 1
Math Tests4 0.48 0.52 0.5 1
Math Tests5 0.34 0.21 0.3 0.3 1
Math Tests6 0.44 0.42 0.4 0.4 0.3 1
Math Tests7 0.37 0.3 0.2 0.4 0.3 0.5 1
Math Tests8 0.45 0.33 0.3 0.5 0.3 0.4 1 1
Math Tests9 0.46 0.34 0.3 0.4 0.3 0.5 1 0.7 1
Math Tests10 0.36 0.24 0.2 0.3 0.4 0.4 1 0.5 1 1
Math Tests11 0.45 0.43 0.4 0.5 0.3 0.5 0 0.4 0 0 1
Math Tests12 0.4 0.42 0.3 0.4 0.2 0.4 0 0.5 0 0 0 1
Math Tests13 0.35 0.38 0.3 0.4 0.3 0.4 0 0.5 1 0 1 0 1
Math Tests14 0.54 0.38 0.3 0.3 0.5 0.5 1 0.6 1 1 1 0 1 1
Math Tests15 0.47 0.44 0.3 0.4 0.4 0.4 0 0.5 1 0 0 0 1 1 1
Numerical
Tasks16 0.38 0.31 0.2 0.3 0.3 0.3 0 0.3 0 0 0 0 0 0 0 1
Numerical
Tasks17 0.31 0.3 0.2 0.2 0.4 0.2 0 0.4 0 0 0 0 0 0 1 0 1
Numerical
Tasks18 0.35 0.25 0.2 0.2 0.3 0.2 0 0.4 0 0 0 0 0 0 0 0 1 1
Numerical
Tasks19 0.34 0.2 0.2 0.2 0.4 0.3 0 0.3 0 0 0 0 0 0 0 0 1 1 1
Numerical
Tasks20 0.28 0.19 0.2 0.2 0.3 0.3 0 0.3 0 0 0 0 0 0 0 0 1 1 1 1
Math
Course21 0.38 0.32 0.4 0.3 0.4 0.2 0 0.3 0 0 0 0 0 0 0 0 0 0 0 0 1
European Journal of Contemporary Education, 2018, 7(1)
109
Math
Course22 0.41 0.25 0.3 0.3 0.5 0.3 0 0.5 0 0 0 0 0 0 0 0 0 0 0 0 1 1
Math
Course23 0.26 0.4 0.4 0.4 0.2 0.2 0 0.3 0 0 0 0 0 0 0 0 0 0 0 0 1 0 1
Math
Course24 0.32 0.28 0.3 0.2 0.3 0.3 0 0.4 0 0 0 0 0 0 0 0 0 0 0 0 0 1 0 1
Math
Course25 0.31 0.18 0.1 0.2 0.4 0.2 0 0.4 0 0 0 0 0 0 0 0 0 0 0 0 0 1 0 0 1
Determinant = 7.42E-007 Source: own
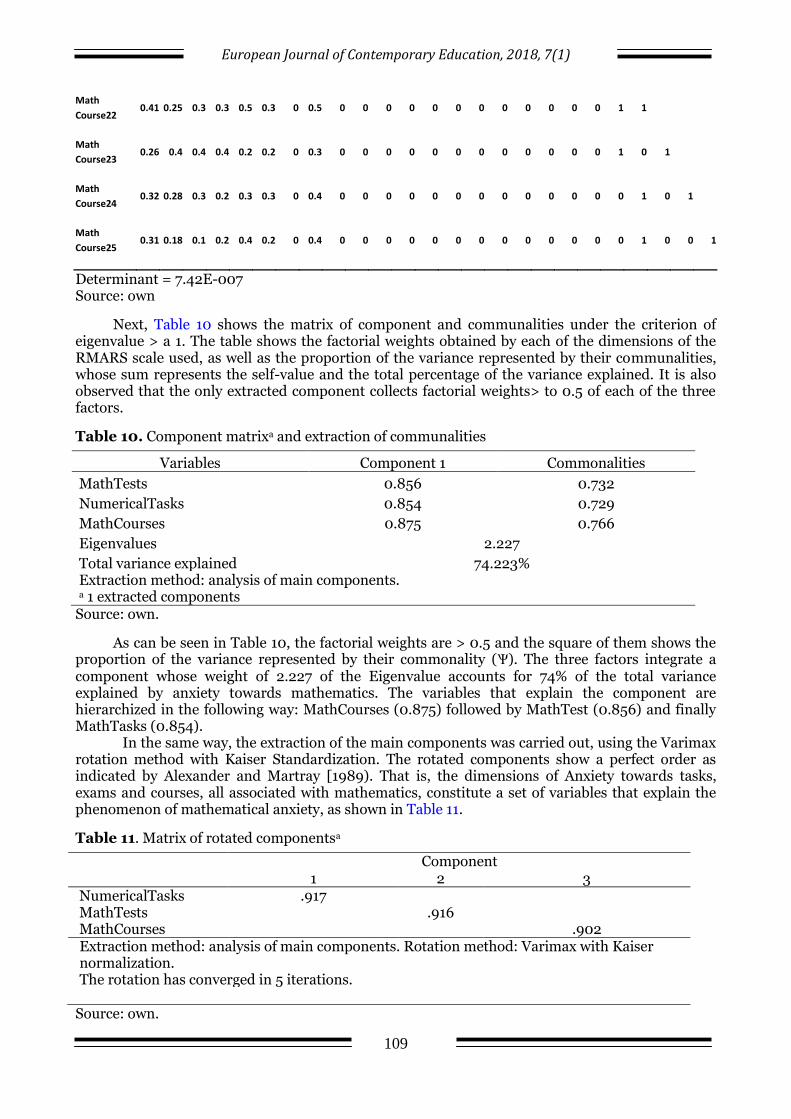
Next, Table 10 shows the matrix of component and communalities under the criterion of eigenvalue > a 1. The table shows the factorial weights obtained by each of the dimensions of the RMARS scale used, as well as the proportion of the variance represented by their communalities, whose sum represents the self-value and the total percentage of the variance explained. It is also observed that the only extracted component collects factorial weights> to 0.5 of each of the three factors.
Table 10. Component matrixa and extraction of communalities
Variables Component 1 Commonalities
MathTests 0.856 0.732
NumericalTasks 0.854 0.729
MathCourses 0.875 0.766
Eigenvalues 2.227
Total variance explained 74.223% Extraction method: analysis of main components.
a 1 extracted components Source: own.
As can be seen in Table 10, the factorial weights are > 0.5 and the square of them shows the proportion of the variance represented by their commonality (Ѱ). The three factors integrate a component whose weight of 2.227 of the Eigenvalue accounts for 74% of the total variance explained by anxiety towards mathematics. The variables that explain the component are hierarchized in the following way: MathCourses (0.875) followed by MathTest (0.856) and finally MathTasks (0.854).
In the same way, the extraction of the main components was carried out, using the Varimax rotation method with Kaiser Standardization. The rotated components show a perfect order as indicated by Alexander and Martray [1989). That is, the dimensions of Anxiety towards tasks, exams and courses, all associated with mathematics, constitute a set of variables that explain the phenomenon of mathematical anxiety, as shown in Table 11.
Table 11. Matrix of rotated componentsa
Component
1 2 3 NumericalTasks .917 MathTests .916 MathCourses .902 Extraction method: analysis of main components. Rotation method: Varimax with Kaiser normalization. The rotation has converged in 5 iterations.
Source: own.
European Journal of Contemporary Education, 2018, 7(1)
110
With the previous analysis, we can say that hypotheses H1 and H2 are checked. If there is a set of latent variables that explain mathematical anxiety, the value of the calculated Chi2 gave evidence of this assertion, since the calculated Chi2 exceeds the theoretical criterion of theoretical Chi2 in both cases. In addition, anxiety is explained by at least one factor as indicated in Table 10 and in the rotated matrix described in Table 11.
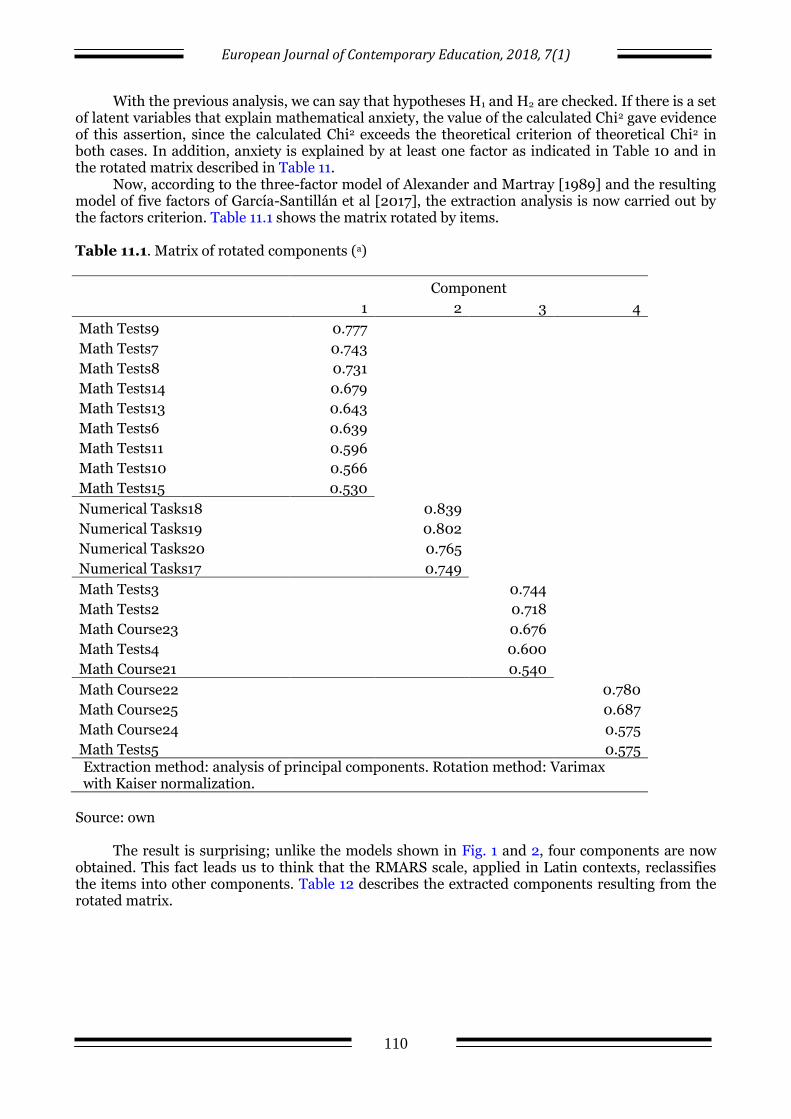
Now, according to the three-factor model of Alexander and Martray [1989] and the resulting model of five factors of García-Santillán et al [2017], the extraction analysis is now carried out by the factors criterion. Table 11.1 shows the matrix rotated by items.
Table 11.1. Matrix of rotated components (a)
Component
1 2 3 4
Math Tests9 0.777
Math Tests7 0.743
Math Tests8 0.731
Math Tests14 0.679
Math Tests13 0.643
Math Tests6 0.639
Math Tests11 0.596
Math Tests10 0.566
Math Tests15 0.530
Numerical Tasks18 0.839
Numerical Tasks19 0.802
Numerical Tasks20 0.765
Numerical Tasks17 0.749
Math Tests3 0.744
Math Tests2 0.718
Math Course23 0.676
Math Tests4 0.600
Math Course21 0.540
Math Course22 0.780
Math Course25 0.687
Math Course24 0.575
Math Tests5 0.575 Extraction method: analysis of principal components. Rotation method: Varimax with Kaiser normalization.
Source: own
The result is surprising; unlike the models shown in Fig. 1 and 2, four components are now
obtained. This fact leads us to think that the RMARS scale, applied in Latin contexts, reclassifies the items into other components. Table 12 describes the extracted components resulting from the rotated matrix.
European Journal of Contemporary Education, 2018, 7(1)
111
Table 12. Extracted components
Component 1
Component 2 Component 3 Component 4
9.- Think about an upcoming math exam one hour before (0.777) 7.- Think about an upcoming math exam one week before (0.743) 8.- Think about an upcoming math exam one day before (0.731) 14.- Study for a math exam (0.679) 13.- Open a math or physics textbook and see a page full of problems (0.643) 6.- Receive an assignment with several difficult problems which must be turned in the following class (0.639) 11.- Grab a math book to start a difficult task that involves reading mathematical theory (0.596) 10.- Realize you have to take math classes during the three years of middle and high school (0.566) 15.- The moment you receive a test during a math class (0.530)
18.- Receive a series of subtraction problems to solve (0.839) 19.- Receive a series of multiplication problems to solve (0.802) 20.- Receive a series of division problems to solve (0.765) 17.- Receive a series of numbers to add on paper (0.749
3.- Present a quiz during a math class (0.744) 2.- Present the math section of an institutional exam(0.718) 23.- Register for a math class (0.676) 4.- Present the final exam during a math class (0.600) 21.- Buy a math textbook(0.540)
22.- Watch the teacher solve a math equation on the board (0.780) 25.- Enter math class (0.687) 24.- Listen to another student explaining a math problem to someone else (0.575) 5.- Grab a math book to start an assignment (0.575)
Source: own
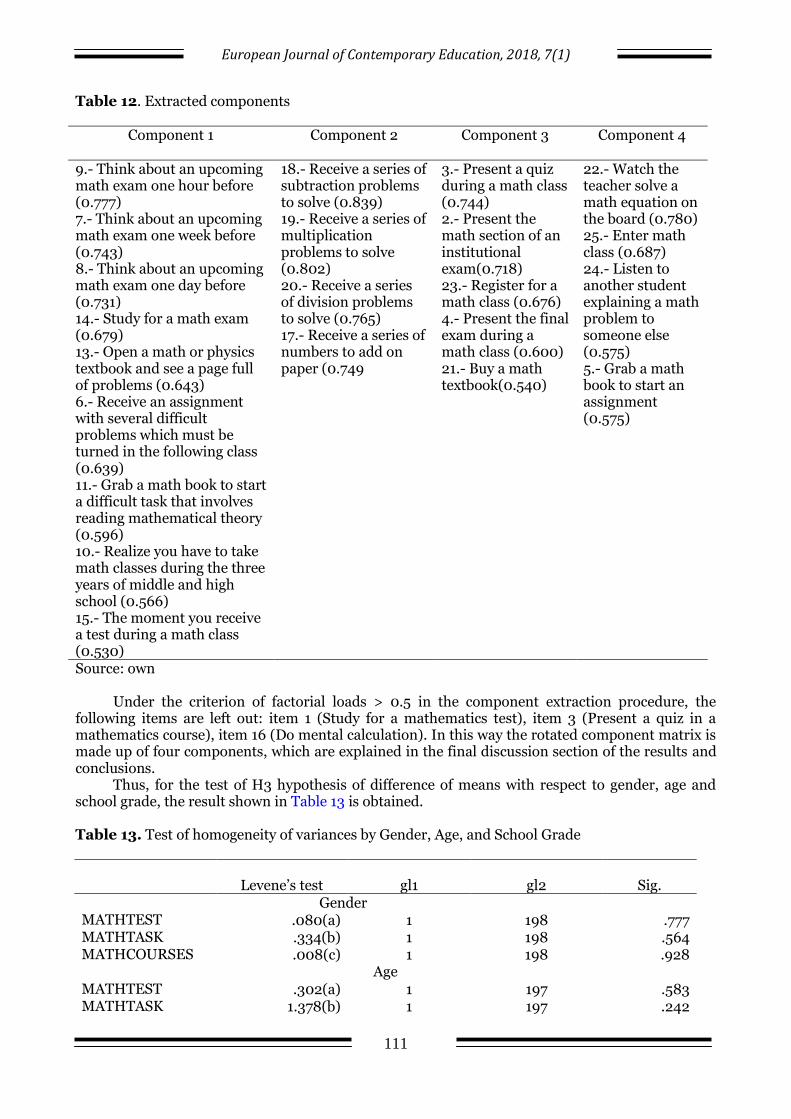
Under the criterion of factorial loads > 0.5 in the component extraction procedure, the following items are left out: item 1 (Study for a mathematics test), item 3 (Present a quiz in a mathematics course), item 16 (Do mental calculation). In this way the rotated component matrix is made up of four components, which are explained in the final discussion section of the results and conclusions.
Thus, for the test of H3 hypothesis of difference of means with respect to gender, age and school grade, the result shown in Table 13 is obtained.
Table 13. Test of homogeneity of variances by Gender, Age, and School Grade
Levene’s test gl1 gl2 Sig. Gender MATHTEST .080(a) 1 198 .777 MATHTASK .334(b) 1 198 .564 MATHCOURSES .008(c) 1 198 .928
Age MATHTEST .302(a) 1 197 .583 MATHTASK 1.378(b) 1 197 .242
European Journal of Contemporary Education, 2018, 7(1)
112
MATHCOURSES 3.461(c) 1 197 .064 School grade
MATHTEST 1.147(a) 2 197 .320 MATHTASK 2.147(b) 2 197 .120 MATHCOURSES .059(c) 2 197 .943
a Groups with a single case will be ignored when calculating the homogeneity of variance test for MATHTEST. b Groups with a single case will be ignored when calculating the homogeneity of variance test for MATHTASK. c Groups with a single case will be ignored when calculating the homogeneity of variance test for MATHCOURSES.
Source: own
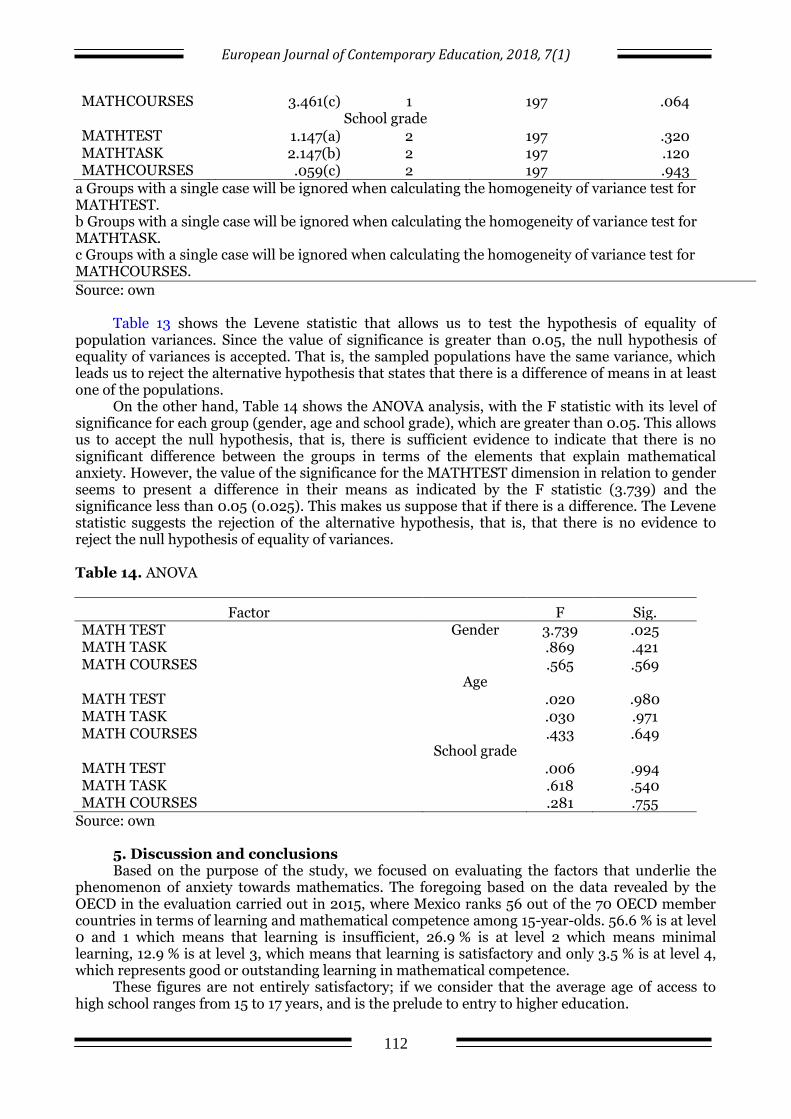
Table 13 shows the Levene statistic that allows us to test the hypothesis of equality of population variances. Since the value of significance is greater than 0.05, the null hypothesis of equality of variances is accepted. That is, the sampled populations have the same variance, which leads us to reject the alternative hypothesis that states that there is a difference of means in at least one of the populations.
On the other hand, Table 14 shows the ANOVA analysis, with the F statistic with its level of significance for each group (gender, age and school grade), which are greater than 0.05. This allows us to accept the null hypothesis, that is, there is sufficient evidence to indicate that there is no significant difference between the groups in terms of the elements that explain mathematical anxiety. However, the value of the significance for the MATHTEST dimension in relation to gender seems to present a difference in their means as indicated by the F statistic (3.739) and the significance less than 0.05 (0.025). This makes us suppose that if there is a difference. The Levene statistic suggests the rejection of the alternative hypothesis, that is, that there is no evidence to reject the null hypothesis of equality of variances. Table 14. ANOVA
Factor F Sig. MATH TEST Gender 3.739 .025 MATH TASK .869 .421 MATH COURSES .565 .569 Age MATH TEST .020 .980 MATH TASK .030 .971 MATH COURSES .433 .649 School grade MATH TEST .006 .994 MATH TASK .618 .540 MATH COURSES .281 .755
Source: own 5. Discussion and conclusions Based on the purpose of the study, we focused on evaluating the factors that underlie the
phenomenon of anxiety towards mathematics. The foregoing based on the data revealed by the OECD in the evaluation carried out in 2015, where Mexico ranks 56 out of the 70 OECD member countries in terms of learning and mathematical competence among 15-year-olds. 56.6 % is at level 0 and 1 which means that learning is insufficient, 26.9 % is at level 2 which means minimal learning, 12.9 % is at level 3, which means that learning is satisfactory and only 3.5 % is at level 4, which represents good or outstanding learning in mathematical competence.
These figures are not entirely satisfactory; if we consider that the average age of access to high school ranges from 15 to 17 years, and is the prelude to entry to higher education.
European Journal of Contemporary Education, 2018, 7(1)
113
In this study, we used the RMARS scale, which presented acceptable indicators of internal consistency with Cronbach's Alpha scores for all items of 0.934 and a grouped 0.693, which shows a concordance with the reliability indexes collected in studies by García-Santillán et al. [2017].
Among the important findings in this empirical study carried out among Telebachillerato students from the municipalities of Zacatal and Jamapa in the state of Veracruz Mexico, they show empirical evidence to affirm that mathematical anxiety depends on 74.22 % of the variables, mathematical exams, numerical tasks, and mathematical courses. This means that if these variables are present in Telebachillerato students the level of anxiety towards mathematics will be high.
However, undoubtedly the most important finding appeared when analyzing the data through the statistical procedure of extraction of components by the factor criterion. This refers to the matrix of rotated component obtained (Table 11.1), since the data aligned to a model of four factors, not the three of Alexander and Martray, nor the five factors that García-Santillán et al [2017] obtained as shown in Fig. 1 and 2.
Now, analyzing the indicators that were grouped in each one of the extracted components, we could think that the sense and interpretation that the students give to each one of these items, changes depending on the context; that is a population studied in Mexican territory may differ in interpreting.
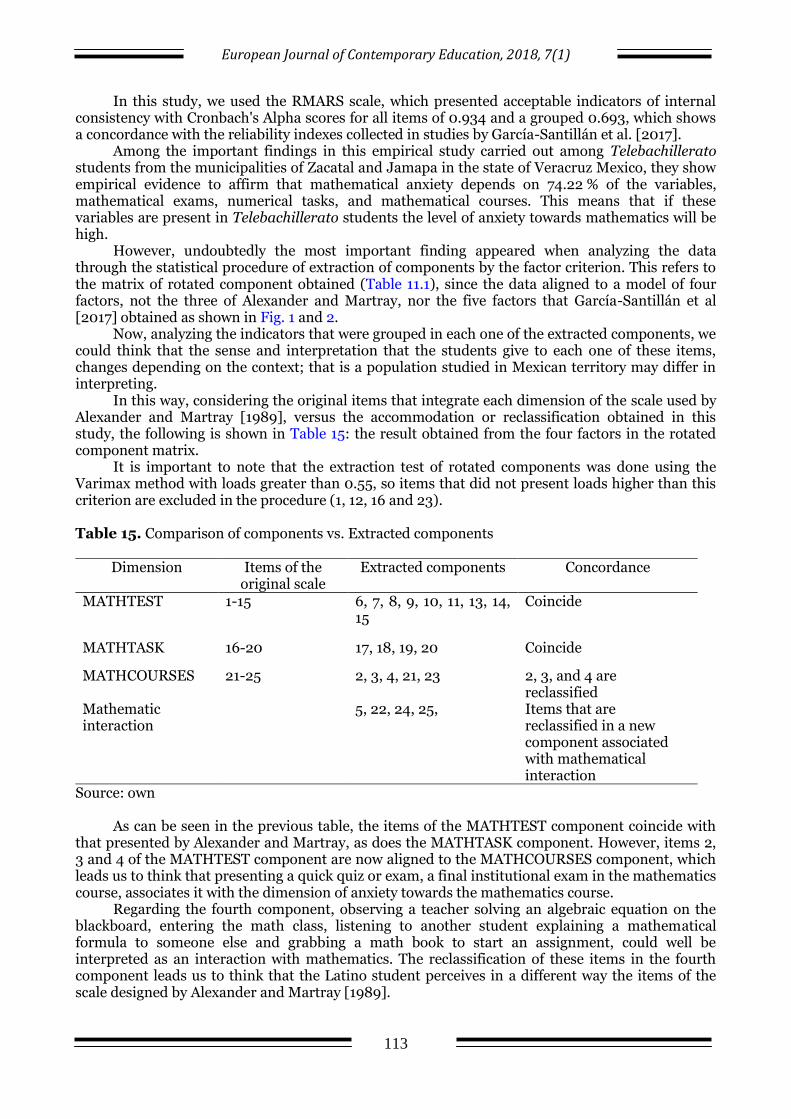
In this way, considering the original items that integrate each dimension of the scale used by Alexander and Martray [1989], versus the accommodation or reclassification obtained in this study, the following is shown in Table 15: the result obtained from the four factors in the rotated component matrix.
It is important to note that the extraction test of rotated components was done using the Varimax method with loads greater than 0.55, so items that did not present loads higher than this criterion are excluded in the procedure (1, 12, 16 and 23).
Table 15. Comparison of components vs. Extracted components
Dimension Items of the original scale
Extracted components Concordance
MATHTEST 1-15 6, 7, 8, 9, 10, 11, 13, 14, 15
Coincide
MATHTASK 16-20 17, 18, 19, 20 Coincide
MATHCOURSES 21-25 2, 3, 4, 21, 23 2, 3, and 4 are reclassified
Mathematic interaction
5, 22, 24, 25, Items that are reclassified in a new component associated with mathematical interaction
Source: own
As can be seen in the previous table, the items of the MATHTEST component coincide with that presented by Alexander and Martray, as does the MATHTASK component. However, items 2, 3 and 4 of the MATHTEST component are now aligned to the MATHCOURSES component, which leads us to think that presenting a quick quiz or exam, a final institutional exam in the mathematics course, associates it with the dimension of anxiety towards the mathematics course.
Regarding the fourth component, observing a teacher solving an algebraic equation on the blackboard, entering the math class, listening to another student explaining a mathematical formula to someone else and grabbing a math book to start an assignment, could well be interpreted as an interaction with mathematics. The reclassification of these items in the fourth component leads us to think that the Latino student perceives in a different way the items of the scale designed by Alexander and Martray [1989].
European Journal of Contemporary Education, 2018, 7(1)
114
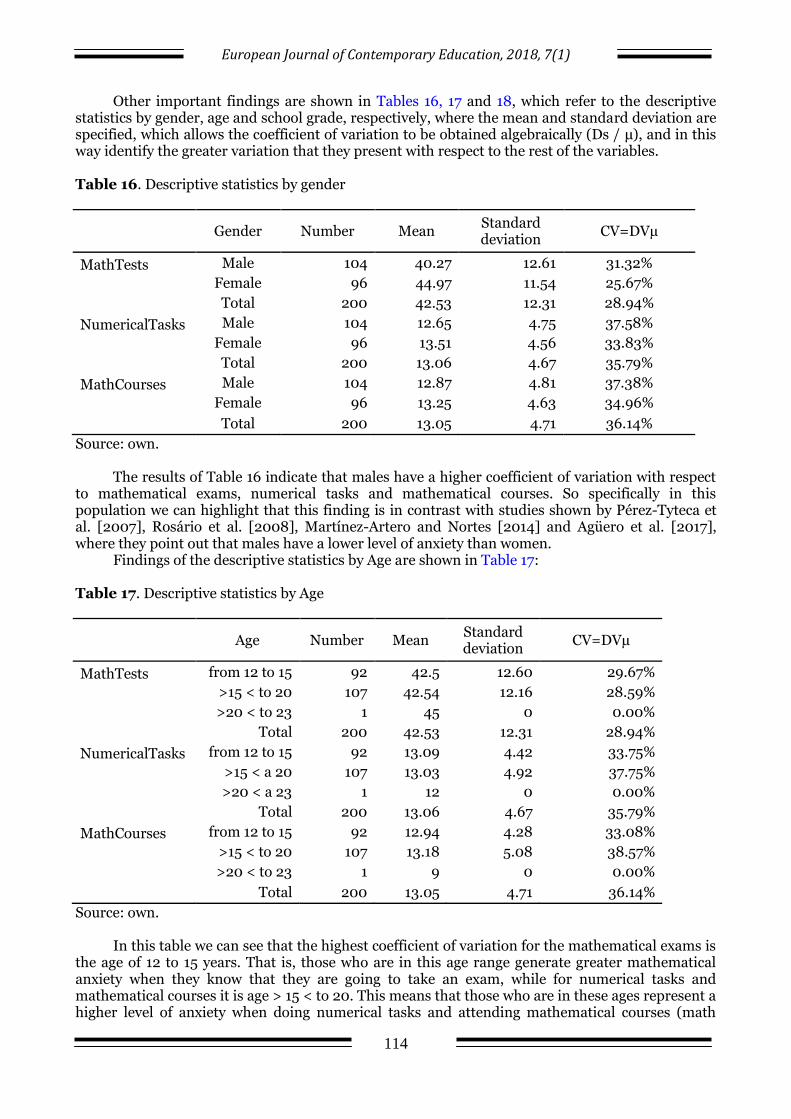
Other important findings are shown in Tables 16, 17 and 18, which refer to the descriptive statistics by gender, age and school grade, respectively, where the mean and standard deviation are specified, which allows the coefficient of variation to be obtained algebraically (Ds / μ), and in this way identify the greater variation that they present with respect to the rest of the variables.
Table 16. Descriptive statistics by gender
Gender Number Mean Standard deviation
CV=DVµ
MathTests Male 104 40.27 12.61 31.32%
Female 96 44.97 11.54 25.67%
Total 200 42.53 12.31 28.94%
NumericalTasks Male 104 12.65 4.75 37.58%
Female 96 13.51 4.56 33.83%
Total 200 13.06 4.67 35.79%
MathCourses Male 104 12.87 4.81 37.38%
Female 96 13.25 4.63 34.96%
Total 200 13.05 4.71 36.14%
Source: own. The results of Table 16 indicate that males have a higher coefficient of variation with respect
to mathematical exams, numerical tasks and mathematical courses. So specifically in this population we can highlight that this finding is in contrast with studies shown by Pérez-Tyteca et al. [2007], Rosário et al. [2008], Martínez-Artero and Nortes [2014] and Agüero et al. [2017], where they point out that males have a lower level of anxiety than women.
Findings of the descriptive statistics by Age are shown in Table 17:
Table 17. Descriptive statistics by Age
Age Number Mean
Standard deviation
CV=DVµ
MathTests from 12 to 15 92 42.5 12.60 29.67%
>15 < to 20 107 42.54 12.16 28.59%
>20 < to 23 1 45 0 0.00%
Total 200 42.53 12.31 28.94%
NumericalTasks from 12 to 15 92 13.09 4.42 33.75%
>15 < a 20 107 13.03 4.92 37.75%
>20 < a 23 1 12 0 0.00%
Total 200 13.06 4.67 35.79%
MathCourses from 12 to 15 92 12.94 4.28 33.08%
>15 < to 20 107 13.18 5.08 38.57%
>20 < to 23 1 9 0 0.00%
Total 200 13.05 4.71 36.14%
Source: own.
In this table we can see that the highest coefficient of variation for the mathematical exams is the age of 12 to 15 years. That is, those who are in this age range generate greater mathematical anxiety when they know that they are going to take an exam, while for numerical tasks and mathematical courses it is age > 15 < to 20. This means that those who are in these ages represent a higher level of anxiety when doing numerical tasks and attending mathematical courses (math
European Journal of Contemporary Education, 2018, 7(1)
115
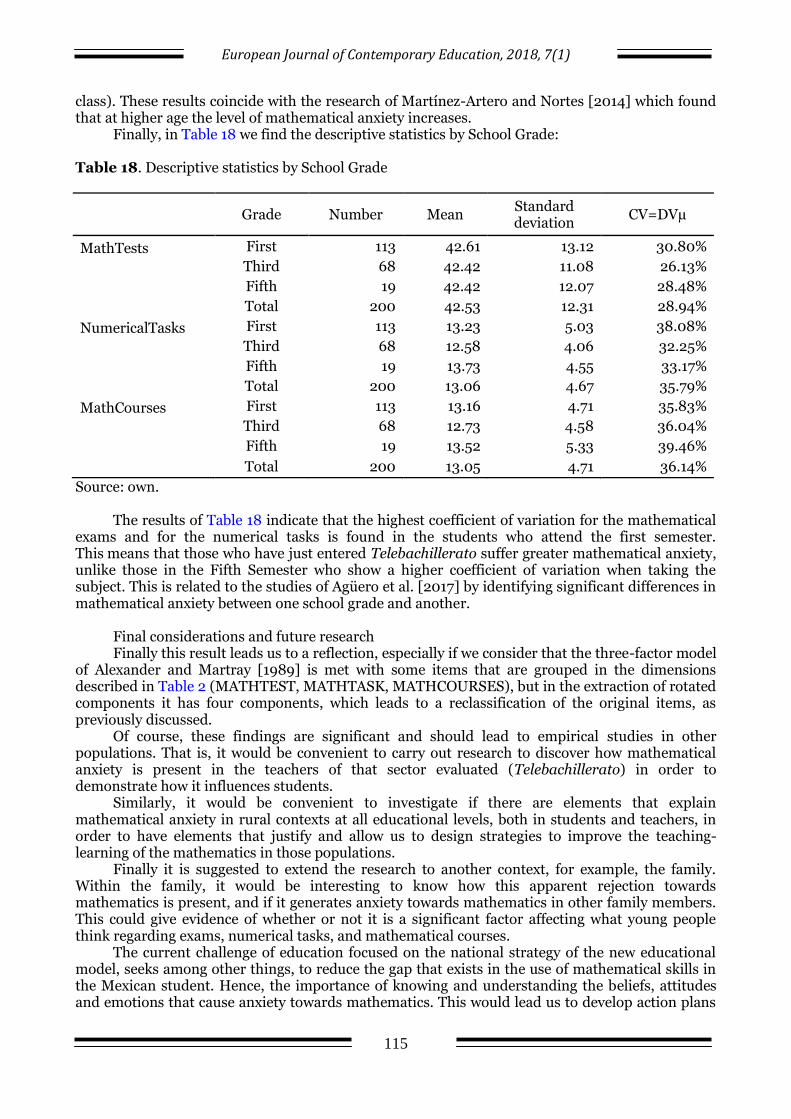
class). These results coincide with the research of Martínez-Artero and Nortes [2014] which found that at higher age the level of mathematical anxiety increases.
Finally, in Table 18 we find the descriptive statistics by School Grade:
Table 18. Descriptive statistics by School Grade
Grade Number Mean
Standard deviation
CV=DVµ
MathTests First 113 42.61 13.12 30.80%
Third 68 42.42 11.08 26.13%
Fifth 19 42.42 12.07 28.48%
Total 200 42.53 12.31 28.94%
NumericalTasks First 113 13.23 5.03 38.08%
Third 68 12.58 4.06 32.25%
Fifth 19 13.73 4.55 33.17%
Total 200 13.06 4.67 35.79%
MathCourses First 113 13.16 4.71 35.83%
Third 68 12.73 4.58 36.04%
Fifth 19 13.52 5.33 39.46%
Total 200 13.05 4.71 36.14%
Source: own. The results of Table 18 indicate that the highest coefficient of variation for the mathematical
exams and for the numerical tasks is found in the students who attend the first semester. This means that those who have just entered Telebachillerato suffer greater mathematical anxiety, unlike those in the Fifth Semester who show a higher coefficient of variation when taking the subject. This is related to the studies of Agüero et al. [2017] by identifying significant differences in mathematical anxiety between one school grade and another.
Final considerations and future research Finally this result leads us to a reflection, especially if we consider that the three-factor model
of Alexander and Martray [1989] is met with some items that are grouped in the dimensions described in Table 2 (MATHTEST, MATHTASK, MATHCOURSES), but in the extraction of rotated components it has four components, which leads to a reclassification of the original items, as previously discussed.
Of course, these findings are significant and should lead to empirical studies in other populations. That is, it would be convenient to carry out research to discover how mathematical anxiety is present in the teachers of that sector evaluated (Telebachillerato) in order to demonstrate how it influences students.
Similarly, it would be convenient to investigate if there are elements that explain mathematical anxiety in rural contexts at all educational levels, both in students and teachers, in order to have elements that justify and allow us to design strategies to improve the teaching-learning of the mathematics in those populations.
Finally it is suggested to extend the research to another context, for example, the family. Within the family, it would be interesting to know how this apparent rejection towards mathematics is present, and if it generates anxiety towards mathematics in other family members. This could give evidence of whether or not it is a significant factor affecting what young people think regarding exams, numerical tasks, and mathematical courses.
The current challenge of education focused on the national strategy of the new educational model, seeks among other things, to reduce the gap that exists in the use of mathematical skills in the Mexican student. Hence, the importance of knowing and understanding the beliefs, attitudes and emotions that cause anxiety towards mathematics. This would lead us to develop action plans
European Journal of Contemporary Education, 2018, 7(1)
116
in the search to increase the level of understanding and mathematical ability in teaching-learning. Getting students to understand mathematical benefits and their multiple applications in daily life in the mind of the student would help change thoughts and feelings of rejection, to acceptance.
References Adelson, 2011 – Adelson, J.L., McCoach, D.B. (2011). Development and psychometric
properties of the Math and Me Survey: Measuring third through sixth graders’ attitudes towards mathematics. Measurement and Evaluation in Counseling and Development, 44, 225-247.
Agüero et al., 2017 – Agüero, E., others (2017). Estudio de la ansiedad matemática en la educación media costarricense. Revista Electrónica de Investigación Educativa, 19(1), 35-45.
Aiken, 1961 – Aiken, L. (1961). The effect of attitudes on performance in mathematics. Journal of Educational Psychology, 52(1), 19-24.
Aiken, 1961 – Aiken, L. (1976). Update on attitudes and other affective variables in learning mathematics. Review of Educational Research, 46, 293-311.
Alexander, Martray, 1989 – Alexander, L., Martray, C. (1989). The development of an abbreviated version of the Mathematics Anxiety Rating Scale. Measurement and Evaluation in Counseling and Development, 22, pp. 143-150.
Betz, 1978 – Betz, N. (1978). Prevalence, distribution and correlates of math anxiety in college students. Journal of Counseling Psychology, 25, 441-448.
Bessant, 1995 – Bessant, K. (1995). Factors associated with types of mathematics anxiety in college students. Journal for Research in Mathematics Education, 26(4), 327-345.
Contreras et al., 2005 – Contreras, F., others (2005). Autoeficacia, ansiedad y rendimiento académico en adolescentes. Diversitas, 1(2), pp. 183-194.
Dutton, Blum, 1968 – Dutton, W., Blum, M. (1968). The measurement of attitudes towards arithmetic with a Likert-type test. Elementary School Journal, 68(5), 259-264.
Eccius-Wellmann, Lara-Barragan, 2016 – Eccius-Wellman, C.C., Lara-Barragán, A. (2016). Hacia un perfil de ansiedad matemática en estudiantes de nivel superior. Revista Iberoamericana de Educación Superior (RIES), 7(18). Retrieved from: https://ries.universia.net/article/view/1104/perfil-ansiedad-matematica-estudiantes nivel-superior
García-Santillán et al., 2013 – García-Santillán, A., others (2013). Percepción del alumno hacia el proceso de enseñanza de la matemática financiera mediado por las TIC. Un estudio empírico a partir de las variables de la escala EAPHFM. Investigación Administrativa, 112(07), pp. 23-38.
García-Santillán et al., 2014 – García-Santillán, A., others (2014). The Golden Trilogy in the Teaching-Learning Process. Turkish Online Journal of Educational Technology, Vol 13 (3) July 2014. pp. 138-147.
García-Santillán et al., 2015 – García-Santillán, A., others (2015). What factors explain the anxiety level towards studying mathematics among students in elementary school? Mediterranean Journal of Social Science, Vol. 6, No.4 July 2015, pp 564-572.
García-Santillán et al., 2016 – García-Santillán, A., others (2016). Confirmatory analysis to validate a theoretical model that explains student anxiety toward mathematics. Eurasia Journal of Mathematics, Science and Technology Education. Vol 12 (2) pp. 361-372.
García-Santillán et al., 2016 – García-Santillán, A., others (2016). Anxiety towards mathematics on undergraduates in a Nautical School (An empirical study in Port Veracruz). Mathematics Education. Vol. 11 (7). pp. 2418-2429.
García-Santillán et al., 2016 – García-Santillán, A., others (2016). Estudio empírico para determinar el nivel de ansiedad hacia la matemática en estudiantes universitarios. International Journal of Developmental and Educational Psychology, 1(2), 441-452.
García-Santillán et al., 2016 – García-Santillán, A., others (2016). Anxiety toward mathematics in students of the CONALEP campus Veracruz-1: a comparative study of the morning and afternoon shifts in Veracruz, México. Revista Internacional de Investigación e Innovación en Didáctica de las Humanidades y las Ciencias, 3, 55-75.
García-Santillán et al., 2017 – García-Santillán, A. (2017). Measuring set latent variables through exploratory factor analysis with principal components extraction and confirmatory analysis. European Journal of Pure and Applied Mathematics. Vol. 10 (2). pp. 167-198.
European Journal of Contemporary Education, 2018, 7(1)
117
García-Santillán et al., 2017 – García-Santillán, A., others (2017). Factores que determinan el nivel de ansiedad hacia la matemática en alumnos de nivel superior. Revista Pensamiento Matemático Vol. VII, Número 1. Abr 17. pp. 165-179.
Gil et al., 2005 – Gil, N., others (2005). El dominio afectivo en el aprendizaje de las Matemáticas. Una revisión de sus descriptores básicos. UNION. Revista Iberoamericana de Educación matemática, 2, 15-32.
Johnson, 1981 – Johnson, G. (1981). An investigation of selected variables and their effect upon the attitudes toward the teaching of elementary school Mathematics by prospective elementary school teacher. Southwest Educational Research Association. Dallas.
Ma, 1999 – Ma, X. (1999). A meta-analysis of the relationship between anxiety toward mathematics and achievement in mathematics. Journal for Research in Mathematics Education, 30, 520-541.
Martínez-Artero, Nortes, 2104 – Martínez-Artero, R., Nortes, A. (2014). Tienen ansiedad hacia las matemáticas los futuros matemáticos? Profesorado. Revista de Currículum y Formación de Profesorado, 18(2), pp.153-170.
McLeod, 1988 – McLeod, D. (1988). Affective issues in mathematical problem solving: Some theoretical considerations. Journal for Research in Mathematics Education, 19(2), pp. 134-141.
Navarro-Ibarra et al., 2017 – Navarro-Ibarra, L., others (2017). Mathematics, Technology and Learning: How to align these variables in order to explain anxiety towards math and the attitude towards the use of technology for learning mathematics. Eurasia Journal of Mathematics, Science and Technology Education. Vol 13 (9) pp. 6211-6229.
Nortes, Nortes, 2017 – Nortes, R., Nortes, A. (2017). Ansiedad, motivación y confianza hacia las matemáticas en futuros maestros de Primaria. Números. Revista de Didáctica de las Matemáticas, 95(7), pp. 77-92.
OECD, 2016 – OECD. (2016). Informe de Resultados de PISA 2015. Oviedo, Campo-Arias, 2005 – Oviedo, H., Campo-Arias, A. (2005). Aproximación al uso del
coeficiente alfa de Cronbach. Revista colombiana de psiquiatría, 34(4), 572-580. Palacios et al., 2014 – Palacios, A., others (2014). Las actitudes hacia las matemáticas:
construcción y validación de un instrumento para su medida. Revista de Psicodidáctica, 19(1), pp. 67-91.
Pérez-Tyteca et al., 2007 – Pérez-Tyteca, P., & others (2007). Ansiedad matemática de los alumnos que ingresan en la Universidad de Granada. Investigación en Educación matemática XI, pp. 171-180.
PLANEA, 2017 – PLANEA. (2017). Resultados Nacionales Planea 2017. Richardson, Suinn, 1972 – Richardson, F.C., Suinn, R.M. (1972). The Mathematics Anxiety
Rating Scale: Psychometric data. Journal of Counseling Psychology, 19, 551–554. Rosário et al., 2008 – Rosário, P., others (2008). Ansiedad ante los exámenes: relación con
variables personales y familiares. Psicothema, 20(4). Sánchez et al., 2011 – Sánchez, J., others (2011). Exploración de la ansiedad hacia las
matemáticas en los futuros maestros de educación primaria. Revista de currículum y formación del profesorado, 15(3), pp. 297-312.
Sandman, 1980 – Sandman, R.S. (1980). The mathematics attitude inventory: Instrument and user’s manual. Journal for Research in Mathematics Education, 11, 148–149.
Satake, Amato, 1995 – Satake, E., Amato, P.P. (1995). Mathematics anxiety and achievement among Japanese elementary school students. Educational and Psychological Measurement, 55, 1000–1007.
Suinn, Winston, 2003 – Suinn, R.M., Winston, E.H. (2003). The Mathematics Anxiety Rating Scale, a brief version: Psychometric data. Psychological Reports, 92, 167–173.