Embed Size (px)
Citation preview

Copyright 2013, 2010, 2007, Pearson, Education, Inc.
Section 7.1
Systems of Linear
Equations

Copyright 2013, 2010, 2007, Pearson, Education, Inc.
What You Will Learn
Systems of Linear EquationsSolutions to Systems of Linear EquationsSolving Systems of Linear Equations by Graphing
7.1-2

Copyright 2013, 2010, 2007, Pearson, Education, Inc.
System of Linear EquationsWhen two or more linear equations are considered simultaneously, the equations are called a system of linear equations.A solution to a system of equations is the ordered pair or pairs that satisfy all equations in the system. A system of linear equations may have exactly one solution, no solution, or infinitely many solutions.
7.1-3

Copyright 2013, 2010, 2007, Pearson, Education, Inc.
Example 1: Is the Ordered Pair a Solution?Determine which of the ordered pairs is a solution to the following system of linear equations.
2x – y = 62x + y = 14
a. (0, –6) b. (5, 4) c. (3, 8)
7.1-4

Copyright 2013, 2010, 2007, Pearson, Education, Inc.
Example 1: Is the Ordered Pair a Solution?SolutionCheck (0, –6)
(0,–6) does not satisfy both equations, it is not a solution to the system.
2x y 6
2(0) ( 6) 6
6 6True
2x y 14
2(0) ( 6) 14
6 14False
7.1-5

Copyright 2013, 2010, 2007, Pearson, Education, Inc.
Example 1: Is the Ordered Pair a Solution?SolutionCheck (5, 4)
(5, 4) satisfies both equations, it is a solution to the system.
2x y 6
2(5) 4 6
6 6True
2x y 14
2(5) 4 14
14 14True
7.1-6
Copyright 2013, 2010, 2007, Pearson, Education, Inc.
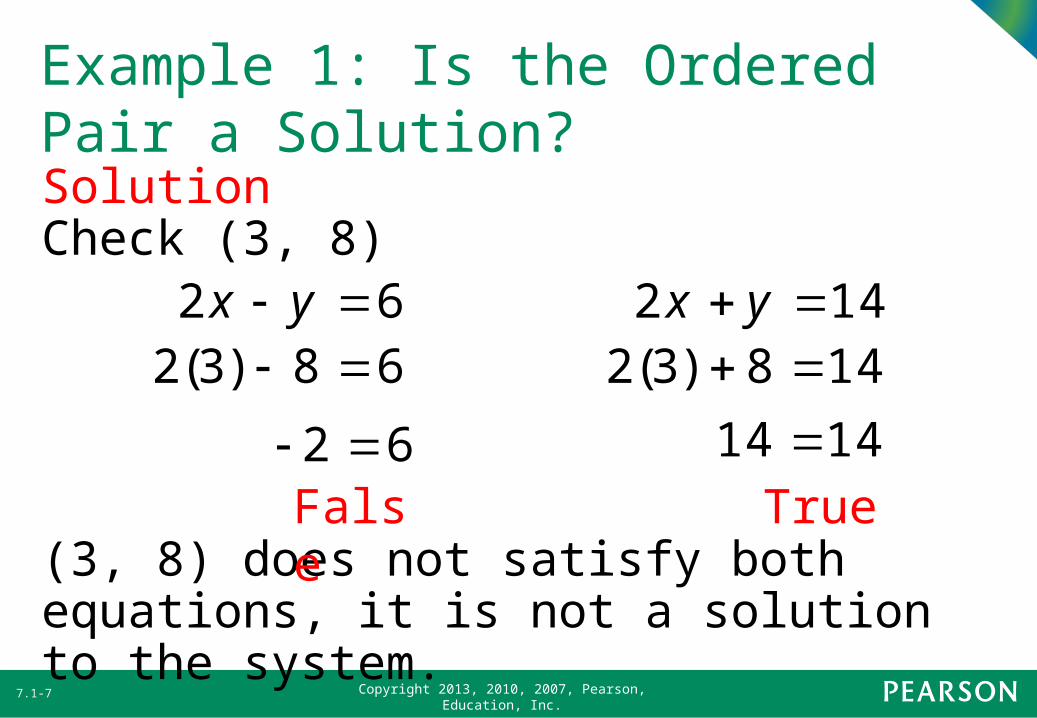
Example 1: Is the Ordered Pair a Solution?SolutionCheck (3, 8)
(3, 8) does not satisfy both equations, it is not a solution to the system.
2x y 6
2(3) 8 6
2 6False
2x y 14
2(3) 8 14
14 14True
7.1-7

Copyright 2013, 2010, 2007, Pearson, Education, Inc.
Solving a System of Equations by Graphing1.Determine three ordered pairs
that satisfy each equation.2.Plot the ordered pairs and
sketch the graphs of both equations on the same axes.
3.The coordinates of the point or points of intersection of the graphs are the solution or solutions to the system of equations.
7.1-8
Copyright 2013, 2010, 2007, Pearson, Education, Inc.
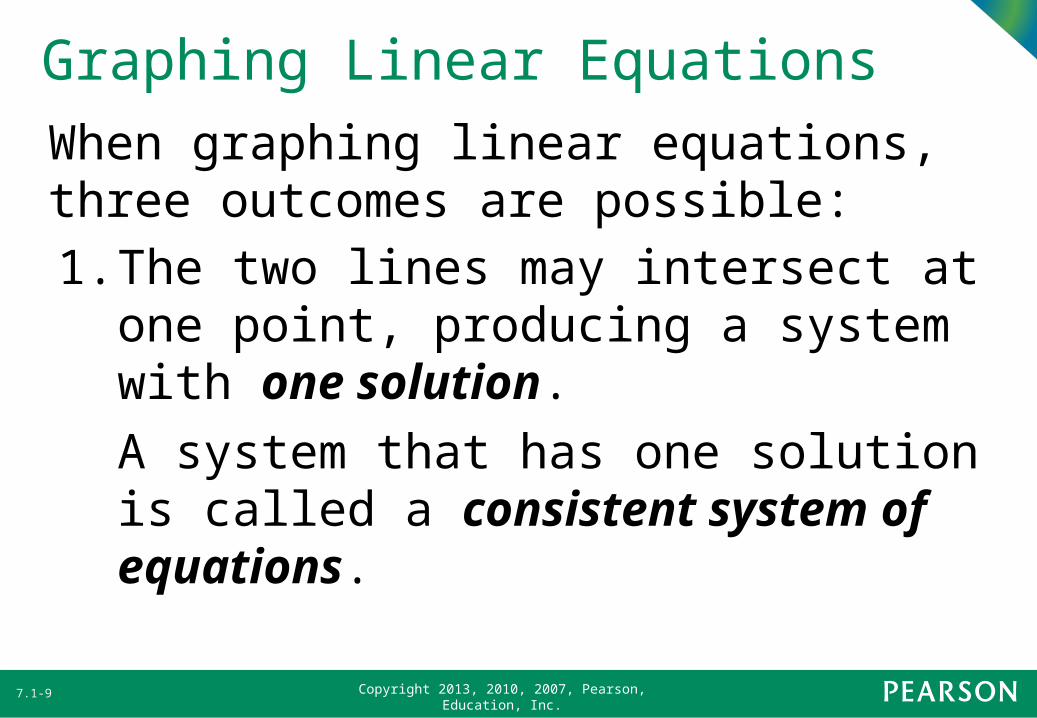
Graphing Linear EquationsWhen graphing linear equations, three outcomes are possible:1.The two lines may intersect at
one point, producing a system with one solution.A system that has one solution is called a consistent system of equations.
7.1-9

Copyright 2013, 2010, 2007, Pearson, Education, Inc.
Graphing Linear Equations
7.1-10
Copyright 2013, 2010, 2007, Pearson, Education, Inc.
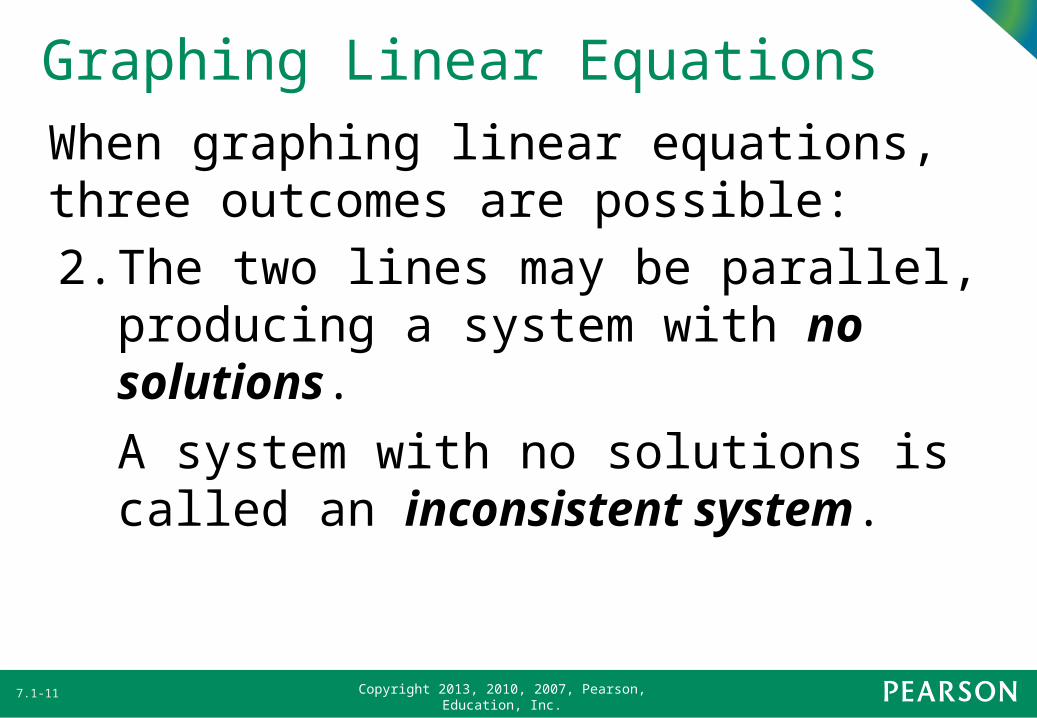
Graphing Linear EquationsWhen graphing linear equations, three outcomes are possible:2.The two lines may be parallel,
producing a system with no solutions.A system with no solutions is called an inconsistent system.
7.1-11
Copyright 2013, 2010, 2007, Pearson, Education, Inc.
Graphing Linear Equations
7.1-12

Copyright 2013, 2010, 2007, Pearson, Education, Inc.
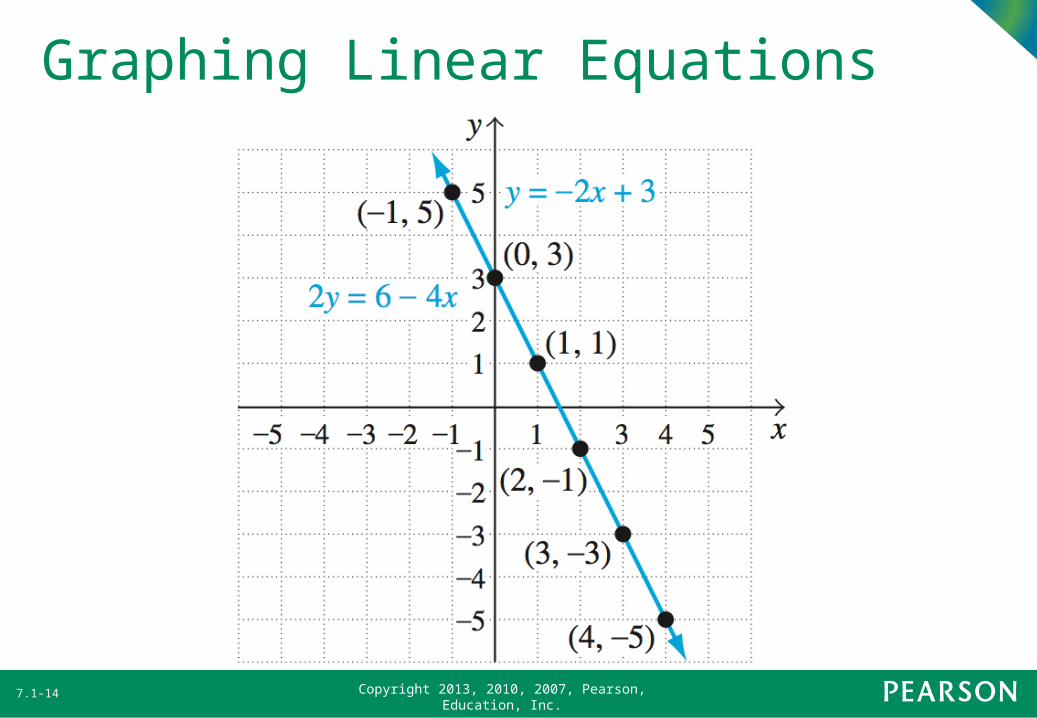
Graphing Linear EquationsWhen graphing linear equations, three outcomes are possible:3.The two equations may
represent the same line, producing a system with an infinite number of solutions.
A system with an infinite number of solutions is called a dependent system.
7.1-13
Copyright 2013, 2010, 2007, Pearson, Education, Inc.
Graphing Linear Equations
7.1-14

Copyright 2013, 2010, 2007, Pearson, Education, Inc.
Example 2: A System with One SolutionDetermine the solution to the following system of equations graphically.
x y 4
2x y 1
7.1-15
Copyright 2013, 2010, 2007, Pearson, Education, Inc.
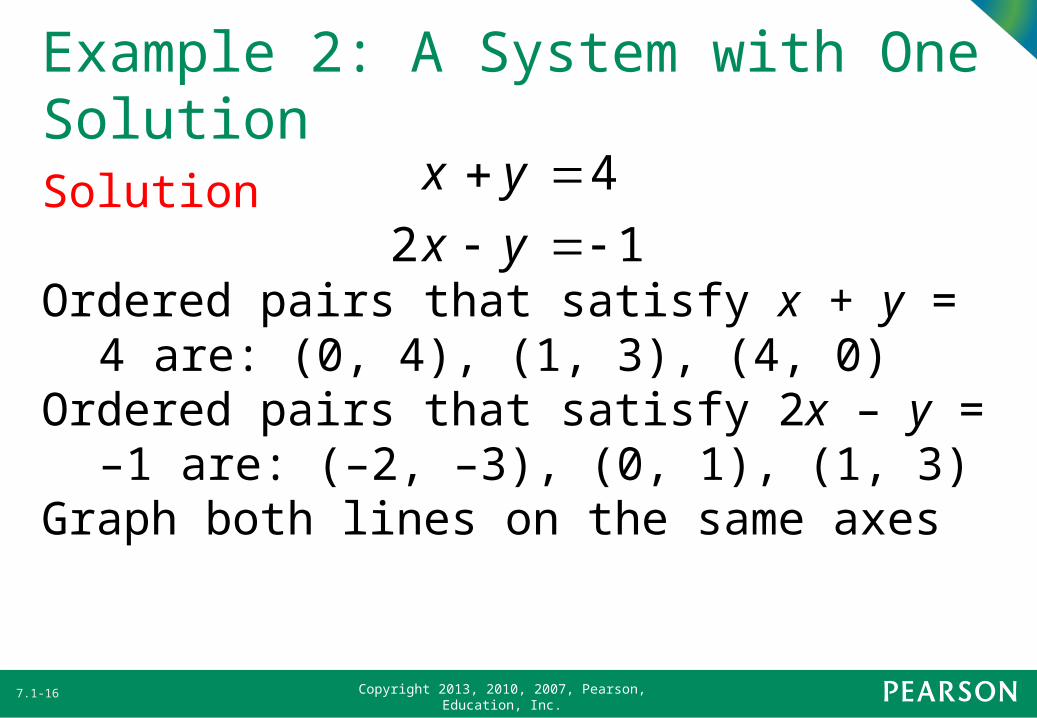
Example 2: A System with One SolutionSolution
Ordered pairs that satisfy x + y = 4 are: (0, 4), (1, 3), (4, 0)
Ordered pairs that satisfy 2x – y = –1 are: (–2, –3), (0, 1), (1, 3)
Graph both lines on the same axes
x y 4
2x y 1
7.1-16

Copyright 2013, 2010, 2007, Pearson, Education, Inc.
Example 2: A System with One SolutionSolution
7.1-17
Copyright 2013, 2010, 2007, Pearson, Education, Inc.
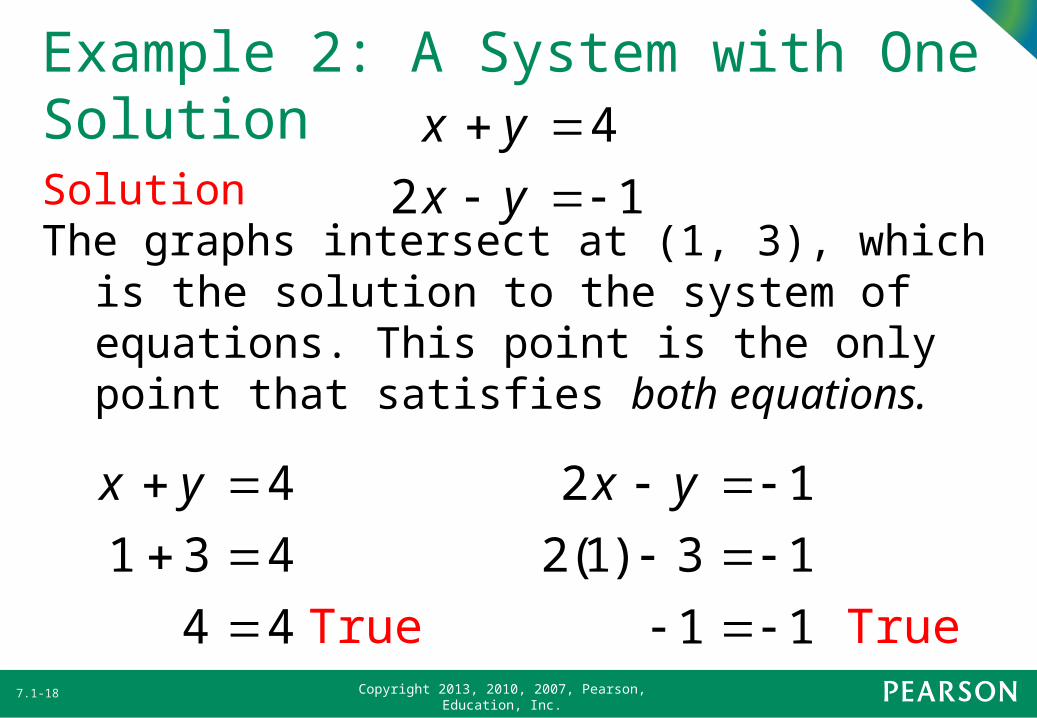
Example 2: A System with One SolutionSolutionThe graphs intersect at (1, 3),
which is the solution to the system of equations. This point is the only point that satisfies both equations.
x y 4
2x y 1
x y 4
1 3 4
4 4 True
2x y 1
2(1) 3 1
1 1 True7.1-18
Copyright 2013, 2010, 2007, Pearson, Education, Inc.
Example 3: A System with No SolutionDetermine the solution to the following system of equations graphically.
x y 3
2x 2y 4
7.1-19

Copyright 2013, 2010, 2007, Pearson, Education, Inc.
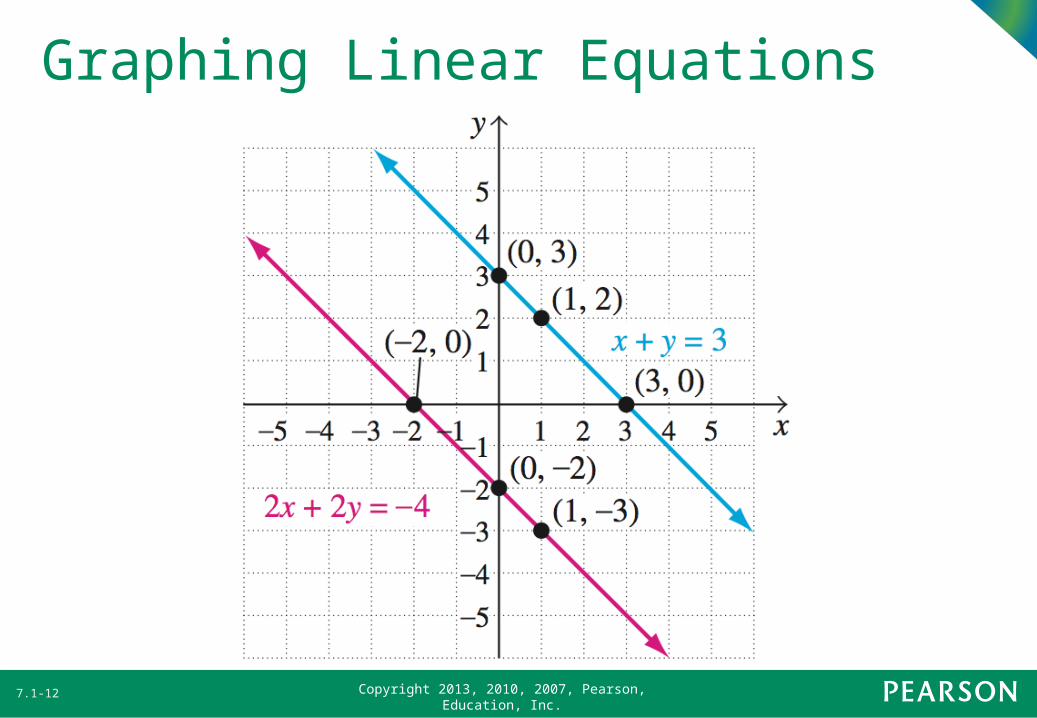
Example 3: A System with No SolutionSolution
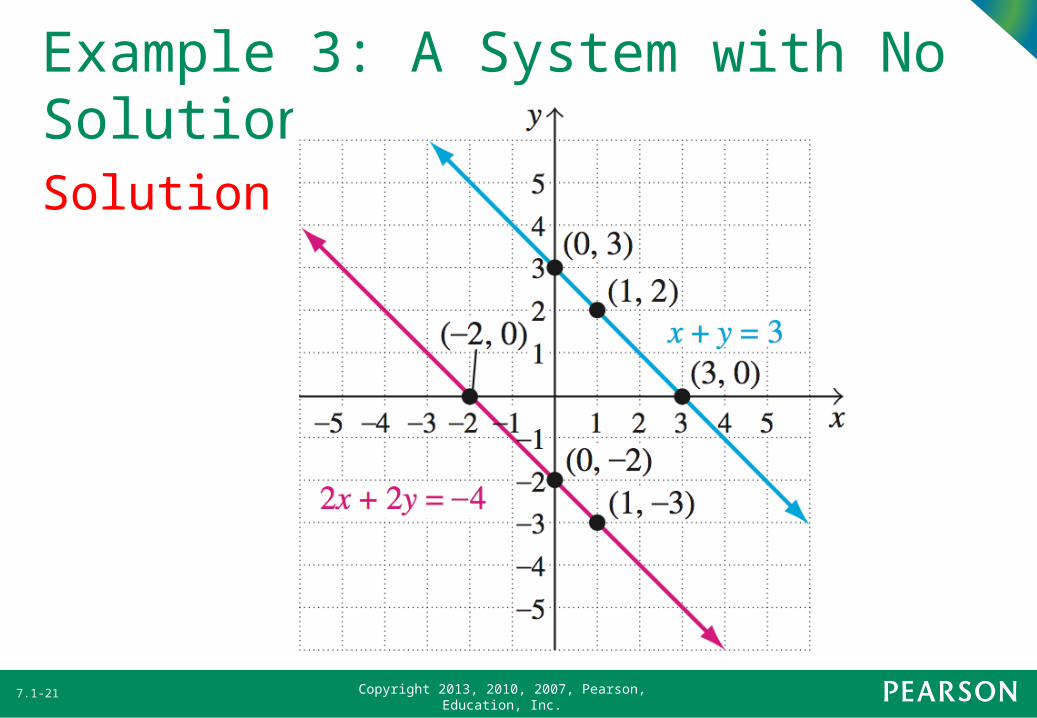
Ordered pairs that satisfy x + y = 3 are: (0, 3), (3, 0), (1, 2)
Ordered pairs that satisfy 2x + 2y =–4 are: (–2, 0), (0, –2), (1, –3)
Graph both lines on the same axes
x y 3
2x 2y 4
7.1-20
Copyright 2013, 2010, 2007, Pearson, Education, Inc.
Example 3: A System with No SolutionSolution
7.1-21

Copyright 2013, 2010, 2007, Pearson, Education, Inc.
Example 3: A System with No SolutionSolution
Since the two lines are parallel, they do not intersect; therefore, the system has no solution.
x y 3
2x 2y 4
7.1-22

Copyright 2013, 2010, 2007, Pearson, Education, Inc.
Example 6: Modeling–Profit and Loss in BusinessAt a collectibles show, Richard Lane can sell model trains for $35. The costs for making the trains are a fixed cost of $200 and a production cost of $15 apiece. a) Write an equation that represents Richard’s revenue. Write an equation that represents Richard’s cost.
7.1-23

Copyright 2013, 2010, 2007, Pearson, Education, Inc.
Example 6: Modeling–Profit and Loss in Businessb)How many model trains must
Richard sell to break even?c)Write an equation for the profit
formula. Use the formula to determine Richard’s profit if he sells 15 model trains.
d)How many model trains must Richard sell to make a profit of $600?
7.1-24

Copyright 2013, 2010, 2007, Pearson, Education, Inc.
Example 6: Modeling–Profit and Loss in BusinessSolutiona) Let x denote the number of model trains made and sold.Revenue:
R = 35x ($35 times # of trains)Cost:
C = 200 + 15x(200 plus $15 times # of trains)
7.1-25

Copyright 2013, 2010, 2007, Pearson, Education, Inc.
Example 6: Modeling–Profit and Loss in BusinessSolutionb) Break-even point is where graphs intersect (10, 350)He must make and sell 10 model trains.Cost = $350Revenue = $350
7.1-26

Copyright 2013, 2010, 2007, Pearson, Education, Inc.
Example 6: Modeling–Profit and Loss in BusinessSolutionc) Profit = Revenue – Cost
P R C
35x (200 15x) 35x 200 15x 20x 200
For 15 trains, profit is:
P 20(15) 200 100
7.1-27

Copyright 2013, 2010, 2007, Pearson, Education, Inc.
Example 6: Modeling–Profit and Loss in BusinessSolutionc) Richard has a profit of $100 if he sells 15 trains.Observe the graph.At 15 trains the revenue line is greater than the cost line, that is, there is a profit.
7.1-28

Copyright 2013, 2010, 2007, Pearson, Education, Inc.
Example 6: Modeling–Profit and Loss in BusinessSolutiond) Substitute $600 for P, solve for x
600 20x 200 800 20x 40 x
Richard must sell 40 model trains to make a profit of $600.
7.1-29