Embed Size (px)
Citation preview

2 Copyright 2011 © www.iTradeAIMS.com
Copyright © 2011, iTradeAIMS.com
All rights reserved. No part of this eBook shall be reproduced, stored in a retrieval system or transmitted by any means, which includes but is not limited to any electronic means, mechanical, photocopying, recording, scanning or otherwise without written permission from the author/publisher.
Limit of Liability/Disclaimer Warranty
Despite their best efforts to prepare the information accurately within this book, the publisher and authors make absolutely no representations or warranties with respect to any information herein. No patent liability is assumed with respect to this eBook. Neither the publisher nor the authors of the book assume any liability for the use of the information contained herein, nor do they assume responsibility for any errors, omissions or inaccuracies.
The information is provided on an “as is” basis, meaning the publisher, the authors, or any party associated with either party assumes no liability to any entity for loss or damages sustained from information within this book.
The trading of Forex or any securities may not be suitable for all potential readers of this eBook. You should be aware of the risks inherent in the market. Past performance does not guarantee or imply future success. You cannot assume that profits or gains will be realized. The strategies discussed may result in the loss of some, or all, of any investment made. We recommend that you consult a stockbroker or financial advisor before buying or selling any securities, or making any investment decisions. You assume the entire cost and risk of any investing and/or trading you choose to undertake.
For information on our other products or services, or if you are having technical problems with this product, please contact us.
Email us at [email protected]
Or visit our website, www.iTradeAIMS.com
3 Copyright 2011 © www.iTradeAIMS.com
AIMS Stress Free Trading The Setup Imran & AIMSters
4 Copyright 2011 © www.iTradeAIMS.com
Table of Contents
WELCOME TO 7
CHAPTER 1: GETTING READY 11
The Strategy in a Nutshell 11
CHAPTER 2: THE AIMS INDICATORS 24
AIMS Indicator 1: The AIMSigator 25
Anatomy of the Alligator 25
AIMS Indicator 2: AIMS AO 33
AIMS Indicator 3: AIMS Box 40
AIMS Alert: AIMS Talking Alert 51
CHAPTER 3: THE SETUP 53
The Ground Rules 53
Putting it all Together 55
The Setup – waiting for the Dots 56
The Three Rules 56
Double AIMS Levels 62
Exit Setup 74
CHAPTER 4: MONEY MANAGEMENT 85
Money Management and Risk Percentage per Trade: 85
ROI: The Concept of Adding On 90
Glossary of Terms 95

5 Copyright 2011 © www.iTradeAIMS.com
A Strategy based on The Science of Chaos
A successful strategy already famous for its success on higher time frames
Now applied to very short time frames using new techniques with even greater success
A strategy to help master the Art of Trading Chaos on Forex Markets
It is my intention to share this “Knowing” with you so that you may achieve great success
Other Supporting Books to Read from AIMS Stress Free Trading
AIMS STRESS FREE TRADING – THE MIND Trading is 80% Mental. In this book you will learn how to remain calm and relaxed during trading. It is vital for a trader to learn to effectively use the powers of the mind. You’ll be pleasantly surprised that techniques to fully utilise the powers of the mind are relatively simple compared to the very complex nature of the mind itself. 1
AIMS STRESS FREE TRADING – 10SEC ELLIOTT WAVE The market is not random; it is highly organised. Everything is energy and energy follows the path of least resistance. Everything has a usually-unseen underlying structure that defines the way it moves. The market also has a structure and this book is about that structure. Learn to trade with the structure of the market. 1
1 Available to premium members of www.AIMSForum.com. To upgrade please visit www.iTradeAIMS.com.

6 Copyright 2011 © www.iTradeAIMS.com
ACKNOWLEDGMENTS It goes without saying that I could not have done it without my AIMSters Friends. Simple words cannot express my thanks to these outstanding individuals. Thank you Special Thanks to: - Grant Hardiman: for your insight and help in developing this strategy and iron clad discipline. Steve Norman: for helping with writing and finishing the revised edition of this book. Jim Czel and John Wimberley: for helping with moderating the forums, chat-rooms and excellent trading company.
A salute to Dr. Bill Williams
ABOUT THIS BOOK My main job in this book is to show you a unique strategy of trading the currency markets. It provides a solution for Forex traders. It shows simple techniques that when mastered, collectively put you on the path to a true trading expertise. I show you step-by-step how to create a setup and trade it in the best possible way. I show you that there’s a simpler, better way to trade the Forex markets.
This book is designed for beginners and experienced traders who want to become successful. What all traders have in common is an ongoing effort to improve their trading efficiency and profitability. Nearly all traders find themselves searching for the illusive Holy Grail system. This book shows you that there really could be a Holy Grail to Forex Trading and that it is not a hidden secret.
In this book you will learn how to successfully trade Forex Markets using AIMS Stress Free Trading Strategy: a complete trading system. It is part of a package which also includes AIMS Indicators for Metatrader 4 platform. To make full use of information provided in this book, the reader must have access to the indicators package.
In Chapter 1: Introduces the strategy
In Chapter 2: You will learn about the indicators
In Chapter 3: Explains the use of the indicators and ‘The Setup’
In Chapter 4: You will learn about money and risk management along with position sizing.
Let’s begin!

7 Copyright 2011 © www.iTradeAIMS.com
Introduction to
You have at your hands an opportunity to learn a simple yet powerful trading strategy.
AIMS Stress Free Trading Strategy has been tried and tested by thousands around the world with great success on all kinds of markets, including stocks, futures, commodities and currency markets. Markets keep changing constantly but the underlying structure of the market remains almost the same. We find that the time frames that we have chosen to trade never stop trending. We often grab very lucrative trading opportunities 2-3 times a day. In this book, you will learn how to apply trading Chaos to Forex on shorter time frames (thoughthe strategy can also be effectively applied to higher time frames). Rest assured, you will not be disappointed.
First you need to accept the fact that trading is simple.
LIFE IS REALLY SIMPLE, BUT WE INSIST ON MAKING IT COMPLICATED.
Many people immediately have their “aha” moments. They grasp the idea relatively quickly, yet others take longer, but eventually they all get it. One thing that everyone agrees on, whether its trading the financial markets or any other business: trading success requires consistency. I have a formula:
PATIENCE + DISCIPLINE = CONSITENCY
Success in trading can not be achieved without consistency. Every time you take a trade following the rules of your system, you move one step closer to your destiny. Every trade is an achievement as long as it is taken according to the rules of your system. To be successful in trading, you have to consistently trade the system as it is supposed to be traded. It really is simple but without consistency and the right mind-set, it might be difficult to say it is easy for all. I know it is not. I also know that it can be made easier. Ironically, in life the simpler things are at times the hardest to achieve. This is not hard work, it is a new way to see the markets. Most of us perceive the market as an unfriendly place, but it is not - the market is neutral. I suggest we shift our perspective about markets from a dangerous and unfriendly place, to a friendly and neutral place.

8 Copyright 2011 © www.iTradeAIMS.com
Remember what Einstein said: “The most important question we should ask is …
“IS THE UNIVERSE A FRIENDLY PLACE?”.
Your answer to this question will fundamentally determine your trading success and, indeed, success in all aspects of your life. Happiness, creating success, great relationships, money, health and wealth, everything. Your answers set in place your belief system.
To understand the markets, all you need is a paradigm shift - for many a quick shift, for others it takes a bit longer, but it does happen. I’m not asking for hardwork, as no hard work is required. Just be open to change; be open and ready to accept “New Incoming Information”; relax and experience the change.
“I HAVE FOUND THAT WE HUMANS HAVE TWO INNATE TENDENCIES: 1 – WE TEND TO OVERCOMPLICATE EVERYTHING WE TOUCH AND, BECAUSE OF THAT, 2 – WE CANNOT SEE THE OBVIOUS”. BILL WILLIAMS
I have learnt, through working with people, that the only way to be consistently successful is to establish a firm belief in your system. A strong belief system paves the path towards the state of “knowing”. A firm belief system can be created by trading your system religiously, repeating the same processs over and over, day in day out. So I urge you to trade the system as it is supposed to be traded: trade the Setup and only the Setup. To do that, we need to learn and thoroughly understand the Setup. The Setup is created when a certain set of rules are in place and a certain picture is created. We create and trade a certain picture that we call The Setup. Essentially we use only three simple rules (referred herein as “the Three Rules”) to create our Setup. It is important to understand the logic behind the rules before applying. Again, it’s just a pattern recognition exercise, it is simple. This books attempts to discuss and explain the Setup and the Three Rules.
Please read this manual carefully and keep in mind that it’s not rocket science. Take it easy, relax and tell yourself: “I’m going to learn a simple way of trading”. Say to yourself and accept that it is simple.
“IT IS THE SIMPLE THINGS IN LIFE THAT ARE THE MOST EXTRAORDINARY; ONLY THE WISE IS ABLE TO UNDERSTAND THEM.”

9 Copyright 2011 © www.iTradeAIMS.com
Important Notes and Actions to Take:
• I assume that you already know a bit about trading in general. However, if you are new to trading please consider visiting http://www.babypips.com
WWW.AIMSFORUM.COM: STANDARD OR PREMIUM MEMBERS ONLY: • Please visit www.AIMSForum.com and register a new account. Registration requires
validation which is a manual process so please allow 24hrs for activation. • Updated templates and indicators are available for download in the Forum. • If you do not understand any topic or concept please do not hesitate to ask questions in the
Forum. I do a better job replying to forum posts than emails and I appreciate questions asked via the Forum.
START A JOURNAL: • I strongly recommend starting a journal - it has many advantages. Take pictures of your trades
and record your comments about your psychological and emotional states of minds. Try to record, in words, how you felt at that time about that trade. It is a very effective tool for learning. Please give more attention to the trades where you followed all the rules correctly and give less attention to the trades taken otherwise. Remain disciplined 100% of the time.
AIMS BLOG: • I encourage you to visit my Blog at www.iTradeAIMS.com as well, to enhance your
understanding of the strategy. The blog is a free resource and a great knowledge base.
DEMO TRADING: • Start by trading a demo account, until you are completely comfortable and confident with
AIMS and Metatrader – this may take more than three months for some; others just a few weeks. When you are consistently profitable on demo, start trading a live account with micro lots, gradually increasing your lot size as you gain confidence.
• If you do not have a Metatrader platform, search for Forex brokers such as Alpari, FX Pro, FXCM, FXDD, etc. and download a free demo from their website.

10 Copyright 2011 © www.iTradeAIMS.com
SPECIFIC TERMINOLOGIES, WORDS OR PHRASES: • You will likely find some specific terminologies, words or phrases peculiar to this system or
Forex in general, that you may have not heard before. When you come across such, please check the Glossary or, if its not covered there, I suggest you Google the word or phrase, before continuing to read . Alternatively, feel free to ask in the forum.
• Many of people might require two or three reads of this book. It’s a new concept, so it is important to read it as many times as you need, for all the information to sink in.
• If you have any comments or feedback please do not hesitate to contact us via the forum.
“Trade What You See Not What You Think, With An Attitude Of Gratitude”
It really is simple
I WISH YOU MANY MONEY-FILLED PIPS. HAPPY TRADING AND HAVE FUN!
Imran & AIMSters
www.iTradeAIMS.com www.AIMSForum.com

11 Copyright 2011 © www.iTradeAIMS.com
Chapter 1: Getting Ready The Strategy in a Nutshell
AIMS Stress Free Trading Strategy offers: -
AN OBJECTIVE ENTRY SYSTEM AIMS gives you a crystal-clear entry mechanism with a simple and easily understandable entry setup. AIMS Stress Free Trading takes the anxiety out of trading by applying three simple rules to create two clear entry setups. We know our entry level within a second.
A CLEAR EXIT MECHANISM AIMS Stress Free Trading exit setup offers two options of exiting with profit. One exit technique is for normal moving markets; the other is for fast moving markets.
SOUND MONEY AND RISK MANAGEMENT The success of the AIMS strategy is based on its sound money management techniques. Our money management and risk control helps us increase our return on investment. AIMS money management and risk control take into account the market conditions. The AIMS strategy allows you to increase profitability when you have winning trades and give little away when you have a negative trade. AIMS techniques allow you to control your risk to a bare minimum and provide a potentially higher risk-reward ratio.
THE MIND We believe that trading is at least 80% mental. The ultimate goal of a trader is to achieve the state of “Knowing without Knowing how You Know”. It is that mental state that we call “The Zone”. The correct mind-set and attitude is the key to trading success. We have two simple techniques to help you remain calm and stress free during trading.
EXPLAINED IN AIMS STRESS FREE TRADING – THE MIND EBOOK AVAILABLE TO PREMIUM MEMBERS
10SEC ELLIOTT WAVE We believe the market has a structure - the market is not random, it is highly organized. We know that everything is energy and energy follows the path of least resistance. The path of least resistance is governed by an always present, usually unseen, underlying structure. AIMS Stress Free Trading Strategy is based on the structure of the market. Learn to trade with the structure of the market.
EXPLAINED IN AIMS STRESS FREE TRADING – 10SEC ELLIOTT WAVE EBOOK AVAILABLE TO PREMIUM MEMBERS

12 Copyright 2011 © www.iTradeAIMS.com
HAVE YOU GOT YOUR SOFTWARE READY? • The first step is to install the indicators and template files in to your Metatrader 4 software. • Although there are plenty of examples in the book, looking up some of the charts in you MT4
Platform should help with understanding and recognising the ‘The Setup’. • If you are a member of AIMSForum.com, check for any updates to the indicators in the
‘Indicators and Templates’ section. • For help with installation, go to ‘Installation Issues’ section of the forum.
TIME FRAMES AND CURRENCY PAIRS TO TRADE Let us now look at the time frames and currency pairs that we like to trade here at the AIMS Stress Free Trading Community. You have 2 options: -
OPTION 1 – EUR/USD ON M5 AND M1 – OUR PREFERRED CHOICE
It can be said that:
• We Trade M1 in the direction of M5 or • We Trade M5 with entries on M1.
There was a time when I clogged my mind with worrying too much about what happens to an array of things.
• I worried about correlation. • I could not bear seeing missed opportunities on other pairs. • I kept checking several different indicators etc
Then I learned that:
THE MARKET HAS A PULSE
So, I now believe that when the market moves all the pairs move. This is especially true for intraday trading. When I suggest that trading only one pair is enough for making good money in the Forex markets, I am usually greeted with disbelief. No one likes to miss trading opportunities on other pairs, though I have found through experience, that trading only one pair, on M1 and M5, is the best way forward.
I DON’T CARE WHAT THE REST OF THE MARKET DOES.
Some traders might be concerned about the number of Setups that the system might generate whilst trading just the EUR/USD pair. Rest assured that we get numerous Setups per session every day. We are usually spoilt for choice.
It is true that we prefer to trade this strategy on M1 and M5 EUR/USD and that the system is tweaked specifically for such. However, this certainly does not mean that the strategy cannot be applied to other currencies, markets and/or time frames. On the contrary, it can be applied to any market, currency and time frame available anywhere.
This strategy was originally applied to the daily charts on stocks and futures markets with huge success. I have successfully tweaked and applied it to Forex markets on all the intraday time frames.

13 Copyright 2011 © www.iTradeAIMS.com
The one minute chart is a fast time frame and, as such, we really do not need to trade any other time frames to get plenty of good Setups, nor do we need to check the entire range of currency pairs. Though you could of course increase your profits considerable, should you choose to trade more than one pair.
THE MARKET HAS A PULSE AND WHEN IT BEATS, EVERYTHING MOVES.
"NOTHING HAPPENS UNTIL SOMETHING MOVES." ALBERT EINSTEIN
OPTION 2 – M5, M15, H1, H4 OR HIGHER TIME FRAMES
The other option is to trade any combination of pairs on a time frame of your choice.
• Trade a selection of 8-14 pairs on H1 or H4 time frames. o EUR/USD, GBP/USD, AUD/USD, EUR/JPY, USD/CHF, USD/JPY, USD/CAD, EUR/GBP,
GBP/JPY, GBP/CHF, EUR/CHF, NZD/USD, • Trade a selection of 3-6 pairs on M5 or M15 time frames.
o EUR/USD, GBP/USD, AUD/USD, EUR/JPY, USD/CHF, USD/JPY • There is no need to display two charts for higher time frames. • There is no need to display purple line. • Use Setup 1 and Setup 2 for entering trades and exit Setups for closing trades.
THE FOCUS OF THIS BOOK IS TO SHARE OUR UNIQUE STRATEGY OF TRADING EUR/USD USING M5 AND M1

14 Copyright 2011 © www.iTradeAIMS.com
HOW TO DISPLAY M5 AND M1 CHARTS
OPTION 1 – M5 TO THE LEFT; M1 TO THE RIGHT We display M5 and M1 together. You can either use two screens or just arrange windows vertically using a single screen. I have a separate screen for each time frame on my trading desk but when using a laptop I split the screen, of my MT4 platform, in to two using the ‘arrange windows vertically’, option. See snapshot below.
I prefer trading off two charts, though you need not display two charts for trading M5 and above. I look at both M5 and M1 simultaneously because I can: -
1. See trend direction at a glance by looking at M5. 2. Time an early entry before M5 entry is ready. 3. Time my exits far better than exits on M5. 4. Minimise my initial risk considerably. 5. Count Waves on M1 for a Wave on M52
Below is a picture of my screen split in to two. M5 to the left and M1 to right using ‘Tile Vertically’ option as shown above.
2 Now don’t get scared, Firstly, to successfully trade the strategy, it is not necessary to learn to count Elliott Waves. Secondly, it’s not that hard to learn either – discussed in detail in AIMS Stress Free Trading – 10Sec Elliott Wave eBook

15 Copyright 2011 © www.iTradeAIMS.com
Your screen should look like below. A perfect buy Setup on M1 (right) and how it looked on M5 (left)
Below: M1 (right) is an expanded/zoomed view of the M5 (left) chart. The two vertical lines point to a situation in time where the market created an entry to sell on the M1
chart. By looking at the vertical line to the left, you can see how the chart looked at that particular moment on M5. Notice how M5 showed a down-trend and M1 had a clear short entry Setup. The
entry was objectively clear.

16 Copyright 2011 © www.iTradeAIMS.com
Above: M5 on the left and M1 on the right – AIMSigator Template with Purple Line
THE ESSENCE OF AIMS STRESS FREE TRADING STRATEGY IS TO UNDERSTAND THIS RELATIONSHIP OF M1 AND M5.
OPTION 2 – ONLY M5 OR ONLY M1 CHART I understand that trading off two charts may not be everybody’s cup of tea. Wide screen monitors are usually able to display up to 180 candles on one screen. This equates to 3 hours of trading data which should be more than enough data for making informed trading decisions. AIMSigator, with its derived “Purple” Line, can be used to eliminate the need for displaying two charts, allowing you to display all the information on a single screen/window. The Purple Line, as explained in Chapter 2, is effectively the Red Line of the 5 times higher time frame. We turned a famous indicator, the Alligator, into a multi time frame indicator and named it AIMSigator.
AIMSigator can show us the trend of the 5 times higher time frame on our open chart without switching to the higher time frame. The whole idea is to trade in the direction of trend on the higher time frame. See the above example of the charts with or without the Purple Line.
In Chapter 2 you will learn about the indicators; in Chapter 3, how to use them.

17 Copyright 2011 © www.iTradeAIMS.com
TRADING HOURS AND TIME FRAMES The Forex market is open 24 hours a day except weekends (it’s closed from 22:00 GMT on Friday until 22:00 GMT on Sunday). It doesn’t matter if you’re working or retired, a homemaker or a student, you can always find trading times that work for you. There are many part-time traders who are able to use the long hours of market activity to their advantage, by trading when they are not at work. The trading hours of the Forex market also benefit long-term investors because they are able to enter and exit their positions whenever the market dictates, as opposed to waiting for the markets to open, such as they would if trading the FTSE or DOW
SESSION OPEN TIMES ARE THE BEST If you can manage to keep a routine, the best times to trade is when there is the highest amount of volatility expected. In my experience, session open times are the best times to trade this strategy - I call them the “Chaos Influx Points” (Chaos is basically new Incoming information). The more new incoming information (that is Chaos), such as important news releases, the greater the chances of price moving in a certain direction. Just 1-2 Hrs per session is usually enough to successfully trade the session opens.
Whilst there can be so much movement during the session opens, a lot can happen in between opening times as well. I have seen dead session opens and alive mid-session hours as well. I have seen markets move 100 pips in a matter of minutes during unimaginable hours. Having said that, I’ll add that more often than not, the markets move the most during London and New York Sessions, followed by the Tokyo Session.
The above is just a guideline. Call me a chart-aholic but I’m always on the charts and I love it. Trading can be a lonely activity, but not for me: I have my kids nearby and my best friends, the AIMSters, on Skype. We crack jokes all day long and yes, in between jokes we manage a few trades as well, just to make things interesting I choose to visit a place where I can trade even when I am on holidays – but that’s just me, trading or thinking about trading whenever I get the chance. At the time of writing this, I am sat in the foothills of the Himalayas. I just took a deep breath, in this serene calm natural environment with my laptop on my lap.
I CAN’T WATCH A SCREEN ALL-DAY Many people say: “I don’t want to watch screen all day” - well, that’s totally fine. You can still catch some decent moves by trading just the session open times. If you see a Setup, trade it, if you don’t see a Setup just come back later. Trading M1 does not mean you have to be on the screens all day long; on the contrary, you could get to trade a complete wave cycle within just an hour or so and leave the charts for the rest of the day.
WAVES WITHIN WAVES WITHIN WAVES I believe, the market moves in waves. In fact, I believe the whole universe moves in waves. The bigger time frames depict bigger waves. Those bigger waves can each be broken down to smaller waves. The shorter time frames show those smaller waves within the bigger waves of the higher time frames. By trading M1 we trade the very small waves. Think waves within waves; think fractal geometry - the market is a great example of fractal geometry.
FRACTAL GEOMETRY Geometry: its principles are taught to young students across the world - the Pythagorean Theorem; surface area and volume; Pi. This classical, or Euclidean, geometry is perfectly suited for the world that

18 Copyright 2011 © www.iTradeAIMS.com
humans have created. However, if one considers the structures that are present in nature, that which are beyond the realms of smooth human construction, many of these rules disappear. Clouds are not perfect spheres, mountains are not symmetric cones and lightning does not travel in a straight line. Nature is rough and until very recently this roughness was impossible to measure. The discovery of fractal geometry has made it possible to mathematically explore the kinds of rough irregularities that exist in nature.
In the relatively short time since its discovery, fractal geometry has informed breakthroughs in numerous areas of science and industry—from biology, to telecommunications, to computer graphics. The depth and breadth of these applications suggest that we have only just begun to scratch the surface of what fractal geometry can teach us.
"CLOUDS ARE NOT SPHERES, MOUNTAINS ARE NOT CONES, COASTLINES ARE NOT CIRCLES, AND BARK IS NOT SMOOTH, NOR DOES LIGHTNING TRAVEL IN A STRAIGHT LINE." BENOIT MANDELBROT
The market price action does not travel in a straight line. Linear geometric techniques cannot be used to measure the market accurately. Please visit our forum and watch the videos about fractal geometry. The market is not so different. Click Here
19 Copyright 2011 © www.iTradeAIMS.com
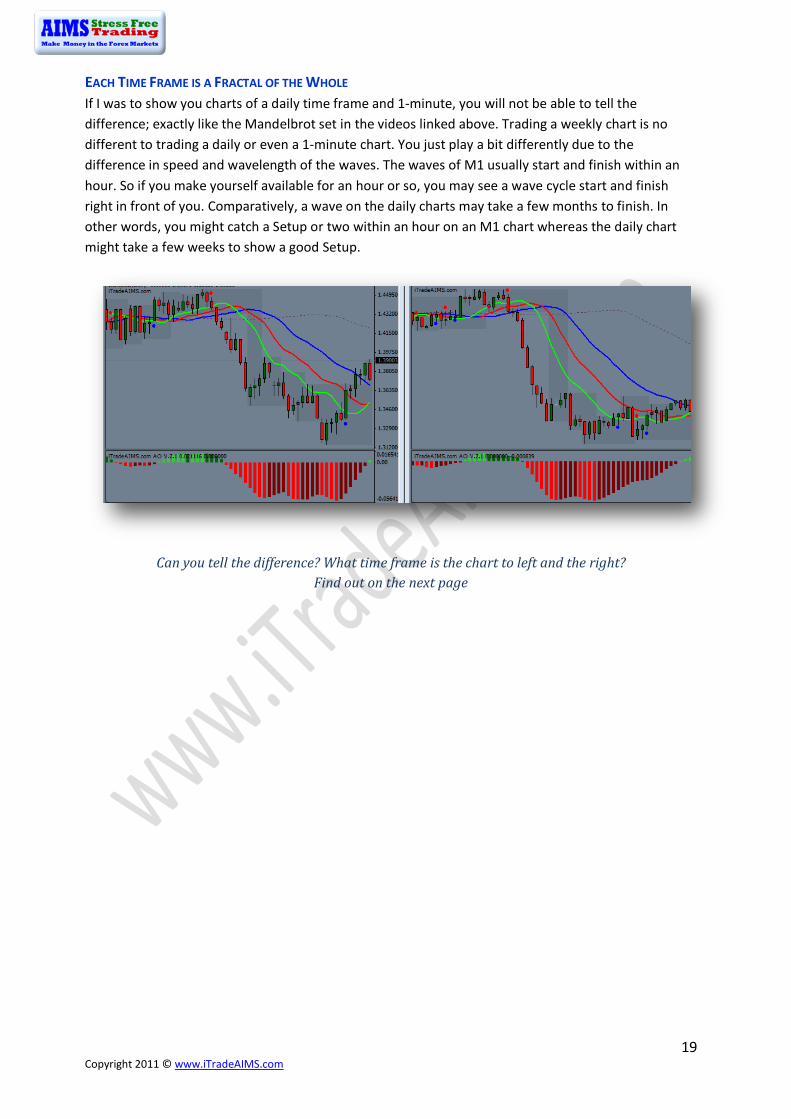
EACH TIME FRAME IS A FRACTAL OF THE WHOLE If I was to show you charts of a daily time frame and 1-minute, you will not be able to tell the difference; exactly like the Mandelbrot set in the videos linked above. Trading a weekly chart is no different to trading a daily or even a 1-minute chart. You just play a bit differently due to the difference in speed and wavelength of the waves. The waves of M1 usually start and finish within an hour. So if you make yourself available for an hour or so, you may see a wave cycle start and finish right in front of you. Comparatively, a wave on the daily charts may take a few months to finish. In other words, you might catch a Setup or two within an hour on an M1 chart whereas the daily chart might take a few weeks to show a good Setup.
Can you tell the difference? What time frame is the chart to left and the right? Find out on the next page

20 Copyright 2011 © www.iTradeAIMS.com
The Chart to left is a Daily Chart whereas the one to the right is a One Minute Chart This is Fractal Geometry
FOREX OPEN AND CLOSE TIMES Following is a table of Forex market open and close times.
FOREX MARKET HOURS
Region City Open (GMT) Close (GMT) Open (EST) Close (EST)
Europe London 8:00 am 5:00 pm 3:00 am 12:00 noon
Frankfurt 7:00 am 4:00 pm 2:00 am 11:00 am
America New York 1:00 pm 10:00 pm 8:00 am 5:00 pm
Chicago 2:00 pm 11:00 pm 9:00 am 6:00 pm
Asia Tokyo midnight 9:00 am 7:00 pm 4:00 am
Hong Kong 1:00 am 10:00 am 8:00 pm 5:00 am
Pacific Sydney 10:00 pm 7:00 am 5:00 pm 2:00 am
Wellington 10:00 pm 6:00 am 5:00 pm 1:00 am
21 Copyright 2011 © www.iTradeAIMS.com
SHORTER TIME FRAMES VS HIGHER TIME FRAMES If you have a large account, you might be able to earn good living using time frames that require little chart time, e.g. the daily charts would require just 15 minutes of trading per day. The 4hr time frame would require that you check your charts at most every 4 hrs or just once or twice per day. If you are a daily trader you cannot do anything until the next bar is printed so you’ll have to wait until the next day to take a decision. Likewise for H4 it would take four hours for the candle to close before you can make a decision, giving you ample time in between. For anything less than M30 you need to stay focused and remain at your computer for a good amount of time. Don’t worry though, we have made this very simple and stress free. You don’t have to be staring at your screen all the time; we’ve created an indicator where a lady’s voice will alert you to possible Setups.
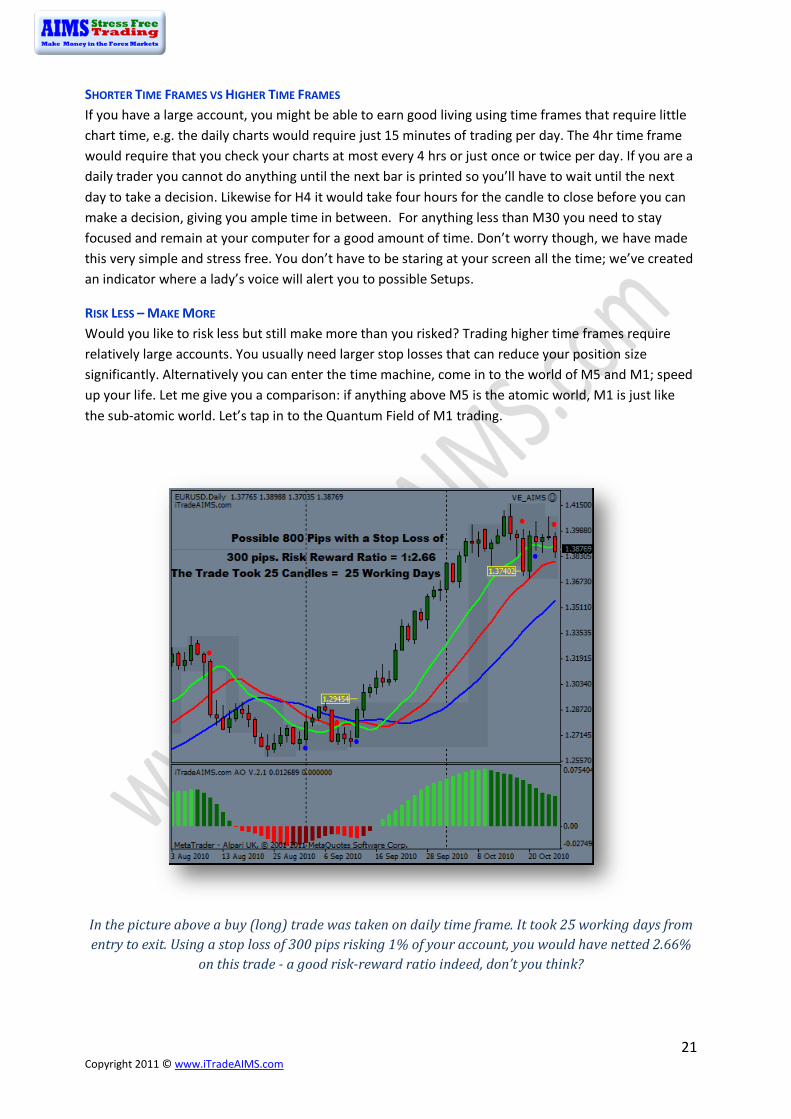
RISK LESS – MAKE MORE Would you like to risk less but still make more than you risked? Trading higher time frames require relatively large accounts. You usually need larger stop losses that can reduce your position size significantly. Alternatively you can enter the time machine, come in to the world of M5 and M1; speed up your life. Let me give you a comparison: if anything above M5 is the atomic world, M1 is just like the sub-atomic world. Let’s tap in to the Quantum Field of M1 trading.
In the picture above a buy (long) trade was taken on daily time frame. It took 25 working days from entry to exit. Using a stop loss of 300 pips risking 1% of your account, you would have netted 2.66%
on this trade - a good risk-reward ratio indeed, don’t you think?
22 Copyright 2011 © www.iTradeAIMS.com
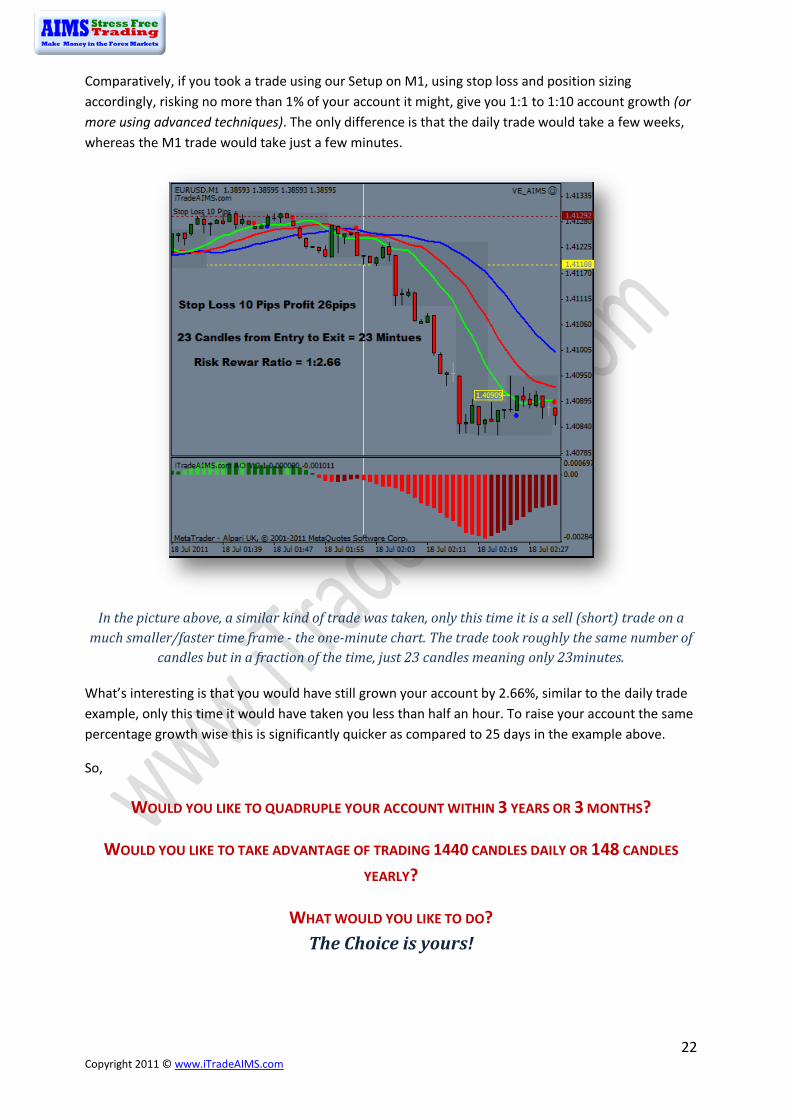
Comparatively, if you took a trade using our Setup on M1, using stop loss and position sizing accordingly, risking no more than 1% of your account it might, give you 1:1 to 1:10 account growth (or more using advanced techniques). The only difference is that the daily trade would take a few weeks, whereas the M1 trade would take just a few minutes.
In the picture above, a similar kind of trade was taken, only this time it is a sell (short) trade on a much smaller/faster time frame - the one-minute chart. The trade took roughly the same number of
candles but in a fraction of the time, just 23 candles meaning only 23minutes.
What’s interesting is that you would have still grown your account by 2.66%, similar to the daily trade example, only this time it would have taken you less than half an hour. To raise your account the same percentage growth wise this is significantly quicker as compared to 25 days in the example above.
So,
WOULD YOU LIKE TO QUADRUPLE YOUR ACCOUNT WITHIN 3 YEARS OR 3 MONTHS?
WOULD YOU LIKE TO TAKE ADVANTAGE OF TRADING 1440 CANDLES DAILY OR 148 CANDLES
YEARLY?
WHAT WOULD YOU LIKE TO DO? The Choice is yours!

23 Copyright 2011 © www.iTradeAIMS.com
THE SCHEDULE
TRADING DAY STARTS AT LONDON OR FRANKFURT OPEN On average we see 1-3 Setups per session. Some people don’t like the Frankfurt Open, others trade it differently. I prefer the London session but will trade a good Setup when Frankfurt opens, if I happen to be up and at my trading desk
TRADERS IN THE US: Trading the London Session might not be an easy task and you do not necessarily have to trade this session. Just NY session or a bit of Tokyo Session would do the trick. I have a few US-based AIMSter friends who trade the first two hours of the London Session and then get a few hours sleep before they’re up again for the US session.
BREAK TIME Our game requires concentration and we need to make sure we create an environment that is conducive to a mental state that we call “Focused Relaxation”. People often lose focus after concentrating hard for couple of hours and, as such, it is very important to take regular breaks.
You may quit trading if the market moves considerably (say 100 to 150 pips) early in the London session as the price will likely consolidate (go sideways in small range) for a while. You might also take a break if, after a couple of hours into session open, nothing happens – returning for the opening of the next session.
You should ideally have about 1-2 hr non-trading activity in between trading session, to ‘chillax’ and regain focus.
START AGAIN AT THE NEW YORK OPEN The New York open is similar to the London Open. There are some weeks that we see higher volatility in the New York session and some during the London Session, yet there are days when both sessions provide very good trading opportunities. The choice of session to trade is yours.
TRADERS IN THE US: You may want to take a break after London Close and come back for Tokyo Open. It may be a bit slow comparatively but still it produces Setups on a regular basis. I constantly find very good Setups on M5 and M1 during Tokyo Open. Volatility is usually lower than other sessions but the low volatility helps reduce the size of the AIMS Boxes, which then helps reduce risk further. E.g. AIMS Boxes might allow for a 6-10 pip stop loss, making it easier to hit the 1:1 or 1:2 trades.

24 Copyright 2011 © www.iTradeAIMS.com
Chapter 2: The AIMS Indicators
Let’s now understand our Indicators. We use only three Indicators and one alert. In Chapter 3, we discuss the Three Rules to create our Setup using these indicators. With practice and experience you will soon learn to identify a Setup within seconds, which should make your trading stress free and fun.
The picture below (a great example of a good Setup) shows all the indictors that we use.
NOW LET’S LEARN ABOUT EACH INDICATOR IN DETAIL.
Indicator 1. AIMSigator Green, Red, Blue and the Dotted
Line we call the Purple Line is AIMSigator
Indicator 2. AIMS AO
The 4-Coloured Histogram below the main chart window
Indicator 3. AIMS BOX
The Grey Shaded Area shows the AIMS Box. The top of the AIMS Box is the ‘upper AIMS Level’; the bottom is the ‘lower AIMS
Level’
AIMS Dot Alert V4
The Red and Blue Dots

25 Copyright 2011 © www.iTradeAIMS.com
AIMS Indicator 1: The AIMSigator To understand AIMSigator we must first understand Bill Williams Alligator. The Alligator is a very good indicator; it reveals the fractal geometric nature of the market. There is scientific research behind it and Bill Williams used super computers to arrive at this trend-confirming indicator. The Alligator is our “compass” - it shows us the direction of the trend and is very much in tune with the structure of the market.
Anatomy of the Alligator The Alligator is made of three smooth moving averages, shifted into the future.
Above: Alligator Lines without price candles/bars or other indicators
Green Line – Lips
Red Line – Teeth
Blue Line – Jaw
The Alligator

26 Copyright 2011 © www.iTradeAIMS.com
Above: Alligator with AIMS Boxes and the Purple Line
Alligator's Jaw (the Blue Line) – is a 13 period smooth moving average, at the mid price (High+Low)/2, offset 8 bars into the future.
INTERPRETATION AND USE OF INFORMATION PROVIDED BY THE BLUE LINE The Blue line is the Balance Line for price on the current time frame. Price will come to the Blue Line when there is no new incoming information. This means when the volatility goes down, the momentum will fall and price will stop travelling up and down; it starts going sideways and the Alligator catches up with price. When price is close to the Blue Line, it is said to be at its Balance Line. When price goes sideways, with all three lines intertwined we say, the Alligator is sleeping and that the market has reached its Balance Line. When there is new incoming information, price starts going away from the Balance Line and the Alligator opens its mouth. The rise and fall of momentum is also represented in the form of a histogram by AIMS AO (explained below). The Blue Line mimics AIMS AO as well. You must pay attention to relationship of the Blue Line and AIMS AO.
The Blue Line is the trend and the Balance Line of the current time frame.
Green Line – Lips
Red Line – Teeth
Blue Line – Jaw
The Alligator

27 Copyright 2011 © www.iTradeAIMS.com
Alligator's Teeth (the Red Line) – is 8-period smooth moving average, at the mid price (High+Low)/2, offset 5 bars into the future.
INTERPRETATION AND USE OF INFORMATION PROVIDED BY THE RED LINE The Red Line is the Balance Line of the significant lower time frame. When price is above the Red Line on M5 we start looking for a buy Setup on M1. When price is below the Red Line on M5 we start looking for a sell Setup on M1. We have a mechanism to display the Red Line of M5 on M1 – it’s called the Purple Line.
Red Line is the trend and the Balance Line of a certain lower time frame.
Alligator's Lips (The Green Line) – 5 period smooth moving average, at the mid price (High+Low)/2, offset 3 bars into the future.
INTERPRETATION AND USE OF INFORMATION PROVIDED BY THE GREEN LINE The Green Line is the Balance Line of a significant lower time frame, even lower than the Red Line. Just like the Blue Line, it also has a relationship with AO but with AO of the 5 times lower time frame.
Green Line is the trend and Balance Line of a lower time frame than the Red Line.
OK, WHAT IS THE AIMSIGATOR? Now that you know about the Alligator and the relationship of the lines it should be easy for you to understand that the AIMSigator is the “Multi-Dimensional Alligator”. We trade in the direction of 5 times higher time frame. Wouldn’t it be nice to know what the Alligator of the five times higher time frame telling us? In order to do so we have chosen to display on M1, information provided by the Red Line on M5. AIMSigator shows us the Red Line of M5 on M1. AIMSigator has built-in Alligator with added Purple Line.
ALLIGATOR IS OUR COMPASS WHEREAS AIMSIGATOR IS OUR FILTER.
The Purple Line – is a derivative of the Red Line of 5 time higher time frame. On M1, it is the Red Line of M5.
The Purple Line is the trend of a 5 times higher time frame.
In the next section we discuss how to use information provided by AIMSigator to help with our trading decisions.
WHAT IS THE SLEEPING ALLIGATOR? We generally want the Alligator to ‘sleep’ before we start looking for a trading opportunity. The Alligator is considered asleep when the three lines are intertwined and horizontal. We want the Blue, Red and Green Lines to be intertwined and inside the AIMS Box (explained later in this chapter). If the Purple Line is intertwined as well then that is even better. When the Alligator is sleeping we get excited, looking for a range breakout and a new trend to trade.

28 Copyright 2011 © www.iTradeAIMS.com
In the picture above, Alligator is sleeping in the area to the left of the blue vertical line. To the right of the blue vertical line, the lines have opened to the upside with Green above Red and Red above Blue. The Alligator mouth is open to upside.
THE EQUILIBRIUM POINT AND THE PATH OF LEAST RESISTANCE Everything is energy and energy follows the path of least resistance. The market is also energy. The energy of the market also follows the path of least resistance. In the markets, the path of least resistance is ‘Price Going Away from the Alligator’s Mouth’.
When the Alligator is sleeping, price is at the equilibrium point. The energy flow of buyers and sellers is at a ‘zero point’. It is like being at the top of a mountain - right at the peak of it. It requires less effort, at the peak of the mountain, to move a rock and let it roll downwards. The ‘path of least resistance is downwards’. When the rock starts rolling, it becomes increasingly difficult to stop because it would require a considerably larger amount of energy and force to stop it. The force of gravity pulls it down harder and harder. A little change at the start can have substantial effects later. To take advantage of this point in the time-space-reality of the markets, we patiently wait for the Alligator to sleep tight before looking for trading opportunities. A sleeping Alligator usually only requires a small stop loss and all trends start from this point. At this point “We don’t care which way the market moves, we just want to be in it when it does”.
Lines Intertwined Alligator Sleeping
Alligator Awake with it Mouth Open to Upside
Green above Red, Red Above Blue
Equilibrium Point – Price at Blue Line with alligator
sleeping. Either side of Alligator is ‘Path of Least
Resistance’

29 Copyright 2011 © www.iTradeAIMS.com
WHAT IS THE AWAKE ALLIGATOR OR OPEN ALLIGATOR? We say the Alligator is awake with its mouth open: when the Alligator Lines - Blue, Red and Green Lines - have opened to the up or down side.
If the Alligator’s mouth is open to the upside and above the Purple Line, we only take Long Trades
Alligator Open to Upside
Alligator Open to Upside

30 Copyright 2011 © www.iTradeAIMS.com
If the Alligator’s mouth is open to the downside and below the Purple Line, we take only Short Trades
Above: Alligator lines are below the Purple Line - it is the correct formation to go short.
Above: Alligator lines are open to downside, Purple is inside the AIMS Box.
Next: A full picture of the sleeping Alligator and the awake Alligator
Alligator Open to Downside
Alligator Open to Downside
31 Copyright 2011 © www.iTradeAIMS.com
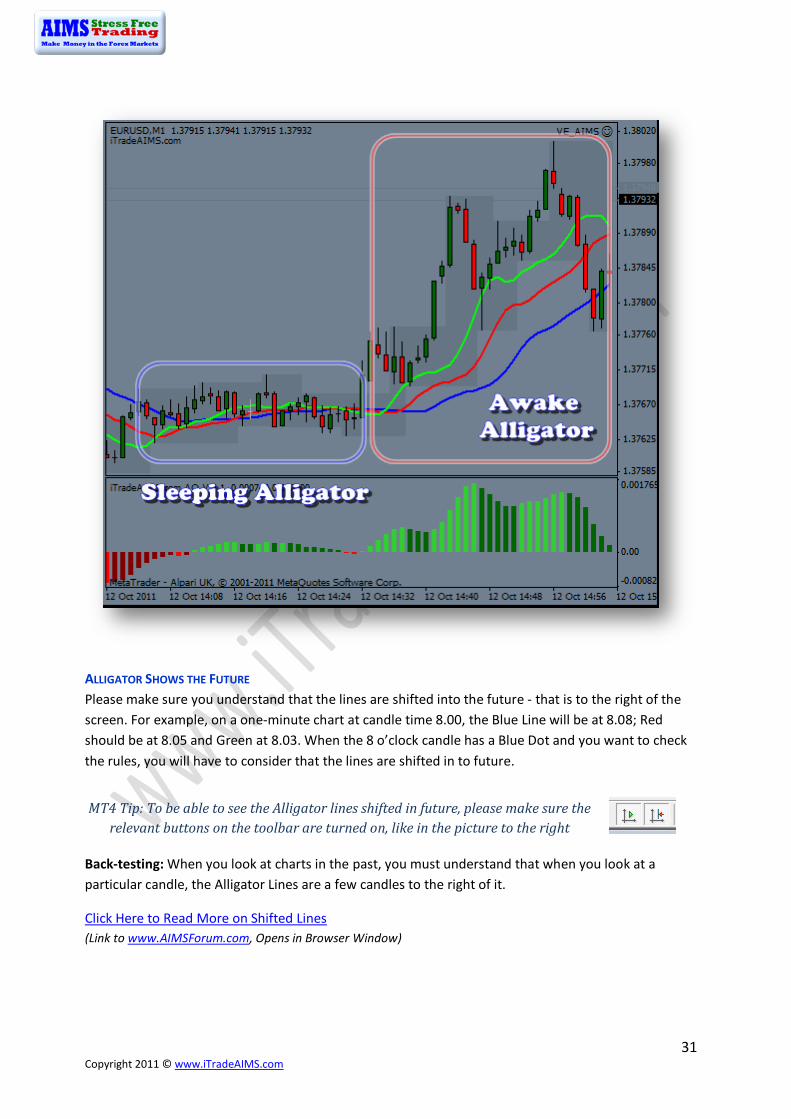
ALLIGATOR SHOWS THE FUTURE Please make sure you understand that the lines are shifted into the future - that is to the right of the screen. For example, on a one-minute chart at candle time 8.00, the Blue Line will be at 8.08; Red should be at 8.05 and Green at 8.03. When the 8 o’clock candle has a Blue Dot and you want to check the rules, you will have to consider that the lines are shifted in to future.
MT4 Tip: To be able to see the Alligator lines shifted in future, please make sure the relevant buttons on the toolbar are turned on, like in the picture to the right
Back-testing: When you look at charts in the past, you must understand that when you look at a particular candle, the Alligator Lines are a few candles to the right of it.
Click Here to Read More on Shifted Lines (Link to www.AIMSForum.com, Opens in Browser Window)

32 Copyright 2011 © www.iTradeAIMS.com
MULTI DIMENSIONS OF ALLIGATOR LINES Note that the lines are shifted in to future - that is why we have two dimensions of the Alligator. One dimension is the lines relative to where the current price bar is; another is the end of the lines. To find out if the mouth is open or closed you would look at the ends of the Alligator lines. Whereas to find out if price closed above/below Green or Red Line, you would look at the position of the lines relative to the current price bar close.

33 Copyright 2011 © www.iTradeAIMS.com
AIMS Indicator 2: AIMS AO AIMS AO is a 34-period simple moving average, plotted through the middle points of the bars (H+L)/2, which is subtracted from the 5-period simple moving average, built across the central points of the bars (H+L)/2.
It shows us quite clearly what is happening to the market driving force at the present moment - it shows momentum.
Above the Zero Line, it remains green and dark green. Below the Zero Line it remains red and maroon.
WHAT IS ‘AO CLOSE TO ZERO LINE’? It means that AIMS AO bars are close to the Zero Line - it looks like below.
We take Setups when AO is close to the Zero Line. The AO is the most important indicator in terms of momentum and wave counting. It shows the waves very clearly that the Zero Line is the: -
• Point of Equilibrium • Peak of the mountain • Balance point • Pivot point. • Tipping point from where the boulders roll down the hill.
THE BUTTERFLY FLAP OF THE BUTTERFLY PRINCIPLE STARTS HERE.
I CANNOT PUT ENOUGH EMPHASIS ON THIS POINT - PLEASE UNDERSTAND IT
This is Zero Line Time Entries near this
point
34 Copyright 2011 © www.iTradeAIMS.com
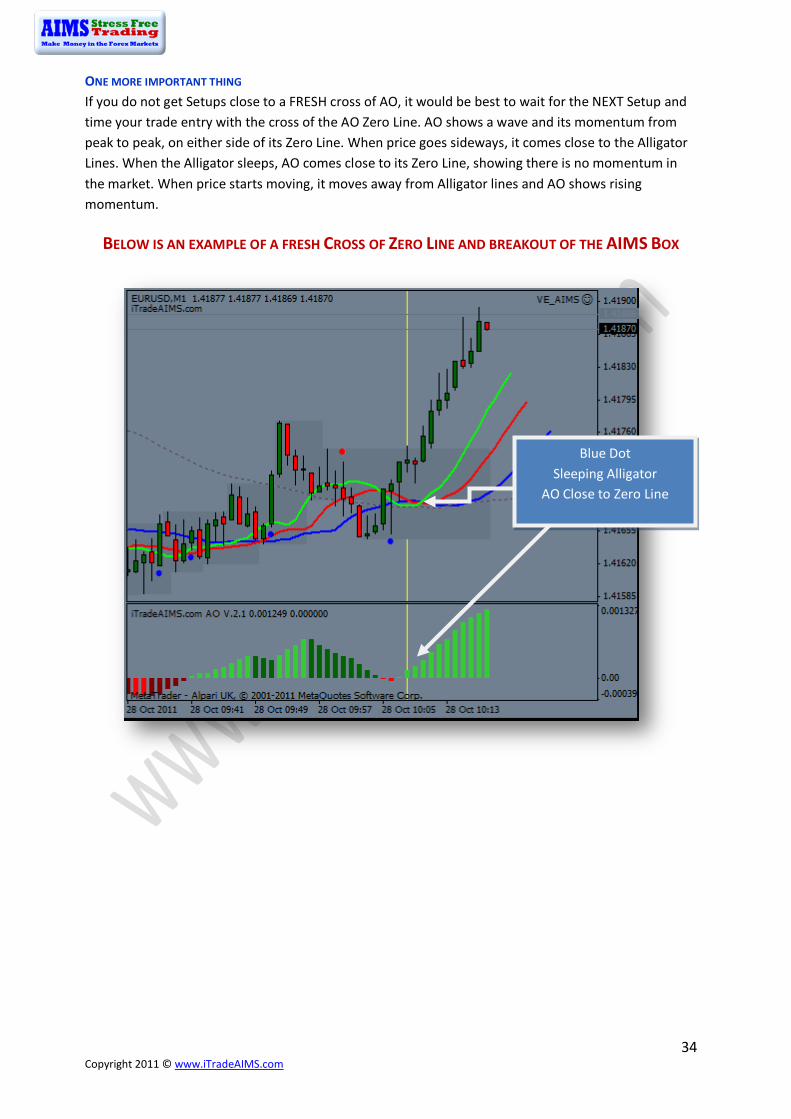
ONE MORE IMPORTANT THING If you do not get Setups close to a FRESH cross of AO, it would be best to wait for the NEXT Setup and time your trade entry with the cross of the AO Zero Line. AO shows a wave and its momentum from peak to peak, on either side of its Zero Line. When price goes sideways, it comes close to the Alligator Lines. When the Alligator sleeps, AO comes close to its Zero Line, showing there is no momentum in the market. When price starts moving, it moves away from Alligator lines and AO shows rising momentum.
BELOW IS AN EXAMPLE OF A FRESH CROSS OF ZERO LINE AND BREAKOUT OF THE AIMS BOX
Blue Dot Sleeping Alligator
AO Close to Zero Line
35 Copyright 2011 © www.iTradeAIMS.com
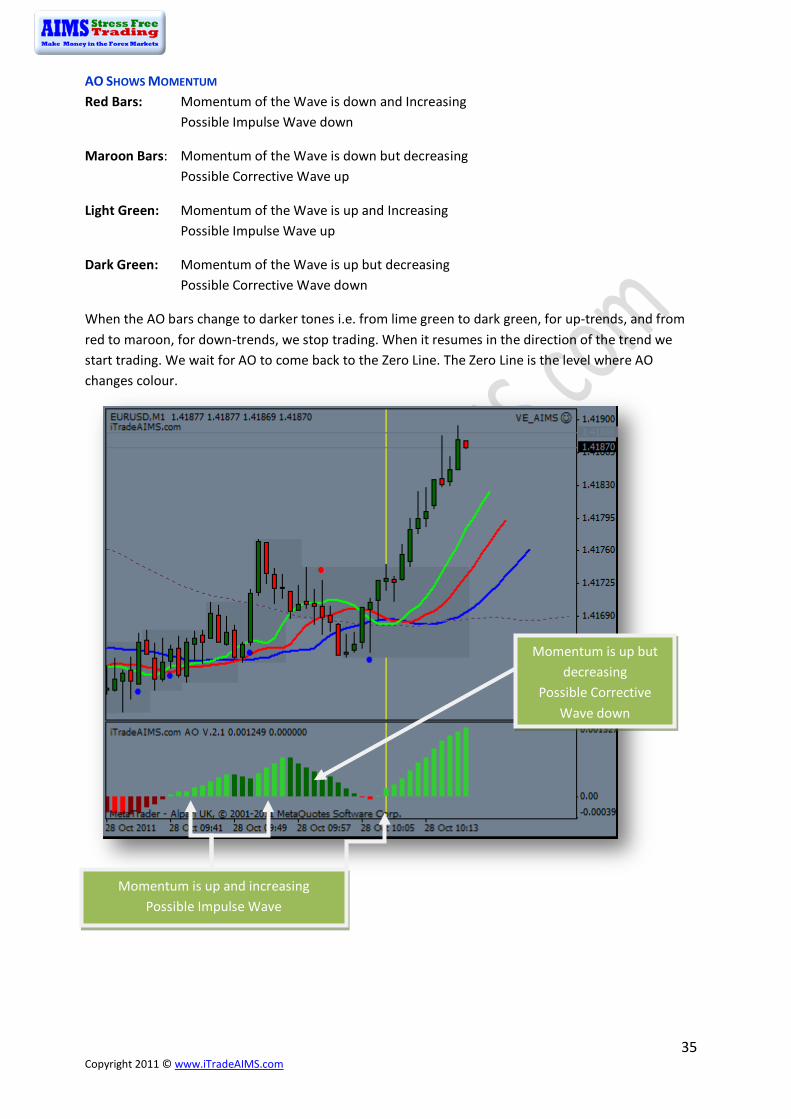
AO SHOWS MOMENTUM Red Bars: Momentum of the Wave is down and Increasing Possible Impulse Wave down
Maroon Bars: Momentum of the Wave is down but decreasing Possible Corrective Wave up
Light Green: Momentum of the Wave is up and Increasing Possible Impulse Wave up
Dark Green: Momentum of the Wave is up but decreasing Possible Corrective Wave down
When the AO bars change to darker tones i.e. from lime green to dark green, for up-trends, and from red to maroon, for down-trends, we stop trading. When it resumes in the direction of the trend we start trading. We wait for AO to come back to the Zero Line. The Zero Line is the level where AO changes colour.
Momentum is up and increasing
Possible Impulse Wave
Momentum is up but decreasing
Possible Corrective Wave down

36 Copyright 2011 © www.iTradeAIMS.com
MARKET MOVES IN WAVES We all know that the market moves in waves. Our charting software proves that to us every second, every minute. Price does not go up and down in a straight line - it creates waves.
Up-Trend: Waves taking the price up are longer than the waves bringing the price down again.
Down-Trend: Waves taking the price down are longer than the waves bringing the price up again.
Momentum is Down and Increasing Possible Impulse Wave Down
Momentum is Down but Decreasing Possible Corrective Wave Up
37 Copyright 2011 © www.iTradeAIMS.com
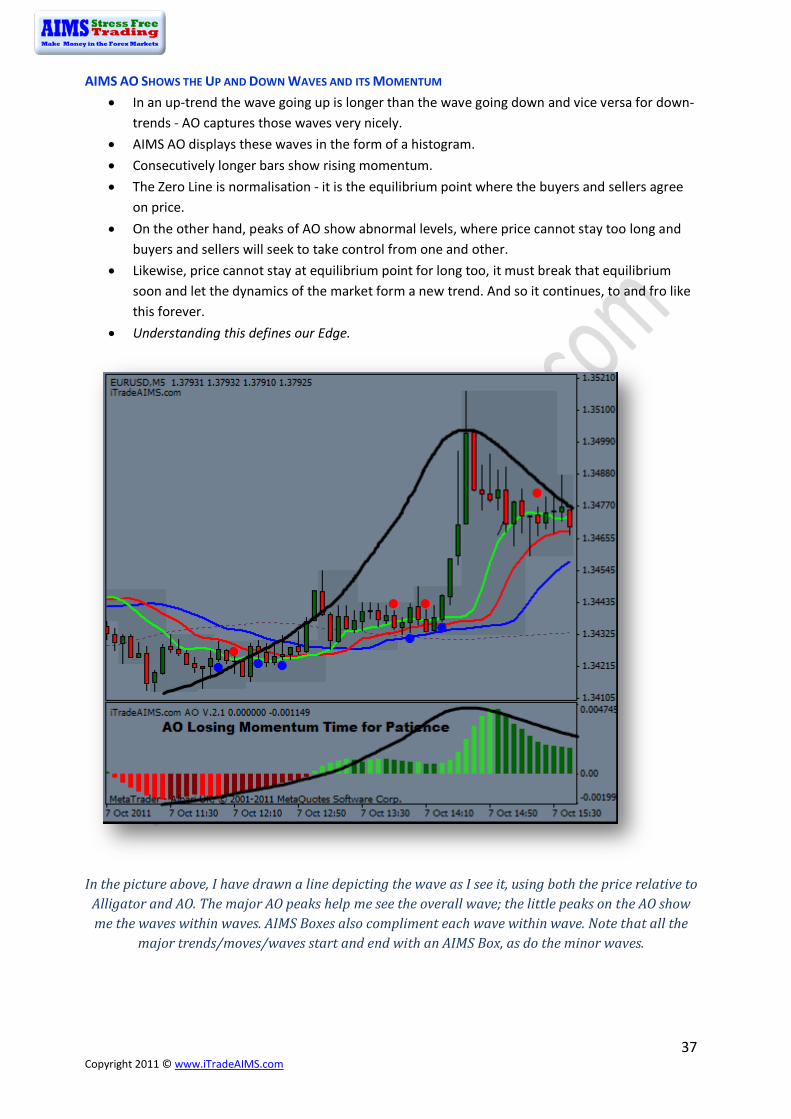
AIMS AO SHOWS THE UP AND DOWN WAVES AND ITS MOMENTUM • In an up-trend the wave going up is longer than the wave going down and vice versa for down-
trends - AO captures those waves very nicely. • AIMS AO displays these waves in the form of a histogram. • Consecutively longer bars show rising momentum. • The Zero Line is normalisation - it is the equilibrium point where the buyers and sellers agree
on price. • On the other hand, peaks of AO show abnormal levels, where price cannot stay too long and
buyers and sellers will seek to take control from one and other. • Likewise, price cannot stay at equilibrium point for long too, it must break that equilibrium
soon and let the dynamics of the market form a new trend. And so it continues, to and fro like this forever.
• Understanding this defines our Edge.
In the picture above, I have drawn a line depicting the wave as I see it, using both the price relative to Alligator and AO. The major AO peaks help me see the overall wave; the little peaks on the AO show me the waves within waves. AIMS Boxes also compliment each wave within wave. Note that all the
major trends/moves/waves start and end with an AIMS Box, as do the minor waves.

38 Copyright 2011 © www.iTradeAIMS.com
AIMS STRESS FREE TRADING – 10SEC ELLIOTT WAVE EBOOK – HOW TO USE AO TO COUNT WAVES AND TIME
ENTRIES AND EXITS I recommend reading AIMS Stress Free Trading – 10Sec Elliott Wave eBook. The book explains in detail how we use AIMS AO V2 to trade the markets. It also discusses, with illustrations, how to count the Elliott Wave using AIMS AO.
In the picture below, we have a Setup on M5 and on M1. (Now I’m going to speak some Elliott Wave language, if you’re allergic to Elliott Wave then protect your eyes now )
AO has peaked red, once on M5 to the left, showing Wave 3. After a peak of AO, we wait for a retrace. Price comes back to Alligators mouth and AO bars come close to its Zero Line. Based on the peak of AO to the downside, after the retrace has completed we expect a 5th wave down and hence we wait
for a short Setup on M1, into the possible 5th wave of M5. More on this in AIMS Stress Free Trading – 10 Sec Elliott Wave eBook.

39 Copyright 2011 © www.iTradeAIMS.com
By knowing how to read AO you know how to trade any financial market in the world
“This information could be worth 7 figures to you in the near future”.
AIMS Stress Free Trading – 10Sec Elliott Wave eBook explains in detail how to use AIMS AO and how to use AO to count Elliott Wave.
Blue Arrow: Wave Up
Yellow Arrow: Wave Down
First Circle: Cross of ZL Up
Second Circle: Cross of ZL Down

40 Copyright 2011 © www.iTradeAIMS.com
AIMS Indicator 3: AIMS Box The AIMS Box is formed from a minimum of five bars with the top of the box being the upper Fractal; the bottom of box, the lower Fractal
The AIMS Levels are the high and low of the AIMS Box – the upper and lower Fractals.
This indicator, by itself, provided the concept that revolutionised my trading.
OBJECTIVE INFORMATION GENERATED BY THE AIMS BOX AND ITS LEVELS 1. Crystal clear entry levels. 2. Stop loss levels – clear support and resistance levels. 3. Money management information. 4. Position/lot size information. 5. Trailing stop loss mechanism.
BESIDES THAT, IT ALSO GENERATES THE FOLLOWING ADDITIONAL INFORMATION ABOUT THE MARKET: a. The market always creates an AIMS Box before it turns around. Every trend starts and ends
with an AIMS Level. b. Entries are always taken on the breakout of the AIMS Box. We don’t take entries inside the
AIMS Box on the timeframe that produced the Setup. When price is inside the grey shaded zone, it is inside the AIMS Box; it is within the AIMS Levels – we look the breakouts3.
c. We prefer a short AIMS Box: a tight range between the AIMS Levels. New trades are preferably taken on the break of tight AIMS Levels. AIMS Levels are considered tight, shallow or narrow when the distance between upper and lower AIMS Levels, on M1, is less than 15 pips.
d. The stop loss is always set on the opposite side of the AIMS Box from where the trade was entered.
e. We do money management using the number of pips distance between upper and lower AIMS Levels.
f. We use the AIMS Box for trailing our hard stop loss – basically behind the obvious support and resistance.
g. It is the structure of the structure of the market. Elliott Wave is the structure of the market and the AIMS Box is the structure of Elliott Wave.
Important Fact
“WITHIN AN AIMS BOX THERE IS ALWAYS AN ELLIOTT WAVE OF A CERTAIN DEGREE”
If you understood this concept you are in line with the structure of the market. The market cannot turn around without creating an AIMS Box. There is always always always an AIMS Level at the top or bottom of a wave.
Now let’s study the anatomy of the AIMS Box and its Levels.
3 We have another Setup for trading inside the AIMS Box but that is beyond the scope of this book for now. It will however be explained in the Forum under ‘Expert Techniques’ in due course.

41 Copyright 2011 © www.iTradeAIMS.com
Anatomy of the AIMS Box and the AIMS Levels As mentioned earlier, the AIMS Boxes are formed using high and low Fractals. A new AIMS Box will be created whenever price makes a new high or low Fractal.
THE BOTTOM OF THE AIMS BOX – THE LOWER AIMS LEVEL - is created when a low Fractal is formed i.e. the low of a candle is lower than two candles to the left and two candles to the right.
The AIMS Level clearly shows support and resistance – where price approached a level and could not go further, forcing it to retrace on itself.
Pending Sell Order is set 1 pip below the lower AIMS Level (provided it’s a correct Setup).
THE TOP OF THE AIMS BOX – THE UPPER AIMS LEVEL - is created when a high Fractal is formed i.e. the high of a candle is higher than two candles to the left and two candles to the right.
Pending Buy Order is set 1 pip + spread above the AIMS Box (provided it’s a correct Setup).
Below: Example of Lower AIMS Level
Below: Example of Upper AIMS Level
AIMS Level of the AIMS Box Forms at High or Low of Middle Candle

42 Copyright 2011 © www.iTradeAIMS.com
Upper AIMS Level of the AIMS Box Forms here
Lower AIMS Level of the AIMS Box Forms here

43 Copyright 2011 © www.iTradeAIMS.com
THE AIMS BOX AND ITS UPPER AND LOWER LEVELS
The above picture shows the upper and lower AIMS Levels that form the AIMS Box. The candle marked with ‘Middle Candle’ is what creates the upper AIMS Level. You can see that the highs of the
two candles prior to the middle candle are lower than the middle candle; the highs of the two candles to the right are also lower than the middle candle - that forms the AIMS Level.
The High of the Middle Candle Forms
Upper AIMS Level
2 Candles to the Right
2 Candles to the Left
2 Candles to the Left
2 Candles to the Right
The Low of the Middle Candle Forms
Lower AIMS Level

44 Copyright 2011 © www.iTradeAIMS.com
DOES THE AIMS BOX REPAINT? Not really. The indicator is coded to paint a tentative AIMS Box at the end of the 4th candle instead of 5th candle. You need at least five candles to create an AIMS Level, but the code allows for an early warning system: instead of painting an AIMS Box at the end of 5th candle, it paints it at the end of 4th candle. Sometimes you might notice an AIMS Box formed and then deleted in a minute - this is not a repaint. When you see an AIMS Box, wait for one more candle to close before considering it a confirmed AIMS Box.

46 Copyright 2011 © www.iTradeAIMS.com
Down-Trend - AIMS Boxes stepping down; price continues breaking below AIMS Boxes consecutively; a sequence of lower lows and lower highs.
Up-Trend - AIMS Levels stepping up; price continues breaking upper AIMS Levels consecutively; a sequence of higher highs and higher lows.
AIMS Stepping Up. Price Breaking
Above Upper AIMS
Up-Trend
An AIMS Box is formed at each Lower Low and Lower High. AIMS Boxes Stepping Down like an Escalator shows a Down Trend
Each tiny wave creates an AIMS Box at the start and end of it.
Price always creates an AIMS Box when it moves up and down
Lower Lows Lower Highs

47 Copyright 2011 © www.iTradeAIMS.com
Range bound (non-trending market) AIMS Levels moving horizontally.
WHERE TO PUT YOUR STOP LOSS? We put our stop loss on the opposite side of the AIMS Box. Stop Loss for Buy Order: 1 pip below lower AIMS Level Stop Loss for Sell Order: 1 pip + spread above upper AIMS Level
No clear stepping up sequence or stepping down sequence.
Alligator Lines help see these periods even better.
48 Copyright 2011 © www.iTradeAIMS.com
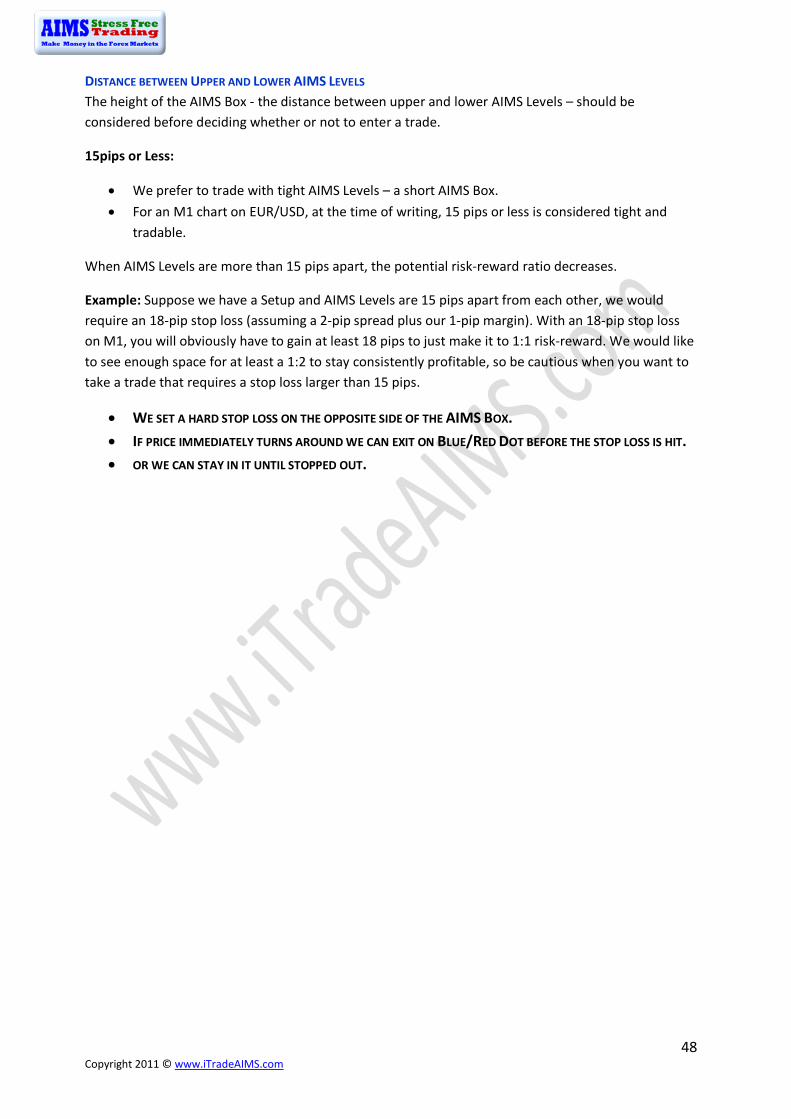
DISTANCE BETWEEN UPPER AND LOWER AIMS LEVELS The height of the AIMS Box - the distance between upper and lower AIMS Levels – should be considered before deciding whether or not to enter a trade.
15pips or Less:
• We prefer to trade with tight AIMS Levels – a short AIMS Box. • For an M1 chart on EUR/USD, at the time of writing, 15 pips or less is considered tight and
tradable.
When AIMS Levels are more than 15 pips apart, the potential risk-reward ratio decreases.
Example: Suppose we have a Setup and AIMS Levels are 15 pips apart from each other, we would require an 18-pip stop loss (assuming a 2-pip spread plus our 1-pip margin). With an 18-pip stop loss on M1, you will obviously have to gain at least 18 pips to just make it to 1:1 risk-reward. We would like to see enough space for at least a 1:2 to stay consistently profitable, so be cautious when you want to take a trade that requires a stop loss larger than 15 pips.
• WE SET A HARD STOP LOSS ON THE OPPOSITE SIDE OF THE AIMS BOX. • IF PRICE IMMEDIATELY TURNS AROUND WE CAN EXIT ON BLUE/RED DOT BEFORE THE STOP LOSS IS HIT. • OR WE CAN STAY IN IT UNTIL STOPPED OUT.

49 Copyright 2011 © www.iTradeAIMS.com
WHAT IS BRACKETING? Bracketing is the placing of pending buy and sell orders, either side of the AIMS Box.
We Bracket when: -
• Market is going sideways and there is no obvious trend (Alligator asleep) • AIMS Levels are tight • AIMS AO is close to the Zero Line with short histogram bars
Bracketing is used only when
1. Alligator is asleep on both M5 and M1. 2. AIMS Levels on M5 and M1 are both tight
When we have all the lines intertwined, like in the above picture, we bracket the market each side of the AIMS Box. A stop loss for the buy order is placed exactly at the sell order level and vice versa. See the picture on the next page.
Important:
• Do not bracket if the trend direction on M5 is clear. • If the Alligator is open on M5, we would usually be biased to take trades only in that
direction. • Remember that we only trade in the direction of the trend on M5. • For beginners, I recommend waiting for Alligator on M5 to open and then wait for a Setup
on M1.
Buy Order
Sell Order

50 Copyright 2011 © www.iTradeAIMS.com
WHAT IS ‘STOP AND REVERSE’? Bracketing and the ‘stop and reverse’ are similar things. When we bracket the market our stop loss is on the other side of the AIMS Box, exactly at that level we have an order to go in the opposite direction.
For example, if triggered long but the breakout fails and our stop loss is hit, a sell order is activated as soon as we are stopped. This is called a ‘stop and reverse’ order, whereby when one order triggers and reverses; it stops at the other side of the AIMS Box and triggers a trade in the opposite direction. This ensures that we don’t miss a trend.
WHAT IF BOTH ENTRIES FAIL? It is possible that it might happen. There is nothing one can do about it; it’s part of the game. Wait for next Setup.
ADVANTAGES OF BRACKETING: You will never miss a trend again. You must do your money management correctly – please read Money Management in Chapter 4.
Rules for Bracketing:
• We bracket only when the Purple Line is also inside the AIMS Box. If Purple is away from us, we take trades in the direction going away from the Purple Line.
• We place bracket trades when the Alligator is asleep on M5 as well. If the Alligator is awake on M5, trade long/short in line with where the mouth is pointing – “the trend is your friend”.
SL for Sell Order
SL for Buy Order

51 Copyright 2011 © www.iTradeAIMS.com
AIMS Alert: AIMS Talking Alert
The Dots are our mechanism to spot entry or exit setups. The indicator alerts us that a Setup might be forming. The AIMS Talking Alert is designed to play a sound that calls out the name of the currency pair, the time frame and the colour of the Dot.
The Dots are roughly timed with a close above or below the Green Line. The Dots alert us that price has either come back to the Alligator or ready to go away from it.
In the picture below, note that a Dot is printed each time a candle closed above or below the Green Line.
Each Dot plays a voice alert to inform us that a Red or Blue Dot has appeared on a certain pair and a time frame.
INFORMATION GENERATED BY THE DOTS: -
BLUE DOT A Blue Dot is printed below the candle when price closes above the Green Line.
What does a Blue Dot Tell you?
1. Check the Setup Rules for a possible long Setup. 2. If already in a short trade, consider exiting.
RED DOT A Red Dot is printed above the high of a candle when price closes below the Green Line.
What does a Red Dot tell you?
1. Check the Setup rules for a possible short Setup 2. If already in a long trade, consider exiting.
GROUND RULES FOR DOTS: • The candle with a Dot must be inside the AIMS Box to be considered for a Setup; it must not
have already broken out of the AIMS Box. • Do not enter the market just because a new Dot has appeared. Entries are always taken using
pending orders, set to trigger on the breakout of The AIMS Box. • Enter the markets only when the Setup rules have all been checked.

52 Copyright 2011 © www.iTradeAIMS.com
THE DOTS AND SLEEPING ALLIGATOR ON M1: When the Alligator is sleeping we may get many Blue and Red Dots. The Dots do not dictate the direction of the trade in this situation. What dictates the direction of our trade, in this situation, is …
THE FIRST BREAKOUT OF THE AIMS BOX OUTSIDE THE SLEEPING ALLIGATOR’S MOUTH

53 Copyright 2011 © www.iTradeAIMS.com
Chapter 3: The Setup In this chapter we shall first explore our three Ground Rules followed by three Entry Rules and exit Setup. The Ground Rules are always there as non-negotiable constants. They lay down the foundation for the three Entry Rules. The Entry Rules create that moment in time-space when we are ready to trade; they help us recognise correct spots of entering markets.
The Ground Rules
1. ENTER THE MARKET ON THE BREAKOUT OF THE AIMS BOX ONLY • Always use pending orders, in order to catch the breakout of The AIMS Box. • Price MUST be inside the AIMS Box. • Always check the distance between upper and lower levels of the AIMS Box. For M1 anything
more than 15 pips could be high risk. • The candle with a Dot MUST be inside AIMS BOX.
2. TRADE AWAY FROM THE PURPLE LINE We trade in the direction of the trend of 5 times higher time frame. For M1, the M5 is obviously the 5 times higher time frame. Hence, we trade in the direction of the Alligator on M5. As long as price is at least above the Red Line of M5, we trade long Setups on M1. As Long as price is below at the Red Line of M5, we trade short Setups on M1.
Since the Purple Line is the Red Line of M5 or 5 times higher time frame, we take our trend direction from the Purple Line. Besides interpreting Alligator of M5, we also look at the angulations of the Purple Line of M1. We shall take Setups on M1 as long as we are trading in the direction going away from the Purple Line. If you see a Setup on M1 but the trade direction is towards the Purple Line, you will be trading against the trend.
• Do not trade towards Purple Line unless you are comfortable with trading reversals or deliberately going against the trend.
• Do not trade into Alligator’s mouth. • Do not feed the Alligator. • Do not trade inside the Alligator’s mouth. • If you trade towards the Purple Line on M1, you are trading into the Alligator’s mouth on M5.
As long as we are trading into any one Purple Line, be it the Purple on M1 or the Purple on M5, we are essentially trading against the higher time frame trends. If there is a Setup on M1 on the correct side of the Purple Line but against Purple of M5, we might still take the Setup but keeping in mind that we may be going against the trend or hitting an early trend reversal. We never trade towards the Purple Line on M1.

54 Copyright 2011 © www.iTradeAIMS.com
3. ALWAYS SET PENDING ORDERS – NEVER TRADE MARKET ORDERS Many traders have lost money by taking impulse trades – basically clicking the buy/sell now button. I suffered from impulse trading too, until I decided to cure this situation: I created the rule of “No More Market Orders”. Since our entries are always on the breakout of the AIMS Box, we always set a pending order. Never mind if you miss a trade because you couldn’t place a pending order in time, just say “NEXT” and you shall most likely see another opportunity present itself shortly.
Do not confuse “Break of AIMS” with making a market order after it breaks the level. We must always set pending orders and wait for price to trigger it. Some people do enter market orders, when there is a good Setup and price closes just outside an AIMS Box, but there should be no need of doing that.

55 Copyright 2011 © www.iTradeAIMS.com
Putting it all Together Let’s now put everything together. Chapter 2 explains how to read and interpret information generated by the three AIMS indicators. In this chapter, we will learn to understand how to use the indicators, in a specific way, to make trading decisions.
THE SETUP SIGNALS A TRADE OPPORTUNITY FOR WHICH WE HAVE THREE SIMPLE RULES.
Once you have understood how to interpret the AIMS Indicators, explained in Chapter 2, identifying a Setup should take a matter of seconds. The Three Rules effectively mean interpreting information generated by our three indicators. It is the confluence of three dimensions, the information generated by the market and sent to us via our three indicators, which create the perfect environment for taking a trade.
In the beginning, you might find the experience akin to learning to ride a bicycle for the first time. You might find yourself looking for each indicator and rule separately and might feel a bit uncomfortable. I promise you that as you practice, the time will soon come when you won’t have to look at the rules; they will become a natural part of the picture for you. You’ll soon become a ‘picture trader’. You’ll be able to simply glance at any chart and within a second you will know if there’s a Setup or not. To begin, I suggest you focus on learning to balance the bike, then once mastered go for a ride around the city in style. We use our conscious mind during the process of learning. With practice, the knowledge is transferred to the right part of the brain. Remember when you were learning to drive for the first time …?
Keep in mind!
“TRADE WHAT YOU SEE NOT WHAT YOU THINK”

56 Copyright 2011 © www.iTradeAIMS.com
The Setup – waiting for the Dots
Dot Alert: Wait for “Red/Blue Dot” alert then check The Three Rules
The Three Rules
The following rules confirm our Setup: -
Rule 1 Alligator Sleeping or Awake?
Rule 2 AIMS AO Bars Close to the Zero Line?
Rule 3 Entry Level not too far from the Stop Loss Level?
EXPLANATION OF THE RULES The indicators generate information constantly but we take a trade only when all three indicators generate certain information simultaneously. It is the confluence of certain conditions that form the perfect hunting season. We have established rules that serve as criteria for us to create what we call The Setup.
Setup 1: If the Alligator is sleeping, we call it Setup 1
When the Alligator is sleeping, i.e. the three lines are intertwined and going sideways inside the AIMS Box, we have a sleeping Alligator. This is the time to check the Three Rules. When the Alligator is sleeping, we do not have a trend on the current time frame. We look at M5 and see if the Alligator on M5 is sleeping or awake. An example follows of the sleeping Alligator Setup -Setup 1

57 Copyright 2011 © www.iTradeAIMS.com
EXAMPLE OF SETUP 1
Check the price action to the left of the blue vertical line. Price remained stuck inside The AIMS Box and the Alligator lines were intertwined. We would set a pending buy order before price breaks out
of the AIMS Box. The candle on the blue vertical line would trigger our buy order.
Buy Order
Rule 1: Sleeping Alligator
Rule 2: AO Close to Zero Line
Rule 3: Entry Price Close to Stop Loss
58 Copyright 2011 © www.iTradeAIMS.com
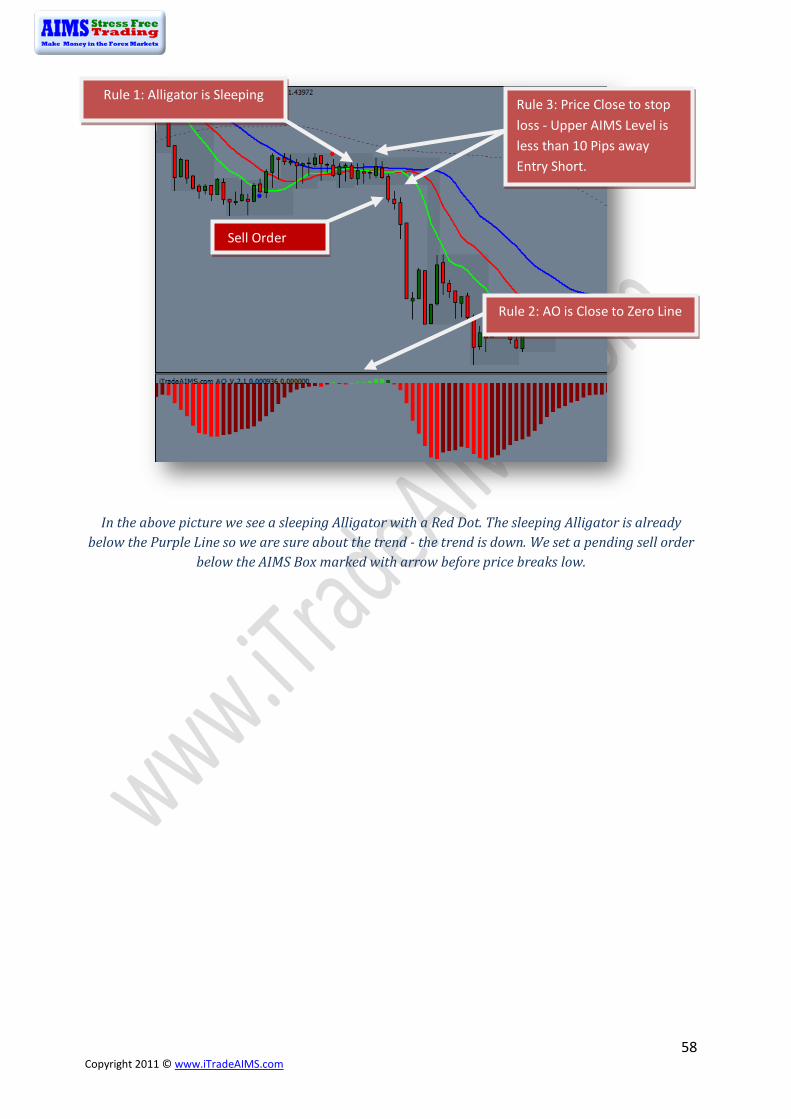
In the above picture we see a sleeping Alligator with a Red Dot. The sleeping Alligator is already below the Purple Line so we are sure about the trend - the trend is down. We set a pending sell order
below the AIMS Box marked with arrow before price breaks low.
Sell Order
Rule 1: Alligator is Sleeping
Rule 2: AO is Close to Zero Line
Rule 3: Price Close to stop loss - Upper AIMS Level is less than 10 Pips away Entry Short.

59 Copyright 2011 © www.iTradeAIMS.com
Setup 2: If the Alligator is awake, we call it Setup 2
When the Alligator is awake i.e. the three lines are open either up or down, we trade only in the direction of the Alligator. Alligator on M5 tells us the direction of the trend. Alligator on M1 tells us the direction of our trades. Setup 2 is usually the break of the 2nd AIMS Box out of Alligators mouth. What is first or second AIMS Box is explained later.
EXAMPLE OF SETUP 2
Buy Order
Rule 1: Alligator is Open to Upside
Rule 2: AO is Close to Zero Line
Rule 3: Price is Close to Stop Loss
60 Copyright 2011 © www.iTradeAIMS.com
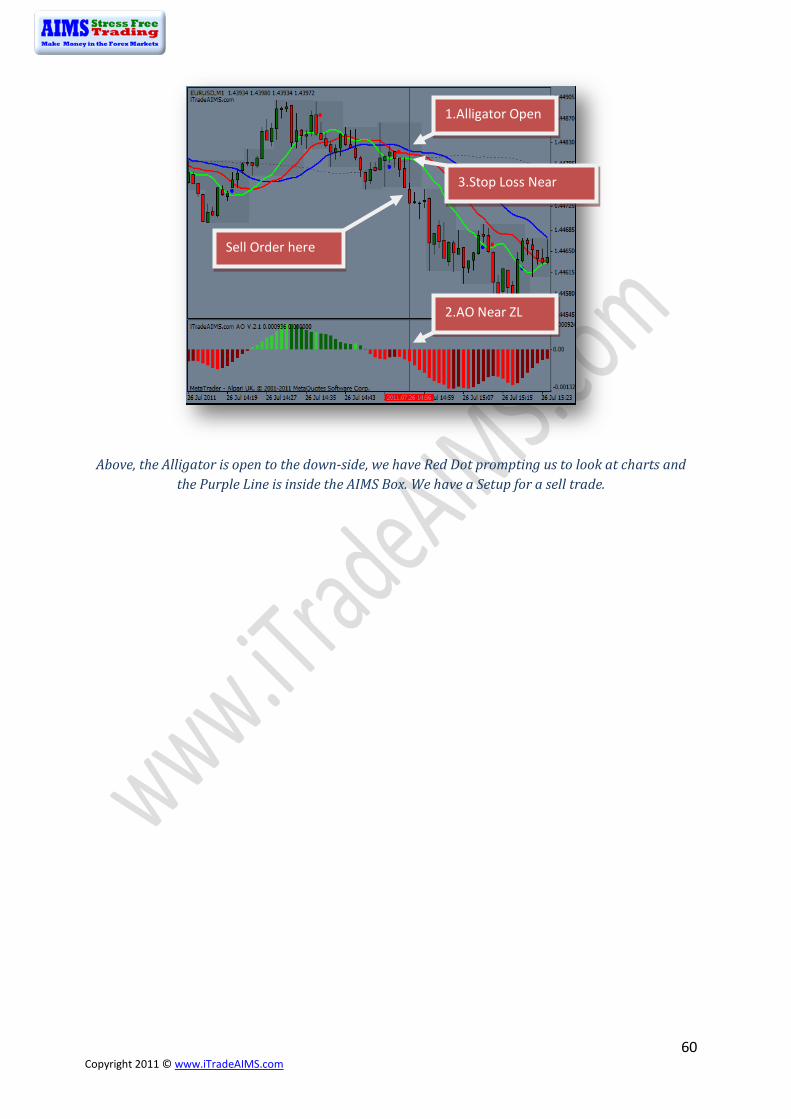
Above, the Alligator is open to the down-side, we have Red Dot prompting us to look at charts and the Purple Line is inside the AIMS Box. We have a Setup for a sell trade.
Sell Order here
1.Alligator Open
2.AO Near ZL
3.Stop Loss Near

61 Copyright 2011 © www.iTradeAIMS.com
WHAT IS THE BREAK OF FIRST OR SECOND AIMS BOX, OUTSIDE ALLIGATOR’S MOUTH In the pictures below, the arrows point to the first and second AIMS Box outside the Alligators mouth. On the M5 chart, to the left, the candle that broke out of the labelled AIMS Box is the break of first AIMS Box outside sleeping Alligators mouth. On the M1 chart, the arrow pointing to the 2nd AIMS Box shows how price broke out of AIMS Box for the first time. A new AIMS Box was then created and hence the break of this new AIMS Box is considered the break of 2nd AIMS Box outside the Alligators mouth. Break of 3rd or further AIMS Boxes are less likely to provide profitable trading opportunities.
1st AIMS Box
2nd AIMS Box 1st AIMS Box
1st AIMS Box
2nd AIMS Box
1st AIMS Box

62 Copyright 2011 © www.iTradeAIMS.com
WHEN THE ALLIGATOR’S MOUTH IS CLOSED ON M5 If the Alligator is sleeping on both time frames then we do not have a trend on either time frame. We should wait for the trend to confirm on M5.
WAIT FOR AIMS BOX BREAKOUT WITH ALLIGATOR OPEN ON M5 AND THEN WAIT FOR A SETUP
ON M1.
Double AIMS Levels There are times when we have an AIMS Box on M1 that has the same (or extremely close) upper and/or lower AIMS Levels as an AIMS Box on M5. We call that a ‘Double AIMS Level’. We prefer to trade (and actively seek) Setups with double AIMS Levels, as the breakout of both, on the two timeframes, provides a higher-probability of a successful trade.
The example below shows a live trade that I took using the AIMS Box of M5.
In the above example, M5 to the left shows a sleeping Alligator and a good Setup 1. I timed the short trade on M1, after checking the Three Rules, with the break of the AIMS Box of M5, as the lower AIMS
levels were very close.
Note that lower AIMS Level on M1 was a few pips higher than M5. Since it was too close to the bottom of the M5 AIMS Box, I decided to go for the break of the AIMS Box on M5, to avoid trading into support and possibly seeing down-side rejection. It was a beautiful Setup and turned out to be a very profitable trade. An ‘add-on’ on the Setup 2 (the break of second AIMS Box) would have made it an even more profitable trade. Exit on Blue Dot – see picture below
Sell Setup
Add-On Setup
Sleeping Alligator on M5
Rule 1. Alligator is Sleeping Rule 2. AO at Zero Line (On both Time Frames) Rule 3. Exit was less than 10 pips away.

63 Copyright 2011 © www.iTradeAIMS.com
ANOTHER EXAMPLE OF DOUBLE AIMS LEVELS
The M5 chart above shows two vertical yellow lines: the left-most identifies where a new Fractal formed the upper AIMS Level (shown by the dotted horizontal line) of a new AIMS box; the next yellow line shows where price eventually broke out of the AIMS Box. A horizontal dotted line has
been drawn at the same level on the M1 chart.
As you can see, we clearly have double AIMS Levels: the upper AIMS Levels, on both time frames, are at the same price in this instance. The double AIMS Levels are providing strong resistance, against which price on M1 was held back a number of times - an obvious level to place a pending order above (once the Three Rules have been checked), knowing there is a high probability that when price eventually breaks out, it should do so with some vigour.

64 Copyright 2011 © www.iTradeAIMS.com
TAKING SETUP 1 OR SETUP 2 ON M1, WHEN ALLIGATOR IS SLEEPING ON M5 AND PRICE HAS NOT YET BROKEN OUT OF
AN M5 AIMS BOX • We don’t take Setups on M1 if the M5 AIMS Box is squashed short and the M5 Alligator is
sleeping – price moving sideway in a narrow range, • We would look for Setups on M1 if the M5 AIMS Box is stretched tall – price moving in wide
range.
This would mean taking a Setup on M1 even before a Setup 1 is triggered on M5. Here we attempt to join the start of a trend coming out of sideways market. This could be a potentially dangerous period to trade, perhaps a zone for whipsaws, but if we employ correct money management techniques, any losses should be small whilst the rewards could be great.
SHORT AIMS BOX ON M5 • If the AIMS Box on M5 is short4, with the Alligator sleeping, we trade the breakout of the M5
AIMS Level (if the Three Rules are met). • When the Alligator is sleeping and price stuck in sideways AIMS Boxes on M5, price would
usually turn around at or near the outer most M5 AIMS Box range. • To make an entry on M1 before price breakouts on M5, while the M5 Alligator is sleeping, we
check that there is at least 10 pips room between entry level and the next M5 AIMS Level. By the time price reaches the M5 AIMS Box, we may already be in profit or the risk would have been greatly reduced.
• We need to make sure there is room for movement within the AIMS Box of M5 before taking a Setup on M1. Note that by doing so, we may trade inside the AIMS Box on M5 but our entry is still always on the break of the M1 AIMS Box (subject, of course, to The Three Rules).
The above refers to double AIMS Levels on M1 and M5 (on which is our primary focus) but, of course, there will be double AIMS Levels on other time frames: M5 with 1Hr, for example, or 1Hr with daily. The higher the time frame, the stronger the support and resistance is likely to be and thus the greater importance of a break out of the AIMS Box with shared levels.
4 AIMS Box Short: the definition of ‘short’ very much depends on the currency pair, trading times and relative volatility. During London and New York sessions, an AIMS Box on M5 EUR/USD might be considered short if below 15 pips; during Asian session, it might be less the 10 pips. Use 15 pips as a guideline but consider the other factors.
65 Copyright 2011 © www.iTradeAIMS.com
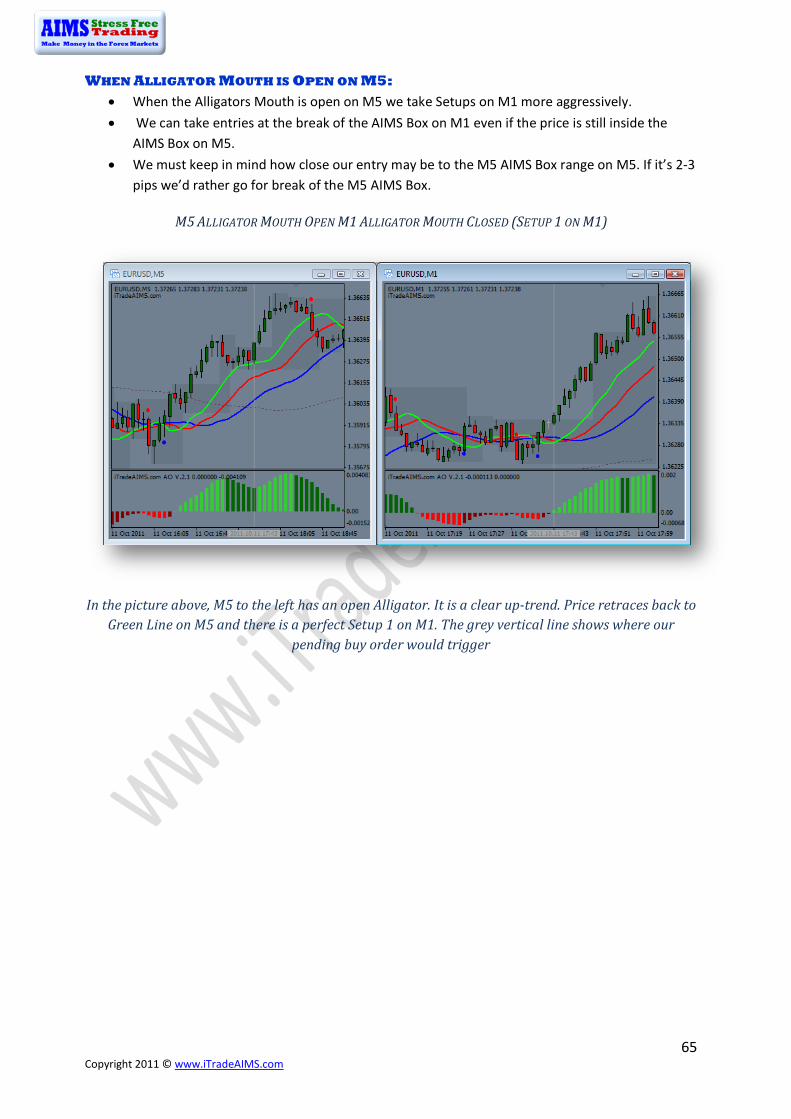
WHEN ALLIGATOR MOUTH IS OPEN ON M5: • When the Alligators Mouth is open on M5 we take Setups on M1 more aggressively. • We can take entries at the break of the AIMS Box on M1 even if the price is still inside the
AIMS Box on M5. • We must keep in mind how close our entry may be to the M5 AIMS Box range on M5. If it’s 2-3
pips we’d rather go for break of the M5 AIMS Box.
M5 ALLIGATOR MOUTH OPEN M1 ALLIGATOR MOUTH CLOSED (SETUP 1 ON M1)
In the picture above, M5 to the left has an open Alligator. It is a clear up-trend. Price retraces back to Green Line on M5 and there is a perfect Setup 1 on M1. The grey vertical line shows where our
pending buy order would trigger

66 Copyright 2011 © www.iTradeAIMS.com
M5: ALLIGATOR MOUTH OPEN M1: ALLIGATOR MOUTH OPEN (SETUP 2 ON M1)
Above: At time of the Red Dot on M5, the Alligator was sleeping, showing that there was no confirmed trend. We waited for a breakout and when it did, the price retraced back to the Green Line. Meanwhile we activated our “predator” mentality. We waited calmly and relaxed for a Setup to be just right on M1. The orange horizontal line marks the lower AIMS Level of M5. Since the lower M1 AIMS Level was too close to the low of the M5 AIMS Level, we went short below 1.3627, the low of the M5 AIMS Box. A lovely trend followed.
Note that at the time we traded Setup 2 on M1, M5 had a Setup 2 at the same level.

67 Copyright 2011 © www.iTradeAIMS.com
STEP BY STEP ANALYSIS OF THE SETUP USING M5 AND M1
PICTURE 1
PICTURE 2

68 Copyright 2011 © www.iTradeAIMS.com
PICTURE 3
PICTURE 4

69 Copyright 2011 © www.iTradeAIMS.com
PICTURE 5
PICTURE 6
Here is another example in my blog

70 Copyright 2011 © www.iTradeAIMS.com
KNOW YOUR EXIT STRATEGY BEFORE TAKING A TRADE
This is the third rule; it is the difference between Successful and Unsuccessful traders
Successful Trading requires cutting losers short and letting winners run
THE DIFFERENCE BETWEEN SUCCESSFUL TRADERS AND LOSING TRADERS • Successful Traders know their exit strategy before they enter the market. • Losers decide their exit strategy soon after they enter the market. • Successful Traders don’t get scared when price goes against them; they follow their exit
plan. • Losers get scared when they see a few pips in profit; they get scared of giving the pips
back and exit prematurely on a small retrace, only to be later regretful when price keeps going in the original direction.
• Successful Traders are relaxed and enjoy the experience; they wait patiently for Entry and Exit signals.
• Losing Traders are stressed, anxious and scared; they do not enjoy the process. • Successful Traders get out of losing trades quickly; they follow their exit plan. • Losers get out of their losing trades far too late; they hope and pray for price to turn
around; they either don’t have a pre-defined stop loss or fail to follow their plan. • Successful Traders let the winners run by following their plan. • Losers cut their winning trades short prematurely; they either do not have an exit plan or
fail to follow one.
POINTS TO REMEMBER
• Time entries on the break of the First AIMS Box outside Alligator’s mouth • The further away price is from the Alligator’s mouth, the more chance of price turning around • The longer the price bars, the greater the chance of price either stalling or turning around • The probability of success is higher at break of 1st and 2nd AIMS Boxes outside the sleeping
Alligator’s mouth • The probability of success is lower at the 3rd or 4th AIMS Boxes outside the Alligator’s mouth • The probability of success is higher when AO Bars are short and close to the Zero Line • The probability of success is lower when AO has peaked and/or diverged. • The probability of success is higher when the entry level is near the Alligator Lines • The probability of success is lower when the price is away from Alligator Lines
71 Copyright 2011 © www.iTradeAIMS.com
WAIT FOR THE SETUP TO SHOW ITSELF
- WAIT FOR SLEEPING ALLIGATOR We look for market to go sideways. We want the market to create a tight range. We look for a short AIMS Box . We wait for the Alligator to sleep.
- BEWARE THE WHIPSAWS We are also aware that during such periods we might experience some false breakouts, some choppy price action and so we are careful.
- BEING CAREFUL We keep our lot size to minimum before the market confirms a trend.
- BEING PROFESSIONAL As professional traders, we know it pays to wait.
- BEING A PREDATOR We assume the role of a predator; we wait patiently for the correct moment when everything sets up just right and pounce on our prey in style.
- FOCUS ON ACTION We do not commit until 100% sure and when the Setup is correct, we focus on action. There is no room for procrastination.
- NO FEAR There are no rewards for scared traders. A trader must learn to master the fear factor; face it rather than avoid it. “We create risk to create profits”.
- STAY IN THE NOW We exercise “The Power of the Now”. Like Mark Douglass says in his book “Trading in the Zone”, “We must make ourselves available in the now”. We must stay in the now and act according to our plan in the current moment. We do not let “the lefty” take over. We do not start thinking about our losing trades of the past neither do we jump in to the future too often. We stay in the now. We listen to the market in the current moment.
- FOCUSED RELAXATION A trader must remain calm and relaxed yet extremely energetic and focused. A trader maintains a calm mind but an active body. Our mind cannot remain in a state of joy and free of anxiety without staying in the now. Anxiety attacks whenever a trader goes into the past or jumps into the future. It is the ability of staying in the now that allows a trader to remain calm, relaxed and joyful.
I suggest reading AIMS Stress Free Trading –The Mind eBook. This book introduces the concept of “Correct State of Mind” for trading. It presents simple techniques on how to be in the correct state of mind; the state where there is no anxiety, fear or procrastination. The book is available to Premium members of the AIMS Forum.
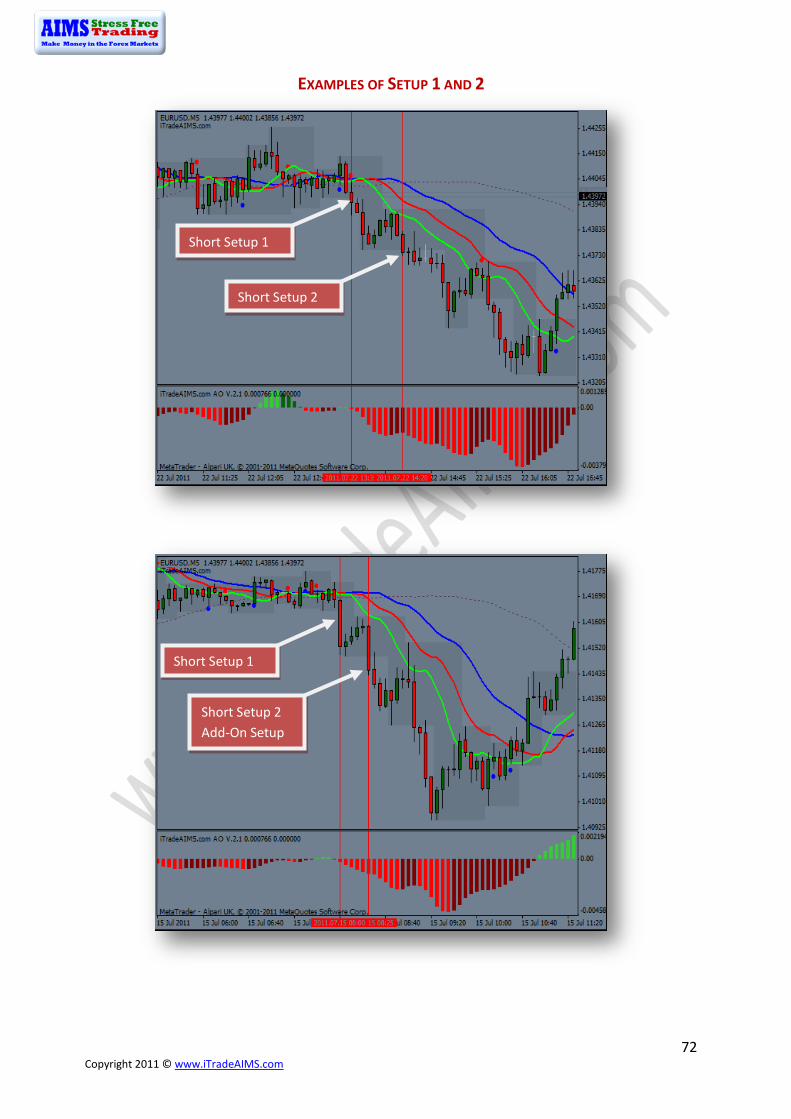
72 Copyright 2011 © www.iTradeAIMS.com
EXAMPLES OF SETUP 1 AND 2
Short Setup 1
Short Setup 2
Short Setup 1
Short Setup 2 Add-On Setup

73 Copyright 2011 © www.iTradeAIMS.com
TRADE ON THE BREAK OF THE AIMS BOX ABOVE OR BELOW THE PURPLE LINE
Incorrect Buy Setup 1
Correct Buy Setup 2
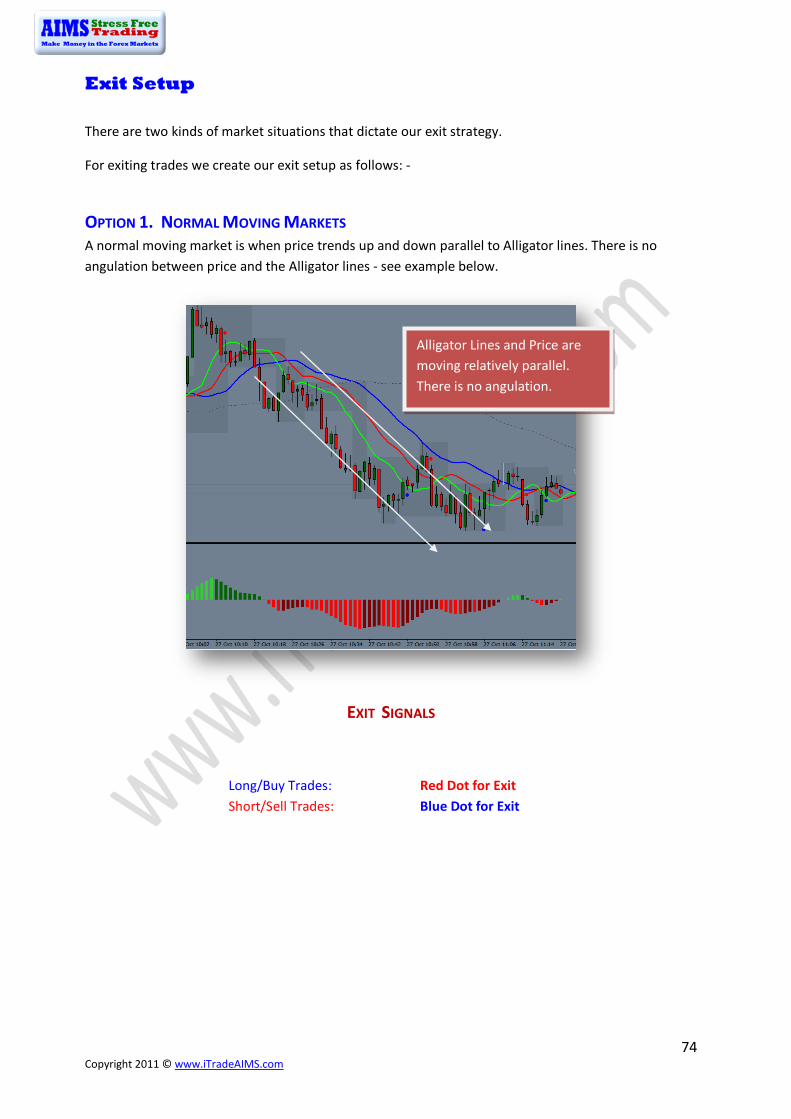
74 Copyright 2011 © www.iTradeAIMS.com
Exit Setup There are two kinds of market situations that dictate our exit strategy.
For exiting trades we create our exit setup as follows: -
OPTION 1. NORMAL MOVING MARKETS A normal moving market is when price trends up and down parallel to Alligator lines. There is no angulation between price and the Alligator lines - see example below.
EXIT SIGNALS
Long/Buy Trades: Red Dot for Exit Short/Sell Trades: Blue Dot for Exit
Alligator Lines and Price are moving relatively parallel. There is no angulation.

75 Copyright 2011 © www.iTradeAIMS.com
OPTION 2. FAST / RUNAWAY MARKETS
When price runs away from the Alligator’s mouth too fast and gets too far away, creating an angulation between Alligator lines and current price, we trail our stop loss behind the high or low at the close of previous candle, to lock in profit. The concept is that the faster price moves away from Alligator Lines, the faster it may come back to it - the rubber band principle applies.
Rules for Trailing Stop Loss:
1. Five consecutive red or green candles that create angulation. 2. Occasionally two or three candles may move considerably. In that case, one can start trailing at
the end of third candle. E.g. when price moves more than 30pips in two candles, start trailing stops at the end of third candle.
See example below.
HOW TO SET TRAILING CANDLES STOP LOSS? Trailing stop loss means moving stops incrementally, using a certain criteria. Once trailing candle stop is activated, keep trailing.
For Long Trades: Set Stop Loss 1 pip below the low of the previous candle.
E.g. at the close of the fifth green candle, set stop loss 1 pip below the low of that candle.
Once five candle trailing is triggered, you must keep moving your stop loss below the low of candle that just closed. Continue moving the stop loss until stopped out.
Price moved too fast too far away from Alligator. There is angulation between price and the Alligator lines.

76 Copyright 2011 © www.iTradeAIMS.com
For Short Trades: Set stop Loss 1pip + spread above the high of the previous candle
AN EXAMPLE OF TRAILING STOP LOSS FOR BUY/LONG TRADES
At the end of 5th consecutive green candle move Stop Loss 1 pip below the low of 5th candle.
Keep Moving 1 pip below the low of candle until stopped out. Stopped Out on this candle.

77 Copyright 2011 © www.iTradeAIMS.com
AN EXAMPLE OF TRAILING STOP LOSS FOR SHORT TRADES
At the end of 5th consecutive red candle move Stop Loss 1 pip + spread above the high of 5th candle.
Keep Moving stop loss at the close of each candle afterwards. Stopped out on the second green candle here

78 Copyright 2011 © www.iTradeAIMS.com
AN EXAMPLE OF TRAILING STOP LOSS EXIT – A SHORT SETUP In the picture below,
1. We have an open Alligator on M5. 2. Price retraces back to the Green Line on M5, creating a lovely Setup 1 on M1. 3. We take the Setup short after the Red Dot and break of the AIMS Box at 1.4231. 4. Price then moved considerably without a retrace. 5. We would have commenced the trailing stop loss - where price retraced a little and resumed. 6. I would have either waited for a Dot or started trailing. 7. Had I started trailing, my stop would have eventually been hit at point 7.1 at 1.4185, or at
1.4168 at point 8. Waiting for Dot would have got me out at 1.4175 at point 7.3. 8. Had I taken the trade just on the M5 chart, it was simple exit on trailing candles, where we
have clear consecutive good size red candles - entry at 1.4222 and exit at 1.4172.
The picture above may be too small to read, so I have split it into two halves on the next page.
Point 2 Point 3
Point 7.3
Point 1 Point 7.1 Point 5
Point 7.2
Point 8

79 Copyright 2011 © www.iTradeAIMS.com
At the end of 5th consecutive red candle move Stop Loss 1 pip + spread above the high of 5th candle. Stopped out here
Point 2
Point 1
Point 8

80 Copyright 2011 © www.iTradeAIMS.com
Point 3
Point 7.3
Point 7.1
Point 5
Point 7.2

81 Copyright 2011 © www.iTradeAIMS.com
AN EXAMPLE OF TRAILING STOP LOSS FOR A SHORT TRADE
1. In the picture below we have a clear down-trend on M5 (left chart). 2. The maroon vertical line on M5, to the left, shows the time where we took the trade on M1 to
the right. 3. M5 AO has peaked once and was then ready for a second go. 4. See how the price bounced against the Blue Line on M5. 5. When we took the short Setup on M1, we were still inside AIMS on M5 but the Lower AIMS
Level of M5 was still more than 10 pips away from entry on M1.
I have split the above picture into two on the next page.
2
3
4
2
5
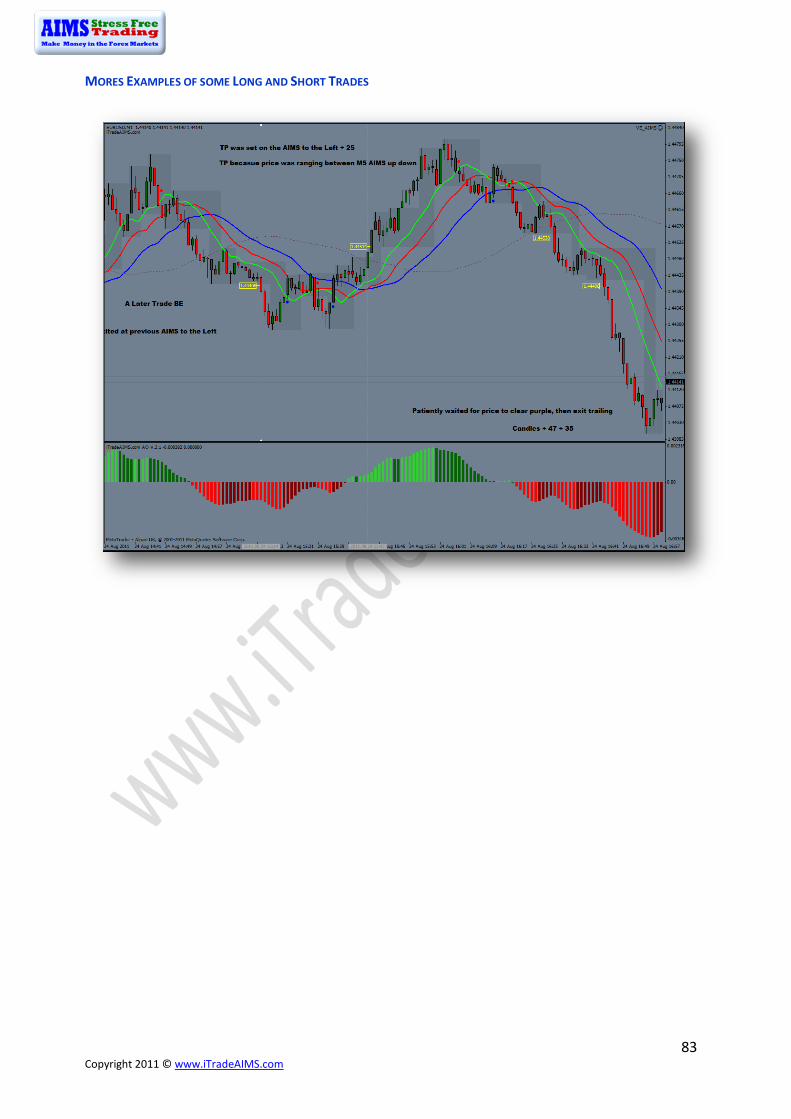
83 Copyright 2011 © www.iTradeAIMS.com
MORES EXAMPLES OF SOME LONG AND SHORT TRADES

85 Copyright 2011 © www.iTradeAIMS.com
Chapter 4: Money Management In Jack Schwager's famous book, "Market Wizards" (1989), day trader and trend follower Larry Hite offers this practical advice: "Never risk more than 1% of total equity on any trade. By only risking 1%, I am indifferent to any individual trade." This is a very good approach. A trader can be wrong 20 times in a row and still have more than 80% of his or her equity left.
The reality is that very few traders have the discipline to practice this method consistently. Not unlike a child who learns not to touch a hot stove only after being burned once or twice, most traders can only absorb the lessons of risk discipline through the harsh experience of monetary loss. Do not trade money that you cannot afford to lose. When novices ask how much money they should begin trading with, one seasoned trader says: "Choose a number that will not materially impact your life if you were to lose it completely. Now subdivide that number by five because your first few attempts at trading will most likely end up in blow out." This is very sage advice and it is well worth following for anyone considering trading Forex. 5
WHY MONEY MANAGEMENT? Had I not already said that “Trading is 80% in the mind”, I would have said here, “Trading is 80% Money Management”. So let me put it this way. Trading is 80% mental and 20% the system. Out of the 20%, trading is 90% money management. Successful trading requires sound, mathematically proven, money management techniques.
Money management must take into consideration both risk and reward, as well as the entire value of the trading account.
Money Management and Risk Percentage per Trade:
I recommend 1% and no more than 2% risk per entry, per Setup. Beginners might consider trading just .25% per Setup.6
HOW TO CALCULATE YOUR POSITION SIZE
We use our beloved indicator, the AIMS Box, for the purpose of calculating position size and managing risk. In doing so, our position size is calculated using market-generated information. We do not set a stop loss simply on a set number of pips. We let the market tell us where to put our stop loss, not the balance of our trading account.
• Using the cross hair tool in MT4, calculate the number of pips difference between the top and bottom of the AIMS Box, then
• Use the number of pips difference to calculate position size, then • Set the stop loss on the other side of the AIMS Box, opposite to the entry Level.
As a Rule of Thumb: Trading EUR/USD on M1, we do not take Setups that require a stop loss of more than 15pips; more than that may be risking too much. Over the last 1500 trades that I have taken, I have managed to 5 http://www.goforex.net/forex-money-management.htm 6This is not financial trading advice; this is only for education

86 Copyright 2011 © www.iTradeAIMS.com
keep my average negative trades to less than 10pips. This could be the secret to consistent account growth that you seek.
In the picture below, there is an example of Setup 1. (Setup 1 is a Setup with Alligator Sleeping).
The Three Rules are met; you identify your exit strategy before you make a trade; you know exactly how much is you risk per trade and you know exactly how many pips make up your positions size. You are NOT setting a stop loss on a meaningless number of pips but rather using market-generated data, i.e. the top and bottom of the AIMS Box and AIMSigator Lines.
FREE FOREX POSTION SIZING CALCULATOR Here are some free and quick resources to calculate your position size.
Here is the information you need to calculate your position size.
1. Stop Loss in Pips – The distance between Entry Level and Stop Loss Level 2. Account Balance 3. Risk Percentage you’re willing to risk for this trade = 1%
Once you know the Stop Loss in Pips, go to the website below.
http://www.forexcalc.com/
Here is another very good resource to do that.
http://www.babypips.com/tools/forex-calculators/positionsize.php
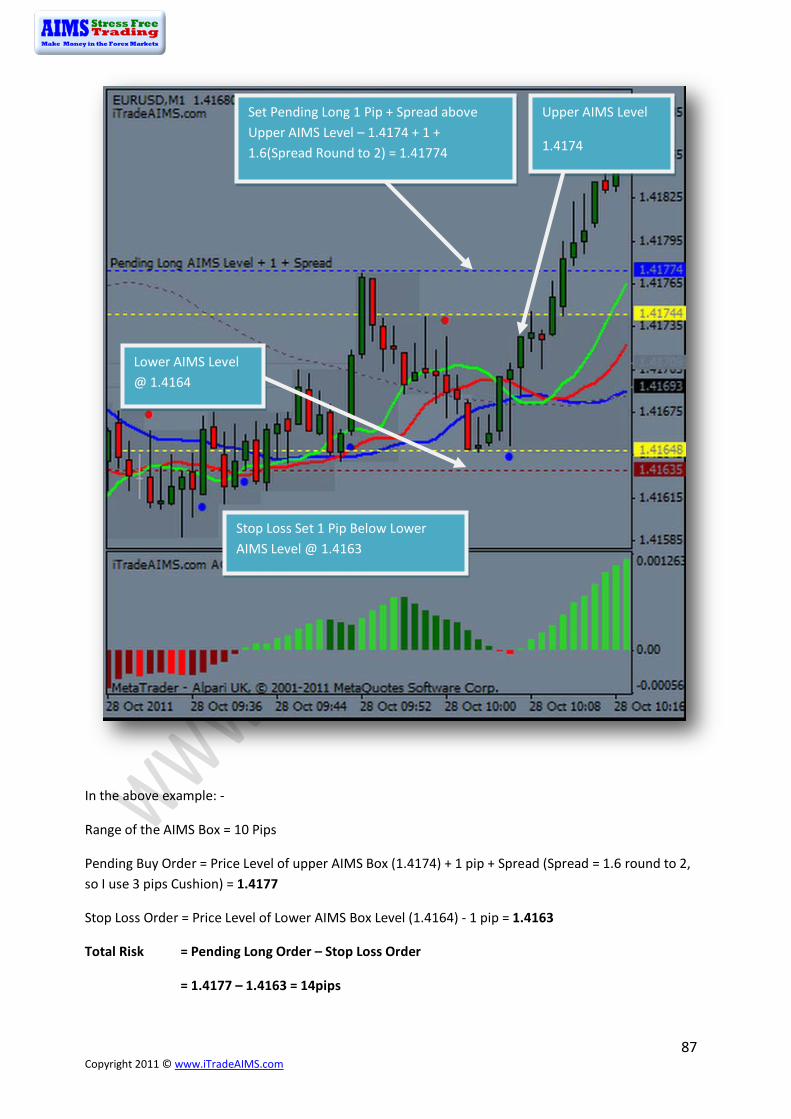
87 Copyright 2011 © www.iTradeAIMS.com
In the above example: -
Range of the AIMS Box = 10 Pips
Pending Buy Order = Price Level of upper AIMS Box (1.4174) + 1 pip + Spread (Spread = 1.6 round to 2, so I use 3 pips Cushion) = 1.4177
Stop Loss Order = Price Level of Lower AIMS Box Level (1.4164) - 1 pip = 1.4163
Total Risk = Pending Long Order – Stop Loss Order
= 1.4177 – 1.4163 = 14pips
Set Pending Long 1 Pip + Spread above Upper AIMS Level – 1.4174 + 1 + 1.6(Spread Round to 2) = 1.41774
Upper AIMS Level
1.4174
Lower AIMS Level @ 1.4164
Stop Loss Set 1 Pip Below Lower AIMS Level @ 1.4163
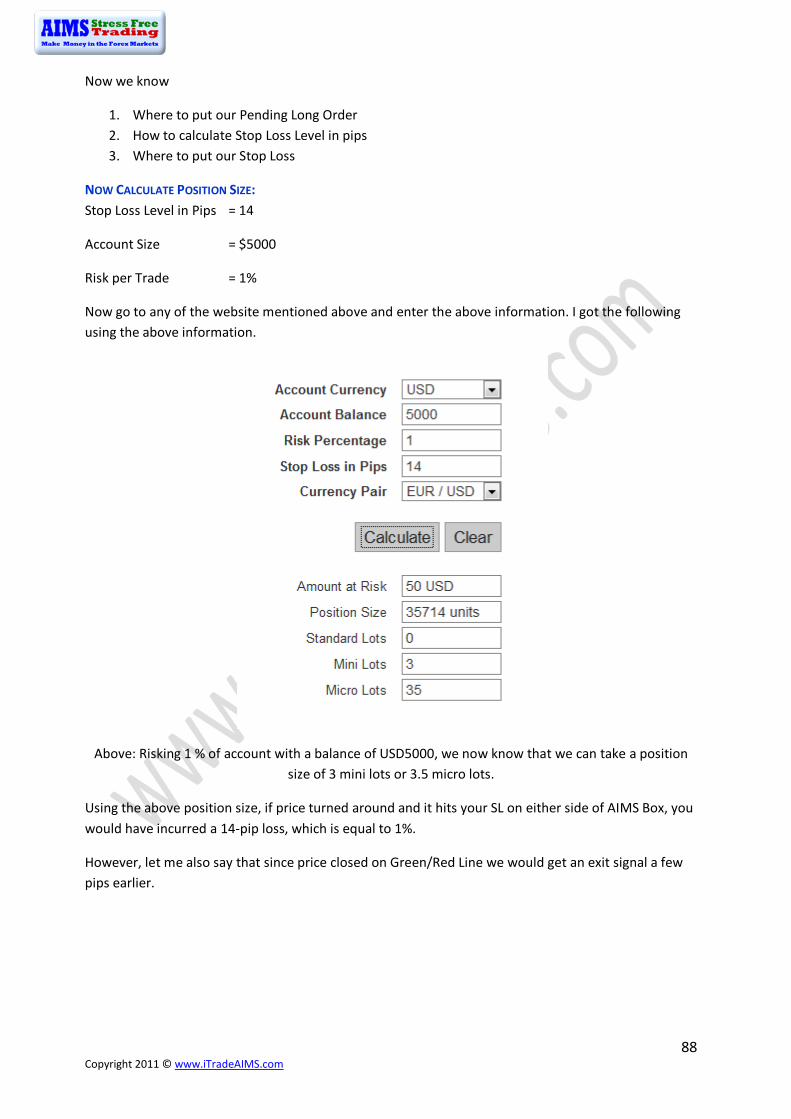
88 Copyright 2011 © www.iTradeAIMS.com
Now we know
1. Where to put our Pending Long Order 2. How to calculate Stop Loss Level in pips 3. Where to put our Stop Loss
NOW CALCULATE POSITION SIZE: Stop Loss Level in Pips = 14
Account Size = $5000
Risk per Trade = 1%
Now go to any of the website mentioned above and enter the above information. I got the following using the above information.
Above: Risking 1 % of account with a balance of USD5000, we now know that we can take a position size of 3 mini lots or 3.5 micro lots.
Using the above position size, if price turned around and it hits your SL on either side of AIMS Box, you would have incurred a 14-pip loss, which is equal to 1%.
However, let me also say that since price closed on Green/Red Line we would get an exit signal a few pips earlier.

89 Copyright 2011 © www.iTradeAIMS.com
THE 15 PIP STOP LOSS RULES As previously mentioned, I am always cautious if my SL has to be more than 15 pips. It depends on the day and the mode of the market but as a rule of thumb, 15 is quite good for M1 EUR/USD under normal conditions.

90 Copyright 2011 © www.iTradeAIMS.com
ROI: The Concept of Adding On
BE VERY CONSERVATIVE WHEN THE MARKET IS RANGE BOUND AND VERY AGGRESSIVE WHEN THE TREND IS CONFIRMED
Adding on is a very important concept. When we hit a trend, we want to get the most out of it. Let’s suppose there is a successful business, e.g. a restaurant. It continues delivering the same service and enjoys good profit taking. They invest more in marketing and other promotional activities to increase demand. As the demand gets higher, they invest more in seating space and kitchen space. Then comes a point where there is no more room in their local market to expand, so they start selling franchises of their brand and ‘success formula’.
The same can be done in trading as well. There is a way to maximize returns from trading the same Setup.
We want to take full advantage of a confirmed trend. Adding on to a trade in a trend is a very good strategy to increase ROI (Return on Investment). This is the way to get more out of the same ‘success formula’. In fact, adding on is the master goal that we want to achieve. It is at this point when a trader really becomes in tune with the market: the state of
“Knowing without Knowing How You Know”
Our Primary Trading Objective:
• Learn to trade the Setup, which includes learning to time entries, applying correct exit strategies and risk management techniques.
• Remain consistently profitable for at least three months.
Our Secondary Trading Objective:
• Maximize ‘Return on Investment’.
GROUND RULE: ADD-ON TO TRENDS NOT THE CHOPS
When the trend is not confirmed: We are very conservative traders
When the trend is confirmed: We are very aggressive traders.
The idea is to remain cautious and conservative as long as the market is moving sideways. As soon as the trend direction is confirmed, we become very aggressive and aim to take full advantage of the trend. The purpose of Setup 1 (sleeping Alligator) is to get us into a breakout trade and minimize losses during choppy price action.
Unfortunately, it is possible to experience many false breakouts before the market eventually starts trending. The key point to remember is that we can never really foresee which way the market will go,

91 Copyright 2011 © www.iTradeAIMS.com
but we always want to be in a trade when price breaks out of a tight range and moves a good distance. Hence we trade all the Setups.
What is being Conservative? Being conservative means trading with good money management. We risk a lower lot size during choppy markets.
What is being Aggressive? Being aggressive means trading bigger lots when the markets are trending. This can be achieved by applying the following money management techniques...
REVERSE PYRAMIDING TECHNIQUE: We risk a minimum lot size when trading Setup 1, e.g. if the market is not showing any trend direction on M5 and M1, we are essentially in a sideways market. We need to be careful whilst still not missing a breakout - for this we make use of the Reverse Pyramiding Technique.
In this technique we trade a bare minimum position size e.g. 0.5% or even 0.25% for our first entry in the market, using Setup 1. If the trade turns into a “rent” payment we lose less. Once the breakout is successful, we use Setup 2, i.e. the breakout of the first or second AIMS Box out of Open Alligator’s mouth. So when the trend proves itself we would risk double or triple the first entry lot size using the next good entry spot. That next good spot is usually the break of the first AIMS Box outside an “open” Alligator’s mouth i.e. Setup 2.
We make a maximum of 5 positions. I suggest the following formula for spreading risk.
Risk %age for Position 1. 0.5%
Risk %age for Position 2. 1.0%
Risk %age for Position 3. 0.75%
Risk %age for Position 4. 0.5%
Risk %age for Position 5. .25%
Total Risk %age = 3.0%
By the time we reach position 3 and 4 we are usually well in profit.
WHAT IS A RENT TRADE? A rent trade is a trade taken off Setup 1 that is supposed to be very low risk. Since we risk less and make more, on such trades, we prefer to call any losses a Rent Trade.
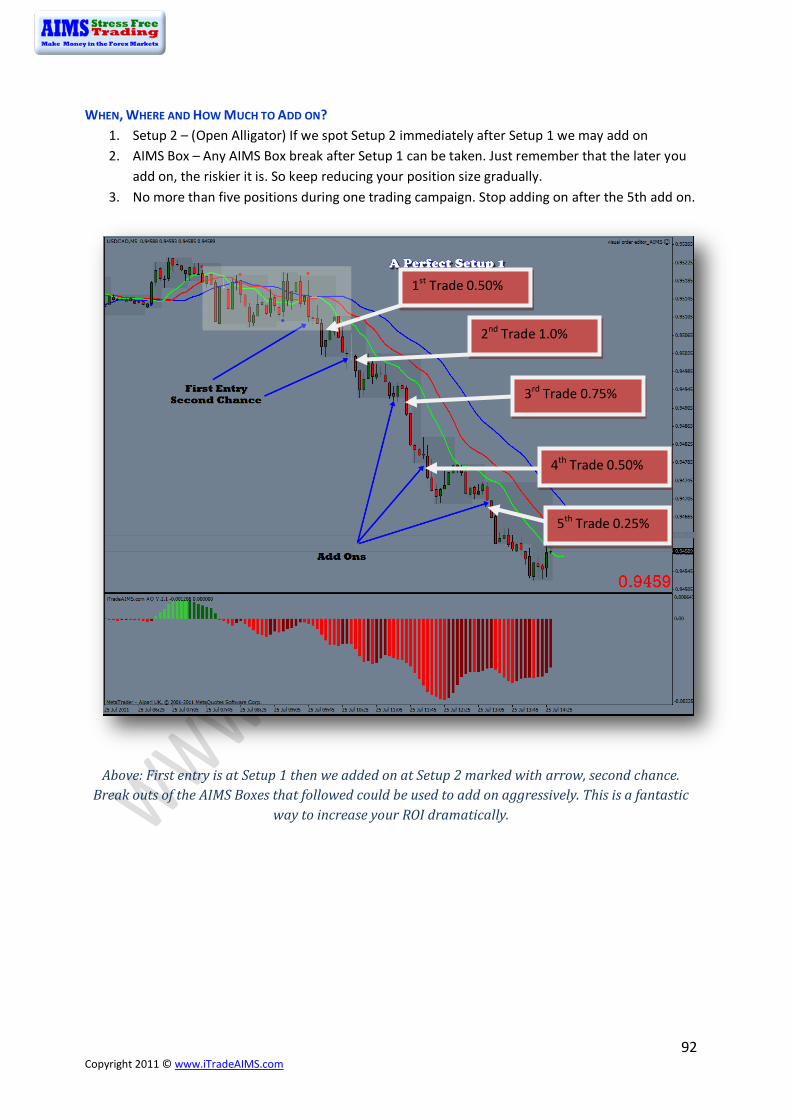
92 Copyright 2011 © www.iTradeAIMS.com
WHEN, WHERE AND HOW MUCH TO ADD ON? 1. Setup 2 – (Open Alligator) If we spot Setup 2 immediately after Setup 1 we may add on 2. AIMS Box – Any AIMS Box break after Setup 1 can be taken. Just remember that the later you
add on, the riskier it is. So keep reducing your position size gradually. 3. No more than five positions during one trading campaign. Stop adding on after the 5th add on.
Above: First entry is at Setup 1 then we added on at Setup 2 marked with arrow, second chance. Break outs of the AIMS Boxes that followed could be used to add on aggressively. This is a fantastic
way to increase your ROI dramatically.
1st Trade 0.50%
2nd Trade 1.0%
3rd Trade 0.75%
4th Trade 0.50%
5th Trade 0.25%

93 Copyright 2011 © www.iTradeAIMS.com
AN EXAMPLE OF A LIVE TRADE
1st Trade 0.50%
2nd Trade 1.0%
3rd Trade 0.75%
Profit Locked by Trailing Stop Loss
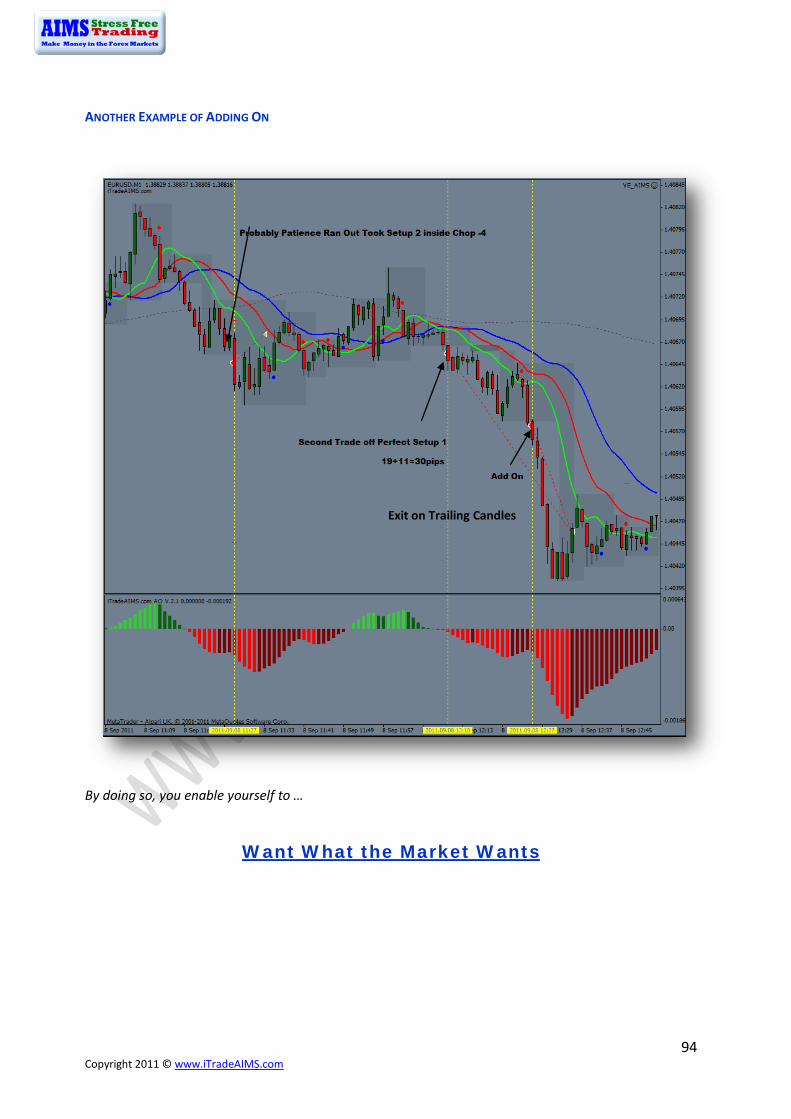
94 Copyright 2011 © www.iTradeAIMS.com
ANOTHER EXAMPLE OF ADDING ON
By doing so, you enable yourself to …
Want What the Market Wants
Exit on Trailing Candles

95 Copyright 2011 © www.iTradeAIMS.com
Glossary of Terms AIMS An Acronym of my family’s First Names.
Derived from Bill Williams Chaos Theory, AIMS provides a holistic approach to profitable trading. It is based on three easy-to-follow rules for trading range-breakouts and trends, underpinned by a positive and calm (stress-free) approach.
AIMS Box Shown as a grey area on the AIMS template, it highlights the range of upper and lower fractals, giving at-a-glance support and resistance levels as well as obvious order entry and stop points. A new AIMS Box is drawn each time a new Fractal is formed.
AIMS Levels The upper and lower levels of the AIMS Box. AIMSigator AIMSigator is the multi-dimensional Alligator. AIMSigator has built in
Alligator with added Purple Line and Grey Line. Alligator is our compass whereas AIMSigator is our Filter.
Alligator Created by Bill Williams, it comprises three off-set smooth moving averages shown as green, red and blue lines – the lips, teeth and jaw. It is intended to help spot trending and range-bound markets.
AO AIMS AO is a 34-period simple moving average, plotted through the middle points of the bars, (H+L)/2, subtracted from the 5-period simple moving average, built across the central points of the bars (H+L)/2. It shows us quite clearly what is happening to the market driving force at the present moment - it shows momentum
Awake (or Open) Alligator
We say the Alligator is awake with its mouth open when the Alligator Lines - Blue, Red and Green lines - have opened to the up or down side.
Balance Line All three of the Alligator lines are Balance Lines (moving averages). When price is close to: - Blue Line, it is said to be at the Balance Line for the current time frame Red Line – Balance Line for the next lower time frame Green Line – Balance Line for one more lower time frame
Blue Line Otherwise known as the Alligator’s Jaw, this is a 13-period smooth moving average at the mid price ((High+Low)/2) offset 8 bars into the future
Bracketing Placing both buy and sell orders either side of the AIMS Levels when the Alligator is asleep
Cross of Zero Line
When AO turns from red to green, or vice versa
Dot - Blue A Blue Dot is printed below the candle when price closes above the Green Line. It highlights a possible buy (long) Setup and, if in a short trade, that the down-trend might be ending and a thus a possible exit signal.
Dot - Red A Red Dot is printed above the candle when price closed below the Green Line. It highlights a possible sell (short) Setup and, in a long trade, that the up-trend might be ending and thus a possible exit signal.
Double AIMS Levels
An AIMS Box on M1 that has the same (or extremely close) upper and/or lower AIMS Levels as an AIMS Box on M5. Trading the breakout the shared levels provides a higher-probability of a successful trade
Down-trend Price making a series of lower lows and lower highs; AIMS Levels stepping down

96 Copyright 2011 © www.iTradeAIMS.com
Elliot Wave Named after Ralph Nelson Elliott (1871-1948) – see http://en.wikipedia.org/wiki/Elliott_Wave_Principle Rather than using Elliot Wave on price, AIMS uses it on the AO histogram. “We don’t trade Elliot Wave, we use it to give us confidence”
Fractal A fractal has been defined as "a rough or fragmented geometric shape that can be split into parts, each of which is (at least approximately) a smaller copy of the whole, a property called self-similarity. In a trading chart, as defined by Bill Williams, a Fractal consists of at least five bars. In an Up-fractal, a high will be preceded and followed by at least two lower highs. In a Down-fractal, a low will be preceded and followed by at least two higher lows.
Green Line Otherwise known as the Alligator’s Lips, this is a 5-period smooth moving average at the mid price ((High+Low)/2) offset 3 bars into the future
Grey Line The Purple Line of 5 times higher time frame. On M1, for example, it is the Purple Line of M5
M1, M5, H1, H4
Refers to the time frames of a currency pair: M1 – 1 minute chart; M5 – 5 minute chart; H1 – hourly chart; H4 – 4-hour chart
Purple Line A derivative of the Red Line of 5 times higher time frame. On M1, for example, it is the Red Line of M5.
Red Line Otherwise known as the Alligator’s Teeth, this is an 8-period smooth moving average at the mid price ((High+Low)/2) offset 5 bars into the future
Sleeping Alligator
The Alligator is considered asleep when the Blue, Red and Green Lines are intertwined and horizontal. The longer the Alligator sleeps, the hungrier it will be when it wakes up – that is, when price stays in a range for a long time, expect big moves when it eventually breaks out.
Setup The point where price combined with Alligator, AIMS Levels, AO Levels or other significant factors, gives an entry or exit signal. A Setup in this eBook is generally a trade-entry signal, unless otherwise specified.
Setup 1 Trading the breakout of the AIMS Box in which the Alligator Lines are intertwined; trading out of congestion
Setup 2 Trading the breakout of the first or second AIMS Box out of the open Alligator’s mouth; trading the trend
Stop and Reverse
Similar to bracketing – basically the first trade is stopped out (or just closed) and a trade in the opposite direction is taken straight away.
The Three Rules
Rule 1 Alligator Sleeping or Awake? Rule 2 AIMS AO Bars Close to the Zero Line? Rule 3 Entry Level not too far from the Stop Loss Level?
Up-trend Price making a series of higher highs and higher lows; AIMS Levels stepping up
Wave A movement of price - up or down. There are two types of Waves: Impulse (or Motive) Wave which is a strong move in price coinciding with the main direction of the underlying trend; Corrective Wave, which is a move in price against the prevailing trend – a pullback/dip/rally
Zero Line Where the value of AO is zero – the point of equilibrium or balance point.