Embed Size (px)
Citation preview
Copyright 2010, The World Bank Group. All Rights Reserved.
Part 1
Sample Design
Produced in Collaboration between World Bank Institute and the Development Data Group (DECDG)
Copyright 2010, The World Bank Group. All Rights Reserved.
Sampling and Total Survey Error
• Impractical to survey entire populations• Samples are drawn, data collected, and estimates are made
that won’t equal true population values• Sampling Error is error arising solely from the sampling process
(measure: variance)• Surveys are also subject to biases from nonsampling errors
such as nonresponse

Copyright 2010, The World Bank Group. All Rights Reserved.
Key Sample Design Issues
Probability based to allow valid analysis– Unbiased estimates (nearly) with 100% response – Ability to measure variance
Frame that covers target population well– Ability to identify and access chosen units
Analytic needs (What estimates are needed?)– How good do variances have to be?
Geographic or other stratification
Copyright 2010, The World Bank Group. All Rights Reserved.
Household Frame
Worldwide, labor force surveys use samples of households (HHs) or housing units
• Target population of adults that may be in the labor force• Difficult to sample persons directly• But fairly easy to sample households
– Some countries have HH lists– Areas frames used when no list
Copyright 2010, The World Bank Group. All Rights Reserved.
Area Frames
An ideal frame for a household survey:• Is 100% Complete (includes all HHs)• Has 0% destroyed/empty HHs• Has 0% units that are not HHs at all• Has 0% chance of duplicating a HH• Has 100% ability to locate a sampled HH
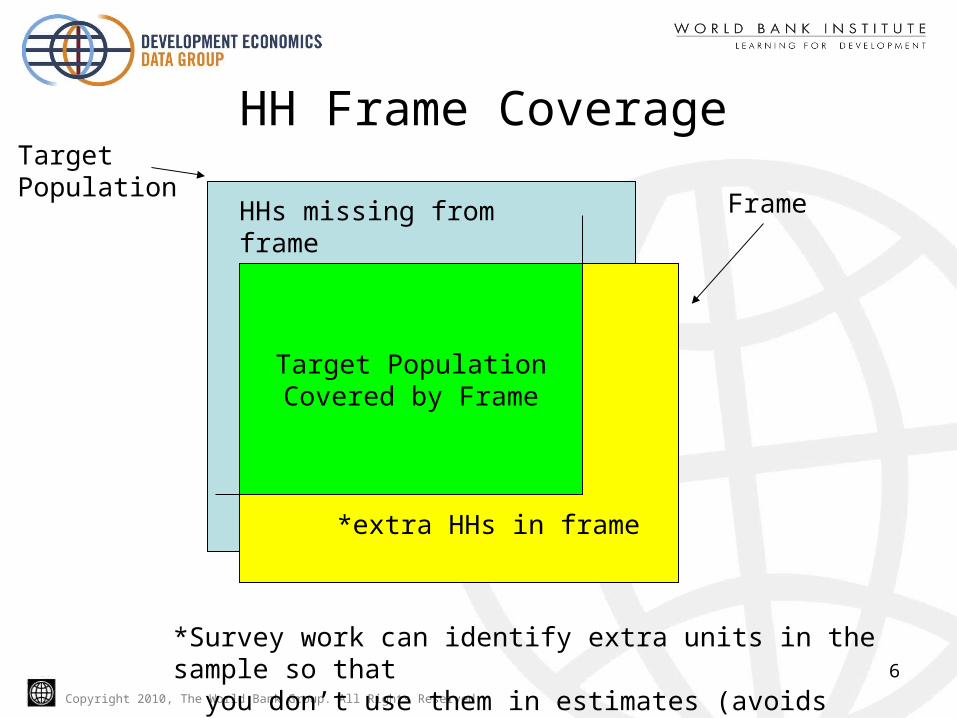
Area Frames are very good in this regard and are widely used (see diagram)
Copyright 2010, The World Bank Group. All Rights Reserved.
6
HHs missing from frame(Undercoverage)
TargetPopulation
*extra HHs in frame
Frame
*Survey work can identify extra units in the sample so that you don’t use them in estimates (avoids overcoverage).
HH Frame Coverage
Target PopulationCovered by Frame
Copyright 2010, The World Bank Group. All Rights Reserved.
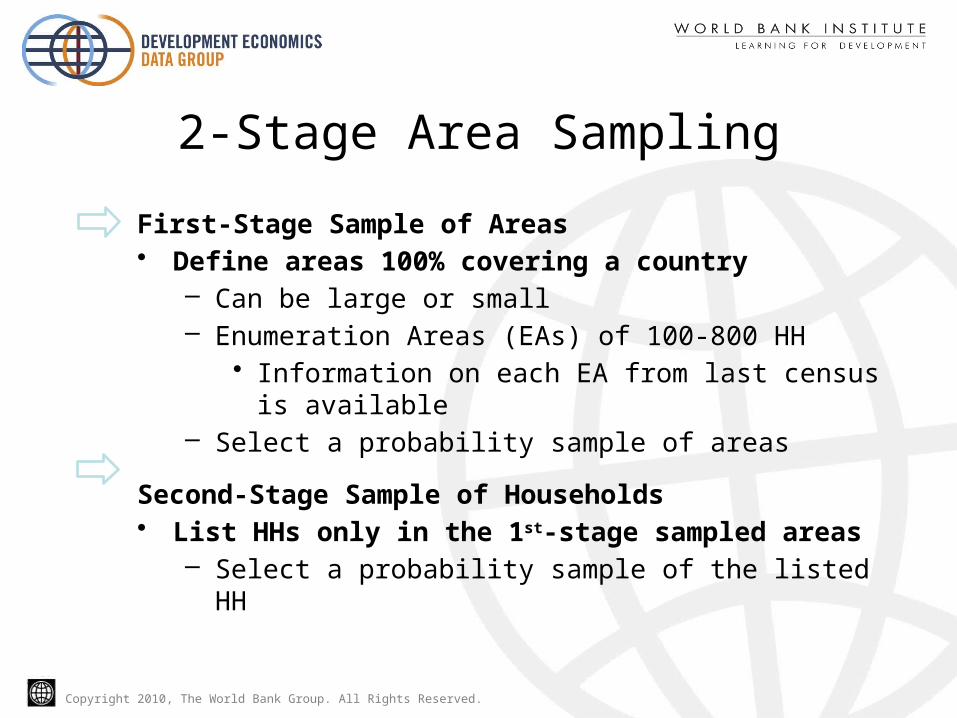
2-Stage Area Sampling
First-Stage Sample of Areas• Define areas 100% covering a country
– Can be large or small– Enumeration Areas (EAs) of 100-800 HH
• Information on each EA from last census is available– Select a probability sample of areas
Second-Stage Sample of Households• List HHs only in the 1st-stage sampled areas
– Select a probability sample of the listed HH
Copyright 2010, The World Bank Group. All Rights Reserved.
Why 2-Stage Area Sampling?
Area frames are typically used if:
• No list of households or housing units• OR there may be a list that is not up-to-date (misses new
construction)• 1st-stage geographic units that contain the households are
readily available (such as enumeration areas)
Copyright 2010, The World Bank Group. All Rights Reserved.
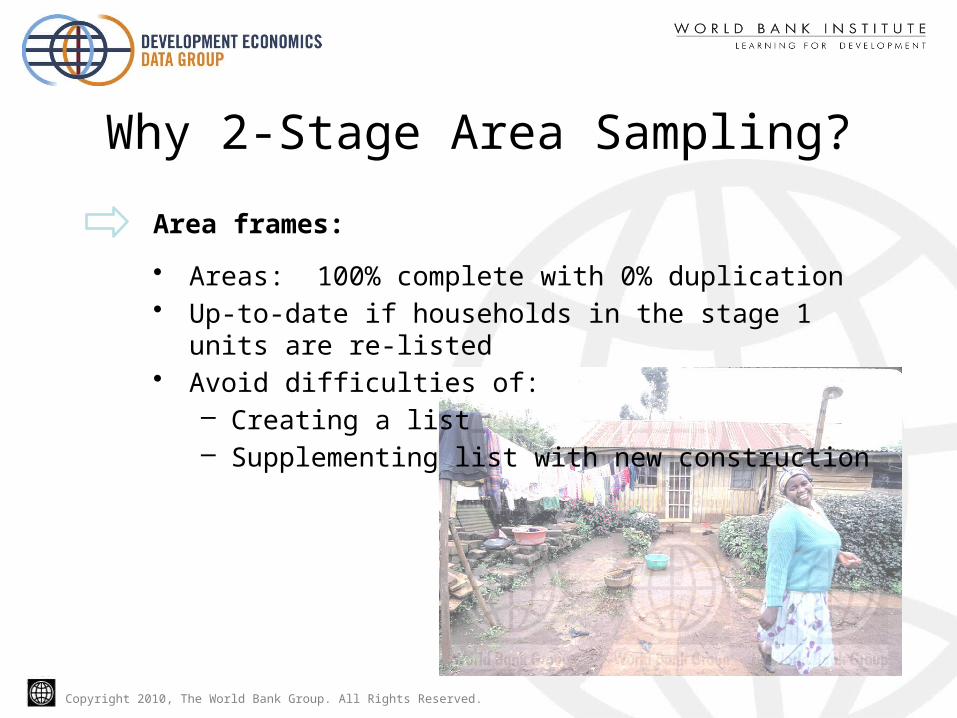
Why 2-Stage Area Sampling?
Area frames:
• Areas: 100% complete with 0% duplication• Up-to-date if households in the stage 1 units are re-listed• Avoid difficulties of:
– Creating a list– Supplementing list with new construction

Copyright 2010, The World Bank Group. All Rights Reserved.
List Households or Housing Units?
• After listing HHs, time is needed to sample the households to be surveyed
• Interviewers return to the field after the 2nd-stage sampling operation is completed
• It is necessary that the interviewer be given enough information to re-locate a sampled household

Copyright 2010, The World Bank Group. All Rights Reserved.
List Households or Housing Units?
Housing Unit (HU) is a physical address– List by observation– Find later from an address (number & street)
HHs often listed in more rural countries– Atypical HUs, and problems finding HUs– More intense HH listing, obtain head of household– Defined using family ties & living arrangements– Locate later by head of household
Copyright 2010, The World Bank Group. All Rights Reserved.
Use of Households (HHs)
HUs can be difficult to identify in some areas and many addresses difficult to locate if they are sampled.• Villages? • Farms? • Cities? • Towns?
HHs identified by head of household can readily be found after sampling.• Up-to-date if sampling and surveying occur shortly after the listing operation.
12
Copyright 2010, The World Bank Group. All Rights Reserved.
A Typical 2-Stage Design
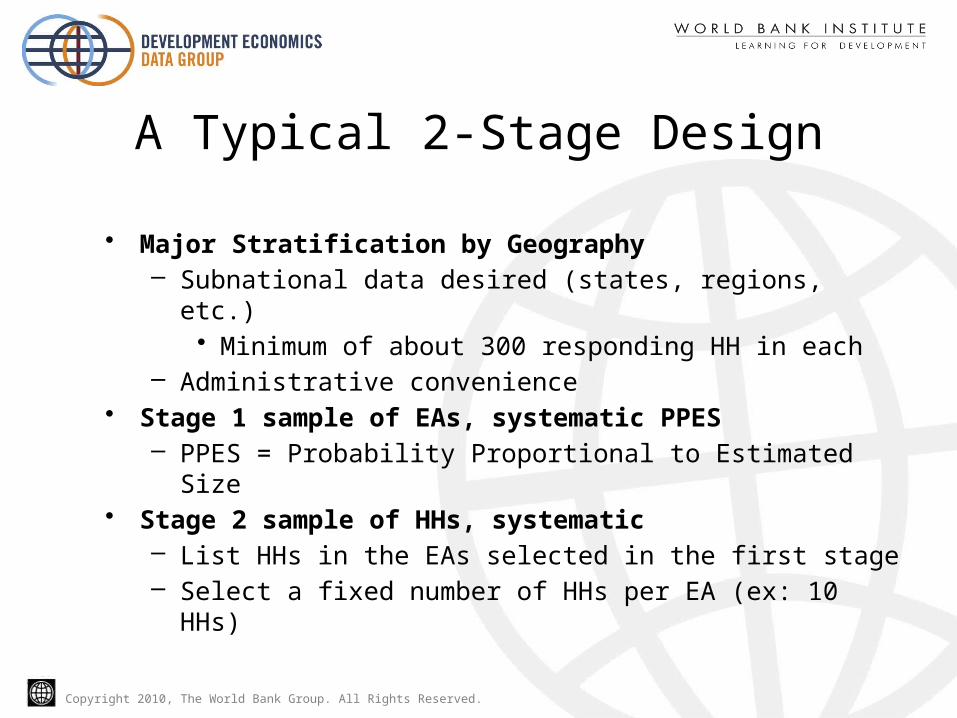
• Major Stratification by Geography– Subnational data desired (states, regions, etc.)
• Minimum of about 300 responding HH in each– Administrative convenience
• Stage 1 sample of EAs, systematic PPES – PPES = Probability Proportional to Estimated Size
• Stage 2 sample of HHs, systematic– List HHs in the EAs selected in the first stage– Select a fixed number of HHs per EA (ex: 10 HHs)
Copyright 2010, The World Bank Group. All Rights Reserved.
Why sample EAs PPES?
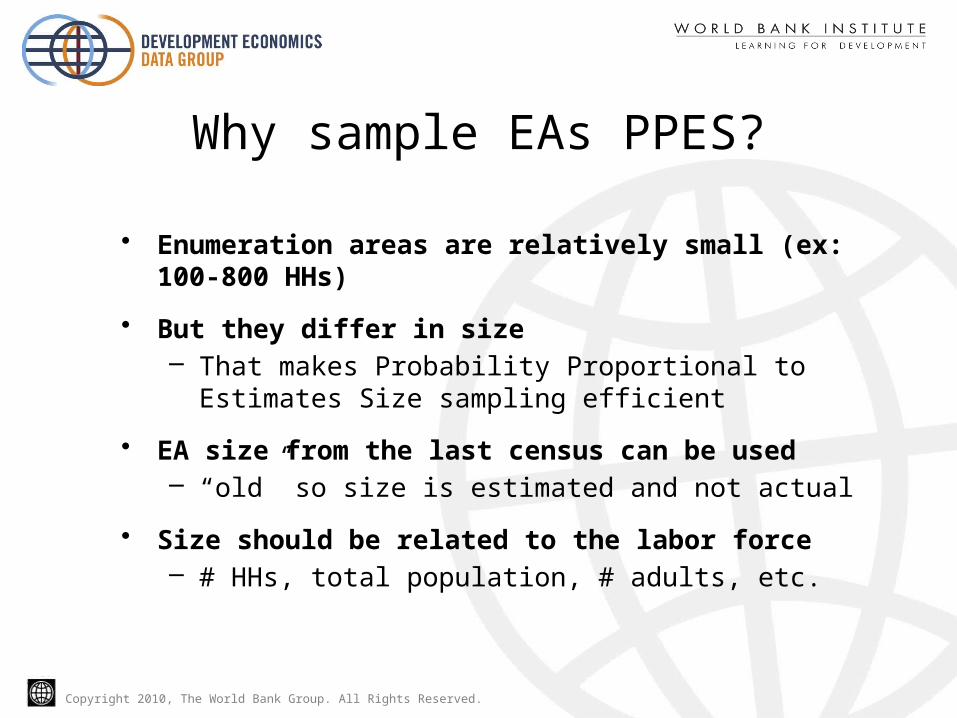
• Enumeration areas are relatively small (ex: 100-800 HHs)
• But they differ in size– That makes Probability Proportional to Estimates Size
sampling efficient
• EA size from the last census can be used– “old” so size is estimated and not actual
• Size should be related to the labor force – # HHs, total population, # adults, etc.

Copyright 2010, The World Bank Group. All Rights Reserved.
Example: Sampling EAs PPES
• Small geographic area of a country with only 7 EAs and 2,000 estimated HHs sample 2
• Introduce concept of Sampling Interval (SI)– In this example SI = 1,000 = 2,000/2
• the total # estimated HHs divided by the # sample Eas
• Random number (rn) determines selections – rn is between 0 and 1 (ex .423)– 1st selection compute: SI * rn = 1,000 * .423 = 423– 2nd selection compute SI * rn + SI = 423+1,000 = 1,423

Copyright 2010, The World Bank Group. All Rights Reserved.
Example: Sampling EAs PPES
EA HHest CumHH choose 2 EAs marked by *EA1 350 350 EA2 200 550* The first EA with CumHHEA3 400 950 greater than 423 is EA2EA4 250 1200 EA5 300 1500* The first EA with CumHHEA6 350 1850 greater than 1,423 is EA5 EA7 150 2000
16

Copyright 2010, The World Bank Group. All Rights Reserved.
Example: Sampling EAs PPES
• HHest is the estimated size of each EA– The # HH from the last census
• CumHH column cumulates Hhest
• 2 EAs selected are the ones that first exceed the calculated numbers 423 and 1,423– 1st selection: EA2 CumHH of 550 exceeds 423– 2nd selection: EA5 CumHH of 1,500 exceeds 1,423

Copyright 2010, The World Bank Group. All Rights Reserved.
Example: EA Probabilities
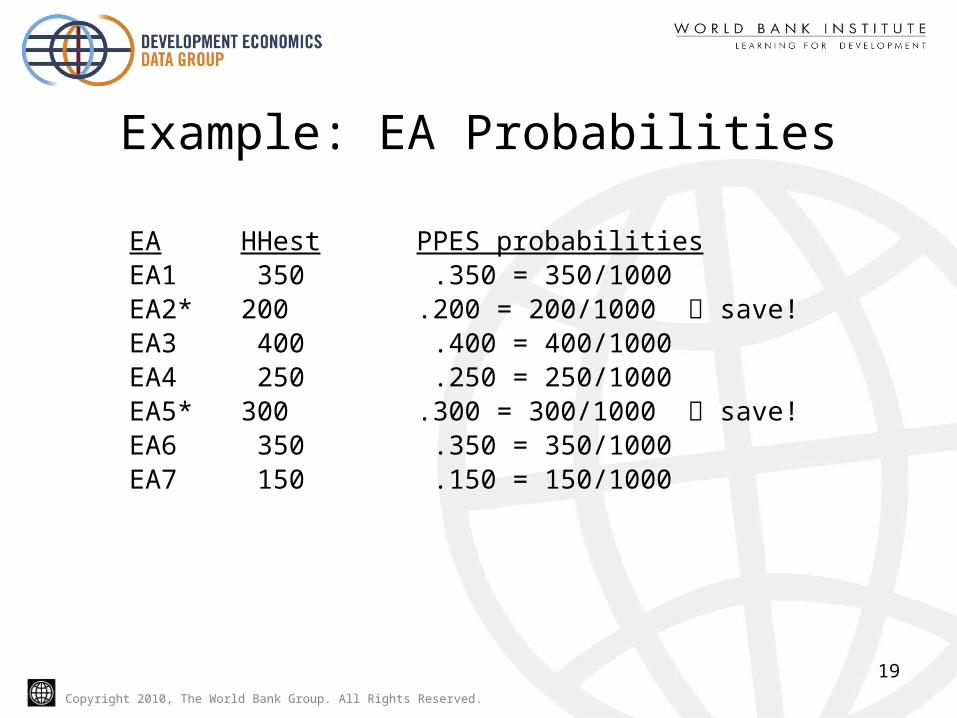
• EA Probability of selection: HHest/SI
• The EA sizes are estimated – but the probabilities are valid– probabilities sum to 2, the sample size– As actual EA sizes become known for the sampled EAs, DO
NOT change the probabilities
• Save the probabilities of sampled EAs
Copyright 2010, The World Bank Group. All Rights Reserved.
Example: EA Probabilities
EA HHest PPES probabilities EA1 350 .350 = 350/1000EA2* 200 .200 = 200/1000 save!EA3 400 .400 = 400/1000EA4 250 .250 = 250/1000 EA5* 300 .300 = 300/1000 save!EA6 350 .350 = 350/1000EA7 150 .150 = 150/1000
19
Copyright 2010, The World Bank Group. All Rights Reserved.
Example: EA Weights
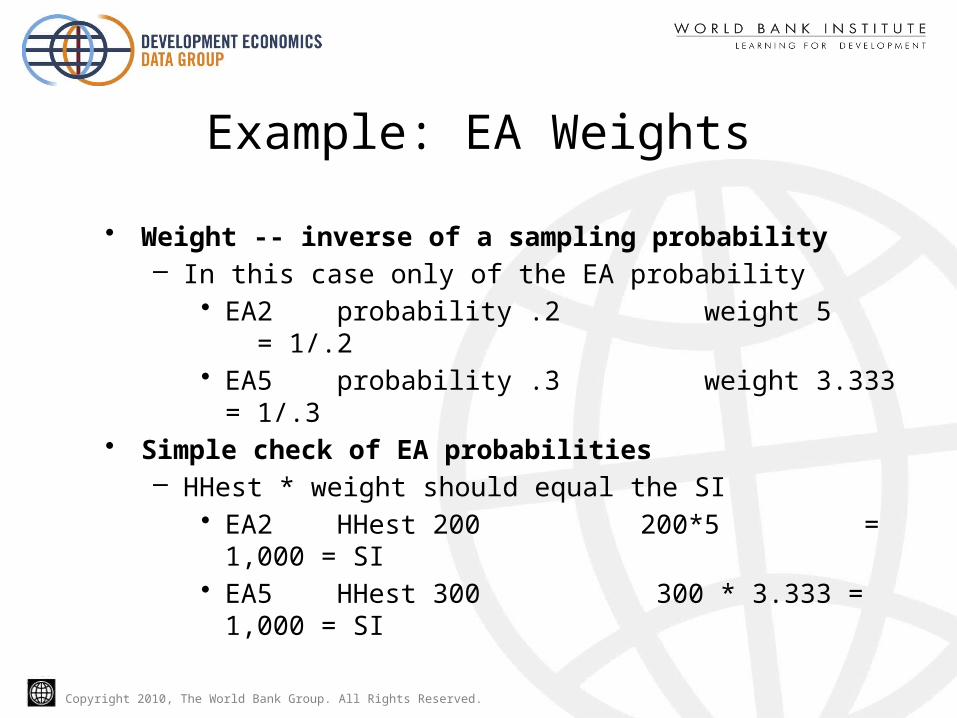
• Weight -- inverse of a sampling probability– In this case only of the EA probability
• EA2 probability .2 weight 5 = 1/.2• EA5 probability .3 weight 3.333 = 1/.3
• Simple check of EA probabilities – HHest * weight should equal the SI
• EA2 HHest 200 200*5 = 1,000 = SI• EA5 HHest 300 300 * 3.333 = 1,000 = SI
Copyright 2010, The World Bank Group. All Rights Reserved.
Example: List & Sample HHs
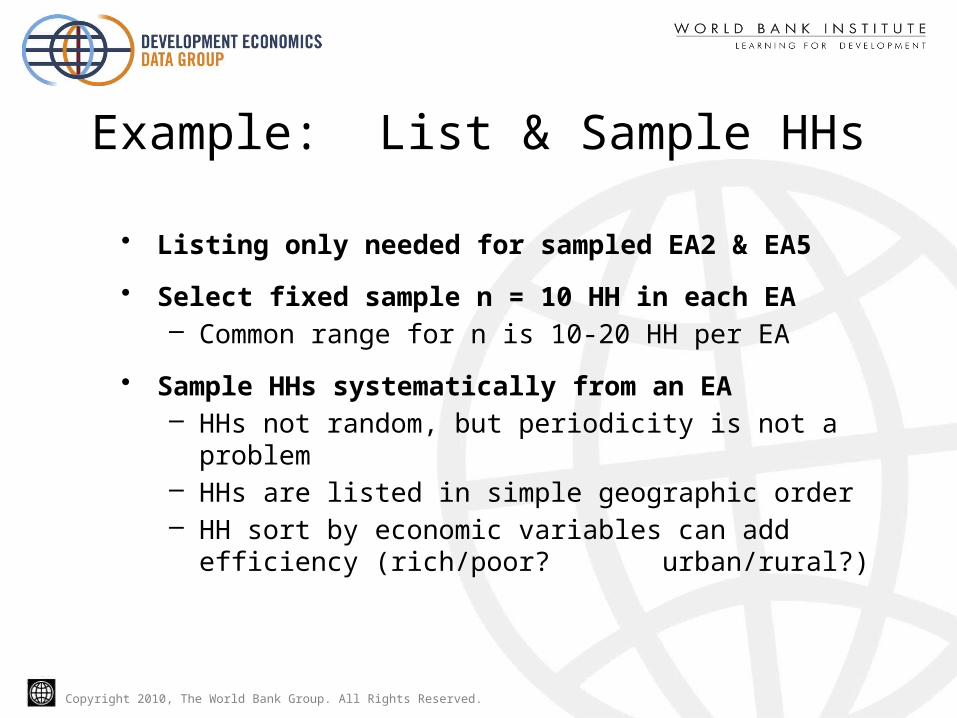
• Listing only needed for sampled EA2 & EA5
• Select fixed sample n = 10 HH in each EA– Common range for n is 10-20 HH per EA
• Sample HHs systematically from an EA– HHs not random, but periodicity is not a problem– HHs are listed in simple geographic order– HH sort by economic variables can add efficiency
(rich/poor? urban/rural?)
Copyright 2010, The World Bank Group. All Rights Reserved.
Example: Sample HH from EAs
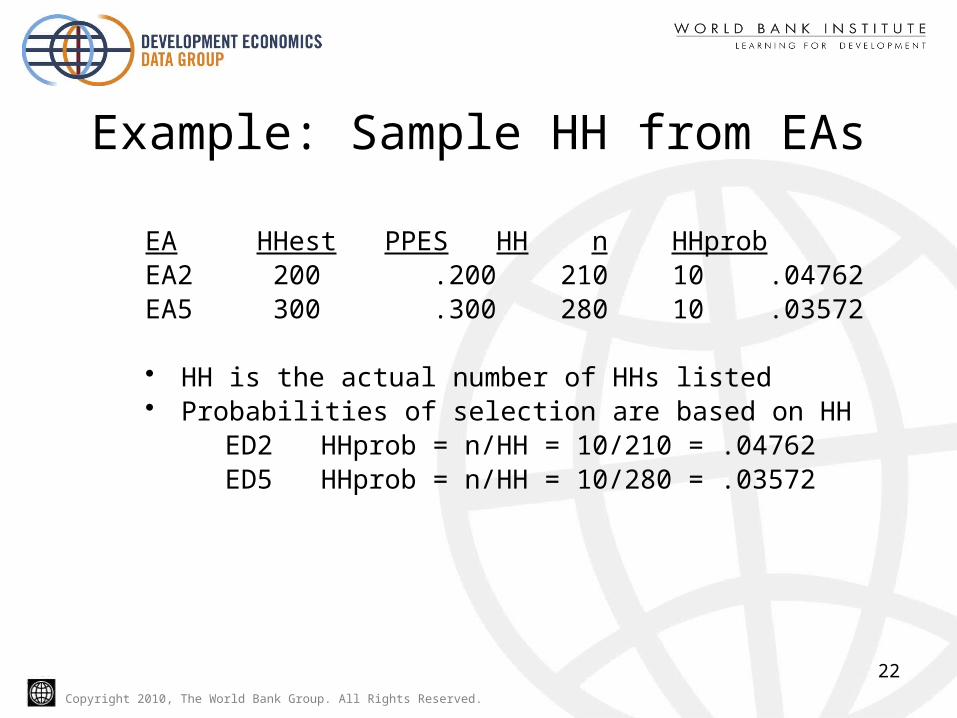
EA HHest PPES HH n HHprobEA2 200 .200 210 10 .04762 EA5 300 .300 280 10 .03572
• HH is the actual number of HHs listed• Probabilities of selection are based on HH ED2 HHprob = n/HH = 10/210 = .04762 ED5 HHprob = n/HH = 10/280 = .03572
22

Copyright 2010, The World Bank Group. All Rights Reserved.
Example: Sample HH from EA2
• Calculate a sampling interval (SI) for EA2– SI = HH/n = 210/10 = 21– Choose a random start from 1-21, ex: rs = 12
• The HHs are listed 1, 2, 3, 4, 5, …, 210
• Choose rs, rs+SI, rs+2SI, rs+3SI, …, rs+9SI
12th 33rd 54th 75th 96th
117th 138th 159th 180th 201st
Copyright 2010, The World Bank Group. All Rights Reserved.
Example: Sample HH from EA5
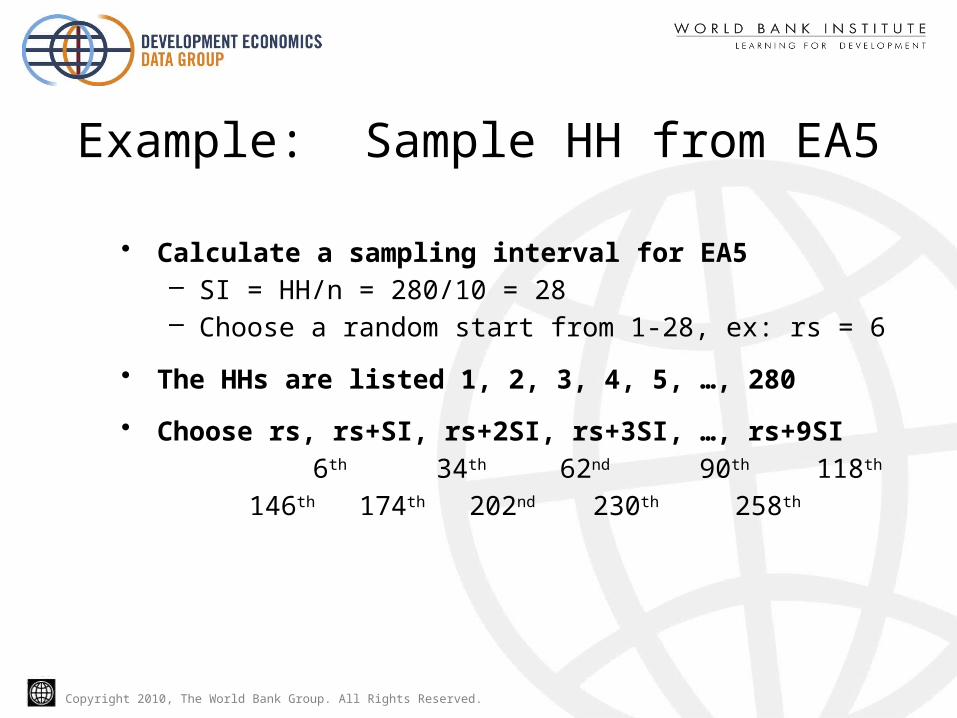
• Calculate a sampling interval for EA5– SI = HH/n = 280/10 = 28– Choose a random start from 1-28, ex: rs = 6
• The HHs are listed 1, 2, 3, 4, 5, …, 280
• Choose rs, rs+SI, rs+2SI, rs+3SI, …, rs+9SI
6th 34th 62nd 90th 118th
146th 174th 202nd 230th 258th

Copyright 2010, The World Bank Group. All Rights Reserved.
Example: Total 2-Stage Probability
• Multiply the probabilities from each stage EA HHest PPES HH n HHprob EA2 200 .200 210 10 .04762 EA5 300 .300 280 10 .03571
• Multiply the probabilities PPES * HHprob and the inverse is the weight
for EA2 .200.04762 = .009524 weight 105 for EA5 .300.03571 = .010714 weight 93.333
25

Copyright 2010, The World Bank Group. All Rights Reserved.
Self Weighting Samples
• Probabilities and weights in the example are different for EA2 and EA5
• Can modify HH sampling to make the probabilities and weights equal (almost)
• Samples where all weights are equal (or all weights in a stratum) are called self-weighting samples.
• Small gains in efficiency

Copyright 2010, The World Bank Group. All Rights Reserved.
Contribute!
• That was not too difficult, was it? • Start a VSS discussion on sampling!
Visit www.virtualstatisticalsystem.org
27