Embed Size (px)
Citation preview

Copyright 2010, The World Bank Group. All Rights Reserved.
Basic principles
Part 1
Geographic Information Systems
Produced in Collaboration between World Bank Institute and the Development Data Group (DECDG)

Copyright 2010, The World Bank Group. All Rights Reserved.
Module Objectives
Modules designed for non-GIS practitioners and Managers
National Statistics Organizations or working in Agriculture or Health
Geographic Information Systems, its principles, components, uses and successful implementation imperatives
Non-technical reference – does not detail high level technical issues
Focus on providing non-technical individuals with:Base knowledge to understand the core principles of -
Geographic Information Systems (GIS)The Global Positioning System (GPS)Remote SensingIntegration and Implementation Issues
Copyright 2010, The World Bank Group. All Rights Reserved.
The History of GIS - Introduction
To understand GIS one needs to understand its history
The history of GIS spans four decades
It springs from many origins and mingles many disciplines
GIS is many things to many people
Evolved fromMainframe computers toMini computers toPersonal computers toDistributed computing and Visualisation tools operating via the Internet
Has gained increasing general awareness and acceptance

Copyright 2010, The World Bank Group. All Rights Reserved.
The History of GIS - Introduction
The awareness of the importance of and need for spatial information increased
The integration of mathematical and statistical models with modern computing aand mapping techniques initially drove GIS
The prominence of spatial information is a direct result of the computer and information age
The history of GIS can be divided into four phases: (adapted from Berry)Computerized Mapping: The early yearsSpatial Data Management – The idealistic teenagerMap Analysis and Modeling – The maturity of GISMultimedia Mapping and Visualization – The rise of Neogeography
Copyright 2010, The World Bank Group. All Rights Reserved.
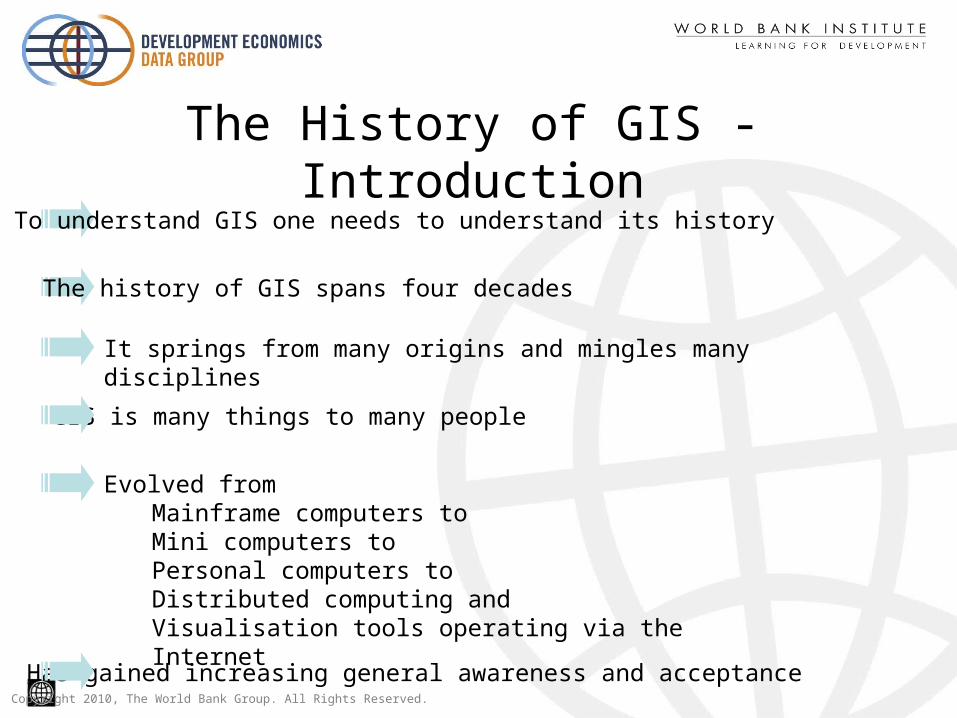
The History of GIS – Computerized Mapping
Mid 1960s to 1970s
The focus was on the automation of map creation and map theme overlays
Development limited to expensive and cumbersome computer mainframe systems – universities and government departments
Development was driven mostly by individuals with little collective effort
Pioneering work was done which established many of the underlying modern GIS concepts and procedures

Copyright 2010, The World Bank Group. All Rights Reserved.
The History of GIS – Spatial Data Management
The 1980s
Exploitation of the change in data formats and computer environment
The development of spatial data management systems was pioneered
Enabling spatial information to be queried using traditional database methods
Focus on data availability, accuracy and standards – market growth for digital map products and vendor software
Linking data about a feature from a database to a map

Copyright 2010, The World Bank Group. All Rights Reserved.
The History of GIS – Map Analysis and Modeling
The 1990s
Realisation that information is a key driver for development
From where is what?...to spatial interrelationships and WHY?
Comprehensive theory of map analysis – spatial statistics and spatial analysis – applying traditional statistical and mathematical operations from different subject matter fields to GIS
Analysing statistical data within the spatial component
Allowed the GIS community to create new operations unique to GIS – Optimal path routingVisual exposure density Intelligent thematic mappingGeodemographic neighbourhood and trade area analysis

Copyright 2010, The World Bank Group. All Rights Reserved.
The History of GIS – Multimedia mapping and Visualization
The Naughties
A broad adoption of geotechnology in our everyday lives – Geography now matters to everyone
Geotechnology is one of the three major mega technologies of the 21st centuryComplex vendor based GIS giving way to web services and customised application solutions
Web based spatial visualization tools and the integration of GPS and remotely sensed imagery allows non-geographically inclined persons to create customised maps and views
The age of the neogeographer has arrived - someone who uses geotechnology for personal or even business use but does not have a background in geography – GIS has come full circle

Copyright 2010, The World Bank Group. All Rights Reserved.
Defining GIS
Traditional definition: A collection of hardware and software to – CreateStoreAnalyseDisseminate spatial data and its related attribute information
Operates on many levels of increasing complexity
Common database operations and statistical analysis is integrated with visualisation benefits of digital maps
Every object present on the Earth can be georeferenced and its related attribute information can be linked through a database

Copyright 2010, The World Bank Group. All Rights Reserved.
The acronym, G I S
The constant evolution of GIS means the acronym is also evolving
G I – refers to Geographic or Geospatial information
3 Distinct technologies comprising Geographic Information Technology:Global Positioning Systems (GPS)Remote Sensing Imagery (RS)Geographic Information Systems (GIS)
S – can mean any of the following:Systems – the technology for the acquisition and management of spatial informationScience – comprehending the underlying conceptual issues of representing data and processes in space-timethe theory and concepts behind the technologyStudies – understanding the social, legal and ethical issues associated with the application of GIS
Copyright 2010, The World Bank Group. All Rights Reserved.
Briggs’s Revised Definition of GIS
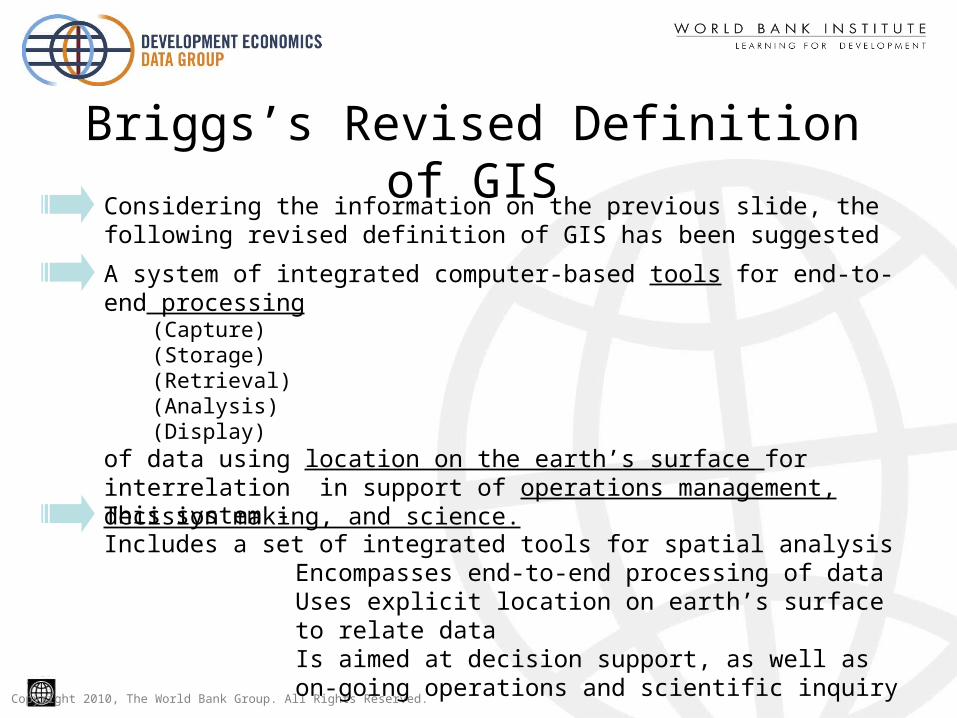
Considering the information on the previous slide, the following revised definition of GIS has been suggested
A system of integrated computer-based tools for end-to-end processing(Capture)(Storage)(Retrieval)(Analysis)(Display)
of data using location on the earth’s surface for interrelation in support of operations management, decision making, and science.
This system - Includes a set of integrated tools for spatial analysis
Encompasses end-to-end processing of dataUses explicit location on earth’s surface to relate data Is aimed at decision support, as well as on-going operations and scientific inquiry
Copyright 2010, The World Bank Group. All Rights Reserved.
The Philosophy of GIS
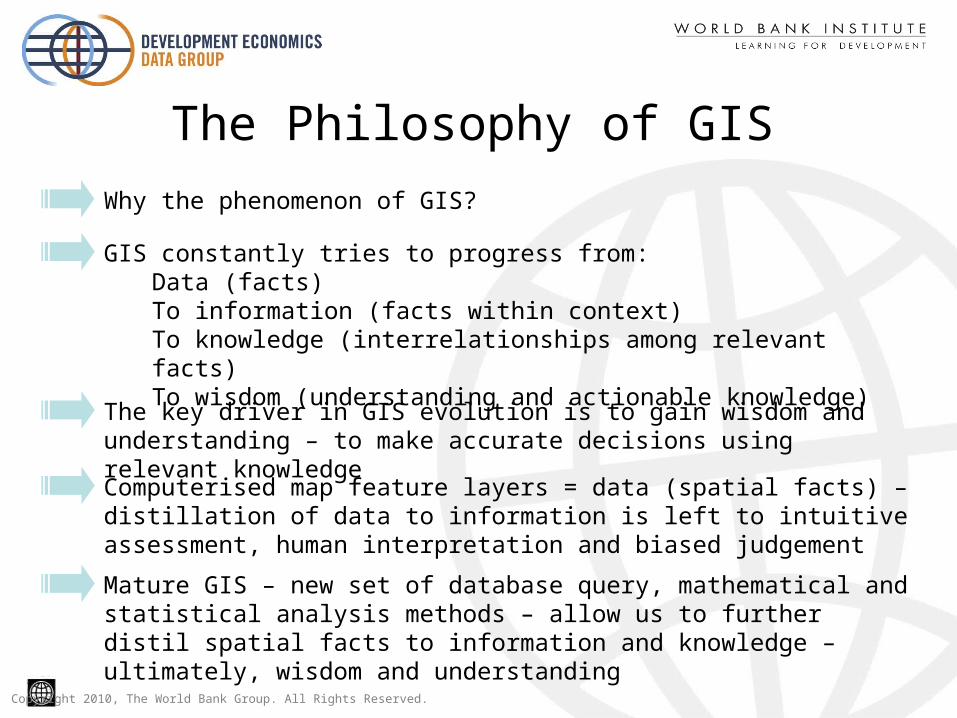
Why the phenomenon of GIS?
GIS constantly tries to progress from:Data (facts)To information (facts within context)To knowledge (interrelationships among relevant facts)To wisdom (understanding and actionable knowledge)
The key driver in GIS evolution is to gain wisdom and understanding – to make accurate decisions using relevant knowledge
Computerised map feature layers = data (spatial facts) – distillation of data to information is left to intuitive assessment, human interpretation and biased judgement
Mature GIS – new set of database query, mathematical and statistical analysis methods – allow us to further distil spatial facts to information and knowledge – ultimately, wisdom and understanding

Copyright 2010, The World Bank Group. All Rights Reserved.
GIS – The Answer Machine
All GIS analysis begins with asking a question relevant to the real world –
We collect/create/add spatial and attribute information Apply database queries, spatial and statistical analysis methodsApply our own specialised knowledge about the relevant subject matter
We arrive at an answer/conclusion/understanding
The accuracy of the answer dependent on the accuracy, currency, relevancy of the data used and the statistical and spatial analysis methods – Most important – how accurately we apply our own knowledge to interpret results

Copyright 2010, The World Bank Group. All Rights Reserved.
So what are these questions?
There are 7 basic questions we can ask a GIS (consider the table adapted from Berry)
First three questions inventory based – deal mainly with data only
The Question Function Approach
Can you map that? Mapping Descriptive
Where is what? Management Descriptive
Where has it changed? Temporal Descriptive
What relationships exist?
Spatial Prescriptive
Where is best? Suitability Prescriptive
What effects what? System Prescriptive
What if….? Simulation Prescriptive
Latter four questions are analysis related – deal with the creation of new information, knowledge and ultimately, understanding

Copyright 2010, The World Bank Group. All Rights Reserved.
Question 1 – Can you map that?
The first question ever asked in GIS – Computerized mapping
A large portion of GIS still deals with this question – updating and timely output of map products
Digital map creation much more productive, accurate than manual draughting with many more aesthetic possibilities
Typical question in a Population Census environment would be: “Can we map our new Enumerator Area (EA) boundaries digitally and can we add prominent landmarks as points within each EA polygon?
Transferring analogueEA boundaries to digital format throughheads-up digitizing

Copyright 2010, The World Bank Group. All Rights Reserved.
Question 2 – Where is what?
Exploits the linkage between the digital map and database management technology
Conditions surrounding the first two questions determines the character and design of GIS – remaining questions determine the sophistication of its applications
Relevant question - Where are the Enumerator Areas with a male population of more than 200?

Copyright 2010, The World Bank Group. All Rights Reserved.
Question 3 – Where has it changed?
Temporal analysis or change over time – transition from descriptive to prescriptive queriesAffords a new perspective on existing data
Typical question – “Assess the prevalence of pit latrines within a peri urban environment over a period of five years.”
9230532
9230545
9232556
9232557
9232558
9232559
9232560
9232561
9232562
9232563
9232564
9232565
9232566
9232567
9232568
92325699232570
9232571
9232572
9232573
9232575
9232576
9232577
9225635
9230008
9230009
VD_GSP_NP354_1_3_0101.tif
VD_GSP_NP354_2_3_0101.tif
Labels of EA_AREA
MAP_SHEET
NP_EA
EA_AREA
SOCIAL_BOUNDARIES
9232751
9230363
9230367
Using imagery from different years to determine urban development and densification for EA
demarcation

Copyright 2010, The World Bank Group. All Rights Reserved.
Question 4 – What relationships exist?Focuses on spatial and statistical analysis across data layers
Here we deal with derived information from existing data
Requires developed spatial reasoning in order to ask the correct questions
0
0-1010-2020-3040-50>50
Female Literacy RatePercent
10 20 30 40 50
Female Literacy Rate (percent)
10
20
30
40
50
60
70
ContraceptivePrevalence
Rate
Finding a relationship between female literacy and contraceptive use

Copyright 2010, The World Bank Group. All Rights Reserved.
Question 5 – Where is best?
Suitability models, trade area analysis and site selection
Spatial reasoning and subject matter knowledge is important
Clinic site selection using buffer analysis

Copyright 2010, The World Bank Group. All Rights Reserved.
Question 6 – What effects what?
Involves system models – tracking of cause and effect through empirically derived relationshipsOutcome based models built with the sole purpose to identify causality or trends within real world environments

Copyright 2010, The World Bank Group. All Rights Reserved.
Question 6 – What effects what?
From InnovativeGIS:
Creating a customer density map

Copyright 2010, The World Bank Group. All Rights Reserved.
Question 7 – What if?....scenarios Models and predicts outcomes of real world actions and occurrences which already happened or might still happen.
What if – we implement this there or move this here or build this there – what will the outcome or forecast be?
What if we increase the floor space of this shopping centre by
20000 sq/m – How would it impact trade area?


![Escala gráfica en millas terrestres y en kilómetros. Supl ...€¦ · Autor(es): produced by the Cartographic Division [of the] National geographic Society [for the] National Geographic](https://img.pdfslide.us/doc/110x75/603099c77a37e42b1c542a67/escala-grfica-en-millas-terrestres-y-en-kilmetros-supl-autores-produced.jpg)