Embed Size (px)
Citation preview

Copyright © 2009 Pearson Addison-Wesley. All rights reserved.
Chapter 28
Empirical Evidence of the Effectiveness of Monetary Policy

Copyright © 2009 Pearson Addison-Wesley. All rights reserved. 28-2
Learning Objectives
• Understand the historical volatility in velocity and money demand and the implications of that volatility for Keynesianism and monetarism
• Explain the fiscal and monetary policy lags and resulting difficulties in enacting these policies
• Analyze the empirical evidence relating monetary and fiscal policies to GDP, investment, consumption, and interest rates

Copyright © 2009 Pearson Addison-Wesley. All rights reserved. 28-3
Introduction
• Previous chapters dealt with theoretical concepts of monetary theory on economic activity
• This chapter explores empirical evidence– How are interest rates affected– What categories of spending are most influenced– Does monetary policy alter real economic outcomes
—output and unemployment—as compared to changes in prices

Copyright © 2009 Pearson Addison-Wesley. All rights reserved. 28-4
Living with Velocity
• Much of Monetarist-Keynesian debate hinges on the behavior of velocity– Monetarists—relatively stable and changes are
highly predictable– Keynesians—neither contention is true, velocity can
vary unpredictably
• While velocity is not constant, changes do not appear to be obviously random or perverse

Copyright © 2009 Pearson Addison-Wesley. All rights reserved. 28-5
Living with Velocity (Cont.)
• If the Federal Reserve could discover the underlying determinants of these changes, it might still be able to coexist with such a moving target
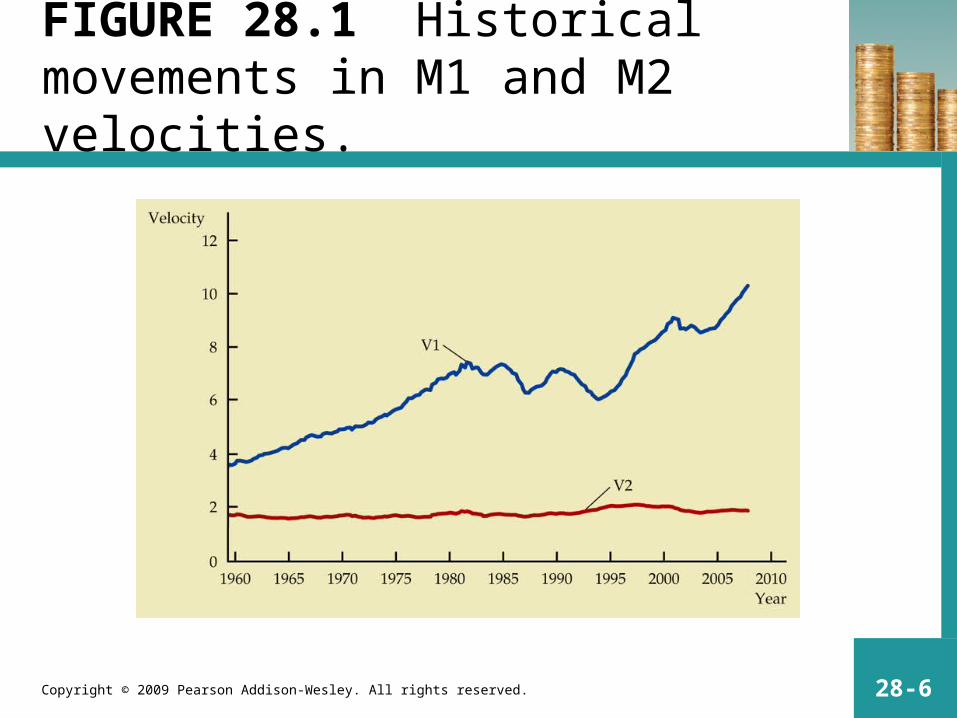
• Figure 28.1 plots the historical movements of measures of velocity for two definitions of the money supply—M1 and M2—over time– Velocity of M2 has been relatively stable
Copyright © 2009 Pearson Addison-Wesley. All rights reserved. 28-6
FIGURE 28.1 Historical movements in M1 and M2 velocities.

Copyright © 2009 Pearson Addison-Wesley. All rights reserved. 28-7
Living with Velocity (Cont.)
• Figure 28.1 (Cont.)– Velocity of M1 appears highly unpredictable
• Reached a peak of about 4 at the beginning of the 1920s
• Fell almost continuously during the Great Depression and World War
• Experienced a dramatic increase since the low in 1949 reaching almost 9 during the early 2000s

Copyright © 2009 Pearson Addison-Wesley. All rights reserved. 28-8
Living with Velocity (Cont.)
• Figure 28.1 (Cont.)– Main reasons for the post-World War II rise in
velocity of M• The relatively narrow definition of M1• Increasing attractiveness of other categories of financial
assets as prudent/desirable places to invest excess cash• Higher interest rates experienced during the 1970s and
early 1980s increased opportunity cost of holding cash• This lead to an increase in velocity by inducing business
firms and households to economize on money
Copyright © 2009 Pearson Addison-Wesley. All rights reserved. 28-9
Living with Velocity (Cont.)
• Figure 28.1 (Cont.)– However, since the mid-1980s, M1 velocity has
reversed the post-World War II uptrend forcing the Federal Reserve to abandon setting M1 targets and focus on the more stable behavior of M2

Copyright © 2009 Pearson Addison-Wesley. All rights reserved. 28-10
The Demand for Money
• The historical movements in the velocity of M1 are a result of many factors– Movements in interest rates– Technology– Innovations in financial markets
• In order to be able to focus more precisely on the relative importance of each, must be able to disentangle their separate influences

Copyright © 2009 Pearson Addison-Wesley. All rights reserved. 28-11
The Demand for Money (Cont.)
• Formal application of statistical techniques to historical data of economic variables will permit identification of individual relationships
• Statistical studies show that interest rates and the level of GDP influence money demand– Higher rates reduce demand for cash balances– Contradicts extreme forms of monetarism, which assume
zero interest-sensitivity of money demand– However, none of the empirical studies isolate the Keynesian
liquidity trap

Copyright © 2009 Pearson Addison-Wesley. All rights reserved. 28-12
The Demand for Money (Cont.)
• More sophisticated approach focuses on the stability of the money demand– Recognizes that specific numbers are less important
than ability to forecasting future money demand– If this relationship can be established, Federal
Reserve can gauge proper amount of money to add/subtract to hit a target of economic activity
– If this relationship is unpredictable, it provides no useful guidance to the Federal Reserve

Copyright © 2009 Pearson Addison-Wesley. All rights reserved. 28-13
The Demand for Money (Cont.)
• Empirical evidence – Demand for money was quite stable until the mid-
1970s– Deteriorated after the middle of 1974 with people
holding smaller money balances than the historical relationship suggested
– The observations in the 1980s were the opposite—holding of too much money reflecting the decline in M1 velocity

Copyright © 2009 Pearson Addison-Wesley. All rights reserved. 28-14
Econometrics and Time Lags
• The simple velocity and money demand approaches leave much to be desired as a guideline for Federal Reserve policy-making.
• Ignores time lags between changes in monetary policy and impact on economy
• Ignores more sophisticated computer driven statistical methodology that can simulate the impact of monetary policy via formal econometric modeling

Copyright © 2009 Pearson Addison-Wesley. All rights reserved. 28-15
Econometrics and Time Lags (Cont.)
• Lags in monetary policy– Prompt recognition of what the economy is doing
can be difficult– Available data are often inadequate and frequently
mixed– The economy rarely proceeds on a perfectly smooth
course

Copyright © 2009 Pearson Addison-Wesley. All rights reserved. 28-16
Econometrics and Time Lags (Cont.)
• Lags in monetary policy (Cont.)– Recognition lag
• Time associated with getting an accurate understanding of what is happening or is likely to happen in the future
• Data suggests the Federal Reserve generally starts to tighten only a few months after a business cycle has reached its trough, while the move toward easing is somewhat more delayed
• This leads to the conclusion that the Federal Reserve is typically more concerned with preventing inflation than with avoiding a recession

Copyright © 2009 Pearson Addison-Wesley. All rights reserved. 28-17
Econometrics and Time Lags (Cont.)
• Lags in monetary policy (Cont.)– Impact lag—time span from when the central bank starts to
use one of the monetary tools until an effect is evident on the ultimate objective—aggregate spending in the economy
• It may take weeks before interest rates change
• Changes in credit availability also take time
• Delay before actual spending decisions are affected
• Once monetary policy starts to influence spending, it will most likely continue to have an impact well into the future

Copyright © 2009 Pearson Addison-Wesley. All rights reserved. 28-18
Econometrics and Time Lags (Cont.)
• Econometric Models– A mathematical-statistical representation that
describes how the economy behaves– How do different economic actors (consumers and
businesses) respond to economic stimuli– Once the relationships are formalized in
mathematical representations, data on past experience in the real world are used to estimate the precise behavioral patterns of each sector

Copyright © 2009 Pearson Addison-Wesley. All rights reserved. 28-19
Econometrics and Time Lags (Cont.)
• Econometric Models (Cont.)– The computer model simulates the economy in action and
makes predictions based on the formal relationships embedded in the model
– However, depending on the theoretical propositions used to construct the model, the data can produce different results
– Since Monetarists and Keynesians use different theory, predictions of models based on their respective theories would be significantly different

Copyright © 2009 Pearson Addison-Wesley. All rights reserved. 28-20
The Impact of Monetary Policy on GDP
• The Federal Reserve, working with several universities, has developed econometric models of behavior of economic aggregates in the U.S.
• These econometric models are an evolutionary phenomena, constantly being revised and updated to reflect new and different perspectives about economic reality

Copyright © 2009 Pearson Addison-Wesley. All rights reserved. 28-21
The Impact of Monetary Policy on GDP (Cont.)
• Outcomes of these models will vary with specific conditions of current economic activity
• The Federal Reserve model articulates rather carefully the impact of monetary policy on various categories of spending

Copyright © 2009 Pearson Addison-Wesley. All rights reserved. 28-22
The Impact of Monetary Policy on GDP (Cont.)
• Fed’s model shows that a 1% increase in the money supply raises real GDP by about ½% after one year, rising over the next two years to reflect the full 1% increase
• Model demonstrates that monetary policy has a significant impact even within a year
• However, because of various lags, the continued impact may cause difficulties for policymakers in subsequent years

Copyright © 2009 Pearson Addison-Wesley. All rights reserved. 28-23
Fiscal Policy and Crowding Out
• The models test the Monetarists-Keynesian distinction of the effect of fiscal policy and crowding out– Monetarists—increased government spending will
merely displace private spending, leaving little net impact of fiscal policy on GDP
– Keynesians—“crowding-out” effects are incomplete, implying that fiscal policy generates much of the traditional multiplier effect on GDP

Copyright © 2009 Pearson Addison-Wesley. All rights reserved. 28-24
Fiscal Policy and Crowding Out (Cont.)
• The Federal Reserve model– Holding the money supply constant
• This results in an increase in the interest rates caused by additional government borrowing
• An increase in government spending by 1 percent of GDP increases the level of real GDP by about 1 percent for at least two years
• It takes more than three years for crowding out to reduce the impact on real GDP

Copyright © 2009 Pearson Addison-Wesley. All rights reserved. 28-25
Fiscal Policy and Crowding Out (Cont.)
• The Federal Reserve model (Cont.)– Allowing the money supply to increase
• In this case, the Federal Reserve finances the additional borrowing/spending by printing money and interest rates do not increase
• In this case the multiplier effects on GDP are substantial
• The effects on GDP continue even after 4 years

Copyright © 2009 Pearson Addison-Wesley. All rights reserved. 28-26
Fiscal Policy and Crowding Out (Cont.)
• These models suggest that fiscal policy has a multiplier of about one without any help from monetary policy, but an accommodating monetary authority can make fiscal policy even more effective
• Empirical evidence on fiscal policy confirms the crowding-out effect, but only if the contractionary effects on private spending are given substantial time to work themselves out

Copyright © 2009 Pearson Addison-Wesley. All rights reserved. 28-27
Interest Rates
• Monetarists and Keynesians believe the initial liquidity impact of an expansionary monetary policy reduces the level of interest rates
• Eventually both recognize inflationary expectations generated by excessive expansion of money will raise interest rates
• Difference between the two rests on how long it takes for inflationary expectations to counter the initial liquidity effect
Copyright © 2009 Pearson Addison-Wesley. All rights reserved. 28-28
Interest Rates (Cont.)
• Figure 28.2– Illustrates that levels of short-term interest rates have been
closely related to actual movements in the rate of inflation
– However, the chart also shows substantial intervals of independent movements in the level of interest rates
– Most econometric models report that interest rates decline and remain below their original levels for six months following an expansion of money

Copyright © 2009 Pearson Addison-Wesley. All rights reserved. 28-29
FIGURE 28.2 Interest rates move with the rate of inflation.

Copyright © 2009 Pearson Addison-Wesley. All rights reserved. 28-30
Interest Rates (Cont.)
• Figure 28.2 (Cont.)– Similarly, interest rates are above their original
levels for a similar period after an contractionary monetary policy
– After a year, however, the initial liquidity effect is reversed, and interest rates move in the opposite direction
Copyright © 2009 Pearson Addison-Wesley. All rights reserved. 28-31
Interest Rates (Cont.)
• It should be emphasized that the response of inflationary expectations depends crucially on the initial state of the economy– Responding very quickly when the economy is very
close to full employment– Also, a quick response when there is high degree of
concern about possible inflation

Copyright © 2009 Pearson Addison-Wesley. All rights reserved. 28-32
Business Investment
• Theory would suggest interest rates and all types of investment spending to move in opposite directions
• However, historically the two almost always move in the same direction– This conflicting result stems from the fact that
business investment is dependent upon a number of factors besides interest rates

Copyright © 2009 Pearson Addison-Wesley. All rights reserved. 28-33
Business Investment (Cont.)
– The model, therefore, violates the assumption of holding all other influences constant and just changing the rate of interest
– An increase in interest rates may inhibit investment, but an increase in investment caused by other factors may offset the interest rate effect

Copyright © 2009 Pearson Addison-Wesley. All rights reserved. 28-34
Business Investment (Cont.)
• Fed’s econometric model can sort out effects of individual variables and does demonstrate the negative relationship between interest rates and business spending
• Most of the effects occur during the last year of a 3 year time period
• The time delay relates to the fact that current business decisions are not executed usually until several years later

Copyright © 2009 Pearson Addison-Wesley. All rights reserved. 28-35
Residential Construction
• The impact of monetary policy is felt more promptly and powerfully on residential construction expenditures—higher interest, lower residential construction
• Part of this effect occurs through credit rationing activities by financial institutions engaged in mortgage lending
• Construction expenditures by state and local governments also appear sensitive to the actions of the monetary authorities
Copyright © 2009 Pearson Addison-Wesley. All rights reserved. 28-36
Consumer Spending
• The Federal Reserve model includes the wealth effect of modern Keynesians
• Lower interest rates raise the value of financial securities which increase the level of consumer spending
• According to the Fed’s model, the importance of the wealth effect in the overall impact of monetary policy is quite substantial