Embed Size (px)
Citation preview

Copyright © 2002 by Thomson Learning, Inc.
Chapter 2Appendix
Welfare Economics
Copyright © 2002 Thomson Learning, Inc. Thomson Learning™ is a trademark used herein under license.
ALL RIGHTS RESERVED. Instructors of classes adopting PUBLIC FINANCE: A CONTEMPORARY APPLICATION OF THEORY TO POLICY, Seventh Edition by David N. Hyman as an assigned textbook may reproduce material from this publication for classroom
use or in a secure electronic network environment that prevents downloading or reproducing the copyrighted material. Otherwise, no part of this work covered by the copyright hereon may be reproduced or used in any form or by any means—graphic, electronic, or mechanical, including, but not limited to, photocopying, recording, taping, Web distribution, information networks, or information storage and retrieval
systems—without the written permission of the publisher. Printed in the United States of America
ISBN 0-03-033652-X
Copyright © 2002 by Thomson Learning, Inc.
Efficiency Resource Use
Assumptions 2 inputs (capital and labor) 2 outputs (food and clothing)
Copyright © 2002 by Thomson Learning, Inc.
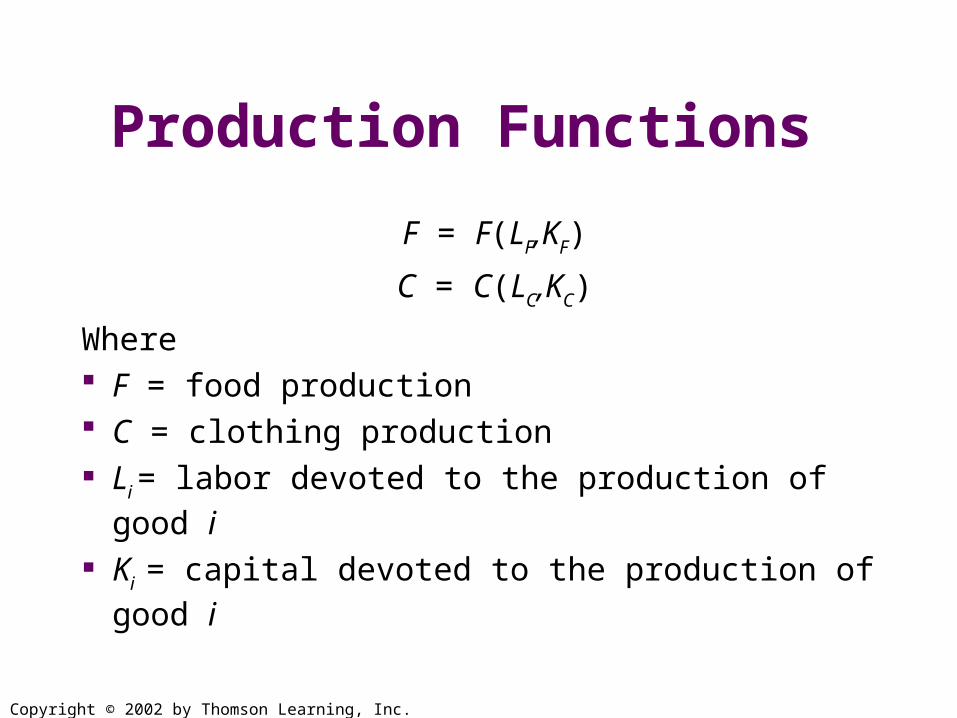
Production Functions
F = F(LF,KF)
C = C(LC,KC)
Where F = food production C = clothing production Li = labor devoted to the production of good i
Ki = capital devoted to the production of good i
Copyright © 2002 by Thomson Learning, Inc.
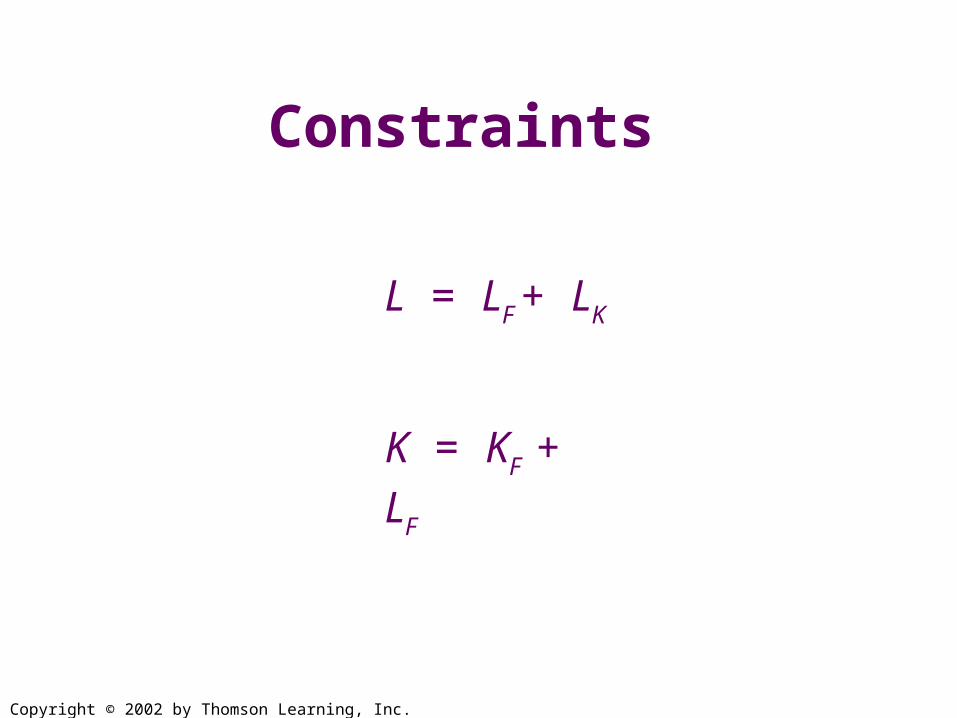
Constraints
L = LF + LK
K = KF + LF

Copyright © 2002 by Thomson Learning, Inc.
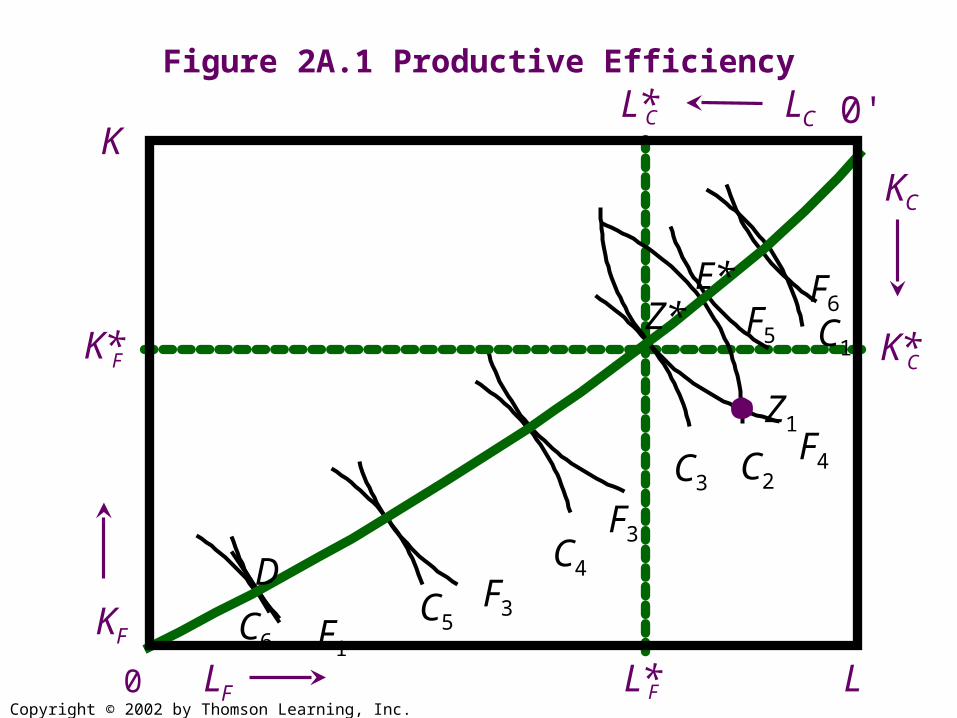
Productive Efficiency
It is not possible to reallocate inputs to alternative uses in such a manner as to increase the output of any good without reducing the output of some alternative good.
Copyright © 2002 by Thomson Learning, Inc.
Figure 2A.1 Productive Efficiency
F3
E* F6 F5 Z*
F3 F1
F4 Z1
C2 C3
C4
C5 C6
C1
D
0
K* F
K
L
K* C
KF
LF
LC
KC
L* F
L* C 0'
Copyright © 2002 by Thomson Learning, Inc.
Efficiency Condition
MRTSFLK = MRTSC
LK
The Marginal Rate of Technical
substitution of Labor for Capital in each good are equal
Copyright © 2002 by Thomson Learning, Inc.
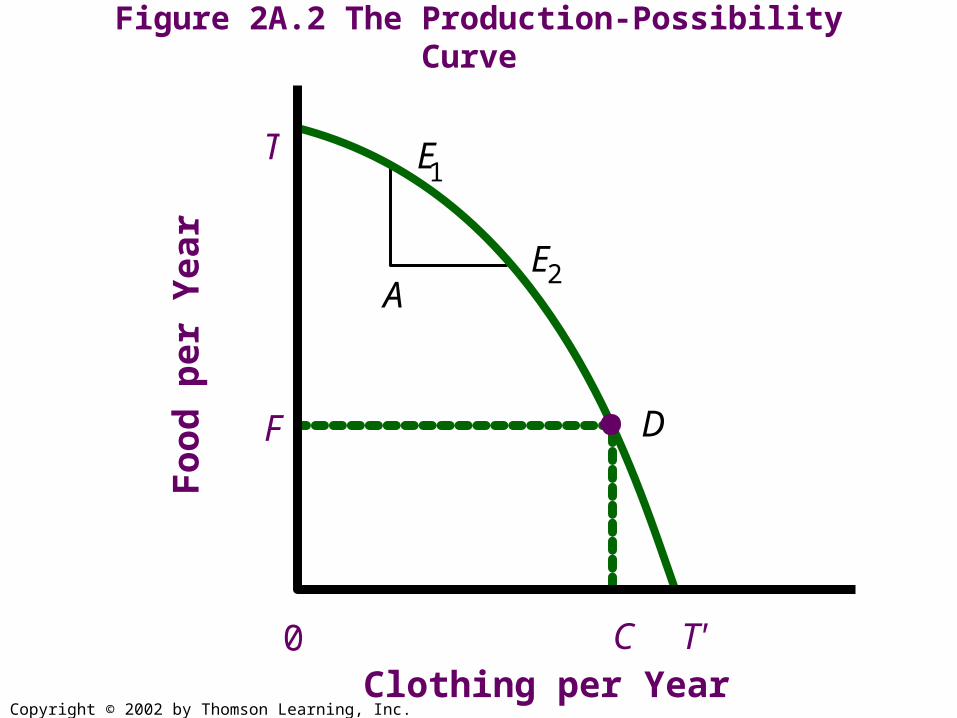
Figure 2A.2 The Production-Possibility Curve
A
D
E 1
E 2
Fo
od
per
Yea
r
Clothing per Year 0
T
F
C T'
Copyright © 2002 by Thomson Learning, Inc.
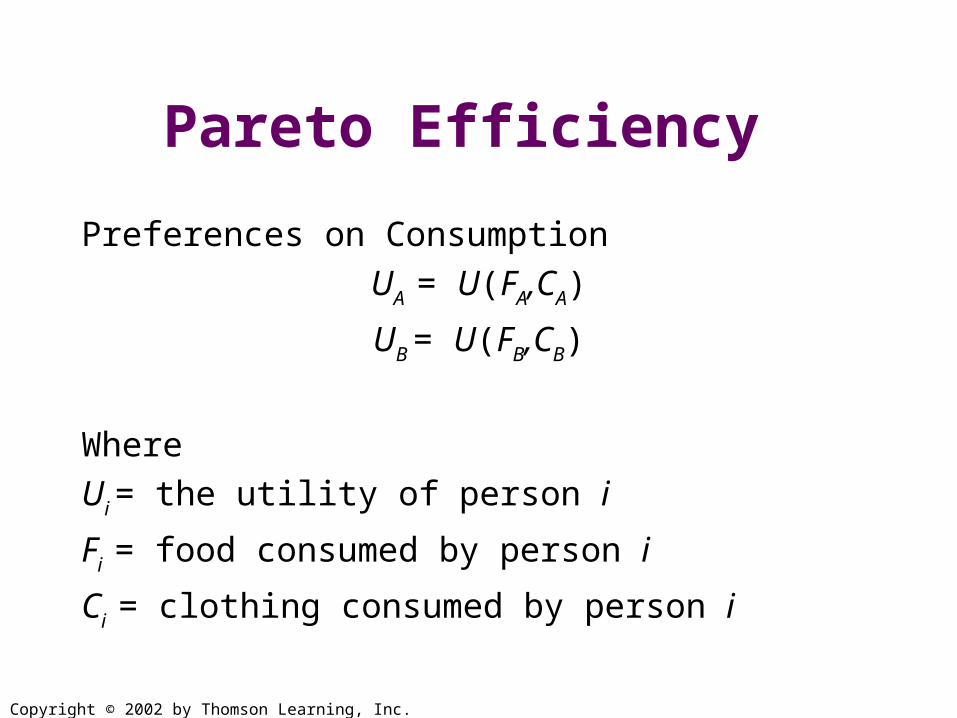
Pareto Efficiency
Preferences on Consumption
UA = U(FA,CA)
UB = U(FB,CB)
Where
Ui = the utility of person i
Fi = food consumed by person i
Ci = clothing consumed by person i
Copyright © 2002 by Thomson Learning, Inc.
Constraints
F = FA + FB
C = CA + CB
Copyright © 2002 by Thomson Learning, Inc.
Fo
od
per
Yea
r
Clothing per Year
T
T’
F
C
D
FA
CA
CB
FB
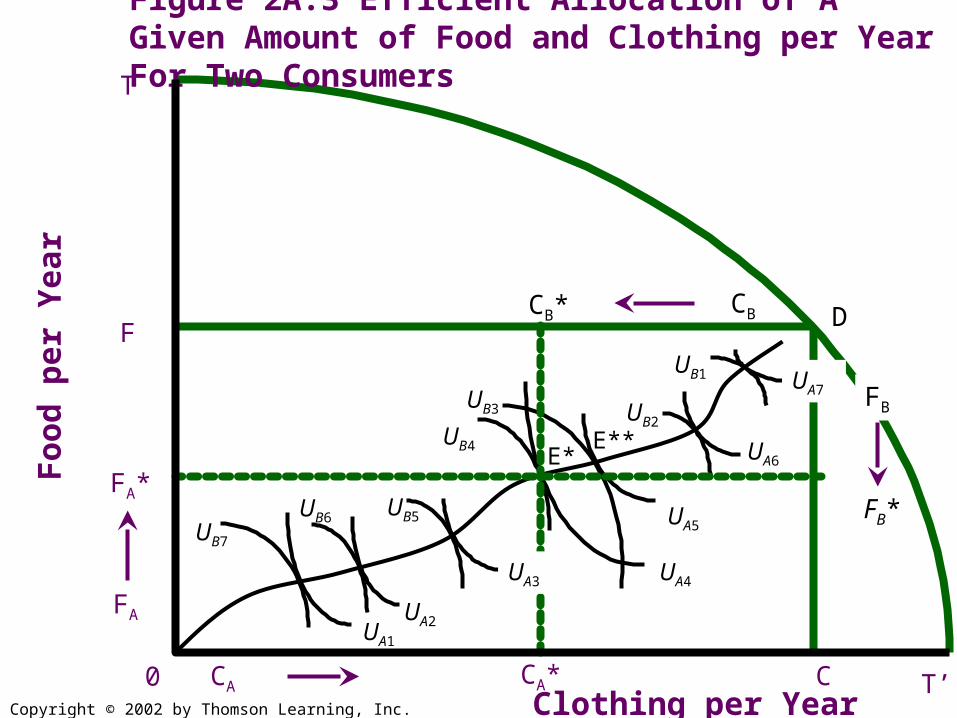
Figure 2A.3 Efficient Allocation of A Given Amount of Food and Clothing per Year For Two Consumers
UB1
UB2UB3
UB4
UB5UB6UB7
UA5
UA4
UA2UA1
UA6
FA*FB*
CB*
CA*
E*E**
UA3
UA7
0

Copyright © 2002 by Thomson Learning, Inc.
Efficiency Criterion on Consumption and Production
MRSACF = MRSB
CF = MRTCF
Copyright © 2002 by Thomson Learning, Inc.
Interpretation of Efficiency Criterion
Suppose we say that the “price of a unit of clothing is $1.” Then clothing is the same as “money.” We can then say that MRSA
CF is A’s willingness to substitute
clothing for money, which is their marginal benefit of clothing, MBA
C. The same is true for B. If these are
equal to the MRTCF then this represents the
capability of turning money into clothing as well. Thus it reflects the costs of production. Lastly if there are no other people who gain from either A or B consuming clothing or food then:
MSB = MBAC = MBB
C = MSCC
Copyright © 2002 by Thomson Learning, Inc.
Social Welfare Functions
W = W(UA,UB)
Where W is social welfare UA is A’s utility
UB is B’s utility
Copyright © 2002 by Thomson Learning, Inc.
Efficiency and Economic Institutions
Given the conditions for a market rendering a Pareto Optimal outcome referred to in Chapter 2 then if costs are:
C = PKK + PLL
then production of a particular amount of a good is efficient if the slope of the production function for each good is equal to the slope of the isocost line.
Copyright © 2002 by Thomson Learning, Inc.
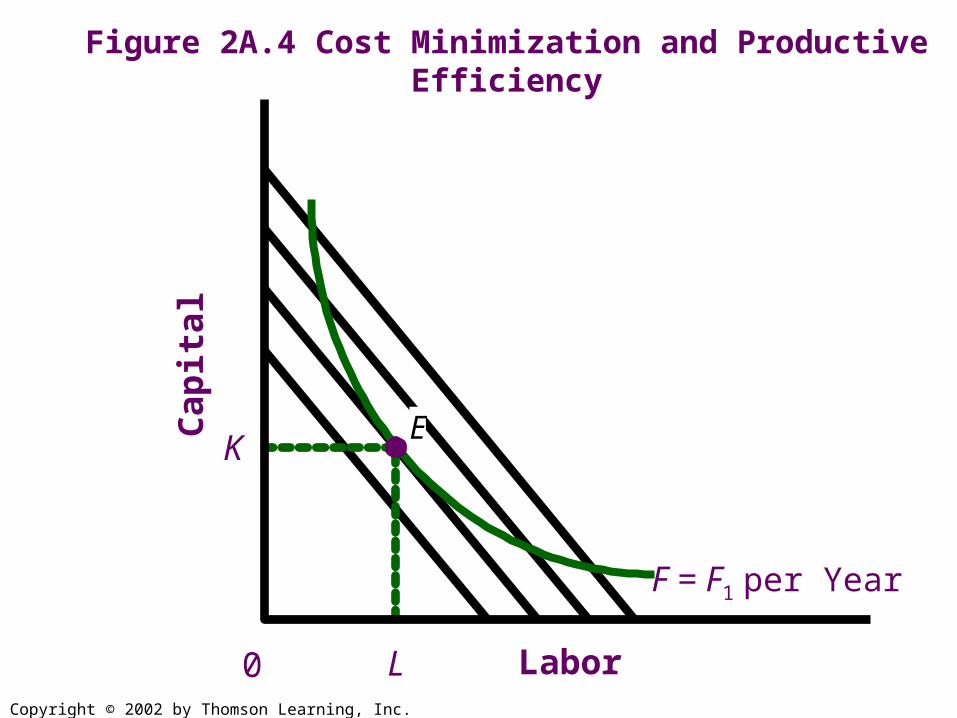
Figure 2A.4 Cost Minimization and Productive Efficiency
Ca
pit
al
Labor
F = F1 per Year
0
K
L
E
Copyright © 2002 by Thomson Learning, Inc.
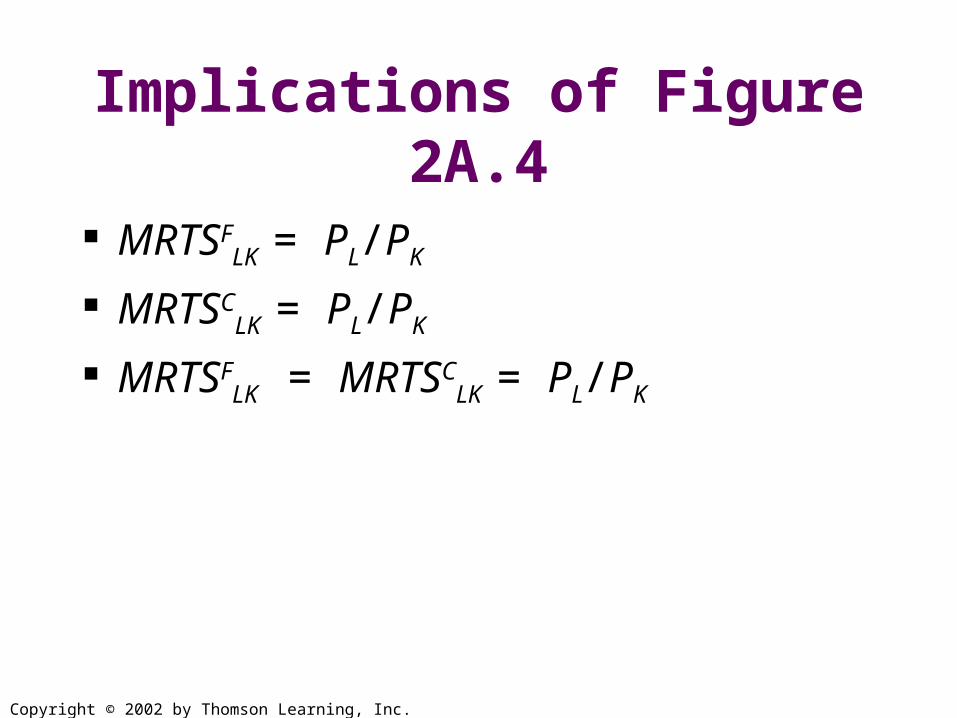
Implications of Figure 2A.4
MRTSFLK = PL/PK
MRTSCLK = PL/PK
MRTSFLK = MRTSC
LK = PL/PK

Copyright © 2002 by Thomson Learning, Inc.
Pure Market Economy and Pareto Efficiency
Step 1So far we know that PF = MCF and PC = MCC
from perfect competition dividing one by the other we get
PC MCC
PF MCF
=

Copyright © 2002 by Thomson Learning, Inc.
Pure Market Economy and Pareto Efficiency
Step 2 MCF is the amount of other resources
that must be given up to produce more Food. We will denote this fact by saying:
MCF = C.
It is the forgone clothing to produce more Food.
The same applies the other way around
MCC = F.

Copyright © 2002 by Thomson Learning, Inc.
Pure Market Economy and Pareto Efficiency
Step 3
Dividing these by each other we get:
MCC FMCF C
=

Copyright © 2002 by Thomson Learning, Inc.
Pure Market Economy and Pareto Efficiency
Step 4
= MRTCF
F
C
Since
AndMRTCF =
PC
PF
Then
= MRTCF =PC
PF
F
C
MCC
MCF
=
Copyright © 2002 by Thomson Learning, Inc.
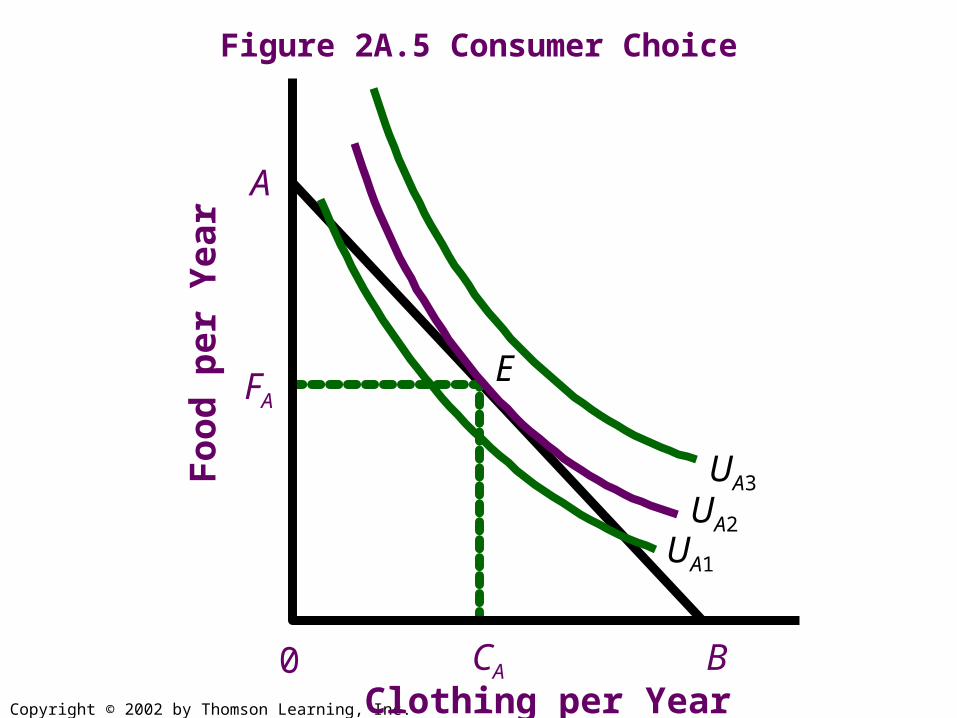
Figure 2A.5 Consumer Choice
E
UA3
UA2 UA1
Fo
od
per
Yea
r
Clothing per Year 0
FA
A
B CA
Copyright © 2002 by Thomson Learning, Inc.
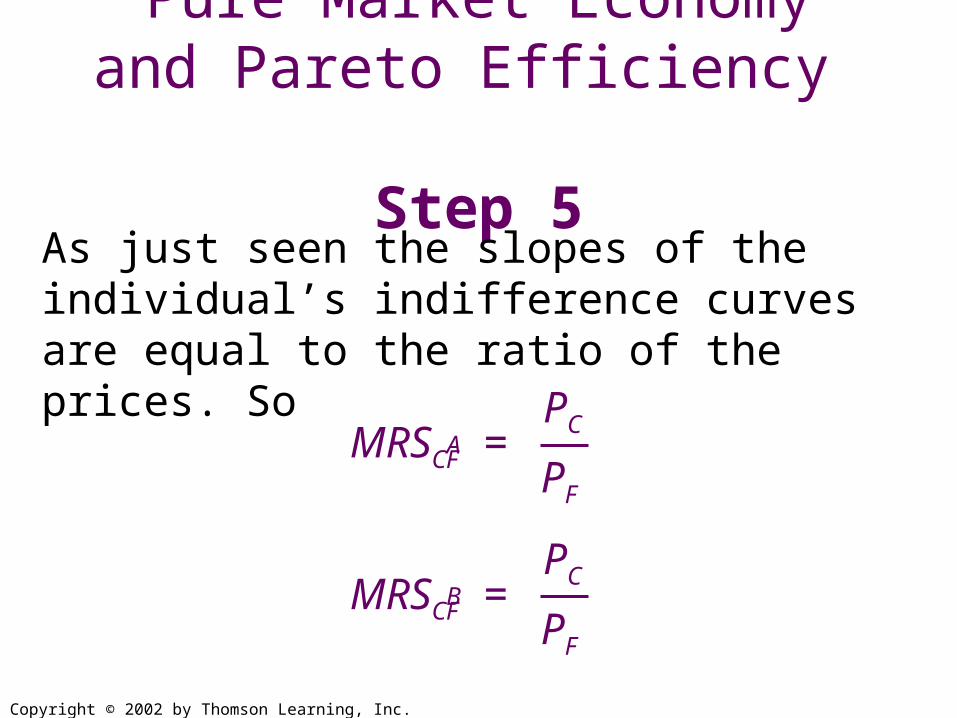
Pure Market Economy and Pareto Efficiency
Step 5As just seen the slopes of the individual’s indifference curves are equal to the ratio of the prices. So
MRSCF =PC
PF
A
MRSCF =PC
PF
B
Copyright © 2002 by Thomson Learning, Inc.
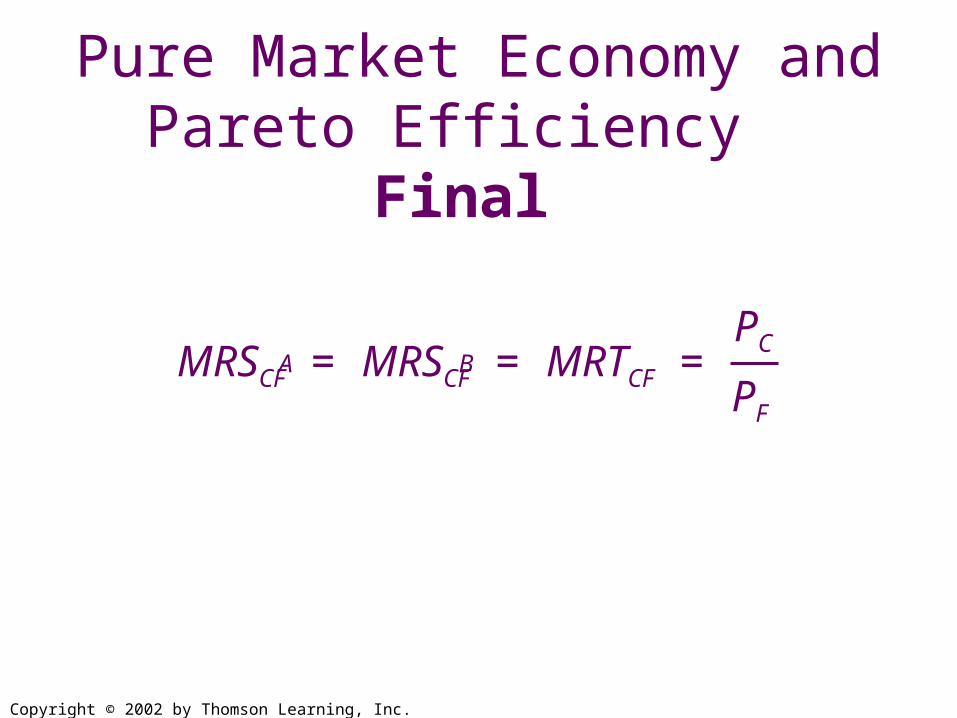
Pure Market Economy and Pareto Efficiency
Final
MRSCF = MRSCF = MRTCF =PC
PF
A B

Copyright © 2002 by Thomson Learning, Inc.
Market Imperfections
Monopoly P > MC Others are affected so MB = MSB or
MC = MSC