Embed Size (px)
Citation preview
COP21: 10 THINGS THE NEGOTIATORS NEED TO KNOW
23 November 2015
1
WHAT THE COP21 NEGOTIATORS NEED TO KNOW…
COP21: 10 Things the Negotiators Need to Know – 23 November 2015
2. SOME TARGETS ARE MORE AMBITIOUS THAN OTHERS
3. INDIA AND SOUTHEAST ASIA ARE KEY TO CURBING FUTURE
GLOBAL EMISSIONS GROWTH
4. RENEWABLE ENERGY IS GETTING CHEAPER
6. CLEAN ENERGY INVESTMENT HAS LEVELLED AT ~$300BN/YR
SINCE 2011
1. THE INTENDED NATIONALLY DETERMINED CONTRIBUTIONS
(INDCS) SUBMITTED DON’T GET YOU TO 2°C
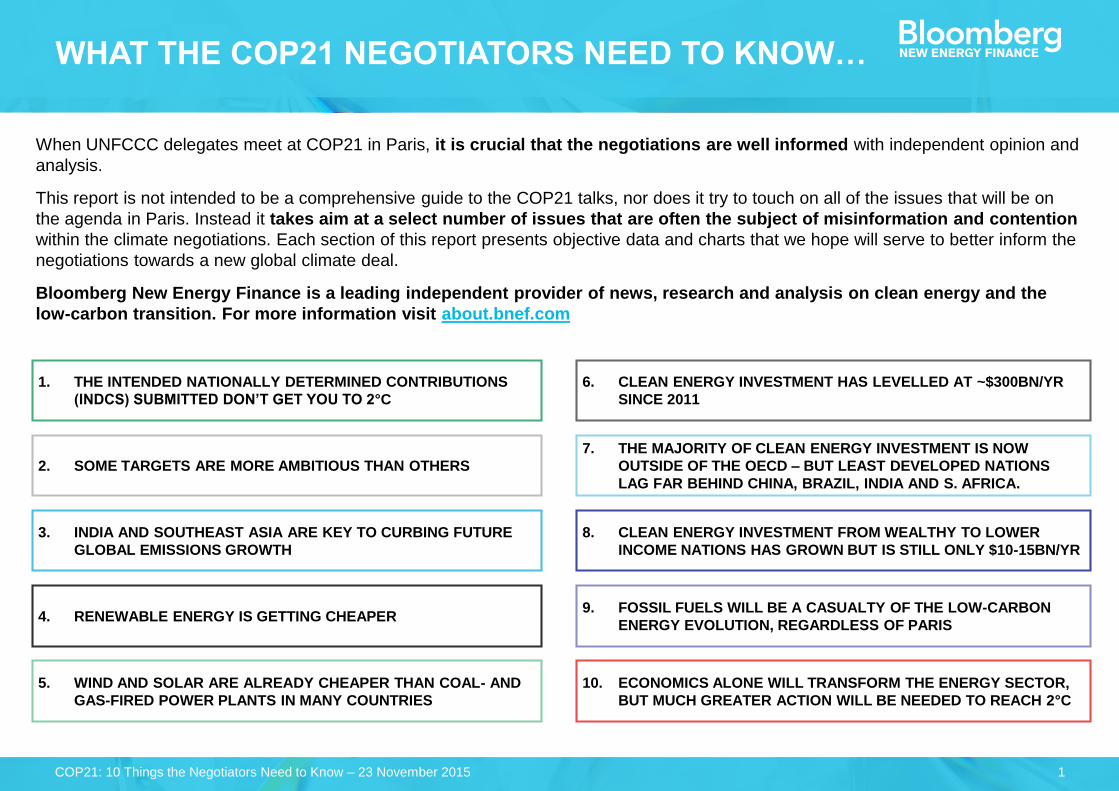
When UNFCCC delegates meet at COP21 in Paris, it is crucial that the negotiations are well informed with independent opinion and
analysis.
This report is not intended to be a comprehensive guide to the COP21 talks, nor does it try to touch on all of the issues that will be on
the agenda in Paris. Instead it takes aim at a select number of issues that are often the subject of misinformation and contention
within the climate negotiations. Each section of this report presents objective data and charts that we hope will serve to better inform the
negotiations towards a new global climate deal.
Bloomberg New Energy Finance is a leading independent provider of news, research and analysis on clean energy and the
low-carbon transition. For more information visit about.bnef.com
8. CLEAN ENERGY INVESTMENT FROM WEALTHY TO LOWER
INCOME NATIONS HAS GROWN BUT IS STILL ONLY $10-15BN/YR
9. FOSSIL FUELS WILL BE A CASUALTY OF THE LOW-CARBON
ENERGY EVOLUTION, REGARDLESS OF PARIS
10. ECONOMICS ALONE WILL TRANSFORM THE ENERGY SECTOR,
BUT MUCH GREATER ACTION WILL BE NEEDED TO REACH 2°C
7. THE MAJORITY OF CLEAN ENERGY INVESTMENT IS NOW
OUTSIDE OF THE OECD – BUT LEAST DEVELOPED NATIONS
LAG FAR BEHIND CHINA, BRAZIL, INDIA AND S. AFRICA.
5. WIND AND SOLAR ARE ALREADY CHEAPER THAN COAL- AND
GAS-FIRED POWER PLANTS IN MANY COUNTRIES
2
30
35
40
45
50
55
60
65
1990 1995 2000 2005 2010 2015 2020 2025 2030
Historical emissions2 C trajectory
INDC trajectory
Pre-COP21 pledges
GtCO2e/yr
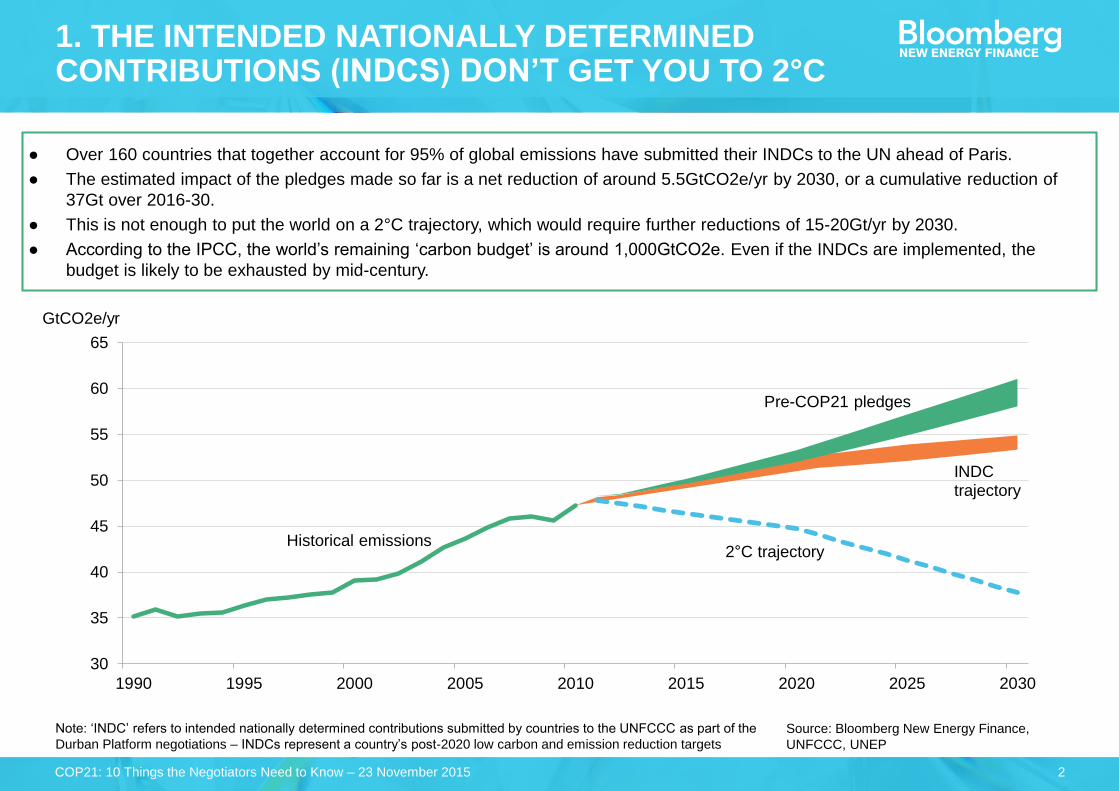
1. THE INTENDED NATIONALLY DETERMINED CONTRIBUTIONS (INDCS) DON’T GET YOU TO 2°C
● Over 160 countries that together account for 95% of global emissions have submitted their INDCs to the UN ahead of Paris.
● The estimated impact of the pledges made so far is a net reduction of around 5.5GtCO2e/yr by 2030, or a cumulative reduction of
37Gt over 2016-30.
● This is not enough to put the world on a 2°C trajectory, which would require further reductions of 15-20Gt/yr by 2030.
● According to the IPCC, the world’s remaining ‘carbon budget’ is around 1,000GtCO2e. Even if the INDCs are implemented, the
budget is likely to be exhausted by mid-century.
Source: Bloomberg New Energy Finance,
UNFCCC, UNEP
Note: ‘INDC’ refers to intended nationally determined contributions submitted by countries to the UNFCCC as part of the
Durban Platform negotiations – INDCs represent a country’s post-2020 low carbon and emission reduction targets
COP21: 10 Things the Negotiators Need to Know – 23 November 2015
3
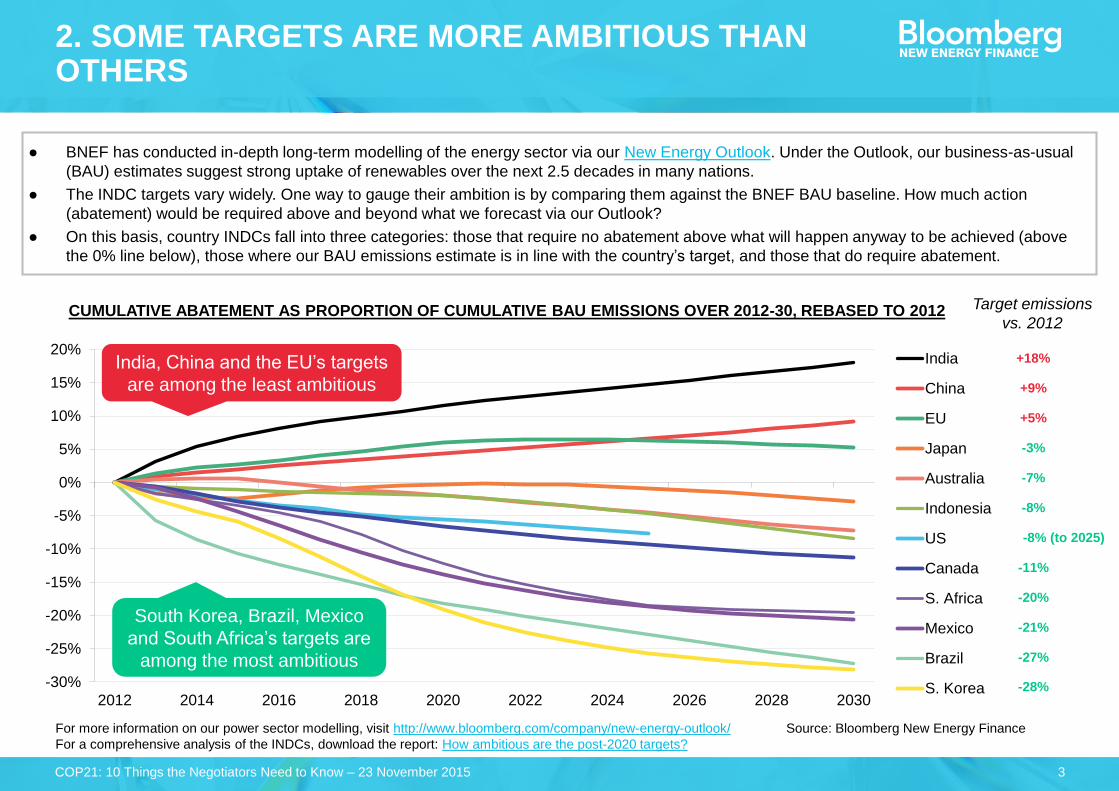
2. SOME TARGETS ARE MORE AMBITIOUS THAN OTHERS
● BNEF has conducted in-depth long-term modelling of the energy sector via our New Energy Outlook. Under the Outlook, our business-as-usual
(BAU) estimates suggest strong uptake of renewables over the next 2.5 decades in many nations.
● The INDC targets vary widely. One way to gauge their ambition is by comparing them against the BNEF BAU baseline. How much action
(abatement) would be required above and beyond what we forecast via our Outlook?
● On this basis, country INDCs fall into three categories: those that require no abatement above what will happen anyway to be achieved (above
the 0% line below), those where our BAU emissions estimate is in line with the country’s target, and those that do require abatement.
-30%
-25%
-20%
-15%
-10%
-5%
0%
5%
10%
15%
20%
2012 2014 2016 2018 2020 2022 2024 2026 2028 2030
India
China
EU
Japan
Australia
Indonesia
US
Canada
S. Africa
Mexico
Brazil
S. Korea
+9%
-8%
-8% (to 2025)
-20%
+5%
-3%
-11%
-7%
-21%
-27%
-28%
+18%
CUMULATIVE ABATEMENT AS PROPORTION OF CUMULATIVE BAU EMISSIONS OVER 2012-30, REBASED TO 2012 Target emissions
vs. 2012
For more information on our power sector modelling, visit http://www.bloomberg.com/company/new-energy-outlook/
For a comprehensive analysis of the INDCs, download the report: How ambitious are the post-2020 targets?
Source: Bloomberg New Energy Finance
South Korea, Brazil, Mexico
and South Africa’s targets are
among the most ambitious
India, China and the EU’s targets
are among the least ambitious
COP21: 10 Things the Negotiators Need to Know – 23 November 2015
4
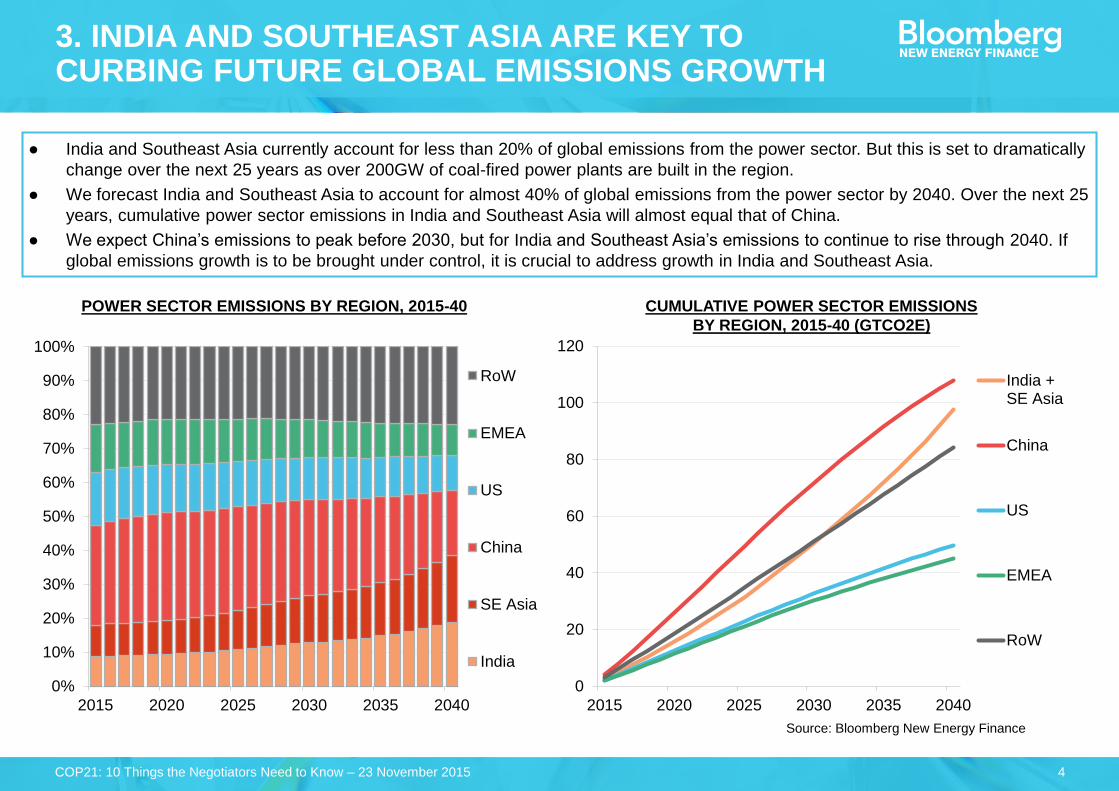
3. INDIA AND SOUTHEAST ASIA ARE KEY TO CURBING FUTURE GLOBAL EMISSIONS GROWTH
● India and Southeast Asia currently account for less than 20% of global emissions from the power sector. But this is set to dramatically
change over the next 25 years as over 200GW of coal-fired power plants are built in the region.
● We forecast India and Southeast Asia to account for almost 40% of global emissions from the power sector by 2040. Over the next 25
years, cumulative power sector emissions in India and Southeast Asia will almost equal that of China.
● We expect China’s emissions to peak before 2030, but for India and Southeast Asia’s emissions to continue to rise through 2040. If
global emissions growth is to be brought under control, it is crucial to address growth in India and Southeast Asia.
0%
10%
20%
30%
40%
50%
60%
70%
80%
90%
100%
2015 2020 2025 2030 2035 2040
RoW
EMEA
US
China
SE Asia
India
0
20
40
60
80
100
120
2015 2020 2025 2030 2035 2040
India +SE Asia
China
US
EMEA
RoW
Source: Bloomberg New Energy Finance
POWER SECTOR EMISSIONS BY REGION, 2015-40 CUMULATIVE POWER SECTOR EMISSIONS
BY REGION, 2015-40 (GTCO2E)
COP21: 10 Things the Negotiators Need to Know – 23 November 2015
5
0.1
1
10
100
1 10 100 1,000 10,000 100,000 1,000,000
Experience curve Historic prices (Maycock) Chinese c-Si module prices (BNEF)
1976
1985
2003
2012
Cumulative capacity (MW)
2015
Source: Bloomberg New Energy Finance, Paul MaycockSource: Bloomberg New Energy Finance, Lawrence Berkeley National
Laboratory, ExTool study (Neij et al, 2003), Vestas annual reports
Note: data is inflation corrected to 2014 prices
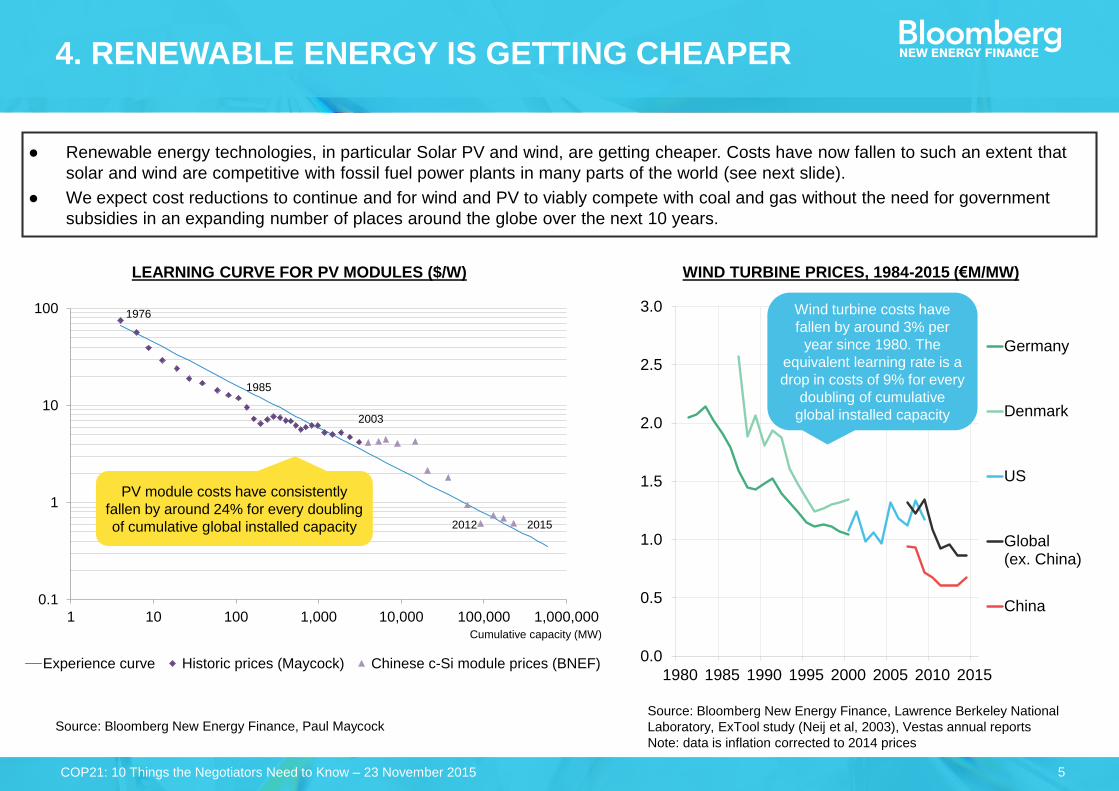
4. RENEWABLE ENERGY IS GETTING CHEAPER
● Renewable energy technologies, in particular Solar PV and wind, are getting cheaper. Costs have now fallen to such an extent that
solar and wind are competitive with fossil fuel power plants in many parts of the world (see next slide).
● We expect cost reductions to continue and for wind and PV to viably compete with coal and gas without the need for government
subsidies in an expanding number of places around the globe over the next 10 years.
0.0
0.5
1.0
1.5
2.0
2.5
3.0
1980 1985 1990 1995 2000 2005 2010 2015
Germany
Denmark
US
Global(ex. China)
China
LEARNING CURVE FOR PV MODULES ($/W) WIND TURBINE PRICES, 1984-2015 (€M/MW)
PV module costs have consistently
fallen by around 24% for every doubling
of cumulative global installed capacity
Wind turbine costs have
fallen by around 3% per
year since 1980. The
equivalent learning rate is a
drop in costs of 9% for every
doubling of cumulative
global installed capacity
COP21: 10 Things the Negotiators Need to Know – 23 November 2015
6
Source: Bloomberg New Energy Finance
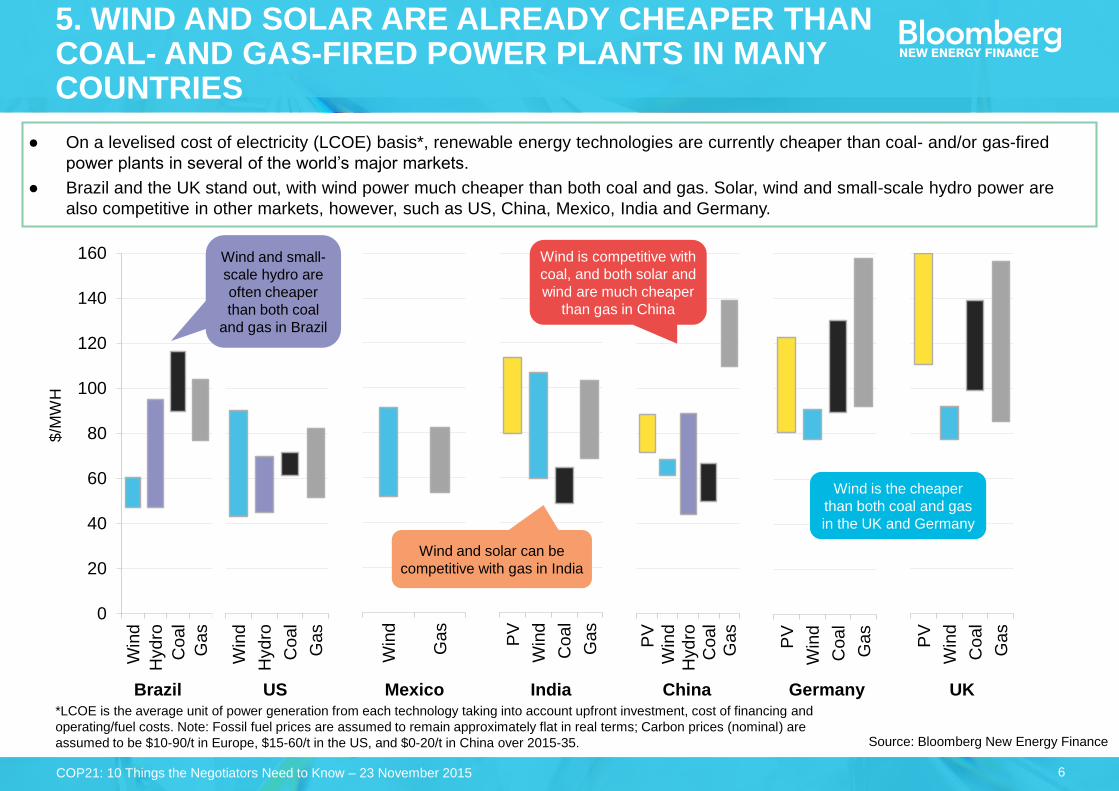
5. WIND AND SOLAR ARE ALREADY CHEAPER THAN COAL- AND GAS-FIRED POWER PLANTS IN MANY COUNTRIES
● On a levelised cost of electricity (LCOE) basis*, renewable energy technologies are currently cheaper than coal- and/or gas-fired
power plants in several of the world’s major markets.
● Brazil and the UK stand out, with wind power much cheaper than both coal and gas. Solar, wind and small-scale hydro power are
also competitive in other markets, however, such as US, China, Mexico, India and Germany.
*LCOE is the average unit of power generation from each technology taking into account upfront investment, cost of financing and
operating/fuel costs. Note: Fossil fuel prices are assumed to remain approximately flat in real terms; Carbon prices (nominal) are
assumed to be $10-90/t in Europe, $15-60/t in the US, and $0-20/t in China over 2015-35.
0
20
40
60
80
100
120
140
160
Win
d
Hydro
Coal
Gas
Brazil
PV
Win
d
Hydro
Coal
Gas
China
PV
Win
d
Coal
Gas
Germany
PV
Win
d
Coal
Gas
India
Win
d
Gas
Mexico
PV
Win
d
Coal
Gas
UK
Win
d
Hydro
Coal
Gas
US
$/M
WH
Wind and small-
scale hydro are
often cheaper
than both coal
and gas in Brazil
Wind and solar can be
competitive with gas in India
Wind is competitive with
coal, and both solar and
wind are much cheaper
than gas in China
Wind is the cheaper
than both coal and gas
in the UK and Germany
COP21: 10 Things the Negotiators Need to Know – 23 November 2015
7
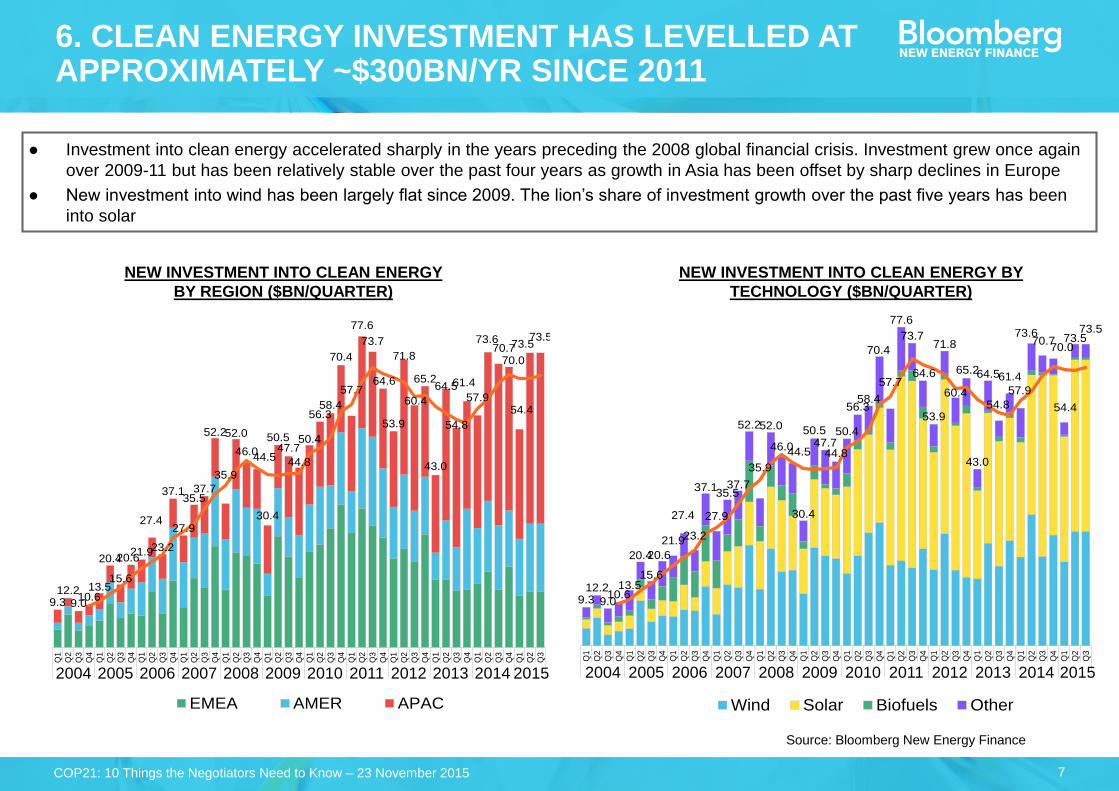
6. CLEAN ENERGY INVESTMENT HAS LEVELLED AT APPROXIMATELY ~$300BN/YR SINCE 2011
● Investment into clean energy accelerated sharply in the years preceding the 2008 global financial crisis. Investment grew once again
over 2009-11 but has been relatively stable over the past four years as growth in Asia has been offset by sharp declines in Europe
● New investment into wind has been largely flat since 2009. The lion’s share of investment growth over the past five years has been
into solar
9.312.2
9.010.6
13.5
20.4
15.6
20.621.9
27.4
23.2
37.1
27.9
35.537.7
52.2
35.9
52.0
46.044.5
30.4
50.547.7
44.8
50.4
56.358.4
70.4
57.7
77.6
73.7
64.6
53.9
71.8
60.4
65.2
43.0
64.5
54.8
61.4
57.9
73.670.7
70.0
54.4
73.573.5
Q1
Q2
Q3
Q4
Q1
Q2
Q3
Q4
Q1
Q2
Q3
Q4
Q1
Q2
Q3
Q4
Q1
Q2
Q3
Q4
Q1
Q2
Q3
Q4
Q1
Q2
Q3
Q4
Q1
Q2
Q3
Q4
Q1
Q2
Q3
Q4
Q1
Q2
Q3
Q4
Q1
Q2
Q3
Q4
Q1
Q2
Q3
2004 2005 2006 2007 2008 2009 2010 2011 2012 2013 2014 2015
EMEA AMER APAC
2004 2005 2006 2007 2008 2009 2010 2011 2012 2013 2014 2015
9.312.2
9.010.6
13.5
20.4
15.6
20.6
21.9
27.4
23.2
37.1
27.9
35.537.7
52.2
35.9
52.0
46.044.5
30.4
50.547.7
44.8
50.4
56.358.4
70.4
57.7
77.6
73.7
64.6
53.9
71.8
60.4
65.2
43.0
64.5
54.8
61.4
57.9
73.670.7
70.0
54.4
73.573.5
Q1
Q2
Q3
Q4
Q1
Q2
Q3
Q4
Q1
Q2
Q3
Q4
Q1
Q2
Q3
Q4
Q1
Q2
Q3
Q4
Q1
Q2
Q3
Q4
Q1
Q2
Q3
Q4
Q1
Q2
Q3
Q4
Q1
Q2
Q3
Q4
Q1
Q2
Q3
Q4
Q1
Q2
Q3
Q4
Q1
Q2
Q3
2004 2005 2006 2007 2008 2009 2010 2011 2012 2013 2014 2015
Wind Solar Biofuels Other
2004 2005 2006 2007 2008 2009 2010 2011 2012 2013 2014 2015
NEW INVESTMENT INTO CLEAN ENERGY
BY REGION ($BN/QUARTER)
NEW INVESTMENT INTO CLEAN ENERGY BY
TECHNOLOGY ($BN/QUARTER)
Source: Bloomberg New Energy Finance
COP21: 10 Things the Negotiators Need to Know – 23 November 2015
8
Source: Bloomberg New Energy Finance
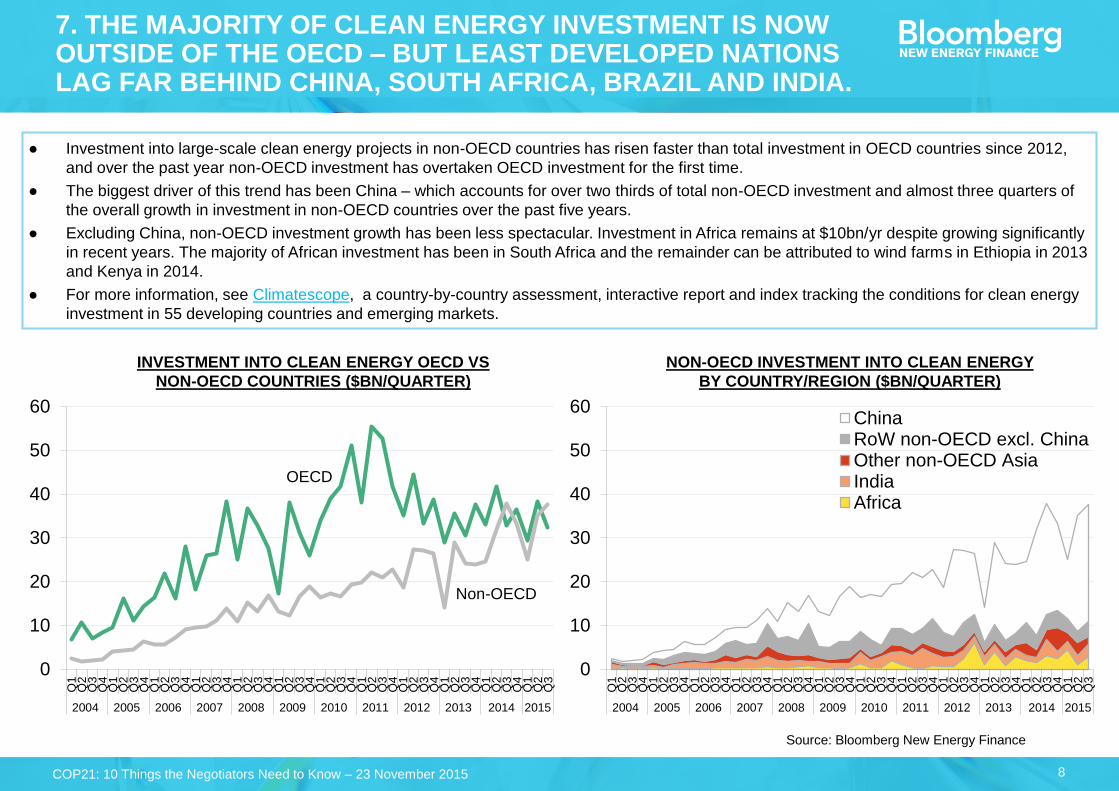
7. THE MAJORITY OF CLEAN ENERGY INVESTMENT IS NOW OUTSIDE OF THE OECD – BUT LEAST DEVELOPED NATIONS LAG FAR BEHIND CHINA, SOUTH AFRICA, BRAZIL AND INDIA.
● Investment into large-scale clean energy projects in non-OECD countries has risen faster than total investment in OECD countries since 2012,
and over the past year non-OECD investment has overtaken OECD investment for the first time.
● The biggest driver of this trend has been China – which accounts for over two thirds of total non-OECD investment and almost three quarters of
the overall growth in investment in non-OECD countries over the past five years.
● Excluding China, non-OECD investment growth has been less spectacular. Investment in Africa remains at $10bn/yr despite growing significantly
in recent years. The majority of African investment has been in South Africa and the remainder can be attributed to wind farms in Ethiopia in 2013
and Kenya in 2014.
● For more information, see Climatescope, a country-by-country assessment, interactive report and index tracking the conditions for clean energy
investment in 55 developing countries and emerging markets.
INVESTMENT INTO CLEAN ENERGY OECD VS
NON-OECD COUNTRIES ($BN/QUARTER)
NON-OECD INVESTMENT INTO CLEAN ENERGY
BY COUNTRY/REGION ($BN/QUARTER)
0
10
20
30
40
50
60
Q1
Q2
Q3
Q4
Q1
Q2
Q3
Q4
Q1
Q2
Q3
Q4
Q1
Q2
Q3
Q4
Q1
Q2
Q3
Q4
Q1
Q2
Q3
Q4
Q1
Q2
Q3
Q4
Q1
Q2
Q3
Q4
Q1
Q2
Q3
Q4
Q1
Q2
Q3
Q4
Q1
Q2
Q3
Q4
Q1
Q2
Q3
2004 2005 2006 2007 2008 2009 2010 2011 2012 2013 2014 2015
0
10
20
30
40
50
60
Q1
Q2
Q3
Q4
Q1
Q2
Q3
Q4
Q1
Q2
Q3
Q4
Q1
Q2
Q3
Q4
Q1
Q2
Q3
Q4
Q1
Q2
Q3
Q4
Q1
Q2
Q3
Q4
Q1
Q2
Q3
Q4
Q1
Q2
Q3
Q4
Q1
Q2
Q3
Q4
Q1
Q2
Q3
Q4
Q1
Q2
Q3
2004 2005 2006 2007 2008 2009 2010 2011 2012 2013 2014 2015
ChinaRoW non-OECD excl. ChinaOther non-OECD AsiaIndiaAfrica
OECD
Non-OECD
COP21: 10 Things the Negotiators Need to Know – 23 November 2015
9
0
10
20
30
40
50
60
2004 2005 2006 2007 2008 2009 2010 2011 2012 2013 2014
South-South
North-South
North-North
0
10
20
30
40
50
60
2004 2005 2006 2007 2008 2009 2010 2011 2012 2013 2014
0
10
20
30
40
50
60
2004 2005 2006 2007 2008 2009 2010 2011 2012 2013 2014
Source: Bloomberg New Energy Finance
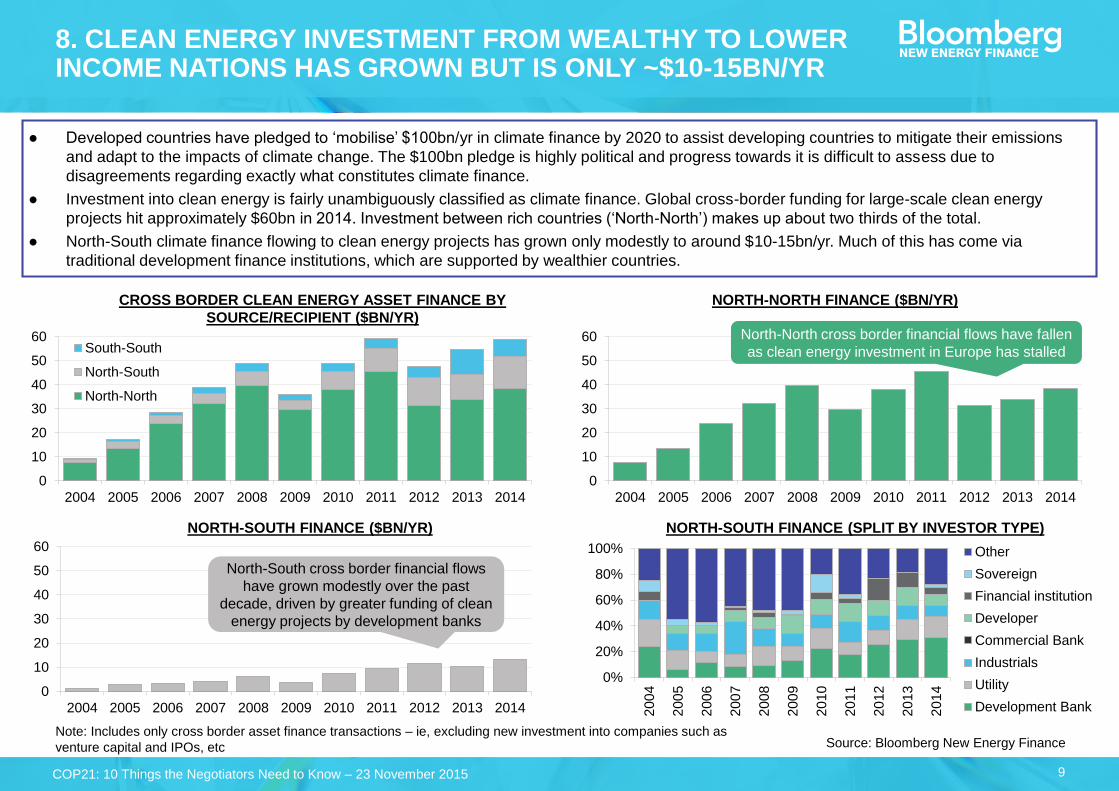
8. CLEAN ENERGY INVESTMENT FROM WEALTHY TO LOWER INCOME NATIONS HAS GROWN BUT IS ONLY ~$10-15BN/YR
● Developed countries have pledged to ‘mobilise’ $100bn/yr in climate finance by 2020 to assist developing countries to mitigate their emissions
and adapt to the impacts of climate change. The $100bn pledge is highly political and progress towards it is difficult to assess due to
disagreements regarding exactly what constitutes climate finance.
● Investment into clean energy is fairly unambiguously classified as climate finance. Global cross-border funding for large-scale clean energy
projects hit approximately $60bn in 2014. Investment between rich countries (‘North-North’) makes up about two thirds of the total.
● North-South climate finance flowing to clean energy projects has grown only modestly to around $10-15bn/yr. Much of this has come via
traditional development finance institutions, which are supported by wealthier countries.
Note: Includes only cross border asset finance transactions – ie, excluding new investment into companies such as
venture capital and IPOs, etc
CROSS BORDER CLEAN ENERGY ASSET FINANCE BY
SOURCE/RECIPIENT ($BN/YR)
NORTH-NORTH FINANCE ($BN/YR)
NORTH-SOUTH FINANCE ($BN/YR) NORTH-SOUTH FINANCE (SPLIT BY INVESTOR TYPE)
COP21: 10 Things the Negotiators Need to Know – 23 November 2015
North-North cross border financial flows have fallen
as clean energy investment in Europe has stalled
North-South cross border financial flows
have grown modestly over the past
decade, driven by greater funding of clean
energy projects by development banks
0%
20%
40%
60%
80%
100%
2004
2005
2006
2007
2008
2009
2010
2011
2012
2013
2014
Other
Sovereign
Financial institution
Developer
Commercial Bank
Industrials
Utility
Development Bank
10
50%
100%
150%
200%
250%
2015 2020 2025 2030 2035 2040
50%
100%
150%
200%
250%
2015 2020 2025 2030 2035 2040
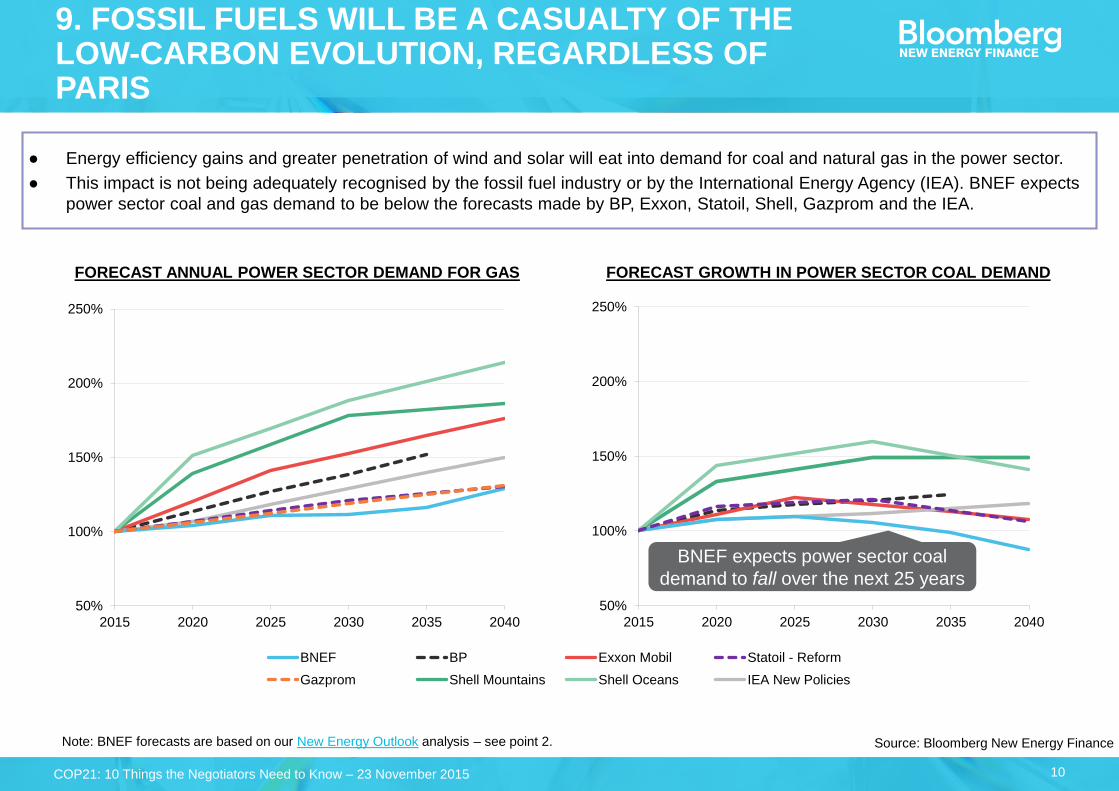
9. FOSSIL FUELS WILL BE A CASUALTY OF THE LOW-CARBON EVOLUTION, REGARDLESS OF PARIS
● Energy efficiency gains and greater penetration of wind and solar will eat into demand for coal and natural gas in the power sector.
● This impact is not being adequately recognised by the fossil fuel industry or by the International Energy Agency (IEA). BNEF expects
power sector coal and gas demand to be below the forecasts made by BP, Exxon, Statoil, Shell, Gazprom and the IEA.
Source: Bloomberg New Energy Finance
FORECAST ANNUAL POWER SECTOR DEMAND FOR GAS FORECAST GROWTH IN POWER SECTOR COAL DEMAND
BNEF expects power sector coal
demand to fall over the next 25 years
Note: BNEF forecasts are based on our New Energy Outlook analysis – see point 2.
0%50%100%150%200%250%
2015 2020 2025 2030 2035 2040
BNEF BP Exxon Mobil Statoil - Reform
Gazprom Shell Mountains Shell Oceans IEA New Policies
COP21: 10 Things the Negotiators Need to Know – 23 November 2015
11
Source: Bloomberg New Energy Finance
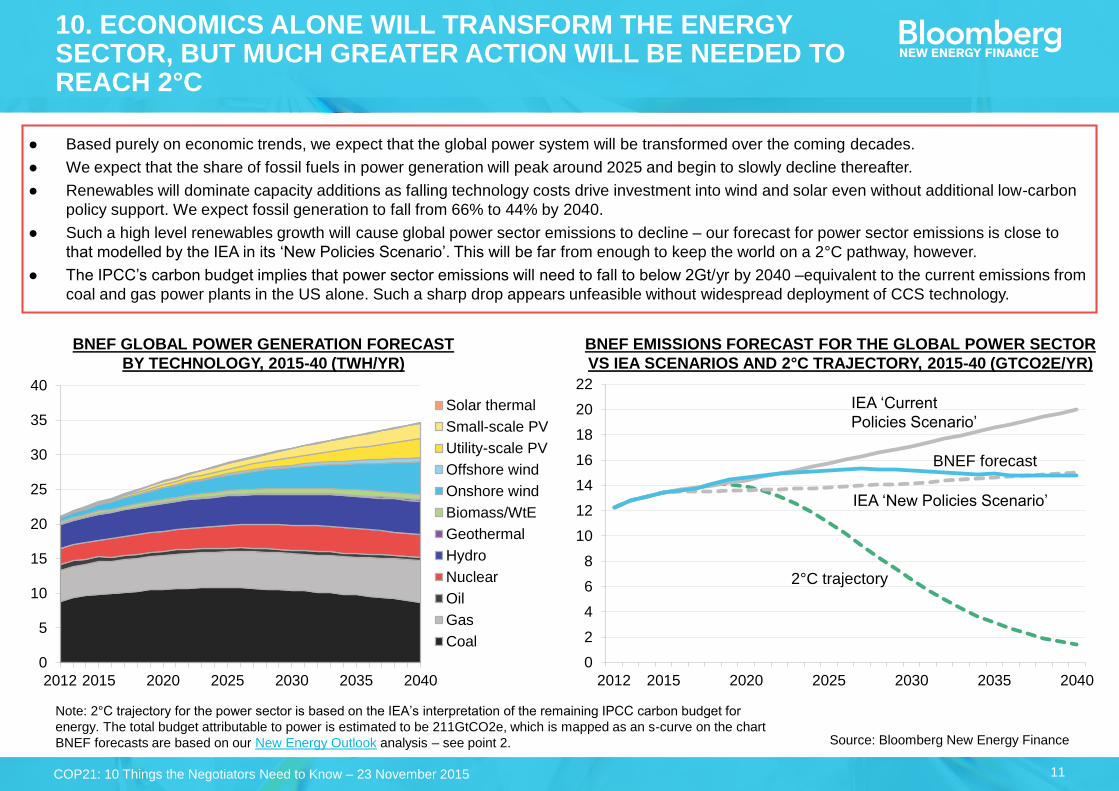
10. ECONOMICS ALONE WILL TRANSFORM THE ENERGY SECTOR, BUT MUCH GREATER ACTION WILL BE NEEDED TO REACH 2°C
● Based purely on economic trends, we expect that the global power system will be transformed over the coming decades.
● We expect that the share of fossil fuels in power generation will peak around 2025 and begin to slowly decline thereafter.
● Renewables will dominate capacity additions as falling technology costs drive investment into wind and solar even without additional low-carbon
policy support. We expect fossil generation to fall from 66% to 44% by 2040.
● Such a high level renewables growth will cause global power sector emissions to decline – our forecast for power sector emissions is close to
that modelled by the IEA in its ‘New Policies Scenario’. This will be far from enough to keep the world on a 2°C pathway, however.
● The IPCC’s carbon budget implies that power sector emissions will need to fall to below 2Gt/yr by 2040 –equivalent to the current emissions from
coal and gas power plants in the US alone. Such a sharp drop appears unfeasible without widespread deployment of CCS technology.
Note: 2°C trajectory for the power sector is based on the IEA’s interpretation of the remaining IPCC carbon budget for
energy. The total budget attributable to power is estimated to be 211GtCO2e, which is mapped as an s-curve on the chart
BNEF forecasts are based on our New Energy Outlook analysis – see point 2.
0
5
10
15
20
25
30
35
40
2012 2015 2020 2025 2030 2035 2040
Solar thermal
Small-scale PV
Utility-scale PV
Offshore wind
Onshore wind
Biomass/WtE
Geothermal
Hydro
Nuclear
Oil
Gas
Coal
BNEF GLOBAL POWER GENERATION FORECAST
BY TECHNOLOGY, 2015-40 (TWH/YR)
BNEF EMISSIONS FORECAST FOR THE GLOBAL POWER SECTOR
VS IEA SCENARIOS AND 2°C TRAJECTORY, 2015-40 (GTCO2E/YR)
0
2
4
6
8
10
12
14
16
18
20
22
2012 2015 2020 2025 2030 2035 2040
BNEF forecast
IEA ‘Current
Policies Scenario’
2°C trajectory
IEA ‘New Policies Scenario’
COP21: 10 Things the Negotiators Need to Know – 23 November 2015
12
This publication is the copyright of Bloomberg New Energy Finance. No portion of this document may be photocopied,
reproduced, scanned into an electronic system or transmitted, forwarded or distributed in any way without prior consent of
Bloomberg New Energy Finance.
The information contained in this publication is derived from carefully selected sources we believe are reasonable. We do
not guarantee its accuracy or completeness and nothing in this document shall be construed to be a representation of such
a guarantee. Any opinions expressed reflect the current judgment of the author of the relevant article or features, and does
not necessarily reflect the opinion of Bloomberg New Energy Finance, Bloomberg Finance L.P., Bloomberg L.P. or any of
their affiliates ("Bloomberg"). The opinions presented are subject to change without notice. Bloomberg accepts no
responsibility for any liability arising from use of this document or its contents. Nothing herein shall constitute or be
construed as an offering of financial instruments, or as investment advice or recommendations by Bloomberg of an
investment strategy or whether or not to "buy," "sell" or "hold" an investment.
COPYRIGHT AND DISCLAIMER
Unique analysis, tools and data for decision-makers
driving change in the energy system
MARKETS Renewable Energy
Energy Smart Technologies
Advanced Transport
Gas
Carbon and RECs
SERVICESAmericas Service
Asia Pacific Service
EMEA Service
Applied Research
Events and Workshops
Richard Chatterton, CFA