Embed Size (px)
Citation preview

Coordination of Data Elements from the DOT Management Systems Page i
COORDINATION OF DATA
ELEMENTS FROM THE DOT MANAGEMENT SYSTEMS�
Prepared for
Iowa Department of Transportation
Prepared by Center for Transportation Research and Education
an Iowa State University Center
Final Draft - May 8, 1997

Coordination of Data Elements from the DOT Management Systems Page ii
Coordination of Data Elements from the DOT Management Systems
Prepared for Iowa Department of Transportation
Prepared by Center for Transportation Research and Education
Iowa State University Iowa State University Research Park 2625 North Loop Drive, Suite 2100
Ames, IA 50010-8615
Principal Investigator Reginald R. Souleyrette
Project Manager
Marilyn Kuntemeyer
Graduate Assistants Michael Anderson
Dan Gieseman
May 1997

Coordination of Data Elements from the DOT Management Systems Page iii
Table of Contents i. Executive Summary I. Introduction - Objectives of the coordinated database Page 1 II. Methodology for developing the database Page 2
1. Identification of Data Elements to be Included in Database Page 2 a. Focus group discussion Page 2 b. Data flow diagram Page 2 c. Follow-up interviews for specific management systems Page 4
2. Selection of Pilot Areas Page 4 III. Construction of the database Page 7
1. Software Platform Page 7 a. Criteria for selection Page 7 b. Performance characteristics of the selected software Page 7
2. Data Records Requested From Iowa DOT Page 8 a. Metadata of database files Page 9 b. Bridge Management System Page 9 c. Congestion Management System Page 9 d. Intermodal Management System Page 9 e. Maintenance Management System Page 9 f. Pavement Management System Page 9 g. Public Transportation Management System Page 10 h. Safety Management System Page 10 i. Traffic Monitoring Management System Page 10 j. Other data requested Page 10 k. Summary Page 10
3. Flow Charts of Individual Database Table Construction Page 11 IV. Testing and applications of the database Page 20
1. Description of User Instructions Page 20 2. Comments from Potential Users Page 20 3. Applications Page 21
V. Relationship with other research and planning efforts Page 24 1. Iowa in Motion Page 24 2. Statewide Transportation Modeling for Freight Page 24 3. Coordination among GIS-Related Projects Page 24
a. GIS Pilot Projects Page 24 b. GIS-ALAS Page 25 c. Attribution of Cartography Page 25 d. Base Record Redesign Page 25 e. Iowa Pavement Management Program Page 25
VI. Conclusions Page 27 1. Statewide Implementation Page 27 2. Updates and Maintenance of a Statewide GIS Database Page 27 3. Summary and Recommendations Page 29
i.

Coordination of Data Elements from the DOT Management Systems Page iv
Executive Summary
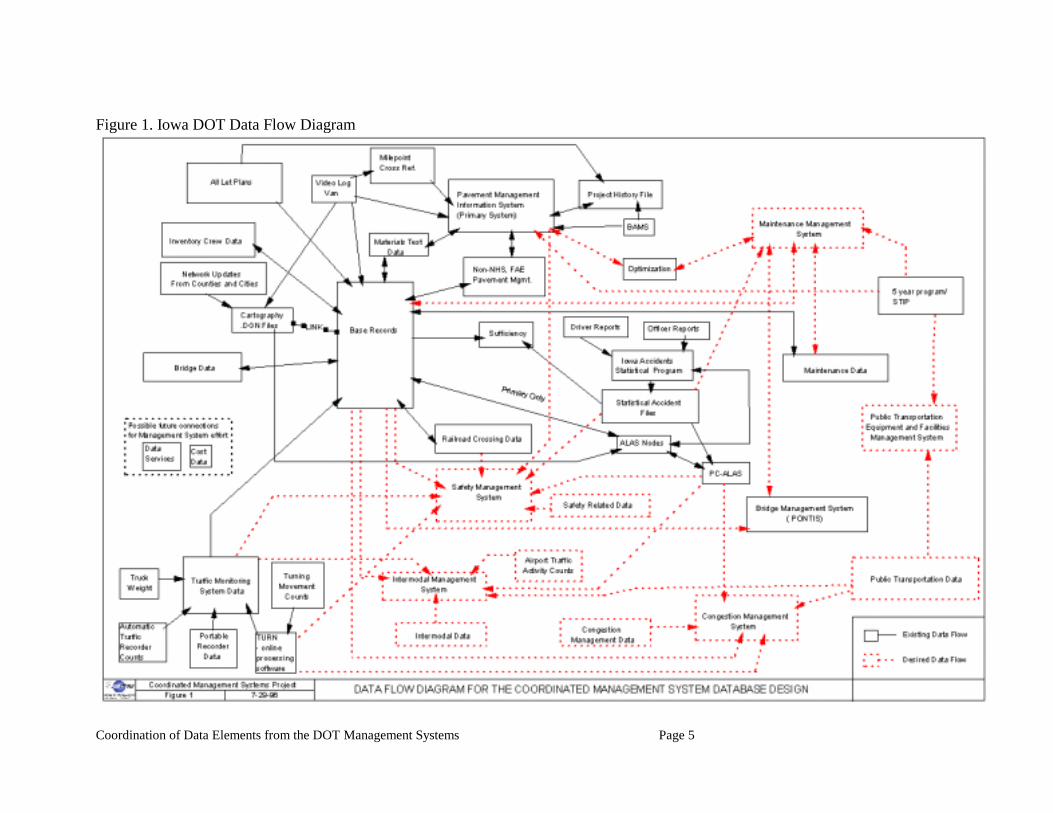
Objective: This study designed and developed a coordinated database to provide a graphic link to many relevant datasets at the Iowa Department of Transportation (DOT), so that policy makers and managers can consider multiple functional areas and analyze resulting implications when making decisions. In order to support decision-making at the Iowa DOT, this database combines information from the management systems including Pavement, Bridge, Safety, Congestion, Public Transportation, Intermodal, Traffic Monitoring, and Maintenance. Further objectives of the study effort were to provide all information in a user friendly environment with easy access, to build on other research and database efforts, to evaluate mechanisms for long term support of the database, and to supply a decision-making tool not currently available. Methodology: Major elements to be included in the database were identified through a focus group process representing each management system team (see Table 1), and specific database items can be seen in Appendix A. Before developing the database, a Geographic Information System (GIS) platform was chosen. Using the criteria of cost, availability, hardware requirements and software capabilities, MapInfo was chosen as this platform. To develop the database, existing DOT data were exported and incorporated into the MapInfo GIS environment. As one charge of the project was to develop a prototype, working system, the Waterloo and Des Moines areas were identified for initial database development and testing (including the surrounding Regional Planning Affiliation areas, RPA 7 and RPA 11). The determination of these pilot areas was primarily based on two criteria (urban areas with congestion management systems and participation in the Iowa DOT statewide pavement management project). Table 2 depicts the full selection criteria and candidate locations. Results: An early contribution of the project was the development of a Department-wide data flow diagram. This diagram, implemented as an internet based (www.ctre.iastate.edu) image map (see Figure 1), allows users to examine the relationships between key, DOT databases, and by point and click, better understand the composition and relationships between data sets. Appendix A of the report contains a full explanation of data flow diagram components, should internet access not be available. A working prototype database was developed and presented in MapInfo format on a single CD-ROM for the two study areas. The database encompasses data elements for each of the management system efforts and provides a base of reference (or base-map) with graphic layers representing streets, highways and other useful referencing features (rivers, corporate limits). All files have standard formats and filenames which allows different users to identify and understand the data they are viewing. All files are documented with source, key information required to join data tables, and whether the file is graphical or text-only. Specific documentation (metadata) for each item in the database is also included. User friendly query capabilities (predefined queries) have been developed for selected functions. For example, users not familiar with MapInfo procedures can display data from the bridge management system by hitting one icon on the computer screen. Appendix B shows selected GIS-based data outputs and user screens.

Coordination of Data Elements from the DOT Management Systems Page v
Conclusions: The GIS designed in this project includes all datasets mentioned above and displays diverse datasets conveniently. Previously many of these data sets were available only in printed form or on the mainframe computer, and no such display methods were available. To use the database, a user must have MapInfo software. Users can then also access all general MapInfo features and options in addition to predefined queries, making the system both powerful and flexible. If a user does not wish to use MapInfo, data from the system can easily be imported into one of several other GIS formats. A limitation is that the system contains a static version of its information (not real time). Regular maintenance and updates must be provided. Table 6 provides preliminary estimates of maintenance frequency and time commitments. A concern is that users may modify the databases resulting in "orphan" copies of data. To discourage this, policies must be established for providing feedback to original keepers of the data so that corrections/updates can be reflected in future versions of the system. All procedures used for conversion of data sets to the GIS environment have been well documented in this research effort so that updates can be efficiently accomplished. The database was designed considering other GIS efforts of the Iowa DOT and could potentially benefit other research and planning efforts. For example, statewide transportation freight planning is the focus of one research effort, and the freight planning project could be enhanced with the availability of this type of coordinated database. In addition, various elements of the database could be used in the modal plans proposed as part of Iowa in Motion, the statewide transportation plan. Recommendations: Two pilot areas are now complete, and based on comments from potential users, it is recommended that the Iowa DOT pursue statewide implementation, increasing the utility of the system. An integrated GIS database of this type will provide an excellent starting point for the GIS staff (Coordinator and Database Administrator) that the Department will be hiring shortly. With an integrated database in place, DOT GIS staff could focus efforts on the identification of useful applications within the Department. For example, consideration could be given to incorporating land use elements for improved coordination between planning decisions of local governments and design considerations on the state highway system. Time required to complete statewide implementation is estimated at up to 52 person-weeks to incorporate all datasets, implement query capabilities and document procedures and data. Frequency of updates would range from three months to once per year depending on data type (see Table 6), with annual updates provided on CD ROM and quarterly updates provided via the internet. Approximately 26 person weeks of staff time would be required to perform quarterly and annual updates, track user suggestions for updating the data, produce CD ROMs and internet updates, provided export versions of data, and provide for continuous improvement of functionality.

Coordination of Data Elements from the DOT Management Systems Page 1
I. INTRODUCTION - OBJECTIVES OF THE COORDINATED DATABASE
The Iowa Department of Transportation (Iowa DOT) established Work Plans in 1994 for the development of the following systems as required by the Intermodal Surface Transportation Efficiency Act (ISTEA) of 1991: { Pavement Management System { Bridge Management System { Highway Safety Management System { Congestion Management System { Public Transportation Facilities and Equipment Management System { Intermodal Management System { Traffic Monitoring System In addition to the management systems from ISTEA, the Iowa DOT has begun development of a Maintenance Management System. As each of the management systems were developed, questions arose about duplication of efforts and requirements for data sharing. The Iowa DOT requested the establishment of a coordinated database designed to support the investment decisions of the department and local governments for future investment decisions in the State of Iowa. The Center for Transportation Research and Education (CTRE) at Iowa State University began work on establishing the coordinated database in April 1996, and followed a scope of work with the following major tasks: { Identification of common data elements for database coordination { Design of coordinated database to accomplish goals and objectives { Selection of pilot areas for the testing of system design { Determination of common accuracy levels { Establishment of database access and maintenance levels { Implementation of database for selected pilot areas { Testing of system This report documents the results of this research effort and presents recommendations to the Iowa DOT on future deployment of the database.

Coordination of Data Elements from the DOT Management Systems Page 2
II. METHODOLOGY FOR DEVELOPING THE DATABASE
1. Identification of Data Elements to be Included in Database Data elements to be included in the database design were identified through discussions with Iowa DOT staff who had been involved with the development of each of the management systems. The following sections describe this process. a. Focus group discussion To initiate discussion about data elements to be included in the database design, the CTRE research team invited Iowa DOT staff to participate in a focus group discussion. DOT staff from the following areas participated in the focus group discussion: { Bridge { Systems Planning { Maintenance { Maintenance Support { Pavement Management { District Planning { Transportation Data { Traffic Safety The data elements identified by the focus group were classified into general areas (see Appendix A) and are summarized in Table 1 by theme. b. Data flow diagram Following the focus group meeting with representatives from all the management systems, the project team conducted interviews as needed to understand and sort the multitude of data elements requested for each of the management systems. Information was sought regarding: { the source of data { which divisions collected and maintained certain data elements { the direction that data flowed between management systems { where data resided within the DOT In this interview process, the project team determined that many of the data elements requested are currently available in the Iowa DOT's collection of files known as the base record system. The base record database is currently stored on a mainframe computer system and contains records utilized by each of the management areas and was chosen as the starting point of the sorting and understanding process.

Coordination of Data Elements from the DOT Management Systems Page 1
Table 1. Summary Matrix of Common Data Elements Among Management Systems
General Grouping of Data Elements
Mainten. Safety Pavement Congestion Intermodal Public Transport.
Traffic Monitoring
Bridge Num.
Traffic 7 Traffic Estimates 2
Programming 3 Travel Time 2
Incident Response 2 Roadside Structures 5
Intermodal 2 Accidents 6
Bridge Data 4 Roadway Conditions 6
Travel Demand Manag. 4 Maintenance Activities 2 Traffic Control Devices 4
Public Transit 2

Coordination of Data Elements from the DOT Management Systems Page 4
At the conclusion of the interview process, a data flow diagram was created and shown to individuals involved in developing the management systems. Figure 1 displays the final data flow diagram. Explanations of all terms shown on Figure 1 are given in Appendix A. c. Follow-up interviews for specific management systems To ensure that the project team fully understood the manner in which data are collected and exchanged by management systems, several follow-up interviews were held with individual Management System staff at the DOT. These follow-up meetings were very beneficial towards ensuring that files were complete and that files contained the data requested. 2. Selection of Pilot Areas The scope of work for this project called for testing the database within a selected pilot area (or areas). The principal requirements for data availability that were considered to be most important in deciding the pilot area location were: { Participation in the non-NHS Iowa Pavement Management Program during 1996 { Participation of a Metropolitan Planning Organization (MPO) in the Congestion Management System (CMS) { Consideration given to deployment of Intelligent Transportation Systems (ITS) technologies Participation in the non-NHS Iowa Pavement Management Program (IPMP) during 1996 assisted in testing the system design of the coordinated database because substantial effort would have been required to link the cartography files for mapping and base records. CTRE had already begun the linkage between cartography and base records for the areas participating in the non-NHS IPMP as part of another research project, and this task had included the mapping corrections that have been required as part of this effort. A cost-effective product was provided by building from GIS database efforts that have already begun through the pavement management project. Since the objective of the project was to design a coordinated database for all of the management systems, CTRE staff recommended that the selected pilot area be a participant in the CMS so that the database design could be tested for CMS data elements. Therefore, the areas of the state with no MPO participation in the CMS were not included for further consideration as a pilot area. CTRE also included participation in an ITS Early Deployment Study as one of the evaluation categories since a coordinated GIS database could help with the implementation of ITS technologies in those areas that are considering ITS deployment. The project team recommended that selection of a pilot area implementing ITS in the near future would help the Iowa DOT achieve objectives for ITS infrastructure. For the Des Moines metropolitan area, building a GIS database had already begun as part of the ITS Early Deployment Study that was underway.
Coordination of Data Elements from the DOT Management Systems Page 5
Figure 1. Iowa DOT Data Flow Diagram

Coordination of Data Elements from the DOT Management Systems Page 6
Since building a GIS database had already begun for the Des Moines area, the project budget could support testing the database design in the Des Moines area plus one other area. Before choosing the "areas", "areas" needed to be defined. Possible area types were metropolitan area, county, Regional Planning Affiliation (RPA), or Iowa DOT Transportation Centers. Choosing metropolitan areas would omit rural data considerations, and as some metropolitan areas consist of multiple counties, metrpolitan or county level pilot areas were not considered. On the other hand, transporatation Centers were considered to be too large (only six in the state) and could contain more than one large metropolitan area. Therefore, the state's 18 RPAs were considered as candidate pilot locations. Of the RPAs shown in Table 2, CTRE recommended that RPA 7 (Waterloo area) be selected as the pilot area. Linking of the cartography files and base records in the pavement management project had been accomplished in RPA 6 and RPA 7, and the project team could start testing the database design without delay for these areas. Since RPA 6 did not have an urban area that would be participating in the CMS, this led CTRE to recommend that RPA 7 be used as a pilot area in addition to Des Moines and RPA 11 for testing the database design. Table 2 shows the matrix that was used for the selection of two pilot study areas for the testing of the database.
Table 2. Evaluation Matrix for Selection of Pilot Area --- in a shaded box indicates no MPO participation in the CMS - not included for consideration as a pilot area. * cartography for base records was most complete for RPAs 6 and 7 in pavement management project as of 7/96. ** GIS database had been initiated for the Des Moines metro area as part of the ITS Early Deployment Study.
RPA Number & Metropolitan Planning Organization (MPO)
Participation in Non-NHS Iowa Pavement Management
Program (IPMP) for 1996
Participation in Congestion Management System (CMS)
by MPO
Consideration of ITS through an Early
Deployment Study
1 No --- 2 Yes --- 3 Yes ---
4 - Sioux City Yes Yes 5 No --- 6 Yes* ---
7 – Waterloo Yes* Yes --- 8 – Dubuque Yes Yes ---
9 – Davenport Yes Yes --- 10 - Cedar Rapids & Iowa
City RPA & Iowa City - No
Cedar Rapids - Yes Yes ---
11 - Des Moines No Yes Yes** 12 Yes --- 13 No --- 14 Yes --- 15 Yes --- 16 No --- 17 No ---
18 - Council Bluffs Yes Yes Yes

Coordination of Data Elements from the DOT Management Systems Page 7
III. CONSTRUCTION OF THE DATABASE
1. Software Platform Because the majority of data collected by the individual management systems was spatially referenced, a geographic information system (GIS) was chosen as the type of software that would be investigated to display and manipulate data elements. The data elements from the management systems were stored in several formats. This variety of formats demanded that any GIS software package be able to accommodate many data formats. a. Criteria for selection The principal criteria that the project team considered in recommending a GIS software platform for this project were: { Cost of the software package { Current availability to DOT staff and at the MPO/RPA level { Hardware requirements for running the software { Software capabilities for creating customized features MapInfo Professional was chosen as the primary GIS platform to be used. MapInfo was found to be readily available at many of the Iowa MPOs and RPAs and relatively inexpensive to obtain. In addition, because MapInfo is a desktop mapping system, the hardware requirements of such a system are easy to meet. MapInfo has the capability of being customized using the programming language called MapBasic. Many of the procedures used to create database coverages were automated by using MapInfo together with MapBasic. In addition to MapInfo, another GIS software package, ArcView, was tested for use with the database. ArcView has the ability to overlay tabular data on a dynamically segmented network. This was the primary reason ArcView was given consideration. Files were tested for compatibility with MapInfo and the ability to import DOT databases. There were no apparent problems. The use of ArcView was dropped from the project when a program was written in MapBasic that could overlay tabular data on the base primary network and be displayed graphically. This eliminated the need for ArcView's dynamic segmentation capabilities. b. Performance characteristics of the selected software A majority of the database manipulations and importing of files were done on a 150 MHz Pentium Pro computer utilizing Windows NT 3.51 operating system. At the time of completion of this document, this type of computer is at the high end of desktop hardware. At least a 486 is required to operate the database. All of the updating and importing of files proceeded smoothly except for the following large tables:

Coordination of Data Elements from the DOT Management Systems Page 8
{ BRROAD file from Transportation Data - this file contained over 65,000 records for RPA11 and required extensive time for manipulation and concatenation of columns. Combining four columns to produce the key fields required 30 minutes of updating for each of the four key fields necessary. This updating procedure was required only once and subsequent work with this table required much less time. A standard query will run in less than a minute. { RPA ALAS file importation - this file contained over 89,000 records for RPA 11 and was very cumbersome. The program which counted the accidents at each intersection within the RPA ran for approximately six hours. This counting procedure was required only once, and subsequent work with this table required much less time. A standard query will run in less than a minute. { Pavement Test Section data, Pavement History data, and 5 Year Program Data - these files required the use of the MapBasic program DYNA.MBX which overlaid the tabular data in these files on the graphical primary network. This process required as much as one hour per file. This updating procedure was required only once and subsequent work with these tables required much less time. A standard query will run in less than thirty seconds. 2. Data Records Requested From Iowa DOT The coordinated database was developed by importing tables from many different sources into a usable format for the GIS software. This process involved movement of data stored on a mainframe to a desktop computer. The first step in setting up any GIS database is the development of a base map. Cartography files from the Iowa DOT were used for the background layers of the base map. In addition, DOT Cartography files of base record segmentation were used to make up primary, secondary, and municipal layers. These layers were updated with the key fields necessary to join many of the Management System databases. For more information regarding the development of these base maps, see the specific flowchart for development of base record segment MapInfo cartography following this section. Next, data were requested from individual management systems in a text format. Data in a text format were manipulated in a text editor to fit a particular format that can be understood by the GIS software. For example, some of the text exports received did not include decimal points where they were necessary. To remedy this, a text editor with macro recording capability was used. By adding a few decimal points to a sample of lines in the file and recording the process, the computer can play back the process until it reaches the end of the file. In this manner, the file can have decimal points added in an efficient and timely fashion. Many files in text format did not need any manipulation in a text editor and were imported directly into MapInfo. More detailed information about the specific data and files requested for individual management systems follows.

Coordination of Data Elements from the DOT Management Systems Page 9
a. Metadata of database files Metadata are data regarding sources and column definitions. The metadata for the GIS were received from Iowa DOT in both hard copy and digital formats. The digital format was integrated into the GIS utilizing a Mapbasic program. This program enables the user to search the metadata database for information regarding any column the user may want to know more about. This includes information about the codes used in the database. For more information regarding the use of the metadata tool see the detailed user instructions for the GIS. b. Bridge Management System Structural Inventory and Appraisal (SI & A) data for bridges in the state and Supplemental Structural Inventory (SSI) for primary bridges only were requested and integrated for the Bridge Management System. These files contained information such as overall bridge condition, year constructed, and inspection year. The SI & A file was received from Transportation Data. The SSI file was received from the Maintenance Support Team. c. Congestion Management System Congestion management routes for the Des Moines MPO are included as map coverages. Travel time studies are being conducted along these routes by the Des Moines MPO, and the travel times can be added as the results become available. d. Intermodal Management System The location of intermodal terminals are mapped for areas in and around Des Moines. These locations were mapped as part of work done for the Intermodal Management System for the Iowa DOT by CTRE. In addition to terminal locations, connector routes to the National Highway System (NHS) are mapped for these terminals. e. Maintenance Management System The construction of the maintenance management system is ongoing. To facilitate joining of future data from the maintenance database, all cost center garage numbers are included as key fields for the primary segmentation. This will enable maintenance feature data and maintenance plan data to be joined to the database in the future. f. Pavement Management System The Pavement Management Information System files for the primary system were included as well as the Pavement History file for the primary system. These files contain condition data for all primary system segments such as Pavement Condition Index and International Roughness Index. The files also contain history data regarding origin of aggregates, type of aggregates, year of overlay, etc. Both of the Pavement Management System files were received from the Office of Design.

Coordination of Data Elements from the DOT Management Systems Page 10
g. Public Transportation Management System Data collected for the PTMS primarily deals with the inventory of equipment. Data is collected for this management system, but is not conducive to being mapped using a GIS. For this reason no data were requested from the PTMS. h. Safety Management System Cartography for the location of all Accident Location and Analysis System (ALAS) nodes within the study areas was generated and attributed with the proper node identification numbers. In addition to cartography, ALAS datafiles of accidents records for the study areas were converted to MapInfo format and a program was run to compute all accidents at intersections for the years 1989 to 1993. Accidents not occurring at intersections were not dealt with due to time constraints and the fact that another Iowa DOT/CTRE project is dealing with this much more complex issue. Cartography was created from edit files received from DOT Cartography. i. Traffic Monitoring Management System Average Annual Daily Traffic (AADT) information from base record files was included in the database. Total AADT, year counted information, and individual vehicle classification counts are stored. These data were received from Transportation Data. The data are a portion of the base record file named BRROAD. The remaining data within the BRROAD file are also included in the database. j. Other data requested In addition to data elements from specific management systems, the following data not associated with a particular management system were included: { 1995 Iowa Primary Road Sufficiency Log data { Five Year Program data { Three Year Statewide Transportation Improvement Plan data k. Summary Table 3 summarizes the files requested from the Iowa DOT for the coordinated database project. All files were requested at the RPA level.

Coordination of Data Elements from the DOT Management Systems Page 11
Table 3. Files Required for Construction of Coordinated Database
File Name Source Pavement History Pavement Management Pavement Test Section Pavement Management Bridge SI & A Transportation Data Bridge SSI Transportation Data Bridge Key / FHWA Transportation Data Accident Node Mapping Cartography Accident File Conversion PC-ALAS File BR ROAD Base Record File Transportation Data Sufficiency Systems Planning 3 Year STIP Program Management 5 Year Program Program Management Attributed Primary Coverage Cartography Attributed Secondary Coverage Cartography Attributed Municipal Coverage Cartography Development of Background Coverages Cartography
3. Flow Charts of Individual Database Table Construction The Coordinated Management Systems Database is comprised of many data tables originating from individual management systems and Transportation Data. Each file was created in a similar fashion, but certain unique procedures were used for creating some of the files. The following figures contain flow charts of the processes followed for the development of individual database files. Procedures are outlined as follows:
Table 4. Flow Chart Outline
Figure Process Shown 2 Development of Base Primary Network Mapping 3 Development of Secondary and Municipal Network Mapping 4 Instructions for the Importation of Text Files into MapInfo 5 Instructions for Joining Graphics to Base Record Data 6 Instructions for Overlaying Tabular (non-graphical) Data in MapInfo 7 Development of PC - ALAS Node Coverages 8 Development of PC - ALAS Data Files Within MapInfo 9 Development of Background Coverages

Coordination of Data Elements from the DOT Management Systems Page 12
Primary System information from
base records (key fields and coordinate values) (prims.dat)
FORTRAN program to remove additional
coordinates (basercrd.exe). Results in a file
containing the key information and beginning and
ending coordinates.
Text file with key elements and starting
and ending coordinates
(primsnew.txt)
Register the text file into MapInfo
MapInfo table for the primary base records
segments. Each segment has a unique
ID and coordinates.
This text file was provided by
Transportation Data, it is a variable length file
with the key information for the primary roads
and the coordinates for the segments in
cartography units of resolution.
Save the table as a new table (baserd2.tab). Create map and line
graphics for each base record segment in the
cartography units.
Creates a MapInfo table that contains the primary system
base records segments, each with a key field that can be used to attach any other
piece of base record information (traffic counts, roadway widths, surface
types)
Modify the table definition to
concatenate the key information into one field to
serve as the unique ID for each
segment.
This MapInfo table maps all of the base records for the primary
system and can have all the data from the base records attached to
the graphic elements.
This page illustrates the creation of the base primary network. The map linework for the primary network is created from a text file from transportation data. The resulting MapInfo coverage contains the location of each primary segment and a unique id key field that is used to join to database files.
Development of Base Primary NetworkFigure 2 Coordination of Data Elements From the DOT Management Systems Page 12

Coordination of Data Elements from the DOT Management Systems Page 13
Secondary roadway graphics were developed for the IPMP. The IPMP created an MGE project file that includes all the secondary roadway segments
and the key information needed to join the information to the base record data.
This information is being prepared by the IPMP. The key information include the county, township, section, range,
route #. This is the same key information associated with the secondary roadways on the base records.
The graphics were exported from MGE into a MapInfo table.
This table can be accessed in MapInfo and
displayed with the primary network developed in the previous slide.
The secondary table was saved
and modified such that the key
information was made into one
column that became the ID.
The secondary table can be joined to the base records in a similar fashion as the primary
table - through an SQL join to a file of base record data (as long as the files share the same key
fields)
This process can create a MapInfo table that
contains the secondary or municipal system
base records segments, each with a key field that can be used to
attach any other piece of base record
information (traffic counts, roadway widths,
surface types)
This MapInfo table has all of the base records for the primary
system and can have all the data from the base records attached to
the graphic elements.
This page illustrates the methodology used to incorporate the base record information for the secondary system. The result is a MapInfo table with a key field that can attach any other piece of data from the base record database. If the entire base record database was exported into a single text file (or maintained) in an ODBC (Other Database Compatible) ORACLE accessible format, one SQL join will associate all the base record data with the graphics. At present, have selected pieces of base record data in text files which can be joined to the graphics. The same process is going to be performed for the city street information when it is finished in the IPMP.
Development of Secondary and Municipal CoveragesFigure 3 Coordination of Data Elements From the DOT Management Systems Page 13

Coordination of Data Elements from the DOT Management Systems Page 14
This is a comma delimited ASCII file. Most database packages can readily export data in this format.
Choose File>Open Table. The table open dialog
displays.Choose Delimited ASCII
from the file format drop-down list.
Choose a delimited ASCII file from the
browser. The delimited ASCII
information dialog displays.
All data received from the DOT was requested in a comma delimited format.
Beginning text file
Specify comma delimitation and if the text file has column
headings specify Use First Line for Column Titles by clicking on the checkbox
Press the OK button. The resulting file opened is
read-only. The user must use the File>Save Copy As
command to create an editable file that can be
modified or updated.
Importation of Text Files Into MapInfo
Files incorporated into the GIS database originated from different databases within the DOT. These databases ranged from SAS to FoxPro. The easiest way to overcome the formatting problems that arise is to export data into delimited ASCII format. This is a generic text-only format that can be understood by most modern database packages.
Figure 4 Coordination of Data Elements From the DOT Management Systems Page 14

Coordination of Data Elements from the DOT Management Systems Page 15
Table containing either the primary or secondary
graphics with key field
Text file containing the key information
and the base record information of interest (traffic
counts for example)
Register the text file into MapInfo and save as a
new MapInfo table.
Register the text file
Modify the columns to include a single column
containing the key information. Will the same
as in the primary or secondary table
Perform a SQL join between the text file and
the existing graphics table using equal key fields as the where
condition. Applying a name to the selected set can eliminate confusion
in later steps
The selected information needs to be added to the
map by adding the appropriate query name
After adding the query to the map, using the Information tool within MapInfo will provide the base
record data for any segment. New queries can also be performed on
the selected set to analyze and display base record attribute data.
This section depicts the process of joining the graphics to the base record data (stored in a text file - would work similar if the base record data was stored in an ORACLE table). This process allows analysis, selection, and display of base record information (e.g., select all where AADT > 25000).
Joining Files to Base Record DataFigure 5 Coordination of Data Elements From the DOT Management Systems Page 15

Coordination of Data Elements from the DOT Management Systems Page 16
Overlaying tabular data onto graphical objects usually requires software capable of dynamic segmentation. A program was written in MapBasic which allows the displaying of data graphically. The example in the flowchart incorporates the pavement data, but the process works for all tabular data developed with the key information being the route and beginning and ending milepost information.
Run MapBasic Program DSEG.mbx. This program overlays tabular data on top of
the primary network by using Route, Beginning, Ending Milepost.
Modify any data if necessary. For the PMIS data, the milepost information was
incorrectly formatted and needed to be modified to represent a number (placement of a decimal point - from 230 95 to 230.95)
Open as a table.
Follow the programs instructions. Highlight the columns containing the route, beginning,
and ending milepost data. Start program executing. Run time for 400 records is
approximately 1 hour.
The table should appear as a new layer in the view and should
contain all the data associated with the table. At this point, the
table attribute information is attached to the graphics and
graphical queries can be executed on the table information.
Overlay of Tabular Data Within MapInfoFigure 6 Coordination of Data Elements From the DOT Management Systems Page 16
Open the table of information that is desired to overlay on the primary network. In the example, the PMIS data is used, but could have used the project
history file, 5 year program data, or other data defined by a route and beginning and ending
milepost. Note: some manipulation of the file may be necessary.

Coordination of Data Elements from the DOT Management Systems Page 17
Primary Projection System Coordinates attached to node table created by
export program
Points created using Region Conformal
Projection, the projection used for the other
coverages in the GIS database
Individual county coverages copied to single layer called
RPAXXnod.tab
Text file output from Cartography containing CADD coordinates and
ALAS node number copied to local hard drive
MapBasic program delimits text file accordingly and creates separate
columns for Units of Resolution (UOR) coordinates and
node number
MGE used to convert UOR coordinates
to Primary Projection System
components
This file is created during an editing process used by cartography to check ALAS node coverages for errors. The resultant file contains a fixed length text string that can be
separated into X,Y coordinates and Node Number.
Development of ALAS Node Coverages
ALAS node maps from DOT Cartography are the basis for the creation of map coverages within MapInfo. An edit file created by Microstation reads out the X,Y coordinates of the Node Label along with the Node Number. This file is used to gather the coordinate information which MGE (a mainframe GIS package) uses to convert the CADD points to real world coordinates.
Figure 7 Coordination of Data Elements From the DOT Management Systems Page 17

Coordination of Data Elements from the DOT Management Systems Page 18
Importation of PC-ALAS Data File into MapInfoFigure 8 Coordination of Data Elements From the DOT Management Systems Page 18
Run program ALAS_con.mbx. This delimits the text file,
separates the text file into ALAS A,B, and C records
and creates a MapInfo table for each record type.
Create and run batch program which appends all "A"
records for the RPA into one single table.
Run program acccount.mbx. This program counts all
accidents occurring at individual intersections
within the RPA.
Select from the new table (RPAXXacc) all accidents occurring at intersections.
Accidents occurring at links were ignored. Save selection as RPAXXafj.This table contains the "A" records for all intersection accidents occurring in
the RPA
This file is an ALAS .MPT database file. It is a variable length text file. The files are organized by county and year. For example CO7793.mpt contains the ALAS records for Polk County for
the year 1993.
The acccount.mbx program outputs separate files for each year processed. These files are joined to RPAXXnod. This
join updates the ALAS node cartography with count information. Thematic maps can be created based on
accident numbers. The records for each accident can be accessed by viewing the RPAXXafj file created during this
process.
Incorporating the ALAS database files, which are in a text format, into MapInfo is more complicated than other text importing procedures. Intersection accidents are counted by sorting by node number and then counting the number of accidents in the database occurring at each node number. A program is required to do this iterative procedure. The program can take up to 6 hours to complete the counting process. This procedure is a one-time step in the table creation process. Once complete, the RPA Node table is permanently updated with accident information for a particular year.

Coordination of Data Elements from the DOT Management Systems Page 19
Batch program is written to extract file or files from the tape
drive.
This file is a Microstation CADD file from Cartography. Separate files are
maintained for all cities and counties.Files are stored on a tape drive in a UNIX
environment
Batch program is written to convert files from Microstation .DGN
format to AutoCad .DXF readable by MapInfo
MapBasic Program is used to import .DXF files into MapInfo.
The program converts the CADD Units of Resolution
(UOR) to real world coordinates that can be
mapped to the surface of the earth.
The CADD file contains individual coverages
(bridges, rivers, primary, etc.) on separate levels. The MapBasic program separates these levels and saves the files as
individual MapInfo layers with no attributes
Cosmetic work is performed on table (i.e.. changing of all
primary linework to red)
All similar layers in an RPA (i.e.. all city route centerlines for RPA
07) are combined into one individual coverage and named
accordingly.
Background coverages such as bridges, railroads, and rivers contain no database attributes. Individual background coverages are provided to aid in reference and provide complete secondary road coverage beyond functional class 12.
Development of Background CoveragesFigure 9 Coordination of Data Elements From the DOT Management Systems Page 19

Coordination of Data Elements from the DOT Management Systems Page 20
IV. TESTING AND APPLICATIONS OF THE DATABASE
1. Description of User Instructions All tables for the database are in MapInfo format and require MapInfo to view. A basic set of tables can be opened using the File>Run MapBasic Program command once MapInfo opens. Appendix B shows some of the typical outputs that can be generated with the database using the following tables and files: { Primary network file - containing information from the BRROAD base record file { Secondary network file - containing information from the BRROAD base record file { Municipal network file - containing information from the BRROAD base record file { Bridge SI & A file - containing information for bridges { Bridge SSI file - containing additional information regarding primary bridges { Pavement Management file - containing information for primary pavement test sections { Pavement History file - containing history information for primary pavement test sections { ALAS Node file - locations of ALAS nodes and their identification numbers { ALAS data file - accident data concerning accidents at intersections from 1989 - 1993 { Background data files - pertinent background mapping such as rivers, railroads, street names, and roads with a functional class greater than 12 (These files contain no attribute data but are useful for referencing.) Detailed user instructions are included as a separate document. The user instructions include procedures for making queries with respect to certain attribute information. For example, primary roads with AADT greater than 2500 can be queried using the Query>Select command within MapInfo. 2. Comments From Potential Users Potential users of this coordinated database include: { Iowa DOT staff working on individual management systems { Iowa DOT staff from the central office and the transportation centers not involved in the management systems { Planning and engineering staff at the local government level { Staff of regional planning agencies The coordinated database has been demonstrated at various forums to potential users, and comments have been positive for the use of the database as an objective programming tool. The project team identified an effective way to distribute data files through the recordable CD. All of the data for an entire RPA can be readily contained on a single CD. Feedback from users was primarily focused on having built-in queries preprogrammed into a user friendly interface.

Coordination of Data Elements from the DOT Management Systems Page 21
3. Applications The use of the database system developed has a full range of potential applications within the Iowa DOT, with the majority of them relating to the programming of funds. To this extent, this section will demonstrate some of the potentially useful queries and map displays that can be generated using the coordinated database. In addition to the offices which specifically program funds, Systems Planning staff could use the database for Iowa in Motion (State Transportation Plan) activities. This section will first examine some standard queries identified to program funds and conclude with a brief discussion of how the database can support the Iowa in Motion plan. The programming of funds for highways and bridges on the primary system, excluding the interstates, is applied after selected roadways and bridge structures meet a specified criteria. The coordinated database contains many of the key data elements necessary to perform the associated queries. Beginning the discussion with the bridge programming criteria for the primary system, an identified item is the deck rating. Currently, the bridges have a deck rating assigned between zero (worst) to ten (best). An informative query for programming is the location of all bridges in the RPA with a bridge deck rating of less than or equal to five. Entering the coordinated database and performing queries with these selection criteria for RPA 7 yields the map shown in Figure 10.
Figure 10. Bridges in RPA 7, Deck Rating [ 5

Coordination of Data Elements from the DOT Management Systems Page 22
A second bridge related query involves identification of all bridges eligible for federal funds. To qualify, a bridge must have an SI&A rating of less than 50 and be classified as either structurally deficient or functionally obsolete. Entering the appropriate selection criteria into the coordinated database for RPA 7 produces the map shown in Figure 11.
Figure 11. Bridges in RPA 7 Eligible for Federal Funds Lane width is also an important programming criteria for the primary system. For example, the Programming Office is interested in identifying all pavements that have a width less than 22 feet. This specification is also being considered for inclusion in the Iowa in Motion guidelines. Therefore, all pavements with a width of less than 22 feet in RPA 7 were selected from the database. The results of this query are shown in Figure 12. As a final example of the utility of the coordinated GIS database, highway sections by pavement condition index (PCI) can be identified. As programming decisions are partly predicated on a combination of PCI and service level (B, C, and D for non-interstate primary roads), it is useful to derive a thematic map displaying both criteria for threshold levels. This is easily accomplished with the coordinated database. For example, B-level highways with PCI<60, C-level highways with PCI<50, and D-level highways with PCI<40 are all candidates for the 3R program. For RPA 7, primary 3R candidates are identified in blue in Figure 13 .

Coordination of Data Elements from the DOT Management Systems Page 23
Figure 12. Primary System Roadways with Pavement Width < 22 feet
Figure 13. Candidates for 3R Improvements

Coordination of Data Elements from the DOT Management Systems Page 24
V. RELATIONSHIP WITH OTHER RESEARCH AND PLANNING EFFORTS
The Iowa DOT is engaged in other research projects and planning efforts that can enhance this Coordinated Management System project or that can benefit from having the database readily available. Other activities are described in the following sections. 1. Iowa in Motion The Iowa DOT is developing a state transportation plan, Iowa in Motion, to provide the direction for planning and developing the transportation system needed to move Iowa productively and prosperously into the future. The coordinated database developed during this research effort could potentially be used in the following areas for Iowa in Motion: { Document transportation system conditions for the modal plans that are proposed as part of the draft Transportation Plan { Provide data for calculation of performance measures { Integrate management system efforts with statewide planning { Provide basis for coordination with local and regional planning efforts 2. Statewide Transportation Modeling for Freight Another research effort, statewide freight planning and modeling, is developing a framework to identify important issues, commodities, analytical tools, and data sources to support statewide freight transportation planning analyses. The coordinated database could potentially be used to document the transportation system conditions for roadway characteristics, locations of intermodal freight terminals, and other data elements to support the modeling effort. 3. Coordination among GIS-Related Projects In 1995, the Iowa DOT adopted a GIS Strategic Plan which outlines the basic implementation plan for GIS within the department. Currently, a GIS coordinating committee (GIS-CC) is charged with implementing the recommendations of the strategic plan, as well as coordinating the department's GIS efforts. These efforts may be department-wide, such as the coordinated data elements project and GIS pilot project development, or office specific. Because of its knowledge of the department's GIS-related activities and the overall direction of GIS implementation within the department, the GIS-CC was regularly updated on project progress and asked for input to ensure coordination among activities. Relevant activities included development of GIS pilot projects, attribution of cartography with Base Record Inventory System control attributes, redesign of the Base Record Inventory System, and Iowa Pavement Management Program database.

Coordination of Data Elements from the DOT Management Systems Page 25
a. GIS Pilot Projects To date, ten GIS pilot projects have been investigated as part of the GIS-CC directed efforts. Most of these pilots were developed using MapInfo or a similar desktop PC-based GIS, ArcView, or Maptitude. MapInfo was selected as the development platform primarily because of its capabilities, user friendliness, and relative low cost. These factors were also considered in selection of the coordinated database platform. A common objective of several of the pilot projects was also to provide a graphic link (GIS based) to DOT datasets. Although the pilot projects primarily dealt with datasets not explicitly addressed in the coordinated database study, such as highway access priority ratings, sufficiency ratings, roadside features, and accident (ALAS) data, the database was designed in a manner that can readily accommodate integration of these datasets as well. b. GIS-ALAS As a result of the pilot efforts, the GIS-ALAS project has been initiated to further develop graphical display and analysis of accident (ALAS) data within GIS. An objective of the GIS-ALAS project is to provide graphical access to node, link, and point accident data. The coordinated database, on-the-other-hand, currently only provides graphical access to node data. Additionally, a GIS software platform has not yet been selected for the GIS-ALAS project. As the GIS-ALAS project progresses, potential integration of GIS-ALAS advancements and the coordinated database will be continually investigated. c. Attribution of Cartography The Office of Transportation Data is currently in the process of modifying the Iowa DOT's cartographic representations of the secondary roadways (functional classification 12 or less) and updating the graphic data with the corresponding control attributes from the Base Record Inventory System. The base GIS network of the coordinated database, which enables the geographic overlay of the DOT datasets, was developed using products of this process (i.e., a MicroStation file containing graphical representations of the roadways and a text file describing information about each graphic element, including the Base Record control attributes). Furthermore, the underlying, reference GIS coverages used in conjunction with the coordinated database are created from other DOT cartographic data. d. Base Record Redesign In a related effort, the Office of Transportation Data is in the process of redesigning the Base Record Inventory System itself. Upon redesign, the system will reside on a relational database and be more GIS compatible. These advancements only serve to benefit the coordination of data elements, making data management integration and access easier.

Coordination of Data Elements from the DOT Management Systems Page 26
e. Iowa Pavement Management Program The same datasets used for developing the base GIS network of the coordinated database were also utilized in the development of the Iowa Pavement Management Program's (IPMP) database. The IPMP database is a GIS-based (MGE), relational database (Oracle), supporting dynamic segmentation capabilities. The four primary data sources currently included in the IPMP database are: Base Record Inventory System data, DOT cartography, pavement history data provided by the Iowa DOT and local agencies, and pavement distress data collected centrally utilizing automated distress collection equipment. Both the pavement history and distress data are referenced using route (street) names and geographic coordinates. Dynamic segmentation is necessary to access these datasets. However, after performing dynamic segmentation, these data may be referenced and accessed in several different ways and provided in several different formats, including MapInfo.

Coordination of Data Elements from the DOT Management Systems Page 27
VI. CONCLUSIONS
1. Statewide Implementation The coordinated database project was only developed for two pilot areas within the state. Most of the state has no coordinated database assembled. Feedback from Iowa DOT planner staff has been positive regarding the usefulness of the database as a planning and programming tool. Because there has been a high demand for the database at the regional level, the project team recommends the implementation of the database on a statewide level. The database has many useful applications, such as presentation mapping, planning, and supporting investment decisions. Statewide implementation of the coordinated database could be accomplished by Iowa DOT staff using the procedures documented in this report. As an alternative, CTRE could convert all DOT files to the required GIS format and provide the Iowa DOT with the completed files. All of the files documented in Table 3 can be converted to appropriate GIS files by CTRE staff in approximately 32 to 48 weeks of staff time for the remainder of the state. DOT staff would require training in the procedures used, but after an investment in learning, should be able to achieve similar results.
Table 5. Comparison of Estimated Implementation Times
Action
Staff time estimate for implementation by
Iowa DOT CTRE
Learn file conversion procedures 4 weeks 0 weeks Convert all files to GIS format for
remaining areas of the State 32 to 48 weeks 32 to 48 weeks
Total staff time commitment 36 to 52 weeks 32 to 48 weeks

Coordination of Data Elements from the DOT Management Systems Page 28
An issue that the Iowa DOT will have to consider in making the decision on implementation will be availability of staff at the Iowa DOT for commitment of 36 to 52 weeks of staff time. 2. Updates and Maintenance of a Statewide GIS Database Once a statewide GIS database is implemented, procedures must be established for updates to be incorporated and responsibility must be assigned for this maintenance effort. Table 6 summarizes each type of file in the database and an estimate of how often the information in the file might need to be updated. Methods to be used for distribution of the GIS database files will also have to be established. Tools such as the internet and recordable CD's seem to hold promise as methods to maintain accessibility to the database. Updated files could be placed on the World Wide Web and downloaded by users as desired.
Table 6. Estimate of Updating (Maintenance) Requirements
File Name Source Estimate of Update
Requirements
Time Required
Annual Requirement
Pavement History Pavement Management
Every 6 months 1 day 2 days
Pavement Test Section Pavement Management
Every 6 months 1 day 2 days
Bridge SI & A Transportation Data
Every 3 months 1 day 4 days
Bridge SSI Transportation Data
Every 3 months 1 day 4 days
Accident Node Mapping Cartography Once a year 1 day 1 day Accident File Conversion PC-ALAS File Once a year 2 week 2 week BR ROAD Base Record File Transportation
Data Every 3 months 1 week 4 weeks
Sufficiency Systems Planning Once a year 3 days 3 days 3 Year STIP Program
Management Once a year 1 day 1 day
5 Year Program Program Management
Once a year 1 day 1 day
Attributed Primary Coverage Cartography Every 3 months 1 day 4 days Attributed Secondary Coverage Cartography Every 3 months 1 day 4 days Attributed Municipal Coverage Cartography Every 3 months 1 day 4 days Development of Background Coverages
Cartography Once a year 2 weeks 2 weeks
TOTAL 13 weeks

Coordination of Data Elements from the DOT Management Systems Page 29
Frequency of updates would range from three months to once per year depending on data type (see Table 6), with annual updates provided on CD ROM and quarterly updates provided via the internet. Approximately 26 person weeks of staff time would be required to perform quarterly and annual updates (13 weeks), track user suggestions for updating the data, produce CD roms and internet updates, provided export versions of data, and provide for continuous improvement of functionality. In addition to procedures for updates to GIS database files, opportunities exist within the GIS environment to create a mechanism for updating DOT databases, such as the base record or PMIS. The graphical interface presented by the GIS can greatly facilitate updates of spatial data. An example of this approach is the updating of AADT information for an entire route. By using GIS software, the process is straightforward, requiring little time and effort. 3. Summary and Recommendations The coordinated database was designed considering other DOT GIS efforts. The system displays diverse datasets conveniently (whereas previously no such methods were available). To use the database, a user must have MapInfo software. Users can then also access all general MapInfo features and options in addition to predefined queries, making the system both powerful and flexible. If a user does not wish to use MapInfo, data from the system can easily be imported into one of several other GIS formats. A limitation is that the system contains a static version of its information (not real time). Regular maintenance and updates must be provided. Table 6 provided preliminary estimates of maintenance frequency and time commitments. A concern is that users may modify the databases resulting in "orphan" copies of data. To discourage this, policies must be established for providing feedback to original keepers of the data so that corrections/updates can be reflected in future versions of the system. An integrated GIS database of this type will provide an excellent starting point for the GIS staff (coordinator and database administrator) that the department will be hiring shortly. With an integrated database in place, DOT GIS staff could focus efforts on the identification of useful applications within the department. For example, consideration could be given to bringing in land-use elements for improved coordination between planning decisions of local governments and design considerations on the state highway system. Two pilot areas are now complete for the coodinated management systems database. Based on comments from potential users, it is recommended that the DOT pursue statewide implementation, increasing the utility of the system.

Coordination of Data Elements from the DOT Management Systems Page 30
Appendix A DATA ELEMENTS IDENTIFIED BY FOCUS GROUP (WITH DEFINITIONS)

Coordination of Data Elements from the DOT Management Systems Page 31
Table 1. Data Elements Identified During Focus Group Discussion
General Grouping Management System Data Element
TRAFFIC IMS Truck AADT Auto ADT
Turning movements
TMMS AADT
Turning movements
Traffic expansion factors
Vehicle classification
CMS Traffic counts
MMS Traffic
BMS Traffic on bridge
SMS Traffic data - intersection and road sections
PMS Roadway traffic data
TRAFFIC ESTIMATES TMMS Type area Date of observations, also time
Equipment used for observation
Functional classification
Who set equipment or made observation
Climate conditions at time of observation
MMS Service level
PROGRAMMING PMS 5 yr. program Construction and maintenance letting costs (BAMS)
CMS Construction schedules
MMS Project scheduling
TRAVEL TIME IMS Travel time CMS Travel time
INCIDENT RESPONSE SMS EMS service agency locations and boundaries of service areas, including fire and hazmat teams
Law enforcement jurisdiction boundaries.
Location of key institutions and facilities, i.e. schools, hospitals, fire and police stations
Location of special safety equipment
CMS EMS vehicle locations
Tow truck availability
ROADSIDE STRUCTURES
MMS Roadside safety features inventory

Coordination of Data Elements from the DOT Management Systems Page 32
General Grouping Management System Data Element SMS Roadside safety features inventory
BMS Location of high mast lighting towers
Location of overhead sign trusses
Location of bridge mounted signs
Location of cantilever signals over 40 feet in length
IMS Sign inventory
PTMS Bus stops
Bus passenger shelters
INTERMODAL PMS Intermodal facilities IMS Intermodal facility locations
Intermodal connections to the NHS
ACCIDENTS PTMS Accidents IMS Accident data
PMS Safety accidents. ALAS
Safety management analysis results
MMS Accidents
SMS Traffic volume vs. accident history relationships
Motor vehicle state accident file. All Elements
Accident history related to roadway construction
Accident location by link and node
CMS Accident rates
BRIDGE BMS Bridge Condition - Deck, superstructure, substructure

Coordination of Data Elements from the DOT Management Systems Page 33
General Grouping Management System Data Element Bridge maximum load capacity
Is bridge posted?
Year of last inspection
Year bridge painted
Drainage area for bridges over waterways
Vertical clearance at bridge
Year deck overlay
Year bridge major rehab
Is bridge factor critical?
Bridges requiring underwater inspection
Type of bridge
Year bridge constructed
Bridge rail, substandard or does it meet criteria
Is bridge scour critical?
Bridge width
Bridge length
Bridge sufficiency rating
MMS Bridge or culvert information
PMS Bridge condition and program
PTMS Bridge load limits
SMS Structure location
ROADWAY MMS Pavement evaluation (IRI, friction)

Coordination of Data Elements from the DOT Management Systems Page 34
General Grouping Management System Data Element Pavement types
Maintenance costs
Pavement condition (PCR's)
Shoulder information
Roadway characteristics
SMS Surface type
Pavement surface friction data
Roadway or highway type
PMS All non-mgmt. system information
Truck permitting info
Physical road test data
PM investment analysis results
Maintenance costs
Long range planning (Iowa in Motion)
Roadway condition data
All historic PM info
Roadway inventory data
PTMS Pavement smoothness
Roadway load limits
Intersection turning radii
Sidewalks
Sidewalks ADA ramps
IMS NHS routes
Roadway geometrics
TMMS Roadway section lengths
TRAVEL DEMAND MANAGEMENT
TMMS Occupancy
PMS Capacity level analysis
MMS Detour location
Traffic control data
CMS Radio alert numbers
Special events timing
V/C ratios
Alternate route choices
Business delivery schedules
Rush hour times
SMS Road circumstances the vary over time, locations of construction zones or detours
MAINTENANCE ACTIVITIES
MMS Maintenance functions and activities
PMS Maintenance in house activities
EXTRA PMS DATA PMS Construction management system. information

Coordination of Data Elements from the DOT Management Systems Page 35
General Grouping Management System Data Element EXTRA SMS DATA SMS Historical data, new construction and major
reconstruction Futuristic: criminal justice system data links
EXTRA MMS DATA MMS Maintenance jurisdiction Maintenance locations
TRAFFIC CONTROL DEVICES
SMS RR grade crossings, location, safety hardware, trains per day, FRA accident data
Traffic control device replacement schedule
Intersection data, type, traffic control, lighting, turning lanes
MMS Railroad crossings
PTMS Signal pre-emption
Signals
Turn signals
CMS Traffic signal locations
Traffic signal timings
PUBLIC TRANSIT CMS Public transit options PTMS Bus routes
Bus transfer locations

Coordination of Data Elements from the DOT Management Systems Page 36
DATA ELEMENT DEFINITIONS
5 Year Program/STIP - The 5 year program/STIP contains data related to the future projects programmed. Data from the 5 year program/STIP are desired by the PMIS, MMS, and PTMS. ALAS Nodes - ALAS nodes are used to identify the location of accidents. The node numbers for the primary system are contained on the base records and the cartography design files. The ALAS nodes are attached to accidents in the ALAS Database. All Let Plans - Included in the all let plans are data from the construction and maintenance plans. For the primary roadway system, plans are examined within the Office of Transportation Data for updating base records. For the secondary roadway system, the counties submit construction and maintenance plans that are used to update the base records for the secondary roads. The plans are also used to update information in the Project History File. Airport Traffic Activity Counts - The Traffic Monitoring System collects data related to airport activity counts. These data are to be provided to the Intermodal Management System. Automatic Traffic Recorder Counts - The Automatic Traffic Recorder Counts (ATRC) are produced from 125 permanent stations located throughout the state. The recorders collect information related to volume and vehicle classification. The ATRC counts are used to calculate AADTs, estimate VKT by system and month, and compare ADT for each month and AADT to previous years through the use of programs run by the Traffic Monitoring System. BAMS - Data from the Bid Analysis Management System are added to the Project History File. The data are related to the vendor, contract ID, bid year, and amount bid. The BAMS data are incorporated into the project history file and the PMIS database. Base Records - Base records are a hierarchical, static database containing data on the roadway, traffic, shoulder, sufficiency, ALAS node numbers, geometrics, over/underpasses, structures, and railroads. Most offices within the DOT obtain their data from base records. The base records are updated throughout the year, and the data are collected and made into a flat file containing all the roadway data as of December 31 the previous year. This flat file is where many offices obtain the data for their analysis. Many offices are responsible for collecting the data that are inserted into the base records and many offices use the base records for their functions. Bridge Data - There are two categories of bridge data in the base records: Structural Inventory and Appraisal (SI&A) data and Supplemental Structures Inventory (SSI) data.

Coordination of Data Elements from the DOT Management Systems Page 37
The SI&A data are collected by the owners for all the 25,500 bridges during the biennial inspections required by the National Bridge Inspection Standards (NBIS). The Office of Transportation Data entered the SI&A data for the 4,000 and 21,500 bridges on the primary and secondary/municipal systems, respectively. The information includes location, structure type, geometric data, condition and appraisal ratings, load capacity, construction and rehabilitation data, proposed improvements, and inspection dates. The SSI data are collected only for the bridges on the primary system. It is entered into the base records by the Office of Bridge Maintenance and Inspection and contains condition information and maintenance/repair recommendations for specific elements of the bridges. Bridge Management System (PONTIS) - The DOT is developing a Bridge Management System (BMS) for the 4000 primary system bridges using PONTIS software. Participation in a BMS by the local entities is optional. PONTIS is operated on PCs. Information for PONTIS is obtained by the bridge owners during the biennial inspections required by the National Bridge Inspection Standards (NBIS). It is anticipated that the PONTIS information will be entered into the base records by the Office of Transportation Data and down loaded into PCs. Cartography .DGN Files - The cartography design files (*.DGN) are the graphics for the cities and counties. There is currently an effort underway to tie the cartography to the base records. Congestion Management Data - Congestion management data include desired CMS data not currently collected or data that is collected but unavailable to the CMS. These other data would be used to support the workings of the CMS and will include congestion data being collected by local agencies such as travel time studies. Congestion Management System - Congestion Management System (CMS) represents the database that will be developed to store the CMS data. The CMS is expected to receive data from the base records, turning movement data from the turn processor, accident data from PC-ALAS and other congestion management data that will be collected by local agencies. Driver Reports - When an accident happens and no law enforcement officer is called, the drivers have the option to submit a report detailing the accident. The driver report is incorporated into the Statistical Accident Files. Iowa Accident Statistical Program - The Driver and Officer Reports that are submitted to the Department of Motor Vehicles are compiled and entered into the Iowa Accident Statistical Program. This data are then used to populate the Statistical Accident Files. Intermodal Data - Intermodal data include the future information desired by the IMS that is not currently collected by another department. At this point in time, it is not possible to identify what data this includes and who would be responsible for its collection. These other data would be used to support the workings of the IMS.

Coordination of Data Elements from the DOT Management Systems Page 38
Intermodal Management System - The Intermodal Management System (IMS) is expected to begin collecting and storing information related to intermodal management. The data for the IMS is expected to come from the base records, PC-ALAS, traffic monitoring system, airport activity counts, public transportation data, and other intermodal data that will be collected in the future. Inventory Crew Data - Inventory crew data are collected on four levels: { Rural Primary and Municipal Extensions { Institutional Roads { Rural Secondary Roads { Municipal Streets The inventory crews are provided with a print-out of the base record data for the section and they verify that the base record data are correct for the roadway section. Inventory crews verify the base record information for the primary road system every three years, for the secondary road system every ten years, the municipal road system every five years, and the institutional road systems on an as needed basis. Maintenance Data - The Office of Maintenance collects data that is inserted into base records and into the Maintenance Management System (MMS). The base record data collected by the Office of Maintenance includes the maintenance cost center, whether maintenance is DOT or contract provided, and the service level. There is a conversion between base records surface type and maintenance surface type allowing maintenance to update surface type. Maintenance data used within the MMS include number of hours worked in a location and description/location of work performed. Maintenance Management System - The Maintenance Management System (MMS) represents the database currently being developed to store data related to maintenance activities. Data for the MMS will be provided from: { specific maintenance data collected { base records data (number of lanes, AADT, surface type, shoulder type) { PMIS data (rutting, PSI, patching and cracking, programmed projects) { bridge management data { data from the accounting system (cost information) { accident data from the statistical accident files { programming information from the 5 year program and STIP Materials Test Data - The Office of Materials collects test data related to the roadway that are inserted into the base records. This includes the ride index and the condition index. For operation of the PMIS, the materials division collects data, such as the amount of cracking, IRI, rut depth, structural rating, and other pavement performance information. IRI and calculated PSR are loaded on to the base records for the Highway Performance Monitoring System (HPMS) reports.

Coordination of Data Elements from the DOT Management Systems Page 39
Milepoint Cross Reference - The milepoint/milepost cross reference file is used to convert the milepost to milepoint for use in the PMIS. Network Updates From Counties and Cities - Network updates from the counties and cities represent plots or printouts of the graphics (or street network) which are submitted to the counties and cities and they send them back to the DOT with any changes. This data is used to update the cartography for the cities and counties. Non-NHS, FAE Pavement Management - The non-NHS, Federal Aid Eligible Pavement Management System will be a database used to store test data and inventory data. The database incorporates roadway data from the base records, along with having some test data collected by Road Ware supplemented by additional data from the PMIS, and will probably place pavement condition data into the base records. Anticipated connection to the PMIS database through roadways on the primary system will be in both pavement management systems. Officer Reports - Reports are prepared by a Highway Patrol Officer or local police officer at the location of an accident. The report contains data related to the accident, vehicles, drivers, injuries, and fatalities. The reports are placed into the Iowa Accident Statistical Program. Optimization - Information is taken from the PMIS through optimization routines by the Office of Design and will be used by the Office of Program Management and by the Office of Maintenance. Public Transportation Data - Public transportation data represent information that is desired by the PTMS or for improved transit planning but is currently not being collected, or is being collected but unavailable to the PTMS. The data come from the transit inventory submitted by local agencies and maintained by Equipment Support, Program Guidance developed by the Public Transit Coordination Committee and maintained by Planning Services, and the 5 Year Program/STIP developed by Program Management. The data supplied include vehicle ID, vehicle class, purchase dates, accumulative miles, cost by vehicle class, and vehicle replacement/rehabilititation data. These data would be used to support the workings of the PTMS, as well as the Congestion and Intermodal Management Systems. Pavement Management Information System (PMIS) (primary system only) - The PMIS is a repository for pavement data for the primary system. The PMIS takes roadway inventory data such as the surface type, base and shoulder information from the base records, and data collected by the Office of Materials related to pavement conditions. PMIS currently operates on a SAS system. Information from letting plans through BAMS is used to populate the project history file.

Coordination of Data Elements from the DOT Management Systems Page 40
The PMIS has the ability to create maps related to the primary system and pavement condition. The system has the capability to display query results for basic queries related to pavement condition and functional classification. The maps are limited in the number of colors they can display, however, they do represent a powerful ability of the PMIS. The PMIS is interested in obtaining SAS GIS to improve their maps and graphical display. Currently, the PMIS has only the primary system. The PMIS office is interested in obtaining SAS/GIS to improve the maps being developed to display the PMIS information. PC-ALAS - The Personal Computer - Accident Location and Analysis System (PC-ALAS) is a computerized program written to extract accident data in a format that can be used on personal computers. The data that is in the PC-ALAS system is from the statistical accident files and the ALAS nodes coded on the base records. PC-ALAS is used by the intermodal, congestion, and safety management systems. Portable Recorder Data - The accumulative portable recorders are used to collect volumes along roadways. The portable recorder counts include data related to volume of traffic as well as vehicle classification and are referenced to a location node. The volumes and classifications are placed into the traffic monitoring system data. Project History File - The project history file contains data from construction and maintenance projects. The data relates to the materials used and the contractor. The project history file obtains data from the let plans, and the Bid Analysis Management System (BAMS). Public Transportation Equipment and Facilities Management System - The Public Transportation Equipment and Facilities Management System (PTMS) represents the database used to support the functions of the PTMS. This database will contain data related to the PTMS. Other public transportation data will be collected to supplement the data required by the PTMS. Railroad Crossing Data - The railroad crossing file contains data related to railroad grade crossings such as location, number of tracks, warning devices, trains per day, maximum train speed, crossing angle, and sight distance. The crossing file is tied to base records on the Federal Railroad Association number. The railroad crossing data are requested by the SMS to analyze accidents occurring at rail crossings. Safety Management System - Safety Management System (SMS) operates through committees and involves people using data. The SMS proposes to review data from a wide variety of sources including base records, railroad crossing files, statistical accident files, PC-ALAS, and turning movement count data from the traffic monitoring system. Safety Related Data - Safety related data represent the information desired by the SMS that is currently not collected or is being collected but is unavailable to the SMS. The SMS provided a list of data they would be interested in receiving such as vehicle features, weather conditions, and emergency response. The other data would be used to support the workings of the safety management system.

Coordination of Data Elements from the DOT Management Systems Page 41
Statistical Accident Files - The statistical accident files are built from the Iowa Accident Statistical Program and contain data related to the accident, vehicles involved, drivers, injuries, and fatalities (if any). The statistical accident file is the summary of the accident. Statistical accident information is used to populate the PC-ALAS database, support activities in the MMS, and is used in determining sufficiency. Sufficiency - The Systems Planning Office produces a sufficiency rating for the primary system. The sufficiency rating is based on structural adequacy, safety, and service. The sufficiency is determined by incorporating data from the base records such as functional classification and volume to capacity ratio, statistical accident file information, and then uses other factors to calculate a sufficiency rating. Traffic Monitoring System Data - Traffic Monitoring System Data, which contains the Traffic Monitoring Management System (TMMS), currently is the collection of the different traffic counts and count mechanisms. Data from the TMMS are used to update the base records with respect to traffic such as, AADT, percent trucks, vehicle classifications, and Equivalent Single Axle Loads (ESALs). Traffic Monitoring System data are obtained from the traffic recorders, truck weight data collectors, and the turning movement processing software. Truck Weight - The Traffic Monitoring System collects data related to the truck weights and ESALs. This data is placed into the base records and is used by the pavement management system. TURN - online processing software - The on-line turning movement processing software (TURN) is used to store turning movements by node location. These data are incorporated in the Traffic Monitoring System Data. Turning Movement Counts - Turning movement counts are collected manually by the office of Transportation Data. They are collected on the primary system at intersections with both primary and secondary roadways. They are collected with the summer count program and updated every four years. They are then inserted into the TURN processing software. Video Log Van - The video log collects video images which the PMIS uses to check the milepost in the cross reference file. The video log van was used previously to collect curve and grade data. This data were inserted into base records for the primary system. The video log van is used to update the cartography design files.

Coordination of Data Elements from the DOT Management Systems Page 42
appendix B. GIS database Outputs