Embed Size (px)
Citation preview

Coordination in Teams:
Evidence from a Simulated Management Game
Robert E. Krauta,b, Susan R. Fussella, F. Javier Lerch.a,b, Alberto Espinosac
aHuman-Computer Interaction Institute
bGraduate School of Industrial Administration
Carnegie Mellon University
cKogod School of Business
American University
Contact Information:
Dr. Susan R. FussellHuman-Computer Interaction InstituteCarnegie Mellon University5000 Forbes AvenuePittsburgh, PA 15213Phone: 412-268-4003Email: [email protected]
Keywords: coordination, teamwork, communication, shared cognition
Classification: research article
Running Head: Coordination in Teams
10/31/02

Coordination in Teams Page 2
Coordination in Teams:
Evidence from a Simulated Management Game
Summary
In this paper, we examine the strategies managerial teams use to achieve coordination and
the effects of coordination on team performance. We hypothesized that four coordination
strategies—frequent communication, evenly distributed communication, shared cognitions about
members’ expertise, and team history—would lead to greater team coordination. We also
hypothesized that there would be tradeoffs between several of these strategies. Greater
coordination was expected to lead to better performance outcomes, regardless of the strategies a
team used to achieve it. We examined our hypotheses within the context of a 14-week realistic
management simulation. Coordination was influenced by evenness of communication, shared
cognitions about the distribution of expertise within the team, and time working together.
Coordination was also influenced by interactions between shared cognitions and frequency of
communication, and between shared cognitions and team history. Contrary to our predictions,
however, there was neither a main effect of communication frequency on coordination, nor an
interaction of communication frequency with history working together. The level of coordination
within a team was directly related to three of four outcome measures.

Coordination in Teams Page 3
Coordination in Teams:
Evidence from Simulated Management Teams
Groups are inherently different from individuals performing the same task because of a
need to coordinate. Whenever the work of individuals is interdependent, they must coordinate to
achieve success (Van de Ven, 1976). Malone and Crowston (1994) defined coordination as the
extra work organizations and individuals must complete when individuals are working in concert
to accomplish some goal, over and above what they would need to do to accomplish the goal
individually. To work together effectively, team members must coordinate their efforts in both
broad and detailed ways. At the broad level, for example, managers organizing a new product
roll-out must align goals: If the marketing manager is positioning a product as a prestige item,
the engineering manager cannot skimp on quality. At a more detailed level, the team must assign
tasks to the people most capable of doing them, must phrase documents so that they reflect a
common style, and must exchange work products with each other in a timely way.
Although coordination has long been assumed by group and organizational scholars to be
a component of group effectiveness, as Argote and McGrath (1993) note, there has been little
systematic research examining the way teams achieve coordination or its effects on performance.
In this paper, we examine the strategies teams use to achieve coordination and the effects of
coordination on team performance with a specific focus on managerial teamwork.
Coordination strategies are methods that groups and organizations can use to align their
activities. Classic theories of organizational behavior typically distinguish between mechanistic
and organic coordination (March, 1958; Thompson, 1967). Mechanistic coordination or
coordination by programming consists of relatively static techniques, such as division of labor,
regulations, or standard operating procedures, that align individual actions through structure or
Coordination in Teams Page 4
directive. In contrast, organic coordination or coordination by mutual adjustment consists of
more informal and unstructured communication, whereby individuals exchange information
about their current states and adjust their behavior to others’ goals and actions.
Although there are a number of different strategies teams can use to coordinate their
activities, we focus in this paper on four that we hypothesize will be especially important for the
type of managerial teamwork we examine: frequency of communication, evenness of
communication, shared cognition, and reliance on a common history. These strategies are
beneficial individually and are likely to compensate for each other. That is, teams can use any of
these methods to coordinate, but using more of them might not lead to additional benefit.. In
addition, we examine how a team’s overall level of coordination, regardless of which strategies it
used to achieve it, affects several different performance outcomes.
In the remainder of this introduction, we describe in more detail our specific hypotheses
regarding coordination strategies, trade-offs among coordination strategies, and effects of
coordination on performance. We then examine these hypotheses in the context of a realistic
management simulation, in which teams of MBA students manage a simulated consumer
products company over a multi-week time period. We end with a general discussion of the
implications of our findings.
Coordination Strategies
In this section we consider four distinct strategies that groups can use to become
coordinated: (a) frequent communication among team members; (b) evenness of communication
among team members; (c) shared mental models of who knows what within the team; and (d)
reliance on a team’s history of working together. We next describe the rationale for expecting
that these strategies will lead to increased coordination in teams.

Coordination in Teams Page 5
Frequent communication. By communication we mean the conversations, meetings,
phone calls, electronic mail (email), documents, notes and verbal interactions over other media
that teams members use to perform such tasks as negotiating their goals, making decisions, and
updating each other about task status. This is a prime example of coordination by mutual
adjustment. A large literature in the management and organizational sciences shows that for tasks
involving interdependence and uncertainty—characteristic of the management simulation that we
describe below—team members must have a substantial amount of interpersonal communication
to be successful (Thompson, 1967; Van de Ven, 1976). Pelz and Andrews (1966), in their
classic study of scientists in organizations, show the importance of within-team communication
for success, and these findings have been replicated often. In a recent study, Cummings (2001)
showed that teams in a multi-national corporation were evaluated more highly when the
members communicated more with each other. Conversely, Kiesler, Wholey and Carley (Kiesler,
Wholey, & Carley, 1994) showed that novice software engineering teams failed when they didn’t
communicate enough. Thus, we expect that in general more communication will lead to more
coordination.
Hypothesis 1: More frequent communication among team members will lead to better
coordination.
Even communication. In addition to the sheer volume of communication, the structure of
the communication within the group is also likely to influence how well teams can coordinate
their efforts. Research has shown that for relatively simple, information-exchange tasks,
communication flow is more efficient when it passes through a small number of individuals who
serve as communication hubs than when it is spread evenly among all group members (Leavitt,
1951). However, this centralized structure is not appropriate for typical managerial tasks
Coordination in Teams Page 6
involving high uncertainty in a changing and competitive environment. In these circumstances,
the centralized communication hub becomes a bottleneck (Shaw, 1964). As a result, research has
shown that when task uncertainty is high, people engage in higher levels of informal, peer-to-
peer communication to coordinate their work (Van de Ven, 1976), and teams that fail to do so
perform less well (Tushman, 1979). This reasoning suggest the following hypothesis:
Hypothesis 2: Greater evenness of communication among team members will lead to
better coordination.
Shared cognitions about team expertise. Contemporary theorists have added shared
cognition or shared mental models to the list of strategies that teams use to coordinate (e.g.,
Cannon-Bowers, Salas, & Converse, 1993; Fiore, Salas, & Cannon-Bowers, 2001; Mathieu,
Heffner, Goodwin, Salas, & Cannon-Bowers, 2000). By shared cognitions we mean the beliefs in
common that team members have about such topics as each other’s abilities, the tasks they must
perform, team processes, and the team environment (see Mohammed & Dumville, 2001 for a
review). In this paper, we concentrate on shared cognitions about the distribution of expertise in
a group—others’ skills, knowledge, and the like. Shared cognitions about expertise are part of
what many researchers call transactive memory systems (e.g., Hollingshead, 2000; Moreland,
2000; Moreland, Argote, & Krishnan, 1996; Wegner, 1987). These shared cognitions allow
team members to retrieve a larger amount of material than they would be able to store on their
own, by knowing whom to consult about what topics or for what assistance.
There are a number of ways teams can drawn upon shared cognitions about members’
expertise to help coordinate their activities. Knowing each person’s strengths and weaknesses
increases the efficiency and appropriateness of team’s task assignments (Argote, 2000; Liang,
1995), allows team members to distribute information more efficiently (Larson, Christensen,

Coordination in Teams Page 7
Abbott, & Franz, 1996), and enables people to consult the appropriate individuals for advice and
guidance (Olivera, 1999). Depending on how detailed this knowledge is, shared cognitions
about expertise allow groups members to anticipate the actions of others and to make
adjustments in their own behavior in anticipation of others’ reactions (e.g., Blickensderfer,
2000). Under some circumstances, knowledge of the distribution of expertise may also
encourage group members to work harder, if they realize that their unique talents are needed for
a group effort (Karau & Williams, 1993). Finally, this knowledge may be the basis of trust
within the group, especially what McAllister calls cognitive trust, which is based on judgments
of competence (E.g., Gabarro, 1978). Although the mediating mechanisms might vary, this
reasoning suggests the following hypothesis:
Hypothesis 3: Shared cognitions about the distribution of expertise within the team will
lead to better coordination.
Team History. By team history we mean the length of time members have worked
together. Team performance typically increases as its members work together for longer periods,
at least up to some limits. In Katz’s classic research (1978), research and development teams
reached their peak of performance when the average tenure in the team was three to five years
(See Pelz, 1966, for similar results). Training in an intact group improves later performance in
that group (Hollingshead, 2000; Moreland, Argote, & Krishnan, 1998). Even brief periods of
work history improve performance. For example, (Kanki & Foushee, 1989) demonstrated that
cockpit crews who had flown together for two days before participating in a simulator exercise
performed more successfully and committed fewer serious errors than crews that had not yet
flown together . When intact work groups are disrupted through personnel turnover, change in
the technology they use, or change in their physical environment, the group’s performance

Coordination in Teams Page 8
declines until it become accustomed to the changes (Goodman & Shah, 1991; McGrath, Arrow,
Gruenfeld, Hollingshead, & et al., 1993). Thus, we hypothesize that longer team history will
have a positive effect on coordination:
Hypothesis 4: As groups work together longer, they will become better coordinated.
Trade-offs among Coordination Strategies
Although each of the strategies we have discussed—volume of communication, evenness
of communication, shared cognitions about expertise, and team history—in and of itself may
benefit coordination, it may not be necessary for a team to rely on all four of these strategies in
order to achieve a satisfactory level of coordination. Indeed, there is evidence that overuse of
coordination strategies when they are not necessary can harm team performance by detracting
from the work itself. In this section we consider three trade-offs between coordination strategies:
between volume of communication and shared cognition, between volume of communication
and team history, and between shared cognition and team history.
Trade-offs between frequency of communication and shared cognition. Communication is
essential for coordination, but it is also a time-intensive activity that diverts time and effort from
team member’s primary tasks. Engineers, for example, frequently believe that coordination-
oriented communication is not real work; research too much of it leads to wasted time and
missed deadlines (Perlow, 1999). When shared cognition leads to better coordination, it may do
so by reducing needs to explicitly communicate for coordination. There are two reasons to
expect this interaction of shared cognition and frequency of communication on coordination.
First, as suggested previously, knowledge of who knows what allows team members to assign
tasks and to anticipate others' actions with minimal communication. For example, they can use
their shared beliefs about each other’s interpersonal skills or expertise in finance to decide,

Coordination in Teams Page 9
without extensive discussion, who to send to a negotiating session with union representatives or
to serve as the spokesperson describing a stock buy-back policy to a board of directors. Second,
shared knowledge of one another’s skills and expertise constitutes a type of mutual knowledge or
common ground, which provides the basis for efficient communication (Clark & Brennan, 1991;
Cramton, 2001).When team members are aware of each other’s expertise, they can formulate
easily understood messages to their partners—for example, using the acronym ROI instead of
“return on investment” when they know that their communicative partners are familiar with
finance. Consequently, we predict that when teams share cognitions about member expertise,
they will be able to achieve coordination with a lower volume of communication.
Hypothesis 5: Greater shared cognition about the distribution of expertise within a team
will lead to better coordination with less frequent communication.
Trade-offs between frequency of communication and team history. The longer a team has
been together, the less communication it may need to coordinate activities. First, early in their
histories, managerial groups are setting direction, while later on they are primarily executing
plans developed earlier. Therefore, they will need to communicate extensively to set direction
early on, when their task is more uncertain, but can reduce their communication later on, when
they are executing their plans. Second, over time, teams devise standard operating procedures or
routines, such as weekly meeting times or responsibilities for tasks, that could allow them to
handle recurrent problems without explicit communication (Gersick & Hackman, 1990). Third,
as groups work together they develop common ground that they can draw upon for more
efficient communication (E.g., Isaacs & Clark, 1987; Krauss & Weinheimer, 1966). Kanki and
her colleagues (Kanki & Foushee, 1989) demonstrated that improvements in communication
mediated the impact of work history on performance in natural settings. Because by working

Coordination in Teams Page 10
together teams reduce the uncertainty in their tasks, develop standard operating procedures and
develop efficient communication over time, we would expect they would need less
communication to coordinate later in their histories than they did earlier on.
Hypothesis 6: The influence of frequent communication will have weaker effects on
coordination later in a teams history than early .
Trade-offs between shared cognition and team history. Through the observations of
each other and through the communication they exchange in the course of working together,
team members develop the shared cognitions previously discussed. Salas and his colleagues
(E.g., Orasanu & Salas, 1993) have demonstrated that teams that work longer together are likely
to develop shared cognitions, including those about each other’s competencies. Gabarro (1978)
describes how senior managers learn about the competencies of their management team through
direct observation.
At the same time, however, as teams develop standard operating procedures over time,
the need to rely upon shared models of who knows to coordinate what is also likely to decline.
Task assignments and other decisions based on this knowledge are likely to have been made
already. The consequences of routinization associated with working together suggests that
coordination through shared beliefs will be more important for groups early in their histories than
later on.
Hypothesis 7: The effects of shared cognition on coordination will be strongest early in a
team’s history than later on.

Coordination in Teams Page 11
Effects of Coordination on Performance Outcomes
The overall level of coordination achieved by a team, regardless of the strategies used to
achieve it, is a component of what Hoegle and Gemeunden (2001) refer to as teamwork quality.
One can think of coordination in this sense as an index of group efficiency. When coordination is
high, a unit of individual work translates into more or better team output. In contrast, when
coordination is low, the same quality and quantity of individual work will result in less or poorer
group output because of what Steiner (1972) terms process losses. Teams will be devoting
valuable time and attention to solving the problems of how to work together, rather than apply
this energy into their primary task. Failures of coordination lead to excess communication,
redundant work, delays in production, and incompatibilities between intermediate outputs that
need to be redone before they can be integrated. For example, Brooks (Brooks, 1975) writes
eloquently about the way that coordination problems undercut productivity in software teams,
and Argyes (1999) demonstrated that information technologies that improved coordination
among engineers working on the Stealth Bomber improved the timeliness of handoffs and
reduced the rework. Of course, successful coordination by itself does not guarantee a successful
group. The group needs appropriate goals and strategies, and individual members need to possess
sufficient skill and motivation to contribute to the achieving the goal (Larson & Schaumann,
1993). However, all else being equal, one would expect that increased coordination would
improve a team’s success.
Hypothesis 8: Groups will be more successful in their primary tasks as their coordination
increases.
Coordination in Teams Page 12
Method
Setting and participants
We examined these hypotheses in the context of a realistic business simulation called the
Management Game (Cohen, Dill, Kuehn, & Winters, 1964). Participants consisted of 277 MBA
students, organized into 50 teams. Students had from zero to 27 years prior work experience (M
= 4.62; sd = 3.12). Approximately one-third were women.
Teams of five or six MBA students competed with each other running soap companies
over a 14-week period. During the first seven weeks, students organized teams and learned
about the simulation, and during the second period they actually played the game. Students were
placed on teams through a two-stage draft. First, students exchanged resumes describing skills,
task preferences, and work experience. Based on a popular vote, the class as a whole elected 50
team presidents. These presidents subsequently selected members for their teams through a
round-robin draft.
Students acted as the senior managers of a consumer product company during a simulated
two-year business period. They made decisions regarding the nature, production, distribution,
and financing of their products--laundry detergents. For example, they decided what
combinations of price, cleaning power, and environmental friendliness their detergents should
have, how much to manufacture, which regions of the country to target, what manufacturing
capacity they should maintain, and how large their stock dividends should be. During three
separate reviews, each team presented its company’s strategies and accomplishments to its board
of directors, composed of local business executives. As individuals, all students participated in a
stock market, trading shares of the simulated companies to amass personal wealth.

Coordination in Teams Page 13
Except for the appointment of its president, each team had discretion on how they would
be internally organized. Most teams adopted a functional division of labor, with different
individuals responsible for research and development, finance, marketing, production and the
presidency of the company. Each team member was responsible for finding, analyzing, and
drawing conclusions from a large body of information, which had to be integrated with
information developed by other roles to make decisions. For example, early in the simulation,
Vice Presidents of Marketing typically decided how much money to spend on simulated market
research programs about the consumers’ preferences; they executed these programs and
interpreted the results.
The responsibilities for acquiring and analyzing other information were more diffuse. For
example, most team members would be involved in the basic strategic decision to produce a low
cost/low quality product or a high cost/premium one. In addition, most team members examined
publicly available financial data about other firms and sought out classroom gossip to assess their
competitor’s strategies. Most business decisions they made were highly interdependent, requiring
a high degree of coordination among team members. For example, marketing decisions about
consumer preferences had to be integrated with research and development information about
product formula and production decisions about plant capacities.
Approximately twice a week each team recorded decisions for that period (e.g., about the
pricing of products in different markets, the attributes of products, the level of production in
several factories, the sources of financing for their operations, etc.) and received feedback from a
computer simulation about their sales, market share, profitability and other key business
indicators.

Coordination in Teams Page 14
Each team met with a separate board of directors three times over a seven-week period.
Each board of directors consisted of four or five local business executives or managers. In
preparation for each meeting, the teams wrote 10-25 page strategic plans and operational
reviews, and they presented their plans and accomplishments to their board during multi-hour,
highly interactive meetings. The boards of directors approved major capital decisions and set
compensation for the team. At the end of each meeting, they evaluated the team and its members
on several Likert scales. These evaluations were a major component of students’ grades.
Team members communicated both synchronously (scheduled face-to-face meetings,
telephone calls, impromptu discussions in corridors) and asynchronously (email and file
sharing). Because team members had different work and class schedules, teams worked in a
distributed manner much of the time.
Measures
Because the teams prepared for and played the simulation over 14 weeks, we were able to
collect data over time, allowing us to examine developmental processes and to test causal paths
using panel designs and path analysis. Teams are the unit of analysis for this study. Some
variables (e.g., a team’s profit or the evenness of communication within the team) can only be
measured at the team level. Others variables (e.g., coordination or board member’s evaluations)
represent individuals’ assessments of the team as a whole. For these measures, we first
determined that teams explained sufficient variance to warrant combining data at the team-level
and then averaging data from all who made assessments, as described below. The data came
from three sources:
Student Surveys. Participants completed voluntary surveys assessing their teams at three
points during the simulation: at the end of the first 7-week period, halfway through the second 7-

Coordination in Teams Page 15
week period, and at the end of the simulation. The second and third surveys coincided with
teams’ second and third presentations to their boards of directors. Of the 277 students, 74%
completed the first survey, 77% completed the second, and 67% completed the third. We first
conducted one-way analyses of variance to establish that the team explained variance in these
assessments, and then calculated team-level measures by taking the mean of the individual
member’s ratings. The effect of teams was significant for all self-reported measures described
below, except for the measure of communication volume.
For each time period, we calculated team-level data from any team where at least 3
members filled out a survey. This represents 49 teams at time 1, 50 teams at time 2 and 47 teams
at time 3. When teams had fewer than three responses, we imputed missing values for teams
within time-period, using the expectation-maximization technique in (SPSS, 1997). Although
significance levels change slightly, none of the results that we present below changed
substantively when we limited the analysis to teams with no missing values or when we included
all teams with at least two non-missing surveys per time period. We included the following
measures, based on self-reported, survey data.
Frequency of communication. Team members indicated the frequency with which they
communicated with the other members of their team using a 6-point scale ranging from never to
multiple times per day. Estimates were averaged across respondents and their partners to first get
an index of the communication between the pair and then averaged across pairs to arrive at a
communication index for the team as a whole. While we did not keep records of electronic mail
exchanges among team members for the simulation reported in this paper, we did record this data
for the subsequent running of the Management Game. During that year, self-reported

Coordination in Teams Page 16
communication frequently was moderately correlated with the number of e-mail messages sent
within the team (r=.47, p< 0.001), suggesting some validity to this self-reported measure.
Evenness of communication. We used students’ estimates of their communication with
each other to calculate a measure of the evenness of communication among team members. Our
measure of evenness is one minus the Gini coefficient (Alker & Russett, 1964). The Gini
coefficient measures the deviation of the actual Lorenz curve, in which the X-axis represents the
cumulative percentage of communicators in the team and the Y-axis represents the cumulative
percentage of communication, from the straight line of equality. The evenness measure
(reversed Gini) could theoretically range from 1, when each member of a team received an equal
amount of communication, to 0, when one team member (e.g., the team president) received all
communication. The formula for the reversed Gini coefficient = Xn
xxn
i
n
jji
2
1 1
21
∑∑= =
−− , where Xi
represents the cumulative percentage of individuals in a group and Xj represents the cumulative
percentage of communication that they receive and N represents the number of individuals in the
group. In the following year of conducting the Management Game, the measure of
communication evenness was moderately correlated with evenness of e-mail messages sent
within the team (r=0.316, p= 0.002), suggesting some validity of the self-reported measure.
Shared cognitions about expertise. Each member of a team rated him or herself and
every other team member on four dimensions: their knowledge of marketing, strategy, finance,
and production. We calculated the average correlation between pairs of respondents judging the
same target across the four knowledge dimensions. It is equivalent to estimating the reliability of
the judges’ assessments (Rosenthal, 1982). This metric represents overlap of beliefs about who
knows what, and controls for biases in the use of rating scales (Cronbach, 1955). We used this
measure of shared beliefs because we believed coordination in a group would be influenced by

Coordination in Teams Page 17
members’ agreement about the relative expertise of each other on these four dimensions (e.g.,
who is most knowledgeable about finance or production). It is relative judgments that determine
who one would ask for help on a task or who one would assign to a particular activity. We
explicitly decided not to use Rwg (James, Demaree, & Wolf, 1984), because the Rwg compares
absolute judgments and penalizes raters who have different mean values when using a scale.
In general these shared beliefs about expertise were moderately accurate, in the sense that
the average Pearson correlation between group members' evaluation of a target's knowledge and
the target's self assessment was .44 (p<.001).
Coordination. The questionnaire included scales that previous research had developed to
measure interdependence (Van de Ven, 1976) and coordination (Cammann, Fichman, Jenkins, &
Flesh, 1983; Van de Ven, 1976). We also included questions that we had constructed to assess
the adequacy of the team’s ability to relate tasks and share information needed for decisions.
Principal components analysis of each of the three questionnaires we administered
demonstrated non-independence of many of these independently developed scales. In particular,
each survey contained a major factor that can be interpreted as how well-coordinated members of
a team judged the team to be. This coordination factor included agreement with statements such
as “People in this team were able to do their jobs without getting in each other’s way,” and “I
found myself duplicating others’ work (reversed)”. These were originally designed to measure
coordination. This factor also included items such as “It was very easy for me to get information
from other team members when I needed it,” (reversed).” The reliability of this measure was
high at all three time periods (.86, .93, and .90). We therefore constructed a coordination scale by
taking the mean of the 15 items loading most highly on this factor. We consider this to be a
measure of coordination as outcome.

Coordination in Teams Page 18
Board Evaluations. Boards of directors evaluated each team based on its presentations
and reports as well as objective performance data, such as market share, profitability, and stock
price. Boards made their judgments by indicating their level of agreement/disagreement with
statements such as “The team is very likely to meet its financial and marketing objectives,” “The
team has predicted the reactions of its competitors to its strategy,” and “Compared to other
strategic plans and reports that I have read, this one is [7-point Likert scale, with endpoints of
‘unacceptable’ to ‘outstanding’].” Principal components analysis identified only one dimension,
reflecting overall quality of performance, underlying their judgments.
The board evaluation is the mean of multiple evaluation questions, averaged over board
members. The average intercorrelation across three time periods between members of a board
rating each of the 50 teams was .61 (s.d. = .15). The average reliability of this measure across all
judges for a team was high for all three time periods (.80, .84 and .89).
Financial performance. Based on the decisions a team made in relation to those of its
competitors, the simulation calculated a number of financial indicators of team success for each
quarter. We include Sales and Profits. Sales represent the quantity of soap the team sold in the
simulation. In the simulation, sales for soap was determined by the price a team set, the extent to
which their product had attributes that met the consumer’s preferences in different markets,
customer loyalty, the team’s inventory levels during periods of high demand, and the team’s
success at competing in government wholesale auctions, all relative to the performance of
competing teams. Profits represents the gross income the team received from sales (price times
sales) minus the cost of goods sold and operating expenses, including salaries, transportation,
research and development and marketing. Because profits are contingent on sales, we include
sales when predicting profits in the analyses below.
Coordination in Teams Page 19
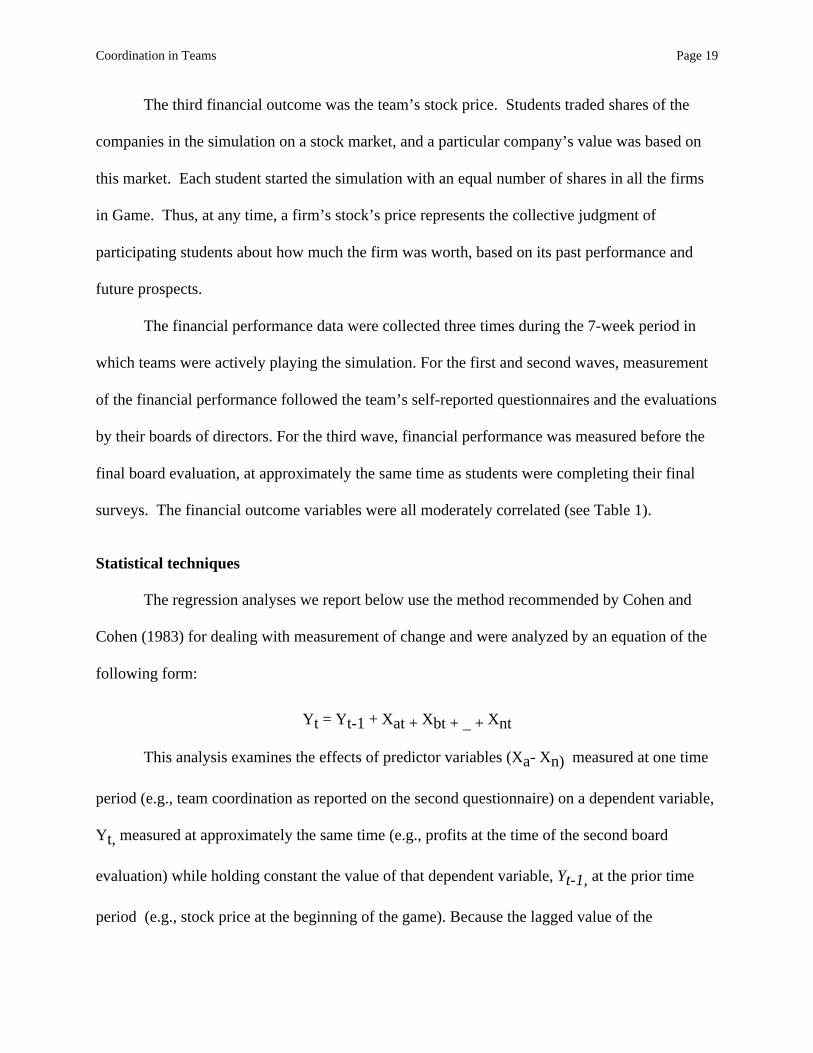
The third financial outcome was the team’s stock price. Students traded shares of the
companies in the simulation on a stock market, and a particular company’s value was based on
this market. Each student started the simulation with an equal number of shares in all the firms
in Game. Thus, at any time, a firm’s stock’s price represents the collective judgment of
participating students about how much the firm was worth, based on its past performance and
future prospects.
The financial performance data were collected three times during the 7-week period in
which teams were actively playing the simulation. For the first and second waves, measurement
of the financial performance followed the team’s self-reported questionnaires and the evaluations
by their boards of directors. For the third wave, financial performance was measured before the
final board evaluation, at approximately the same time as students were completing their final
surveys. The financial outcome variables were all moderately correlated (see Table 1).
Statistical techniques
The regression analyses we report below use the method recommended by Cohen and
Cohen (1983) for dealing with measurement of change and were analyzed by an equation of the
following form:
Yt = Yt-1 + Xat + Xbt + _ + Xnt
This analysis examines the effects of predictor variables (Xa- Xn) measured at one time
period (e.g., team coordination as reported on the second questionnaire) on a dependent variable,
Yt, measured at approximately the same time (e.g., profits at the time of the second board
evaluation) while holding constant the value of that dependent variable, Yt-1, at the prior time
period (e.g., stock price at the beginning of the game). Because the lagged value of the

Coordination in Teams Page 20
dependent variable is included among the regressors, the analysis is equivalent to an analysis of
change scores on Y, controlling for regression towards the mean, unreliability, contemporaneous
co-variation between the outcome and the predictor variables, and other statistical artifacts. In
the example described in this paragraph, one can interpret the regression coefficent associated
with coordination as an estimate of the extent to which variation in a team's current state of
coordination predicts changes to its stock price (or more accurately, variation in its stock price
that was not predictable by its price a few weeks prior).
Each team contributed two observations to this analysis (i.e., when predicting profits at
T2 and T3). Since the errors in these observations are not independent of each other, violating
assumptions of ordinary least squares regression, we analyzed data using the cross-sectional,
time series regression procedure (xtreg) in the Stata statistical package (StatCorp, 2001), with a
random effects design that modeled teams as a random variable. This procedure accounts for the
non-independence of observations.
Tables 3-5 present the results of these analyses as a hierarchical regression analysis.
Figure 2 is a path analysis, summarizing the results relevant to our hypotheses. In these
analyses, interaction terms involving an independent variable have been excluded when
calculating that variable's main effect on a dependent variable; main effects, however, are
included when calculating the impact of interaction terms. (i.e., interactions involving amount of
communication, history, and shared cognitions have been excluded when predicting the main
effects of these variables on coordination, stock price, or board evaluation; main effects have
been included when predicting the impact of the interactions on the dependent variables). We
used regression coefficients to estimate a path model rather than a structure equation model, such

Coordination in Teams Page 21
as LISREL, because the small sample size of 50 teams did not allow estimation of both
measurement and casual parameters in a single structural equation model.
Results
Preliminary analyses
Table 1 shows the means, standard deviations, and standard errors of the mean for all
variables at the three time periods and the correlations among the variables after being averaged
across the three time periods. Note that frequency of communication was negatively correlated
with evenness of communication (r = -.51, p < .001). To guard against potential multi-
colinearity in models testing the influence of communication, we conducted additional analyses,
described below.
Insert Table 1 About Here
Coordination Strategies
The major goal in this research was to investigate the way that frequency of
communication, evenness of communication, shared cognitions about team expertise, and time
working together influenced a team’s ability to coordinate and, through this path, influenced
performance outcomes. In this section, we consider predictors of coordination; in the next
section we examine the effects of coordination on our performance measures.
The first model in Table 2 shows the results for the main-effects analysis; the second
model adds the theoretically relevant first-order interactions. As one would expect, coordination
at one time period predicted coordination at the next (β = .32, p < .01). That is, teams that were
coordinated at one time period continued to be coordinated.

Coordination in Teams Page 22
Hypothesis 1, that more frequent communication would lead to better coordination, was
not supported (β = .04, ns). However, Hypothesis 2, that more even communication would lead
to greater coordination, was supported (β = .17, p=.05, 1-tailed). Overall, teams exhibited high
evenness of communication (see Table 1), close to the theoretical maximum on the scale.
Therefore, the association of evenness of communication with coordination means that the
minority of groups that excluded one of their members from their communication networks
performed worse than the majority of teams who included everyone equally in their networks.
Because communication frequency and communication evenness were themselves moderately
correlated (r= -.51), we conducted two supplementary analyses to assess whether including both
variables into the models predicting coordination distorted the results. We refit Models 1 and 2 in
Table 2 separately, excluding first communication evenness and then communication frequency.
The results are not substantively different than those presented in Table 2: Communication
evenness still predicted increases in coordination, while communication volume did not.
Hypothesis 3, that shared cognitions about the distribution of expertise within the team
would lead to greater coordination, was also supported (β = 22, p <.01). Coordination increased
more among teams whose judgments of each other’s knowledge were more similar.
As predicted by Hypothesis 4, coordination increased as teams worked together longer.
The coefficient of .36 (p. < .05) for Time in Model 1 of Table 2 indicates that, on average, teams
increased their coordination approximately one-third of a scale point in the original measurement
units, or approximately two-thirds of a standard deviation, between administrations of the
questionnaire. This is a moderate effect size.
Model 2 shows the results of the analysis with the three predicted interactions included.
Consistent with Hypothesis 5, shared beliefs and communication seem to be able to substitute for

Coordination in Teams Page 23
each other (β = -.21, p < .05). The interaction plot in Figure 1A shows that teams that had both
below-average shared cognitions about others’ knowledge and below-average communication
were poorly coordinated, while teams that had either one of these were better coordinated.
Having both above-average communication frequency and above-average shared cognitions
conferred no additional advantage.
There was no support for Hypothesis 6. Communication did not have stronger effects on
coordination early in a team's history. However, consistent with Hypothesis 7, teams gained
more from shared beliefs earlier in their history than they did later on (β = -.42, p =.01). The
interaction plot in Figure 1B indicates that teams with higher shared cognitions improved their
coordination more between time periods one and two than teams with fewer shared cognitions.
However, shared cognitions did not confer a similar advantage between time periods two and
three.
Insert Table 2 and Figure 1 About Here
Effects of Coordination on Performance
Table 3 shows the effects of each coordination strategy, the interactions among these
strategies, and team coordination on the teams’ performance outcomes. Common business
practice indicates that the financial performance outcomes for a firm are themselves causally
interrelated. Profits are constrained by a firm’s sales. Investors rely upon a firm’s current profits
to predict its future performance; therefore stock market price is dependent upon profits. Finally,
boards of directors, representing shareholders interests, are influenced by these financial
performance measures. Therefore we include causally prior financial outcomes in the models of
performance below.

Coordination in Teams Page 24
To summarize the major results reported in more detail below, teams’ performance
outcomes improved more during periods when the teams were more coordinated, holding
constant their previous performance outcomes and the financial outcomes during that period.
Insert Table 3 About Here
Sales. Model 1 in Table 3 shows sales as a dependent variable. The only reliable
predictor of a team’s sales during one time period was its sales in the immediately preceding
period (β = .46, p < .001).
Profits. Model 2 in Table 3 shows profits as the dependent variable. Profits declined with
time, as the game became more competitive (β = -.31, p < .05). Firms with larger sales were
more profitable (β = .67, p < .001). Consistent with Hypothesis 8, teams that were more
coordinated had larger profits, even holding constant sales and profits in the prior period (β =
.21, p < .01).
Firm Price. Model 3 in Table 3 shows a firm’s stock price as the dependent variable.
Recall that stock price is the amount that other students in the class were willing to pay for a
share of the firm’s stock in the Management Game stock market. It represents their assessment
of that firm's prior performance and future earnings.
Stock prices increased with time (β = .61, p < .001), in part driven by the law of supply
and demand, as the amount of cash in the simulated economy increased while the number of
stock shares remained constant. A company’s previous stock price was a good predictor of its
subsequent stock price (β = .66, p < .001). In addition, firms that were more profitable had larger
increases in their stock price (β = .47, p < .001). Holding constant these financial considerations

Coordination in Teams Page 25
and consistent with Hypothesis 8, teams that were more coordinated had larger run-ups in their
stock prices (β = .20, p < .01).
Board Evaluations. Model 4 in Table 3 shows the boards of directors’ evaluation of the
team as the dependent variable. Prior evaluations (β = .44, p < .001), current profits (β = .32, p <
.001) and current stock price (β = .32, p<.10) predicted the evaluation a team received from its
boards. Board evaluations tended to be stable, with teams that received a high evaluation at one
time tending to receive high ones at subsequent times. In addition, the boards were sensitive to
objective measures of performance: higher profits and stock prices predicted their evaluations.
Although we had made no predictions about how communication would directly
influence performance, for this dependent variable, the evenness of a team’s communication
predicted larger increases in board evaluations (β = .17, p < .01). Finally, consistent with
Hypothesis 8, independent of past evaluations of the team and the team's objective performance,
a team's current level of coordination predicted boards' evaluations: teams that reported
themselves as more coordinated improved their evaluations more than less coordinated teams (β
= .20, p < .01). We suspect that both even levels of communication and coordination influenced
the board evaluations over and above the objective measures of performance, because a team’s
communication and its coordination was directly visible to its board during their multi-hour
reviews.
Mediation or indirect effects. The coefficients in Tables 2 and 3 and summarized in
Figure 2 represent a path analysis (Wright, 1921) of the hypothesized causal relationships among
variables in this study. In each stage of the model, variables hypothesized to be causally prior
have been held constant. We follow Cohen and Cohen’s suggestion and use unstandardized beta
weights in the path analysis, because these are more stable over replications than standardized

Coordination in Teams Page 26
beta weights (Cohen & Cohen, 1983). We do not use a structural equation model, such as
LISREL, because the relatively small number of teams in the study precludes simultaneously
assessing both the measurement and the causal models.
Insert Figure 2 About Here
Taken together, the path analysis shows that group process variables—communication
and shared beliefs about expertise—influenced coordination, which in turn influenced team
performance. A follow-up analysis to those presented in Table 3 tested whether coordination
mediated any direct relationship between group process variables and performance (Baron &
Kenny, 1986). This test examines whether the direct relationship between an independent and
dependent variable is significantly reduced when the presumptive mediator is entered into the
equation. As seen in Table 1, none of the communication or shared belief measures had a
significant direct correlation with any of the three financial performance measures. Therefore,
coordination could not mediate these relationships. However, as seen in Table 1, both evenness
of communication and shared cognitions about the distribution of expertise in a team were
significantly correlated with the board’s evaluation of team. However, comparison of the Model
4 in Table 3 with a similar model excluding coordination shows no evidence of mediation. Thus,
the group process variables primarily had indirect effects on a team’s performance through their
influence on coordination. Only evenness of communication had a direct effect on board
evaluations.

Coordination in Teams Page 27
Discussion
The results of this research help increase our understanding of the strategies teams use to
achieve coordination, how some of these strategies interact with one another, and the effects of
coordination on teams’ performance.
Coordination Strategies
Our research suggests that both work process and group history influence coordination.
To summarize the results, coordination was influenced by evenness of communication, shared
cognitions about the distribution of expertise within the team, and time working together.
Coordination was also influenced by the interactions between shared cognitions and frequency of
communication, and between shared cognitions and team history. Contrary to our predictions,
however, there was neither a main effect of communication frequency on coordination, nor an
interaction of communication frequency with history working together.
The failure to find a main effect of frequency of communication on coordination is in
contrast to previous studies demonstrating the value of communication for team performance
(e.g., Cummings, 2001; Kiesler, Wholey & Carley, 1994; Pelz & Andrews, 1966; Thompson,
1967; Van de Ven, 1976). Although more communication is typically associated with better
coordination and performance, this relationship is not inevitable. Part of the problem is
methodological. In cross sectional research, it is impossible to distinguish cases when excess
communication harms performance from cases where teams increase their communication to
compensate for poor coordination and performance (Smith, 1994). A more substantive problem
is that communication takes time and effort, which group members could use to perform their
individual tasks (Perlow, 1999). Therefore we conducted supplementary analyses to determine
whether communication frequency had a curvilinear relationship with coordination. There was

Coordination in Teams Page 28
no increase in R-squared when the squared value of communication frequency added to Model 2
in Table 2 and the coefficient for the curvilinear component of communication was not
statistically significant. Thus there was no evidence from this experiment that lower performing
teams were communicating “too much”.
In contrast, we did find a main effect of evenness of communication on coordination. On
average team members communicated very evenly (with a mean of .93 on a index with a
theoretical maximum of 1.0). There was, however, variation around this mean. The significant
effect of even communication implies that greater evenness of communication, not withstanding
high average evenness of communication, improve performance. This result did not occur simply
because teams with the least even communication were especially uncoordinated. Results were
substantively the same after excluding the ten-percent of the teams with the least even
communication. These results strongly suggest that in the small managerial teams typical of this
simulation, involving everyone equally in communication improves coordination and, ultimately,
performance.
As predicted, shared cognition among team members about the distribution of expertise
was associated with increases in coordination. These shared cognitions likely facilitated task
assignment, information distribution, advice-seeking, and the like. Although the focus in this
research and the literature as a whole is on knowledge of the distribution of expertise within a
group. However, it is also possible that agreement about distribution of expertise is associated
with other shared beliefs as well, including a common view of goals, strategies, and work tasks.
This is likely because agreement about expertise was acquired in the context of performing and
discussing particular tasks, as teams developed and executed a strategy. In general these
members’ beliefs about the distribution of expertise were accurate (i.e., the correlation between

Coordination in Teams Page 29
groups members' evaluation of a target's knowledge and the target's self-assessment was high).
Whether shared cognitions would have the same effects if they were inaccurate is an open
question.1
Our finding that work history led to greater coordination is consistent with other research
showing that teams that worked together longer improve performance, at least to some limit
(Katz, 1982). It is likely that experience of working together improves coordination through
multiple routes. Part of the improvement occurs because individuals perform better when they
are more familiar with many features of their work environment, including tools, the physical
environment, and the people they work with (Goodman & Leyden, 1991). Surprisingly,
however, teams’ knowledge about the expertise of other members did not increase over time.
Neither shared cognitions (average correlations among team members) nor accuracy (average
correlations between team members judgments and a target’s self-assessment) increased over
administrations of the questionnaire (r=-05 and .12 respectively). These findings are reminiscent
of Levesque, Wilson and Wholey’s findings (2001) that shared cognitions about many aspects
of a team’s environment declined as they worked together and increased their division of labor.
Part of the improvement in team’s coordination with experience occurs because groups
become more efficient in communication as they work together (Kanki, Folk, & Irwin, 1991;
Kanki & Foushee, 1989; Krauss & Fussell, 1991). In addition, we believe that part of the
1 We focused on agreement in beliefs rather than accuracy for three reasons. First, these two attributes of sharedbeliefs are inherently related, in the sense that when individuals have beliefs about a common object that areperfectly accurate they are necessarily in perfect agreement with each other. This connection makes it difficult totease apart the separate contributions of agreement and accuracy. Second, there are fundamental ambiguities indefining the accuracy of person perception judgments (Cronbach, 1955). For example, it is possible to use anindividual's self-assessment as the criterion against which others' assessments are evaluated. In the case of personperception judgments, however, there is little reason to believe that self-assessments are closer to the truth thanothers' assessments. Finally, in analyses not reported in this paper, we included both agreement between self andothers, which can be thought of as an accuracy measure, and the agreement among others, our consensus measure, topredict coordination and performance outcomes. Including the accuracy measure did not improve the predictivepower of any of our models, and so it was eliminated for reasons of parsimony and simplicity of presentation.

Coordination in Teams Page 30
improvement occurs because groups develop standard operating procedures as they work
together longer (Gersick & Hackman, 1990). One limitation of this research is that we did not
directly measure the development of standard operating procedures, and therefore, cannot
definitively point to their role in improving coordination over time.
Our findings also highlight some of the ways in which coordination strategies can
interact. Stout, Cannon-Bowers, Salas, & Milanovich {, 1999 #1123}theorize that shared
cognitions should allow groups to coordinate with less explicit communication. Our study is
consistent with this prediction. The interaction between shared cognitions and communication
frequency suggests that shared beliefs and communication are alternate ways of achieving
coordination. Teams were relatively uncoordinated when they had neither shared cognitions nor
adequate communication, but being above average on either communication or shared cognitions
improved coordination. However, being above average on both did not further increase
coordination. It is important to understand more fully the developmental process by which
shared cognitions can substitute for other means of coordination. Because we collected data at
only three time periods in the present study, however, we do not have sufficient data to
determine in detail how these tradeoffs evolved.
The negative interaction between shared cognitions about expertise and time is consistent
with Moreland, Argote, and their colleagues’ suggestion that shared cognitions about expertise
have their impact on group performance primarily by facilitating in task assignment (Liang,
1995; Moreland et al., 1996). Early in their history, when many tasks were new, teams need to
understand each other’s skills and abilities to match team members to these tasks. For example,
in the present simulation, team members needed to assess who was most knowledgeable about
finance or production before assigning members to executive roles, and they needed to know

Coordination in Teams Page 31
who was most computer-savvy and could program spreadsheets to assign someone the task of
uploading data. It is likely that later in their history, these assignments would have been
routinized as part of the team’s standard operating procedures, and they no longer needed to
return to the basics for the initial decisions.
Coordination as outcome
As expected, teams that were better coordinated had better outcomes, with Hypothesis 8
being confirmed for the outcomes of profits, stock price, and board evaluations. The effect of
coordination on profits remained, even after controlling for sales, which itself was a major
determinant of a team’s profit. This finding suggests that teams that were more rather than less
coordinated were able to wring greater profits from a comparable level of sales. Sales directly
reflect a team’s decisions about product quality and pricing. In the simulation, consumers bought
more product if it met their preferences and was inexpensive. However, within this general
economic model, teams had latitude to influence profits. They could charge more for their
product in regions where consumers were relatively insensitive to price or where they
particularly appreciated some product feature, like environmental friendliness. They could react
quickly to price changes by competitors, to retain their own competitive position. They could
control costs, by avoiding stock outs, by selling their products in regions close to their factories
to reduce transportation costs, by maintaining efficient plant capacity, or by advertising only in
regions where consumers were sensitive to this type of marketing. Increasing revenues or
reducing costs through these methods required decision-making and performance involving
multiple team members. It appears that better coordinated teams were able to integrate
information across functional areas to make and execute these business decisions.

Coordination in Teams Page 32
A team’s coordination had an impact on its board of directors’ evaluations over and
above the team’s financial performance, as measured by sales, profits and stock prices. Why was
this the case? One reason is that the board members had direct access to rich information about
the team above and beyond financial data. In particular, board members could directly evaluate
the quality of the management team, the coherence of their strategy, their future plans to deal
with competitors and how well they supported each other during meetings. That is, by reading
planning documents and observing meetings, the boards of directors had evidence directly
relevant to a team's coordination and rewarded teams through higher evaluations if they appeared
more coordinated.
Limitations and Future Directions
Inferring causation. Our theoretical model and the summary of results in Figure 2
presents the relationships among variables as unidirectional. Methodologically, we have used
time series data to infer the direction of causation. This research design allows stronger causal
inferences than is possible from cross-section designs. In general, self-reported measures of
group process were collected before measures of group performance, although at time three,
these variables were measured contemporaneously. Our analyses included lagged dependent
variables, which further strengthen the causal claims we are making. By including lagged
dependent variables in the models, the analyses model the way an independent variable at one
time period influences changes in the dependent variable from the preceding time period (Cohen
& Cohen, 1983). The influence of the dependent variable at the prior period is partialled from
both the dependent variable and from the independent variables in the current period.
Despite the panel design, both theoretically and empirically, the relationships among the
key variables are likely to be bi-directional. While our methods demonstrate one of the causal

Coordination in Teams Page 33
paths, they do not preclude others. As an example, consider the links between communication,
shared cognitions, and coordination. Our results suggest that evenness of communication and
shared beliefs both increase coordination, and that communication frequency and shared beliefs
trade off in causing coordination. However, alternative causal paths are also plausible. For
example, as research by Smith and his colleagues suggests, groups that are poorly coordinated at
one period may subsequently increase their communication to get back on track (Smith, 1994).
Similarly, when a team discovers that work assigned to one member is not being done in a timely
way (a symptom of poor coordination), this discovery may change their assessment of the
distribution of expertise in the group and may also increase communication levels as they try to
resolve the problem. Both experimental research and observational research with a finer
temporal granularity could help resolve some of these ambiguities about causal direction.
The nature of shared cognitions. The current research looked at only one type of shared
cognitions–consensus about the distribution of expertise within the team. The focus of our own
research and much of the organizational literature on transactive memory has been on slowly
changing aspects of a team’s internal environment—team members’ expertise and skills. We
expect that these shared cognitions represent many beliefs about relatively slowly changing
aspects of a team’s internal environment. However, it is unclear how results obtained from
examining shared cognitions about expertise would generalize to shared cognitions about more
rapidly changing features of the internal team environment, such as others' time availability
(Perlow, 1999) or about shared beliefs about the external environment, such as the behavior of
competitors.
Despite the focus in the small groups literature on transactive memory and other beliefs
about the internal environment (e.g., Liang, Moreland & Argote, 1995; Hollingshead, 200),

Coordination in Teams Page 34
future research should also look at shared cognitions about the external environment. Situational
awareness (Endsley, 1995) or knowledge about the external environment may be even more
important in predicting a team’s performance. There is substantial evidence that for teams
embedded in organizations, as opposed to laboratory groups, mechanisms for focusing on the
external environment are crucial to success, especially in a changing environment. In particular,
research in managerial decision-making teams (D'Aveni & MacMillan, 1990), software
engineering teams (Curtis, 1988) and new product development teams (Ancona & Caldwell,
1992) all suggest that failure results when teams ignore such changes as the preferences of their
customers, the behavior of their competitors, or the technology base on which they are
performing their work.
Conclusion
Our research has important consequences of team coordination for performance and
interesting tradeoffs among the strategies teams use to achieve coordination. Shared cognitions
seem to be alternatives to compensate for deficits in communication and a history of working
together in achieving coordination. Additional research is needed to understand the causal route
by which shared cognitions are formed and through which they influence group process and
outcomes more generally. Qualitative studies of the nature of teams’ communication could be
especially valuable. In addition, there is a need for the development of detailed process models.
We also believe that more empirical research is needed to identify the effects of different types
of shared cognitions.

Coordination in Teams Page 35
Acknowledgements
This research was funded by NSF grant #IIS-9812123. We thank Linda Argote and
several anonymous reviewers for their helpful comments on earlier versions of this paper.

Coordination in Teams Page 36
TABLES
Table 1. Means, standard deviations, and standard errors of the mean for variables used in regression equations.
Variable (range in parentheses) Mean Std. Dev Mean Std. Dev Mean Std. Dev 1 2 3 4 5 6 7
1 Frequency of Communication (1-5) 3.14 .52 2.32 .51 2.43 .58
2 Evenness of Communication (.00-1.00) .93 .05 .93 .04 .93 .05 -.51
3 Shared Cognition (-1.00-1.00) .44 .15 .46 .19 .42 .24 .17 .05
4 Coordination (1-5) 3.70 .36 3.75 .64 3.93 .48 -.03 .26 .38
5 Sales ($15,039-$82,930) 35,349 8,045 37,961 9,346 37,488 12,893 -.15 .16 -.02 .01
6 Profits (-$5,247 - $12,504) 2,295 2,526 1,828 3,151 1,178 3,224 -.07 .21 .12 .41 .71
7 Stock Price per Share ($33.66- $192.61) 70.75 18.98 75.97 20.80 100.38 36.89 .16 .19 .16 .40 .62 .76
8 Board Evaluation (1-6) 4.66 .88 4.93 1.06 5.37 1.14 .04 .28 .28 .59 .42 .62 .65
Note: N=50 for all analyses. For the correlations, |r| >=.27, p <.05; |r|>=.36, p<.01
Correlations (data collapsed across wave)Time 1 Time 2 Time 3

Coordination in Teams Page 37
Table 2: Predicting coordination
Model 1 Model 2Main effects Main effects + interactions
Variable Beta SE p-value Beta SE p-valueIntercept -.76 .43 -1.08 .48 *Lagged Coordination .32 .10 ** .41 .10 ***Frequency of Communication .04 .14 -.56 .56Evenness of Communication .17 .12 .19 .11 +Shared Cognitions about Expertise .22 .09 ** 1.21 .44 **Time (Team History) .36 .10 * .49 .18 **Communication Frequency X Shared Cognitions -.21 .11 *Time X Communication Frequency .27 .22Time X Shared Cognitions -.42 .17 **
Rsq .38 .44Change in Rsq .06df 44 41Wald Chi Square 33.99 47.40Difference in Chi Square 13.41 **
Note: 1-tailed p-values
+ p <= .05, * p <= .025 , ** p <= .01 , *** p <= .001

Coordination in Teams Page 38
Table 3: Predicting team performance
Model 1 Model 2 Model 3 Model 4Sales Profits Stock price Board evaluation
Variable Beta SE p Beta SE p Beta SE p Beta SE pIntercept .25 .61 .57 .38 -1.00 .45 -.23 .39Lagged dependent variable .46 .13 *** .03 .08 .66 .12 *** .44 .09 ***Frequency of Communication -.53 .68 .26 .43 .40 .18 .05 .41Evenness of Communication -.13 .13 .01 .09 .05 .09 .17 .08 **Shared Cognitions .13 .52 .14 .33 -.21 .36 -.35 .31Time (Team History) -.08 .24 -.31 .15 * .61 .18 *** .20 .16Coordination -.05 .11 .21 .08 ** .20 .08 ** .20 .07 **Time X Communication Frequency .11 .27 -.13 .17 -.11 .19 .02 .16Time X Shared Cognitions -.09 .20 .09 .12 .01 .14 .13 .12Communicaton Freq. X Shared Cognitions -.13 .13 .03 .08 -.02 .09 -.06 .08Sales .67 .17 *** -.03 .10 -.04 .08Profits .47 .11 *** .32 .10 ***Stock price .14 .08 †
Rsq .21 .61 .63 .71df 41 39 38 37
Note: † p < .10, * p < .05, ** p < .01, *** p < .001

Coordination in Teams Page 39
Figure 1. Interactions of shared cognitions and history and communication frequency on coordination.
Note. For illustration, interaction plots show level of coordination when (A) frequency of communication was a standard deviation
above the mean (high communication) or below (low communication) or (B) when coordination was measured at the second
questionnaire or the third questionnaire shared crossed with shared cognition when it was a standard deviation above the mean
(high agreement) and below the mean (low agreement).
(B) Shared cognition x
History
1
0.8
0.6
0.4
0.2
0.2
0.4
0.6
econd hird
Questionnaire Wave
Low agreement
High agreement
(A) Shared cognition x Communication
-0.8
-0.6
-0.4
-0.2
.2
.4
.6
Low igh
Communication
igh agreement
ow agreement

Coordination in Teams Page 40
Figure 2: Path model, summarizing the relationships among time, communication, shared cognitions, coordination, and
performance outcomes.
Note: Numbers represent unstandardized beta weights. Only relationships where p < .05, 1-tailed, have been retained. Models
control for the lagged dependent variable, but this link has not been shown for simplicity.
Coordination
Communicationfrequency
Communicationevenness
Time
Sharedcognitions
Stock price
Sales
Profits
Board evaluation
TimeX
Sharedcognitions
Shared cognitionsX
Communicationfrequency
.49
.19
.11
.17
1.21
.17
-.31
.61
.32
.21
.20
.20

Coordination in Teams Page 41
References
Alker, H. R. J., & Russett, B. M. (1964). On measuring inequality. Behavioral Science, 9, 207-
218.
Allen, T. (1977). Managing the flow of technology. Cambridge, MA: MIT Press.
Ancona, D., & Caldwell, D. (1992). Bridging the boundary: External activity and performance in
organizational teams. Administrative Science Quarterly, 37, 634-665.
Argote, L., Gruenfeld, D., & Naquin, C. (2000). Group learning in organizations. In M. Turner
(Ed.), Groups at work: Advances in theory and research. New York: Erlbaum.
Argote, L., & McGrath, J. E. (1993). Group processes in organizations: Continuity and change.
In C. L. Cooper & I. T. Robertson (Eds.), International Review of Industrial and
Organizational Psychology (8th ed., pp. 333-389). New York: John Wiley & Sons.
Argyes, N. S. (1999). The impact of information technology on coordination: Evidence from the
B-2 "stealth" bomber. Organization Science, 10(2), 162-180.
Baron, R. M., & Kenny, D. A. (1986). The moderator-mediator variable distinction in social
psychological research: Conceptual, strategic, and statistical considerations. Journal of
Personality & Social Psychology, 51(6), 1173-1182.
Blickensderfer, E. L. (2000). Role of experience and team knowledge in team process and
performance. Dissertation Abstracts International: Section B: The Sciences & Engineering,
61(2-B), 1116.
Brooks, F. P. (1975). The mythical man-month. Reading, MA.: Addison-Wesley.

Coordination in Teams Page 42
Cammann, C., Fichman, M., Jenkins, D., & Flesh, J. R. (1983). Assessing the attitudes and
perceptions of organizational members. In S. E. Seashore & E. Lawler & P. H. Mirvis & C.
Cammann (Eds.), Assessing organizational change (pp. 71-138). New York: John Wiley &
Sons.
Cannon-Bowers, J. A., Salas, E., & Converse, S. (1993). Shared mental models in expert team
decision making. In N. J. Castellan, Jr. (Ed.), Individual and group decision making: Current
issues (pp. 221-246). Hillsdale, NJ: Lawrence Erlbaum Associates.
Clark, H., & Brennan, S. (1991). Grounding in communication. In L. Resnick & J. Levine & S.
Teasley (Eds.), Perspectives on socially shared cognition (pp. 127-149). Washington DC:
American Psychological Association.
Cohen, J., & Cohen, P. (1983). Applied Multiple Regression/Correlations Analysis for the
Behavioral Sciences (2nd Edition) (2nd Edition ed.). Hillsdale, NJ: Lawrence Erlbaum
Associates.
Cohen, K. J., Dill, W. R., Kuehn, A. A., & Winters, P. R. (1964). The Carnegie Tech
Management Game: An experiment in business education.Unpublished manuscript.
Cramton, C. D. (2001). The mutual knowledge problem and its consequences for dispersed
collaboration. Organization Science Special Issue, 12(3), 346-371.
Cronbach, L. (1955). Processes affecting scores on "understanding of others" and "assumed
similarity." Psychological Bulletin, 52, 177-193.
Cummings, J. (2001). Work groups and knowledge sharing in a global organization. Carnegie
Mellon University, Pittsburgh, PA.
Curtis, B., Krasner, H., and Iscoe, N. (1988). A field study of the software design process for
large systems. Communications of the ACM, 31(11), 1268-1287.

Coordination in Teams Page 43
D'Aveni, R., & MacMillan, I. (1990). Crisis and the content of managerial communications: A
study of the focus of attention of top managers in surviving and failing firms. Administrative
Science Quarterly, 35, 634-657.
Endsley, M. R. (1995). Toward a theory of situation awareness in dynamic systems. Human
Factors Special Issue: Situation awareness, 37(1), 32-64.
Fiore, S. M., Salas, E., & Cannon-Bowers, J. A. (2001). Group dynamics and shared mental
model development. In M. London (Ed.), How people evaluate others in organizations (pp.
309-336). Mahwah, NJ: Lawrence Erlbaum Associates.
Gabarro, J. J. (1978). The development of trust, influence, and expectation. In A. G. Athos & J.
J. Gabarro (Eds.), Interpersonal behavior: Communication and understanding in
relationships (pp. 290-303). Englewood Cliffs, NJ: Prentice Hall.
Gersick, C. J., & Hackman, J. R. (1990). Habitual routines in task-performing groups.
Organizational Behavior & Human Decision Processes, 47(1), 65-97.
Goodman, P. S., & Leyden, D. P. (1991). Familiarity and group productivity. Journal of Applied
Psychology, 76(4), 578-586.
Goodman, P. S., & Shah, S. (1991). Familiarity and work group outcomes. In S. Worchel & W.
Wood & et al. (Eds.), Group process and productivity (pp. 276-298). Thousand Oaks, CA,
US: Sage Publications.
Hoegl, M., & Gemuenden, H. G. (2001). Teamwork quality and the success of innovative
projects: A theoretical concept and empirical evidence. Organizational Science, 12(4), 435-
449.
Hollingshead, A. B. (2000). Perceptions of expertise and transactive memory in work
relationships. Group Processes & Intergroup Relations, 3(3), 257-267.

Coordination in Teams Page 44
Isaacs, E. A., & Clark, H. H. (1987). References in conversation between experts and novices.
Journal-of-Experimental-Psychology-General, 116(1), 26-37.
James, L. R., Demaree, R. G., & Wolf, G. (1984). Estimating within-group interrater reliability
with and without response bias. Journal of Applied Psychology, 69(1), 85-98.
Kanki, B. G., Folk, V. G., & Irwin, C. M. (1991). Communication variations and aircrew
performance. International Journal of Aviation Psychology, 1(2), 149-162.
Kanki, B. G., & Foushee, H. C. (1989). Communication as group process mediator of aircrew
performance. Aviation, Space, & Environmental Medicine, 60(5), 402-410.
Karau, S. J., & Williams, K. D. (1993). Social loafing: A meta-analytic review and theoretical
integration. Journal of Personality & Social Psychology, 65(4), 681-706.
Katz, D., & Kahn, R. (1978). The social psychology of organizations. New York: Wiley.
Katz, R. (1982). The effects of group longevity on project communication and performance.
Administrative Science Quarterly, 27, 81-104.
Kiesler, S., Wholey, D., & Carley, K. M. (1994). Coordination as linkage: The case of software
development teams. In D. H. Harris (Ed.), Organizational linkages: Understanding the
productivity paradox (pp. 214-239). Washington, DC: National Academy Press.
Krauss, R. M., & Fussell, S. R. (1991). Perspective-taking in communication: Representations of
others' knowledge in reference. Social Cognition Special Issue: Social cognition and
communication: Human judgment in its social context, 9(1), 2-24.
Krauss, R. M., & Weinheimer, S. (1966). Concurrent feedback, confirmation, and the encoding
of referents in verbal communication. Journal of Personality & Social Psychology, 4(3), 343-
346.

Coordination in Teams Page 45
Larson, J. R., Christensen, C., Abbott, A. S., & Franz, T. M. (1996). Diagnosing groups:
Charting the flow of information in medical decision-making teams. Journal of Personality &
Social Psychology, 71(2), 315-330.
Larson, J. R., & Schaumann, L. J. (1993). Group goals, group coordination, and group member
motivation. Human Performance, 6(1), 49-69.
Leavitt, H. (1951). Some effects of certain communication patterns on group performance.
Journal of Abnormal and Social Psychology, 46, 38-50.
Levesque, L. L., Wilson, J. M., & Wholey, D. R. (2001). Cognitive divergence and shared
mental models in software development project teams. Journal of Organizational Behavior,
22(SpecIssue), 135-144.
Liang, D., Moreland, R., & Argote, L. (1995). Group versus individual training and group
performance: The mediating role of transactive memory. Personality and Social Psychology
Bulletin, 21, 384-393.
Malone, T., & Crowston, K. (1994). The interdisciplinary study of coordination. ACM
Computing Surveys, 26(1), 87-119.
March, J., & Simon, H. (1958). Organizations. New York: Wiley.
Mathieu, J. E., Heffner, T. S., Goodwin, G. F., Salas, E., & Cannon-Bowers, J. A. (2000). The
influence of shared mental models on team process and performance. Journal of Applied
Psychology, 85(2), 273-283.
McGrath, J. E., Arrow, H., Gruenfeld, D. H., Hollingshead, A. B., & et al. (1993). Groups, tasks,
and technology: The effects of experience and change. Small Group Research, 24(3), 406-
420.

Coordination in Teams Page 46
Mohammed, S., & Dumville, B. C. (2001). Team mental models in a team knowledge
framework: Expanding theory and measurement across disciplinary boundaries. Journal of
Organizational Behavior Special Issue: Shared cognition, 22(SpecIssue), 89-106.
Moreland, R. L. (2000). Transactive memory: learning who knows what in work groups and
organizations. In L. Thompson, D. Messick, & J. Levine, (Eds.) Shared cognition in
organizations: The management of knowledge. Hillsdale, NJ: Lawrence Erlbaum Associates.
Moreland, R. L., Argote, L., & Krishnan, R. (1996). Socially shared cognition at work:
Transactive memory and group performance. In A. M. Brower (Ed.), What's social about
social cognition? Research on socially shared cognition in small groups (pp. 57-84).
Thousand Oaks, CA: Sage Publications.
Moreland, R. L., Argote, L., & Krishnan, R. (1998). Training people to work in groups. In L.
Heath (Ed.), Theory and research on small groups (pp. 37-60). New York, NY: Plenum Press.
Olivera, F. (1999). Memory systems in organizations. Unpublished Doctoral Dissertation,
Carnegie Mellon University, Pittsburgh, PA.
Orasanu, J., & Salas, E. (1993). Decision making in action: Models & methods. In G. Klein & J.
Orasanu & R. Calderwood & C. Zsambok (Eds.), Team decision making in complex
environments. (pp. 327 -359). Norwood, NJ: Ablex Publishing.
Pelz, D., & Andrews, F. (Eds.). (1966). Scientists in organizations: Productive climates for
research and development. New York: Wiley.
Perlow, L. A. (1999). The time famine: Toward a sociology of work time. Administrative
Science Quarterly, 44(1), 57-81.

Coordination in Teams Page 47
Rosenthal, R. (1982). Conducting judgment studies. In K. R. Scherer & P. Ekman (Eds.),
Handbook of methods in nonverbal behavior research (pp. 287-361). New York: Cambridge
University Press.
Shaw, M. (1964). Communication networks. In L. Berkowitz (Ed.), Advances in experimental
social psychology (pp. 111-147). New York: Academic Press.
Smith, K., Smith, K., Olian, J., Sims, H., O'Bannon, D., & Scully, J. (1994). Top management
team demography and process: The role of social integration and communication.
Administrative Science Quarterly, 39, 412-438.
SPSS. (1997). SPSS Missing Value Analysis 7.5. Chicago, IL: Author.
StatCorp. (2001). Stata Statistical Software: Release 7.0. College Station, TX: Stata Corporation.
Steiner, I. (1972). Group process and productivity. New York: Academic Press.
Stout, R. J., Cannon-Bowers, J. A., Salas, E., & Milanovich, D. M. (1999). Planning, shared
mental models, and coordinated performance: An empirical link is established. Human
Factors, 41(1), 61-71.
Thompson, J. (1967). Organizations in action. New York: McGraw-Hill.
Tushman, M. (1979). Work characteristics and subunit communication structure: A contingency
analysis. Administrative Science Quarterly, 24primary, 82-98.
Van de Ven, A., Delbecq, A., & Koenig, R. (1976). Determinants of coordination modes within
organizations. American Sociological Review, 41, 322-338.
Wegner, D. M. (1987). Transactive memory: A contemporary analysis of the group mind. In I.
B. Mullen & G. R. Goethals, (Eds.) Theories of group behavior. NY: Springer-Verlag.
Wright, S. (1921). Correlation and causation. Journal of Agricultural Research, 20, 557-585.


![Katherine Bessie`re, Sara Kiesler, Robert Kraut & …kraut.hciresearch.org/sites/kraut.hciresearch.org/files...Downloaded By: [University of Canterbury] At: 04:11 5 March 2008 Katherine](https://img.pdfslide.us/doc/110x75/5ab8d2307f8b9ac10d8d6ce7/katherine-bessiere-sara-kiesler-robert-kraut-kraut-by-university-of-canterbury.jpg)