Embed Size (px)
Citation preview
e-Perimetron, Vol. 2, No 2, Spring 2007 [80-91] www.e-perimetron.org | ISSN 1790-3769
[80]
Evangelos Livieratos∗, Angeliki Tsorlini**, Chryssoula Boutoura***
Coordinate analysis of Ptolemy’s Geographia Europe Tabula X
with respect to geographic graticule and point positioning
in a Ptolemaic late 15th century map
Keywords: Ptolemy’s Geographia; Ptolemy’s coordinates; ptolemy maps; history of maps;
map comparison; cartometry; optimal fitting
Summary
Claudius Ptolemy, in his Geographia, gives a list of geographic coordinates of
spherical longitude and latitude of almost ten thousand point locations on the earth
surface, as they were known at his times. The list is organized in Tabulae which cor-
respond to specific regions of the three known continents at that time, Africa, Asia
and Europe. One of these Tabulae is the 10th of Europe (Tabula X) in which almost
500 sets of spherical longitude – latitude coordinates cover the major part of the ac-
tual territory of Greece. Having, in one hand, the coordinates of the points and, on
the other, relevant map depictions of Tabula X, a computational methodology was
developed in order to test the consistency of the coordinates with respect to their
point-wise and graticule-wise representation on maps, which are derived on the basis
of Ptolemy’s Geographia. In our study, the list of Tabula X coordinates, coming
from the Donnus Nicolaus Germanus 15th century manuscript were cross-checked
with respect to the relevant Nobbe’s (1843) and Müller’s catalogues (1883) and the
Tabula X facsimile map from the 1490 de Turre’s printed Rome edition of Geo-
graphia was transformed in digital form. The two digital files (coordinates vs image)
were then brought into a best fitting correspondence using, in a first scheme of com-
parison, the map graticule of meridians and parallels and in a second, the point posi-
tioning as represented on the map. The results show an interesting deviation of the
two comparison schemes proving that the positioning of the points on the map do not
correspond to the geographic graticule and vice-versa. This result raises the question
on the graphic correspondence between the graticule and the point positioning from
the technical drafting point of view, in preparing the Ptolemaic maps.
Introduction
The geometric part of Claudius Ptolemy’s Geographia refers mainly to the list of spheri-
cal coordinates, in sets of longitude and latitude, which is given in the text concerning
almost ten thousand of point positions on the globe as they were known in the Ptolemy’s
days. The coordinates, rounded-off in five minutes of arc, in both orthogonal primer di-
rections (parallels and meridians), are grouped according to the continental and regional
classification followed by Ptolemy in his Geographia. Based on these coordinates, the so-
called Ptolemaic maps were designed later, the oldest preserved since the late 13th cen-
tury, almost ten centuries after Geographia. In the process of designing a Ptolemaic map,
using the listed coordinates as given in the text, the drawing of a geographic graticule of
∗ Professor of geodesy and cartography, Aristotle University of Thessaloniki, Greece [[email protected]]
** Surv. Eng., MSc, Carto. & Geogr., PhD Cand., Aristotle University of Thessaloniki, Greece
*** Professor of cartography, Aristotle University of Thessaloniki, Greece [[email protected]]
e-Perimetron, Vol. 2, No 2, Spring 2007 [80-91] www.e-perimetron.org | ISSN 1790-3769
[81]
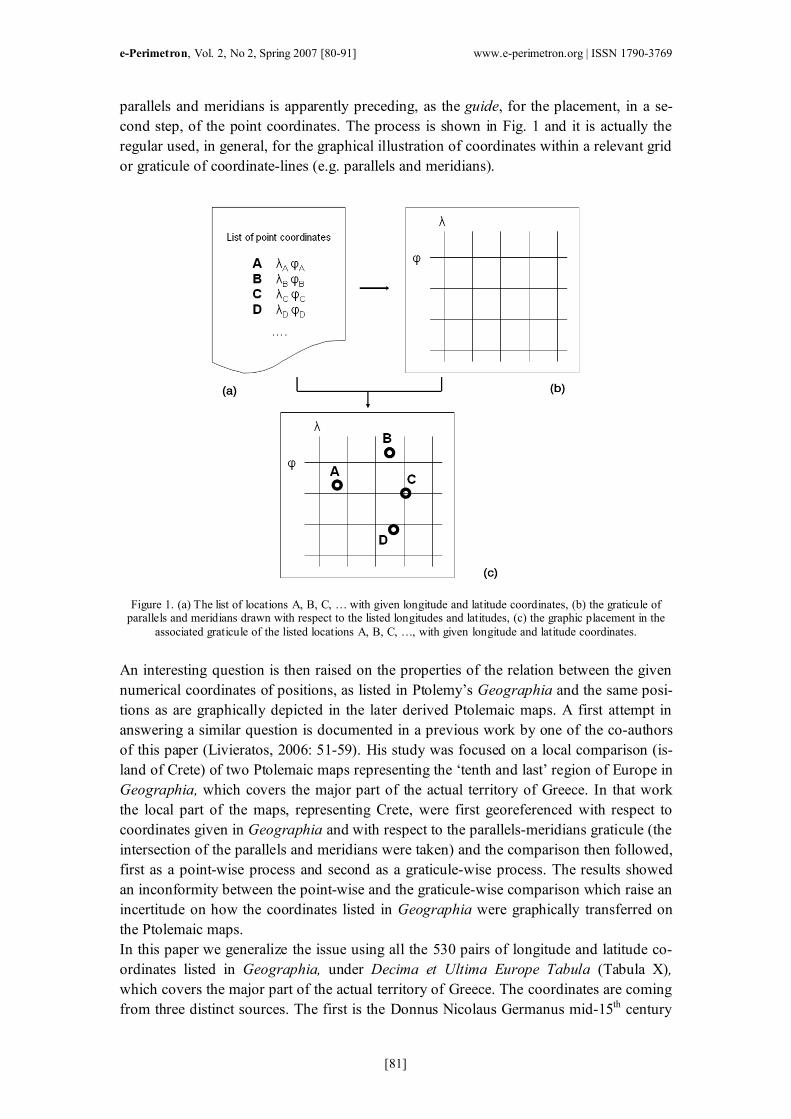
parallels and meridians is apparently preceding, as the guide, for the placement, in a se-
cond step, of the point coordinates. The process is shown in Fig. 1 and it is actually the
regular used, in general, for the graphical illustration of coordinates within a relevant grid
or graticule of coordinate-lines (e.g. parallels and meridians).
Figure 1. (a) The list of locations A, B, C, … with given longitude and latitude coordinates, (b) the graticule of parallels and meridians drawn with respect to the listed longitudes and latitudes, (c) the graphic placement in the
associated graticule of the listed locations A, B, C, …, with given longitude and latitude coordinates.
An interesting question is then raised on the properties of the relation between the given
numerical coordinates of positions, as listed in Ptolemy’s Geographia and the same posi-
tions as are graphically depicted in the later derived Ptolemaic maps. A first attempt in
answering a similar question is documented in a previous work by one of the co-authors
of this paper (Livieratos, 2006: 51-59). His study was focused on a local comparison (is-
land of Crete) of two Ptolemaic maps representing the ‘tenth and last’ region of Europe in
Geographia, which covers the major part of the actual territory of Greece. In that work
the local part of the maps, representing Crete, were first georeferenced with respect to
coordinates given in Geographia and with respect to the parallels-meridians graticule (the
intersection of the parallels and meridians were taken) and the comparison then followed,
first as a point-wise process and second as a graticule-wise process. The results showed
an inconformity between the point-wise and the graticule-wise comparison which raise an
incertitude on how the coordinates listed in Geographia were graphically transferred on
the Ptolemaic maps.
In this paper we generalize the issue using all the 530 pairs of longitude and latitude co-
ordinates listed in Geographia, under Decima et Ultima Europe Tabula (Tabula X),
which covers the major part of the actual territory of Greece. The coordinates are coming
from three distinct sources. The first is the Donnus Nicolaus Germanus mid-15th century
e-Perimetron, Vol. 2, No 2, Spring 2007 [80-91] www.e-perimetron.org | ISSN 1790-3769
[82]
manuscript of Ptolemy’s Geographia as given in Codex Ebnerianus (Stevenson 1991: 92)
which, according to Fischer (1991: 10), served as the basis for the later printed Rome edi-
tions, 1478, 1490 (is used in this study), 1507, 1508, Ulm editions, 1482, 1486 and Stras-
bourg editions, 1513, 1520, 1522, 1525. The second and third sources are two 19th cen-
tury editions by Nobbe (1843, 1966) and Müller (1883).
The coordinates from the three sources, properly auto- and cross-checked and evaluated,
are then projected onto a map with a relevant graticule of parallels and meridians. In this
way, three Ptolemaic reference maps of Tabula X are designed, which are directly de-
rived from the coordinates, and are then used as the base maps in order to study their de-
viations from the printed Ptolemaic de Turre’s Tabula X map (1490), as far as the consis-
tency of the point placements is concerned, with respect also to the relevant geographic
graticule as depicted on de Turre’s map.
It is needless to say that, the process developed in this work can be easily generalized and
applied to any other manuscript and/or printed Ptolemaic map, transformed in digital
raster form.
On the Tabula X coordinates
In this study, longitude and latitude coordinates are taken into consideration, referred to
Ptolemy’s Geographia both to inhabited locations (i.e. towns and cities) and to point-
physical features (i.e. debouchments, mountain rises, cape-ends). In Tabula X, this con-
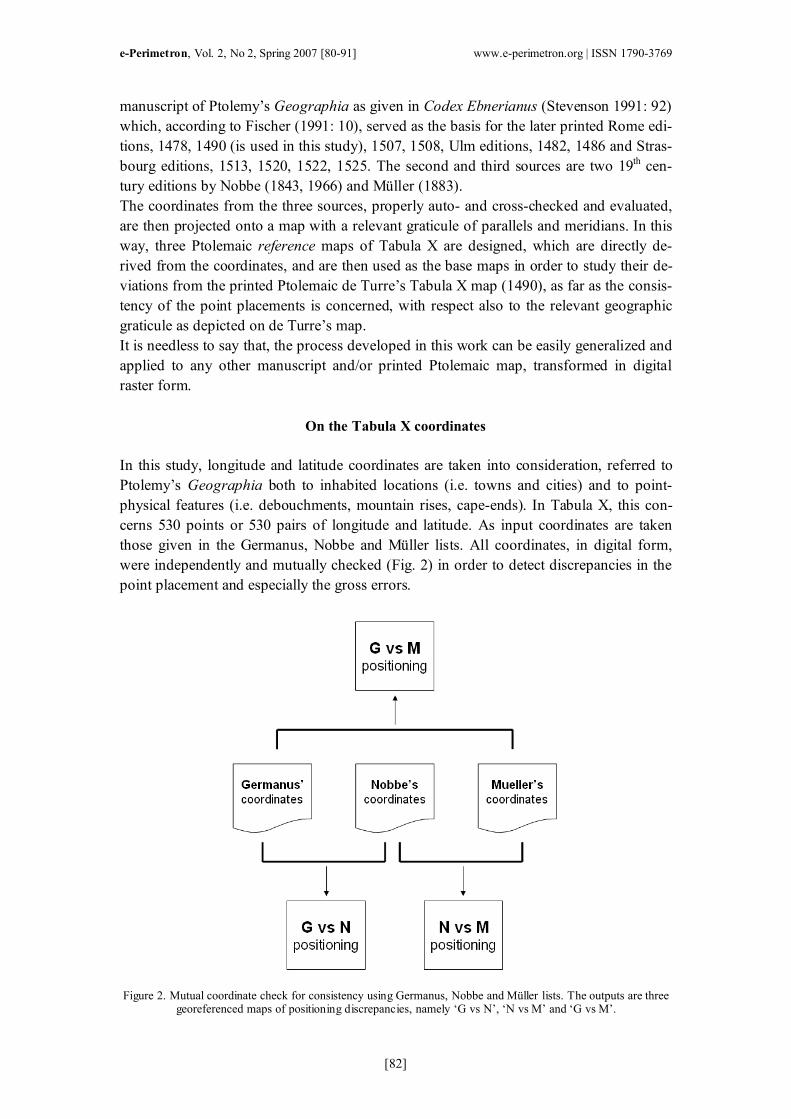
cerns 530 points or 530 pairs of longitude and latitude. As input coordinates are taken
those given in the Germanus, Nobbe and Müller lists. All coordinates, in digital form,
were independently and mutually checked (Fig. 2) in order to detect discrepancies in the
point placement and especially the gross errors.
Figure 2. Mutual coordinate check for consistency using Germanus, Nobbe and Müller lists. The outputs are three georeferenced maps of positioning discrepancies, namely ‘G vs N’, ‘N vs M’ and ‘G vs M’.
e-Perimetron, Vol. 2, No 2, Spring 2007 [80-91] www.e-perimetron.org | ISSN 1790-3769
[83]
From the independent check of Germanus coordinate list, 6 gross errors were detected.
These errors and the corrections are given in Tab. 1.
Germanus Corrected Point site
longitude latitude longitude latitude
Central part of Oeta mountains 50° 30′ 28° 35′ 50°°°° 30′ 38°°°° 35′
Thessaloniki 49° 50′ 49° 20′ 49°°°° 50′ 40°°°° 20′
Saso island 41° 10′ 39° 30′ 44°°°° 10′ 39°°°° 30′
Zakynthos island 47° 30′ 30° 30′ 47°°°° 30′ 36°°°° 30′
Strophades, two islands 47° 20′ 30° 30′ 47°°°° 20′ 36°°°° 00′
Table 1. The gross errors found from the independent coordinate consistency-check in Germanus list.
In the Nobbe list, two values are given for some single points. These values were checked
in order to choose the most appropriate value for each point as it shown in Tab. 2.
Nobbe Corrected Point site
longitude latitude longitude latitude
Mouth of the Lydias river 49° 30′ 40° 00′ (10′) 49°°°° 30′ 40°°°° 00′
Oreus 53° 00′ (40′) 38° 20′ 53°°°° 00′ 38°°°° 20′
Methone 48° 10′ 35° (25′) 5′ 48°°°° 10′ 35°°°° 25′
Zarex mountains 51° 00′ 35°(50′) 20′ 51°°°° 00′ 35°°°° 20′
Herea 49° (40′) 20′ 36° 00′ 49°°°° 20′ 36°°°° 00′
Cnosos 54° 45′ 35° (10′) 54°°°° 45′ 35°°°° 10′
Criumetopon promontory 52° 30′ (45′) 34° 10′ 52°°°° 30′ 34°°°° 10′
Table 2. The gross errors and the double values, in minutes of arc, detected from the independent coordinate con-
sistency-check in Nobbe list.
Finally, in the Müller list, the only obvious misprint in point-coordinates is that of ‘Thes-
saloniki’ as shown in Tab.3.
Müller Corrected Point site
longitude latitude londitude latitude
Thessaloniki 49° 50′ 49° 20′ 49°°°° 50′ 40°°°° 20′
Table 3. The gross errors found from the independent coordinate consistency-check in Müller list.
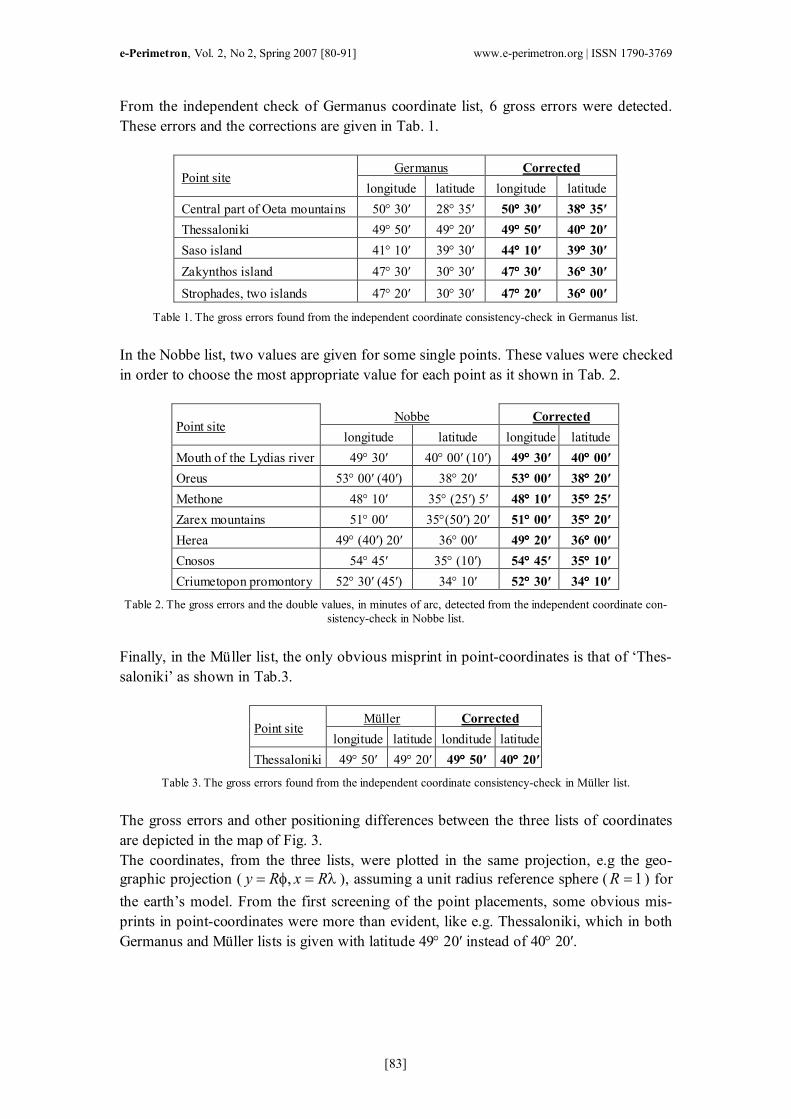
The gross errors and other positioning differences between the three lists of coordinates
are depicted in the map of Fig. 3.
The coordinates, from the three lists, were plotted in the same projection, e.g the geo-
graphic projection ( ,y R x R= φ = λ ), assuming a unit radius reference sphere ( 1R = ) for
the earth’s model. From the first screening of the point placements, some obvious mis-
prints in point-coordinates were more than evident, like e.g. Thessaloniki, which in both
Germanus and Müller lists is given with latitude 49° 20′ instead of 40° 20′.
e-Perimetron, Vol. 2, No 2, Spring 2007 [80-91] www.e-perimetron.org | ISSN 1790-3769
[84]
Figure 3. The map of positioning differences in Germanus, Nobbe and Müller.
From the cross comparison of the three coordinate lists, three relevant maps are plotted,
depicting the differences in point positioning, as they come out from the comparison,
namely ‘G vs N’, ‘N vs M’ and ‘G vs M’, respectively shown in Fig. 4, Fig. 5 and Fig. 6.
Figure 4. ‘G vs N’: In red are the different point positioning in Germanus list with respect to Nobbe’s positioning
(in green)
e-Perimetron, Vol. 2, No 2, Spring 2007 [80-91] www.e-perimetron.org | ISSN 1790-3769
[85]
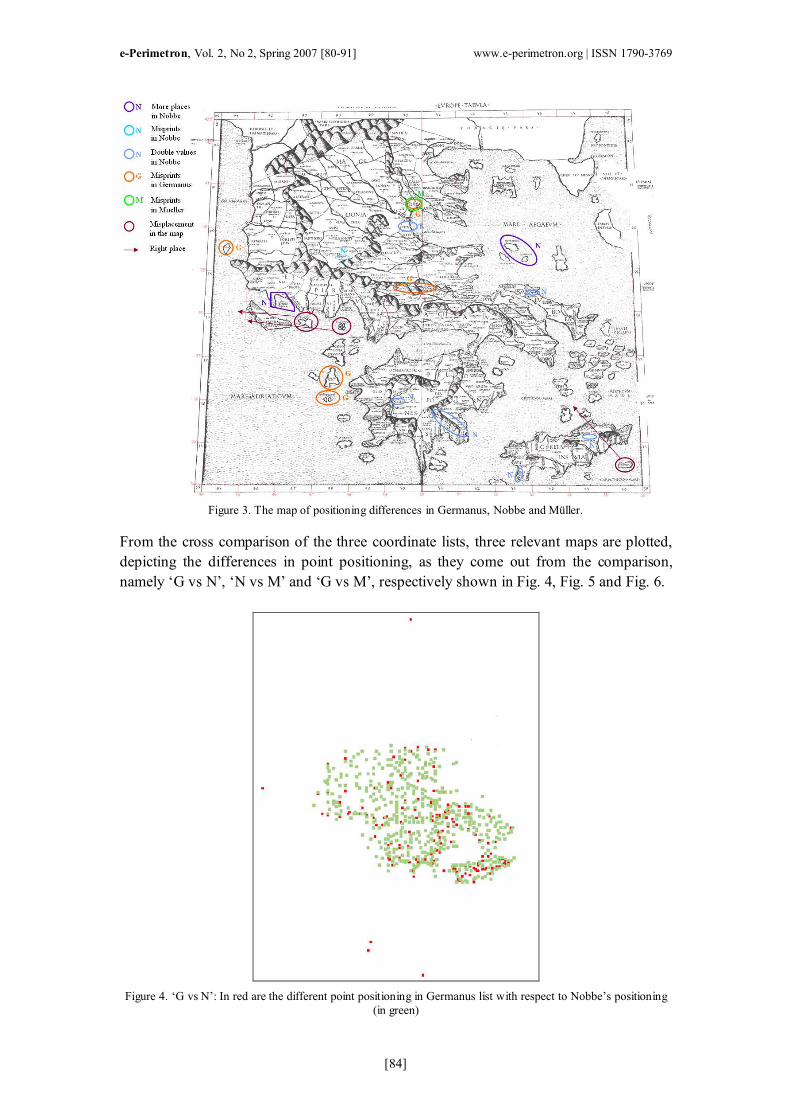
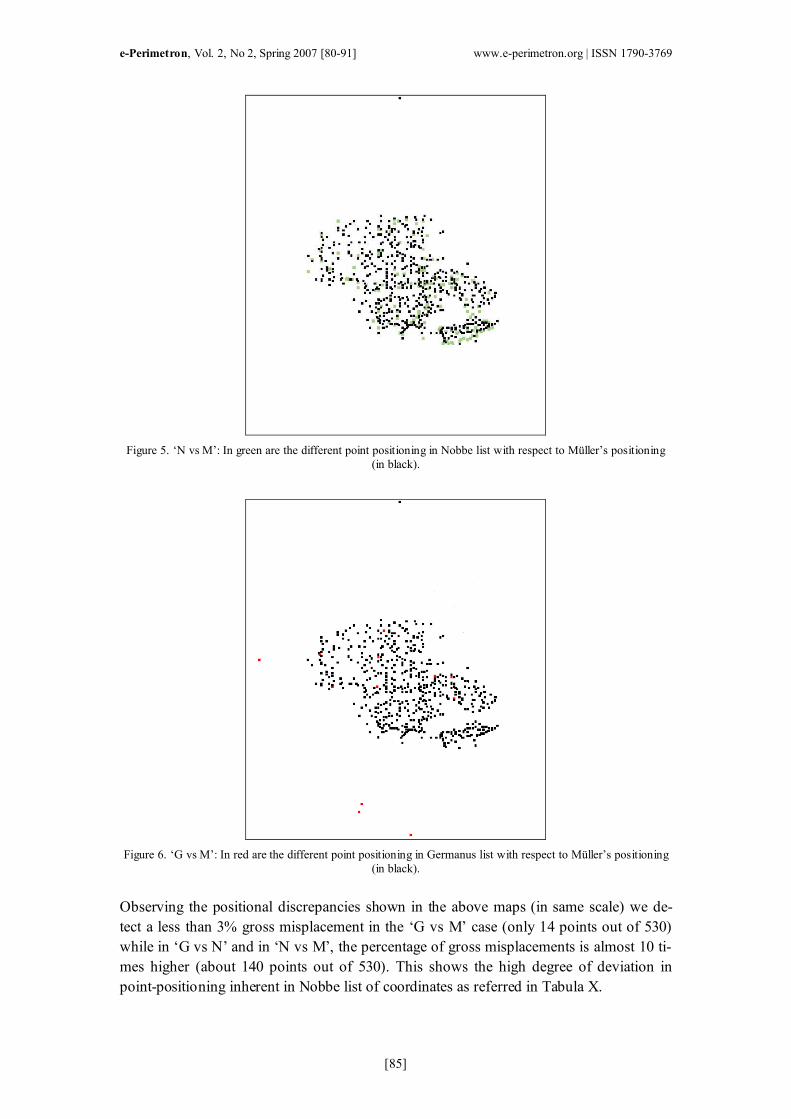
Figure 5. ‘N vs M’: In green are the different point positioning in Nobbe list with respect to Müller’s positioning
(in black).
Figure 6. ‘G vs M’: In red are the different point positioning in Germanus list with respect to Müller’s positioning
(in black).
Observing the positional discrepancies shown in the above maps (in same scale) we de-
tect a less than 3% gross misplacement in the ‘G vs M’ case (only 14 points out of 530)
while in ‘G vs N’ and in ‘N vs M’, the percentage of gross misplacements is almost 10 ti-
mes higher (about 140 points out of 530). This shows the high degree of deviation in
point-positioning inherent in Nobbe list of coordinates as referred in Tabula X.
e-Perimetron, Vol. 2, No 2, Spring 2007 [80-91] www.e-perimetron.org | ISSN 1790-3769
[86]
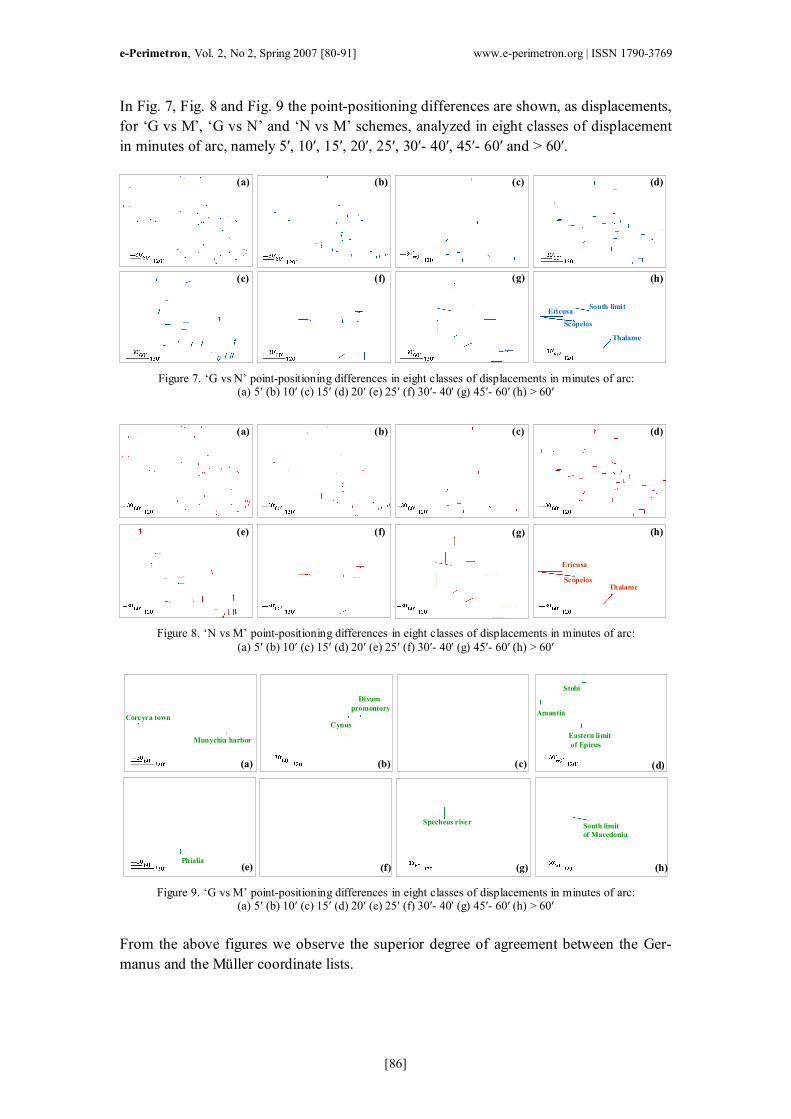
In Fig. 7, Fig. 8 and Fig. 9 the point-positioning differences are shown, as displacements,
for ‘G vs M’, ‘G vs N’ and ‘N vs M’ schemes, analyzed in eight classes of displacement
in minutes of arc, namely 5′, 10′, 15′, 20′, 25′, 30′- 40′, 45′- 60′ and > 60′.
Scopelos
Ericusa
Thalame
(a) (b) (c) (d)
(e) (f) (g) (h)
South limit
Figure 7. ‘G vs N’ point-positioning differences in eight classes of displacements in minutes of arc: (a) 5′ (b) 10′ (c) 15′ (d) 20′ (e) 25′ (f) 30′- 40′ (g) 45′- 60′ (h) > 60′
Scopelos
Ericusa
Thalame
(a) (b) (c) (d)
(e) (f) (g) (h)
Figure 8. ‘N vs M’ point-positioning differences in eight classes of displacements in minutes of arc: (a) 5′ (b) 10′ (c) 15′ (d) 20′ (e) 25′ (f) 30′- 40′ (g) 45′- 60′ (h) > 60′
South limit
of Macedonia
Specheus river
(a) (b) (c) (d)
(g) (h)
Munychia harbor
Corcyra town
Divum
promontory
Cynus
Eastern limit
of Epirus
Amantia
Stobi
Phialia(e) (f)
Figure 9. ‘G vs M’ point-positioning differences in eight classes of displacements in minutes of arc: (a) 5′ (b) 10′ (c) 15′ (d) 20′ (e) 25′ (f) 30′- 40′ (g) 45′- 60′ (h) > 60′
From the above figures we observe the superior degree of agreement between the Ger-
manus and the Müller coordinate lists.
e-Perimetron, Vol. 2, No 2, Spring 2007 [80-91] www.e-perimetron.org | ISSN 1790-3769
[87]
Fitting de Turre’s Tabula X map to the coordinates
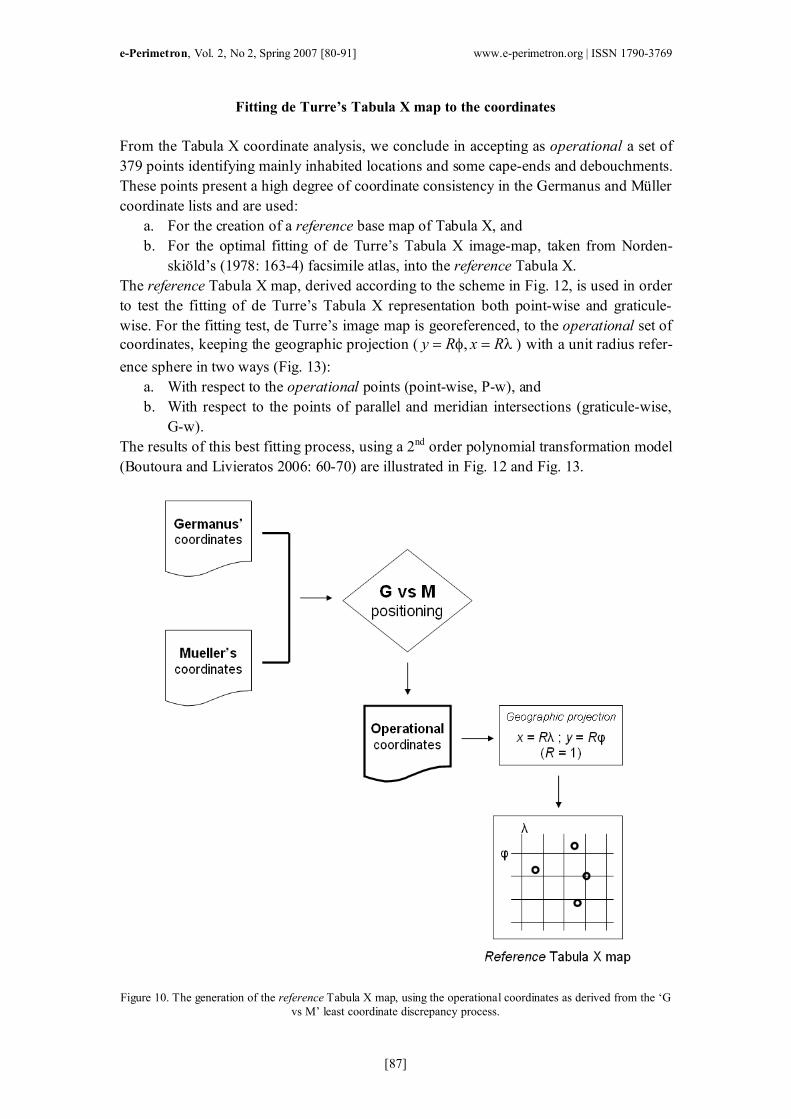
From the Tabula X coordinate analysis, we conclude in accepting as operational a set of
379 points identifying mainly inhabited locations and some cape-ends and debouchments.
These points present a high degree of coordinate consistency in the Germanus and Müller
coordinate lists and are used:
a. For the creation of a reference base map of Tabula X, and
b. For the optimal fitting of de Turre’s Tabula X image-map, taken from Norden-
skiöld’s (1978: 163-4) facsimile atlas, into the reference Tabula X.
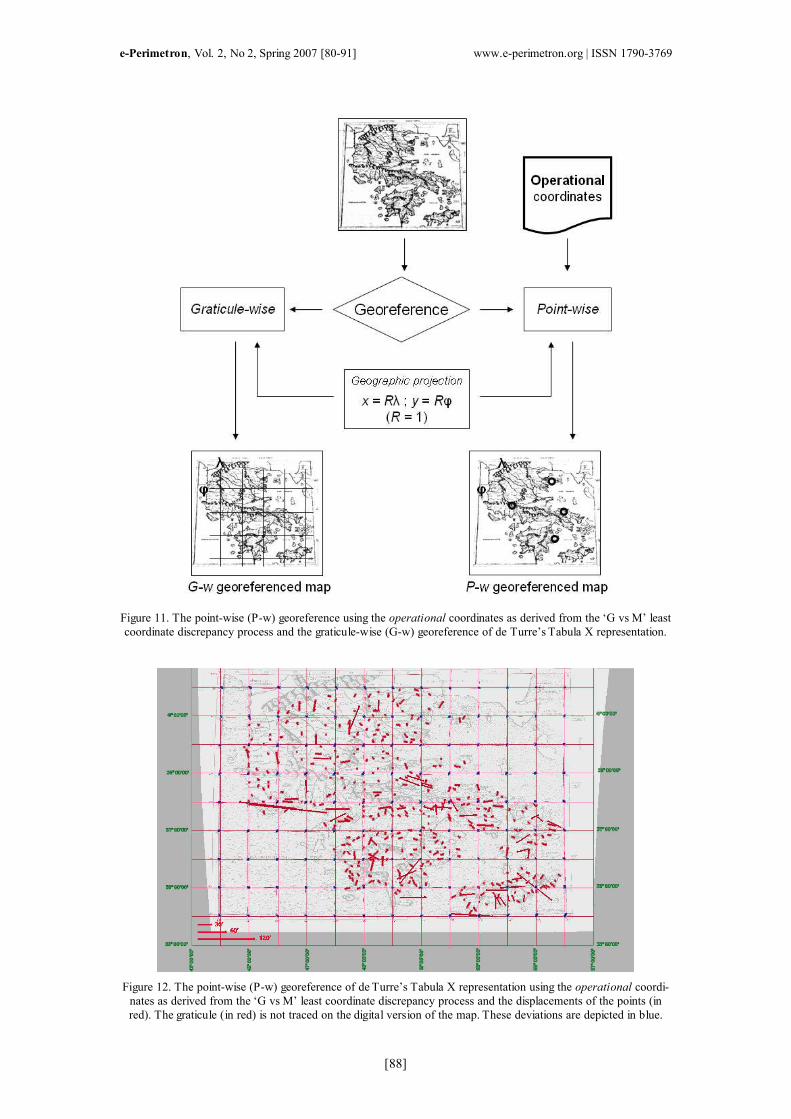
The reference Tabula X map, derived according to the scheme in Fig. 12, is used in order
to test the fitting of de Turre’s Tabula X representation both point-wise and graticule-
wise. For the fitting test, de Turre’s image map is georeferenced, to the operational set of
coordinates, keeping the geographic projection ( ,y R x R= φ = λ ) with a unit radius refer-
ence sphere in two ways (Fig. 13):
a. With respect to the operational points (point-wise, P-w), and
b. With respect to the points of parallel and meridian intersections (graticule-wise,
G-w).
The results of this best fitting process, using a 2nd order polynomial transformation model
(Boutoura and Livieratos 2006: 60-70) are illustrated in Fig. 12 and Fig. 13.
Figure 10. The generation of the reference Tabula X map, using the operational coordinates as derived from the ‘G
vs M’ least coordinate discrepancy process.
e-Perimetron, Vol. 2, No 2, Spring 2007 [80-91] www.e-perimetron.org | ISSN 1790-3769
[88]
Figure 11. The point-wise (P-w) georeference using the operational coordinates as derived from the ‘G vs M’ least
coordinate discrepancy process and the graticule-wise (G-w) georeference of de Turre’s Tabula X representation.
Figure 12. The point-wise (P-w) georeference of de Turre’s Tabula X representation using the operational coordi-
nates as derived from the ‘G vs M’ least coordinate discrepancy process and the displacements of the points (in
red). The graticule (in red) is not traced on the digital version of the map. These deviations are depicted in blue.
e-Perimetron, Vol. 2, No 2, Spring 2007 [80-91] www.e-perimetron.org | ISSN 1790-3769
[89]
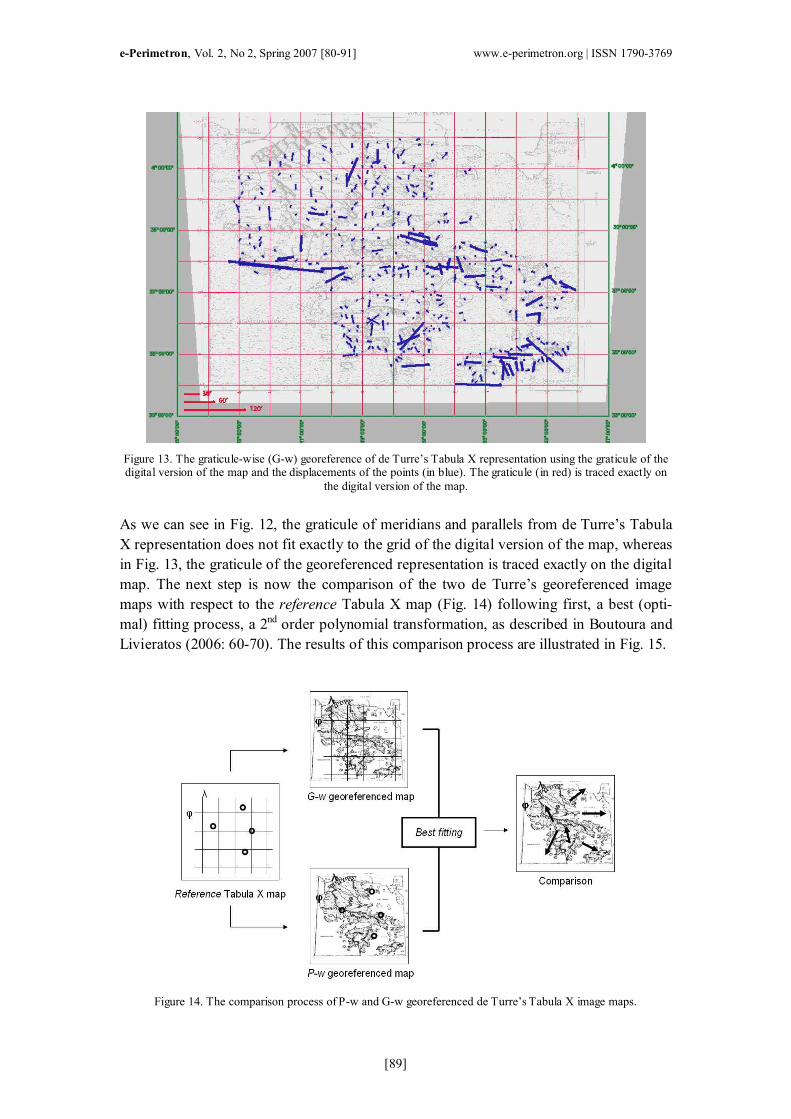
Figure 13. The graticule-wise (G-w) georeference of de Turre’s Tabula X representation using the graticule of the digital version of the map and the displacements of the points (in blue). The graticule (in red) is traced exactly on
the digital version of the map.
As we can see in Fig. 12, the graticule of meridians and parallels from de Turre’s Tabula
X representation does not fit exactly to the grid of the digital version of the map, whereas
in Fig. 13, the graticule of the georeferenced representation is traced exactly on the digital
map. The next step is now the comparison of the two de Turre’s georeferenced image
maps with respect to the reference Tabula X map (Fig. 14) following first, a best (opti-
mal) fitting process, a 2nd order polynomial transformation, as described in Boutoura and
Livieratos (2006: 60-70). The results of this comparison process are illustrated in Fig. 15.
Figure 14. The comparison process of P-w and G-w georeferenced de Turre’s Tabula X image maps.
e-Perimetron, Vol. 2, No 2, Spring 2007 [80-91] www.e-perimetron.org | ISSN 1790-3769
[90]
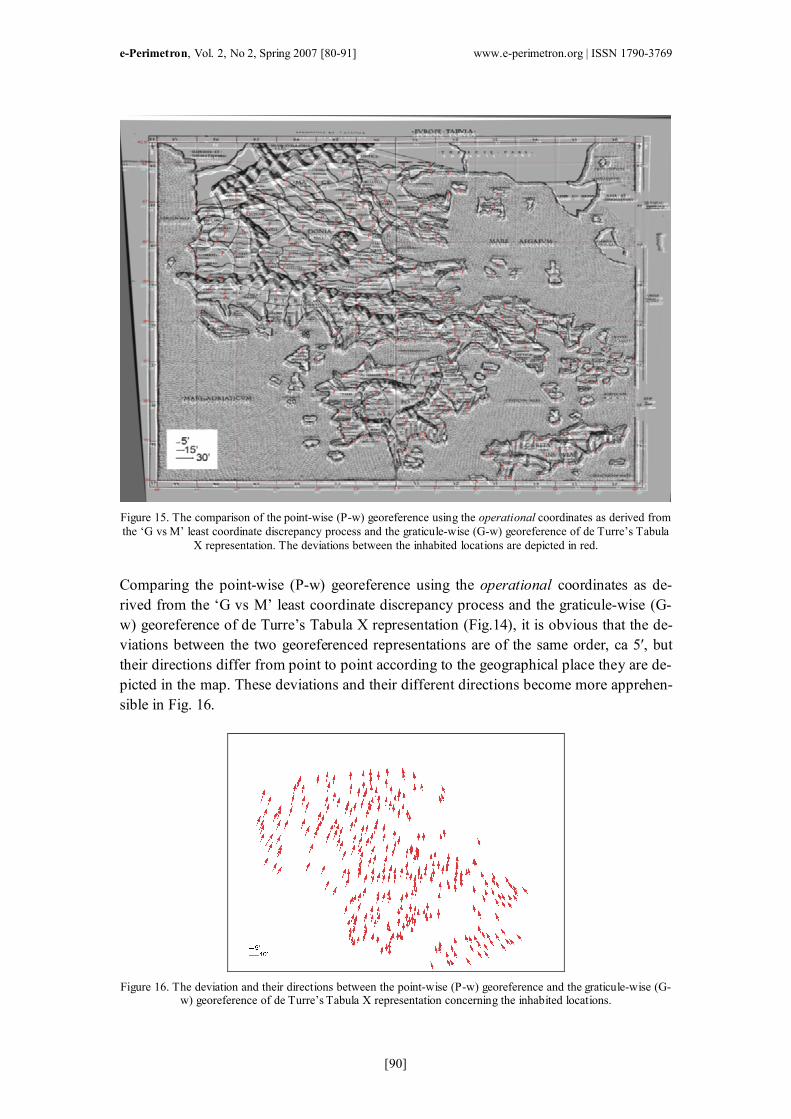
Figure 15. The comparison of the point-wise (P-w) georeference using the operational coordinates as derived from
the ‘G vs M’ least coordinate discrepancy process and the graticule-wise (G-w) georeference of de Turre’s Tabula
X representation. The deviations between the inhabited locations are depicted in red.
Comparing the point-wise (P-w) georeference using the operational coordinates as de-
rived from the ‘G vs M’ least coordinate discrepancy process and the graticule-wise (G-
w) georeference of de Turre’s Tabula X representation (Fig.14), it is obvious that the de-
viations between the two georeferenced representations are of the same order, ca 5′, but
their directions differ from point to point according to the geographical place they are de-
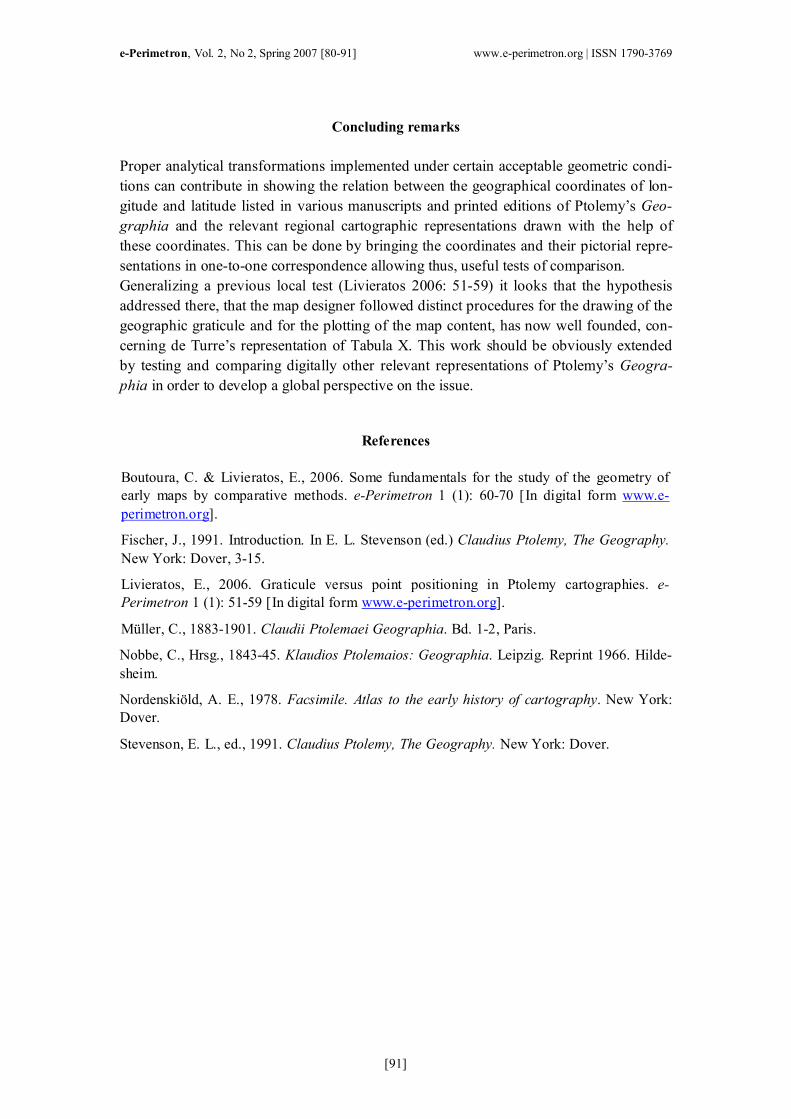
picted in the map. These deviations and their different directions become more apprehen-
sible in Fig. 16.
Figure 16. The deviation and their directions between the point-wise (P-w) georeference and the graticule-wise (G-w) georeference of de Turre’s Tabula X representation concerning the inhabited locations.
e-Perimetron, Vol. 2, No 2, Spring 2007 [80-91] www.e-perimetron.org | ISSN 1790-3769
[91]
Concluding remarks
Proper analytical transformations implemented under certain acceptable geometric condi-
tions can contribute in showing the relation between the geographical coordinates of lon-
gitude and latitude listed in various manuscripts and printed editions of Ptolemy’s Geo-
graphia and the relevant regional cartographic representations drawn with the help of
these coordinates. This can be done by bringing the coordinates and their pictorial repre-
sentations in one-to-one correspondence allowing thus, useful tests of comparison.
Generalizing a previous local test (Livieratos 2006: 51-59) it looks that the hypothesis
addressed there, that the map designer followed distinct procedures for the drawing of the
geographic graticule and for the plotting of the map content, has now well founded, con-
cerning de Turre’s representation of Tabula X. This work should be obviously extended
by testing and comparing digitally other relevant representations of Ptolemy’s Geogra-
phia in order to develop a global perspective on the issue.
References
Boutoura, C. & Livieratos, E., 2006. Some fundamentals for the study of the geometry of
early maps by comparative methods. e-Perimetron 1 (1): 60-70 [In digital form www.e-
perimetron.org].
Fischer, J., 1991. Introduction. In E. L. Stevenson (ed.) Claudius Ptolemy, The Geography.
New York: Dover, 3-15.
Livieratos, E., 2006. Graticule versus point positioning in Ptolemy cartographies. e-
Perimetron 1 (1): 51-59 [In digital form www.e-perimetron.org].
Müller, C., 1883-1901. Claudii Ptolemaei Geographia. Bd. 1-2, Paris.
Nobbe, C., Hrsg., 1843-45. Klaudios Ptolemaios: Geographia. Leipzig. Reprint 1966. Hilde-
sheim.
Nordenskiöld, A. E., 1978. Facsimile. Atlas to the early history of cartography. New York:
Dover.
Stevenson, E. L., ed., 1991. Claudius Ptolemy, The Geography. New York: Dover.