Embed Size (px)
Citation preview
GEOGRAPHIA N
APOCENSIS AN X
, nr. 2
/2016
geog
raphia
napo
censis
.acad
-cluj.
ro
7
Geographia Napocensis Anul X, nr. 2, 2016
THE EVOLUTION OF GROAPA RUGINOASA RAVINE STUDIED BY GIS TECHNOLOGY
imecS ZoLtáN1, GáL aNdrea1, SimoN Éva Beáta1, PoSZet SZiLárd2
Abstract: - The evolution of Groapa Ruginoasa ravine studied by GIS technology. The detailed, accurate study of ravines, gullies or gully systems is a great challenge for researchers. The complexity of phenomenon, the size of the forms and in many cases the difficult accessibility increase this challenge. In order to overcome these difficulties we used besides the field surveys photogrammetric methods to study Groapa Ruginoasa ravine. The evolution of this spectacular form can be followed beginning with the Second military survey’s map (1863-1864). Using all of the cartographic documents of the region, with the help of GIS technology one can follow the evolution in time of the ravine, at least the position and the size of it. But are the existing cartographic documents detailed enough for a thorough study of such a complex phenomenon? At first our paper presents the results regarding the evolution obtained by the analysis of the maps dating back to the 19th century. Then it presents the results obtained by the help of UAV systems. This relatively new technology – after the photogrammetric interpretation of images made from low altitude – can offer more detailed information. The orthophoto with a resolution of 6 cm, and the resulted DEM with 13 cm resolution offers the possibility of more accurate analyses and to follow up the evolution. The only measurement which exists at the moment allows us to calculate the volume of the material washed out by the Seaca valley and to make sections over it. But after repeating the measurements we’ll have the possibility of other types of analyses as well. By the comparison of data gathered from field surveys with the results of repeated airborne (UAV) image acquisition and processing we intend to check the reliability and the accuracy of using photogrammetric methods in ravine research.
Keywords: ravine evolution, headcut retreat rate, UAV, GIS;
1 Babeș-Bolyai University, Department of Geography in Hungarian, 400006, Cluj-Napoca, Str. Clinicilor 5-7, Romania, [email protected]; [email protected]; [email protected]; 2 Sapientia University, Department of Environmental Studies, 400193, Cluj-Napoca, Calea Turzii 4, Romania, [email protected]
1. Introduction The Groapa Ruginoasa ravine (larger and
more complex form of a gully, with intricate network of various forms of gullies, Bates and Jackson, 1984) has been studied by our team starting from 2014. The first paper about the evolution of the ravine was published on an Internet blog in 2011 (Linc and Nedelcu, 2011) with no detailed analysis. In 2014 we started gathering cartographic documents about the Groapa Ruginioasa. In order to obtain data about the actual situation we made GPS measurements on the scarp of the phenomenon, but we soon realized that in these topographical conditions our “hobby” GPS equipment is not accurate enough to show the retreat of the ridge. Short-term monitoring of gully head or gully wall retreat is usually realized by ground-based and recently by
airborne techniques (e.g. Vandekerckhove et al., 2001, Stöcker, C, et al., 2015, Gómez-Gutiérrez et al., 2014, Rădoane and Rădoane, 2016). In 2015 we set all together 26 control points by marking some trees around the ridge and we measured regularly the change in distance between the edge of the gully head or wall and these control points. This method probably will give in time more accurate information about the evolution of the ravine. But ravine development is more complex, it evolves by erosion of the gully floor, headcut migration and erosion of the sidewalls, which implies besides the water erosion mass movement as well (Nachtergaele, et al., 2002). Bergonse and Reis, 2016 suggest that in gully systems mass movement processes in headcuts and sidewalls are prevalent in their evolution, (as the ravine is very large – more than 500 m long and wide,
GEOGRAPHIA N
APOCENSIS AN X
, nr. 2
/2016
geog
raphia
napo
censis
.acad
-cluj.
ro
Imecs Zoltán, Gál AndreA, sImon ÉvA BeátA, PosZet sZIlárd
8
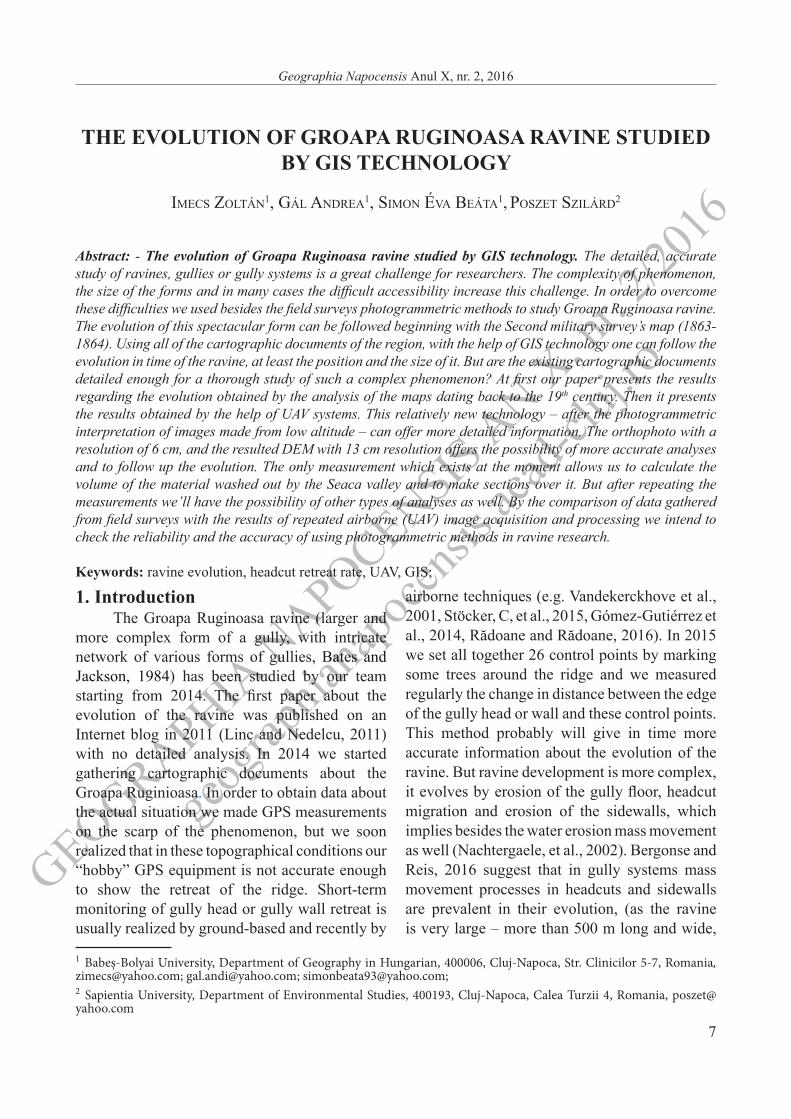
more than 200 m deep) so the processes going on inside the ravine need to be studied as well. Due to brittle rock formations and the very steep, unstable sidewalls it is practically impossible to make measurements inside of the ravine along or on the interfluves which divide this huge form in three smaller alcoves. In the bottom of the ravine bed and the lower parts of the walls, which are accessible in dry season, we started classic, field surveys by mounting erosion pins (steel sticks) serving as control levels to determine the amount of material carried away or deposited in the valley. But all these measurements are still not enough to describe the processes going on inside, in the upper parts of the ravine. In July 2016 we managed to make the first aerial photographs of the ravine. After processing the almost 200 images taken in two flights we got a very detailed orthophoto – with a spatial resolution of 6 cm, and a digital surface model with a resolution of 13 cm. This measurement is a milestone in the study of this huge geomorphologic phenomenon and it is the starting point for the forthcoming measurements.
2. Study area Groapa Ruginoasa ravine is situated in the
central part of the Apuseni Mountains, Bihor Mountains group close to the Vârtop pass which separates Arieș basin, a tributary of Mureș River in East, from Crișul Negru River in West. The ravine itself is the origin of Valea Seacă valley, a tributary of Galbena River which goes finally in Crișul Negru and is actually a geologic reserve that represents a touristic objective as well. The viewpoint of this spectacular natural phenomenon lies at about 1360 m a.s.l. The ravine is incised in different types of sediments, in the Southern and Western parts the prevailing rock is quartz conglomerate and quartz sandstone with a high feldspar content, in East there is argillaceous shale and quartz sandstone having a brittle structure and in the Northern part the geology is dominated by limestone (Bordea et al., 1985). Another factor that might have played an important role in the genesis of Groapa Ruginoasa is the high precipitation quantity (>1400 mm in some years), the high daily precipitation maximum quantities exceeding even 60 mm/day in some years (ANM,
Fig. 1. – Groapa Ruginoasa ravine seen from North by UAV
GEOGRAPHIA N
APOCENSIS AN X
, nr. 2
/2016
geog
raphia
napo
censis
.acad
-cluj.
ro
The Evolution of Groapa Ruginoasa Ravine Studied by GIS Technology
9
1960-2013). It is also important the long annual average duration of snow cover (snow patches can be found even in June). In addition to these factors gully and ravine development is controlled by temporal changes in flow hydraulics, soil type, land use, topography, other climatic and meteorological parameters (Poesen et al. 2003; Valentin et al. 2005).
The surface of the ravine lacks any vegetation cover, trees are present only in the western part where an area of about 10500 m2 slid down towards the central part of the ravine. The surroundings are covered by dense coniferous forest. According to our fresh measurements the length of the ravine is about 700 meters, and in the widest section is about 530 meters. The deepest point is about 215 meters below the edge.
3. Evolution of Groapa Ruginoasa ravine reflected in cartographic and ortophotographic documents
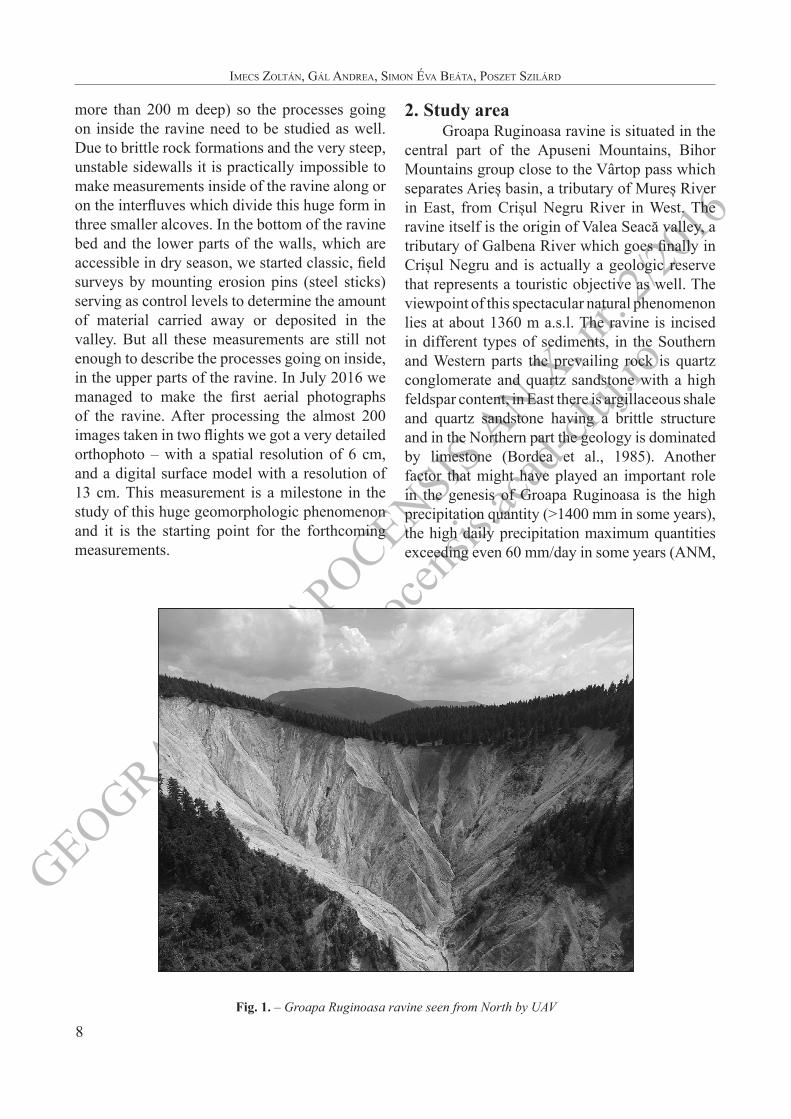
3.1 The first military surveyThe first military survey (Josephinian Land
Survey) was conducted from 1763 to 1787, by the order of Empress Maria Theresa at scale 1:28800 (mapire.eu). On this map there is no track of
Groapa Ruginoasa ravine [Fig. 2.-left]. It is very difficult to conclude anything from this fact. We cannot be sure if the absence of this form is just a mistake of the map makers or it really wasn’t there yet. Fact is that the position of the ravine is very difficult to find.
3.2 The second military surveyThe second military survey (Franciscan
Land Survey) was conducted between 1806–1869, the studied region was measured in 1864, and the scale is also 1:28800 (mapire.eu). This is the first available map on which the ravine appears under the name “Gropa la rusinoasa” and it has a spindle-shape. Although spindle-shaped gullies may ramify and develop multilobate headscarps it is unlikely for Groapa Ruginoasa to have had this shape and size because the maximal width represented on the map is larger than the actual one in the torrent channel sector. The digitized boundary polygon has the area of 52844.7 m2, the length is about 440 meters and the width is about 195 meters [Fig. 2.-right].
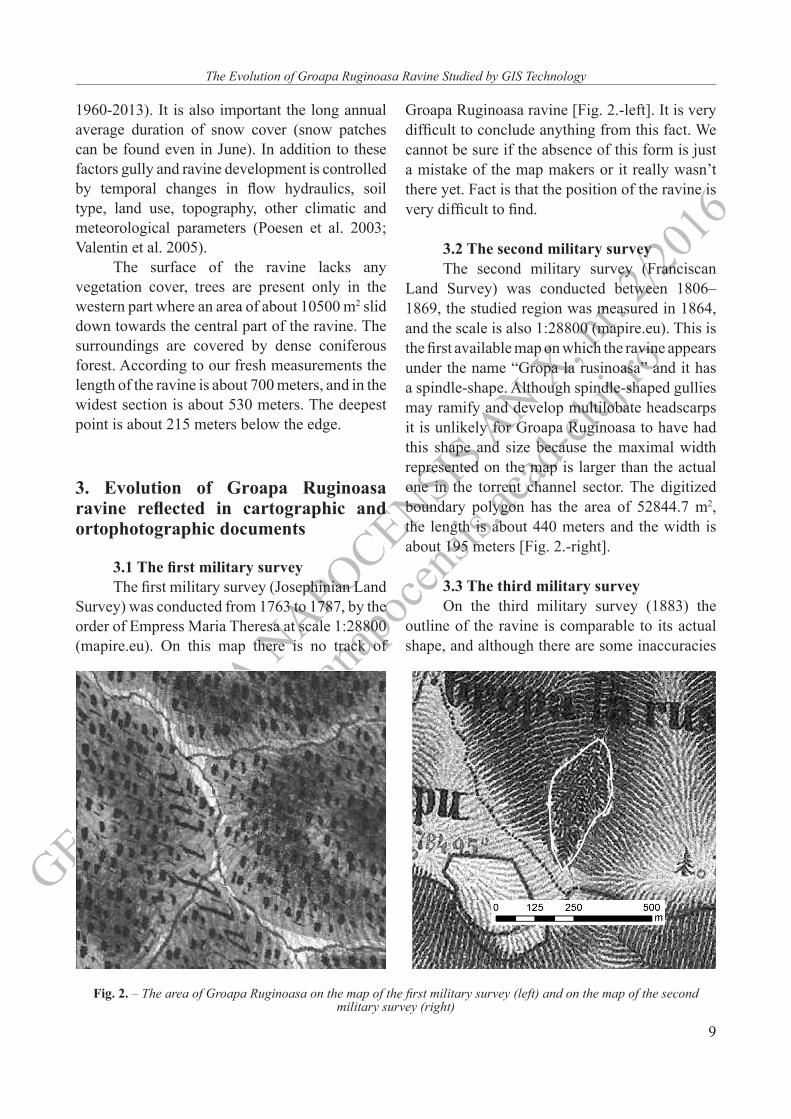
3.3 The third military surveyOn the third military survey (1883) the
outline of the ravine is comparable to its actual shape, and although there are some inaccuracies
Fig. 2. – The area of Groapa Ruginoasa on the map of the first military survey (left) and on the map of the second military survey (right)
GEOGRAPHIA N
APOCENSIS AN X
, nr. 2
/2016
geog
raphia
napo
censis
.acad
-cluj.
ro
Imecs Zoltán, Gál AndreA, sImon ÉvA BeátA, PosZet sZIlárd
10
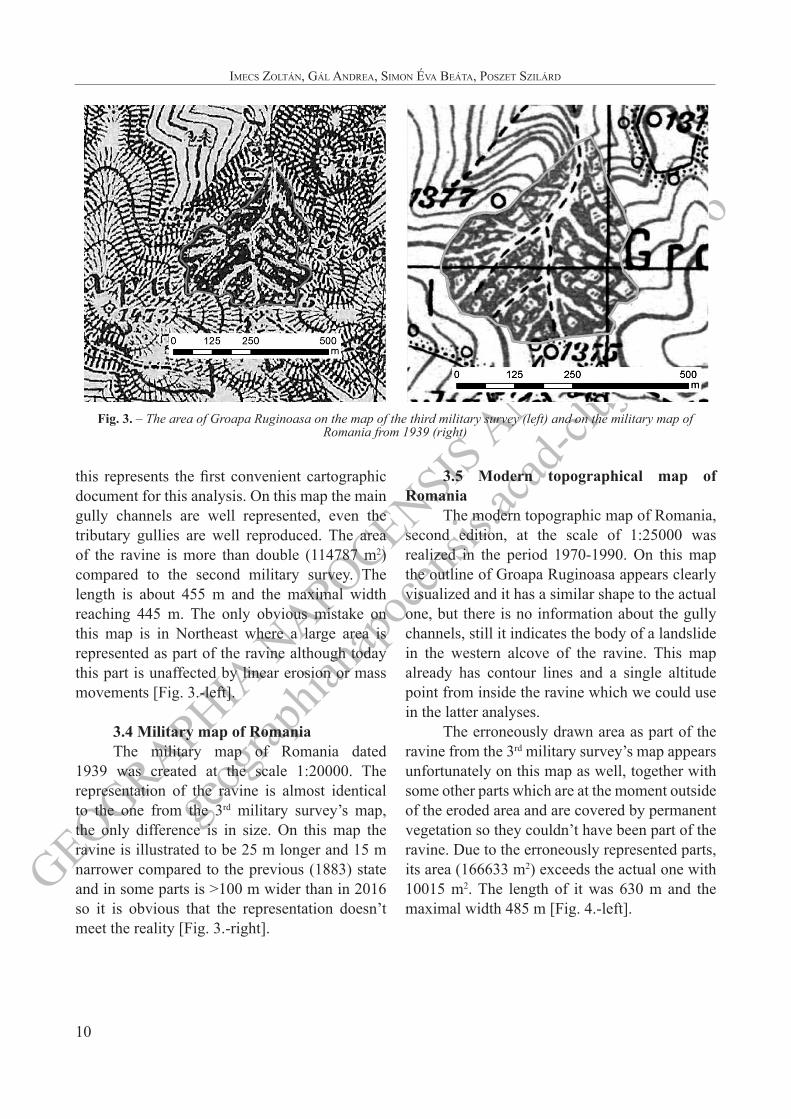
this represents the first convenient cartographic document for this analysis. On this map the main gully channels are well represented, even the tributary gullies are well reproduced. The area of the ravine is more than double (114787 m2) compared to the second military survey. The length is about 455 m and the maximal width reaching 445 m. The only obvious mistake on this map is in Northeast where a large area is represented as part of the ravine although today this part is unaffected by linear erosion or mass movements [Fig. 3.-left].
3.4 Military map of RomaniaThe military map of Romania dated
1939 was created at the scale 1:20000. The representation of the ravine is almost identical to the one from the 3rd military survey’s map, the only difference is in size. On this map the ravine is illustrated to be 25 m longer and 15 m narrower compared to the previous (1883) state and in some parts is >100 m wider than in 2016 so it is obvious that the representation doesn’t meet the reality [Fig. 3.-right].
3.5 Modern topographical map of Romania
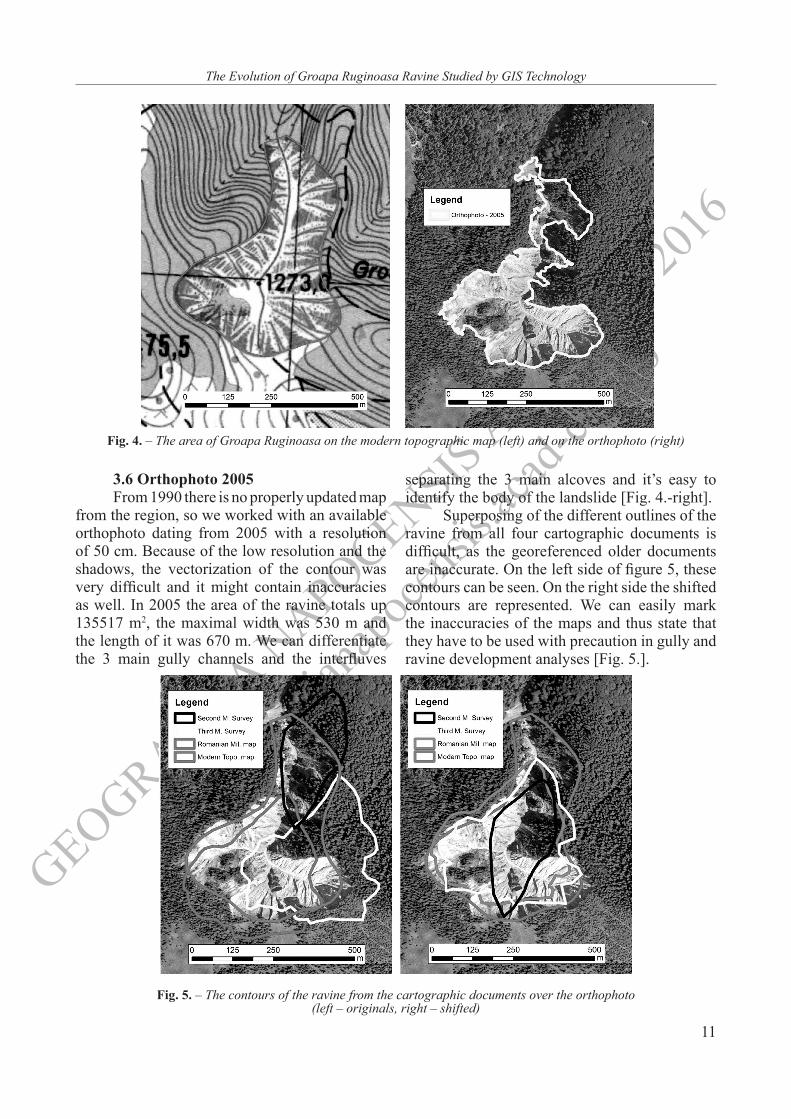
The modern topographic map of Romania, second edition, at the scale of 1:25000 was realized in the period 1970-1990. On this map the outline of Groapa Ruginoasa appears clearly visualized and it has a similar shape to the actual one, but there is no information about the gully channels, still it indicates the body of a landslide in the western alcove of the ravine. This map already has contour lines and a single altitude point from inside the ravine which we could use in the latter analyses.
The erroneously drawn area as part of the ravine from the 3rd military survey’s map appears unfortunately on this map as well, together with some other parts which are at the moment outside of the eroded area and are covered by permanent vegetation so they couldn’t have been part of the ravine. Due to the erroneously represented parts, its area (166633 m2) exceeds the actual one with 10015 m2. The length of it was 630 m and the maximal width 485 m [Fig. 4.-left].
Fig. 3. – The area of Groapa Ruginoasa on the map of the third military survey (left) and on the military map of Romania from 1939 (right)
GEOGRAPHIA N
APOCENSIS AN X
, nr. 2
/2016
geog
raphia
napo
censis
.acad
-cluj.
ro
The Evolution of Groapa Ruginoasa Ravine Studied by GIS Technology
11
3.6 Orthophoto 2005From 1990 there is no properly updated map
from the region, so we worked with an available orthophoto dating from 2005 with a resolution of 50 cm. Because of the low resolution and the shadows, the vectorization of the contour was very difficult and it might contain inaccuracies as well. In 2005 the area of the ravine totals up 135517 m2, the maximal width was 530 m and the length of it was 670 m. We can differentiate the 3 main gully channels and the interfluves
separating the 3 main alcoves and it’s easy to identify the body of the landslide [Fig. 4.-right].
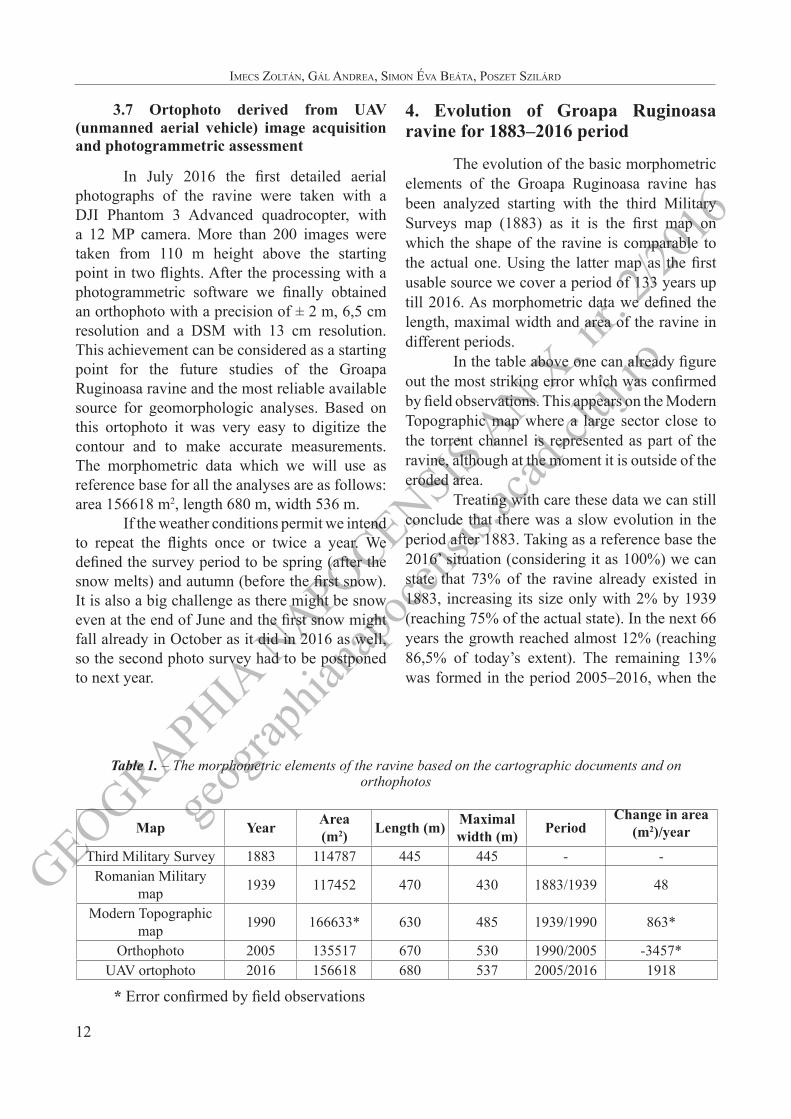
Superposing of the different outlines of the ravine from all four cartographic documents is difficult, as the georeferenced older documents are inaccurate. On the left side of figure 5, these contours can be seen. On the right side the shifted contours are represented. We can easily mark the inaccuracies of the maps and thus state that they have to be used with precaution in gully and ravine development analyses [Fig. 5.].
Fig. 4. – The area of Groapa Ruginoasa on the modern topographic map (left) and on the orthophoto (right)
Fig. 5. – The contours of the ravine from the cartographic documents over the orthophoto (left – originals, right – shifted)
GEOGRAPHIA N
APOCENSIS AN X
, nr. 2
/2016
geog
raphia
napo
censis
.acad
-cluj.
ro
Imecs Zoltán, Gál AndreA, sImon ÉvA BeátA, PosZet sZIlárd
12
3.7 Ortophoto derived from UAV (unmanned aerial vehicle) image acquisition and photogrammetric assessment
In July 2016 the first detailed aerial photographs of the ravine were taken with a DJI Phantom 3 Advanced quadrocopter, with a 12 MP camera. More than 200 images were taken from 110 m height above the starting point in two flights. After the processing with a photogrammetric software we finally obtained an orthophoto with a precision of ± 2 m, 6,5 cm resolution and a DSM with 13 cm resolution. This achievement can be considered as a starting point for the future studies of the Groapa Ruginoasa ravine and the most reliable available source for geomorphologic analyses. Based on this ortophoto it was very easy to digitize the contour and to make accurate measurements. The morphometric data which we will use as reference base for all the analyses are as follows: area 156618 m2, length 680 m, width 536 m.
If the weather conditions permit we intend to repeat the flights once or twice a year. We defined the survey period to be spring (after the snow melts) and autumn (before the first snow). It is also a big challenge as there might be snow even at the end of June and the first snow might fall already in October as it did in 2016 as well, so the second photo survey had to be postponed to next year.
4. Evolution of Groapa Ruginoasa ravine for 1883–2016 period
The evolution of the basic morphometric elements of the Groapa Ruginoasa ravine has been analyzed starting with the third Military Surveys map (1883) as it is the first map on which the shape of the ravine is comparable to the actual one. Using the latter map as the first usable source we cover a period of 133 years up till 2016. As morphometric data we defined the length, maximal width and area of the ravine in different periods.
In the table above one can already figure out the most striking error which was confirmed by field observations. This appears on the Modern Topographic map where a large sector close to the torrent channel is represented as part of the ravine, although at the moment it is outside of the eroded area.
Treating with care these data we can still conclude that there was a slow evolution in the period after 1883. Taking as a reference base the 2016’ situation (considering it as 100%) we can state that 73% of the ravine already existed in 1883, increasing its size only with 2% by 1939 (reaching 75% of the actual state). In the next 66 years the growth reached almost 12% (reaching 86,5% of today’s extent). The remaining 13% was formed in the period 2005–2016, when the
Map Year Area (m2) Length (m) Maximal
width (m) PeriodChange in area
(m2)/year
Third Military Survey 1883 114787 445 445 - -Romanian Military
map 1939 117452 470 430 1883/1939 48
Modern Topographic map 1990 166633* 630 485 1939/1990 863*
Orthophoto 2005 135517 670 530 1990/2005 -3457*UAV ortophoto 2016 156618 680 537 2005/2016 1918
* Error confirmed by field observations
Table 1. – The morphometric elements of the ravine based on the cartographic documents and on orthophotos
GEOGRAPHIA N
APOCENSIS AN X
, nr. 2
/2016
geog
raphia
napo
censis
.acad
-cluj.
ro
The Evolution of Groapa Ruginoasa Ravine Studied by GIS Technology
13
average growth rate was 1918 m2/year. Although we presented the data resulted from the Modern Topographic map’s measurements we didn’t use these data in the calculations as the measured dimensions of the ravine exceed the actual state.
Regarding the length of the ravine we may estimate that 65% of the present size length of the ravine was already documented on the map in 1883.
The evolution pattern documented in the case of Groapa Ruginoasa is consistent with other gully and ravine development studies which state that after the most active period which occurs in the first 25-30 years after incision, the development rate slows down corresponding to a stagnation stage followed by extinction which can last up to 300–450 years (ex. Rădoane and Rădoane, 2016). According to these authors 50 % of the gully length (as well as the corresponding active surface) is produced in less than 20 % of the expected lifespan of the respective gully. Taking into account this statement we consider that the documented period belongs to a slower evolution pattern, corresponding to the second stage of evolution.
4.1 Headcut retreat rate
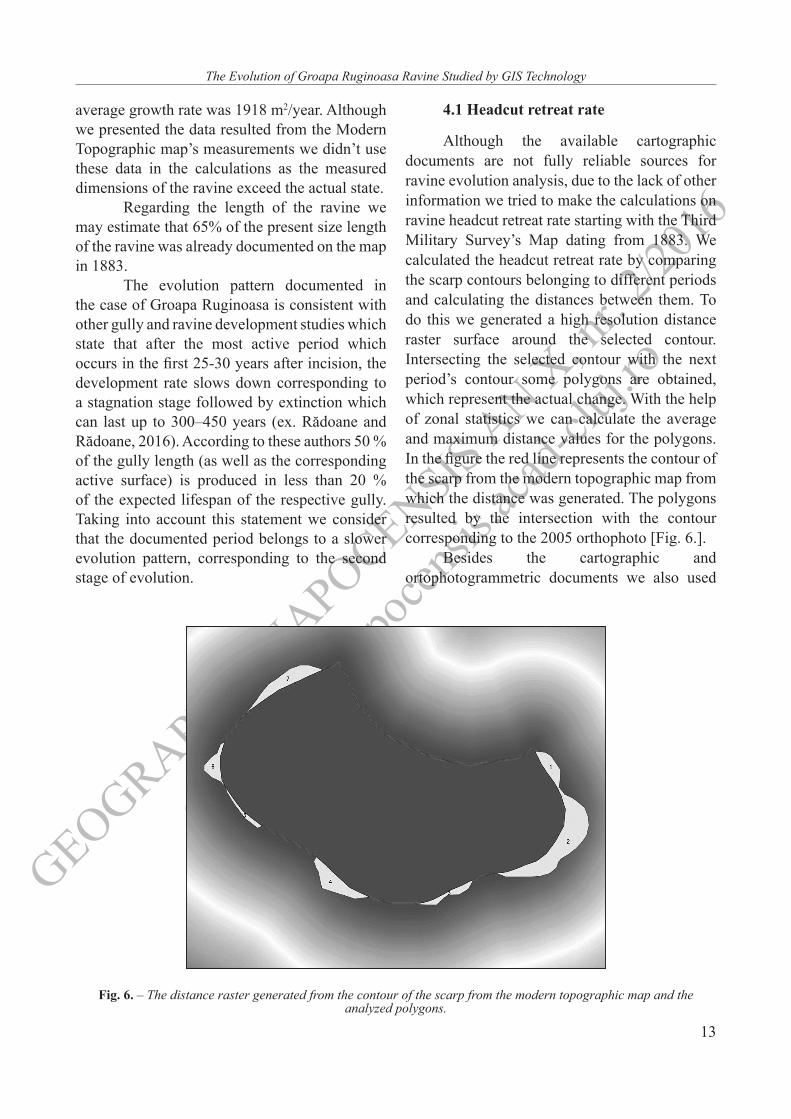
Although the available cartographic documents are not fully reliable sources for ravine evolution analysis, due to the lack of other information we tried to make the calculations on ravine headcut retreat rate starting with the Third Military Survey’s Map dating from 1883. We calculated the headcut retreat rate by comparing the scarp contours belonging to different periods and calculating the distances between them. To do this we generated a high resolution distance raster surface around the selected contour. Intersecting the selected contour with the next period’s contour some polygons are obtained, which represent the actual change. With the help of zonal statistics we can calculate the average and maximum distance values for the polygons. In the figure the red line represents the contour of the scarp from the modern topographic map from which the distance was generated. The polygons resulted by the intersection with the contour corresponding to the 2005 orthophoto [Fig. 6.].
Besides the cartographic and ortophotogrammetric documents we also used
Fig. 6. – The distance raster generated from the contour of the scarp from the modern topographic map and the analyzed polygons.
GEOGRAPHIA N
APOCENSIS AN X
, nr. 2
/2016
geog
raphia
napo
censis
.acad
-cluj.
ro
Imecs Zoltán, Gál AndreA, sImon ÉvA BeátA, PosZet sZIlárd
14
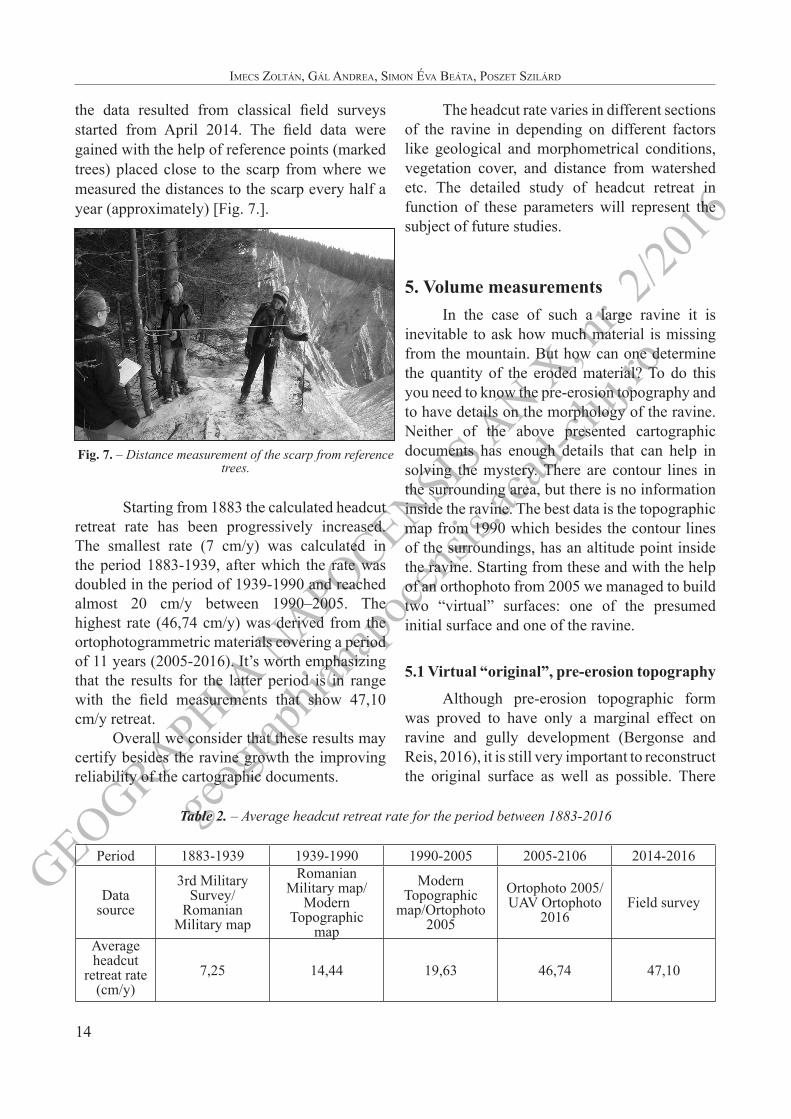
the data resulted from classical field surveys started from April 2014. The field data were gained with the help of reference points (marked trees) placed close to the scarp from where we measured the distances to the scarp every half a year (approximately) [Fig. 7.].
Starting from 1883 the calculated headcut retreat rate has been progressively increased. The smallest rate (7 cm/y) was calculated in the period 1883-1939, after which the rate was doubled in the period of 1939-1990 and reached almost 20 cm/y between 1990–2005. The highest rate (46,74 cm/y) was derived from the ortophotogrammetric materials covering a period of 11 years (2005-2016). It’s worth emphasizing that the results for the latter period is in range with the field measurements that show 47,10 cm/y retreat.
Overall we consider that these results may certify besides the ravine growth the improving reliability of the cartographic documents.
The headcut rate varies in different sections of the ravine in depending on different factors like geological and morphometrical conditions, vegetation cover, and distance from watershed etc. The detailed study of headcut retreat in function of these parameters will represent the subject of future studies.
5. Volume measurementsIn the case of such a large ravine it is
inevitable to ask how much material is missing from the mountain. But how can one determine the quantity of the eroded material? To do this you need to know the pre-erosion topography and to have details on the morphology of the ravine. Neither of the above presented cartographic documents has enough details that can help in solving the mystery. There are contour lines in the surrounding area, but there is no information inside the ravine. The best data is the topographic map from 1990 which besides the contour lines of the surroundings, has an altitude point inside the ravine. Starting from these and with the help of an orthophoto from 2005 we managed to build two “virtual” surfaces: one of the presumed initial surface and one of the ravine.
5.1 Virtual “original”, pre-erosion topography
Although pre-erosion topographic form was proved to have only a marginal effect on ravine and gully development (Bergonse and Reis, 2016), it is still very important to reconstruct the original surface as well as possible. There
Fig. 7. – Distance measurement of the scarp from reference trees.
Period 1883-1939 1939-1990 1990-2005 2005-2106 2014-2016
Data source
3rd Military Survey/
Romanian Military map
Romanian Military map/
Modern Topographic
map
Modern Topographic
map/Ortophoto 2005
Ortophoto 2005/UAV Ortophoto
2016Field survey
Average headcut
retreat rate (cm/y)
7,25 14,44 19,63 46,74 47,10
Table 2. – Average headcut retreat rate for the period between 1883-2016
GEOGRAPHIA N
APOCENSIS AN X
, nr. 2
/2016
geog
raphia
napo
censis
.acad
-cluj.
ro
The Evolution of Groapa Ruginoasa Ravine Studied by GIS Technology
15
have been quite a few interpolation methods presented in scientific works most of them using linear interpolation methods (Perroy et al., 2010, Buccolini et al. 2012), only a newly published article reports of validated spatial interpolation techniques (Bergonse and Reis, 2016).
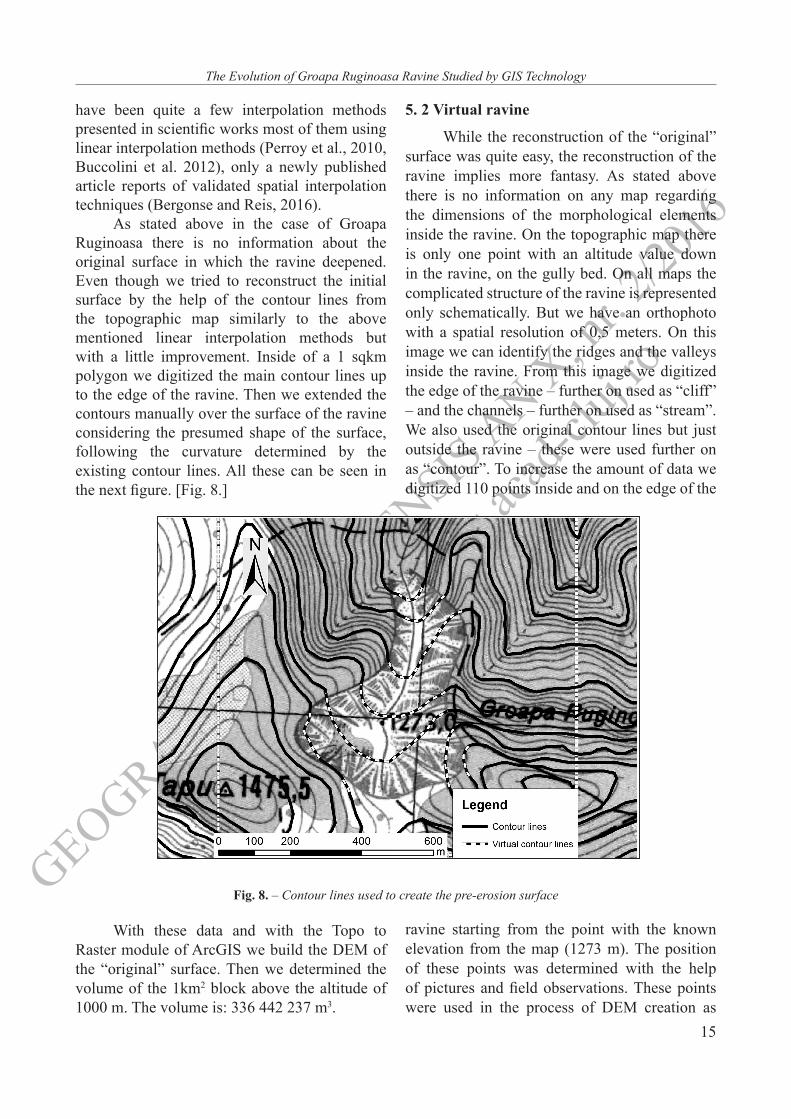
As stated above in the case of Groapa Ruginoasa there is no information about the original surface in which the ravine deepened. Even though we tried to reconstruct the initial surface by the help of the contour lines from the topographic map similarly to the above mentioned linear interpolation methods but with a little improvement. Inside of a 1 sqkm polygon we digitized the main contour lines up to the edge of the ravine. Then we extended the contours manually over the surface of the ravine considering the presumed shape of the surface, following the curvature determined by the existing contour lines. All these can be seen in the next figure. [Fig. 8.]
With these data and with the Topo to Raster module of ArcGIS we build the DEM of the “original” surface. Then we determined the volume of the 1km2 block above the altitude of 1000 m. The volume is: 336 442 237 m3.
5. 2 Virtual ravine
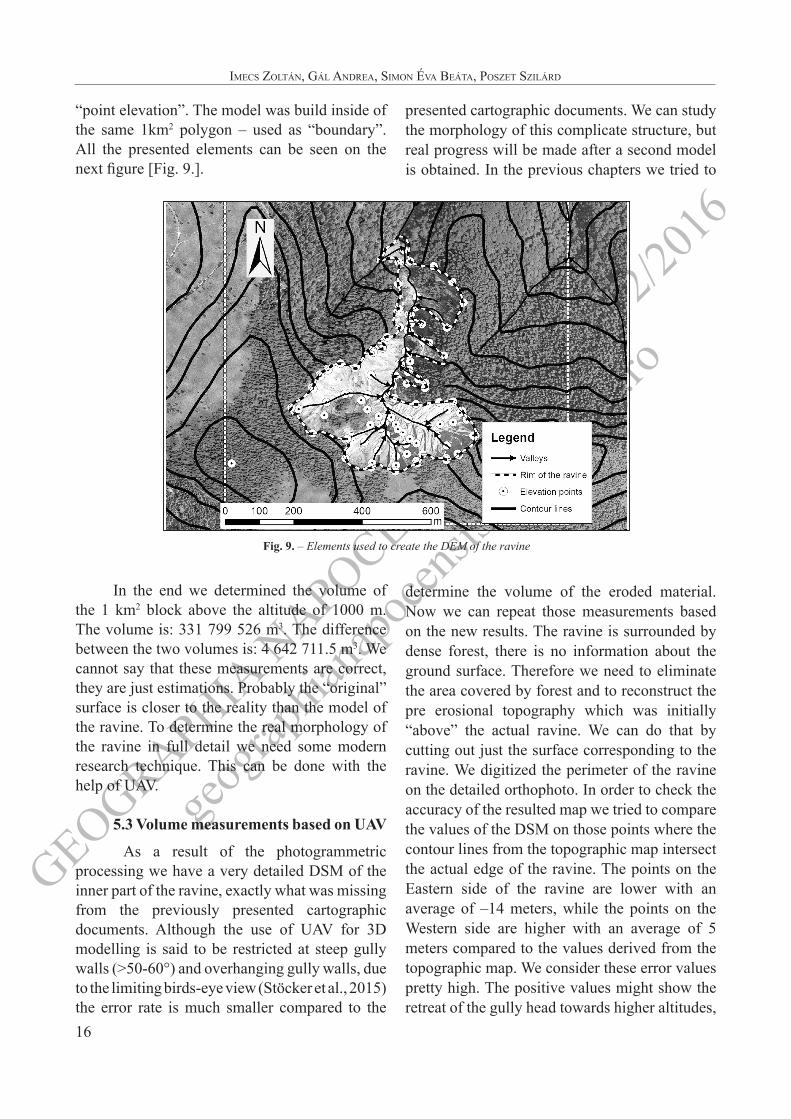
While the reconstruction of the “original” surface was quite easy, the reconstruction of the ravine implies more fantasy. As stated above there is no information on any map regarding the dimensions of the morphological elements inside the ravine. On the topographic map there is only one point with an altitude value down in the ravine, on the gully bed. On all maps the complicated structure of the ravine is represented only schematically. But we have an orthophoto with a spatial resolution of 0,5 meters. On this image we can identify the ridges and the valleys inside the ravine. From this image we digitized the edge of the ravine – further on used as “cliff” – and the channels – further on used as “stream”. We also used the original contour lines but just outside the ravine – these were used further on as “contour”. To increase the amount of data we digitized 110 points inside and on the edge of the
ravine starting from the point with the known elevation from the map (1273 m). The position of these points was determined with the help of pictures and field observations. These points were used in the process of DEM creation as
Fig. 8. – Contour lines used to create the pre-erosion surface
GEOGRAPHIA N
APOCENSIS AN X
, nr. 2
/2016
geog
raphia
napo
censis
.acad
-cluj.
ro
Imecs Zoltán, Gál AndreA, sImon ÉvA BeátA, PosZet sZIlárd
16
“point elevation”. The model was build inside of the same 1km2 polygon – used as “boundary”. All the presented elements can be seen on the next figure [Fig. 9.].
In the end we determined the volume of the 1 km2 block above the altitude of 1000 m. The volume is: 331 799 526 m3. The difference between the two volumes is: 4 642 711.5 m3. We cannot say that these measurements are correct, they are just estimations. Probably the “original” surface is closer to the reality than the model of the ravine. To determine the real morphology of the ravine in full detail we need some modern research technique. This can be done with the help of UAV.
5.3 Volume measurements based on UAV
As a result of the photogrammetric processing we have a very detailed DSM of the inner part of the ravine, exactly what was missing from the previously presented cartographic documents. Although the use of UAV for 3D modelling is said to be restricted at steep gully walls (>50-60°) and overhanging gully walls, due to the limiting birds-eye view (Stöcker et al., 2015) the error rate is much smaller compared to the
presented cartographic documents. We can study the morphology of this complicate structure, but real progress will be made after a second model is obtained. In the previous chapters we tried to
determine the volume of the eroded material. Now we can repeat those measurements based on the new results. The ravine is surrounded by dense forest, there is no information about the ground surface. Therefore we need to eliminate the area covered by forest and to reconstruct the pre erosional topography which was initially “above” the actual ravine. We can do that by cutting out just the surface corresponding to the ravine. We digitized the perimeter of the ravine on the detailed orthophoto. In order to check the accuracy of the resulted map we tried to compare the values of the DSM on those points where the contour lines from the topographic map intersect the actual edge of the ravine. The points on the Eastern side of the ravine are lower with an average of –14 meters, while the points on the Western side are higher with an average of 5 meters compared to the values derived from the topographic map. We consider these error values pretty high. The positive values might show the retreat of the gully head towards higher altitudes,
Fig. 9. – Elements used to create the DEM of the ravine
GEOGRAPHIA N
APOCENSIS AN X
, nr. 2
/2016
geog
raphia
napo
censis
.acad
-cluj.
ro
The Evolution of Groapa Ruginoasa Ravine Studied by GIS Technology
17
so these more or less fit in the frame. Taking into account that the contour lines originate from a map originally made more than 50 years ago with a 1:25 000 scale we question the accuracy of the map and we consider the newly made DSM more accurate than the maps.
As it is very difficult to reconstruct just the surface above the actual ravine, and as the checked values are close to those of the topographic map, in the measurement of the volume we will use the virtual surface already used in the previous measurement. But because the UAV model is just about the inner part of the ravine, we have to cut the virtual surface with the boundary of the ravine and to compare just the inner parts. The surface inside the boundary is 156618 m2. We determined the volume of this surface above the height of 1000 m a.s.l., both on the original, virtual surface and on the DSM produced by the UAV. The volume of the pre-erosional surface, just inside the actual boundary is 52 904 512 m3. The actual volume is 49 634 085 m2, so the difference between the two volumes is 3 270 427 m3. We have to mention that the UAV made DSM includes the trees on the Western part of the ravine, on the landslide surface. Thus the volume of these trees – which is very difficult to approximate – is included in the actual volume. The difference value is smaller than the value determined with the virtual ravine as that was based on approximations. Even if this value is still not correct – as we used an approximated original surface – it shows the greatness of the phenomenon. Further measurements with the same UAV technology will show the real evolution of the processes.
6. Conclusion The present study addressed the evolution
of Groapa Ruginoasa ravine based on available cartographic and ortophotographic documents. The first map on which the ravine appears dates 1864 (Second Military Survey’s Map). Based on the shape and sizes of the ravine we consider it only a cartographic symbol rather than the representation of the actual/real ravine. For this reason the calculations were performed starting
with the Third Military Survey’s map (1883). The confirmed errors from the Modern Topographic map (1990) determined us not to use this map for some of the calculations.
The morphometric data set shows that 73% of the actual ravine’s surface and 65% of the present size length already existed in 1883, thus the early evolution stage corresponding to the most active period has not been documented on maps. The change in area varies in different periods from 48m2/year (1883-1939) to 274 m2/year (1939-2005) and 1918m2/year (2005-2016).
The obtained results from the headcut retreat rate measurements from the cartographic and ortofotographic documents have a similar increasing pattern from 7 cm/year (1883-1939) to 47 cm/year (2005-2016). The headcut retreat rate calculated from data obtained from field survey performed in the period 2014-2016 almost equals the ones calculated from the 2 ortophotos. This supports/confirms the reliability of using ortophotos in ravine evolution analysis.
Overall we consider that these results may certify besides the ravine growth the improving reliability of the cartographic documents.
The next photogrammetric survey will allow us to perform much more accurate calculations that will be suitable for detailed analyses.
First of all our short-term future plan is to repeat the data acquisition with the UAV every 6 month and test its accuracy with ground based techniques.
References[1] BATES, R.L., JACkSON, J.A. (eds.) (1987),
Glossary of geology, 3rd Ed. American Geological Institute, Alexandria, VA. 788 pp.
[2] BERGONSE, R., REIS, E., (2015), Reconstructing pre-erosion topography using spatial interpolation techniques: a validation-based approach. J. Geogr. Sci. Vol. 25 (2), pp. 196–210. http://dx.doi.org/10.1007/s11442-015-1162-2.
[3] BERGONSE, R., REIS, E., (2016), Controlling factors of the size and location of large gully systems: A regression-based exploration using
GEOGRAPHIA N
APOCENSIS AN X
, nr. 2
/2016
geog
raphia
napo
censis
.acad
-cluj.
ro
Imecs Zoltán, Gál AndreA, sImon ÉvA BeátA, PosZet sZIlárd
18
reconstructed pre-erosion topography, Catena 147, pp. 621–631
[4] BORDEA S., BLEAHU M., BORDEA J., MANTEA GH., CIOFLICĂ G., ȘTEFAN A., POPESCU A., MARINESCU F. (eds.), (1985): 56 a Pietroasa, Harta geologică a României 1: 50000, Inst. Geol., București
[5] BUCCOLINI, M., COCO, L., CAPPADONIA, C., ROTIGLIANO, E., 2012. Relationships between a new slopemorphometric index and calanchi erosion in northern Sicily, Italy. Geomorphology 149-150, pp. 41–48.
[6] GóMEZ GUTIéRREZ, Á., SCHNABEL, S., BERENGUER-SEMPERE, F., LAVADO-CONTADOR, J.F., RUBIO-DELGADO, J., (2014), Using 3D photo-reconstruction methods to estimate gully headcut erosion, Catena 2014, 120, 91–101
[7] LINC R., NEDELCU, Gh., (2011), Evoluţia Gropii Ruginoasa în intervalul 1886-2009, urmărind documente cartografice, [http://geobihor.blogspot.ro/2011/11/evolutia-gropii-ruginoasa-muntele-tapu.html]
[8] NACHTERGAELE, J., POESEN, J., GOVERS, G., (2002), Ephemeral gullies. A spatial and temporal analysis of their characteristics, importance and prediction, Belgeo, 2/2002, pp. 159-182
[9] POESEN, J., NACHTERGAELE, J., VERSTRAETEN, G., VALENTIN, C. (2003). “Gully erosion and environmental change: importance and research needs.” CATENA, 50(2-4), pp. 91-133.
[10] PERROY R. L, BOOKHAGEN B, ASNER G. P., (2010). Comparison of gully
erosion estimates using airborne and ground based LiDAR on Santa Cruz Island, California, Geomorphology, 118: pp. 288–300.
[11] RĂDOANE, M., RĂDOANE, N., (2016), Gully Erosion, in RĂDOANE M., VESPREMEANU-STROE, A. (eds.), Landform Dynamics and Evolution in Romania, Springer Geography, DOI 10.1007/978-3-319-32589-7_16, pp. 371-396
[12] STÖCKER, C, ELTNER, A., KARRASCH, P., (2015), Measuring gullies by synergetic application of UAV and close range photogrammetry – A case study from Andalusia, Spain, Catena, 132, pp. 1-11
[13] VALENTIN, C., POESEN, J., LI, Y., (2005), Gully erosion: impacts, factors and control. Catena 63, pp. 132–153
[14] VANDEKERCKHOVE, L., POESEN, J., OOSTWOUD WIJDENES, D., GYSSELS, G., (2001). Short-term bank gully retreat rates in Mediterranean environments, Catena 44, pp. 133–161.
***First Military Survey’s Map [http://mapire.eu/hu/map/firstsurvey/]
***Second Military Survey’s map: [http://mapire.eu/hu/map/secondsurvey/]
***Third Military Survey’s map [http://mapire.eu/hu/map/hkf_75e/]
***Modern Topographical Map, 1:25000 (second edition 1970-1990) L-35-48-A-d, Direcția topografică militară
*** Ortophoto 2005 - ANCPI***Meteorological data: [http://www.
meteoromania.ro/anm/?lang=ro_ro]