Embed Size (px)
Citation preview

ORIGINAL PAPER
Control of style-of-faulting on spatial pattern of earthquake-triggered landslides
T. Gorum • E. J. M. Carranza
Received: 9 June 2014 / Revised: 12 December 2014 / Accepted: 3 January 2015 / Published online: 20 January 2015
� Islamic Azad University (IAU) 2015
Abstract Predictive mapping of susceptibility to earth-
quake-triggered landslides (ETLs) commonly uses distance
to fault as spatial predictor, regardless of style-of-faulting.
Here, we examined the hypothesis that the spatial pattern
of ETLs is influenced by style-of-faulting based on dis-
tance distribution analysis and Fry analysis. The Yingxiu–
Beichuan fault (YBF) in China and a huge number of
landslides that ruptured and occurred, respectively, during
the 2008 Wenchuan earthquake permitted this study
because the style-of-faulting along the YBF varied from its
southern to northern parts (i.e. mainly thrust-slip in the
southern part, oblique-slip in the central part and mainly
strike-slip in the northern part). On the YBF hanging-wall,
ETLs at 4.4–4.7 and 10.3–11.5 km from the YBF are likely
associated with strike- and thrust-slips, respectively. On the
southern and central parts of the hanging-wall, ETLs at
7.5–8 km from the YBF are likely associated with oblique-
slips. These findings indicate that the spatial pattern of
ETLs is influenced by style-of-faulting. Based on knowl-
edge about the style-of-faulting and by using evidential
belief functions to create a predictor map based on prox-
imity to faults, we obtained higher landslide prediction
accuracy than by using unclassified faults. When distance
from unclassified parts of the YBF is used as predictor, the
prediction accuracy is 80 %; when distance from parts of
the YBF, classified according to style-of-faulting, is used as
predictor, the prediction accuracy is 93 %. Therefore,
mapping and classification of faults and proper spatial
representation of fault control on occurrence of ETLs are
important in predictive mapping of susceptibility to ETLs.
Keywords Distance distribution analysis � Fry analysis �Evidential belief functions � Geographic information
system � Yingxiu–Beichuan fault � 2008 Wenchuan
earthquake
Introduction
Landslides triggered by earthquakes are significant natural
hazards to human life and property in many areas of the
world. Predicting where earthquake-triggered landslides
(ETLs) are likely to occur in relation to future earthquakes is
difficult because scientifically reproducible predictions of
where and when earthquakes will occur cannot be made yet.
Nevertheless, as most earthquakes are associated with faults,
many previous studies in predictive mapping of suscepti-
bility to occurrence of ETLs (e.g. Bai et al. 2014; Jaafari et al.
2014; Pourghasemi et al. 2014; Regmi et al. 2014; Zhao et al.
2014) commonly use distance to (or from) every mapped
fault as a spatial predictor, regardless of either orientation or
style-of-faulting (i.e. strike-slip, dip-slip or oblique-slip).
Implicit in this practice is the notion that every fault has equal
influence on landslide occurrence. However, Ghosh and
Carranza (2010) analysed the spatial pattern of landslides to
determine which sets of faults, according to their strikes, are
useful predictors of landslide susceptibility. They then
showed that, comparedwith using distance to every fault (i.e.
of various strikes), using distance to sets of faults of certain
strikes and having positive spatial associations with
T. Gorum
University of Twente, P.O. Box 217, 7500 AE Enschede,
The Netherlands
T. Gorum
Yildiz Technical University, Esenler, 34220 Istanbul, Turkey
E. J. M. Carranza (&)
James Cook University, Townsville, QLD 4811, Australia
e-mail: [email protected]
123
Int. J. Environ. Sci. Technol. (2015) 12:3189–3212
DOI 10.1007/s13762-015-0752-y

landslides yields a better predictive map of landslide sus-
ceptibility. Thus, as Dai et al. (2011) remind us, studying
‘…the spatial pattern of landslides triggered by an earth-
quake is important in understanding what areas may be
susceptible to landsliding in future earthquakes’.
In the last three decades, various studies have contributed
to the understanding of susceptibility to landsliding asso-
ciated with earthquakes by studying spatial patterns of ETLs
in relation to earthquake magnitude (e.g. Keefer 1984, 1993,
1994, 2002; Chen et al. 2012; Das et al. 2013; Xu and Xu
2014), ground motion parameters (e.g. Keefer 1984; Jibson
and Keefer 1993; Eberhart-Phillips et al. 2003; Wu and Lin
2009; Kaiser et al. 2012; Huang and Fan 2013; Gorum et al.
2014), distance from epicentre or from fault rupture (e.g.
Keefer 1984; Crozier et al. 1995; Eberhart-Phillips et al.
2003; Song et al. 2012; Li et al. 2013a, b; Yin 2014), geo-
logical properties such as lithology and soil (e.g. Keefer
1984; Holzer 1994; Shou and Wang 2003; Malamud et al.
2004; Huang et al. 2014), geomorphic features such rivers
and ridges (Hewitt 1983; Yang 1992; Chang and Slaymaker
2002; Xu et al. 2012; Xu and Xu 2013; Pourghasemi et al.
2014) and topographic variables such as slope gradient and
curvature (Hewitt 1983; Jibson and Keefer 1993; Chang and
Slaymaker 2002; Xu et al. 2012; Xu and Xu 2013, 2014).
Among these studies, those in the first two of the last three
decades (e.g. Hewitt 1983; Keefer 1984, 1993, 1994, 2002;
Jibson and Keefer 1993; Eberhart-Phillips et al. 2003; Shou
and Wang 2003) have formed the bases of various studies in
using a geographic information system (GIS) for predictive
mapping of susceptibility to occurrence of ETLs (e.g. Bai
et al. 2014; Jaafari et al. 2014; Pourghasemi et al. 2014;
Regmi et al. 2014; Zhao et al. 2014).
The studies cited in the preceding paragraph only pro-
vide implicit relationships between spatial patterns of ETLs
and style-of-faulting (i.e. based on slip direction). How-
ever, differences in style-of-faulting represent variations in
distribution of stress and vice versa, which influence vari-
ations in seismicity or ground motion parameters (Wei
et al. 2012; Teson et al. 2013; Bradley et al. 2014).
Accordingly, different styles-of-faulting have different
influence on geomorphic processes such as landsliding (e.g.
Wu and Chen 2011; Huang et al. 2012; Huang and Fan
2013; Xu and Xu 2014). Based on two- and three-dimen-
sional dynamic simulations of dipping faults, for the same
initial stress magnitude, thrust (or reverse dip-slip) faults
can produce much higher fault and ground motion than
normal and strike-slip faults (Oglesby and Day 2002; Be-
avan et al. 2012; Shi and Day 2013; Gabuchian et al. 2014).
Considering that landslides are important components of a
geomorphic system, Scheidegger (2001) emphasized that
ongoing tectonic movements, especially neo-tectonic pro-
cesses, have much more profound influence on geomorphic
systems and, thus, on landslide formation than the
generally assumed factors of geomorphic development.
Later studies elsewhere, based on two- and three-dimen-
sional dynamic simulations of dipping faults, show that, for
the same initial stress magnitude, thrust (or reverse dip-
slip) faults can produce much higher fault and ground
motion than normal and strike-slip faults (Nielsen 1998;
Shi et al. 1998; Oglesby et al. 1998, 2000a, b; Oglesby and
Day 2002). However, while the relationship of ETLs with
various factors is relatively well known, little is known
about the role of fault slips and orientations in co-seismic
landsliding and their influence on the spatial pattern of
ETLs. Therefore, analysis of the spatial pattern of ETLs in
relation to style-of-faulting would contribute further to the
understanding of susceptibility to occurrence of ETLs.
In this paper, we examine the hypothesis that the spatial
pattern of ETLs is influenced by style-of-faulting. To do
so, we chose the 240-km-long Yingxiu–Beichuan fault
(YBF) as reference because of two reasons. Firstly, it was
associated with the 2008 Wenchuan earthquake that trig-
gered a huge number of landslides (Ouimet 2009; Chigira
et al. 2010; Dai et al. 2011; Tang et al. 2010; Yin et al.
2010; Zhuang et al. 2010; Xu and Xu 2013; Xu et al. 2012,
2014) (Fig. 1). Secondly, the style-of-faulting along the
YBF, from its southern to northern parts, varied from
mainly thrust-slip to mainly strike-slip (Wang et al. 2009,
2010; Lin et al. 2009; Wan and Shen 2010) (Fig. 2). Based
on these two reasons, we examined the above hypothesis
by investigating two research questions. Firstly, given that
style-of-faulting can vary along a fault, can we classify
that fault according to predominant style-of-faulting based
on the spatial pattern of associated ETLs? This question
bears the importance of mapping and classification of
faults prior to predictive mapping of susceptibility to
occurrence of ETLs. Secondly, granted that parts of a fault
can be classified according to predominant style-of-fault-
ing, how does the spatial pattern of associated ETLs vary
with respect to predominant style-of-faulting? This ques-
tion bears the importance of proper representation of
predictors in predictive mapping of susceptibility to
occurrence of ETLs. Thus, we also show here that using
classified faults, rather than using un-classified faults,
provides for better spatial representation of fault control as
a predictor of susceptibility to occurrence of ETLs. This
study, using the ETL inventory of Gorum et al. (2011),
was conducted from 2011 to 2012 in the University of
Twente (Netherlands).
Study area
Tectonic setting and the 2008 earthquake
The 12 May 2008 Mw 7.9 Wenchuan earthquake occurred
in the NE-trending Longmenshan thrust fault belt along the
3190 Int. J. Environ. Sci. Technol. (2015) 12:3189–3212
123
eastern margin of the Tibetan Plateau that borders with the
Sichuan Basin (Fig. 2). This fault belt, a spectacular
mountain range, has developed due to the convergence of
the Tibetan Plateau with the Sichuan Basin since Late
Triassic (Burchfiel et al. 1995; Li et al. 2003; Richardson
et al. 2008). Because of that convergence, a complex
package of rocks, including Triassic marine sedimentary
rocks of the Songpan-Ganzi remnant ocean basin (Zhou
and Graham 1996), was thrusted to the southeast over the
margin of the South China block, creating a Late Triassic
foreland basin. The fault belt consists of a series of active
parallel thrusts (Fig. 2), among which the Wenchuan–
Maowen fault, Yingxiu–Beichuan fault (YBF) and Peng-
guan fault (PF) are seismogenic (Li et al. 2003; Densmore
et al. 2007).
The 2008 Wenchuan earthquake, which initiated close
to the south end of the YBF and propagated unilaterally
towards the NE for about 320 km (Wang et al. 2009; Xu
et al. 2009), ruptured both the YBF (240 km long) and PF
(70 km long) (Fig. 2). Shen et al. (2009) showed that the
rupture along the southern parts of the YBF has different
geometry than the rupture along its northern parts from SW
of Beichuan towards NE (Fig. 3). The north-west dips of
the YBF are, on average, 43�–44� along its southern parts
and increase to 49�–50� along its central parts approxi-
mately around Beichuan, and they are at least 55� to nearly
vertical in its northern parts. These variations in the
geometry of the YBF have corresponding variations in co-
seismic slip directions and slip rates (Liu-Zeng et al. 2009;
Xu et al. 2009).
Nakamura et al. (2010) and Zhao et al. (2010) showed
that the rupture along the YBF was due to two major
seismic sub-events (Fig. 2), one that occurred near Yingxiu
had mainly thrust-slip components and the other that
occurred near Beichuan had mainly right-lateral strike-slip
components. Zhao et al. (2010) further showed that the
Wenchuan earthquake consisted of five sub-events of
Mw C 7.3 that occurred successively in time and space
(Fig. 2). They also pointed out that the surface rupture
consisted of two areas with large slips. One area with large
slips was Dujiangyan–Mianzhu located 20–80 km NE from
the epicentre. In this area, the rupture had large thrust-slips
within depths of\15 km (Fig. 4). Around Mianzhu near
Leigu, the thrust-slips converted to dextral strike-slips,
which extended northwards along the YBF to Qingchuan
forming another area, 140–260 km NE from the epicentre,
with large slips within depths of\10 km (Fig. 4).
Several studies (e.g. Parsons et al. 2008; Lin et al. 2009;
Liu-Zeng et al. 2009; Wang et al. 2010; Zhang et al. 2010;
Fu et al. 2011; Li et al. 2013a, b; Wang et al. 2014) have
shown that in the southern parts of the YBF thrust-slip
components were larger than strike-slip components,
whereas in the northern parts of the YBF strike-slip com-
ponents were larger than thrust-slip components (Fig. 4).
Northwards from Leigu, about 5 km SW of Beichuan, the
dextral strike-slip components became roughly equal to, or
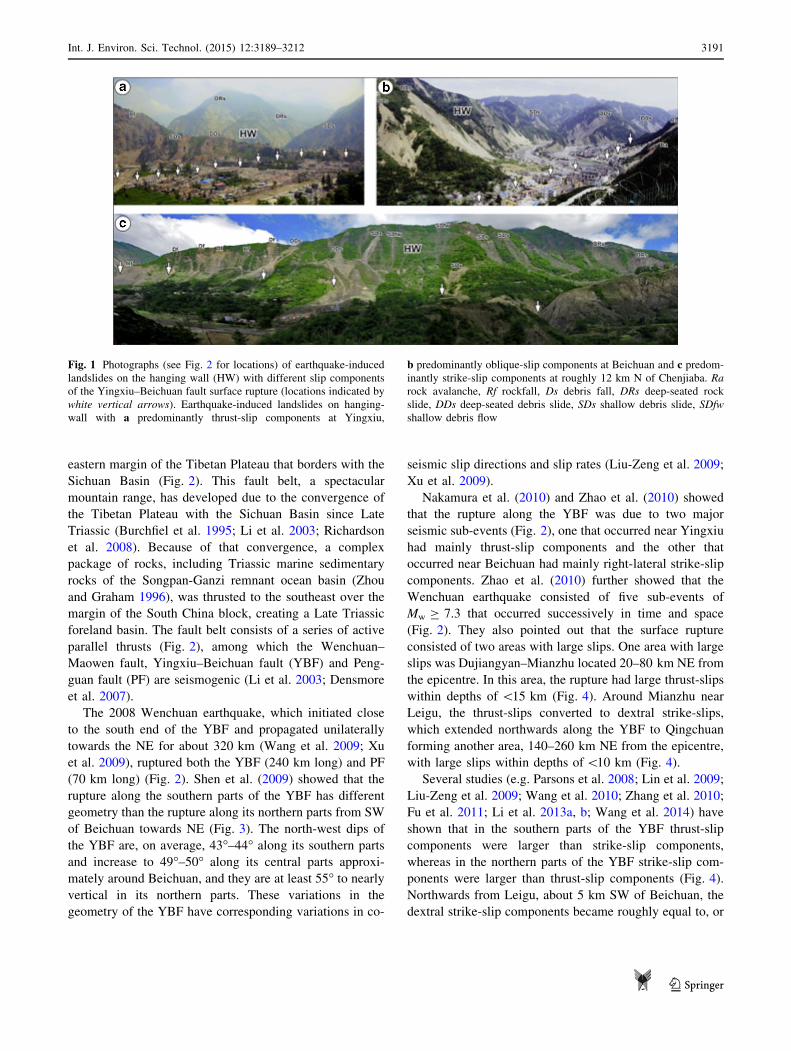
Fig. 1 Photographs (see Fig. 2 for locations) of earthquake-induced
landslides on the hanging wall (HW) with different slip components
of the Yingxiu–Beichuan fault surface rupture (locations indicated by
white vertical arrows). Earthquake-induced landslides on hanging-
wall with a predominantly thrust-slip components at Yingxiu,
b predominantly oblique-slip components at Beichuan and c predom-
inantly strike-slip components at roughly 12 km N of Chenjiaba. Ra
rock avalanche, Rf rockfall, Ds debris fall, DRs deep-seated rock
slide, DDs deep-seated debris slide, SDs shallow debris slide, SDfw
shallow debris flow
Int. J. Environ. Sci. Technol. (2015) 12:3189–3212 3191
123

slightly larger than, the vertical offsets measured at many
localities by Liu-Zeng et al. (2009) and Xu et al. (2009).
The strike-slip components then increased fairly near
Chenjiaba (10 km NE of Beichuan). The average vertical
offset along the YBF was 3–4 m, with maxima of
6.5 ± 0.5 m at north of Beichuan (31�50018.600N,104�2803.600E) in the northern parts and 6.2 ± 0.5 m at
Yingxiu near the branching point in the southern parts (Xu
et al. 2009). The maximum dextral strike-slip offset iden-
tified by Xu et al. (2009) was 4.9 ± 0.5 m at Pingtong
(31�5023.800N, 103�36056.900E).
Earthquake-triggered landslides associated with the 2008
earthquake
The 2008 Wenchuan earthquake triggered and resulted in
several tens of thousands of individual landslides of dif-
ferent types and sizes, which made it one of the most
extreme catastrophes in terms of ETLs in the last century
(Ouimet 2009; Chigira et al. 2010; Dai et al. 2011; Tang
et al. 2010; Wang et al. 2010; Yin et al. 2010; Zhuang
et al. 2010; Xu et al. 2014). The most common types of
landslides associated with that seismic event were
Fig. 2 Map of the Wenchuan earthquake fault surface rupture (from
Xu et al. (2009)) and focal mechanisms (black–white ‘beach ball’) of
the main 12 May 2008 earthquake (from USGS (2008)). The map
shows also the moment tensor solutions of the earthquake and the
distribution of sub-events (red-white ‘beach ball’), their mechanisms
and their time relative to the initial origin times (from Zhao et al.
(2010). Traces of following faults are adopted from Xu et al. (2009):
WMF Wenchuan–Maowen fault, YBF Yingxiu–Beichuan fault, PF
Pengguan fault, JGF Jiangyou–Guanxian fault, QCF Qingchuan fault.
PL location of photographs shown in Fig. 1
3192 Int. J. Environ. Sci. Technol. (2015) 12:3189–3212
123

rockfalls, rock avalanches and rock–debris slides (Chigira
et al. 2010; Dai et al. 2011). Large and deep-seated
landslides were quite common, especially close to the
fault ruptures (Fig. 1), and they occurred mostly in the
southern and central parts of the hanging-wall of the YBF,
whereas smaller and shallow landslides occurred mainly
on the hanging-wall of the YBF (Figs. 1, 5). Most of the
landslides occurred, however, in highly fractured and
jointed Precambrian crystalline and metamorphic rocks,
in weakly cemented and weathered Cambrian sedimentary
rocks and in pre-existing landslide deposits (Dai et al.
2011).
By processing and interpreting various pre- and post-
earthquake, high spatial resolution satellite images
(ASTER, 15 m; ALOS, 2.5 m; Cartosat-1, 2.5 m; SPOT-5,
2.5–5 m; IKONOS, 1–4 m), Gorum et al. (2011) identified
60,104 individual initiation points (or locations) of the
landslides triggered by the 2008 Wenchuan earthquake
(Fig. 5). This inventory of earthquake-triggered landslide
initiation points was used by Gorum et al. (2011) to analyse
the influence of the dynamic rupture processes on the
distribution of ETLs associated with the 2008 Wenchuan
earthquake. Based on this inventory of earthquake-trig-
gered landslide initiation points, we can see that the ETLs
were widely and densely distributed around the southern to
Fig. 3 Model geometry of the Yingxiu–Beichuan fault as viewed
from SW at 45� elevation angle (adopted from Shen et al. 2009). Fault
dip angle was assumed constant along dip and varies linearly along
strike, with six dip angles at fault nodal points inverted in the solution
by Shen et al. (2009)
Fig. 4 Co-seismic slip distributions during the 2008 Wenchuan
earthquake along the Yingxiu–Beichuan fault (YBF) according to
a–c Shen et al. (2009), d Wang et al. (2008a, b), e Nakamura et al.
(2010) and f Nishimura and Yagi (2008). Reverse-slip (b) and
dextral-slip amplitudes (c) and model surface offsets (columns) are
compared with field observations (thin lines; adopted from Xu et al.
2009). PF Pengguan fault
Int. J. Environ. Sci. Technol. (2015) 12:3189–3212 3193
123

central parts of the YBF but narrowly and sparsely dis-
tributed around the northern parts of the YBF (Fig. 5a). In
addition, the inventory of earthquake-triggered landslide
initiation points indicates that about 70 % of the ETLs
occurred in the area between Yingxiu and Beichuan
(Fig. 5d, e), and this observation coheres with the high
vertical slip rates measured by Liu-Zeng et al. (2009) and
Xu et al. (2009) in that area (Fig. 5b). Moreover, the
inventory of earthquake-triggered landslide initiation
points of Gorum et al. (2011) indicates that about 60 % of
the ETLs occurred on the hanging-wall of the YBF,
whereas about 15 % of the ETLs occurred on the hanging-
wall of the PF (Fig. 5a). The remaining 25 % of the ETLs
occurred on slopes of deeply incised valleys much farther
(about 25 km) to the west of the YBF or on the footwall of
either the YBF or the PF (Fig. 5a).
Apparently, the distribution of the ETLs on the hanging-
wall of the YBF was widest (up to about 17 km) in its
southern part, intermediate (up to about 10 km) in its
central part and narrowest (up to about 3.5 km) in its
northern part (Fig. 5a). In the longitudinal swath profile
(18 km wide and 240 km long) that we constructed on the
hanging-wall of the YBF (Fig. 5d), the density of ETLs
(number of landslide per km2) decreases from south to
north along strike of the surface rupture of this fault
(Fig. 5d). On the hanging-wall of the YBF with predomi-
nantly thrust-slip component (PdTC), or in the area
between Yingxiu and Beichuan where the vertical co-
seismic offsets are relatively larger than the horizontal co-
seismic offsets (Fig. 5b, c), the average density of ETLs is
generally more than 20 km-2 with a maximum density of
54 km-2 (Fig. 5d). In contrast, on the hanging-wall of the
Fig. 5 Distribution of earthquake-induced landslides and co-seismic
offsets along the Yingxiu–Beichuan fault (YBF) The map (a) contains60,104 landslide initiation points (from Gorum et al. 2011). The
vertical (b) and horizontal (c) co-seismic offsets, measured by Xu
et al. (2009), show that the YBF can be divided into three parts
depending on whether they have predominantly thrust components
(PdTC), predominantly strike-slip components (PdSC) or predomi-
nantly oblique components (PdOC). The graph in (d) illustrates that,in the selected co-seismic fault plane boundary shown in (a), along-
strike swath profile of earthquake-induced landslide density varies
depending on the predominant fault slip components along the YBF.
The box-whisker plot in (e) illustrates that, in the selected co-seismic
fault plane boundary shown in (a), the total area affected by
earthquake-induced landslides also varies depending on the predom-
inant fault slip components along the YBF. In the map, the following
rivers are indicated: MJR Minjiang River, ZR Zagunao River, HR
Heishuehe River, MYR Mianyuan River, JJR Jianjiang River, QR
Qingzhu River. For fault names in the map, see Fig. 1
3194 Int. J. Environ. Sci. Technol. (2015) 12:3189–3212
123

YBF with predominantly strike-slip component (PdSsC), or
in the area between Beichuan and Qingchuan where the
horizontal co-seismic offsets are relatively larger than the
vertical co-seismic offsets (Fig. 5b, c), the average density
of ETLs is generally less than 15 km-2 with a maximum
density of 30 km-2 (Fig. 5d). Moreover, ETLs on the
hanging-wall of the YBF with PdTC have higher areal
coverage than ETLs on the hanging-wall of the YBF with
PdSsC (Fig. 3e). Finally, in the area between 30 km south
and 30 km north of Beichuan, where horizontal co-seismic
offsets and vertical co-seismic offsets are roughly equal
(Figs. 4a–c, 5b, c), the YBF has a predominantly oblique-
slip component (PdOC). On the hanging-wall of the YBF
with PdOC, the average density of ETLs is lower than on
the hanging-wall of the YBF with PdTC but is higher than
on the hanging-wall of the YBF with PdSsC (Fig. 5d). The
foregoing observations and initial analyses indicate,
therefore, that the spatial pattern of ETLs depends on style-
of-faulting. In the following section, we investigate
dependency of spatial pattern of ETLs on style-of-faulting.
Materials and methods
To examine the hypothesis that the spatial pattern of ETLs
is influenced by style-of-faulting, we investigated two
research questions. Firstly, given that style-of-faulting can
vary along a fault, can we classify that fault according to
predominant style-of-faulting based on the spatial pattern
of associated ETLs? Secondly, granted that parts of a fault
can be classified according to predominant style-of-fault-
ing, how does the spatial pattern of associated ETLs vary
with respect to predominant style-of-faulting? To investi-
gate these two research questions, we applied the distance
distribution analysis (see ‘‘Distance distribution analysis of
landslide distribution’’ section) to characterize the spatial
pattern of ETLs and we investigated further our interpre-
tations of the distance distribution analyses by application
of Fry analysis (see ‘‘Fry analysis of landslide distribution’’
section). Finally, we applied evidential belief functions
(see ‘‘Representation of fault control on susceptibility to
landsliding’’ section) to test whether using classified faults,
compared with using un-classified faults, improves pre-
diction accuracy of landslide susceptibility mapping.
Distance distribution analysis of landslide distribution
In previous studies in the study area (Huang and Li 2009;
Dai et al. 2011; Yin et al. 2010; Zhuang et al. 2010), the
spatial pattern of ETLs with respect to distance from the
YBF was characterized by the number or percentage of
landslides (depicted as points) per unit of cumulative
increasing area of its footwall or hanging-wall. This
method is, however, inadequate for examining spatial
dependency of a set of point objects on another set of
objects. That is because spatial dependency is not associ-
ated with random chance and must be examined properly
via probabilistic methods. Here, we applied the distance
distribution analysis, which is a probabilistic method for-
malized by Berman (1977, 1986) for measuring spatial
association between a set of point objects and another set of
objects. The formalism of the distance distribution method
is complex, and for details, the readers are referred directly
to the seminal papers of Berman (1977, 1986); however,
the following discussion for its application here is
simplified.
The distance distribution analysis involves constructing
two graphs. One graph [denoted as D(L)] represents
cumulative relative frequency distribution of distances
from a set of objects (e.g. surface ruptures along the YBF)
to every location. The other graph [denoted as D(NL)]
represents cumulative relative frequency distribution of
distances from the same set of object(s) to locations of
individual ETLs (depicted as points). In this study, the
D(L) is considered a non-random probability distribution of
ETLs with respect to surface ruptures along the YBF,
whereas the D(NL) is considered a random probability
distribution of (mostly) non-landslide locations with
respect to the same set of spatial objects.
To determine whether ETLs are associated spatially
with surface ruptures along the YBF, the D(L) is compared
with the D(NL) by calculating the Kolmogorov–Smirnov
statistic D = D(L) - D(NL) (Berman 1977, 1986). The
statistical significance of D can be evaluated through a Chi-
square (v2) test (for details, see Chernoff and Lehmann
1954 or Plackett 1983). Positive and negative values of
D represent how much the likelihood of earthquake-trig-
gered landslide occurrence associated with surface ruptures
along the YBF is, respectively, higher or lower than would
be expected due to random chance. A value of D % 0
implies that ETLs under study lack spatial association with
surface ruptures along the YBF. A value of D[ 0 implies
that ETLs under study have positive spatial association
with surface ruptures along the YBF. A value of D\ 0
implies that ETLs under study have negative spatial asso-
ciation with surface ruptures along the YBF. A positive,
rather than negative, spatial association between a set of
point objects and another set of objects is regarded as
spatial dependence (Berman 1977, 1986). Thus, the highest
peak in a graph of D versus distance (or the difference
Int. J. Environ. Sci. Technol. (2015) 12:3189–3212 3195
123

curve) represents distance from reference objects within
which there is optimum positive spatial association
between those objects and a set of point objects.
Fry analysis of landslide distribution
Fry analysis (Fry 1979) is a graphical method of spatial
autocorrelation analysis of a set of point objects (e.g. ETLs
depicted on district- to regional-scale maps). The formal-
ism of this method is complex, and for details, the readers
are referred directly to the seminal papers of Fry (1979)
and Hanna and Fry (1979); however, the following dis-
cussion for its application here is informal and simplified.
The method translates point objects into a Fry plot by using
every point as an origin for translation. On a map of point
objects, N–S and E–W reference lines are drawn. On a
second but empty map, N–S- and E–W-trending reference
lines are also drawn and an origin for translation is marked
at the intersection of an N–S reference line and an E–W
reference line. The origin in the second map is placed on
top of one of the points in the first map, the reference lines
in both maps are kept parallel, and the positions of all the
points are recorded in the second map. The origin in the
second map is then placed on top of a different point in the
first map, the reference lines in both maps are kept parallel,
and the positions of all the points are recorded again in the
second map. The procedure is repeated until all the points
in the first map have been used as the origin in the second
map. If the number of points is n, the number of point
translations is n2–n. These point translations, called Fry
points, were developed originally to investigate strain and
strain partitioning in rocks (Fry 1979; Hanna and Fry
1979).
Based on a Fry plot, a rose diagram can be created for
visual analysis of trends between (a) all pairs of Fry points
and (b) pairs of Fry points within specified distances from
each other. The former analysis reveals trends that can be
associated with regional-scale geological processes or are
artefacts of the shape of study area, whereas the latter
analysis reveals trends that can be associated with local-
scale geological processes. Analysis of Fry points within
specified distances from each other is, in this study, apt for
studying trends in the spatial pattern of ETLs that are likely
associated with style-of-faulting along earthquake faults.
For this purpose, we considered to use minimum distance
from every earthquake-triggered landslide within which
there is probability of only one neighbour earthquake-
triggered landslide. This minimum distance (60 m for the
ETLs in the 21-km-wide zone on the hanging-wall of the
YBF) can be determined via point pattern analysis (see
Boots and Getis (1988) for details). We made that con-
sideration because it is likely that any two ETLs, within
that distance from each other, are controlled by the same
process(es).
Representation of fault control on susceptibility
to landsliding
Predictive mapping of susceptibility to landsliding requires
representation and integration of known spatial factors as
layers of evidence of that phenomenon. This means that a
layer of evidence of landslide susceptibility should ade-
quately capture the process involved and spatial association
between landslides and a spatial factor (style-of-faulting).
In this paper, we use data-driven evidential belief functions
(EBFs), which are based on the Dempster–Shafer theory of
belief (Dempster 1967; Shafer 1976) for representing
degrees of belief that evidence supports a proposition and
thus represents spatial association between evidence and
phenomenon under study. The EBFs to be estimated are
belief (Bel), disbelief (Dis) and uncertainty (Unc). Bel is a
lower degree of belief in evidence with respect to a prop-
osition. Dis is a degree of disbelief in evidence with respect
to that proposition. Unc is ‘ignorance’ or ‘doubt’ in evi-
dence with respect to that proposition. The sum
Bel ? Unc ? Dis for evidence with respect to any prop-
osition is equal to 1 (i.e. maximum probability). Unc
influences the relation between Bel and Dis. If Unc = 0
(i.e. complete knowledge about an evidence), Bel ? -
Dis = 1 and the relation between Bel and Dis is binary (i.e.
Bel = 1 - Dis or Dis = 1 - Bel), as in the theory of
probability. If Unc = 1 (i.e. complete ignorance about an
evidence), Bel and Dis are both equal to zero, because, if
there is complete uncertainty, there can be neither belief
nor disbelief. Usually, however, Unc is neither equal to
zero nor equal to one. If 0\Unc\ 1, then Bel = 1 - Dis
- Unc or Dis = 1 - Bel - Unc, meaning that the relation
between Bel and Dis is not binary because some uncer-
tainty is present. Thus, one should estimate not only Bel but
also Dis and Unc for any evidence (e.g. distance to fault)
used to evaluate a proposition (e.g. ‘this location is prone to
earthquake-triggered landsliding’).
Estimation of EBFs of evidence with respect to certain
propositions has traditionally been knowledge driven (i.e.
based on expert opinion), which is subjective because
(a) no two experts will have the same opinion about an
evidence for a certain proposition and (b) differentiating
between and, thus, estimating Dis and Unc is conceptually
difficult. However, Carranza and Hale (2003) have devel-
oped a method using a GIS for data-driven estimation of
3196 Int. J. Environ. Sci. Technol. (2015) 12:3189–3212
123
EBFs of spatial evidence of mineral prospectivity. Details
of data-driven estimation of EBFs are not given here, but
can be found in Carranza and Castro (2006) or Ghosh and
Carranza (2010), who used that method for predictive
mapping of susceptibility to, respectively, distal lahar-
inundation in Mount Pinatubo (Philippines) and rock slid-
ing in Darjeeling Himalaya (India).
Results and discussion
Distance distribution analysis of landslide distribution
To examine the above-stated hypothesis without loss of
generality, we applied the distance distribution analysis to
characterize the spatial pattern of ETLs in a 240-km-long
zone on the hanging-wall of the YBF (Fig. 5). This zone is
the surface projection of the co-seismic fault plane
boundary of the YBF (Figs. 4a, 5) defined by Shen et al.
(2009), except that we disregard the south-western-most
portion of this fault plane boundary because its surface
projection coincides with the hanging-wall of the Wench-
uan–Maowen fault (WMF). The jagged south-western
boundary of the considered zone is due to the cell config-
urations used by Shen et al. (2009) (Fig. 4a–c). The wes-
tern boundary of the considered zone is at most 21 km
from the surface ruptures of the YBF. This distance is
roughly the average of various reported widths of zones on
the hanging-wall of the YBF with the highest density of
ETLs (i.e. *25–30 km (Ouimet 2009; Dai et al. 2011),
11.5 km (Yin et al. 2010), 15 km (Zhuang et al. 2010),
30 km (Chigira et al. 2010)). Thus, based on findings of
previous studies in the area, we believe that constraining
the examination of the above-stated hypothesis within the
defined 240-km-long and 21-km-wide zone on the hanging-
wall of the YBF is likely to give significant and interesting
findings. In applying distance distribution analysis, we used
a map unit cell size of 100 m to represent every location in
the study area; thus, in the hanging-wall of the YBF, there
are at least 400,000 unit cells, of which at least 28,000 unit
cells contain at least one ETL. Because of these large
numbers of unit cells, all the results of distance distribution
analysis indicated statistically significant spatial patterns.
To investigate the first research question, we performed
two sets of distance distribution analysis using distances
not from the surface ruptures of the YBF but from (1) the
north end of the hanging-wall of the YBF and (2) the south
end of the hanging-wall of the YBF. The purpose of these
analyses is to classify the parts of the hanging-wall of the
YBF, in terms of style-of-faulting, with respect to
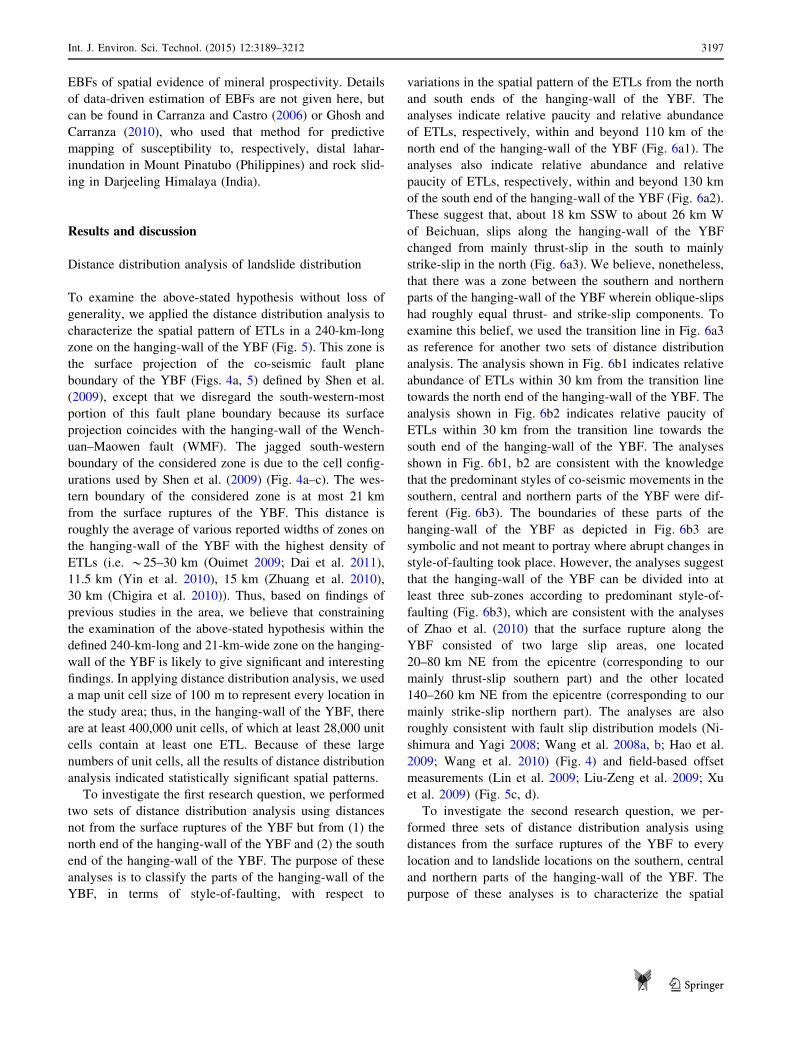
variations in the spatial pattern of the ETLs from the north
and south ends of the hanging-wall of the YBF. The
analyses indicate relative paucity and relative abundance
of ETLs, respectively, within and beyond 110 km of the
north end of the hanging-wall of the YBF (Fig. 6a1). The
analyses also indicate relative abundance and relative
paucity of ETLs, respectively, within and beyond 130 km
of the south end of the hanging-wall of the YBF (Fig. 6a2).
These suggest that, about 18 km SSW to about 26 km W
of Beichuan, slips along the hanging-wall of the YBF
changed from mainly thrust-slip in the south to mainly
strike-slip in the north (Fig. 6a3). We believe, nonetheless,
that there was a zone between the southern and northern
parts of the hanging-wall of the YBF wherein oblique-slips
had roughly equal thrust- and strike-slip components. To
examine this belief, we used the transition line in Fig. 6a3
as reference for another two sets of distance distribution
analysis. The analysis shown in Fig. 6b1 indicates relative
abundance of ETLs within 30 km from the transition line
towards the north end of the hanging-wall of the YBF. The
analysis shown in Fig. 6b2 indicates relative paucity of
ETLs within 30 km from the transition line towards the
south end of the hanging-wall of the YBF. The analyses
shown in Fig. 6b1, b2 are consistent with the knowledge
that the predominant styles of co-seismic movements in the
southern, central and northern parts of the YBF were dif-
ferent (Fig. 6b3). The boundaries of these parts of the
hanging-wall of the YBF as depicted in Fig. 6b3 are
symbolic and not meant to portray where abrupt changes in
style-of-faulting took place. However, the analyses suggest
that the hanging-wall of the YBF can be divided into at
least three sub-zones according to predominant style-of-
faulting (Fig. 6b3), which are consistent with the analyses
of Zhao et al. (2010) that the surface rupture along the
YBF consisted of two large slip areas, one located
20–80 km NE from the epicentre (corresponding to our
mainly thrust-slip southern part) and the other located
140–260 km NE from the epicentre (corresponding to our
mainly strike-slip northern part). The analyses are also
roughly consistent with fault slip distribution models (Ni-
shimura and Yagi 2008; Wang et al. 2008a, b; Hao et al.
2009; Wang et al. 2010) (Fig. 4) and field-based offset
measurements (Lin et al. 2009; Liu-Zeng et al. 2009; Xu
et al. 2009) (Fig. 5c, d).
To investigate the second research question, we per-
formed three sets of distance distribution analysis using
distances from the surface ruptures of the YBF to every
location and to landslide locations on the southern, central
and northern parts of the hanging-wall of the YBF. The
purpose of these analyses is to characterize the spatial
Int. J. Environ. Sci. Technol. (2015) 12:3189–3212 3197
123
pattern of ETLs in relation to differences in slips along the
hanging-wall of the YBF. The analyses for the three parts
of the hanging-wall of the YBF show that the ETLs under
study have positive spatial associations with the YBF
(Fig. 7). However, the difference curves in Fig. 7 show that
in the southern part, compared with the central and
Fig. 6 Graphs of cumulative
relative frequency of distances:
to every location and to
landslide locations from the a1north end of hanging-wall of the
YBF and a2 south end of
hanging-wall of the YBF, which
suggest a3 transition (solid line)
of movements along the YBF
from mostly dip-slip in the
south part to mostly strike-slip
in the north; and graphs of
cumulative relative frequency of
distances from the transition
line to every location and to
landslide locations on b1 the
northern hanging-wall zone of
the YBF and b2 the southern
hanging-wall zone of the YBF,
which suggest b3 three sub-
zones with varying slips along
the hanging-wall zone of the
YBF
3198 Int. J. Environ. Sci. Technol. (2015) 12:3189–3212
123

northern parts, of the hanging-wall of the YBF there is
lowest likelihood of occurrence of ETLs due to proximity
to the YBF than would be expected due to random chance.
This result may seem odd in view of the fact that about
60 % of ETLs on the hanging-wall of the YBF are located
in its 100-m-long southern part (cf. Fig. 6b2). However, we
interpret this ‘odd’ result to mean that, in the southern
hanging-wall of the YBF, there are other factors of earth-
quake-triggered landslide occurrence that are likely more
important than proximity to the YBF, although, in the
central and northern hanging-wall of the YBF, those factors
are likely less important than proximity to the YBF. For
example, because the south end of the hanging-wall of the
YBF is about 15 km from the epicentre of the 2008
Wenchuan earthquake (see Figs. 2, 4 and 5), proximity to
the earthquake epicentre rather than to the YBF is likely
more important for earthquake-triggered landslide occur-
rence in the southern hanging-wall of the YBF but likely
less important in the central and northern hanging-wall of
the YBF. In addition, Precambrian crystalline and meta-
morphic rocks underlie the southern hanging-wall of the
YBF, whereas Cambrian sedimentary rocks underlie the
central and northern hanging-wall of the YBF, suggesting
that lithology may have more influence on earthquake-
triggered landslide occurrence in the southern hanging-wall
of the YBF but less in the central and northern hanging-
wall of the YBF. Moreover, slope failures in brittle rock are
sensitive to high accelerations commonly within higher
frequencies of ground motion (Jibson et al. 2006). How-
ever, Gorum et al. (2011) analysed the density of ETLs in
two areas: one is homogeneously underlain by Precambrian
crystalline rocks and the other by Cambrian sedimentary
rocks. Each of these areas is located on the hanging-wall of
the YBF with different fault geometries. Gorum et al.
(2011) found that changes in lithology do not explain
significant changes in the density of ETLs on the hanging-
wall of the YBF. In addition, Ouimet (2009) stated also that
variations in the spatial pattern of ETLs relative to different
components of the surface rupture do not correspond to
changes in lithology. Besides those independent findings in
the study area, the analyses shown in Fig. 7b, c, which
pertain to areas underlain by Cambrian sedimentary rocks,
show different spatial patterns of ETLs. Thus, changes in
underlying lithology do not seem to have an influence on
the spatial pattern of ETLs in the study area, although this
may not be the case in other areas.
Nevertheless, Fig. 7 further illustrates interesting fea-
tures in relation to the second research question as describe
below. The distance distribution analysis for the southern
hanging-wall of the YBF shows three peaks along the
difference curve, suggesting the presence of three popula-
tions of ETLs lying at, respectively, roughly 4.7, 8 and
11.5 km from the YBF (Fig. 7a). The distance distribution
analysis for the central hanging-wall of the YBF shows
three peaks along the difference curve, suggesting the
presence of three populations of ETLs lying at, respec-
tively, roughly 4.7, 7.5 and 10.3 km from the YBF
Fig. 7 Graphs of cumulative relative frequency of distances from the
YBF to every location and to landslide locations on different parts of
its hanging-wall zone (see Fig. 6b3): a southern part, b central part
and c northern part
Int. J. Environ. Sci. Technol. (2015) 12:3189–3212 3199
123

(Fig. 7b). The distance distribution analysis for the north-
ern hanging-wall of the YBF shows a major peak and a
subtle peak along the difference curve, suggesting the
presence of two populations of ETLs lying at, respectively,
roughly 4.4 and 11.5 km from the YBF (Fig. 7c). The
similar maximum distances of spatial patterns of ETLs on
the hanging-wall of the YBF (Fig. 7) are consistent with
the findings of Yin et al. (2010) and Zhuang et al. (2010)
about the widths of zones on the hanging-wall of the YBF
with highest densities of ETLs (i.e. 11.5 and 15 km,
respectively). However, the similar minimum and maxi-
mum distances of spatial pattern of ETLs on the hanging-
wall of the YBF and the similar intermediate distances of
spatial patterns of ETLs on the southern and central parts of
that zone require interpretation.
The results of distance distribution analysis to examine
the second research question can be interpreted in view of
aspect ratios of asperities of surface ruptures associated
with earthquake faults. An asperity is a zone along a fault
surface that has a larger slip rate compared with the aver-
age slip rate along that fault, and its along-strike length to
down-dip width ratio is called its aspect ratio. Somerville
et al. (1999) observed that asperities of strike-slip earth-
quake faults are roughly 29 larger than asperities of dip-
slip earthquake faults, which indicate that zones of strong
ground motion associated with strike-slip earthquake faults
are narrower than zones of strong ground motion associated
with dip-slip earthquake faults. This is likely the case along
the YBF in view of the changes in geometry of the different
parts of this fault (Fig. 3) and variations in co-seismic slip
distributions along this fault (Fig. 4). If that is the case, the
results of distance distribution analysis can be interpreted
as follows. Within the defined 21-km-wide zone on the
hanging-wall of the YBF, ETLs lying 4.4–4.7 km from the
YBF are likely associated with strike-slips, whereas ETLs
lying 10.3–11.5 km from the YBF are likely associated
with thrust-slips. Within the southern and central parts of
the hanging-wall of the YBF, ETLs lying 7.5–8 km from
the YBF are likely associated with oblique-slips having
roughly equal thrust- and strike-slip components. These
interpretations can be investigated further via the applica-
tion of Fry analysis.
Fry analysis of landslide distribution
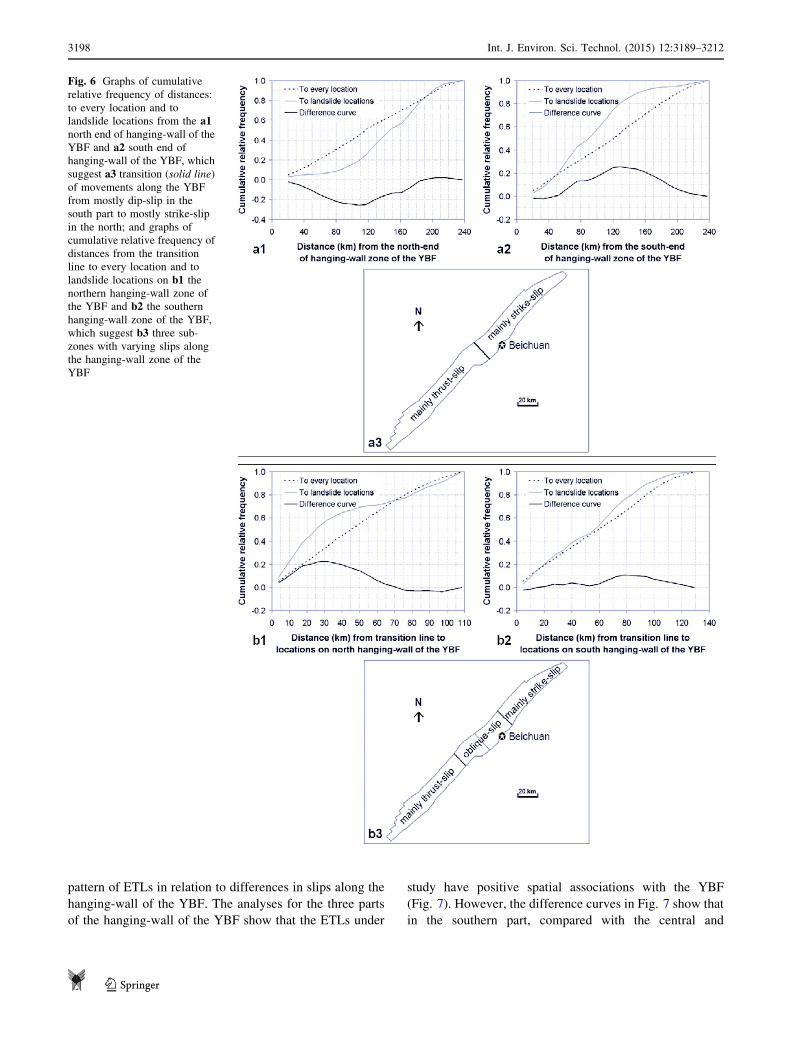
Fry points of ETLs on the southern hanging-wall of the
YBF exhibit 30�–45� major trends, those on the central
hanging-wall exhibit 0�–15� and 30�–45� major trends, and
those on the northern hanging-wall exhibit 0�–15� and 60�–75� major trends (Fig. 8a). Fry points of ETLs on the
hanging-wall of the PF, which has geometry and kine-
matics similar to YBF, exhibit major and minor trends that
are closely similar to those on the southern hanging-wall of
the YBF. The 30�–45� major trends exhibited by ETLs on
the southern and central parts of the hanging-wall of the
YBF follow the main strike of this fault and are likely
associated with thrust-slips of the YBF. That is because
HWs of major thrust (or reverse dip-slip) faults, such as the
YBF, usually exhibit imbricate stacking of minor thrust
faults that strike parallel to the main thrust fault (e.g. La-
combe et al. 1999). The 0�–15� and 60�–75� major trends
exhibited by ETLs on the northern hanging-wall of the
YBF are likely associated with strike-slips of the YBF.
That is because a horizontal r1 oriented at 30�–45� (i.e.
along the strike of YBF) and a horizontal r3 oriented
perpendicular to r1 would result in Riedel shears or con-
jugate Riedel shears that strike 0�–15� and/or 60�–75�(Petit 1987). Accordingly, the 0�–15� major trends exhib-
ited by ETLs on the central hanging-wall of the YBF are
also likely associated with strike-slip components of obli-
que-slips of the YBF. Likewise, the 0�–15� and 60�–75�minor trends exhibited by ETLs on the southern hanging-
wall of the YBF and the 60�–75� minor trends exhibited by
ETLs on the central hanging-wall of the YBF (Fig. 8a) are
likely associated with strike-slip components of oblique-
slips of the YBF. In contrast, the 30�–45� minor trends
exhibited by ETLs on the northern hanging-wall of the
YBF are likely associated with minor thrust-slip compo-
nents of oblique-slips of the YBF. The 150�–165� and
115�–120� minor trends exhibited by ETLs on, respec-
tively, the central and northern hanging-wall of the YBF
are possibly associated with minor normal-slip faults,
which, although not reported in the hanging-wall of the
YBF, are not rare in strike-slip fault systems. Thus, the Fry
analyses illustrate that trends in the spatial patterns of ETLs
on different parts of the hanging-wall of the YBF are
consistent with general knowledge of fault kinematics. In
the succeeding paragraphs, we describe results of Fry
analyses, using ETLs located 0–15, 0–10 and 0–5 km west
and in the 21-km-wide zone of hanging-wall of the YBF, to
investigate further our earlier interpretations of the results
of distance distribution analysis shown in Fig. 7.
For ETLs on the southern hanging-wall of the YBF,
Fig. 8a–d shows consistency of 30�–45� major trends and
gradual increase in frequency of 0�–15� trends from the
western boundary of the southern hanging-wall of the YBF
to the surface ruptures along the YBF. In particular, ETLs
located 0–5 km west and on the southern hanging-wall of
the YBF exhibit not only 30�–45� major trends but also 0�–15� major trends. These results and the inference that 0�–
3200 Int. J. Environ. Sci. Technol. (2015) 12:3189–3212
123
15� trends are likely associated with strike-slips, albeit less
predominant than thrust-slips, in the southern hanging-wall
of the YBF, support our earlier interpretation that ETLs
lying 4.4–4.7 km from the YBF are likely associated with
strike-slips. The gradual decrease in frequency of 0�–15�
minor trends from the surface ruptures along the YBF to
the western boundary of the southern hanging-wall of the
YBF also means gradual increase in frequency of 30�–45�major trends along the same direction. This result and the
inference that 30�–45�.trends are likely associated with
Fig. 8 Rose diagrams of trends between pairs of 60-m spaced Fry
points of earthquake-induced landslides a located on different parts of
the hanging-wall zone of the YBF and on the hanging-wall zone of
the Pengguan fault, b located 0–15 km from the YBF and on different
parts of the hanging-wall zone of that fault, c located 0–10 km from
the YBF and on different parts of the hanging-wall zone of that fault
and d located 0–5 km from the YBF and on different parts of the
hanging-wall zone of that fault. Colours of rose diagrams correspond
to colour of hanging walls of the faults
Int. J. Environ. Sci. Technol. (2015) 12:3189–3212 3201
123

thrust-slips in the southern hanging-wall of the YBF sup-
port our earlier interpretation that ETLs lying
10.3–11.5 km from the YBF are likely associated with
thrust-slips. The consistency of 30�–45� major trends and
the change from 0�–15� major trends to 0�–15� interme-
diate trends from the YBF up to 10 km towards the west
(Fig. 8c, d) suggest increasing thrust-slip components of
oblique-slips across the width of the southern hanging-wall
of the YBF. This inference supports our earlier interpre-
tation that ETLs lying 7.5–8 km from the YBF are likely
associated with oblique-slips having thrust-slip compo-
nents that more likely predominate over strike-slip
components.
For ETLs on the central hanging-wall of the YBF,
Fig. 8a–d shows consistency of 30�–45� major trends,
minor fluctuations of 0�–15� major trends and subtle
increase in frequency of 60�–75� minor trends from the
western boundary of the central hanging-wall of the YBF
to the surface ruptures along the YBF. These results and the
inference that 60�–75� trends are likely associated with
strike-slips in the central hanging-wall of the YBF support
our earlier interpretation that ETLs lying 4.4–4.7 km from
the YBF are likely associated with strike-slips. The minor
fluctuations of 0�–15� major trends and the subtle decrease
in frequency of 60�–75� minor trends from the surface
ruptures along the YBF to the western boundary of the
central hanging-wall of the YBF (Fig. 8a–d) also mean
subtle increase in frequency of 30�–45� major trends along
the same direction. This result and the inference that 30�–45� trends are likely associated with thrust-slips in the
central hanging-wall of the YBF support our earlier inter-
pretation that ETLs lying 10.3–11.5 km from the YBF are
likely associated with thrust-slips. The consistency of 30�–45� major trends and the subtle decrease in frequency of
60�–75� minor trends from the YBF up to 10 km towards
the west (Fig. 8c, d) suggest increasing thrust-slip com-
ponents of oblique-slips across the width of the central
hanging-wall of the YBF. This inference supports our
earlier interpretation that ETLs lying 7.5–8 km from the
YBF are likely associated with oblique-slips having more
or less equal thrust- and strike-slip components.
For ETLs on the northern hanging-wall of the YBF,
Fig. 8a–d shows minor fluctuations of 0�–15� and 60�–75�major trends and subtle decrease in frequency of 30�–45�minor trends from the western boundary of the northern
hanging-wall of the YBF to the surface ruptures along the
YBF. These results and the inference that 30�–45� trends
are likely associated with thrust-slips in the northern
hanging-wall of the YBF support our earlier interpretation
that ETLs lying 10.3–11.5 km from the YBF are likely
associated with thrust-slips. The subtle increase in fre-
quency of 30�–45� minor trends from the surface ruptures
along the YBF to the western boundary of the northern
hanging-wall of the YBF also means subtle decrease in
frequency of 0�–15� and 60�–75� major trends along the
same direction. This result and the inference that 0�–15�and 60�–75� major trends are likely associated with strike-
slips in the northern hanging-wall of the YBF support our
earlier interpretation that ETLs lying 4.4–4.7 km from the
YBF are likely associated with strike-slips.
Representation of fault control on susceptibility
to landsliding
We applied data-driven estimation of EBFs to create a
predictor map representing fault controls on susceptibility
to occurrence of ETLs. We used distances from the YBF to
locations in the same 240-km-long and 21-km-wide zone of
the hanging-wall of the YBF so that the results were directly
comparable to the analyses described in the preceding
sections. Our aim here was not to derive a predictive map of
susceptibility to occurrence of ETLs for policy decision-
making, so we did not create and integrate predictor maps
representing other spatial controls on this phenomenon.
However, a predictor map is by itself a predictive map.
Thus, its predictive capacity can be evaluated. To do so, we
divided the same set of ETLs used in the preceding analyses
into two subsets with equal number of ETLs and roughly the
same spatial pattern. We achieved that by adding a dummy
variable in our database and then labelling the ETLs alter-
nately with ‘1’ and ‘2’. Earthquake-triggered landslides
labelled ‘1’ comprised one subset and those labelled ‘2’
comprised the other subset. One subset (called training
subset) of ETLs was used for estimating EBFs and creating
a predictor map, whereas the other subset (called validation
subset) was used for evaluating the prediction accuracy of a
predictor map. The roles of both subsets of ETLs were then
reversed for cross-checking of results. We performed these
analyses to support our proposition that using classified
faults, rather than using unclassified faults, provides for
proper spatial representation of fault control as a predictor
of susceptibility to occurrence of ETLs.
By classifying parts of the YBF according to style-of-
faulting based on the analyses described in the preceding
sections, we estimated EBFs of classes of 5-percentile
interval distances from the YBF in each part of the hang-
ing-wall of this fault. Assuming that parts of the YBF are
unclassified according to style-of-faulting, we estimated
EBFs of classes of 5-percentile interval distances from the
YBF in the 240-km-long and 21-km-wide zone of the
3202 Int. J. Environ. Sci. Technol. (2015) 12:3189–3212
123

hanging-wall of the YBF. If parts of the YBF are classified
according to style-of-faulting, values of EBFs with respect
to ETLs vary depending on style-of-faulting (Fig. 9a). The
estimated values of Bel suggest that in the southern hang-
ing-wall of the YBF the likelihood of occurrence of ETLs
is the lowest, in the central hanging-wall of the YBF
intermediate and in the northern hanging-wall of the YBF
the highest. This is consistent with what the difference
curves in Fig. 7 suggest as discussed earlier. In contrast, if
parts of the YBF are unclassified, values of EBFs increase
monotonously with increasing distance from the YBF
(Fig. 9a). Variations in values of Bel suggest that areas
closest to and farthest from the YBF have, respectively,
highest and lowest susceptibility to earthquake-triggered
landslide occurrence (Fig. 9a). A simple visual comparison
of the patterns of variations in estimated EBFs (Fig. 9a)
with the spatial pattern of ETLs (Fig. 2) suggests that using
classified faults results in better spatial representation of
fault control on susceptibility to earthquake-triggered
landslide occurrence.
We applied the technique described by Chung and
Fabbri (1999) to evaluate the prediction accuracy of a map
of Bel against a validation subset. Cumulative decreasing
values of Bel define cumulative increasing proportions of
ETL-prone areas, from which cumulative increasing pro-
portions of ETLs in the validation subset can be determined
(Fig. 9b). Proportions of ETLs in a validation subset
delineated in ETL-prone areas define the prediction accu-
racy of a predictor map. If areas covering B30 % of the
240-km-long and 21-km-wide zone of the hanging-wall of
the YBF are considered ETL-prone according to certain
cut-off values of Bel, there is minimal difference in using
classified or unclassified faults (Fig. 9b). However, if areas
covering[30 % of the 240-km-long and 21-km-wide zone
of the hanging-wall of the YBF are considered ETL-prone
according to certain cut-off values of Bel, the prediction
accuracy curve obtained using classified faults is above the
prediction accuracy curve obtained using un-classified
faults. This illustrates the benefit of classifying faults
according to style-of-faulting as explained further below.
Fig. 9 Results of representation
of style-of-faulting controls on
susceptibility to landsliding.
a Estimates of evidential belief
functions (Bel belief, Dis
disbelief, Unc uncertainty)
based on distances from
classified and unclassified parts
of the YBF with respect to
earthquake-induced landslide
occurrence. b Prediction
accuracy curves of maps of Bel
obtained by using distance from
classified and unclassified parts
of the YBF as predictor.
c Binary maps of predicted
ETL-prone zones based on
maps of Bel obtained by using
distance from classified and
unclassified parts of the YBF as
predictor
Int. J. Environ. Sci. Technol. (2015) 12:3189–3212 3203
123
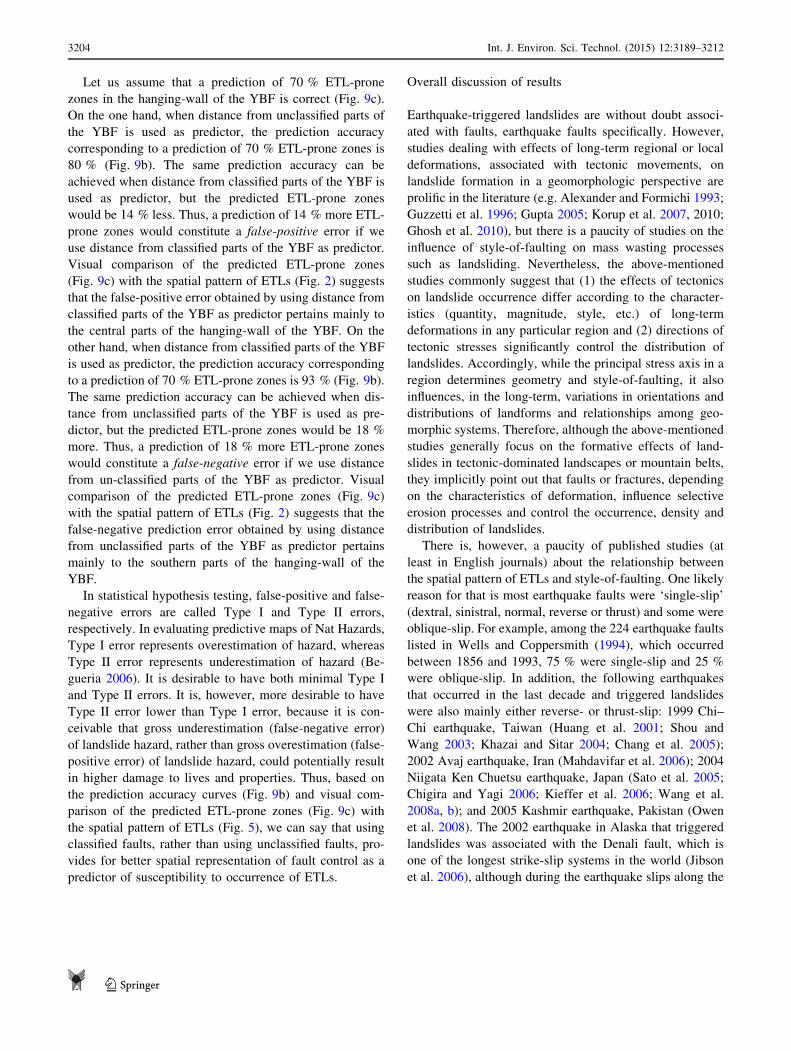
Let us assume that a prediction of 70 % ETL-prone
zones in the hanging-wall of the YBF is correct (Fig. 9c).
On the one hand, when distance from unclassified parts of
the YBF is used as predictor, the prediction accuracy
corresponding to a prediction of 70 % ETL-prone zones is
80 % (Fig. 9b). The same prediction accuracy can be
achieved when distance from classified parts of the YBF is
used as predictor, but the predicted ETL-prone zones
would be 14 % less. Thus, a prediction of 14 % more ETL-
prone zones would constitute a false-positive error if we
use distance from classified parts of the YBF as predictor.
Visual comparison of the predicted ETL-prone zones
(Fig. 9c) with the spatial pattern of ETLs (Fig. 2) suggests
that the false-positive error obtained by using distance from
classified parts of the YBF as predictor pertains mainly to
the central parts of the hanging-wall of the YBF. On the
other hand, when distance from classified parts of the YBF
is used as predictor, the prediction accuracy corresponding
to a prediction of 70 % ETL-prone zones is 93 % (Fig. 9b).
The same prediction accuracy can be achieved when dis-
tance from unclassified parts of the YBF is used as pre-
dictor, but the predicted ETL-prone zones would be 18 %
more. Thus, a prediction of 18 % more ETL-prone zones
would constitute a false-negative error if we use distance
from un-classified parts of the YBF as predictor. Visual
comparison of the predicted ETL-prone zones (Fig. 9c)
with the spatial pattern of ETLs (Fig. 2) suggests that the
false-negative prediction error obtained by using distance
from unclassified parts of the YBF as predictor pertains
mainly to the southern parts of the hanging-wall of the
YBF.
In statistical hypothesis testing, false-positive and false-
negative errors are called Type I and Type II errors,
respectively. In evaluating predictive maps of Nat Hazards,
Type I error represents overestimation of hazard, whereas
Type II error represents underestimation of hazard (Be-
gueria 2006). It is desirable to have both minimal Type I
and Type II errors. It is, however, more desirable to have
Type II error lower than Type I error, because it is con-
ceivable that gross underestimation (false-negative error)
of landslide hazard, rather than gross overestimation (false-
positive error) of landslide hazard, could potentially result
in higher damage to lives and properties. Thus, based on
the prediction accuracy curves (Fig. 9b) and visual com-
parison of the predicted ETL-prone zones (Fig. 9c) with
the spatial pattern of ETLs (Fig. 5), we can say that using
classified faults, rather than using unclassified faults, pro-
vides for better spatial representation of fault control as a
predictor of susceptibility to occurrence of ETLs.
Overall discussion of results
Earthquake-triggered landslides are without doubt associ-
ated with faults, earthquake faults specifically. However,
studies dealing with effects of long-term regional or local
deformations, associated with tectonic movements, on
landslide formation in a geomorphologic perspective are
prolific in the literature (e.g. Alexander and Formichi 1993;
Guzzetti et al. 1996; Gupta 2005; Korup et al. 2007, 2010;
Ghosh et al. 2010), but there is a paucity of studies on the
influence of style-of-faulting on mass wasting processes
such as landsliding. Nevertheless, the above-mentioned
studies commonly suggest that (1) the effects of tectonics
on landslide occurrence differ according to the character-
istics (quantity, magnitude, style, etc.) of long-term
deformations in any particular region and (2) directions of
tectonic stresses significantly control the distribution of
landslides. Accordingly, while the principal stress axis in a
region determines geometry and style-of-faulting, it also
influences, in the long-term, variations in orientations and
distributions of landforms and relationships among geo-
morphic systems. Therefore, although the above-mentioned
studies generally focus on the formative effects of land-
slides in tectonic-dominated landscapes or mountain belts,
they implicitly point out that faults or fractures, depending
on the characteristics of deformation, influence selective
erosion processes and control the occurrence, density and
distribution of landslides.
There is, however, a paucity of published studies (at
least in English journals) about the relationship between
the spatial pattern of ETLs and style-of-faulting. One likely
reason for that is most earthquake faults were ‘single-slip’
(dextral, sinistral, normal, reverse or thrust) and some were
oblique-slip. For example, among the 224 earthquake faults
listed in Wells and Coppersmith (1994), which occurred
between 1856 and 1993, 75 % were single-slip and 25 %
were oblique-slip. In addition, the following earthquakes
that occurred in the last decade and triggered landslides
were also mainly either reverse- or thrust-slip: 1999 Chi–
Chi earthquake, Taiwan (Huang et al. 2001; Shou and
Wang 2003; Khazai and Sitar 2004; Chang et al. 2005);
2002 Avaj earthquake, Iran (Mahdavifar et al. 2006); 2004
Niigata Ken Chuetsu earthquake, Japan (Sato et al. 2005;
Chigira and Yagi 2006; Kieffer et al. 2006; Wang et al.
2008a, b); and 2005 Kashmir earthquake, Pakistan (Owen
et al. 2008). The 2002 earthquake in Alaska that triggered
landslides was associated with the Denali fault, which is
one of the longest strike-slip systems in the world (Jibson
et al. 2006), although during the earthquake slips along the
3204 Int. J. Environ. Sci. Technol. (2015) 12:3189–3212
123

fault rupture were oblique-slips with predominant strike-
slip components (Frankel et al. 2002; Dreger et al. 2004;
Velasco et al. 2004). Nevertheless, several other factors
influence the spatial pattern of ETLs around earthquake
faults (e.g. see references cited in the second paragraph of
the Introduction). Thus, in spite of the disaster brought
about by the 2008 Wenchuan earthquake, the associated
Yingxiu–Beichuan fault, which had mainly thrust-slips in
the south to mainly dextral strike-slips in the north, pro-
vided the opportunity to examine the spatial pattern of
ETLs with respect to style-of-faulting.
To examine the spatial pattern of ETLs with respect to
style-of-faulting, we had to adapt the co-seismic rupture
boundary defined by Shen et al. (2009) on the hanging-wall
of the Yingxiu–Beichuan fault as a reference area (Fig. 5).
This strategy of using a reference area to analyse the spatial
pattern of landslides triggered by that earthquake was
demonstrated by Keefer (2000). The logic of studying the
distribution of ETLs on the hanging-wall of faults is based
on findings that, during earthquakes, ground motions are
stronger on the hanging-wall than on the footwall of a
dipping earthquake fault (Abrahamson and Somerville
1996; Yu and Gao 2001; Ulusay et al. 2004). The proposed
explanation for those observations is asymmetry of distri-
bution of seismic energy as a function of fault geometry
(Oglesby and Day 2002; Beavan et al. 2012; Shi and Day
2013; Gabuchian et al. 2014), although that is usually not
the case because attenuation of ground motion is also a
function of style-of-faulting (Campbell 1981; Abrahamson
and Silva 1997; Bommer et al. 2003). Nevertheless, studies
have shown that ground motions on the hanging wall were
stronger than on the footwall of the Yingxiu–Beichuan
fault (Zhang et al. 2008; Lu et al. 2010). Thus, using the
co-seismic rupture boundary defined by Shen et al. (2009)
on the hanging-wall of the Yingxiu–Beichuan fault as a
reference area is justified in our study.
As stated earlier in ‘‘Distance distribution analysis of
landslide distribution’’ section, the traditional way of
describing the spatial pattern of landslides by counting the
number or calculating the percentage of landslides
(depicted as points) per square kilometre of reference area
is inadequate for examining control of style of earthquake
faults on the spatial pattern of ETLs. Therefore, we applied
the distance distribution analysis (Berman 1977, 1986) for
quantifying spatial dependence of a point process on
another stochastic process. This method has only been used
recently by Ghosh and Carranza (2010) to study landslide
controls, but it has been employed extensively in studies of
mineralization controls (e.g. Bonham-Carter 1985; Car-
ranza and Hale 2002; Carranza et al. 2008a). In the present
study, we applied distance distribution analysis not only
because it is a probabilistic method but also because
(a) distance to fault is suitable for ground motion attenu-
ation analysis (Campbell 1981, 1997), (b) variations in
ground motion are influenced by the style of earthquake
faults (Campbell 1981; Bommer et al. 2003) and (c) ground
motion is a factor of ETLs (Jibson and Keefer 1993; Miles
and Ho 1999). To support the results of distance distribu-
tion analysis, we applied Fry analysis (Fry 1979) for
investigating strain and strain partitioning in rocks. Like-
wise, Fry analysis has only been used recently by Ghosh
and Carranza (2010) to study landslide controls, but it has
been employed extensively to deduce trends of structures
controlling mineralization (e.g. Vearncombe and Vearn-
combe 1999; Carranza 2009, 2011; Carranza et al. 2009;
Carranza and Sadeghi 2010) and geothermal fields (Car-
ranza et al. 2008b) as well as to infer post-mineralization
deformation (Carranza and Sadeghi 2014). As shown by
Ghosh and Carranza (2010), distance distribution analysis
and Fry analysis are complementary and supplementary
methods that can be used in conjunction with one another
to investigate certain controls on landsliding. Distance
distribution analysis is useful in determining optimum
range of distance between ETLs and a fault (or a set of
faults), which indicates that the former are spatially
dependent on the latter. Fry analysis is useful in deter-
mining trends in the spatial pattern of ETLs, which allow
deduction of style-of-faulting. We also show this here by
revisiting to summarize the results of analyses with regard
to the two research questions brought out in the
Introduction.
Regarding the first research question, the distance dis-
tribution analyses (Figs. 6, 7) suggest that the spatial pat-
tern of ETLs allows partitioning of a fault in terms of
predominant style-of-faulting. Of course, we have a priori
knowledge of variations in style-of-faulting along the
Yingxiu–Beichuan fault, which may have led us to inter-
pret the results as such. This illustrates, however, the
importance of mapping and classification of faults, active
faults in particular, in tectonically mobile belts or regions
of high seismicity where earthquakes frequently occur.
Granted that a priori knowledge of style-of-faulting and co-
seismic fault plane boundary are lacking, we can still
examine the spatial pattern of ETLs to determine whether a
mapped but unclassified fault can be partitioned according
to predominant style-of-faulting along that fault. To do so,
distance distribution analysis must be performed on either
side of that fault by using a reference area that extends in a
direction perpendicular to that fault and covers all earth-
quake-triggered on one side that fault. As example, Fig. 10
Int. J. Environ. Sci. Technol. (2015) 12:3189–3212 3205
123
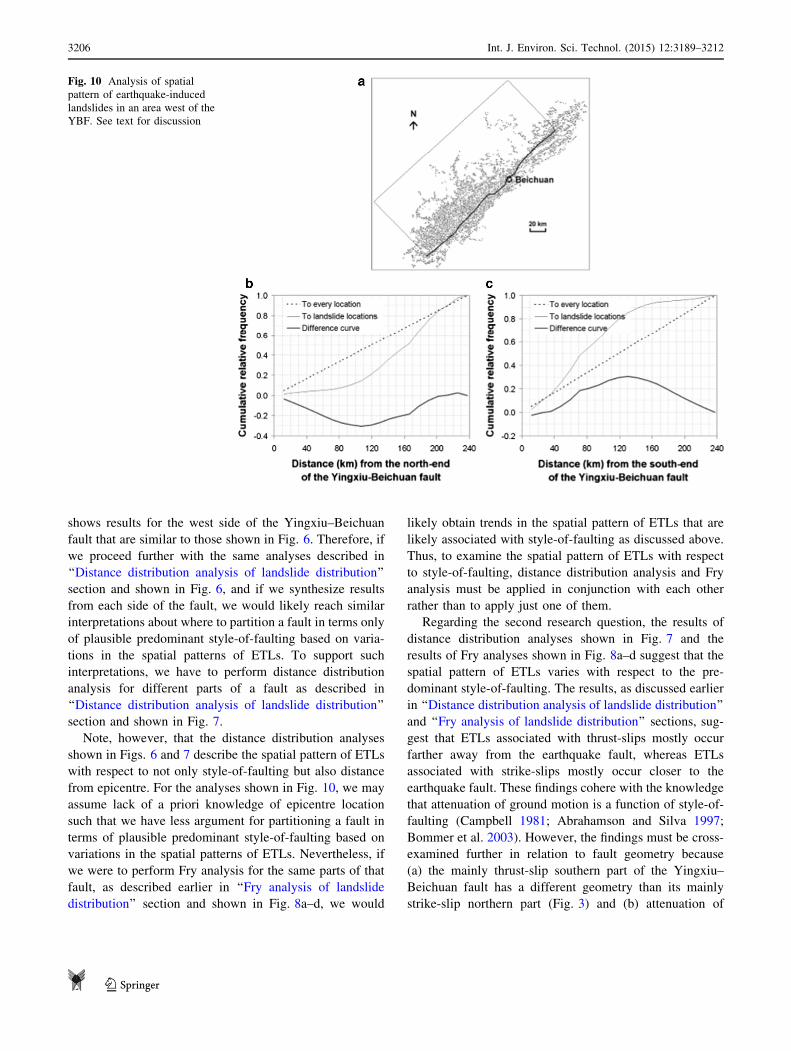
shows results for the west side of the Yingxiu–Beichuan
fault that are similar to those shown in Fig. 6. Therefore, if
we proceed further with the same analyses described in
‘‘Distance distribution analysis of landslide distribution’’
section and shown in Fig. 6, and if we synthesize results
from each side of the fault, we would likely reach similar
interpretations about where to partition a fault in terms only
of plausible predominant style-of-faulting based on varia-
tions in the spatial patterns of ETLs. To support such
interpretations, we have to perform distance distribution
analysis for different parts of a fault as described in
‘‘Distance distribution analysis of landslide distribution’’
section and shown in Fig. 7.
Note, however, that the distance distribution analyses
shown in Figs. 6 and 7 describe the spatial pattern of ETLs
with respect to not only style-of-faulting but also distance
from epicentre. For the analyses shown in Fig. 10, we may
assume lack of a priori knowledge of epicentre location
such that we have less argument for partitioning a fault in
terms of plausible predominant style-of-faulting based on
variations in the spatial patterns of ETLs. Nevertheless, if
we were to perform Fry analysis for the same parts of that
fault, as described earlier in ‘‘Fry analysis of landslide
distribution’’ section and shown in Fig. 8a–d, we would
likely obtain trends in the spatial pattern of ETLs that are
likely associated with style-of-faulting as discussed above.
Thus, to examine the spatial pattern of ETLs with respect
to style-of-faulting, distance distribution analysis and Fry
analysis must be applied in conjunction with each other
rather than to apply just one of them.
Regarding the second research question, the results of
distance distribution analyses shown in Fig. 7 and the
results of Fry analyses shown in Fig. 8a–d suggest that the
spatial pattern of ETLs varies with respect to the pre-
dominant style-of-faulting. The results, as discussed earlier
in ‘‘Distance distribution analysis of landslide distribution’’
and ‘‘Fry analysis of landslide distribution’’ sections, sug-
gest that ETLs associated with thrust-slips mostly occur
farther away from the earthquake fault, whereas ETLs
associated with strike-slips mostly occur closer to the
earthquake fault. These findings cohere with the knowledge
that attenuation of ground motion is a function of style-of-
faulting (Campbell 1981; Abrahamson and Silva 1997;
Bommer et al. 2003). However, the findings must be cross-
examined further in relation to fault geometry because
(a) the mainly thrust-slip southern part of the Yingxiu–
Beichuan fault has a different geometry than its mainly
strike-slip northern part (Fig. 3) and (b) attenuation of
Fig. 10 Analysis of spatial
pattern of earthquake-induced
landslides in an area west of the
YBF. See text for discussion
3206 Int. J. Environ. Sci. Technol. (2015) 12:3189–3212
123

ground motion is also a function of fault geometry (Ogle-
sby and Day 2002; Beavan et al. 2012; Shi and Day 2013;
Gabuchian et al. 2014). In addition, the findings must be
cross-examined further in relation to other factors that
influence variations in ground motion (see Campbell (1981,
1997)). Nevertheless, the results of analyses support our
hypothesis that the spatial pattern of ETLs is influenced by
style-of-faulting. In addition, we have shown in ‘‘Repre-
sentation of fault control on susceptibility to landsliding’’
section that using classified faults, rather than using un-
classified faults, provides for better spatial representation
of fault control as a predictor of susceptibility to occur-
rence of ETLs.
If we were to choose an area for cross-comparing our
findings for the hypothesis that we have examined, we
would chose the area wherein the 3 November 2002Mw 7.9
Alaska earthquake occurred. The reasons for this choice
are: (a) the terrain characteristics of that area are similar to
those in the Wenchuan area; (b) that earthquake has the
same magnitude as the 12 May 2008 Wenchuan earth-
quake; (c) the 300-km-long rupture generated along the
Denali fault by that earthquake is, on a regional-scale,
similar to the 240-km-long rupture generated along the
Yingxiu–Beichuan fault by the 12 May 2008 Wenchuan
earthquake; and (d) the landslides triggered by that earth-
quake were concentrated mostly in a roughly 30-km-wide
zone around the surface rupture (Eberhart-Phillips et al.
2003; Jibson et al. 2006). However, compared with tens of
thousands of landslides triggered by the 2008 Wenchuan
earthquake, only thousands of landslides were triggered by
the 2002 Alaska earthquake (Harp et al. 2003; Jibson et al.
2004, 2006; Kayen et al. 2004). In addition, unlike the
variable slips along the Yingxiu–Beichuan fault during the
12 May 2008 Wenchuan earthquake, the slips along the
Denali fault during the 3 November 2002 were oblique
with predominant strike-slip components (Frankel et al.
2002; Dreger et al. 2004; Velasco et al. 2004). We believe
that these similarities and differences between surface
ruptures and associated landslides linked to the 2002
Alaska and 2008 Wenchuan earthquakes are instructive in
increasing our understanding of the relationship between
spatial patterns of ETLs and styles of earthquake faults. In
turn, better understanding of that relationship is essential
for proper spatial representation of landslide controls in
predictive modelling of areas susceptible to earthquake-
triggered landsliding.
Predictive modelling of areas susceptible to occurrence
of ETLs (or landslides triggered by other phenomenon) can
be categorized into two types—mechanistic and empirical
(Harbaugh and Bonham-Carter 1970). On the one hand,
mechanistic modelling applies fundamental or theoretical
knowledge of processes and their interactions to predict or
understand the system of interest. Examples of mechanistic
modelling of susceptibility to occurrence of ETLs are those
that apply Newmark’s (1965) sliding block or displace-
ment method (e.g. Wilson and Keefer 1985; Miles and Ho
1999; Wu et al. 2009; Wang and Lin 2010; Wu and Tsai
2011). The Newmark analysis, which is suitable for site-
specific modelling of seismic hazard as applied in Cali-
fornia for seismic safety (CGS 2008), makes use of peak
ground acceleration data related not to style-of-faulting but
to earthquake epicentre location and slope. On the other
hand, empirical modelling characterizes or quantifies the
influence of one or more underlying processes, which are
known insufficiently or indirectly, on the behaviour of the
system of interest. Examples of empirical modelling of
susceptibility to occurrence of ETLs, such as those cited in
the first paragraph of the Introduction (e.g. Jaafari et al.
2014; Pourghasemi et al. 2014; Regmi et al. 2014), are
data driven, meaning that they are based on empirical
analysis of spatial relationships between occurrences of
ETLs and various spatial factors. In contrast, Miles and
Keefer (2007) developed CAMEL (comprehensive areal
model of earthquake-triggered landslides) for knowledge-
driven regional-scale empirical analysis in a GIS. Miles
and Keefer (2009) further developed CAMEL to allow
integration of Newmark’s (1965) displacement model.
Although our present study involves data-driven empirical
spatial analysis, the new knowledge gained from the
analyses of spatial pattern of ETLs with respect to style-of-
faulting in the Wenchuan area is likely to be beneficial in
the application of CAMEL. In addition, the knowledge that
the spatial pattern of ETLs is influenced by style-of-
faulting bears the importance of mapping and classification
of faults in predictive mapping of susceptibility to occur-
rence of not only ETLs but also other types of structurally
controlled landslides.
Conclusion
The salient conclusions that can be drawn from the present
study are the following. The Yingxiu–Beichuan fault rup-
ture and the tens of thousands of landslides that were
associated with the 2008 Wenchuan earthquake provided
the opportunity to carry out the study because the style-of-
faulting along that fault, from its southern to northern parts,
varied from mainly thrust-slip to mainly strike-slip. Dis-
tance distribution analysis and Fry analysis are comple-
mentary and supplementary methods that can be used in
conjunction with one another to study the spatial pattern of
earthquake-triggered landslides in relation to style-of-
Int. J. Environ. Sci. Technol. (2015) 12:3189–3212 3207
123

faulting. Analysis of the spatial pattern of earthquake-
triggered landslides allows classification of segments of the
associated earthquake fault in terms of predominant style-
of-faulting. The spatial patterns of earthquake-triggered
landslides vary with respect to predominant style-of-fault-
ing along the earthquake fault. On the hanging-wall of
Yingxiu–Beichuan fault, earthquake-triggered landslides
lying mostly at 10.3–11.5 km from the fault are likely
associated with thrust-slips, earthquake-triggered land-
slides lying mostly at 7.5–8 km from the fault are likely
associated with oblique-slips, and earthquake-triggered
landslides lying mostly at 4.4–4.7 km from the fault are
likely associated with strike-slips. Therefore, earthquake-
triggered landslides associated with thrust-slips mostly
occur farther away from the earthquake fault, whereas
earthquake-triggered landslides associated with strike-slips
mostly occur closer to the earthquake fault. Classification
of faults according to style-of-faulting is crucial in pre-
dictive mapping of susceptibility to occurrence of earth-
quake-triggered landslides. The spatial pattern of
earthquake-triggered landslides is influenced by style-of-
faulting. This proposition requires further examination in
other areas. Further studies are needed to cross-examine the
findings here in relation to fault geometry and other factors
that influence variations in ground motions associated with
earthquake faults.
Acknowledgments The first author thanks Cees J. van Westen for
his encouragement and giving the opportunity to work in Longmen
Shan region after the 12 May 2008 Wenchuan earthquake. He thanks
also Run Qiu Huang and Qiang Xu of the State Key Laboratory of
Geo-hazards Prevention and Geo-environment Protection, Chengdu
University of Technology, for their support and kind hospitality
during fieldwork. This research was financially supported by the
National Basic Research Program ‘973’ Project of the Ministry of
Science and Technology of the People’s Republic of China
(2008CB425801) and by the United Nations University—ITC School
for Disaster Geo-Information Management (www.itc.nl/unu/dgim).
References
Abrahamson NA, Silva WJ (1997) Empirical response spectral
attenuation relations for shallow crustal earthquakes. Seismol
Res Lett 68:94–127
Abrahamson NA, Somerville PG (1996) Effects of the hanging wall
and footwall on ground motions recorded during the Northridge
earthquake. Bull Seismol Soc Am 86:S93–S99
Alexander D, Formichi R (1993) Tectonic causes of landslides. Earth
Surf Proc Land 18:311–338
Bai SB, Wang J, Thiebes B, Cheng C, Chang ZY (2014) Suscepti-
bility assessments of the Wenchuan earthquake-triggered land-
slides in Longnan using logistic regression. Environ Earth Sci
71:731–743
Beavan J, Motagh M, Fielding EJ, Donnelly N, Collett D (2012) Fault
slip models of the 2010–2011 Canterbury, New Zealand,
earthquakes from geodetic data and observations of postseismic
ground deformation. New Zeal J Geol Geophys 55:207–221
Begueria S (2006) Validation and evaluation of predictive models in
hazard assessment and risk management. Nat Hazards
37:315–329
Berman M (1977) Distance distributions associated with Poisson
processes of geometric figures. J Appl Probab 14:195–199
Berman M (1986) Testing for spatial association between a point
processes and another stochastic process. Appl Stat 35:54–62
Bommer JJ, Douglas J, Stasser FO (2003) Style-of-faulting in ground-
motion prediction equations. Bull Earthq Eng 1:171–203
Bonham-Carter GF (1985) Statistical association of gold occurrences
with Landsat-derived lineaments, Timmins-Kirkland Lake area,
Ontario. Can J Remote Sens 11:195–211
Boots BN, Getis A (1988) Point pattern analysis. Sage University
Scientific Geography Series No. 8. Sage, Beverly Hills
Bradley BA, Quigley MC, Van Dissen RJ, Litchfield NJ (2014)
Ground motion and seismic source aspects of the Canterbury
earthquake sequence. Earthq Spectra 30:1–15
Burchfiel BC, Chen Z, Liu Y, Royden LH (1995) Tectonics of the
Longmen Shan and adjacent regions, central China. Int Geol Rev
37:661–735
Campbell KW (1981) Near-source attenuation of peak horizontal
acceleration. Bull Seismol Soc Am 71:2039–2070
Campbell KW (1997) Empirical near-source attenuation relationships
for horizontal and vertical components of peak ground acceler-
ation, peak ground velocity, and pseudo-absolute acceleration
response spectra. Seismol Res Lett 68:154–179
Carranza EJM (2009) Controls on mineral deposit occurrence inferred
from analysis of their spatial pattern and spatial association with
geological features. Ore Geol Rev 35:383–400
Carranza EJM (2011) From predictive mapping of mineral prospec-
tivity to quantitative estimation of number of undiscovered
prospects. Resour Geol 61:30–51
Carranza EJM, Castro OT (2006) Predicting lahar-inundation zones:
case study in West Mount Pinatubo, Philippines. Nat Hazards
37:331–372
Carranza EJM, Hale M (2002) Spatial association of mineral
occurrences and curvilinear geological features. Math Geol
34:199–217
Carranza EJM, Hale M (2003) Evidential belief functions for
geologically constrained mapping of gold potential, Baguio
district, Philippines. Ore Geol Rev 22:117–132
Carranza EJM, Sadeghi M (2010) Predictive mapping of prospectivity
and quantitative estimation of undiscovered VMS deposits in
Skellefte district (Sweden). Ore Geol Rev 38:219–241
Carranza EJM, Sadeghi M (2014) Post-VMS mineralization defor-
mations (1.88–1.82 Ga) of the Skellefte district (Sweden):
insights from the spatial pattern of VMS occurrences. Front
Earth Sci 8:319–324
Carranza EJM, Hale M, Faassen C (2008a) Selection of coherent
deposit-type locations and their application in data-driven
mineral prospectivity mapping. Ore Geol Rev 33:536–558
Carranza EJM, Wibowo H, Barritt SD, Sumintadireja P (2008b)
Spatial data analysis and integration for regional-scale geother-
mal potential mapping, West Java, Indonesia. Geothermics
33:267–299
Carranza EJM, Owusu EA, Hale M (2009) Mapping of prospectivity
and estimation of number of undiscovered prospects for lode-gold,
southwestern Ashanti Belt, Ghana. Min Deposita 44:915–938
CGS (2008) Guidelines for evaluating and mitigating seismic hazards
in California. Special Publication 117A. California Geological
Survey (CGS), Sacramento
3208 Int. J. Environ. Sci. Technol. (2015) 12:3189–3212
123

Chang J, Slaymaker O (2002) Frequency and spatial distribution of
landslides in a mountainous drainage basin: western foothills,
Taiwan. Catena 46:285–307
Chang KJ, Taboada A, Chan YC (2005) Geological and morpholog-
ical study of the Jiufengershan landslide triggered by the Chi–
Chi Taiwan earthquake. Geomorphology 71:293–309
Chen XL, Zhou Q, Ran H, Dong R (2012) Earthquake-triggered
landslides in southwest China. Nat Hazards Earth Syst Sci
12:351–363
Chernoff H, Lehmann EL (1954) The use of maximum likelihood
estimates in v2 tests for goodness-of-fit. Ann Math Stat
25:579–586
Chigira M, Yagi H (2006) Geological and geomorphological char-
acteristics of landslides triggered by the 2004 Mid Niigata
prefecture earthquake in Japan. Eng Geol 82:202–221
Chigira M, Wu X, Inokuchi T, Wang G (2010) Landslides induced by
the 2008 Wenchuan earthquake, Sichuan, China. Geomorphol-
ogy 118:225–238
Chung CJF, Fabbri AG (1999) Probabilistic prediction models for
landslide hazard mapping. Photogramm Eng Rem Sens
65:1389–1399
Crozier MJ, Deimel MS, Simon JS (1995) Investigation of earthquake
triggering for deep-seated landslides, Taranaki, New Zealand.
Quatern Int 25:65–73
Dai FC, Xu C, Yao X, Xu L, Tu XB, Gong QM (2011) Spatial
distribution of landslides triggered by the 2008 Ms 8.0 Wench-
uan earthquake, China. J Asian Earth Sci 40:883–895
Das HO, Sonmez H, Gokceoglu C, Nefeslioglu HA (2013) Influence
of seismic acceleration on landslide susceptibility maps: a case
study from NE Turkey. Landslides 10:433–454
Dempster AP (1967) Upper and lower probabilities induced by a
multivalued mapping. Ann Math Stat 38:325–339
Densmore AL, Ellis MA, Li Y, Zhou R, Hancock GS, Richardson NJ
(2007) Active tectonics of the Beichuan and Pengguan faults at
the eastern margin of the Tibetan Plateau. Tectonics 26:TC4005.
doi:10.1029/2006TC001987
Dreger D, Oglesby D, Harris R, Ratchkovski N, Hansen R (2004)
Kinematic and dynamic rupture models of the November 3, 2002
Mw 7.9 Denali, Alaska, earthquake. Geophys Res Lett. doi:10.
1029/2003GL018333
Eberhart-Phillips D, Haeussler PJ, Freymueller JT, Frankel AD,
Rubin CM, Craw P, Ratchkovski NA, Anderson G, Carver GA,
Crone AJ, Dawson TE, Fletcher H, Hansen R, Harp EL, Harris
RA, Hill DP, Hreinsdottir S, Jibson RW, Jones LM, Kayen R,
Keefer DK, Larsen CF, Moran SC, Personius SF, Plafker G,
Sherrod B, Sieh K, Sitar N, Wallace WK (2003) The 2002
Denali Fault earthquake, Alaska: a large magnitude, slip-
partitioned event. Science 300:1113–1118
Frankel AD, Biswas NN, Martirosyan AH, Dutt U, McNamara DE
(2002) Rupture process of the M 7.9 Denali Fault, Alaska,
earthquake determined from strong-motion recordings. EOS
Trans Am Geophys Union 47:1340
Fry N (1979) Random point distributions and strain measurement in
rocks. Tectonophysics 60:89–105
Fu B, Shi P, Guo H, Okuyama S, Ninomiya Y, Wright S (2011)
Surface deformation related to the 2008 Wenchuan earthquake,
and mountain building of the Longmen Shan, eastern Tibetan
Plateau. J Asian Earth Sci 40:805–824
Gabuchian V, Rosakis AJ, Lapusta N, Oglesby DD (2014) Experi-
mental investigation of strong ground motion due to thrust fault
earthquakes. J Geophys Res Sol Ea 119:1316–1336
Ghosh S, Carranza EJM (2010) Spatial analysis of mutual faults/
fracture and slope controls on rocksliding in Darjeeling Hima-
laya, India. Geomorphology 122:1–24
Ghosh S, Gunther A, Carranza EJM, van Westen CJ, Jetten VG
(2010) Rock slope instability assessment using spatially distrib-
uted structural orientation data in Darjeeling Himalaya (India).
Earth Surf Proc Land 35:1773–1792
Gorum T, Fan X, van Westen CJ, Huang RQ, Xu Q, Tang C, Wang G
(2011) Distribution pattern of earthquake-induced landslides
triggered by the 12 May 2008 Wenchuan earthquake. Geomor-
phology 133:152–167
Gorum T, Korup O, Van Westen CJ, Van der Meijde M, Xu C, Van
der Meer FD (2014) Why so few? Landslides triggered by the
2002 Denali earthquake, Alaska. Quatern Sci Rev 95:80–94
Gupta V (2005) The relationship between tectonic stresses, joint
patterns and landslides in the higher Indian Himalaya. J Nepal
Geol Soc 31:51–58
Guzzetti F, Cardinali M, Reichenbach P (1996) The influence of
structural setting and lithology on landslide type and pattern.
Environ Eng Geosci 2:531–555
Hanna SS, Fry N (1979) A comparison of methods of strain
determination in rocks from southwest Dyfed (Pembrokeshire)
and adjacent areas. J Struct Geol 1:155–162
Hao KX, Si HJ, Fujiwara H, Ozawa T (2009) Coseismic surface
ruptures and crustal deformations of the 2008 Wenchuan
earthquake Mw 7.9, China. Geophys Res Lett 36:L11303.
doi:10.1029/2009GL037971
Harbaugh JW, Bonham-Carter GF (1970) Computer simulation in
geology. Wiley-Interscience, New York
Harp EL, Jibson RW, Kayen RE, Keefer DK, Sherrod BL, Carver
GA, Collins BD, Moss RES, Sitar N (2003) Landslides and
liquefaction triggered by the M 7.9 Denali Fault earthquake of 3
November 2002. GSA Today 13:4–10
Hewitt K (1983) Seismic risk and mountain environments: the role
of surface conditions in earthquake disaster. Mt Res Dev
3:27–44
Holzer TL (1994) Loma Prieta damage largely attributed to enhanced
ground shaking. EOS Trans Am Geophys Union 75:299–301
Huang R, Fan X (2013) The landslide story. Nat Geosci 6:325–326
Huang R, Li W (2009) Analysis of the geo-hazards triggered by the
12 May 2008 Wenchuan earthquake, China. Bull Eng Geol
Environ 68:363–371
Huang CC, Lee YH, Liu HP, Keefer DK, Jibson RW (2001) Influence
of surface-normal ground acceleration on the initiation of the
Jih-Feng-Erh-Shan landslide during the 1999 Chi–Chi, Taiwan,
earthquake. Bull Seismol Soc Am 91:953–958
Huang R, Pei X, Fan X, Zhang W, Li S, Li B (2012) The
characteristics and failure mechanism of the largest landslide
triggered by the Wenchuan earthquake, May 12, 2008, China.
Landslides 9:131–142
Huang Y, Yu M, Bhattacharya S (2014) Characteristics of flow
failures triggered by recent earthquakes in China. Indian Geotech
J 44:218–224
Jaafari A, Najafi A, Pourghasemi HR, Rezaeian J, Sattarian A (2014)
GIS-based frequency ratio and index of entropy models for
landslide susceptibility assessment in the Caspian forest, north-
ern Iran. Int J Environ Sci Technol 11:909–926
Jibson RW, Keefer DK (1993) Analysis of the seismic origin of
landslides: examples from the New Madrid seismic zone. GeolSoc Am Bull 105:521–536
Jibson RW, Harp EL, Schulz W, Keefer DK (2004) Landslides
triggered by the 2002 M 7.9 Denali Fault, Alaska, earthquake
and the inferred nature of the strong shaking. Earthq Spectra
20:669–691
Jibson RW, Harp EL, Schulz W, Keefer DK (2006) Large rock
avalanches triggered by the M 7.9 Denali Fault, Alaska,
earthquake of 3 November 2002. Eng Geol 83:144–160
Int. J. Environ. Sci. Technol. (2015) 12:3189–3212 3209
123

Kaiser A, Holden C, Beavan J, Beetham D, Benites R, Celentano A,
Collett D, Cousins J, Cubrinovski M, Dellow D, Denys P,
Motagh M, Pondard N, McVerry G, Ristau J, Stirling M, Thomas
J, Uma SR, Zhao J (2012) The Mw 6.2 Christchurch earthquake
of February 2011: preliminary report. N Z J Geol Geophys
55:67–90
Kayen RE, Thompson E, Minasian D, Moss RES, Collins BD, Sitar
N, Dreger D, Carver GA (2004) Geotechnical reconnaissance of
the November 3, 2002 M 7.9 Denali Fault earthquake. Earthq
Spectra 20:639–667
Keefer DK (1984) Landslides caused by earthquakes. Geol Soc Am
Bull 95:406–421
Keefer DK (1993) The susceptibility of rock slopes to earthquake-
induced failure. Assoc Eng Geol Bull 30:353–361
Keefer DK (1994) The importance of earthquake-induced landslides
to long-term slope erosion and slope-failure hazards in seismi-
cally active regions. Geomorphology 10:265–284
Keefer DK (2000) Statistical analysis of an earthquake-induced
landslide distribution—the 1989 Loma Prieta, California event.
Eng Geol 58:231–249
Keefer DK (2002) Investigating landslides caused by earthquakes—a
historical review. Surv Geophys 23:473–510
Khazai B, Sitar N (2004) Evaluation of factors controlling earth-
quake-induced landslides caused by Chi–Chi earthquake and
comparison with the Northridge and Loma Prieta events. Eng
Geol 71:79–95
Kieffer DS, Jibson R, Rathje EM, Kelson K (2006) Landslides
triggered by the 2004 Niigata Ken Chuetsu, Japan, earthquake.
Earthq Spectra 22:47–73
Korup O, Clague JJ, Hermanns RL, Hewitt K, Strom AL, Weidinger
JT (2007) Giant landslides, topography, and erosion. Earth
Planet Sci Lett 261:578–589
Lacombe O, Mouthereau F, Deffontaines B, Angelier J, Ch HT, Lee
CT (1999) Geometry and quaternary kinematics of fold-and-
thrust units of southwestern Taiwan. Tectonics 18:1198–1223
Li Y, Allen PA, Densmore AL, Xu Q (2003) Evolution of the
Longmen Shan Foreland Basin (western Sichuan, China) during
the Late Triassic Indosinian Orogeny. Basin Res 15:117–138
Li H, Wang H, Xu Z, Si J, Pei J, Li T, Huang Y, Song SR, Kuo LW,
Sun Z, Chevalier ML, Liu D (2013a) Characteristics of the fault-
related rocks, fault zones and the principal slip zone in the
Wenchuan earthquake Fault Scientific Drilling Project Hole-1
(WFSD-1). Tectonophysics 584:23–42
Li W, Huang R, Tang C, Xu Q, Van Westen C (2013b) Co-seismic
landslide inventory and susceptibility mapping in the 2008
Wenchuan earthquake disaster area, China. J Mt Sci 10:339–354
Lin A, Ren Z, Wu X (2009) Co-seismic thrusting rupture and slip
distribution produced by the 2008 Mw 7.9 Wenchuan earth-
quake, China. Tectonophysics 471:203–215
Liu-Zeng J, Zhang Z, Wen L, Tapponnier P, Sun J, Xing X, Hu G, Xu
Q, Zeng L, Ding L, Ji C, Hudnut KW, van der Woerd J (2009)
Co-seismic ruptures of the 12 May 2008, Ms 8.0 Wenchuan
earthquake, Sichuan: east–west crustal shortening on oblique,
parallel thrusts along the eastern edge of Tibet. Earth Planet Sci
Lett 286:355–370
Lu D, Cui J, Li X, Lian W (2010) Ground motion attenuation of Ms
8.0 Wenchuan earthquake. Earthq Sci 23:95–100
Mahdavifar MR, Solaymani S, Jafari MK (2006) Landslides triggered
by the Avaj, Iran earthquake of June 22, 2002. Eng Geol
86:166–182
Malamud BD, Turcotte DL, Guzzetti F, Reichenbach P (2004)
Landslides, earthquakes, and erosion. Earth Planet Sci Lett
229:45–59
Miles SB, Ho CL (1999) Rigorous landslide hazard zonation using
Newmark’s method and stochastic ground motion simulation.
Soil Dyn Earthq Eng 18:305–323
Miles SB, Keefer DK (2007) Comprehensive area model of earth-
quake-induced landslides: technical specification and user guide.
U.S. Geol Surv Open File Rep 2007-1072
Miles SB, Keefer DK (2009) Evaluation of CAMEL—comprehensive
area model of earthquake-induced landslides. Eng Geol
104:1–15
Nakamura T, Tsuboi S, Kaneda Y, Yamanaka Y (2010) Rupture
process of the 2008 Wenchuan, China earthquake inferred from
teleseismic waveform inversion and forward modeling of
broadband seismic waves. Tectonophysics 491:72–84
Newmark NM (1965) Effects of earthquakes on dams and embank-
ments. Geotechnique 15:139–160
Nielsen SB (1998) Free surface effects on the propagation of dynamic
rupture. Geophys Res Lett 25:125–128
Nishimura N, Yagi Y (2008) Rupture process for May 12, 2008
Sichuan Earthquake (Ver. 2) http://www.geol.tsukuba.ac.jp/
*nisimura/20080512. Accessed 9 Jun 2011
Oglesby DD, Day SM (2002) Stochastic fault stress: implications for
fault dynamics and ground motion. Bull Seismol Soc Am
92:3006–3021
Oglesby DD, Archuleta RJ, Nielsen SB (1998) Earthquakes on
dipping faults: the effects of broken symmetry. Science
280:1055–1059
Oglesby DD, Archuleta RJ, Nielsen SB (2000a) Dynamics of dip-slip
faulting: explorations in two dimensions. J Geophys Res
105:13643–13653
Oglesby DD, Archuleta RJ, Nielsen SB (2000b) The three dimen-
sional dynamics of dipping faults. Bull Seismol Soc Am
90:616–628
Ouimet WB (2009) Landslides associated with the May 12, 2008
Wenchuan earthquake: implications for the erosion and tectonic
evolution of the Longmen Shan. Tectonophysics 491:244–252
Owen LA, Kamp U, Khattak GA, Harp EL, Keefer DV, Bauer MA
(2008) Landslides triggered by the 8 October 2005 Kashmir
earthquake. Geomorphology 94:1–9
Parsons T, Chen J, Kirby E (2008) Stress changes from the 2008
Wenchuan earthquake and increased hazard in the Sichuan basin.
Nature 454:509–510
Petit JP (1987) Criteria for the sense of movement on fault surfaces in
brittle rocks. J Struc Geol 9:597–608
Plackett RL (1983) Karl Pearson and the Chi squared test. Int Stat Rev
51:59–72
Pourghasemi HR, Moradi HR, Fatemi Aghda SM, Gokceoglu C,
Pradhan B (2014) GIS-based landslide susceptibility mapping
with probabilistic likelihood ratio and spatial multi-criteria
evaluation models (North of Tehran, Iran). Arab J Geosci
7:1857–1878
Regmi AD, Devkota KC, Yoshida K, Pradhan B, Pourghasemi HR,
Kumamoto T, Akgun A (2014) Application of frequency ratio,
statistical index, and weights-of-evidence models and their
comparison in landslide susceptibility mapping in Central Nepal
Himalaya. Arab J Geosci 7:725–742
Richardson N, Densmore AL, Seward D, Fowler A, Wipf M, Ellis
MA, Li Y, Zhang Y (2008) Extraordinary denudation in the
3210 Int. J. Environ. Sci. Technol. (2015) 12:3189–3212
123

Sichuan Basin: insights from low temperature thermochronology
adjacent to the eastern margin of the Tibetan Plateau. J Geophys
Res 113(B04409):1–23
Sato HP, Sekiguchi T, Kojiroi R, Suzuki Y, Iida M (2005) Overlaying
landslides distribution on the earthquake source, geological and
topographical data: the Mid Niigata prefecture earthquake in
2004, Japan. Landslides 2:143–152
Scheidegger AE (2001) Surface joint system. Tectonic stresses and
geomorphology: a reconciliation of conflicting observations.
Geomorphology 38:213–219
Shafer G (1976) A mathematical theory of evidence. Princeton
University Press, Princeton
Shen ZK, Sun J, Zhang P, Wan Y, Wang M, Burgmann R, Zeng Y,
Gan W, Liao H, Wang Q (2009) Slip maxima at fault junctions
and rupturing of barriers during the 2008 Wenchuan earthquake.
Nat Geosci 2:718–724
Shi Z, Day SM (2013) Rupture dynamics and ground motion from
3-D rough-fault simulations. J Geophys Res Sol Ea
118:1122–1141
Shi B, Anooshehpoor A, Brune JN, Zeng Y (1998) Dynamics of thrust
faulting: 2D lattice model. Bull Seismol Soc Am 88:1484–1494
Shou KJ, Wang CF (2003) Analysis of the Chiufengershan landslide
triggered by the 1999 Chi–Chi earthquake in Taiwan. Eng Geol
68:237–250
Somerville P, Irikura K, Graves R, Sawada S, Wald D, Abrahamson
N, Iwasaki Y, Kagawa T, Smith N, Kowada A (1999)
Characterizing crustal earthquake slip models for the prediction
of strong ground motion. Seismol Res Lett 70:59–80
Song Y, Gong J, Gao S, Wang D, Cui T, Li Y, Wei B (2012)
Susceptibility assessment of earthquake-induced landslides using
Bayesian network: a case study in Beichuan, China. Comput
Geosci 42:189–199
Tang H, Jia H, Hu J, Li D, Xiong C (2010) Characteristics of
landslides induced by the great Wenchuan earthquake. J Earth
Sci 21:104–113
Teson E, Mora A, Silva A, Namson J, Teixell A, Castellanos J,
Casallas W, Julivert M, Taylor M, Ibanez-Mejıa, Valencia VA
(2013) Relationship of Mesozoic graben development, stress,
shortening magnitude, and structural style in the Eastern
Cordillera of the Colombian Andes. Geol Soc Lond Spec Pub
377:257–283
Ulusay R, Tuncay E, Sonmez H, Gokceoglu C (2004) An attenuation
relationship based on Turkish strong motion data and iso-
acceleration map of Turkey. Eng Geol 74:265–291
USGS (2008) Magnitude 7.9—Eastern Sichuan, China, 2008 May 12
06:28:01 UTC. United States Geological Survey (USGS), http://
earthquake.usgs.gov/earthquakes/eqinthenews/2008/us2008ryan/
Vearncombe J, Vearncombe S (1999) The spatial distribution of
mineralization: applications of Fry analysis. Econ Geol
94:475–486
Velasco AA, Ammon CJ, Farrell J, Pankow K (2004) Rupture
directivity of the 3 November 2002 Denali fault earthquake
determined from surface waves. Bull Seismol Soc Am
94(6B):293–299
Wan Y, Shen ZK (2010) Static Coulomb stress changes on faults
caused by the 2008 Mw 7.9 Wenchuan, China earthquake.
Tectonophysics 491:105–118
Wang KL, Lin ML (2010) Development of shallow seismic landslide
potential map based on Newmark’s displacement: the case study
of Chi–Chi earthquake, Taiwan. Environ Earth Sci 60:775–785
Wang H, Wang G, Wang F, Sassa K, Chen Y (2008a) Probabilistic
modeling of seismically triggered landslides using Monte Carlo
simulations. Landslides 5:387–395
Wang Y, Wang E, Shen Z, Wang M, Gan W, Qiao X, Meng G, Li T,
Tao W, Yang Y, Cheng J, Li P (2008b) GPS-constrained inversion
of present-day slip rates along major faults of the Sichuan-Yunnan
region, China. Sci China Earth Sci 51:1267–1283
Wang Z, Fukao Y, Pei S (2009) Structural control of rupturing of the
Mw 7.9 2008 Wenchuan earthquake, China. Earth Planet Sci
Lett 279:131–138
Wang X, Nie G, Wang D (2010) Relationships between ground
motion parameters and landslides induced by Wenchuan earth-
quake. Earthq Sci 23:233–242
Wang H, Li H, Si J, Sun Z, Huang Y (2014) Internal structure of the
Wenchuan earthquake fault zone, revealed by surface outcrop
and WFSD-1 drilling core investigation. Tectonophysics
619–620:101–114
Wei S, Graves R, Helmberger D, Avouac JP, Jang J (2012) Sources of
shaking and flooding during the Tohoku-Oki earthquake: a
mixture of rupture styles. Earth Planet Sci Lett 333–334:91–100
Wells DI, Coppersmith KJ (1994) New empirical relationships among
magnitude, rupture length, rupture width, rupture area, and
surface displacement. Bull Seismol Soc Am 84:974–1002
Wilson RC, Keefer DK (1985) Predicting areal limits of earthquake-
induced landsliding. In: Ziony JI (eds) Evaluating earthquake
hazards in the Los Angeles Region—an earth-science perspec-
tive. U.S. Geol Surv Prof Paper 1360:316–345
Wu JH, Chen CH (2011) Application of DDA to simulate charac-
teristics of the Tsaoling landslide. Comput Geotech 38:741–750
Wu JH, Lin HM (2009) Analyzing the shear strength parameters of
the Chiu-fen-erh-shan landslide: integrating strong-motion and
GPS data to determine the best-fit accelerogram. GPS Solut
13:153–163
Wu JH, Tsai PH (2011) New dynamic procedure for back-calculating
the shear strength parameters of large landslides. Eng Geol
123:129–147
Wu JH, Lin JS, Chen CS (2009) Dynamic discrete analysis of an
earthquake-induced large-scale landslide. Int J Rock Mech Min
Serv 46:397–407
Xu C, Xu X (2013) Controlling parameter analyses and hazard
mapping for earthquake-triggered landslides: an example from a
square region in Beichuan County, Sichuan Province, China.
Arab J Geosci 6:3827–3839
Xu C, Xu X (2014) Statistical analysis of landslides caused by the
Mw 6.9 Yushu, China, earthquake of April 14, 2010. Nat
Hazards 72:871–893
Xu X, Wen X, Yu G, Chen G, Klinger Y, Hubbard J, Shaw J (2009)
Coseismic reverse- and oblique-slip surface faulting generated
by the 2008 Mw 7.9 Wenchuan earthquake, China. Geology
37:515–518
Xu C, Xu W, Dai F, Sard AK (2012) Comparison of different models
for susceptibility mapping of earthquake triggered landslides
related with the 2008 Wenchuan earthquake in China. Comput
Geosci 46:317–329
Xu C, Xu X, Yao X, Dai F (2014) Three (nearly) complete inventories
of landslides triggered by the May 12, 2008 Wenchuan Mw 7.9
earthquake of China and their spatial distribution statistical
analysis. Landslides 11:441–461
Yang JS (1992) Landslide mapping and major earthquakes on the
Kakapo Fault, South Island, New Zealand. J R Soc N Z
22:205–212
Yin Y (2014) Vertical acceleration effect on landsides triggered by the
Wenchuan earthquake, China. Environ Earth Sci 71:4703–4714
Yin J, Chen J, Wang X, Zheng Y (2010) The characteristics of the
landslides triggered by the Wenchuan Ms 8.0 earthquake from
Anxian to Beichuan. J Asian Earth Sci 37:452–459
Int. J. Environ. Sci. Technol. (2015) 12:3189–3212 3211
123

Yu YX, Gao MT (2001) Effects of the hanging wall and footwall on
peak acceleration during the Jiji (Chi–Chi), Taiwan Province,
earthquake. Acta Seismol Sin 14:654–659
Zhang W, Shen Y, Chen XF (2008) Numerical simulation of strong
ground motion for the Ms 8.0 Wenchuan earthquake of 12 May
2008. Sci China Earth Sci 51:1637–1682
Zhang PZ, Wen X, Shen ZK, Chen J (2010) Oblique, high-angle,
listric-reverse faulting and associated development of strain: the
Wenchuan earthquake of May 12, 2008, Sichuan, China. Annu
Rev Earth Planet Sci 38:353–382
Zhao CP, Chen ZL, Zhou LQ, Li ZX, Kang Y (2010) Rupture process
of the Wenchuan M 8.0 earthquake of Sichuan, China: the
segmentation feature. Chin Sci Bull 55:284–292
Zhao W, Huang R, Ju N, Zhao J (2014) Assessment model for
earthquake-triggered landslides based on quantification theory I:
case study of Jushui River basin in Sichuan, China. Nat Hazards
70:821–838
Zhou D, Graham SA (1996) Songpan-Ganzi Triassic flysch complex
of the West Qinling Shan as a remnant ocean basin. In: Yin A,
Harrison M (eds) The tectonic evolution of Asia. Cambridge
University Press, Cambridge, pp 281–299
Zhuang J, Cui P, Hu K, Chen X, Ge Y (2010) Characteristics of
earthquake-triggered landslides and post-earthquake debris flows
in Beichuan County. J Mt Sci 7:246–254
3212 Int. J. Environ. Sci. Technol. (2015) 12:3189–3212
123