Embed Size (px)
Citation preview
1
Control and Operation of a Vertical Axis Wind Turbine
Tiago Marques
Supervisor: Jörgen Svensson
IEA, LTH, Lunds Universitet
June 16, 2014
Abstract - This project aims to develop and implement an automatic operation and control system for an
experimental vertical axis wind turbine (VAWT) located at Lunds Tekniska Högskola, Sweden. Real-time
monitoring of the operation was made possible by setting up a supervisory control and data acquisition system
(SCADA). A state-machine model was developed to manage the operation of the turbine system and a variable
speed control method was implemented in order to maximize power extraction. Hill Climb Search (HCS) was the
chosen control method, since there is no knowledge about the optimum tip speed ratio of the rotor or the wind
turbine power curve. The control sequence is implemented in programmable logic controllers from National
Instruments, and data from the power converters and wind speed measurement is acquired and analyzed in the
controllers. Performance test results have confirmed the functionality of the implementation, although wind
conditions were not favourable and power production was not feasible. Nevertheless, an estimation of the wind
speed at which the wind turbine is capable of starting power production was made and the optimal tip-speed ratio
was investigated. The control system is fully operational but further studies of the setup are required in order to
have it running autonomously.
Keywords: Wind turbine control, Supervisory Control and Data Acquisition, PLC programming, LabVIEW,
Maximum Power Point Tracking, Hill-Climb search.
Nomenclature
ρ - Air density [kg/m3]
A - Rotor swept area [m2]
U - Wind speed [m/s]
CP - Power coefficient
β - Pitch angle
λ - Tip-speed ratio
Ω - Wind turbine rotor angular speed [rad/s]
R - Wind turbine rotor radius [m]
ωopt - Optimum rotor speed [rad/s]
λopt - Optimum tip-speed ratio
ωWT - VAWT rotor speed [rpm]
ωGEN - Generator rotational speed [Hz]
T - Torque [Nm]
- Average wind speed [m/s]
PMSG - Permanent magnet synchronous generator
GRID SIDE - Electrical grid power converter
GEN SIDE - PMSG power converter
MPPT - Maximum Power Point Tracking
1. Introduction
There is a growing awareness of the urgent need to find
an alternative to the finite fossil resources on which our
energetic and industrial systems are based. The
continuous growth of energy demand of the last decades,
aggravated by the exponential increase in consumption
from emerging economies (IEA, Key World Energy
Statistics, 2013), has compelled governments and
institutions to intervene by stimulating technological
advances in the renewable energy field, due to
environmental considerations in an effort to slow down
climate change.
Wind power is considered to be one of the renewable
energy conversion technologies showing most
developments in the recent years (IEA, Technology
Roadmap Wind Energy, 2013), as researchers and
industries invest their knowledge in improving and
optimizing wind turbine systems for optimal energy yield
and maximum performance. The author's intention is that
this project may contribute as a small step on that path.
Modern wind power plants rely on complex monitoring
and control systems that allow controlling individual
turbines and displaying detailed information about their
operating conditions. Supervisory Control and Data
Acquisition (SCADA) systems establish the
communication between the plant supervisor and the
individual wind turbines, allowing starting and stopping
power production and gathering relevant information.
This information typically includes wind speed and
direction, turbine operating states, individual power
production, wind turbine rotor speed, pitch angle, internal
sensor signals, fault reports or maintenance requests. This
data can be accessed remotely by an operator and
analysed in real-time, to assess the performance of the
turbines by visualizing the power curve and other
parameters, enabling to maximize power production
(Manwell, 2009).
2
A method for maximizing wind power extraction
consists in implementing variable rotor speed through the
use of power converters. Static converters, used as an
interface to the electric grid, enable variable speed
operation allowing to control the extracted power.
The main purpose of this project is to fully develop and
implement an automatic monitoring and control system
for the small-scale vertical axis wind turbine, sited on top
of the Mechanical Engineering building in Lunds
Tekniska Högskola (LTH), to perform overall control
tasks and monitoring to guarantee a safe and optimized
operation. The project goals are:
Design an overall control system to enable
automatic operation of the wind turbine setup and
implement it on the programmable logic controllers;
Implement an efficient control algorithm for
maximum power extraction;
Install an automatic mechanical brake system on
the wind turbine shaft to improve safety;
Update the functions of the web based remote
panel interface to LTH science observation centre,
Vattenhallen;
Evaluate the performance and controllability of
the wind turbine;
Investigate the efficiency of the system through
performance tests.
The installation of the wind turbine in the university
facilities is itself a visible manifestation of the interest and
commitment of the university in exploring and developing
new technologies for renewable energy generation,
contributing for a cleaner environment and a more self-
sustainable energetic system. The wind turbine setup
results from the cooperation between the manufacturing
company EXAMEC and LTH, and was erected in 2011 as
part of a master's thesis project (Petitfils, 2011).
The programming tool used for the implementation is
NI LabVIEW and the program is operating in a
commercial real-time embedded reconfigurable controller
from National Instruments, widely used throughout wind
power industry (Dvorak, Windpower Engineering &
Development, 2014).
2. Wind power overview
The most common design is the horizontal axis type
(HAWT), however experimental research is increasingly
focusing on vertical axis wind turbines (VAWT). Due to
the nature of this project, this introduction focuses
primarily on VAWT. Vertical axis wind turbines are
suitable to be mounted on top of buildings or setup in
higher places instead of ground level. In addition,
researchers think that the VAWT design can be scaled to
larger capacities (10 MW) more easily than conventional
HAWT, especially if it is designed to be on a floating
platform offshore (Wind Basics, 2014).
However, up until now none of the types of VAWT
could be developed to such a point that their theoretical
advantages would outweigh their practical disadvantages,
in order to surpass the matured technology of HAWT.
The fact that the generator is located on the base limits the
height of the tower, which implies that a fraction or the
whole rotor tends to be located close to the ground in a
region where wind is not as strong as in greater heights. A
solution to overcome this limitation is to install the
VAWTs on top of buildings.
This section addresses the theory behind power
production due to aerodynamic forces in the turbine rotor,
to provide a better understanding of how the performance
of a wind turbine is influenced by different parameters.
The power available in an air flow is calculated from
equation (1):
(1)
The efficiency with which a wind turbine can extract the
power present in the wind and convert it into mechanical
power is quantified by the power coefficient CP,
dependent from the tip speed ratio λ, and the pitch angle
β, given by (2).
tracted po er
vaila le po er
(2)
As a brief note, it is relevant to mention that the
projected area of the rotor of a VAWT is calculated as:
(3)
with R as the rotor radius and H as blade height.
The tip speed ratio λ is defined as the ratio et een the
blade tip speed and the free stream wind speed, given by
(4):
(4)
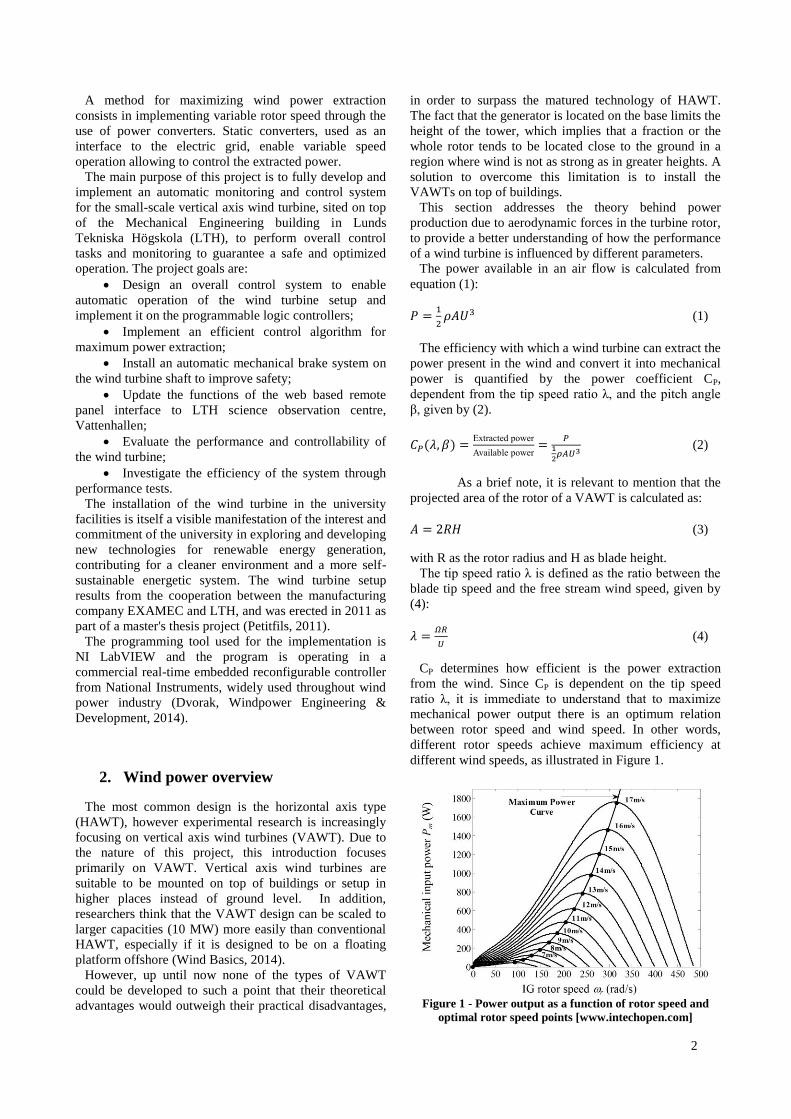
CP determines how efficient is the power extraction
from the wind. Since CP is dependent on the tip speed
ratio λ, it is immediate to understand that to ma imize
mechanical power output there is an optimum relation
between rotor speed and wind speed. In other words,
different rotor speeds achieve maximum efficiency at
different wind speeds, as illustrated in Figure 1.
Figure 1 - Power output as a function of rotor speed and
optimal rotor speed points [www.intechopen.com]
3
SCADA (Supervisory Control and Data Acquisition)
systems are significantly important control systems used
in large scale industrial infrastructures such as electric
grids, water supplies and power plants.
Its function is to control and monitor industrial
processes and to apply intelligent management algorithms
in order to make decisions over the system operation,
taking into account the acquired data and the status of the
different components. An important function is to monitor
alarm signals in the system and apply safety measures or
inform the control room of the detailed alarm conditions.
The downtime from a turbine that is permanently
monitored is significantly reduced and this contributes for
a higher return and better economical viability. Also, by
avoiding hazardous operating conditions, the lifetime of
the wind turbine components is extended. Performance
analysis can improve wind turbine operation in a
significant way and contribute to larger energy yields by
allowing for immediate action when under-performance
problems arise.
3. Wind turbine control theory
Wind turbine control systems are usually hierarchically
separated in different levels, each with different tasks and
responsibilities:
Wind farm controllers (SCADA systems):
responsible for monitoring the operation of several units
and the communication of power between the wind power
plant and the electrical grid, and usually provided with the
possibility to start and shutdown the individual turbines
and coordinate operation between them;
Supervisory controllers: supervise the
operation of an individual turbine and react to changes in
environment and operation conditions, monitoring the
wind data, changing between operating states, sending
command signals to the lower level dynamic control
layers;
Dynamic controllers: control the different
subsystems in the wind turbine and make continuous
adjustments to actuators and components as a reaction to
the operating conditions. Different dynamic controllers
usually operate different subsystems and the coordination
between them is performed by the supervisory controller.
These are used for tasks such as adjustment of blade
pitch, control of the power flow on the power converters
and operation of actuators in the system.
Several control strategies to maximize energy yield
could be applied. In the cases when the power-rotor speed
curve of the wind turbine is known, it is possible to
control the power electronics converter to deliver a
predefined electric power as a function of the rotor speed
ω to optimize po er e traction. Ho ever, this control
strategy requires detailed knowledge of the Cp curve of
the turbine and the electrical machine parameters.
Since there is no trustworthy information about the
electrical generator parameters or operation curves for the
wind turbine in this project, a different approach for
achieving maximum power generation is necessary.
The purpose of a Maximum Power Point Tracking
(MPPT) method is to maintain the tip-speed ratio, λ, of
the wind turbine as close as possible to the optimal tip-
speed ratio, λopt, in order to achieve maximum power
extraction from the wind.
The Hill-Climb Search method acts by continuously
searching for the peak power of the wind turbine, using
only measured data. For this tracking algorithm there is
no need for information about the Cp curve, optimum tip-
speed ratio λopt or ind speed. This method verifies the
location of the operating point and establishes relations
between the variations in power output and rotor speed to
assess if the rotor speed should be increased, decreased or
maintained to drive the system to the point of maximum
power.
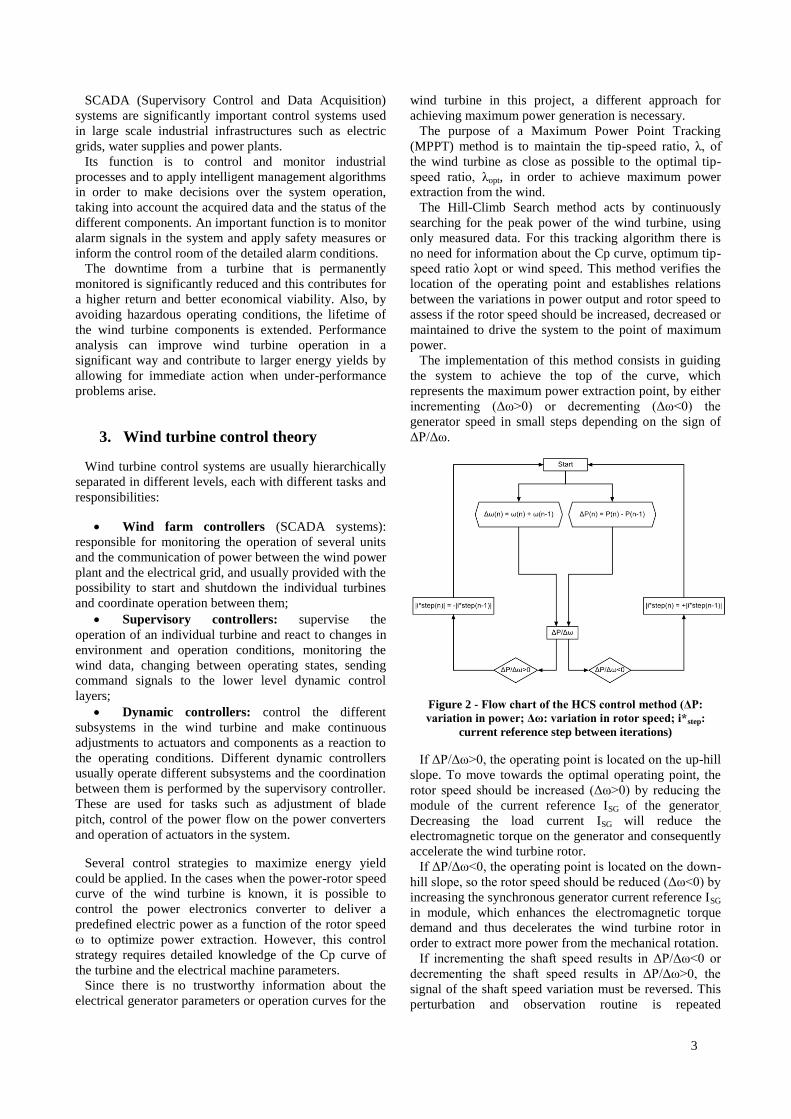
The implementation of this method consists in guiding
the system to achieve the top of the curve, which
represents the maximum power extraction point, by either
incrementing (Δω>0) or decrementing (Δω<0) the
generator speed in small steps depending on the sign of
ΔP/Δω.
Figure 2 - Flow chart of the HCS control method (ΔP:
variation in power; Δω: variation in rotor speed; i*step:
current reference step between iterations)
If ΔP/Δω>0, the operating point is located on the up-hill
slope. To move towards the optimal operating point, the
rotor speed should e increased (Δω>0) y reducing the
module of the current reference ISG of the generator.
Decreasing the load current ISG will reduce the
electromagnetic torque on the generator and consequently
accelerate the wind turbine rotor.
If ΔP/Δω<0, the operating point is located on the do n-
hill slope, so the rotor speed should e reduced (Δω<0) y
increasing the synchronous generator current reference ISG
in module, which enhances the electromagnetic torque
demand and thus decelerates the wind turbine rotor in
order to extract more power from the mechanical rotation.
If incrementing the shaft speed results in ΔP/Δω<0 or
decrementing the shaft speed results in ΔP/Δω>0, the
signal of the shaft speed variation must be reversed. This
perturbation and observation routine is repeated
4
iteratively, until the point here ΔP/Δω=0 is reached and
maximum power extraction is achieved. In practice, the
exact maximum efficiency point is not kept constant, but
rather approximated by small steps in rotor speed change
around the optimal operating point.
4. LTH Wind Power unit
Having an experimental wind turbine setup of its own,
the IEA (Industrial Electrical Engineering and
Automation) department can use it to test different
experimental devices and software, such as generators or
data acquisition and control systems. It is intended to
study the behaviour of the wind turbine and be able to
relate the setup to large scale power production systems,
such as offshore wind power plants or multi source
renewable energy setups.
The specific goals of the implementation are:
Guarantee the safety of the setup and the
university surroundings by constantly monitoring the
rotor speed to avoid hazardous situations in case of strong
winds;
Inform the operator of any irregular situations
related to the power converters, generator voltage, current
or the DC connection, and react accordingly;
Provide the operator with the possibility of
stopping the wind turbine through a mechanical brake, in
case of emergency;
Apply the brake automatically in case of power
failure to prevent the turbine from rotating in 'freewheel',
which could accelerate the rotor to dangerous speeds for
which the structure is not prepared and thus increase the
probability of accidents;
Brake the turbine automatically in case the wind
speed exceeds a maximum value (cut-out wind speed);
Implement a control algorithm in order to extract
the maximum amount of energy from the wind;
Allow the operator to select the desired mode of
operation.
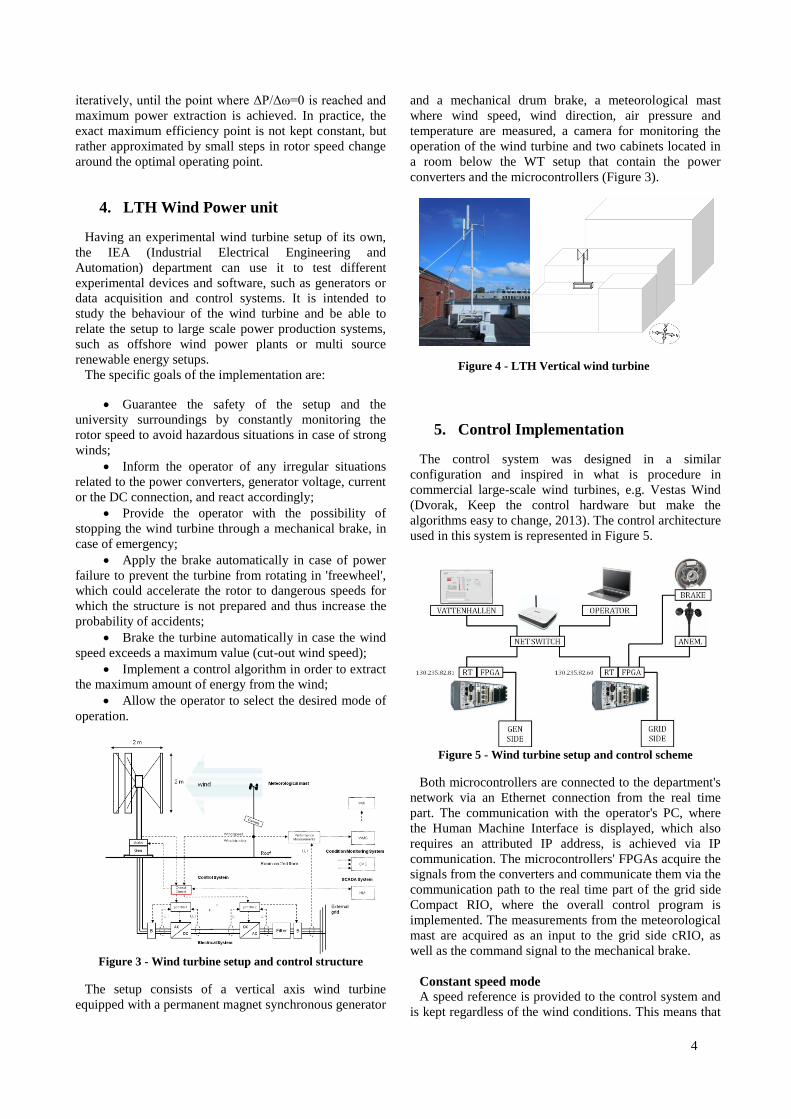
Figure 3 - Wind turbine setup and control structure
The setup consists of a vertical axis wind turbine
equipped with a permanent magnet synchronous generator
and a mechanical drum brake, a meteorological mast
where wind speed, wind direction, air pressure and
temperature are measured, a camera for monitoring the
operation of the wind turbine and two cabinets located in
a room below the WT setup that contain the power
converters and the microcontrollers (Figure 3).
Figure 4 - LTH Vertical wind turbine
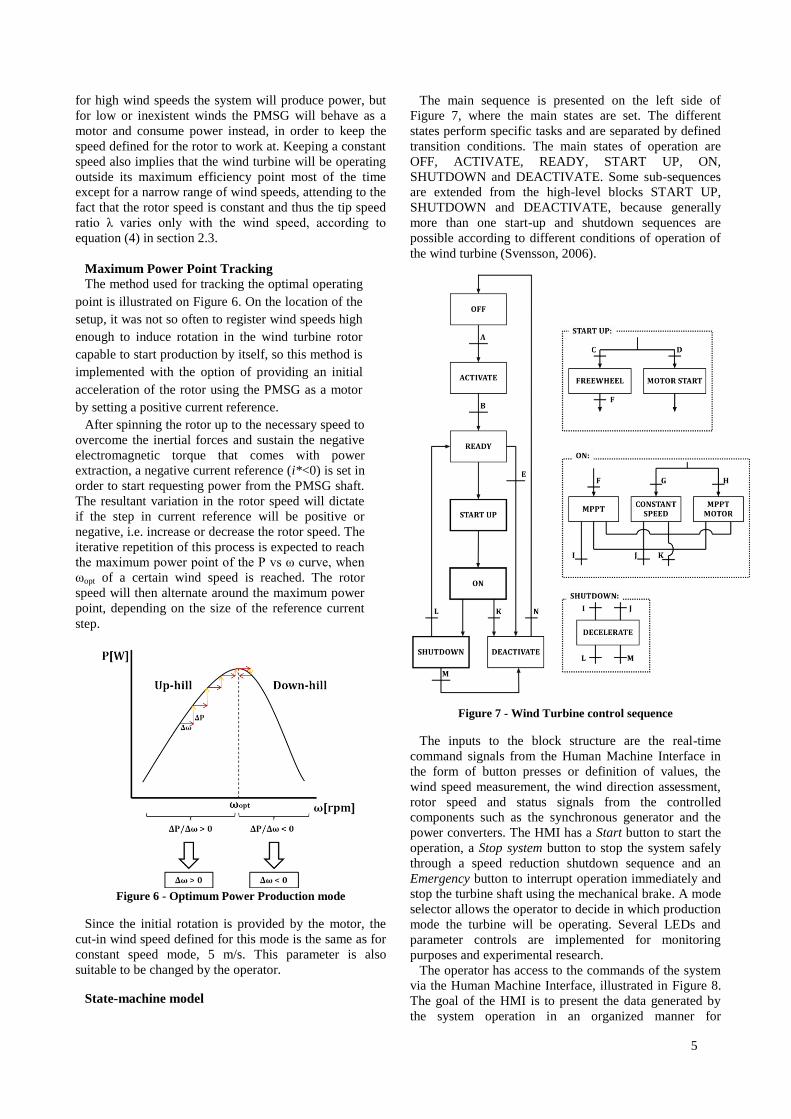
5. Control Implementation
The control system was designed in a similar
configuration and inspired in what is procedure in
commercial large-scale wind turbines, e.g. Vestas Wind
(Dvorak, Keep the control hardware but make the
algorithms easy to change, 2013). The control architecture
used in this system is represented in Figure 5.
Figure 5 - Wind turbine setup and control scheme
Both microcontrollers are connected to the department's
network via an Ethernet connection from the real time
part. The communication with the operator's PC, where
the Human Machine Interface is displayed, which also
requires an attributed IP address, is achieved via IP
communication. The microcontrollers' FPGAs acquire the
signals from the converters and communicate them via the
communication path to the real time part of the grid side
Compact RIO, where the overall control program is
implemented. The measurements from the meteorological
mast are acquired as an input to the grid side cRIO, as
well as the command signal to the mechanical brake.
Constant speed mode
A speed reference is provided to the control system and
is kept regardless of the wind conditions. This means that
5
for high wind speeds the system will produce power, but
for low or inexistent winds the PMSG will behave as a
motor and consume power instead, in order to keep the
speed defined for the rotor to work at. Keeping a constant
speed also implies that the wind turbine will be operating
outside its maximum efficiency point most of the time
except for a narrow range of wind speeds, attending to the
fact that the rotor speed is constant and thus the tip speed
ratio λ varies only ith the ind speed, according to
equation (4) in section 2.3.
Maximum Power Point Tracking
The method used for tracking the optimal operating
point is illustrated on Figure 6. On the location of the
setup, it was not so often to register wind speeds high
enough to induce rotation in the wind turbine rotor
capable to start production by itself, so this method is
implemented with the option of providing an initial
acceleration of the rotor using the PMSG as a motor
by setting a positive current reference.
After spinning the rotor up to the necessary speed to
overcome the inertial forces and sustain the negative
electromagnetic torque that comes with power
extraction, a negative current reference (i*<0) is set in
order to start requesting power from the PMSG shaft.
The resultant variation in the rotor speed will dictate
if the step in current reference will be positive or
negative, i.e. increase or decrease the rotor speed. The
iterative repetition of this process is expected to reach
the ma imum po er point of the P vs ω curve, hen
ωopt of a certain wind speed is reached. The rotor
speed will then alternate around the maximum power
point, depending on the size of the reference current
step.
Figure 6 - Optimum Power Production mode
Since the initial rotation is provided by the motor, the
cut-in wind speed defined for this mode is the same as for
constant speed mode, 5 m/s. This parameter is also
suitable to be changed by the operator.
State-machine model
The main sequence is presented on the left side of
Figure 7, where the main states are set. The different
states perform specific tasks and are separated by defined
transition conditions. The main states of operation are
OFF, ACTIVATE, READY, START UP, ON,
SHUTDOWN and DEACTIVATE. Some sub-sequences
are extended from the high-level blocks START UP,
SHUTDOWN and DEACTIVATE, because generally
more than one start-up and shutdown sequences are
possible according to different conditions of operation of
the wind turbine (Svensson, 2006).
Figure 7 - Wind Turbine control sequence
The inputs to the block structure are the real-time
command signals from the Human Machine Interface in
the form of button presses or definition of values, the
wind speed measurement, the wind direction assessment,
rotor speed and status signals from the controlled
components such as the synchronous generator and the
power converters. The HMI has a Start button to start the
operation, a Stop system button to stop the system safely
through a speed reduction shutdown sequence and an
Emergency button to interrupt operation immediately and
stop the turbine shaft using the mechanical brake. A mode
selector allows the operator to decide in which production
mode the turbine will be operating. Several LEDs and
parameter controls are implemented for monitoring
purposes and experimental research.
The operator has access to the commands of the system
via the Human Machine Interface, illustrated in Figure 8.
The goal of the HMI is to present the data generated by
the system operation in an organized manner for
6
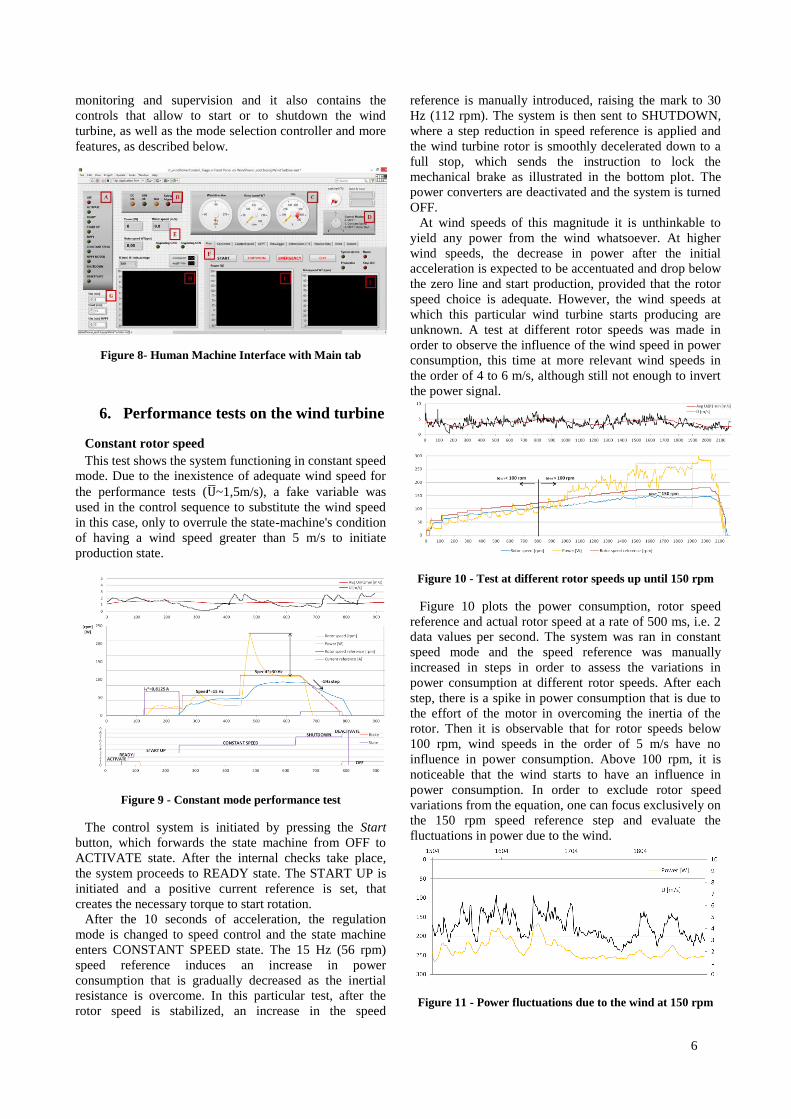
monitoring and supervision and it also contains the
controls that allow to start or to shutdown the wind
turbine, as well as the mode selection controller and more
features, as described below.
Figure 8- Human Machine Interface with Main tab
6. Performance tests on the wind turbine
Constant rotor speed
This test shows the system functioning in constant speed
mode. Due to the inexistence of adequate wind speed for
the performance tests ( ~1,5m/s), a fake variable was
used in the control sequence to substitute the wind speed
in this case, only to overrule the state-machine's condition
of having a wind speed greater than 5 m/s to initiate
production state.
Figure 9 - Constant mode performance test
The control system is initiated by pressing the Start
button, which forwards the state machine from OFF to
ACTIVATE state. After the internal checks take place,
the system proceeds to READY state. The START UP is
initiated and a positive current reference is set, that
creates the necessary torque to start rotation.
After the 10 seconds of acceleration, the regulation
mode is changed to speed control and the state machine
enters CONSTANT SPEED state. The 15 Hz (56 rpm)
speed reference induces an increase in power
consumption that is gradually decreased as the inertial
resistance is overcome. In this particular test, after the
rotor speed is stabilized, an increase in the speed
reference is manually introduced, raising the mark to 30
Hz (112 rpm). The system is then sent to SHUTDOWN,
where a step reduction in speed reference is applied and
the wind turbine rotor is smoothly decelerated down to a
full stop, which sends the instruction to lock the
mechanical brake as illustrated in the bottom plot. The
power converters are deactivated and the system is turned
OFF.
At wind speeds of this magnitude it is unthinkable to
yield any power from the wind whatsoever. At higher
wind speeds, the decrease in power after the initial
acceleration is expected to be accentuated and drop below
the zero line and start production, provided that the rotor
speed choice is adequate. However, the wind speeds at
which this particular wind turbine starts producing are
unknown. A test at different rotor speeds was made in
order to observe the influence of the wind speed in power
consumption, this time at more relevant wind speeds in
the order of 4 to 6 m/s, although still not enough to invert
the power signal.
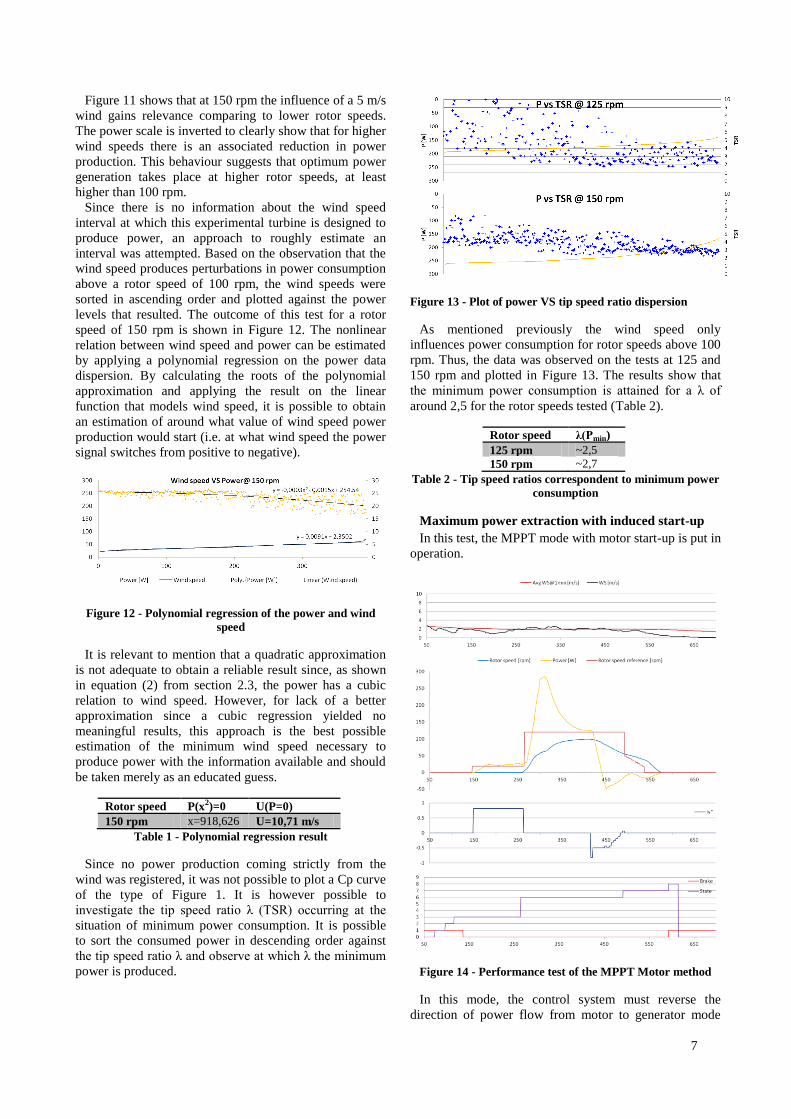
Figure 10 - Test at different rotor speeds up until 150 rpm
Figure 10 plots the power consumption, rotor speed
reference and actual rotor speed at a rate of 500 ms, i.e. 2
data values per second. The system was ran in constant
speed mode and the speed reference was manually
increased in steps in order to assess the variations in
power consumption at different rotor speeds. After each
step, there is a spike in power consumption that is due to
the effort of the motor in overcoming the inertia of the
rotor. Then it is observable that for rotor speeds below
100 rpm, wind speeds in the order of 5 m/s have no
influence in power consumption. Above 100 rpm, it is
noticeable that the wind starts to have an influence in
power consumption. In order to exclude rotor speed
variations from the equation, one can focus exclusively on
the 150 rpm speed reference step and evaluate the
fluctuations in power due to the wind.
Figure 11 - Power fluctuations due to the wind at 150 rpm
7
Figure 11 shows that at 150 rpm the influence of a 5 m/s
wind gains relevance comparing to lower rotor speeds.
The power scale is inverted to clearly show that for higher
wind speeds there is an associated reduction in power
production. This behaviour suggests that optimum power
generation takes place at higher rotor speeds, at least
higher than 100 rpm.
Since there is no information about the wind speed
interval at which this experimental turbine is designed to
produce power, an approach to roughly estimate an
interval was attempted. Based on the observation that the
wind speed produces perturbations in power consumption
above a rotor speed of 100 rpm, the wind speeds were
sorted in ascending order and plotted against the power
levels that resulted. The outcome of this test for a rotor
speed of 150 rpm is shown in Figure 12. The nonlinear
relation between wind speed and power can be estimated
by applying a polynomial regression on the power data
dispersion. By calculating the roots of the polynomial
approximation and applying the result on the linear
function that models wind speed, it is possible to obtain
an estimation of around what value of wind speed power
production would start (i.e. at what wind speed the power
signal switches from positive to negative).
Figure 12 - Polynomial regression of the power and wind
speed
It is relevant to mention that a quadratic approximation
is not adequate to obtain a reliable result since, as shown
in equation (2) from section 2.3, the power has a cubic
relation to wind speed. However, for lack of a better
approximation since a cubic regression yielded no
meaningful results, this approach is the best possible
estimation of the minimum wind speed necessary to
produce power with the information available and should
be taken merely as an educated guess.
Rotor speed P(x2)=0 U(P=0)
150 rpm x=918,626 U=10,71 m/s
Table 1 - Polynomial regression result
Since no power production coming strictly from the
wind was registered, it was not possible to plot a Cp curve
of the type of Figure 1. It is however possible to
investigate the tip speed ratio λ (TSR) occurring at the
situation of minimum power consumption. It is possible
to sort the consumed power in descending order against
the tip speed ratio λ and o serve at hich λ the minimum
power is produced.
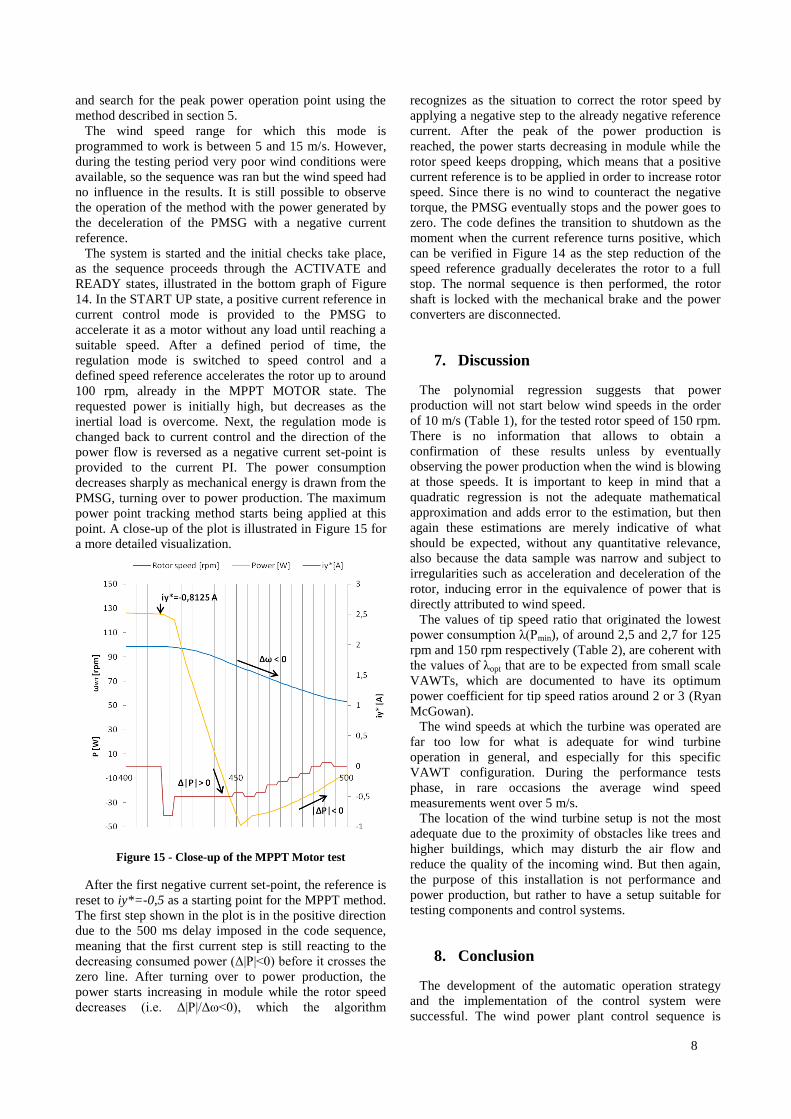
Figure 13 - Plot of power VS tip speed ratio dispersion
As mentioned previously the wind speed only
influences power consumption for rotor speeds above 100
rpm. Thus, the data was observed on the tests at 125 and
150 rpm and plotted in Figure 13. The results show that
the minimum po er consumption is attained for a λ of
around 2,5 for the rotor speeds tested (Table 2).
Rotor speed λ(Pmin)
125 rpm ~2,5
150 rpm ~2,7
Table 2 - Tip speed ratios correspondent to minimum power
consumption
Maximum power extraction with induced start-up
In this test, the MPPT mode with motor start-up is put in
operation.
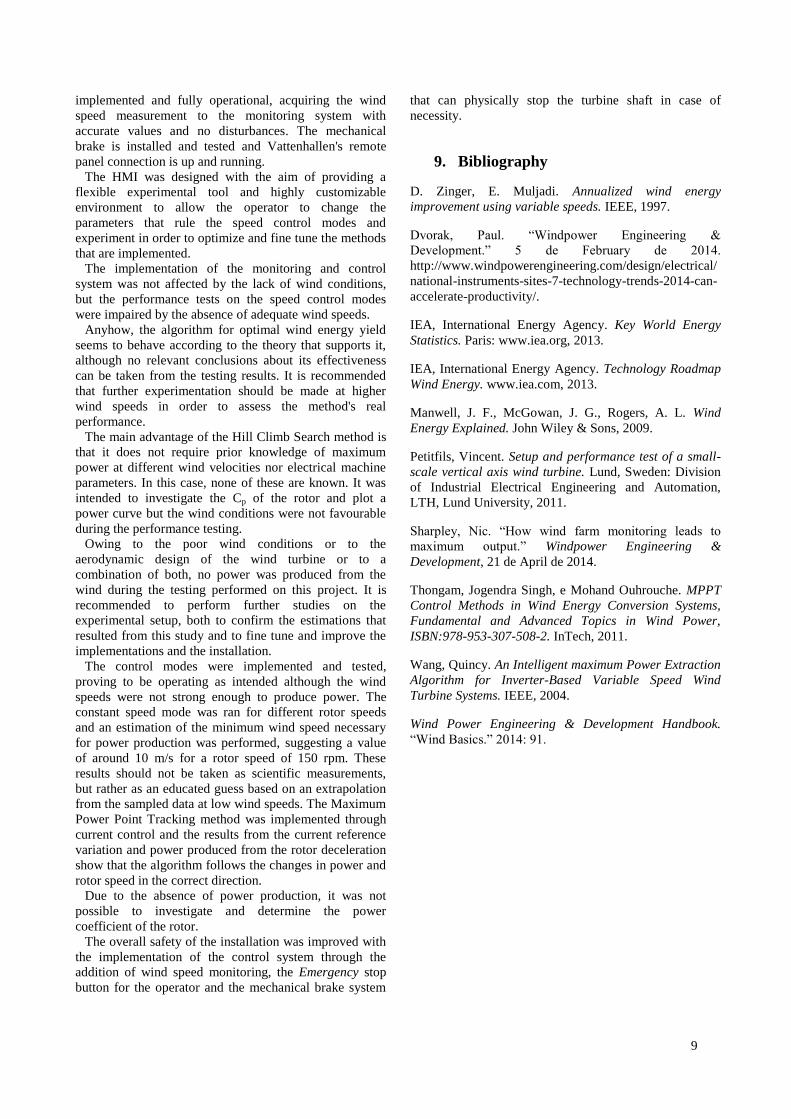
Figure 14 - Performance test of the MPPT Motor method
In this mode, the control system must reverse the
direction of power flow from motor to generator mode
8
and search for the peak power operation point using the
method described in section 5.
The wind speed range for which this mode is
programmed to work is between 5 and 15 m/s. However,
during the testing period very poor wind conditions were
available, so the sequence was ran but the wind speed had
no influence in the results. It is still possible to observe
the operation of the method with the power generated by
the deceleration of the PMSG with a negative current
reference.
The system is started and the initial checks take place,
as the sequence proceeds through the ACTIVATE and
READY states, illustrated in the bottom graph of Figure
14. In the START UP state, a positive current reference in
current control mode is provided to the PMSG to
accelerate it as a motor without any load until reaching a
suitable speed. After a defined period of time, the
regulation mode is switched to speed control and a
defined speed reference accelerates the rotor up to around
100 rpm, already in the MPPT MOTOR state. The
requested power is initially high, but decreases as the
inertial load is overcome. Next, the regulation mode is
changed back to current control and the direction of the
power flow is reversed as a negative current set-point is
provided to the current PI. The power consumption
decreases sharply as mechanical energy is drawn from the
PMSG, turning over to power production. The maximum
power point tracking method starts being applied at this
point. A close-up of the plot is illustrated in Figure 15 for
a more detailed visualization.
Figure 15 - Close-up of the MPPT Motor test
After the first negative current set-point, the reference is
reset to iy*=-0,5 as a starting point for the MPPT method.
The first step shown in the plot is in the positive direction
due to the 500 ms delay imposed in the code sequence,
meaning that the first current step is still reacting to the
decreasing consumed po er (Δ|P|<0) efore it crosses the
zero line. After turning over to power production, the
power starts increasing in module while the rotor speed
decreases (i.e. Δ|P|/Δω<0), hich the algorithm
recognizes as the situation to correct the rotor speed by
applying a negative step to the already negative reference
current. After the peak of the power production is
reached, the power starts decreasing in module while the
rotor speed keeps dropping, which means that a positive
current reference is to be applied in order to increase rotor
speed. Since there is no wind to counteract the negative
torque, the PMSG eventually stops and the power goes to
zero. The code defines the transition to shutdown as the
moment when the current reference turns positive, which
can be verified in Figure 14 as the step reduction of the
speed reference gradually decelerates the rotor to a full
stop. The normal sequence is then performed, the rotor
shaft is locked with the mechanical brake and the power
converters are disconnected.
7. Discussion
The polynomial regression suggests that power
production will not start below wind speeds in the order
of 10 m/s (Table 1), for the tested rotor speed of 150 rpm.
There is no information that allows to obtain a
confirmation of these results unless by eventually
observing the power production when the wind is blowing
at those speeds. It is important to keep in mind that a
quadratic regression is not the adequate mathematical
approximation and adds error to the estimation, but then
again these estimations are merely indicative of what
should be expected, without any quantitative relevance,
also because the data sample was narrow and subject to
irregularities such as acceleration and deceleration of the
rotor, inducing error in the equivalence of power that is
directly attributed to wind speed.
The values of tip speed ratio that originated the lowest
po er consumption λ(Pmin), of around 2,5 and 2,7 for 125
rpm and 150 rpm respectively (Table 2), are coherent with
the values of λopt that are to be expected from small scale
VAWTs, which are documented to have its optimum
power coefficient for tip speed ratios around 2 or 3 (Ryan
McGowan).
The wind speeds at which the turbine was operated are
far too low for what is adequate for wind turbine
operation in general, and especially for this specific
VAWT configuration. During the performance tests
phase, in rare occasions the average wind speed
measurements went over 5 m/s.
The location of the wind turbine setup is not the most
adequate due to the proximity of obstacles like trees and
higher buildings, which may disturb the air flow and
reduce the quality of the incoming wind. But then again,
the purpose of this installation is not performance and
power production, but rather to have a setup suitable for
testing components and control systems.
8. Conclusion
The development of the automatic operation strategy
and the implementation of the control system were
successful. The wind power plant control sequence is
9
implemented and fully operational, acquiring the wind
speed measurement to the monitoring system with
accurate values and no disturbances. The mechanical
brake is installed and tested and Vattenhallen's remote
panel connection is up and running.
The HMI was designed with the aim of providing a
flexible experimental tool and highly customizable
environment to allow the operator to change the
parameters that rule the speed control modes and
experiment in order to optimize and fine tune the methods
that are implemented.
The implementation of the monitoring and control
system was not affected by the lack of wind conditions,
but the performance tests on the speed control modes
were impaired by the absence of adequate wind speeds.
Anyhow, the algorithm for optimal wind energy yield
seems to behave according to the theory that supports it,
although no relevant conclusions about its effectiveness
can be taken from the testing results. It is recommended
that further experimentation should be made at higher
wind speeds in order to assess the method's real
performance.
The main advantage of the Hill Climb Search method is
that it does not require prior knowledge of maximum
power at different wind velocities nor electrical machine
parameters. In this case, none of these are known. It was
intended to investigate the Cp of the rotor and plot a
power curve but the wind conditions were not favourable
during the performance testing.
Owing to the poor wind conditions or to the
aerodynamic design of the wind turbine or to a
combination of both, no power was produced from the
wind during the testing performed on this project. It is
recommended to perform further studies on the
experimental setup, both to confirm the estimations that
resulted from this study and to fine tune and improve the
implementations and the installation.
The control modes were implemented and tested,
proving to be operating as intended although the wind
speeds were not strong enough to produce power. The
constant speed mode was ran for different rotor speeds
and an estimation of the minimum wind speed necessary
for power production was performed, suggesting a value
of around 10 m/s for a rotor speed of 150 rpm. These
results should not be taken as scientific measurements,
but rather as an educated guess based on an extrapolation
from the sampled data at low wind speeds. The Maximum
Power Point Tracking method was implemented through
current control and the results from the current reference
variation and power produced from the rotor deceleration
show that the algorithm follows the changes in power and
rotor speed in the correct direction.
Due to the absence of power production, it was not
possible to investigate and determine the power
coefficient of the rotor.
The overall safety of the installation was improved with
the implementation of the control system through the
addition of wind speed monitoring, the Emergency stop
button for the operator and the mechanical brake system
that can physically stop the turbine shaft in case of
necessity.
9. Bibliography
D. Zinger, E. Muljadi. Annualized wind energy
improvement using variable speeds. IEEE, 1997.
Dvorak, Paul. “Windpo er ngineering &
Development.” 5 de Fe ruary de 2014.
http://www.windpowerengineering.com/design/electrical/
national-instruments-sites-7-technology-trends-2014-can-
accelerate-productivity/.
IEA, International Energy Agency. Key World Energy
Statistics. Paris: www.iea.org, 2013.
IEA, International Energy Agency. Technology Roadmap
Wind Energy. www.iea.com, 2013.
Manwell, J. F., McGowan, J. G., Rogers, A. L. Wind
Energy Explained. John Wiley & Sons, 2009.
Petitfils, Vincent. Setup and performance test of a small-
scale vertical axis wind turbine. Lund, Sweden: Division
of Industrial Electrical Engineering and Automation,
LTH, Lund University, 2011.
Sharpley, Nic. “Ho ind farm monitoring leads to
ma imum output.” Windpower Engineering &
Development, 21 de April de 2014.
Thongam, Jogendra Singh, e Mohand Ouhrouche. MPPT
Control Methods in Wind Energy Conversion Systems,
Fundamental and Advanced Topics in Wind Power,
ISBN:978-953-307-508-2. InTech, 2011.
Wang, Quincy. An Intelligent maximum Power Extraction
Algorithm for Inverter-Based Variable Speed Wind
Turbine Systems. IEEE, 2004.
Wind Power Engineering & Development Handbook.
“Wind Basics.” 2014: 91.