Embed Size (px)
Citation preview

Franke Aviation & Transportation ConsultingFranke Aviation & Transportation Consulting
DE/EN
COPYRIGHT 2010 WWW.FRANKE-AVIATION.COM
FORWARDING & LOGISTICS RAIL POSTAL & EXPRESS DELIVERY OEMs, SUPPLIERS, SERVICE PROVIDERSAVIATION
Contribution of Network Carriers and Low Cost Carriersto the development of (regional) air transport services
Dr. Markus Franke, Founder and Owner of FATC
1st Cracow Aviation Conference: „Managing Regional Airports in Competitive Environment“
Cracow, March 10, 2011
Presentation Cracow Aviation Conference, 03/2011Page 1
Franke Aviation & Transportation Consulting
COPYRIGHT 2010 WWW.FRANKE-AVIATION.COM
Main topics of today‘s presentation
What are the prospects for Poland‘s aviation sector, and what arethe shares of relevant business segments?
Which are feasible objectives for regional airports, and how willWAW / CAP interfere with them?
How can Network Carriers and Low Cost Carriers contribute to asustainable development of Polish regional airports?
What are critical success factors of Network Carriers and Low CostCarriers in Poland, and which actions can be taken to foster them?
1
2
3
4

Presentation Cracow Aviation Conference, 03/2011Page 2
Franke Aviation & Transportation Consulting
COPYRIGHT 2010 WWW.FRANKE-AVIATION.COM
Poland‘s air traffic is emerging – however, there is still a gapbetween overall wealth trajectory and propensity to fly
1
Source: Eurostat, www.finanzwirtschafter.de, Statistics of International Monetary Funds, www.skyscrapercity.com
40,00030,00020,00010,000
UK
Germany
Poland
CzechRepublic
Portugal
Spain
Italy France
Romania
Slovenia
0
Outboundflightsper capita(log, 2009)
0.01
0.1
1.0
10
GDP per capita (USD, 2009, Purchase power parity)
Propensity to fly in selected (European) countries (2009)
Empiricrange
Hungary
Mid-term gap:10…12 Mn pax p.a.
Passenger growth:+13 % p.a. 2002-2010
Presentation Cracow Aviation Conference, 03/2011Page 3
Franke Aviation & Transportation Consulting
COPYRIGHT 2010 WWW.FRANKE-AVIATION.COM
Poland‘s air traffic is emerging – however, there is still a gapbetween overall wealth trajectory and propensity to fly
1
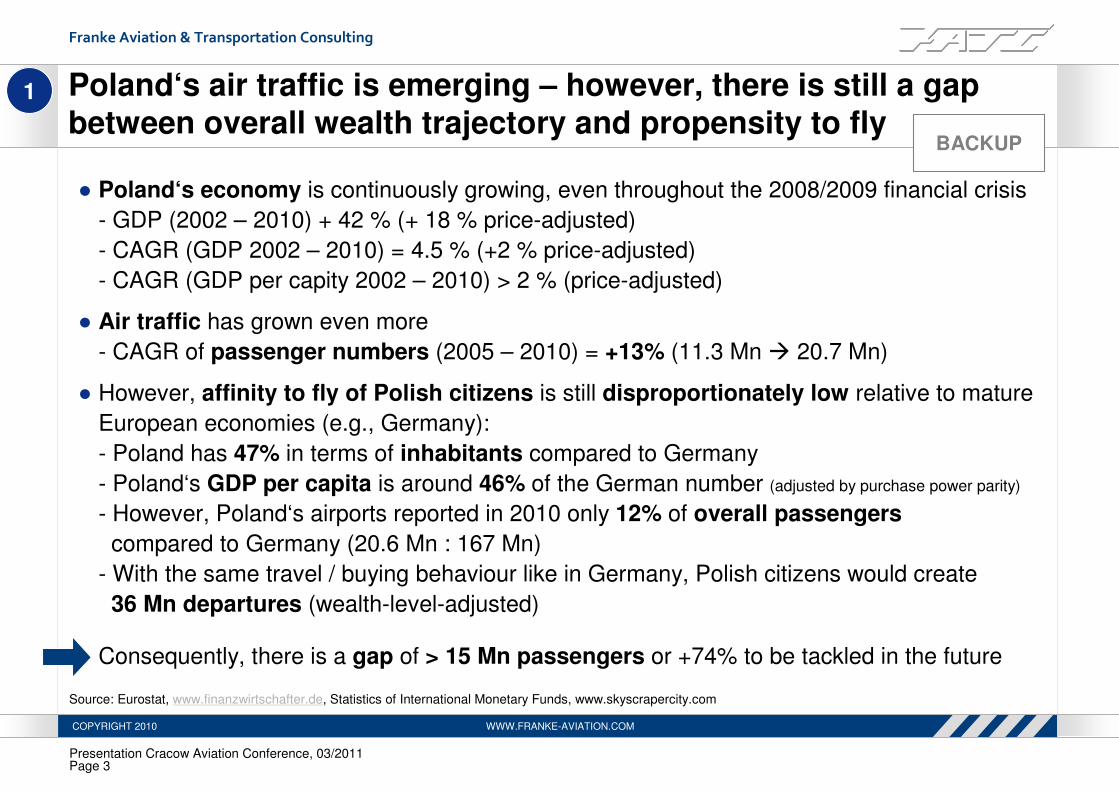
● Poland‘s economy is continuously growing, even throughout the 2008/2009 financial crisis
- GDP (2002 – 2010) + 42 % (+ 18 % price-adjusted)
- CAGR (GDP 2002 – 2010) = 4.5 % (+2 % price-adjusted)
- CAGR (GDP per capity 2002 – 2010) > 2 % (price-adjusted)
● Air traffic has grown even more
- CAGR of passenger numbers (2005 – 2010) = +13% (11.3 Mn � 20.7 Mn)
● However, affinity to fly of Polish citizens is still disproportionately low relative to mature
European economies (e.g., Germany):
- Poland has 47% in terms of inhabitants compared to Germany
- Poland‘s GDP per capita is around 46% of the German number (adjusted by purchase power parity)
- However, Poland‘s airports reported in 2010 only 12% of overall passengers
compared to Germany (20.6 Mn : 167 Mn)
- With the same travel / buying behaviour like in Germany, Polish citizens would create
36 Mn departures (wealth-level-adjusted)
Consequently, there is a gap of > 15 Mn passengers or +74% to be tackled in the future
Source: Eurostat, www.finanzwirtschafter.de, Statistics of International Monetary Funds, www.skyscrapercity.com
BACKUP

Presentation Cracow Aviation Conference, 03/2011Page 4
Franke Aviation & Transportation Consulting
COPYRIGHT 2010 WWW.FRANKE-AVIATION.COM
Although Polish air traffic sector is highly concentrated on top 8 airports, regional airports account for 55% of total passengers
Poznan
Gdansk
Wroclaw
Katowice
LodzZielonaGora
SzczecinSzczytno
Bydogszcz
Rzeszow
Warsaw /CAP
Concentration of passengers at polish airports(2008 in % of total PAX)
0%
20%
40%
60%
80%
100%
Wars
awKra
kow
Katow
ice
Gda
nsk
Wro
claw
Pozna
n
Lodz
Jasi
onka
Gol
enio
wByd
ogsz
czZie
lona
Oth
ers
Top 4 airports~81%
Top 8 airports~97%
Total PAX: 20.7 mn
Source: CAP Project of Polish Ministry of Infrastructure, Oliver Wyman, PwC, DFS, MKmetric
1
Top 6 airports~94%
WAW(45%)
RegionalAirports
(55%)
Krakow
Presentation Cracow Aviation Conference, 03/2011Page 5
Franke Aviation & Transportation Consulting
COPYRIGHT 2010 WWW.FRANKE-AVIATION.COM
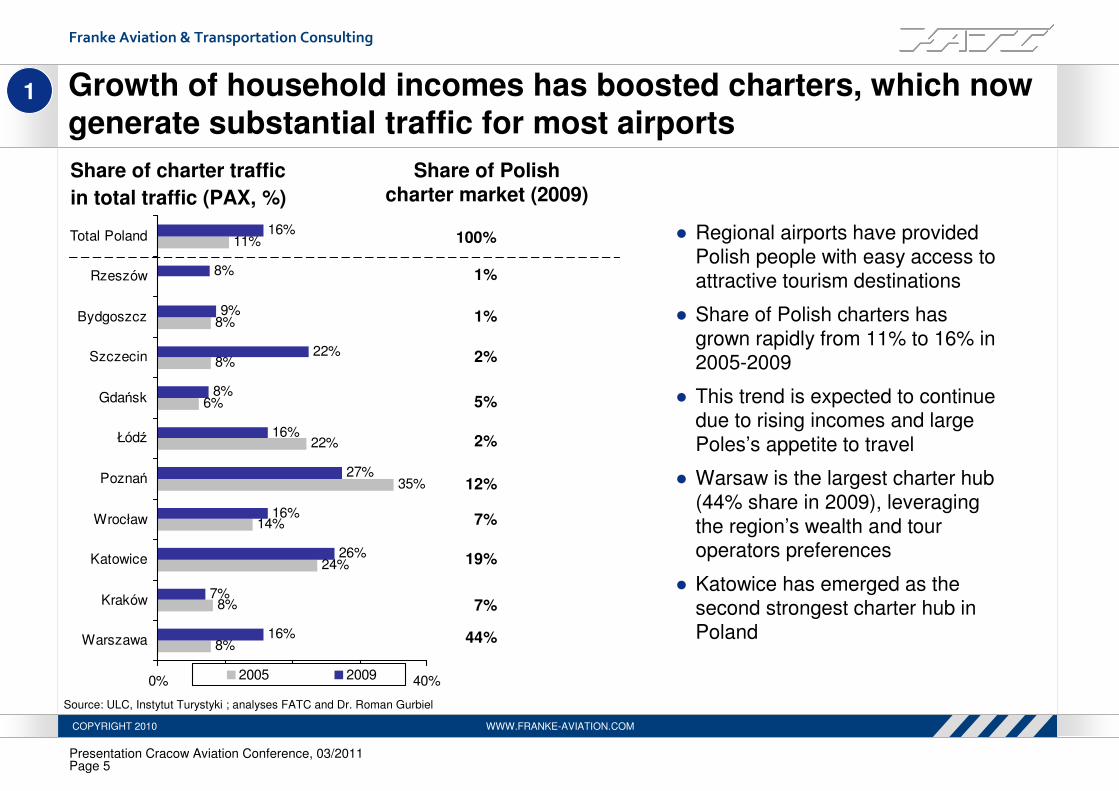
Growth of household incomes has boosted charters, which nowgenerate substantial traffic for most airports
1
Source: ULC, Instytut Turystyki ; analyses FATC and Dr. Roman Gurbiel
● Regional airports have provided Polish people with easy access to attractive tourism destinations
● Share of Polish charters has grown rapidly from 11% to 16% in 2005-2009
● This trend is expected to continue due to rising incomes and large Poles’s appetite to travel
● Warsaw is the largest charter hub (44% share in 2009), leveraging the region’s wealth and tour operators preferences
● Katowice has emerged as the second strongest charter hub in Poland
8%
8%
24%
14%
35%
22%
6%
8%
8%
11%
16%
7%
26%
16%
27%
16%
8%
22%
9%
8%
16%
0% 10% 20% 30% 40%
Warszawa
Kraków
Katowice
Wrocław
Poznań
Łódź
Gdańsk
Szczecin
Bydgoszcz
Rzeszów
Total Poland
2005 2009
Share of charter traffic
in total traffic (PAX, %)
44%
7%
19%
7%
12%
2%
5%
2%
1%
1%
Share of Polishcharter market (2009)
100%
Presentation Cracow Aviation Conference, 03/2011Page 6
Franke Aviation & Transportation Consulting
COPYRIGHT 2010 WWW.FRANKE-AVIATION.COM
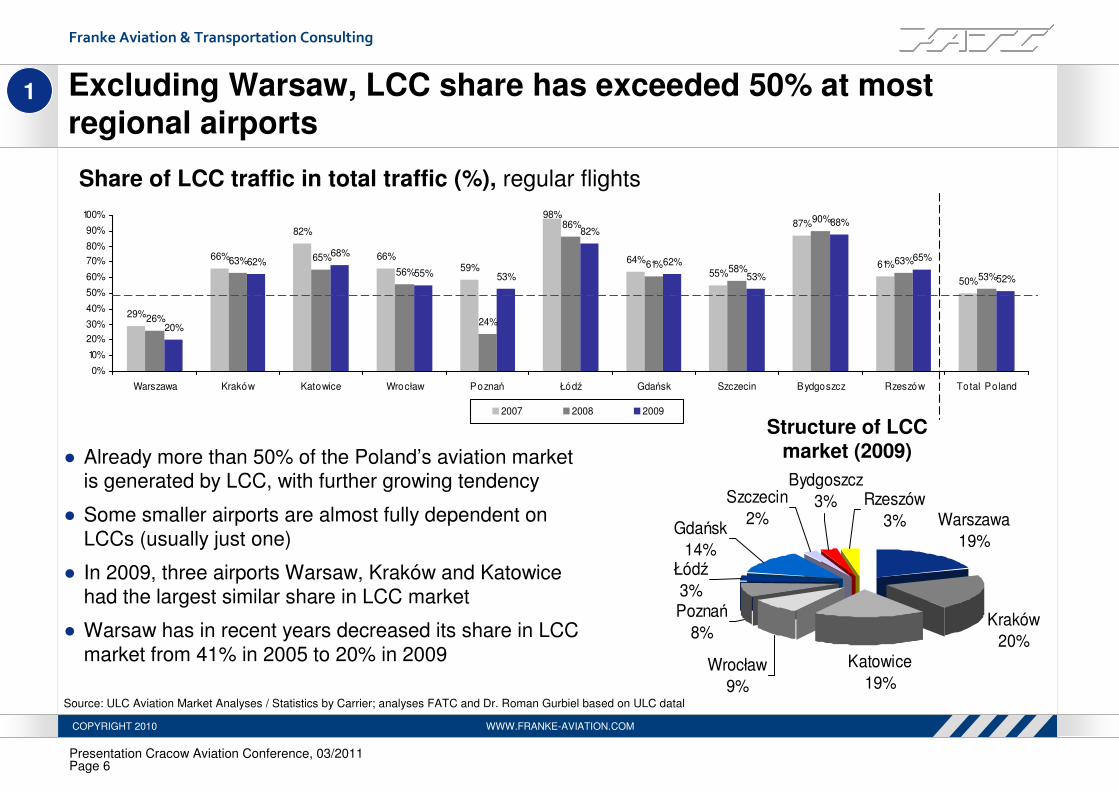
● Already more than 50% of the Poland’s aviation marketis generated by LCC, with further growing tendency
● Some smaller airports are almost fully dependent onLCCs (usually just one)
● In 2009, three airports Warsaw, Kraków and Katowice had the largest similar share in LCC market
● Warsaw has in recent years decreased its share in LCC market from 41% in 2005 to 20% in 2009
29%
66%
82%
66%59%
98%
64%
55%
87%
61%
50%
26%
63% 65%
56%
24%
86%
61% 58%
90%
63%
53%
20%
62%68%
55% 53%
82%
62%
53%
88%
65%
52%
0%
10%
20%
30%
40%
50%
60%
70%
80%
90%
100%
Warszawa Kraków Katowice Wrocław Poznań Łódź Gdańsk Szczecin Bydgoszcz Rzeszów Total Poland
2007 2008 2009
Share of LCC traffic in total traffic (%), regular flights
Warszawa
19%
Kraków
20%Katowice
19%
Łódź
3%
Rzeszów
3%Gdańsk
14%
Bydgoszcz
3%Szczecin
2%
Poznań
8%
Wrocław
9%
Structure of LCCmarket (2009)
Excluding Warsaw, LCC share has exceeded 50% at mostregional airports
1
Source: ULC Aviation Market Analyses / Statistics by Carrier; analyses FATC and Dr. Roman Gurbiel based on ULC datal
Presentation Cracow Aviation Conference, 03/2011Page 7
Franke Aviation & Transportation Consulting
COPYRIGHT 2010 WWW.FRANKE-AVIATION.COM
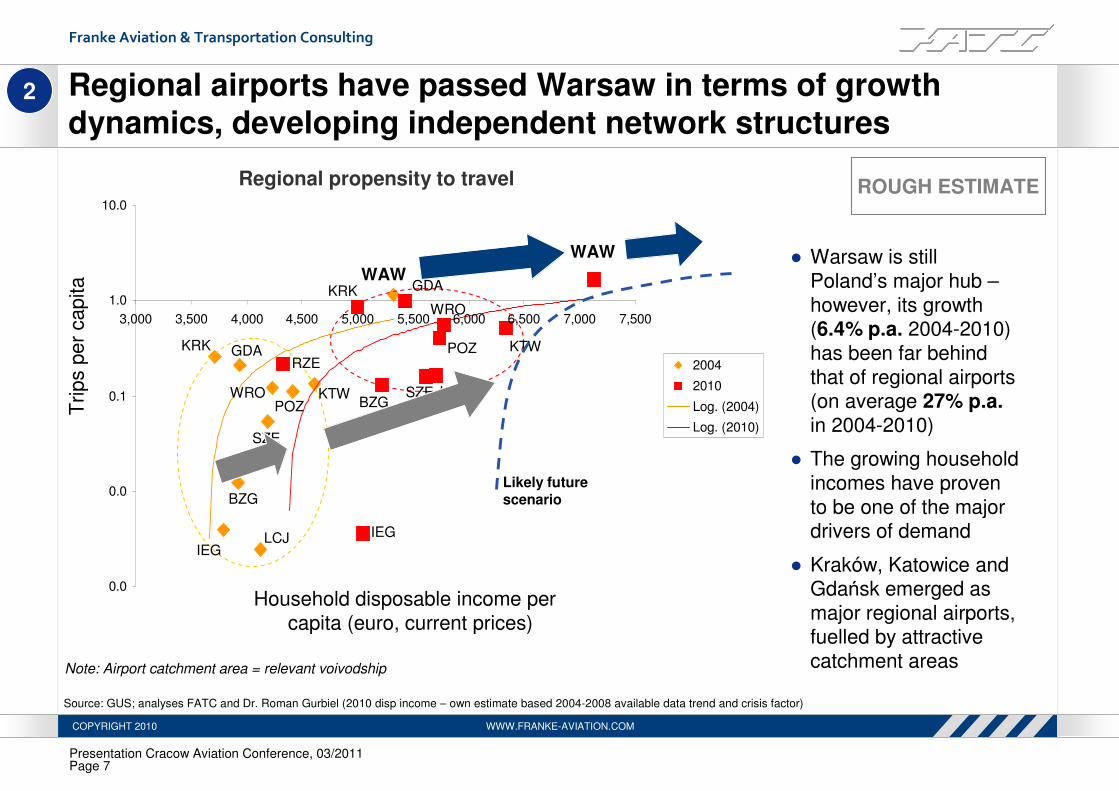
Regional airports have passed Warsaw in terms of growth dynamics, developing independent network structures
2
● Warsaw is still Poland’s major hub –however, its growth (6.4% p.a. 2004-2010) has been far behind that of regional airports(on average 27% p.a.in 2004-2010)
● The growing household incomes have provento be one of the majordrivers of demand
● Kraków, Katowice and Gdańsk emerged as major regional airports, fuelled by attractive catchment areas
Source: GUS; analyses FATC and Dr. Roman Gurbiel (2010 disp income – own estimate based 2004-2008 available data trend and crisis factor)
Note: Airport catchment area = relevant voivodship
ROUGH ESTIMATE
0.0
0.0
0.1
1.0
10.0
3,000 3,500 4,000 4,500 5,000 5,500 6,000 6,500 7,000 7,500
2004
2010
Log. (2004)
Log. (2010)
Household disposable income per capita (euro, current prices)
Trips p
er
capita WAW
WAW
IEG
IEGLCJ
LCJ
KTW
WRO
POZ
KRK GDA
SZEBZG
RZE
KRK GDA
BZG
SZE
WROPOZ
KTW
Likely future scenario
Regional propensity to travel

Presentation Cracow Aviation Conference, 03/2011Page 8
Franke Aviation & Transportation Consulting
COPYRIGHT 2010 WWW.FRANKE-AVIATION.COM
Even if LOT boosts its transfer share in WAW / CAP, the growth dynamics of regional airports will be untapped
2
Source: CAP Project of Polish Ministry of Infrastructure, Oliver Wyman, PwC, DFS, MKmetric
2010 2035
2010 2035
Scenario 1: LOT‘s (low) transfer share remainsconstant (<8%)
Scenario 2: LOT boosts ist transfer share (30%)
20 Mn Pax
20 Mn Pax
+4% p.a.
+4% p.a.
53 Mn Pax
53 Mn Pax
LOT: 7 Mn
(of which
transfer PAX
≈ 600 thsd.)
LOT: 18.6 Mn
(of which
transfer PAX
≈ 1.5 Mn)
LOT: 22.7 Mn(of which
transfer PAX
≈ 5.6 Mn)
● Regional airports had 11…12
Mn passengers in 2010
● LOT is very focused on WAW and contributes only a minor
share to regional airports’ paxnumber
● At 4% annual growth and a
constant transfer share of LOT, regional airports would see
additional 20 Mn pax in 2035
● Assuming that LOT could win additional passengers through
boosting its transfer share in WAW / CAP to 30%, some
passengers could be lost for regional airports
● Even if they would lose all
transfer passengers, they would still see additional 16 Mn pax in 2035 (+ 3.4% p.a.)
ROUGH ESTIMATE
Presentation Cracow Aviation Conference, 03/2011Page 9
Franke Aviation & Transportation Consulting
COPYRIGHT 2010 WWW.FRANKE-AVIATION.COM
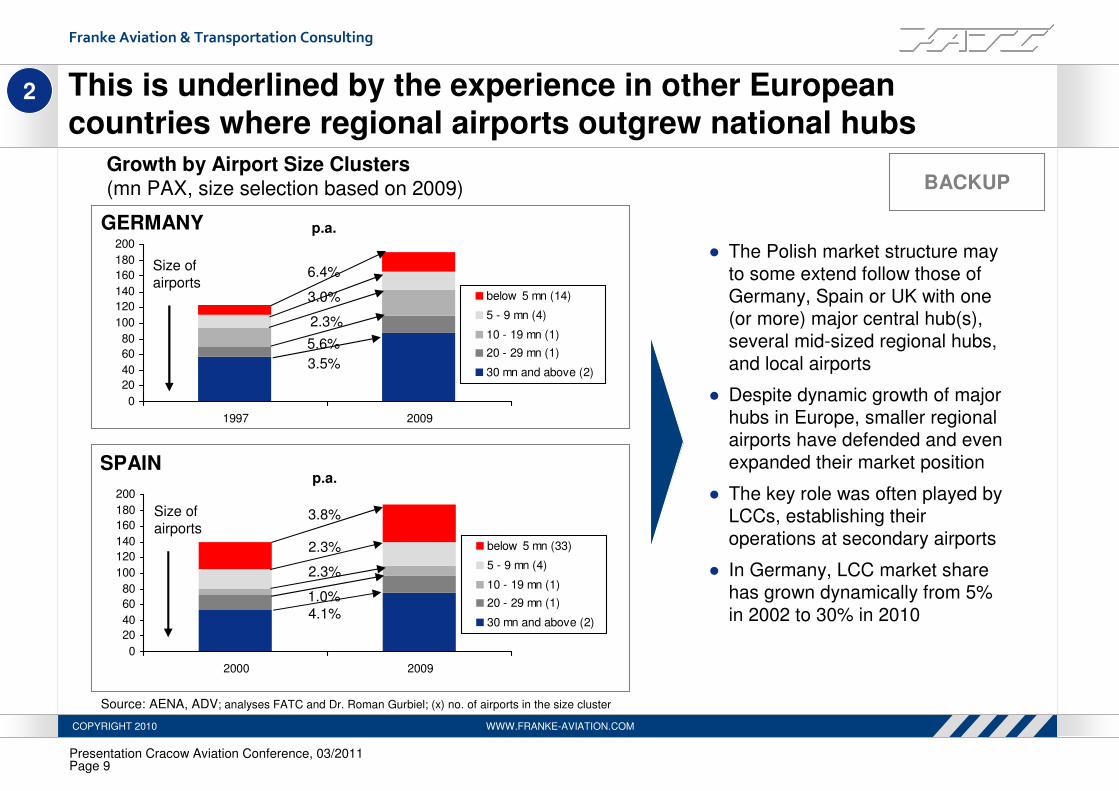
This is underlined by the experience in other European countries where regional airports outgrew national hubs
2
Source: AENA, ADV; analyses FATC and Dr. Roman Gurbiel; (x) no. of airports in the size cluster
GERMANY
SPAIN
● The Polish market structure may to some extend follow those of
Germany, Spain or UK with one(or more) major central hub(s),
several mid-sized regional hubs,
and local airports
● Despite dynamic growth of major
hubs in Europe, smaller regional airports have defended and even
expanded their market position
● The key role was often played by LCCs, establishing their
operations at secondary airports
● In Germany, LCC market share has grown dynamically from 5%
in 2002 to 30% in 2010
0
20
40
60
80
100
120
140
160
180
200
2000 2009
below 5 mn (33)
5 - 9 mn (4)
10 - 19 mn (1)
20 - 29 mn (1)
30 mn and above (2)
p.a.
3.8%
2.3%
2.3%
1.0%
4.1%
0
20
40
60
80
100
120
140
160
180
200
1997 2009
below 5 mn (14)
5 - 9 mn (4)
10 - 19 mn (1)
20 - 29 mn (1)
30 mn and above (2)
p.a.
6.4%
3.0%
2.3%
5.6%
3.5%
Growth by Airport Size Clusters(mn PAX, size selection based on 2009) BACKUP
Size of
airports
Size of
airports
Presentation Cracow Aviation Conference, 03/2011Page 10
Franke Aviation & Transportation Consulting
COPYRIGHT 2010 WWW.FRANKE-AVIATION.COM
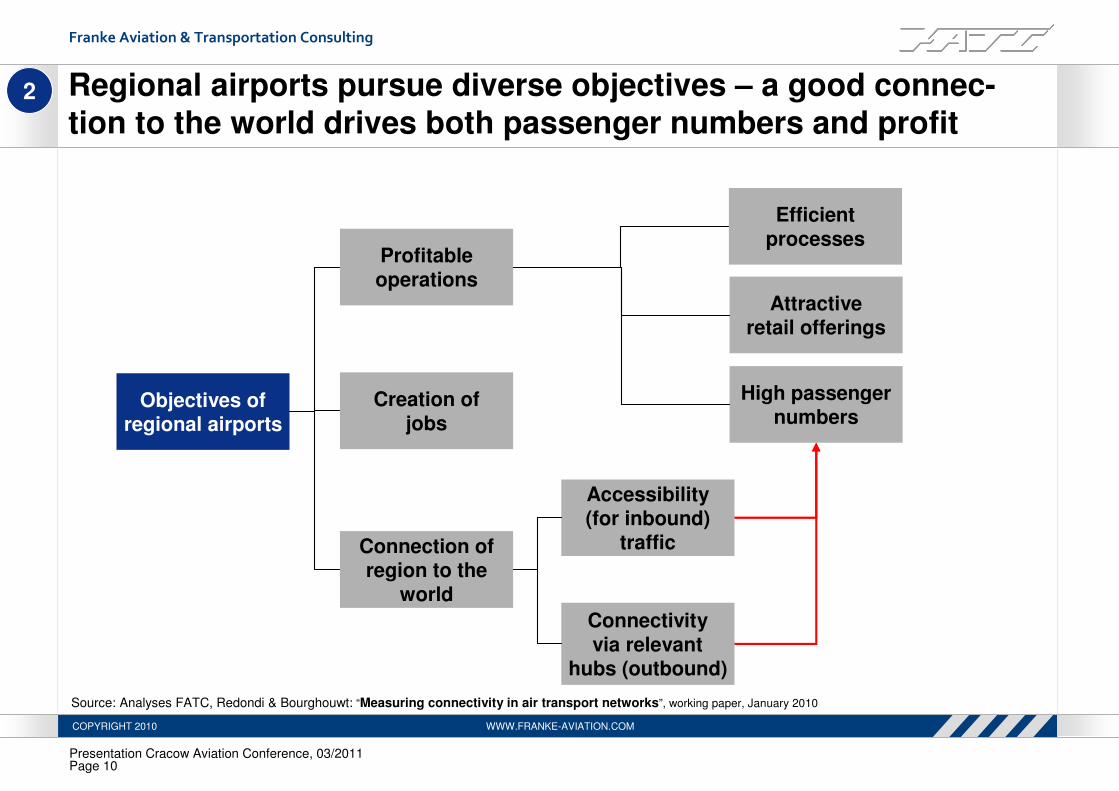
Regional airports pursue diverse objectives – a good connec-tion to the world drives both passenger numbers and profit
2
Objectives ofregional airports
Profitableoperations
Creation ofjobs
Connection ofregion to the
world
High passengernumbers
Attractiveretail offerings
Connectivityvia relevant
hubs (outbound)
Accessibility(for inbound)
traffic
Efficientprocesses
Source: Analyses FATC, Redondi & Bourghouwt: “Measuring connectivity in air transport networks”, working paper, January 2010
Presentation Cracow Aviation Conference, 03/2011Page 11
Franke Aviation & Transportation Consulting
COPYRIGHT 2010 WWW.FRANKE-AVIATION.COM
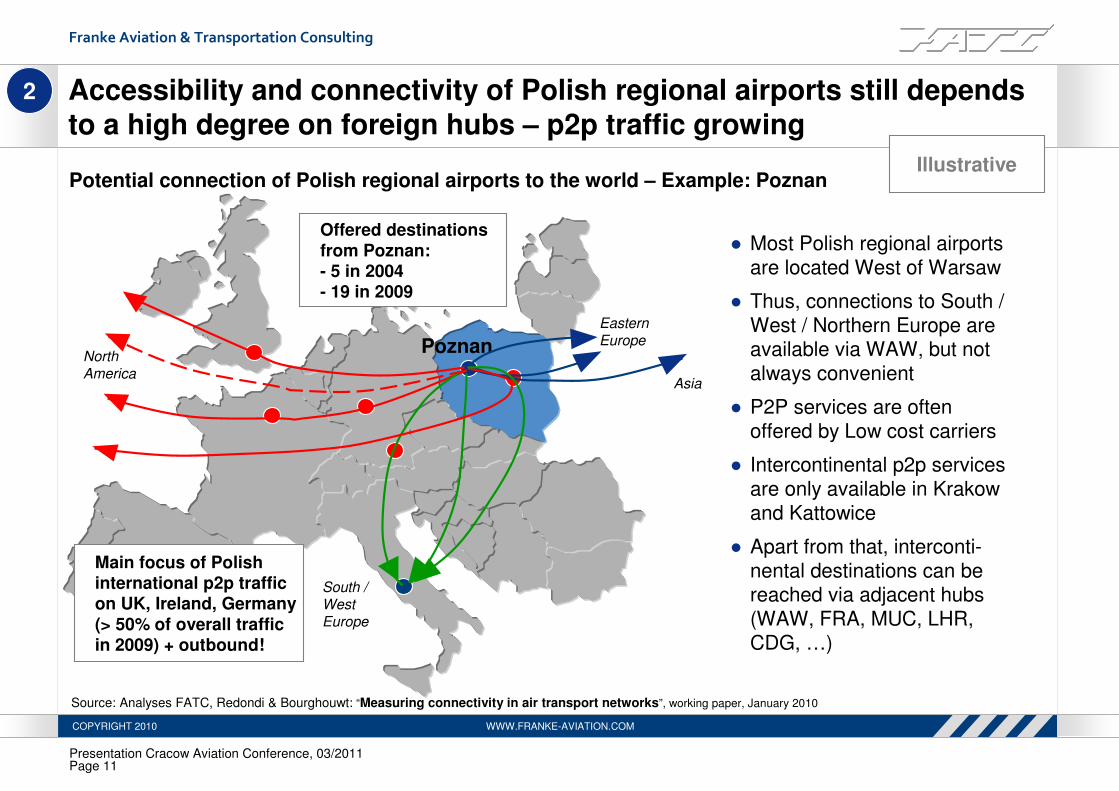
Accessibility and connectivity of Polish regional airports still dependsto a high degree on foreign hubs – p2p traffic growing
Poznan
Asia
Eastern
EuropeNorth
America
South /
West
Europe
IllustrativePotential connection of Polish regional airports to the world – Example: Poznan
● Most Polish regional airportsare located West of Warsaw
● Thus, connections to South / West / Northern Europe areavailable via WAW, but notalways convenient
● P2P services are oftenoffered by Low cost carriers
● Intercontinental p2p servicesare only available in Krakow and Kattowice
● Apart from that, interconti-nental destinations can bereached via adjacent hubs(WAW, FRA, MUC, LHR, CDG, …)
Source: Analyses FATC, Redondi & Bourghouwt: “Measuring connectivity in air transport networks”, working paper, January 2010
2
Offered destinationsfrom Poznan:- 5 in 2004- 19 in 2009
Main focus of Polishinternational p2p trafficon UK, Ireland, Germany(> 50% of overall trafficin 2009) + outbound!

Presentation Cracow Aviation Conference, 03/2011Page 12
Franke Aviation & Transportation Consulting
COPYRIGHT 2010 WWW.FRANKE-AVIATION.COM
Further growth of wealth level and air traffic demand in Poland will in any case foster expansion of regional airports
2
● Total number of offered destinations from regional airports has increased from
34 to 135 (2004-2009)
(summer season; winterseason: from 12 to 132)
● Connection to the worldand growth of passengernumbers go hand in hand
● Even an increase of transfer
traffic via adjacent hubs(WAW / CAP, BBI, FRA, …)
should not harm O&D demand
● O&D network development
will however strongly depend on the local demand
32
913
4 5 2 1
68
30 30
21 19 18
5 5 4 3
0
10
20
30
40
50
60
70
80
Warszawa Kraków Katowice Gdańsk Poznań Wrocław Bydgoszcz Rzeszów Łódź Szczecin
Summer 2004 Summer 2009
Offered Destinations (regular flights, summer season, 2004 vs. 2009)
WAW 2004
level
Likely future scenario
Major
Poland’s hub;
increasing
role of transfer
and intercont
traffic
Stand-alone
O&D spoke,
potential for
some transfer
traffic in future
Medium O&D
operations,
hub-feeding
Niche O&D
operations,
hub-feeding
Source: ULC; analyses FATC and Dr. Roman Gurbiel
BACKUP
Presentation Cracow Aviation Conference, 03/2011Page 13
Franke Aviation & Transportation Consulting
COPYRIGHT 2010 WWW.FRANKE-AVIATION.COM
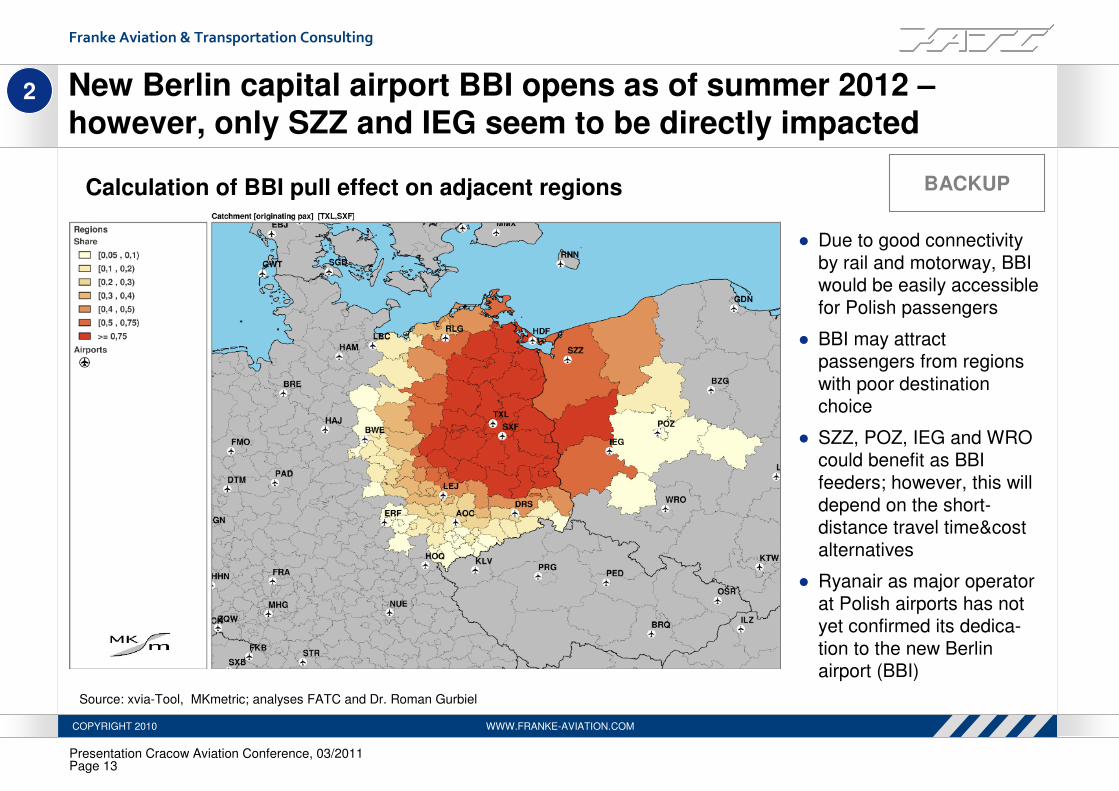
New Berlin capital airport BBI opens as of summer 2012 –however, only SZZ and IEG seem to be directly impacted
2
Source: xvia-Tool, MKmetric; analyses FATC and Dr. Roman Gurbiel
BACKUP
● Due to good connectivity
by rail and motorway, BBI would be easily accessible
for Polish passengers
● BBI may attractpassengers from regions
with poor destination choice
● SZZ, POZ, IEG and WRO could benefit as BBI
feeders; however, this will
depend on the short-distance travel time&cost
alternatives
● Ryanair as major operator
at Polish airports has notyet confirmed its dedica-
tion to the new Berlin airport (BBI)
Calculation of BBI pull effect on adjacent regions
Presentation Cracow Aviation Conference, 03/2011Page 14
Franke Aviation & Transportation Consulting
COPYRIGHT 2010 WWW.FRANKE-AVIATION.COM
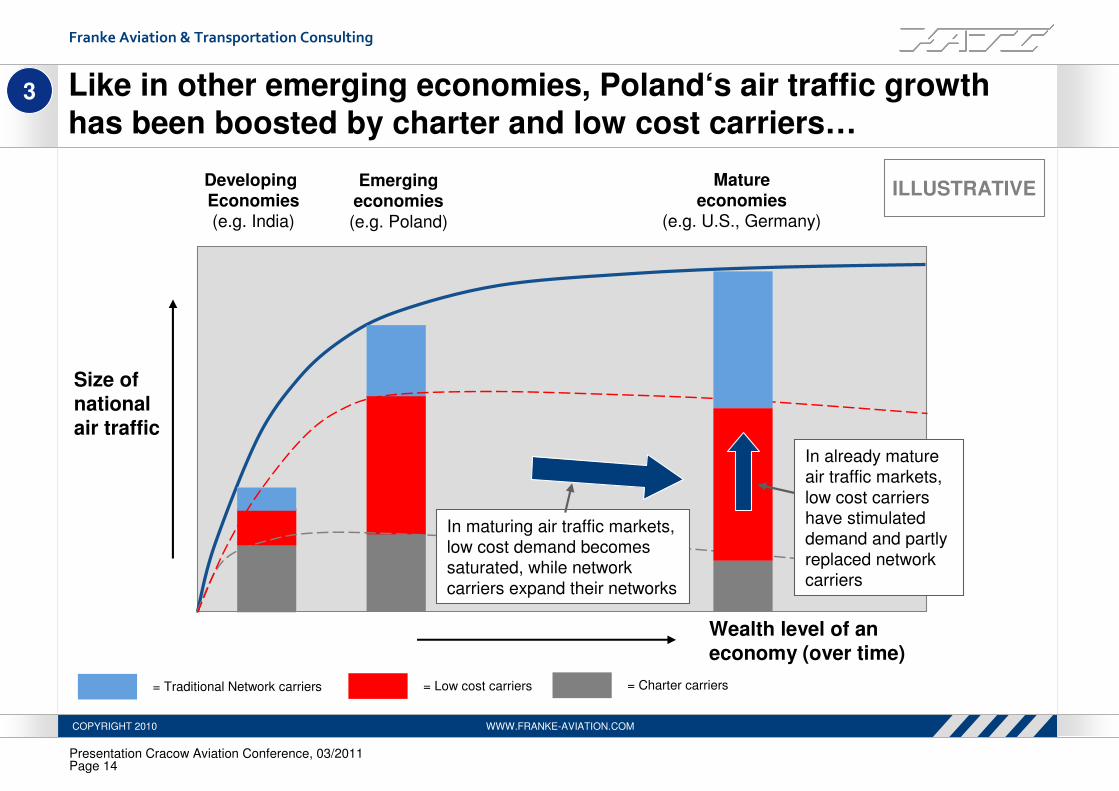
Like in other emerging economies, Poland‘s air traffic growth has been boosted by charter and low cost carriers…
= Traditional Network carriers = Low cost carriers = Charter carriers
3
Matureeconomies
(e.g. U.S., Germany)
Size ofnationalair traffic
Wealth level of aneconomy (over time)
Emergingeconomies(e.g. Poland)
In maturing air traffic markets, low cost demand becomessaturated, while network
carriers expand their networks
In already matureair traffic markets,
low cost carriershave stimulateddemand and partly
replaced networkcarriers
ILLUSTRATIVEDevelopingEconomies(e.g. India)
Presentation Cracow Aviation Conference, 03/2011Page 15
Franke Aviation & Transportation Consulting
COPYRIGHT 2010 WWW.FRANKE-AVIATION.COM
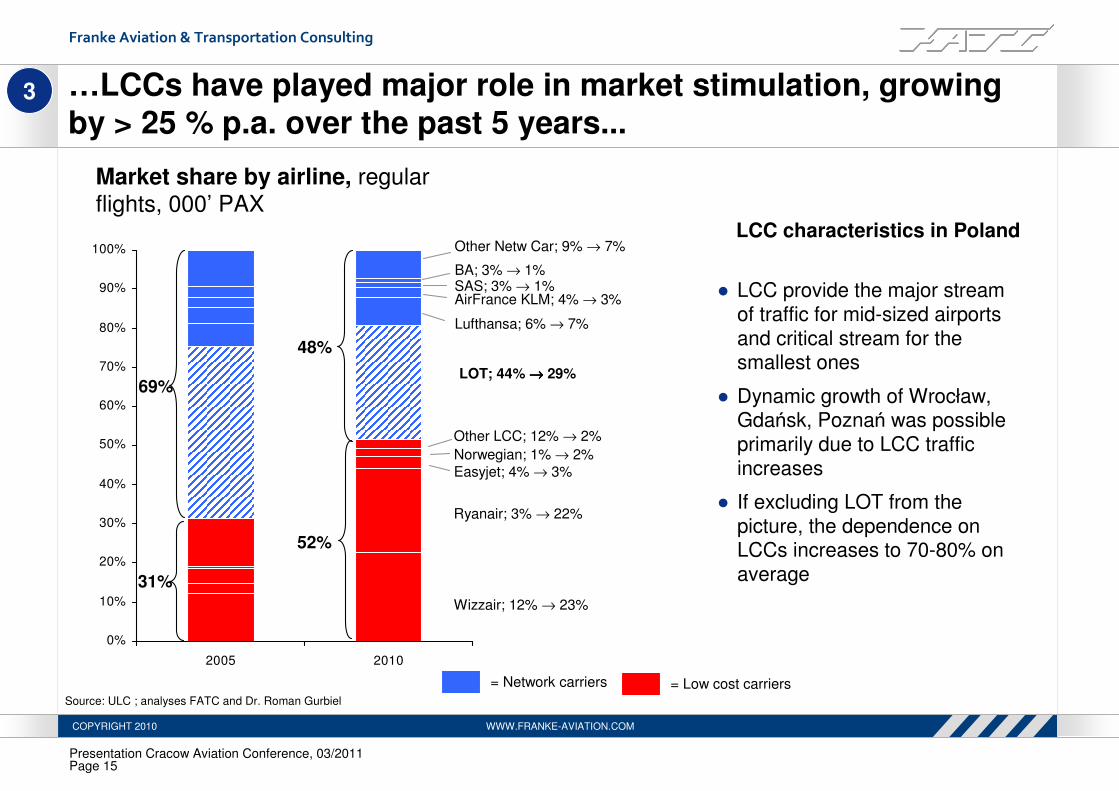
…LCCs have played major role in market stimulation, growingby > 25 % p.a. over the past 5 years...
3
Market share by airline, regular flights, 000’ PAX
Source: ULC ; analyses FATC and Dr. Roman Gurbiel
LCC characteristics in Poland
0%
10%
20%
30%
40%
50%
60%
70%
80%
90%
100%
2005 2010
Other LCC; 12% → 2%
Norwegian; 1% → 2%
Easyjet; 4% → 3%
Ryanair; 3% → 22%
Wizzair; 12% → 23%
BA; 3% → 1%SAS; 3% → 1%AirFrance KLM; 4% → 3%
Lufthansa; 6% → 7%
LOT; 44% →→→→ 29%
Other Netw Car; 9% → 7%
69%
31%
52%
48%
= Network carriers = Low cost carriers
● LCC provide the major stream of traffic for mid-sized airports and critical stream for the smallest ones
● Dynamic growth of Wrocław, Gdańsk, Poznań was possible primarily due to LCC traffic increases
● If excluding LOT from the picture, the dependence on LCCs increases to 70-80% on average

Presentation Cracow Aviation Conference, 03/2011Page 16
Franke Aviation & Transportation Consulting
COPYRIGHT 2010 WWW.FRANKE-AVIATION.COM
…however, Poland‘s flag carrier LOT has still considerablegrowth prospects
3
Source: ULC ; analyses FATC and Dr. Roman Gurbiel
Growth prospects for LOT (and other network carriers)
• LOT‘s national market share has steadily decreased
• Up to now, Polish people are still reluctant – despite increasing wealth level
– to pay premium fares for air travel � they love Low cost carriers
• Thus, LOT focuses on few international markets with limited intercontinentaluplift, supported by domestic network
• With an expected further growth of wealth level, Polish citizens are likely to demand more air travel capacities, both nationally and internationally
• Network carriers like LOT are suited to satisfy this growing demand, particularly in the premium and intercontinental segment

Presentation Cracow Aviation Conference, 03/2011Page 17
Franke Aviation & Transportation Consulting
COPYRIGHT 2010 WWW.FRANKE-AVIATION.COM
There are no “good” or “bad” airlines – both Low cost and Network carriers can contribute to the development of regional airports
3
Low cost carriers Network carriers
Wizz Air, easyJet, Ryanair,Germanwings, …
LOT, Lufthansa, Air France /KLM, British Airways, …
Examples in Poland
• Presence: strong (> 60% market share)
• Commitment: mediocre (most
stations – except Wizz Air) are abroad
• Presence: poor (some hub feed;
international flights only in KRK + KTW)
• Commitment: medium (some local
planes and jobs)
Presence in / commit-ment to regional airports(local station � jobs)
• Domestic: most major city pairs• Continental: numerous routes
• Intercontinental: None
• Domestic: some city pairs + feedertraffic to WAW
• Continental: some routes P2P,more via WAW, FRA, MUC, CDG
Intercontinental: a few routes viaWAW, FRA, MUC, CDG, …
Destination portfolio(connection to the world)
• Medium (additional bases in Poland
+ European city pairs)
• High (stimulation of additional – premium –
demand for P2P and transfer traffic, esp.
Internationally)
Passenger potential(growth options)
• Airport fees: poor (LCCs are very tough
bargainers)
• Retail: limited (bargainer passengers)
• Airport fees: good• Retail: good (� esp. International
passengers, inbound)
Economic potential(fees and revenues)
Characteristics of Low cost & Network carriers from the perspective of regional airports

Presentation Cracow Aviation Conference, 03/2011Page 18
Franke Aviation & Transportation Consulting
COPYRIGHT 2010 WWW.FRANKE-AVIATION.COM
Example LCC: Ryanair uses a uniform approach to develop itsnetwork in Poland, leveraging e.g. large commuter flows
3
Kraków
Wrocław
Gdańsk
Poznań
Rzeszów
Szczecin
Bydgoszcz
Katowice
Łódź
Thin network is the result of strong Wizzair position
Source: Ryanair (as of March 2011)
BACKUP
Presentation Cracow Aviation Conference, 03/2011Page 19
Franke Aviation & Transportation Consulting
COPYRIGHT 2010 WWW.FRANKE-AVIATION.COM
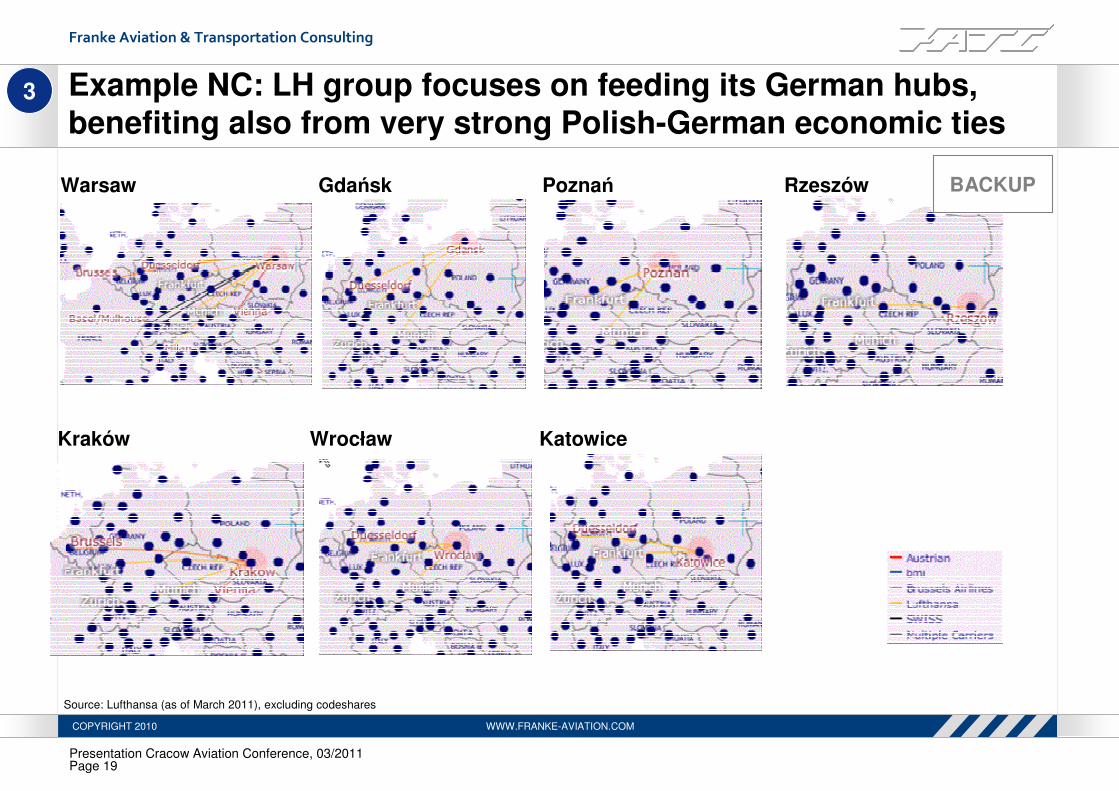
Example NC: LH group focuses on feeding its German hubs, benefiting also from very strong Polish-German economic ties
3
Warsaw
Wrocław
Gdańsk Poznań Rzeszów
KatowiceKraków
Source: Lufthansa (as of March 2011), excluding codeshares
BACKUP
Presentation Cracow Aviation Conference, 03/2011Page 20
Franke Aviation & Transportation Consulting
COPYRIGHT 2010 WWW.FRANKE-AVIATION.COM
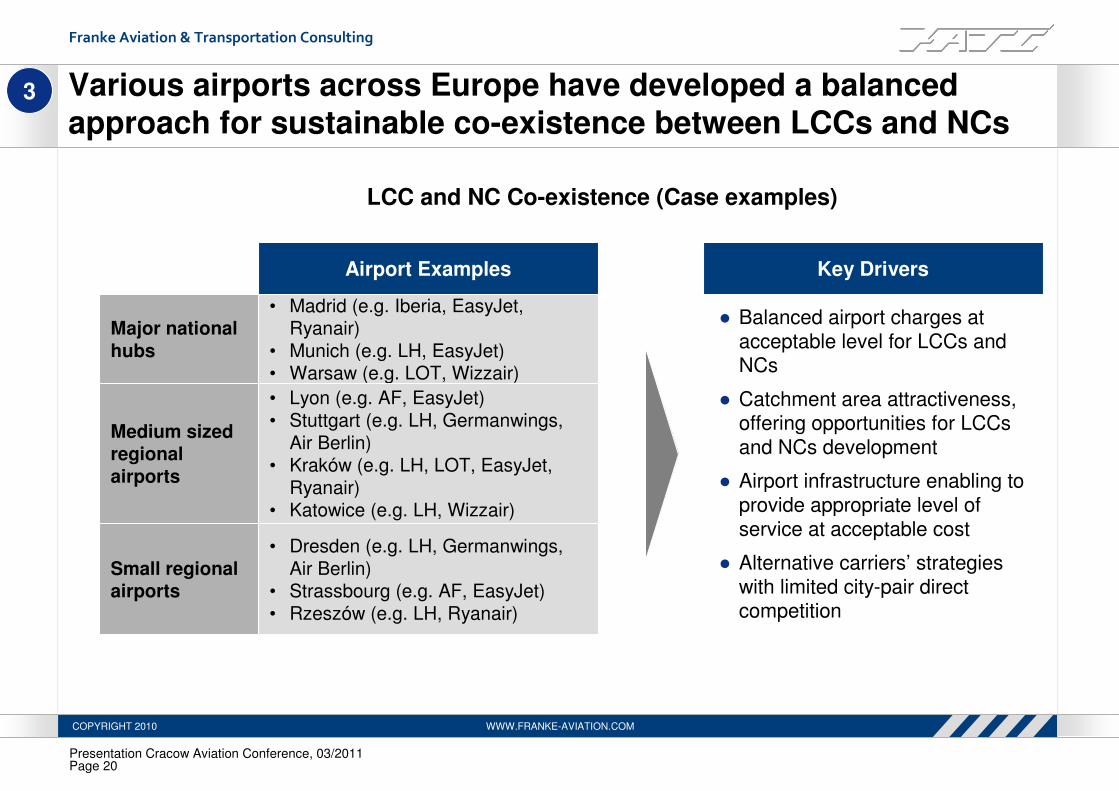
Various airports across Europe have developed a balancedapproach for sustainable co-existence between LCCs and NCs
3
Airport Examples
• Madrid (e.g. Iberia, EasyJet, Ryanair)
• Munich (e.g. LH, EasyJet)• Warsaw (e.g. LOT, Wizzair)
Major national hubs
• Lyon (e.g. AF, EasyJet)
• Stuttgart (e.g. LH, Germanwings,
Air Berlin)• Kraków (e.g. LH, LOT, EasyJet,
Ryanair)• Katowice (e.g. LH, Wizzair)
Medium sized regional airports
• Dresden (e.g. LH, Germanwings,
Air Berlin)• Strassbourg (e.g. AF, EasyJet)
• Rzeszów (e.g. LH, Ryanair)
Small regional airports
LCC and NC Co-existence (Case examples)
● Balanced airport charges at acceptable level for LCCs and NCs
● Catchment area attractiveness, offering opportunities for LCCs and NCs development
● Airport infrastructure enabling to provide appropriate level of service at acceptable cost
● Alternative carriers’ strategies with limited city-pair direct competition
Key Drivers

Presentation Cracow Aviation Conference, 03/2011Page 21
Franke Aviation & Transportation Consulting
COPYRIGHT 2010 WWW.FRANKE-AVIATION.COM
Assuming that both LCCs and NCs will further prosper in Poland, regional airports should pursue a phased approach
4
Further expansion of domesticand European P2P traffic
Development of high-yielddemand and respective
service offerings
Build-up of intercontinentalconnections (via WAW / CAP or
other hubs)
Build-up of intercontinentalp2p services
Step 1
Step 2
Step 3
Step 4
Contribution of…
LCCs Network carriers
Four steps towards further growth
• Strongcontribution
• Poor (outsidetraditional LCC strike zone)
• Feed to networkcarriers withintercontinentalservices?
• Today: none(future: long-haulLCC models?)
• Medium (opportunisticdevelopment)
• Considerablecontribution
• Considerablecontribution (in the course of O&D growth)
• Opportunisticdevelopment(depends onO&D demand)
Presentation Cracow Aviation Conference, 03/2011Page 22
Franke Aviation & Transportation Consulting
COPYRIGHT 2010 WWW.FRANKE-AVIATION.COM
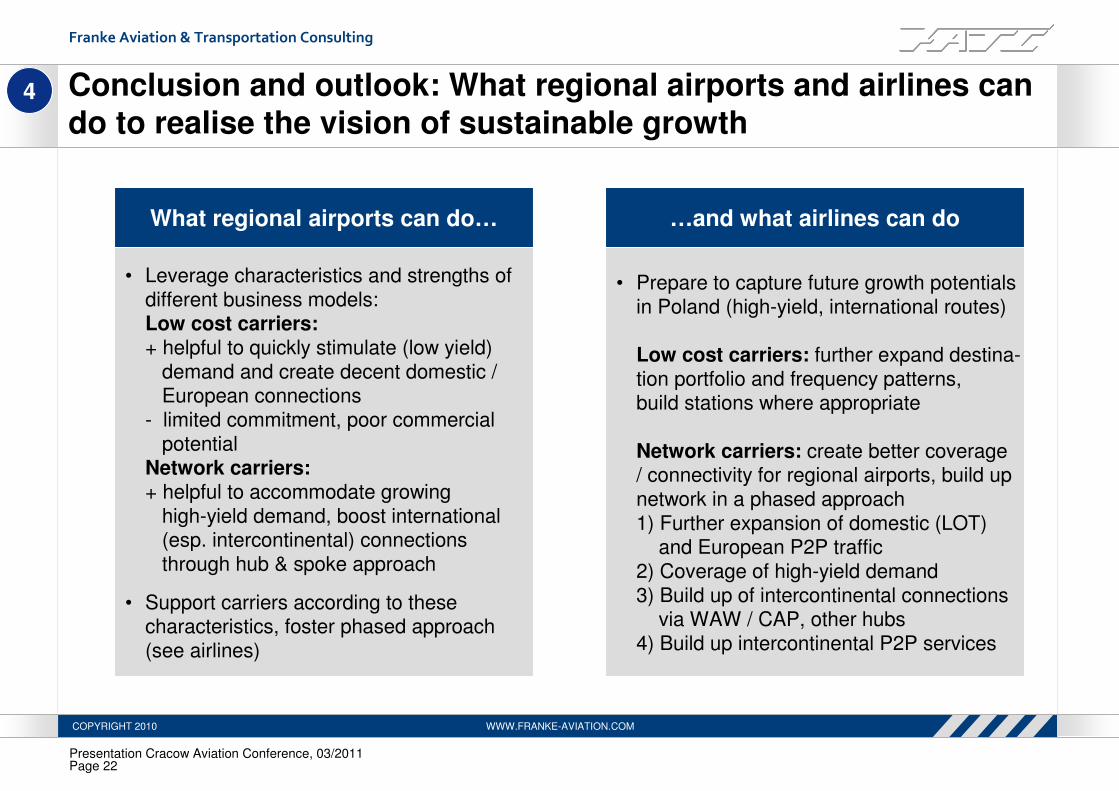
Conclusion and outlook: What regional airports and airlines cando to realise the vision of sustainable growth
4
What regional airports can do… …and what airlines can do
• Leverage characteristics and strengths ofdifferent business models:Low cost carriers:+ helpful to quickly stimulate (low yield)
demand and create decent domestic /European connections
- limited commitment, poor commercialpotential
Network carriers:+ helpful to accommodate growing
high-yield demand, boost international(esp. intercontinental) connectionsthrough hub & spoke approach
• Support carriers according to thesecharacteristics, foster phased approach(see airlines)
• Prepare to capture future growth potentialsin Poland (high-yield, international routes)
Low cost carriers: further expand destina-tion portfolio and frequency patterns,build stations where appropriate
Network carriers: create better coverage/ connectivity for regional airports, build upnetwork in a phased approach1) Further expansion of domestic (LOT)
and European P2P traffic2) Coverage of high-yield demand3) Build up of intercontinental connections
via WAW / CAP, other hubs4) Build up intercontinental P2P services
Presentation Cracow Aviation Conference, 03/2011Page 23
Franke Aviation & Transportation Consulting
COPYRIGHT 2010 WWW.FRANKE-AVIATION.COM
…THANK YOU VERY MUCH FOR YOUR ATTENTION!!!
Dr. Markus FrankeOwner, Senior Advisor
Franke Aviation &
Transportation Consulting
Von-Stauffenberg-Str. 10
D-41352 Korschenbroich
+49 175 2905004 (mob.)[email protected]
www.franke-aviation.com
Selected aviation clients of FATC / Dr Franke