Embed Size (px)
Citation preview

Chem. Listy 105, s233s416 (2011) PMA 2011 & RubberCon 2011 Contributed Lectures
s260
CONTRIBUTED LECTURES
CL-01 CONSTITUTIVE EQUATION FOR RUBBER ELAS-TICITY WITH THE CHANGE IN INTERNAL EN-ERGY AND ENTROPY
KEIZO AKUTAGAWA*, SATOSHI HAMATANI, and HIROSHI KADOWAKI Bridgestone corporation, Ogawahigashi-cho, Kodaira-shi, Tokyo, 187-8531, Japan [email protected]
Abstract For the design of the rubber products, the finite element
analysis, FEA, is one of important technique to model the behaviours of rubbers stressed in complex manner. On the other hands, the energy loss properties of tyre compounds are empirically used as important design parameters to satisfy their performances such as rolling resistance, friction and durability. But most of the constitutive equations for FEA are based only on the entropic origin of rubber elasticity and can not describe the energy dissipation process. The purpose of this study is aiming at understanding the origin of the energy loss of the deformed rubbers. The derivation of a constitutive equation is based on the change in both energy and entropy, which represents the non-equilibrium behaviours of rubber in deformation. This equation was derived from the statistical thermodynamics with Hamiltonian equations and it showed a good agreement with the experimental result.
From global warming concern a tyre rolling resistance is
one of the important performances in the tyre industry. In general, tyre rolling resistance is responsible for 10 % of pas-senger car fuel consumption and 20 % in the case of fully loaded heavy trucks1. Approximately 90 % of tyre rolling loss may be attributed to viscoelastic behaviours of the cord and the rubber component of tyre materials1. For tyre tread com-pounds the energy loss properties can be empirically corre-lated with tyre performance characteristics. It has been shown, for example, that the wet traction and the rolling resis-tance are best correlated with the dynamic mechanical loss properties at the temperature of around 0 °C and 60 °C, re-spectively.
For tyre applications the finite element method is one of important tool to model the behaviour of tyre components stressed in a complex manner. Recently this method was ap-plied to the meso-scopic analysis of the filled rubber and it can provide the meso-scopic stress-strain behaviour of rubber phase and filler phase separately2. To carry this out success-fully it was also needed to develop a constitutive equation to represent the stress-strain behaviour of a rubber phase, pref-erably at least up to the glass transition temperature of rubber phase encountered in many tyre tread applications.
The mean energy of a system in thermal equilibrium can be represented by
where Aα is the energy level of the microstate labeled by α and Z is the partition function as a function of temperature.
From the statistical thermodynamics it can be assumed that the energy function of Aα can be described by a function of the Hamiltonians, H.
Aα=f(Hinteracton, Htrans, Hrot ) (2)
where the Hamiltonian for the system can be assumed as a function of temperature and constrains due to stretching the chain molecules with transversal motion, Htrans, rotational motion, Hrot and molecular interaction, Hinteracton.
For the model of the temperature dependence of the rubber elasticity it can be thought of as two distinguishable molecules, each of which can be in either of two different
strain states as shown as follows. The system has 2 2 = 4 microstates. The strain energy
of each molecule can be assumed to be the strain invariants, I1a and I1b, more in one state than in the other state. There has to consider the attractive energy3 or interaction energy term, which lowers the energy of the system by к of the two mole-cules are in the same strain state.
The Helmhortz free energy change of the rubber elastic-ity,ΔA, can be described as4
where ’ is 1/kΔT and n is the number of statistical links be-tween crosslinks. The first term of the equation (3) represents the internal energy of the elasticity and the second term repre-sents the entropy of the rubber elasticity described by the inverse Langevin function5. The theoretical curves showed a good agreement with the experimental results to represent the temperature dependence and strain induced crystallization. This study was partially supported from New Energy and Industrial Technology Development Organization (NEDO).
REFERENCES 1. Willett P. R.: Rubber Chem. Technol. 47, 118 (1974). 2. Akutagawa K., Yamaguchi K., Yamamoto A., Heguri H.,
(1)
V
A ZeA
ZU
log1
a
b
Strain field
„ {aa
bb
Strain field
„ {
(3)
21312
211
'1
'
'1
'1
'1
'
111
12512250
9943
100
3
2
1
13'2cosh
3'2sinh323'2cosh
IIIn
IIn
IN
Ie
IIIeSTUA

Chem. Listy 105, s233s416 (2011) PMA 2011 & RubberCon 2011 Contributed Lectures
s261
Jinnai H., Shinbori Y.: Rubber Chem. Technol. 81, 182 (2008).
3. Thomas A. G.: Trans. Faraday. Soc. 569 (1954). 4. Heinrich G., Kaliske M., Lion A., Reese S.: Proceedings
of the 6th ECCMR, Taylor & Frances, 185 (2010). 5. Wang M. C., Guth E.: J. Chem. Phys. 20, 1144 (1952). CL-02 ENERGIZING CHEMISTRY - LANXESS INNOVATING FOR THE GLOBAL MEGATRENDS FLEMMING BJØRN BJØRNSLEV LANXESS Central Eastern Europe s.r.o, Stetinova 4, 811 06 Bratislava, Slovakia [email protected]
Tomorrow's world will be shaped, above all, by the four megatrends: mobility, urbanization, a responsible use of the precious resource water and the provision of enough food to feed the global population. The chemicals industry has al-ready developed innovative products to serve these mega-trends, ranging from fuel-saving tires to the removal of arse-nic from drinking water.
CL-03 KINETICS OF THE SILICA-SILANE REACTION ANKE BLUME Evonik Degussa GmbH, Harry-Kloepfer-Str. 1, 50997 Köln [email protected] Abstract
The introduction of the silica/silane system in the tire
industry has changed the demands of the mixing process dra-matically. Thenceforth, the rubber manufacturers have to control a chemical reaction during the mixing process. Only a detailed knowledge of the influencing parameter will enable them to gain an optimum silanization of the silica surface and afterwards a more controlled linkage to the polymer. This study was carried out to determine the reaction kinetic of different silanes. It is shown that varying functional groups at the silane have a big influence on the rate of reaction of the silica-silane coupling.
Introduction The increasing extension of the use of the silica/silane
technology in tires implies that rubber manufacturers have to control to a greater extent a chemical reaction during the mix-ing process. Only a detailed knowledge of the influencing parameter will enable them to gain an optimum silanization of the silica surface and afterwards a more controlled linkage to the polymer. TESPT has been for a long time the standard silane in the tire industry. In order to cover the demands for
further rolling resistance reduction, new silanes like VP Si 363® have been developed. A basic study has been carried out to determine the reaction kinetic of different si-lanes in comparison to TESPT and VP Si 363®. The influence of different functional groups at the silane on the rate of reac-tion of the silica-silane coupling is evaluated.
Scope of the study The kinetic behavior of the reaction of different silanes
with ULTRASIL® 7000 GR was studied with the below de-scribed experimental set-up. The goal of this study was to understand the differences between the mercapto- and an alkylgroup, to clarify the influence of the size and shape of the silane, to identify the different behavior of methoxy and ethoxy and to evaluate the influence of different functional groups.
Experimental set-up The study was carried out in a model system. The rubber
matrix was replaced by decane in order to analyze the reaction between silica and silane without interferences. The detailed experimental set-up is shown in Fig. 1.
The reaction at 120 °C was started by adding the silane to the silica / decane solution. The reaction was stopped ac-cording to a fixed time schedule by freezing the sample in liquid nitrogen. Afterwards, the adsorbed EtOH or MeOH at the silica surface area were desorbed by adding 10 ml DEG-MBE (Diethylenglycol-monobutylether) and analyzed by GC. The amount of remaining silane was analyzed by GC, HPLC or GPC.
The rate of recovery of EtOH were determined by adding different amounts of EtOH to 1 g ULTRASIL® 7000 GR in 10 ml decane without adding silane. The rate of recovery was determined to be ca. 80 % after one hour reaction time at 120 °C. The rate of recovery of MeOH was evaluated in the same way. It is ca. 10 % lower than for EtOH. This has to be taken into account by discussing the maximum of reacted alkoxy groups of a silane.
Furthermore, it was shown that all investigated silanes are stable at 120 °C (measurement of the amount of silane after stirring at 120 °C in decane without silica) and the re-sulting effects were not overlaid by degradation phenome-nons.
Fig. 1. Experimental set-up
1g silica+ 9,5 ml solvent
4 g silane+ 25 ml solvent
120 °C, 30 min
0,5 ml solution
ReactionGC (EtOH, PTEO, OCTEO, VP Si 263®,…)
HPLC (Si 69®)GPC (VP Si 363®,
long alcohol)
120 °C
1g silica+ 9,5 ml solvent
4 g silane+ 25 ml solvent
120 °C, 30 min
0,5 ml solution
ReactionGC (EtOH, PTEO, OCTEO, VP Si 263®,…)
HPLC (Si 69®)GPC (VP Si 363®,
long alcohol)
120 °C

Chem. Listy 105, s233s416 (2011) PMA 2011 & RubberCon 2011 Contributed Lectures
s262
Comparison of mercaptosilanes with alkylsilanes
Different silanes with mercapto function (VP Si 363®
with long dialkoxy-ethoxy-silyl group and VP Si 263® with triethoxy-silyl group) were compared with an experimental alkylsilane (XP Si 303: propyl-dialkoxy-ethoxy-silane with a relation of alkoxy to ethoxy of 2,3:0,7 or 2,9:0,1 respec-tively) and Dynasylan® PTEO (propyltriethoxysilane). The resulting rate of reaction –dc/dt is shown in Fig. 2 versus the remaining concentration c of the silane.
The silane which reacts most slowly is PTEO, the silane which shows the highest reaction rate is VP Si 363®: The ascending order of the reaction rates is the following: PTEO < VP Si 263® = Si 303 < VP Si 363®. This shows that the chemical structure of the whole silane influences its kinetic behavior although all molecules react via the triethoxy-group. The presence of a SH-group or a long alkoxy-group increases the rate of reaction in comparison to an alkyl-group. The pres-ence of a SH- and a long alkoxy-group enhances the rate of reaction most significantly. An explanation for the higher rate of reaction of a mercaptosilane could be the additional ad-sorption possibility to the silanol group of the silica not only via the ethoxy group but also via thiol. And an adsorption via thiol could stabilize also the intermediate product during the silica-silane reaction. VP Si 363® reacts faster than Si 263 probably due to an increasing possibility of adsorption of the different oxygen atoms inside the long alkoxy chain to the silanol groups of the silica via hydrogen bonding.
Kinetic Behavior of Triethoxyalkylsilanes
The influence of the length and branching of the alkyl-
chain of different triethoxyalkylsilanes on the rate of the reac-tion with the silanol groups of the silica was tested: Dynasy-lan® MTES (methyltriethoxysilane), Dynasylan® PTEO (propyltriethoxysilane), Dynasylan® OCTEO (octyltri-ethoxysilane), HDTEO (hexadecyl-triethoxysilane) and Dy-nasylan® IBTEO (isobutyl-triethoxysilane). Fig. 3 shows the different turnovers of the silane (c0-c) with c0 as the initial concentration versus the rates of reaction (--dc/dt).
The ascending order of the rate of the start reaction is the following: MTES > PTEO > OCTEO > HDTEO > IBTEO. This leads to two general conclusions: The shorter the alkyl chain of the silane the higher is the rate of reaction. Linear
alkyl silanes react faster than branched ones. This shows that the stearic hindrance of the alkyl chain of the silanes plays an important role in the reaction mechanism. The higher the effectivity of a longer or even branched alkyl chain to shield the silanol group of the silica the lower is the possibility for an adsorption of the triethoxy-group to a silanol group.
Kinetic Behavior of Trimethoxyalkylsilanes The influence of the length and branching of the alkyl-
chain of different trimethoxyalkylsilanes was tested: Dynasy-lan® MTMS (methyltrimethoxysilane), Dyna-sylan® PTMO (propyltrimethoxysilane), Dynasylan® OCTMO (octyltri-methoxysilane), Dynasylan® 9116 (hexadecyltri-methoxysilane) and Dynasylan® IBTMO (isobutyltri-methoxysilane).
Fig. 4 shows the different turnovers of the silane (c0-c) versus the rates of reaction (-dc/dt).
The most obvious is that all methoxysilanes are reacting significantly faster than ethoxysilanes. The ascending order of the rate of the start reaction is as follows: MTMS > PTMO > OCTMO > IBTMO > 9116. This means that the same conclu-sions are true as for the alkyltriethoxy-silanes. A longer or even branched alkyl chain can shield the silanol groups of the silica more effectively. Therefore, the rate of reaction slows down with increasing chain length and degree of branching.
0 2 4 6 8 10 120
1
2
3
4
5
6
-dc/
dt
c(silane) [µmol/ml]
PTEOSi 303 (2,3)
Si 303 (2,9)Si 263
Si 363
Introduction –SH or –long alkoxy
Introduction –SH and –long alkoxy
0 2 4 6 8 10 120
1
2
3
4
5
6
-dc/
dt
c(silane) [µmol/ml]
PTEOSi 303 (2,3)
Si 303 (2,9)Si 263
Si 363
Introduction –SH or –long alkoxy
Introduction –SH and –long alkoxy
Fig. 2. Rate of reaction of mercaptosilanes in comparison to alkyl-silanes
0
4
8
12
16
0 50 100 150 200 250t [min]
c0
- c
[µm
ol/m
l] PTEO
OCTEO
HDTEO
IBTEO
MTES
0
1
2
3
4
0 5 10 15c0 - c [µmol/ml]
-dc
/dt
PTEOOCTEOHDTEOIBTEOMTES
Fig. 3. Rate of reaction of different alkyltriethoxysilanes
Chem. Listy 105, s233s416 (2011) PMA 2011 & RubberCon 2011 Contributed Lectures
s263
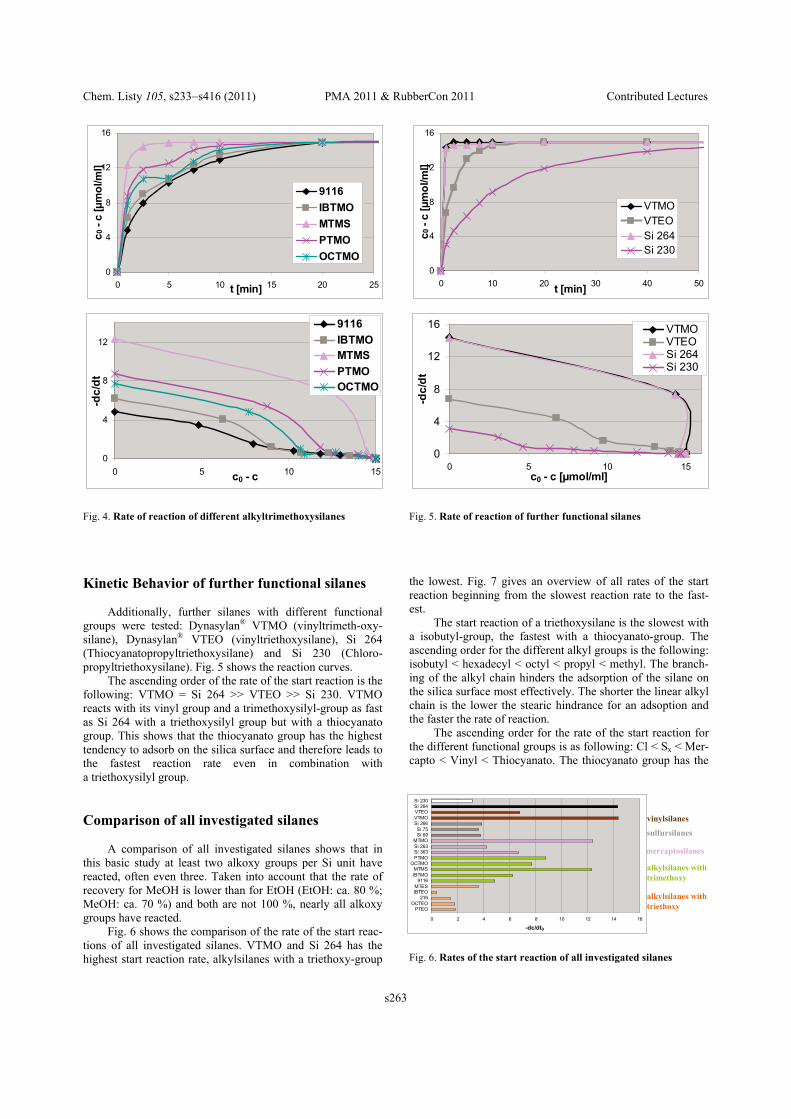
Kinetic Behavior of further functional silanes Additionally, further silanes with different functional
groups were tested: Dynasylan® VTMO (vinyltrimeth-oxy-silane), Dynasylan® VTEO (vinyltriethoxysilane), Si 264 (Thiocyanatopropyltriethoxysilane) and Si 230 (Chloro-propyltriethoxysilane). Fig. 5 shows the reaction curves.
The ascending order of the rate of the start reaction is the following: VTMO = Si 264 >> VTEO >> Si 230. VTMO reacts with its vinyl group and a trimethoxysilyl-group as fast as Si 264 with a triethoxysilyl group but with a thiocyanato group. This shows that the thiocyanato group has the highest tendency to adsorb on the silica surface and therefore leads to the fastest reaction rate even in combination with a triethoxysilyl group.
Comparison of all investigated silanes A comparison of all investigated silanes shows that in
this basic study at least two alkoxy groups per Si unit have reacted, often even three. Taken into account that the rate of recovery for MeOH is lower than for EtOH (EtOH: ca. 80 %; MeOH: ca. 70 %) and both are not 100 %, nearly all alkoxy groups have reacted.
Fig. 6 shows the comparison of the rate of the start reac-tions of all investigated silanes. VTMO and Si 264 has the highest start reaction rate, alkylsilanes with a triethoxy-group
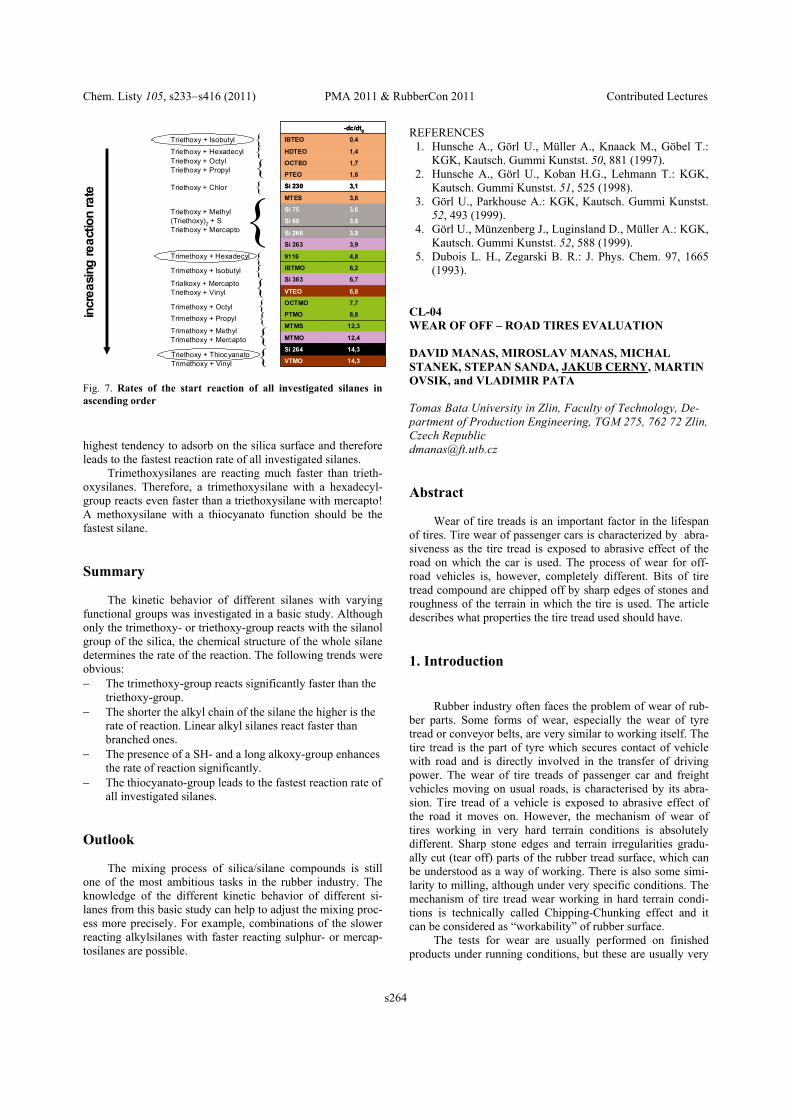
the lowest. Fig. 7 gives an overview of all rates of the start reaction beginning from the slowest reaction rate to the fast-est.
The start reaction of a triethoxysilane is the slowest with a isobutyl-group, the fastest with a thiocyanato-group. The ascending order for the different alkyl groups is the following: isobutyl < hexadecyl < octyl < propyl < methyl. The branch-ing of the alkyl chain hinders the adsorption of the silane on the silica surface most effectively. The shorter the linear alkyl chain is the lower the stearic hindrance for an adsoption and the faster the rate of reaction.
The ascending order for the rate of the start reaction for the different functional groups is as following: Cl < Sx < Mer-capto < Vinyl < Thiocyanato. The thiocyanato group has the
0
4
8
12
16
0 5 10 15 20 25t [min]
c0
- c [µ
mo
l/ml]
9116
IBTMO
MTMS
PTMO
OCTMO
0
4
8
12
0 5 10 15c0 - c
-dc
/dt
9116
IBTMOMTMS
PTMOOCTMO
Fig. 4. Rate of reaction of different alkyltrimethoxysilanes
0
4
8
12
16
0 10 20 30 40 50t [min]
c0
- c
[µ
mo
l/ml]
VTMOVTEOSi 264Si 230
0
4
8
12
16
0 5 10 15c0 - c [µmol/ml]
-dc
/dt
VTMOVTEOSi 264Si 230
Fig. 5. Rate of reaction of further functional silanes
0 2 4 6 8 10 12 14 16
PTEOOCTEO
216IBTEOMTES
9116IBTMOMTMS
OCTMOPTMOSi 363Si 263MTMO
Si 69Si 75
Si 266VTMOVTEOSi 264Si 230
-dc/dt0
alkylsilanes withtriethoxy
alkylsilanes withtrimethoxy
mercaptosilanes
sulfursilanes
vinylsilanes
Fig. 6. Rates of the start reaction of all investigated silanes
Chem. Listy 105, s233s416 (2011) PMA 2011 & RubberCon 2011 Contributed Lectures
s264
highest tendency to adsorb on the silica surface and therefore leads to the fastest reaction rate of all investigated silanes.
Trimethoxysilanes are reacting much faster than trieth-oxysilanes. Therefore, a trimethoxysilane with a hexadecyl-group reacts even faster than a triethoxysilane with mercapto! A methoxysilane with a thiocyanato function should be the fastest silane.
Summary The kinetic behavior of different silanes with varying
functional groups was investigated in a basic study. Although only the trimethoxy- or triethoxy-group reacts with the silanol group of the silica, the chemical structure of the whole silane determines the rate of the reaction. The following trends were obvious: The trimethoxy-group reacts significantly faster than the
triethoxy-group. The shorter the alkyl chain of the silane the higher is the
rate of reaction. Linear alkyl silanes react faster than branched ones.
The presence of a SH- and a long alkoxy-group enhances the rate of reaction significantly.
The thiocyanato-group leads to the fastest reaction rate of all investigated silanes.
Outlook The mixing process of silica/silane compounds is still
one of the most ambitious tasks in the rubber industry. The knowledge of the different kinetic behavior of different si-lanes from this basic study can help to adjust the mixing proc-ess more precisely. For example, combinations of the slower reacting alkylsilanes with faster reacting sulphur- or mercap-tosilanes are possible.
REFERENCES 1. Hunsche A., Görl U., Müller A., Knaack M., Göbel T.:
KGK, Kautsch. Gummi Kunstst. 50, 881 (1997). 2. Hunsche A., Görl U., Koban H.G., Lehmann T.: KGK,
Kautsch. Gummi Kunstst. 51, 525 (1998). 3. Görl U., Parkhouse A.: KGK, Kautsch. Gummi Kunstst.
52, 493 (1999). 4. Görl U., Münzenberg J., Luginsland D., Müller A.: KGK,
Kautsch. Gummi Kunstst. 52, 588 (1999). 5. Dubois L. H., Zegarski B. R.: J. Phys. Chem. 97, 1665
(1993). CL-04 WEAR OF OFF – ROAD TIRES EVALUATION DAVID MANAS, MIROSLAV MANAS, MICHAL STANEK, STEPAN SANDA, JAKUB CERNY, MARTIN OVSIK, and VLADIMIR PATA Tomas Bata University in Zlin, Faculty of Technology, De-partment of Production Engineering, TGM 275, 762 72 Zlin, Czech Republic [email protected] Abstract
Wear of tire treads is an important factor in the lifespan
of tires. Tire wear of passenger cars is characterized by abra-siveness as the tire tread is exposed to abrasive effect of the road on which the car is used. The process of wear for off-road vehicles is, however, completely different. Bits of tire tread compound are chipped off by sharp edges of stones and roughness of the terrain in which the tire is used. The article describes what properties the tire tread used should have.
1. Introduction
Rubber industry often faces the problem of wear of rub-
ber parts. Some forms of wear, especially the wear of tyre tread or conveyor belts, are very similar to working itself. The tire tread is the part of tyre which secures contact of vehicle with road and is directly involved in the transfer of driving power. The wear of tire treads of passenger car and freight vehicles moving on usual roads, is characterised by its abra-sion. Tire tread of a vehicle is exposed to abrasive effect of the road it moves on. However, the mechanism of wear of tires working in very hard terrain conditions is absolutely different. Sharp stone edges and terrain irregularities gradu-ally cut (tear off) parts of the rubber tread surface, which can be understood as a way of working. There is also some simi-larity to milling, although under very specific conditions. The mechanism of tire tread wear working in hard terrain condi-tions is technically called Chipping-Chunking effect and it can be considered as “workability” of rubber surface.
The tests for wear are usually performed on finished products under running conditions, but these are usually very
Triethoxy + ThiocyanatoTrimethoxy + Vinyl
{Trimethoxy + MethylTrimethoxy + Mercapto
{Trimethoxy + Propyl
{Trimethoxy + Octyl
{Trialkoxy + MercaptoTriethoxy + Vinyl
{Trimethoxy + Isobutyl
{
Trimethoxy + Hexadecyl
{Triethoxy + Methyl(Triethoxy)2 + STriethoxy + Mercapto
Triethoxy + Chlor
Triethoxy + OctylTriethoxy + Propyl
{Triethoxy + Hexadecyl {Triethoxy + Isobutyl
incr
ea
sing
rea
ctio
nra
te
{
{
{
14,3VTMO
14,3Si 264
12,4MTMO
12,3MTMS
8,8PTMO
7,7OCTMO
6,8VTEO
6,7Si 363
6,2IBTMO
4,89116
3,9Si 263
3,9Si 266
3,8Si 69
3,6Si 75
3,6MTES
3,1Si 230
1,8PTEO
1,7OCTEO
1,4HDTEO
0,4IBTEO
-dc/dt0
14,3VTMO
14,3Si 264
12,4MTMO
12,3MTMS
8,8PTMO
7,7OCTMO
6,8VTEO
6,7Si 363
6,2IBTMO
4,89116
3,9Si 263
3,9Si 266
3,8Si 69
3,6Si 75
3,6MTES
3,1Si 230
1,8PTEO
1,7OCTEO
1,4HDTEO
0,4IBTEO
-dc/dt0
Fig. 7. Rates of the start reaction of all investigated silanes in ascending order
Chem. Listy 105, s233s416 (2011) PMA 2011 & RubberCon 2011 Contributed Lectures
s265
time demanding and expensive. It would be very useful for technical practice to find a quick test of wear which could be carried out on small samples. Creating a model predicting the behavior of tire tread mixtures and specifying the characteris-tics (tensile strength, elongation, tear strength, hardness etc.) which affect the wear dramatically, would improve the devel-opment of wear research in this field.
2. Experiment 2.1. Used materials (compounds)
Thirteen kinds of tire tread compounds used for motor-
cycle treads subjected to high stress, treads for technical, agri-cultural and multipurpose vehicles were experimented. All compounds represent real products and are produced and machined.
2.2. Test of wear
The tests of tire (tread) wear are time and money con-
suming. They are carried out using real tires in testing rooms or directly in the terrain during driving tests. That is one of the reasons for searching a method that would in a very short time (in minutes) and on small samples test the wear for a comparison of the different kinds of compounds.
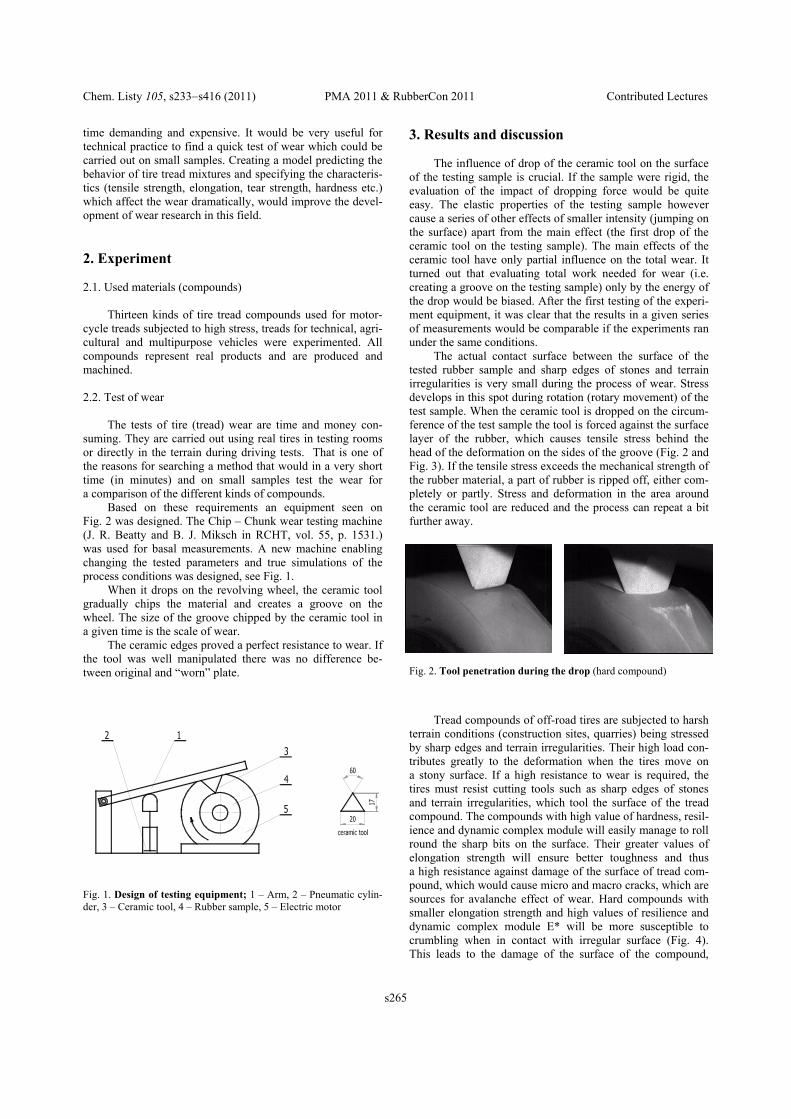
Based on these requirements an equipment seen on Fig. 2 was designed. The Chip – Chunk wear testing machine (J. R. Beatty and B. J. Miksch in RCHT, vol. 55, p. 1531.) was used for basal measurements. A new machine enabling changing the tested parameters and true simulations of the process conditions was designed, see Fig. 1.
When it drops on the revolving wheel, the ceramic tool gradually chips the material and creates a groove on the wheel. The size of the groove chipped by the ceramic tool in a given time is the scale of wear.
The ceramic edges proved a perfect resistance to wear. If the tool was well manipulated there was no difference be-tween original and “worn” plate.
3. Results and discussion The influence of drop of the ceramic tool on the surface
of the testing sample is crucial. If the sample were rigid, the evaluation of the impact of dropping force would be quite easy. The elastic properties of the testing sample however cause a series of other effects of smaller intensity (jumping on the surface) apart from the main effect (the first drop of the ceramic tool on the testing sample). The main effects of the ceramic tool have only partial influence on the total wear. It turned out that evaluating total work needed for wear (i.e. creating a groove on the testing sample) only by the energy of the drop would be biased. After the first testing of the experi-ment equipment, it was clear that the results in a given series of measurements would be comparable if the experiments ran under the same conditions.
The actual contact surface between the surface of the tested rubber sample and sharp edges of stones and terrain irregularities is very small during the process of wear. Stress develops in this spot during rotation (rotary movement) of the test sample. When the ceramic tool is dropped on the circum-ference of the test sample the tool is forced against the surface layer of the rubber, which causes tensile stress behind the head of the deformation on the sides of the groove (Fig. 2 and Fig. 3). If the tensile stress exceeds the mechanical strength of the rubber material, a part of rubber is ripped off, either com-pletely or partly. Stress and deformation in the area around the ceramic tool are reduced and the process can repeat a bit further away.
Tread compounds of off-road tires are subjected to harsh terrain conditions (construction sites, quarries) being stressed by sharp edges and terrain irregularities. Their high load con-tributes greatly to the deformation when the tires move on a stony surface. If a high resistance to wear is required, the tires must resist cutting tools such as sharp edges of stones and terrain irregularities, which tool the surface of the tread compound. The compounds with high value of hardness, resil-ience and dynamic complex module will easily manage to roll round the sharp bits on the surface. Their greater values of elongation strength will ensure better toughness and thus a high resistance against damage of the surface of tread com-pound, which would cause micro and macro cracks, which are sources for avalanche effect of wear. Hard compounds with smaller elongation strength and high values of resilience and dynamic complex module E* will be more susceptible to crumbling when in contact with irregular surface (Fig. 4). This leads to the damage of the surface of the compound,
Fig. 1. Design of testing equipment; 1 – Arm, 2 – Pneumatic cylin-der, 3 – Ceramic tool, 4 – Rubber sample, 5 – Electric motor
Fig. 2. Tool penetration during the drop (hard compound)
Chem. Listy 105, s233s416 (2011) PMA 2011 & RubberCon 2011 Contributed Lectures
s266
which creates ideal conditions for more cracks resulting in the avalanche effect of wear.
4. Conclusion Tire wear is a rather complicated matter. It is not entirely
clear which tire tread compound is the most effective and which will show poorer qualities in respect of wear. The char-acter of wear should always be taken into account and the right properties of a given compound selected accordingly. For movements on standard roads and highways where the tread is exposed to abrasion, it is be more suitable to select a compound which is harder, more resistant to the abrasive effect of the road. On the other hand a softer compound is a better choice for tires used in harsh terrain conditions.
This article is financially supported by the Czech Ministry of Education, Youth and Sports in the R&D project under the title ‘Modelling and Control of Processing Procedures of Natural and Synthetic Polymers’, No. MSM 7088352102 and ‘CEBIA Tech’, No. CZ.1.05/2.1.00/03.0089.
REFERENCES 1. Manas D. et al.: KGK, Kautsch. Gummi Kunstst. 62, 240
(2009). 2. Kaszonyiová M. et al.: J. Macromol. Sci., Phys. B44, 377
(2005). 3. Stanek M. et al.: Chem. Listy 103, 88 (2009).
4. Stanek M. et al.: Chem. Listy 103, 91 (2009). 5. Sanda S. et al.: Chem. Listy 103, 140 (2009). 6. Manas M. et al.: Chem. Listy 103, 24 (2009). 7. Kaszonyiová M. et al.: J. Macromol. Sci., Phys. 46, 1
(2007). 8. Javořík J. et al.: KGK, Kautsch. Gummi Kunstst. 60, 608
(2007). CL-05 LIQUID ELASTOMERS: SCIENCE AND TECHNOLOGY JIRI GEORGE DROBNY* Drobny Polymer Associates, 11 Quails Way, Merrimack, NH, 03054 USA [email protected]
The term “Liquid Elastomers” or “Liquid Rubbers” re-fers to low molecular weight polymers with molecular weight of only several thousands, which can be pumped or cast at room or slightly higher temperatures (i.e. their viscosity does not exceed about 150 Pa.s)1. These oligomers can be vulcan-ized in some way, either by extending chains, by cross-linking or by both reactions combined.
Generally, liquid elastomers can be classified into two groups, depending on whether their terminal groups are non-reactive or reactive. This contribution will focus on the group with reactive terminal groups, often referred to as telechelic oligomers2.
When combining terminal reactive groups, a linear high molecular weight polymer is formed. If the functionality of the liquid oligomers or other reagent present is more than 2, branching and cross-links are formed during the reaction and a three-dimensional network results. Theoretically, more per-fect three-dimensional structures could be obtained by this process than those generated by cross-linking of high molecu-lar weight of currently available elastomers. However, in reality, this is not the case and the final products from liquid systems generally do not attain properties of conventional vulcanized rubber
Typical reactive groups in liquid elastomers are: –OH, –COOH, –Br and –SH3. The polymers terminated by hy-droxyl groups can be cross-linked with diisocyanates. An example is the reaction of hydroxyl-terminated polybutadie-nes with MDI to form polyurethanes.
In general, this type of rubber can be used for applica-tions, where there are not high demands on mechanical prop-erties. Some of them can be reinforced by addition of rein-forcing fillers. The incorporation of such fillers requires a very intensive shearing in mixers of special construction to achieve good dispersion4. The mixture obtained is a paste that has a low cohesion and is sticky; it cannot be processed in the traditional way as milleable rubbers. Otherwise, the advan-tages of liquid elastomers are that they generally require lighter machinery, which is less expensive and requires less power. The process requires less labor, which results in a higher productivity.
There are essentially four types of commercially avail-able liquid elastomer systems5,6:
Fig. 3. Tool penetration during the drop (soft compound)
Fig. 4. Tool penetration during the drop
Chem. Listy 105, s233s416 (2011) PMA 2011 & RubberCon 2011 Contributed Lectures
s267
polysulfides, silicones, polyurethanes, terminally reactive butadiene-based polymers.
This contribution will review the current state of the art in the liquid elastomer science and technology, major applica-tions and current trends. REFERENCES 1. Mesissner B., Schätz M., Brajko V., in: Elastomers and
Rubber Compounding Materials (Franta I., ed.), p. 294, Elsevier, Amsterdam 1989.
2. Edwards D. C., in: Handbook of Elastomers, Second Edition (Bhowmick A. K., Stephens H. L., eds.), p. 133, Marcel Dekker, New York 2001.
3. Mesissner B., Schätz M., Brajko V., in: Elastomers and Rubber Compounding Materials (Franta I., ed.), p. 297, Elsevier, Amsterdam 1989.
4. Mesissner B., Schätz M., Brajko V., in: Elastomers and Rubber Compounding Materials (Franta I., ed.), p. 298, Elsevier, Amsterdam 1989.
5. Edwards D. C., in: Handbook of Elastomers, Second Edition (Bhowmick A. K., Stephens H. L., eds.), p. 136, Marcel Dekker, New York 2001.
6. Saskar A., in: Rubber Technologist’s Handbook, Volume 2 (White J., De S. K., Naskar K., eds.), p. 405, Smithers Rapra Technology, 2009.
CL-06 A SINGLE TESTING INSTRUMENT WITH MULTIPLE TESTING CAPABILITIES FOR RUBBERS AND ELASTOMERS ARNAUD FAVIER 01dB-Metravib 200 chemin des Ormeaux 69760 Limonest-France [email protected], www.dma-instruments.com
Dynamic mechanical Analysis of rubbers are a very particular issue: contrarily to most other polymer materials, they exhibit very singular behaviour, which makes it complex to characterize. Their properties are sensitive to various differ-ent parameters: temperature, frequency, strain, heat build up and even the dynamic history of the sample itself! Rubber samples are available with different geometry and state. In each case, it is necessary to propose the adequate interface in order to adapt easily the sample on the testing instrument.
Following a development of 40 years, 01 dB-Metravib is proposing a set of powerful instruments, including innovative and unique capabilities. The different instruments are cover-ing a unique frequency range from static up to 10,000 Hz. Thanks to high force capabilities (up to +/450 N), it is possi-ble to understand strain dependence of the material up to very high dynamic strain (+/300 % and higher) and also to pro-pose on the same instrument, complementary tests such as: fatigue, heat build up, crack growth, excitation waveform control, automated glass transition detection and optimization of measurement, … .
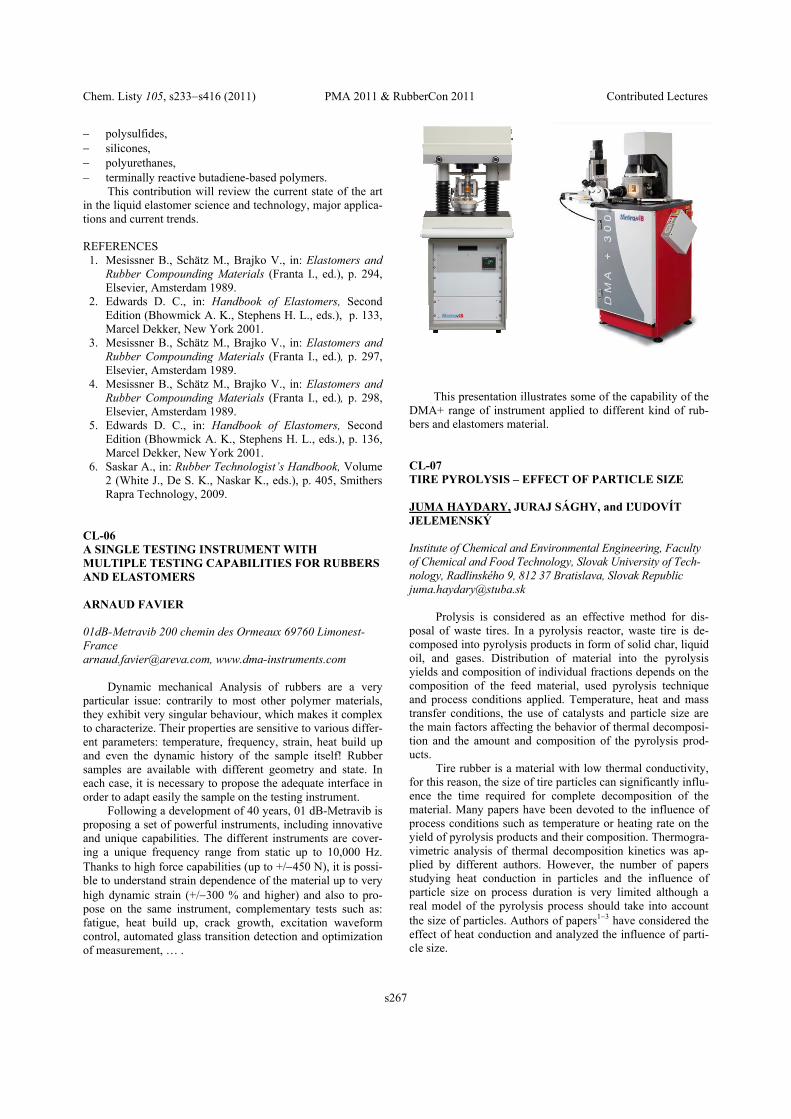
This presentation illustrates some of the capability of the DMA+ range of instrument applied to different kind of rub-bers and elastomers material.
CL-07 TIRE PYROLYSIS – EFFECT OF PARTICLE SIZE JUMA HAYDARY, JURAJ SÁGHY, and ĽUDOVÍT JELEMENSKÝ Institute of Chemical and Environmental Engineering, Faculty of Chemical and Food Technology, Slovak University of Tech-nology, Radlinského 9, 812 37 Bratislava, Slovak Republic [email protected]
Prolysis is considered as an effective method for dis-posal of waste tires. In a pyrolysis reactor, waste tire is de-composed into pyrolysis products in form of solid char, liquid oil, and gases. Distribution of material into the pyrolysis yields and composition of individual fractions depends on the composition of the feed material, used pyrolysis technique and process conditions applied. Temperature, heat and mass transfer conditions, the use of catalysts and particle size are the main factors affecting the behavior of thermal decomposi-tion and the amount and composition of the pyrolysis prod-ucts.
Tire rubber is a material with low thermal conductivity, for this reason, the size of tire particles can significantly influ-ence the time required for complete decomposition of the material. Many papers have been devoted to the influence of process conditions such as temperature or heating rate on the yield of pyrolysis products and their composition. Thermogra-vimetric analysis of thermal decomposition kinetics was ap-plied by different authors. However, the number of papers studying heat conduction in particles and the influence of particle size on process duration is very limited although a real model of the pyrolysis process should take into account the size of particles. Authors of papers13 have considered the effect of heat conduction and analyzed the influence of parti-cle size.
Chem. Listy 105, s233s416 (2011) PMA 2011 & RubberCon 2011 Contributed Lectures
s268
This work aims to determine the effect of particle size on the conversion of thermal decomposition of tire pyrolyzed in a flow reactor under isothermal conditions. Experimental setup
A laboratory pyrolysis unit with a screw type flow reac-
tor for pyrolysis of rubber samples with sizes between 2 and 8 millimeters (weight of 50 to 500 mg) was used. The pyrolysis apparatus is in detail described in ref.4. The sizes and shapes of the used samples are illustrated in Scheme 1. The samples contained also textile cords, but steel cords were removed.
Scheme 1. Illustration of tire rubber samples Temperature of the reactor was set to 550 °C. This tempera-ture was selected based on our previous study on the influence of temperature on pyrolysis conversion4. Each type of the sample was pyrolyzed for a different residence time in the range from 15 to 300 seconds. Residence time was controlled by the frequency of rotation of the screw. Conversion of ther-mal decomposition was obtained by two methods: by com-parison of the weight of the virgin sample and the residue char and by comparison of the TG curves of the residue char and the virgin material. Termogravimetric analysis of virgin rubber and residue char was provided using a NETZSCH STA 409 PC Luxx TG/DSC analyzer. Separate thermogravimetric experiments using small samples (around 10 mg) were carried out to obtain kinetic parameters of thermal decomposition. For details on the method for ki-netic data estimation see our previous paper5. Mathematical model
For mathematical modeling, a spherical particle with an
equivalent diameter de=2rA was considered. Based on the solid char characteristics it was assumed that in the first step, rubber changes into a porous material which is further decom-posed based on a shell model (reacted part of the particle
creates a shell around the unreacted part as shown in Scheme 2).
Based on these considerations and on the isothermal conditions in the reactor, for kinetics of thermal decomposi-tion and heat conduction in the particle it can be written:
Initial and boundary conditions with respect to the technical aspects of the experiment are:
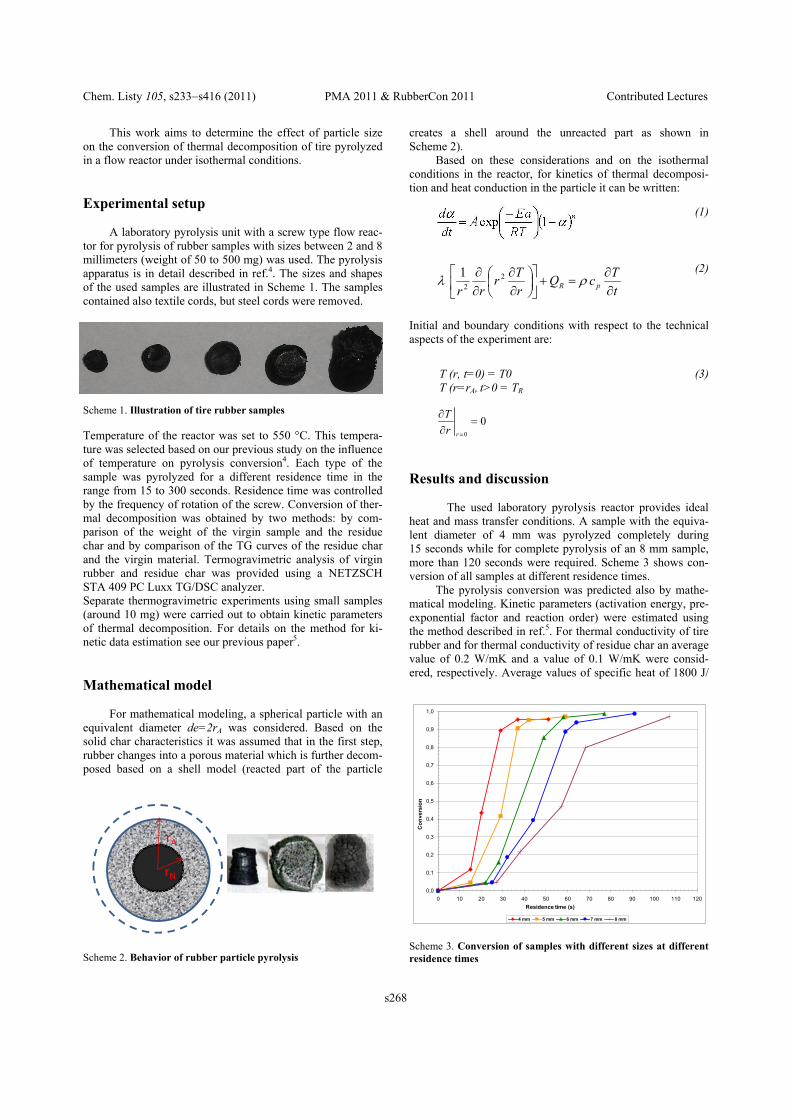
Results and discussion The used laboratory pyrolysis reactor provides ideal heat and mass transfer conditions. A sample with the equiva-lent diameter of 4 mm was pyrolyzed completely during 15 seconds while for complete pyrolysis of an 8 mm sample, more than 120 seconds were required. Scheme 3 shows con-version of all samples at different residence times.
The pyrolysis conversion was predicted also by mathe-matical modeling. Kinetic parameters (activation energy, pre-exponential factor and reaction order) were estimated using the method described in ref.5. For thermal conductivity of tire rubber and for thermal conductivity of residue char an average value of 0.2 W/mK and a value of 0.1 W/mK were consid-ered, respectively. Average values of specific heat of 1800 J/
rN
rA
Scheme 2. Behavior of rubber particle pyrolysis
(1)
(2)
t
TcQ
r
Tr
rr pR
2
2
1
(3) T (r, t=0) = T0 T (r=rA, t>0 = TR
0
0r
T
r
Scheme 3. Conversion of samples with different sizes at different residence times
0,0
0,1
0,2
0,3
0,4
0,5
0,6
0,7
0,8
0,9
1,0
0 10 20 30 40 50 60 70 80 90 100 110 120
zdržný čas [s]
stu
peň
pre
men
y
4 mm 5 mm 6 mm 7 mm 8 mm
Co
nve
rsio
n
Residence time (s)

Chem. Listy 105, s233s416 (2011) PMA 2011 & RubberCon 2011 Contributed Lectures
s269
kgK and decomposition reaction heat of 300 kJ/kg were ap-plied. Scheme 4 shows the comparison of predicted and ex-perimental conversions for different particle sizes. Generally, good coherence between predicted and experimental data was observed. However, the model data show slower thermal de-composition than experimental data.
Also the influence of thermal conductivity was ana-lyzed. The values of thermal conductivity from 0.1 to 0.5 W/mK were used in the model; time needed for 90 % conversion at different thermal conductivities and sample sizes is shown in Scheme 5.
Both experimental and mathematical model results show that particle size and heat conduction have a crucial effect on the pyrolysis time of waste tire. By increasing the size of par-ticles from 4 mm to 8 mm, the time needed for pyrolysis in-creased eight times. This work was supported by the Grant VEGA No. 1/0796/10 from the Slovak Scientific Grant Agency.
Nomenclature A pre-exponential factor, cp specific heat, Ea activation energy, n reaction order, QR heat of reaction, R gas con-stant, rA radius of particle, rN radius of unreacted part of particle, T temperature, TR reactor temperature, t time, λ thermal conductivity, ρ density REFERENCES 1. Juan F. González, Jose´ M. Encinar, José L. Canito, Juan
J. Rodríguez: J. Anal. Appl. Pyrolysis, 58–59, 667 (2001).
2. Morten Boberg Larsen et al.: Fuel 85, 1335 (2006). 3. Siyi Luo, Bo Xiao, Zhiquan Hu, Shiming Liu: Int. J.
Hydrogen Energy 35, 93 (2010). 4. Haydary J., Jelemenský Ľ., Markoš J., Annus J.: KGK,
Kautsch. Gummi Kunstst. 62, 661 (2009). 5. Korenova Z., Juma M., Annus J., Markos J., Jelemenesky
L.: Chemical Papers 60, 422 (2006).
CL-08 EFFECT OF IRRADIATION CROSS-LINKING ON MECHANICAL PROPERTIES OF SELECTED TYPES OF POLYMER ZDENEK HOLIK, MICHAL DANEK, MIROSLAV MANAS, ROMANA LAMBOROVA, JAKUB CERNY, KAMIL KYAS, MARTIN KRUMAL, and MARTINA MALACHOVA Tomas Bata University in Zlin, Department of Production Engineering, Nam. T.G.Masaryka 275, 762 72 Zlin, Czech Republic Abstract
The main objective of the study is an investigation of mechanical properties of selected polymers. These properties were examined in dependence on the dosage of the ionizing electron beam radiation. 1. Introduction
Polymers are more and more replaced by other materi-
als; this is due to a huge range of their properties and proc-essability in a liquid state. Demands on their properties rise with increase of application of these materials. Therefore it is necessary to find new methods of improving the polymer properties to replace expensive construction materials by affordable polymer materials.
Method of improving the polymer properties is based on creating of a network between the polymer chains by energy supplied to the material by ionizing beta radiation as can be seen at Fig. 1. Then the material reaches better mechanical, chemical and thermal properties. The process of irradiation is also carried out on final products without additional stress. A range of irradiation parameters can also vary according to
Scheme 4. Comparison of experimental and model data
Scheme 5. Influence of thermal conductivity

Chem. Listy 105, s233s416 (2011) PMA 2011 & RubberCon 2011 Contributed Lectures
s270
the cross-linking degree and thus the desired material proper-ties can be achieved. 2. Experiment
The samples were made by the injection moulding ma-
chine (ARBURG ALLROUNDER 420 C 1000-350). The sample material was chosen polyamide 6.6
(PA 6.6), unfilled and filled with 25 % glass fibers. PTS Creamid-A3H2G5FR – PA6.6 25%GF PTS Creamid-A3H2 – PA6.6
Processing conditions during the injection moulding were set according to the recommendation of the producers.
All samples were irradiated with electron rays (electron energy 10MeV, dosage: 33, 66, 99, 132, 165 and 198 kGy) in the firm BGS Beta Gamma Service GmbH & Co, Saal am Donau – Germany.
The following equipment was used during testing: Tensile test, according to standard CSN EN ISO 527-1,
527-2 was carried out on the tensile machine ZWICK 1456; used rate: PA 6.6 – 100 mm/min; test data was processed by Test Xpert Standard software; modulus (E [MPa]) and tensile stress (M [MPa]) were deter-mined.
Gel content according to standard CSN EN 579.
3. Results At each irradiated test specimens the gel content was
measured which is presented in the table I and in the table II. Here you can see that the gel content is stable from dosis 99 kGy (in case of PA 6.6) and from dosis 33 kGy (in case of PA 6.6 with 25 % glass fibres).
Comparison of tensile strength and E modulus of poly-amide 6.6 (PA66) measured at 23 °C is given in the Fig. 2 and at 80 °C in the Fig. 3. It is evident that cross-linking improves the tensile strength (M) and E – modulus at of both tempera-tures, but the improvement in case of evaluated temperature is
much higher. The best improvement is reached for test speci-mens irradiated by dosis 132 kGy (70 %). However, as can be seen in Fig. 3, the highest value of doses does not mean the highest value of tensile strength.
Comparison of tensile strength and E modulus of poly-amide 6.6 with 25 %GF measured at 23 °C is given in the Fig. 4 and at 80 °C in the Fig. 5. Here we can see the stagna-tion of tensile strength after irradiation but opposite to un-
Fig. 1. Principe of radiation cross-linking (5)
Fig. 2. Comparisons of tensile strength and E – modulus of PA 6.6 at 23 °C
Fig. 3. Comparisons of tensile strength and E – modulus of PA 6.6 at 80 °C
Fig. 4. Comparisons of tensile strength and E – modulus of PA 6.6 25 % GF at 23 °C

Chem. Listy 105, s233s416 (2011) PMA 2011 & RubberCon 2011 Contributed Lectures
s271
filled PA 6.6 there is higher increase of E-modulus (of about 25 % against non-cross-linked samples). Raise of mechanical properties can be given by cross-linkage of polymeric matrix on fibres. 4. Conclusion
As can be seen from the tests results, the irradiation
cross-linking improves the mechanical properties of each polyamide. The improvement is more considerable in case of
higher temperature (80 °C), as a consequence of creation of cross-link (during irradiation cross-linking) resulting in pro-traction of macromolecular string, which is thus more flexible during thermal load than individual shorter macromolecular strings. This article is financially supported by the Czech Ministry of Education, Youth and Sports in the R&D projects under the titles ‘Modelling and Control of Processing Procedures of Natural and Synthetic Polymers’, No. MSM 7088352102 and ‘CEBIA Tech’, No. CZ.1.05/2.1.00/03.0089 REFERENCES 1. Woods R. J.: Applied radiation chemistry: radiation
processing, 1994. 2. Drobný J. G.: Radiation Technology for Polymers, CRC
Press, Boca Raton 2003. 3. Zyball A.: Strahlungsenergie zur Modification von
Kunststoffen – Industrielle Anwendungen der Bestrah-lungstechnik, In: Strahlenvernetzte Kunstoffe, Springer VDI verlag, Dusseldorf 2006.
4. http://www.pts-marketing.de 5. http://www.bgs.com/ CL-09 POSSIBLE METHOD OF RECYCLATION OF SELECTED TYPES OF CROSSLINKED POLYMERS ROMANA LAMBOROVA, MICHAL DANEK, and ZDENEK HOLIK Tomas Bata University in Zlin, Department of Production Engineering, Nam. T. G. Masaryka 275, 762 72 Zlin, Czech Republic Abstract
The main objective of this article is a study of the possi-ble use of irradiated polymer products after their lifetime period. Irradiated HDPE pipes were used for this research; the main advantage of cross-linking polyolefins is their cross-linking ability without the need of the cross-linking agent. However, the main problem is that the cross-linked material cannot be reprocessed by method of plastification. Focus of research lies in a study of mechanical properties. 1. Introduction
With increasing trend of using the plastic materials and
demands on their properties in economic point of view and also in term of their usage arises the question of their reuse after the life-time period.
In some cases there is limited recyclability of plastic materials. There is a range of methods for reusing the thermo-plastic materials, which are remeltable after processing unlike materials, in which the three-dimensional net is created in the
Fig. 5. Comparisons of tensile strength and E – modulus of PA 6.6 25 % GF at 80 °C
Table I Gel content of PA 6.6
PA 6.6 Dosis [kGy] Gel content [%]
0 0 33 39,0 66 51,4 99 63,9
132 59,4 165 60,0 198 61,5
Table II Gel content of PA 6.6 with 25 % GF
PA 6.6 25 % GF Dosis [kGy] Gel content [%]
0 0 33 67,1 66 67,5 99 72,3
132 72,9 165 73,7 198 75,1

Chem. Listy 105, s233s416 (2011) PMA 2011 & RubberCon 2011 Contributed Lectures
s272
final product after processing, for instance curing at thermo-sets or rubber compounds.
The three-dimensional net is also created by application of radiation cross-linking, which is used for enhancement of wide range of properties, not only mechanical but also chemi-cal and thermal properties as well. This can be utilized with great benefit for cross-linking of commonly used materials and for their subsequent substitution for more expensive con-structional materials or materials for special applications.
The change of properties after radiation cross-linking entails the question of reuse of these materials since due to cross-linking an originally thermoplastic material becomes thermoelastic, thus is the possibility of direct recycling by remoulding analogically closed. 2. Experiment
In order to determine the possibility of reusing products
made of polyethylene modified by irradiation, material of the Slovnaft Petrochemicals s.r.o. LDPE BRALEN VA 20 – 60 was applied as a virgin polyethylene and irradiated high-density polyethylene pipes were used as a filler. The virgin material of these pipes is HDPE Lupolen 4261 A Q 416. These materials were finely ground.
HDPE pipes were cross-linked by accelerated electrons of the energy of 10 MeV and dosage of 139 kGy radiation by BGS Beta-Gamma-Service GmbH & Co. KG. The crosslinking-degree of this pipes used for heat exchanger was measured 64 %. Irradiation by rays is a process by which a material is absorbing energy of high-accelerated electron beams. Energy absorption initiates chemical processes in material. By penetration of electrons in material comes to activation and ionisation of molecules, which are joining and thereby reaching the cross-linking.
Furthermore the mixtures of virgin LDPE and cross-linked HDPE powder were prepared from 0 to 50 % amount of filler and finally the specimens were moulded for the ten-sile test under room and higher temperature and appropriate tests were executed and evaluated.
3. Results and discussion During the tensile test several parameters were ob-
served, especially modulus of elasticity, tensile strength or relative elongation at break. Obtained values were processed into tables depending on the measurement temperature and the amount of cross-linked HDPE filler. For every mixture was testing of thirty specimens accomplished.
When comparing values of unfilled and filled specimens the modulus of elasticity is increasing markedly up to 280 % from 132.9 N mm2 (10 % of HDPE filler) to 298.62 N mm2 (50 % of HDPE filler) (Fig. 1).
Analogous to the previous graph, also tensile strength (Fig. 2) grows steadily in whole 10 to 50 % fillers interval, although the growth is more gradual from 9.19 N mm2 (10 % of HDPE filler) to 12.38 N mm2 (50 % of HDPE filler).
Similar results can be observed from the tensile test at elevated temperature. The raise of modulus of elasticity up to
85 % can offer interesting applications of recycled HDPE pipes (Fig. 3).
In the case of the tensile strength at elevated temperature (Fig. 4), values of filled specimens show also higher values than unfilled, where the highest growth goes up to 32 % by specimens formed of 50 % of fillers and 50 % of virgin mate-rial. 4. Conclusion
It is evident from the measured data, that investigated
material can be reused as fillers in all measured concentra-tions without any appreciable loss of observed mechanical properties.
Fig. 1. Comparison of modulus of elasticity for mixtures of virgin LDPE and crosslinked HDPE at 23 °C
Fig. 2. Comparison of tensile strength for mixtures of virgin LDPE and crosslinked HDPE at 23 °C

Chem. Listy 105, s233s416 (2011) PMA 2011 & RubberCon 2011 Contributed Lectures
s273
Opposite to this, higher amount of filler comes a in-crease tensile strength and modulus of elasticity.
Another good result is the possibility of mixture LDPE and HDPE which are in normal state miscible with difficul-ties.
These results are significant for both the engineering practice, where product price can be reduced by the filler addition with increase in their properties, furthermore thus contribute to a possibility of recycling the radiation cross-linked products and also consequently for the consumer. This article is financially supported by the Czech Ministry of Education, Youth and Sports in the R&D projects under the titles ‘Modeling and Control of Processing Procedures of Natural and Synthetic Polymers’, No. MSM 7088352102 and ‘CEBIA Tech’, No. CZ.1.05/2.1.00/03.0089 REFERENCES 1. Woods R. J.: Applied radiation chemistry: radiation
processing, 1994. 2. Zyball A.: Strahlungsenergie zur Modification von
Kunststoffen – Industrielle Anwendungen der Bestrah-
lungstechnik, In: Strahlenvernetzte Kunstoffe, Springer VDI verlag, Dusseldorf 2006.
3. Drobný J. G.: Radiation Technology for Polymers, CRC Press, Boca Raton 2003.
4. BGS - Beta-Gamma-Service. [online]. http://www.bgs.de
CL-10 THE TESTING OF HYPERELASTIC PROPERTIES OF THE RUBBER MATERIALS JAKUB JAVORIK* and ZDENEK DVORAK Tomas Bata University in Zlin, nam. T.G. Masaryka 5555, 760 01 Zlin, Czech Republic [email protected] Abstract
The aim of our work is to set up nonlinear material pa-
rameters of elastomers for numerical simulation of these ma-terials. For this purpose, it is necessary to test material in three different modes: uniaxial tension, equibiaxial tension and pure shear. The equibiaxial elastomer characterization is the object of this paper. A bubble inflation technique was used for this characterization. We use data from this test and from uniaxial test to create the FEM models of elastomer.
Introduction Thanks their special properties we can find the elastom-
ers in almost all areas of human doings (let us remember their sealing and damping properties)1,2. A need of exact descrip-tion of the highly nonlinear mechanics of this material arises still more often.
Our aim is to set up nonlinear material parameters of elastomers for numerical simulations. The measuring the en-gineering constants for nonlinear material models is demand-ing more special equipment than the measuring the constants for previously used linear material models. For accurate evaluation of hyperelastic material constants we need to test material in all deformation modes that will occur during simu-lation. Usually three basic deformation modes are tested: uniaxial tension, equibiaxial tension and pure shear3,4. The uniaxial tension is easy to perform on standard testing machi-nes5. But the special equipments are necessary for next two deformation modes.
One of the suitable methods for equibiaxial characteriza-tion of elastomers is the bubble inflation technique in which an elastomer is inflated to the shape of bubble6.
Experimental A uniform circular specimen of elastomer is clamped at
the rim and inflated using compressed air to one side. The specimen is deformed to the shape of bubble. The inflation of the specimen results in a biaxial stretching near the pole of the
Fig. 3. Comparison of modulus of elasticity for mixtures of virgin LDPE and crosslinked HDPE at 80 °C
Fig. 4. Comparison of tensile strength for mixtures of virgin LDPE and crosslinked HDPE at 80 °C
Chem. Listy 105, s233s416 (2011) PMA 2011 & RubberCon 2011 Contributed Lectures
s274
bubble and the planar tension near the rim. Thanks to the spherical symmetry we can consider
equibiaxial stress at the pole of the bubble. The thickness of specimen is small and the ratio between the thickness of the inflated membrane t and the curvature radius r is small enough, then the thin shell assumption allows us to neglect the radial stress in the specimen. With consideration of mate-rial incompressibility we can express the thickness of inflated
specimen as: where t0 is the initial thickness of specimen (unloaded state). Further we have to measure the stretch λ at the pole of in-flated material. Generally stretch λ is the ratio between the
current length l and the initial length l0: We can use some of optical method for measurement of
stretch λ and curvature radius r (camera, video camera, laser etc.).
Finally we can compute the hoop stress σ on the pole
of the inflated specimen as ref.6: The specimen of 2 mm thin elastomer is fixed between two rings with inner diameter 40 mm. Rings are clamped in a support.
Next function of the support is distribution of the com-pressed air to one side of the specimen. The current value of applied pressure is recorded using a pressure sensor. The in-flation of the specimen is recorded using a high resolution CCD video camera. A computer is used to control the pres-sure.
The white strips were drawn in the central area of speci-men for stretch measurement. It is important to measure elon-gation and curvature radius only in the area near to pole (between the strips) of inflated specimen and not on entire bubble contour because only on the pole the equibiaxial state of stress occurs.
The common SBR compound for tire manufacturing was tested. The material was loaded until failure. We obtained values of stretch ratios λ and curvature radii r from image analysis of video record.
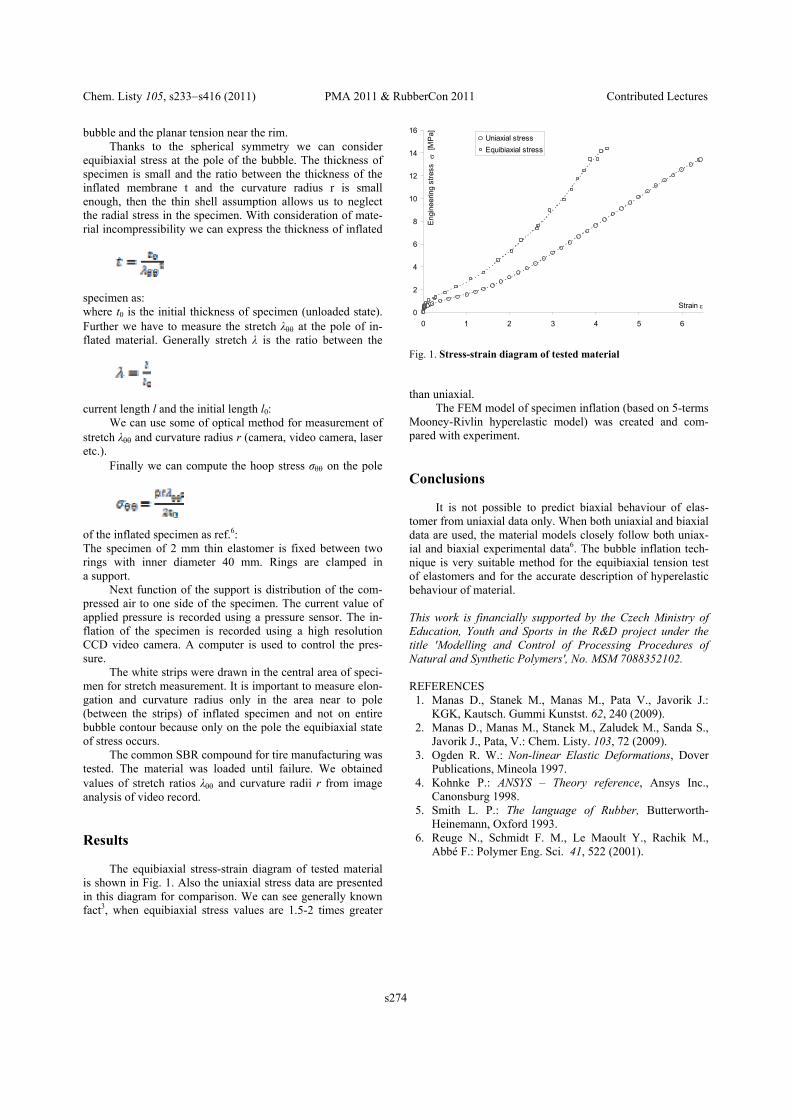
Results The equibiaxial stress-strain diagram of tested material
is shown in Fig. 1. Also the uniaxial stress data are presented in this diagram for comparison. We can see generally known fact3, when equibiaxial stress values are 1.5-2 times greater
than uniaxial. The FEM model of specimen inflation (based on 5-terms
Mooney-Rivlin hyperelastic model) was created and com-pared with experiment.
Conclusions
It is not possible to predict biaxial behaviour of elas-
tomer from uniaxial data only. When both uniaxial and biaxial data are used, the material models closely follow both uniax-ial and biaxial experimental data6. The bubble inflation tech-nique is very suitable method for the equibiaxial tension test of elastomers and for the accurate description of hyperelastic behaviour of material.
This work is financially supported by the Czech Ministry of Education, Youth and Sports in the R&D project under the title 'Modelling and Control of Processing Procedures of Natural and Synthetic Polymers', No. MSM 7088352102.
REFERENCES 1. Manas D., Stanek M., Manas M., Pata V., Javorik J.:
KGK, Kautsch. Gummi Kunstst. 62, 240 (2009). 2. Manas D., Manas M., Stanek M., Zaludek M., Sanda S.,
Javorik J., Pata, V.: Chem. Listy. 103, 72 (2009). 3. Ogden R. W.: Non-linear Elastic Deformations, Dover
Publications, Mineola 1997. 4. Kohnke P.: ANSYS – Theory reference, Ansys Inc.,
Canonsburg 1998. 5. Smith L. P.: The language of Rubber, Butterworth-
Heinemann, Oxford 1993. 6. Reuge N., Schmidt F. M., Le Maoult Y., Rachik M.,
Abbé F.: Polymer Eng. Sci. 41, 522 (2001).
0
2
4
6
8
10
12
14
16
0 1 2 3 4 5 6
Strain
Eng
inee
ring
stre
ss
[MP
a] Uniaxial stress
Equibiaxial stress
Fig. 1. Stress-strain diagram of tested material


![New Therban Compound Development - SGF · 2018. 9. 17. · Therban LT2007 Change in Elongation [%] 14d 21d 42d. 14 ARLANXEO RubberCon 2016-06-08 Formulation 1: Ageing in Water/Ethylene](https://img.pdfslide.us/doc/110x75/611c37f48070c147f6655f19/new-therban-compound-development-2018-9-17-therban-lt2007-change-in-elongation.jpg)