Embed Size (px)
Citation preview
ORIGINAL INVESTIGATION
Miroslava Derenko Æ Boris Malyarchuk
Galina A. Denisova Æ Marcin Wozniak
Irina Dambueva Æ Choduraa Dorzhu Æ Faina Luzina
Danuta Miscicka-Sliwka Æ Ilia Zakharov
Contrasting patterns of Y-chromosome variation in South Siberianpopulations from Baikal and Altai-Sayan regions
Received: 18 January 2005 / Accepted: 13 September 2005 / Published online: 27 October 2005� Springer-Verlag 2005
Abstract In order to investigate the genetic history ofautochthonous South Siberian populations and to esti-mate the contribution of distinct patrilineages to theirgene pools, we have analyzed 17 Y-chromosomal binarymarkers (YAP, RPS4Y711, SRY-8299, M89, M201,M52, M170, 12f2, M9, M20, 92R7, SRY-1532, DYS199,M173, M17, Tat, and LLY22 g) in a total sample of1,358 males from 14 ethnic groups of Siberia (Altaians-Kizhi, Teleuts, Shors, Tuvinians, Todjins, Tofalars,Sojots, Khakassians, Buryats, Evenks), Central/EasternAsia (Mongolians and Koreans) and Eastern Europe(Kalmyks and Russians). Based on both, the distribu-tion pattern of Y-chromosomal haplogroups and resultson AMOVA analysis we observed the statistically sig-nificant genetic differentiation between the populations
of Baikal and Altai–Sayan regions. We suggest thatthese regional differences can be best explained by dif-ferent contribution of Central/Eastern Asian and East-ern European paternal lineages into gene pools ofmodern South Siberians. The population of the Baikalregion demonstrates the prevalence of Central/EasternAsian lineages, whereas in the populations of Altai andSayan regions the highest paternal contribution resultedfrom Eastern European descent is revealed. Yet, ourdata on Y-chromosome STRs variation demonstrate theclear differences between the South Siberian and EasternEuropean R1a1-lineages with the evolutionary agescompatible with divergence time between these two re-gional groups.
Keywords Y-chromosome haplogroups Æ STR ÆSouth Siberia Æ Central/Eastern Asia Æ Eastern Europe ÆR1a1-lineages
Introduction
A particular significance of the genetic research of theAltai and neighboring regions lies in the geographiclocation of the Altai area on the margin of south-western part of Siberia, believed to be the main gate-way for the initial peopling of the remainder of Siberiafrom the southern regions of Central Asia. Archaeo-logical data suggest that modern humans in the latePleistocene could have already inhabited South Siberia.The earliest Upper Paleolithic industries occurred inthe Altai region and are dated as 43,300±1,600 yearsB.P. are thought to be linked with a gradual trans-formation of a Mousterian tradition by the introduc-tion of more progressive elements during the earlystage of the midlast glacial interstadial interval(45,000–30,000 years B.P.) (Derevianko 1998; Goebel1999). A similar ‘‘mixed’’ technological character ob-served in Altai can be found in most of the other LatePaleolithic stone industries in Siberia dating to thesecond half of the Karginsk interstadial interval.
M. Derenko (&) Æ B. Malyarchuk Æ G. A. DenisovaGenetics Laboratory, Institute of Biological Problems of theNorth, Russian Academy of Sciences, Portovaya str. 18,Magadan, RussiaE-mail: [email protected].: 7-41322-31164Fax: 7-41322-34463
M. Wozniak Æ D. Miscicka-SliwkaForensic Medicine Institute, Ludwik Rydygier Medical College,Nicolaus Copernicus University in Torun, 85-094, Bydgoszcz,Poland
I. DambuevaInstitute of General and Experimental Biology, Russian Academyof Sciences, 670047, Ulan-Ude, Russia
C. DorzhuTuva State University, 667035, Kyzyl, Russia
F. LuzinaInstitute of Professional Diseases and Hygiene Problems,Russian Academy of Medical Sciences, Novokuznetsk654041, Russia
I. ZakharovAnimal Comparative Genetics Laboratory, Vavilov Institute ofGeneral Genetics, Russian Academy of Sciences,Gubkin Str. 3, Moscow, Russia
Hum Genet (2006) 118: 591–604DOI 10.1007/s00439-005-0076-y

Analogous combinations of both the Mousterian andLate Paleolithic elements are documented in theTransbaikal and Angara River basin regions, as well asin the upper Yenisei area (Chlachula 2001). They alsohave been recorded in synchronous industries inMongolia and North China thus testifying the similarprocesses of the cultural development as in Siberia(Okladnikov 1981; Derevianko 1998). During the fol-lowing interval, i.e., at the end of the Karginsk inter-stadial and in the early last glacial (Sartan) stage, moreprogressive Late Paleolithic cultures with an advancedtechnique of the prismatic core flaking reminiscent ofthe European traditions emerged in vast areas ofSiberia: on the eastern margin of the West SiberianLowland, in the upper Yenisei River basin, as well asin the Angara River basin (Derevianko and Zenin1996; Vasiliev et al. 1999). Such industries, however,are absent in the Altai area, indicative of complex andregionally divergent cultural evolution in different partsof Siberia (Chlachula 2001).
Unfortunately, archaeological records alone withthe lack of human skeletal remains are inconclusiveabout the anthropological traits, which were charac-teristic for the Upper Paleolithic Siberian population.East Asian features thought to have been derived fromearly modern East Asians exist in the tooth from theDenisova Cave in the Altai region and in human re-mains from the Afontova Gora II site and indicatethat the East Asians had moved into southwesternSiberia by 21,000 B.P. or even earlier (Alekseev 1998).Yet, the Upper Paleolithic artifacts from the 23,000-year-old Mal’ta site near Lake Baikal in south-centralSiberia (Medvedev et al. 1996) have been found inassociation with skeletal remains that bear similarmorphology with contemporary anatomically modernhumans teeth from Europe thus providing the evi-dence for links between Siberia and the West duringthe Upper Paleolithic. Thus, on assuming that duringthe Upper Paleolithic the population of South Siberiawas closely related to other East Asian populations,then during the Neolithic, admixture with populationsfrom Eastern Europe probably occurred. The preva-lence of European features among steppe zoneinhabitants of Tuva, Altai, Khakassia, and WestMongolia became the most significant since theBronze Age or even earlier (Alexeev and Gohman1984; Alexeev 1989). The boundary of the EasternEuropean influence is clearly fixed at Lake Baikal. Tothe east of Baikal no palaeoanthropological find bearsany traces of European admixture (Alekseev 1998).
Thus, the considerable ethnic diversity in SouthSiberia was largely shaped by migration processes thathad occurred since the initial colonization of the region.Historically, a complex network of migrations can betraced from Central, Eastern Asia, and Western Eurasia(Alexeev 1989; Vasiliev 1993; Derevianko 1998).
Classical genetic data, covering most of the present-day aboriginal populations living in Siberia showed ahigh degree of between-population heterogeneity often
attributed to low population densities (Rychkov andSheremetyeva 1980; Cavalli-Sforza et al. 1994; Rych-kov et al. 2000) as well as the existence of consider-able correlations among geographic, linguistic, andgenetic variation (Cavalli-Sforza et al. 1994; Karafetet al. 1994). Recent genetic studies of Siberian popu-lations involving the high-resolution mitochondrialDNA (mtDNA) and Y-chromosomal markers havebeen focused mainly on the peopling of the Americas(Shields et al. 1993; Torroni et al. 1993; Sukerniket al. 1996; Starikovskaya et al. 1998; Karafet et al.1999; Santos et al. 1999; Lell et al. 2002; Derenkoet al. 2000; 2001; Bortolini et al., 2003), on the historyof early human migrations in Eurasia (Zerjal et al.1997; Wells et al. 2001; Derbeneva et al. 2002), EastAsia (Su et al. 1999; Ke et al. 2001; Karafet et al.2001) or particular regions of Siberia (Schurr et al.1999; Pakendorf et al. 2003; Derenko et al. 2003;Fedorova et al. 2003; Puzyrev et al. 2003). MtDNAstudies revealed that modern indigenous South Sibe-rian populations show a complex pattern of themtDNA structure reflecting diverse interactions thatoccurred at different times between eastern and wes-tern Eurasian gene pools (Derenko et al. 2001; Pa-kendorf et al. 2003; Derenko et al. 2003; Fedorovaet al. 2003; Puzyrev et al. 2003). It has also beenshown that the populations of South Siberia share acommon genetic substratum with the Central and EastAsian populations (Derenko et al. 2002; 2003; Pa-kendorf et al. 2003), whereas ethnic groups of north-eastern Siberia (Koryaks and Itel’mens) have strongergenetic affinities with eastern Siberian/East Asianpopulations (Schurr et al. 1999). The Y-chromosomestudy of Su et al. (1999) (see also Shi et al. 2005)suggested that territories of Northern China andSouth Siberia was subsequently populated frommainland Southeast Asia during the last Ice Age,whereas Karafet et al. (2001, 2002) underscored animportant role of Central Asia in the early peopling ofSiberia. In general, a comprehensive survey of Y-chromosome SNP markers revealed that modernaboriginal Siberian populations show the pattern ofreduced haplogroup diversity within populationscombined with high level of between-population dif-ferentiation and underscored the important role ofdirected dispersals, range expansions, and long-dis-tance colonizations bound by common ethnic andlinguistic affiliation in shaping the genetic landscape ofSiberia (Karafet et al. 2002).
Although the Y-chromosome variability data coverall major North Asian regional groups, the detaileddata sets for the ethnical groups living in Eastern andSouth Siberia are still incomplete. The present researchwas aimed at understanding the Y-chromosomalcomposition of 11 Altaic-speaking populations, occu-pying the broader area of Altai–Sayan and Baikalregions, and estimating the level of relative contribu-tion of different genetic components in their paternalgene pools.
592
Materials and methods
Subjects
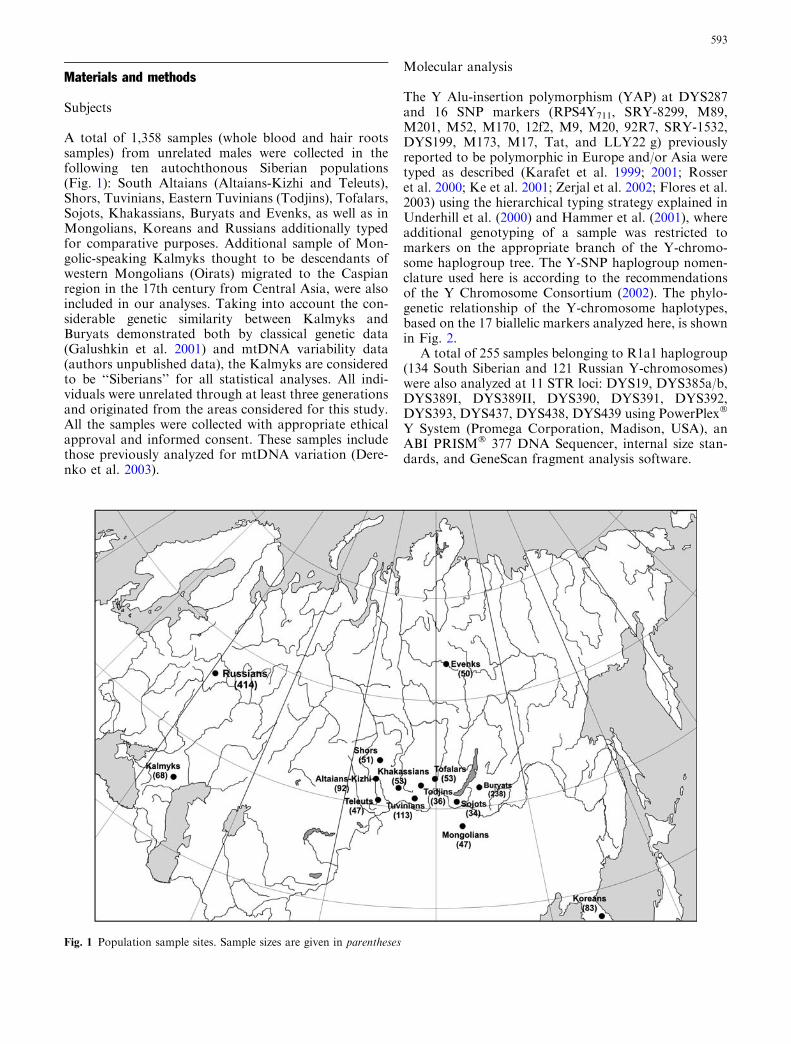
A total of 1,358 samples (whole blood and hair rootssamples) from unrelated males were collected in thefollowing ten autochthonous Siberian populations(Fig. 1): South Altaians (Altaians-Kizhi and Teleuts),Shors, Tuvinians, Eastern Tuvinians (Todjins), Tofalars,Sojots, Khakassians, Buryats and Evenks, as well as inMongolians, Koreans and Russians additionally typedfor comparative purposes. Additional sample of Mon-golic-speaking Kalmyks thought to be descendants ofwestern Mongolians (Oirats) migrated to the Caspianregion in the 17th century from Central Asia, were alsoincluded in our analyses. Taking into account the con-siderable genetic similarity between Kalmyks andBuryats demonstrated both by classical genetic data(Galushkin et al. 2001) and mtDNA variability data(authors unpublished data), the Kalmyks are consideredto be ‘‘Siberians’’ for all statistical analyses. All indi-viduals were unrelated through at least three generationsand originated from the areas considered for this study.All the samples were collected with appropriate ethicalapproval and informed consent. These samples includethose previously analyzed for mtDNA variation (Dere-nko et al. 2003).
Molecular analysis
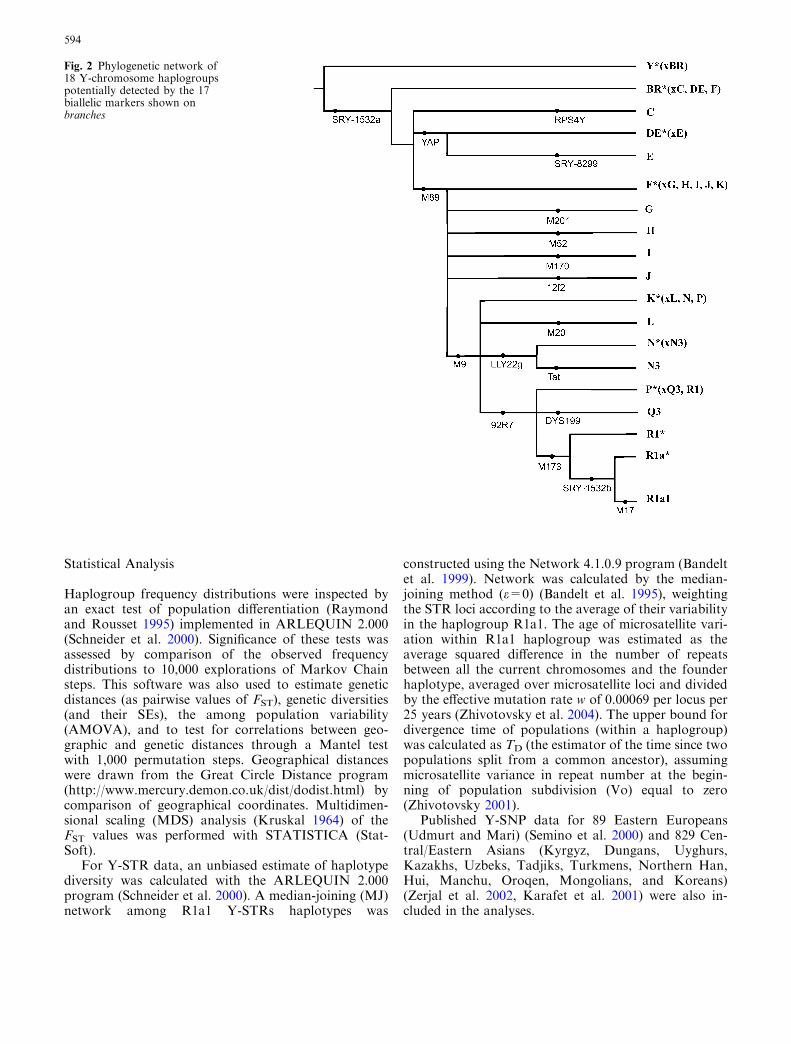
The Y Alu-insertion polymorphism (YAP) at DYS287and 16 SNP markers (RPS4Y711, SRY-8299, M89,M201, M52, M170, 12f2, M9, M20, 92R7, SRY-1532,DYS199, M173, M17, Tat, and LLY22 g) previouslyreported to be polymorphic in Europe and/or Asia weretyped as described (Karafet et al. 1999; 2001; Rosseret al. 2000; Ke et al. 2001; Zerjal et al. 2002; Flores et al.2003) using the hierarchical typing strategy explained inUnderhill et al. (2000) and Hammer et al. (2001), whereadditional genotyping of a sample was restricted tomarkers on the appropriate branch of the Y-chromo-some haplogroup tree. The Y-SNP haplogroup nomen-clature used here is according to the recommendationsof the Y Chromosome Consortium (2002). The phylo-genetic relationship of the Y-chromosome haplotypes,based on the 17 biallelic markers analyzed here, is shownin Fig. 2.
A total of 255 samples belonging to R1a1 haplogroup(134 South Siberian and 121 Russian Y-chromosomes)were also analyzed at 11 STR loci: DYS19, DYS385a/b,DYS389I, DYS389II, DYS390, DYS391, DYS392,DYS393, DYS437, DYS438, DYS439 using PowerPlex�
Y System (Promega Corporation, Madison, USA), anABI PRISM� 377 DNA Sequencer, internal size stan-dards, and GeneScan fragment analysis software.
Fig. 1 Population sample sites. Sample sizes are given in parentheses
593
Statistical Analysis
Haplogroup frequency distributions were inspected byan exact test of population differentiation (Raymondand Rousset 1995) implemented in ARLEQUIN 2.000(Schneider et al. 2000). Significance of these tests wasassessed by comparison of the observed frequencydistributions to 10,000 explorations of Markov Chainsteps. This software was also used to estimate geneticdistances (as pairwise values of FST), genetic diversities(and their SEs), the among population variability(AMOVA), and to test for correlations between geo-graphic and genetic distances through a Mantel testwith 1,000 permutation steps. Geographical distanceswere drawn from the Great Circle Distance program(http://www.mercury.demon.co.uk/dist/dodist.html) bycomparison of geographical coordinates. Multidimen-sional scaling (MDS) analysis (Kruskal 1964) of theFST values was performed with STATISTICA (Stat-Soft).
For Y-STR data, an unbiased estimate of haplotypediversity was calculated with the ARLEQUIN 2.000program (Schneider et al. 2000). A median-joining (MJ)network among R1a1 Y-STRs haplotypes was
constructed using the Network 4.1.0.9 program (Bandeltet al. 1999). Network was calculated by the median-joining method (e=0) (Bandelt et al. 1995), weightingthe STR loci according to the average of their variabilityin the haplogroup R1a1. The age of microsatellite vari-ation within R1a1 haplogroup was estimated as theaverage squared difference in the number of repeatsbetween all the current chromosomes and the founderhaplotype, averaged over microsatellite loci and dividedby the effective mutation rate w of 0.00069 per locus per25 years (Zhivotovsky et al. 2004). The upper bound fordivergence time of populations (within a haplogroup)was calculated as TD (the estimator of the time since twopopulations split from a common ancestor), assumingmicrosatellite variance in repeat number at the begin-ning of population subdivision (Vo) equal to zero(Zhivotovsky 2001).
Published Y-SNP data for 89 Eastern Europeans(Udmurt and Mari) (Semino et al. 2000) and 829 Cen-tral/Eastern Asians (Kyrgyz, Dungans, Uyghurs,Kazakhs, Uzbeks, Tadjiks, Turkmens, Northern Han,Hui, Manchu, Oroqen, Mongolians, and Koreans)(Zerjal et al. 2002, Karafet et al. 2001) were also in-cluded in the analyses.
Fig. 2 Phylogenetic network of18 Y-chromosome haplogroupspotentially detected by the 17biallelic markers shown onbranches
594
Results and discussion
Haplogroup distribution
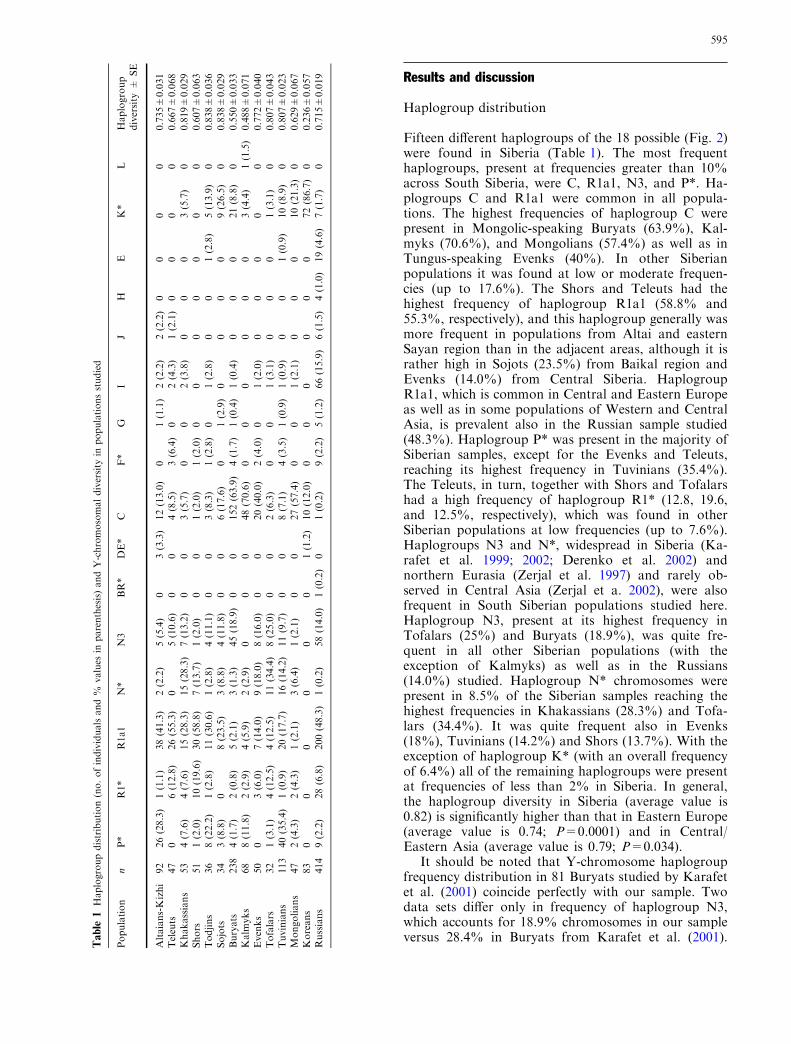
Fifteen different haplogroups of the 18 possible (Fig. 2)were found in Siberia (Table 1). The most frequenthaplogroups, present at frequencies greater than 10%across South Siberia, were C, R1a1, N3, and P*. Ha-plogroups C and R1a1 were common in all popula-tions. The highest frequencies of haplogroup C werepresent in Mongolic-speaking Buryats (63.9%), Kal-myks (70.6%), and Mongolians (57.4%) as well as inTungus-speaking Evenks (40%). In other Siberianpopulations it was found at low or moderate frequen-cies (up to 17.6%). The Shors and Teleuts had thehighest frequency of haplogroup R1a1 (58.8% and55.3%, respectively), and this haplogroup generally wasmore frequent in populations from Altai and easternSayan region than in the adjacent areas, although it israther high in Sojots (23.5%) from Baikal region andEvenks (14.0%) from Central Siberia. HaplogroupR1a1, which is common in Central and Eastern Europeas well as in some populations of Western and CentralAsia, is prevalent also in the Russian sample studied(48.3%). Haplogroup P* was present in the majority ofSiberian samples, except for the Evenks and Teleuts,reaching its highest frequency in Tuvinians (35.4%).The Teleuts, in turn, together with Shors and Tofalarshad a high frequency of haplogroup R1* (12.8, 19.6,and 12.5%, respectively), which was found in otherSiberian populations at low frequencies (up to 7.6%).Haplogroups N3 and N*, widespread in Siberia (Ka-rafet et al. 1999; 2002; Derenko et al. 2002) andnorthern Eurasia (Zerjal et al. 1997) and rarely ob-served in Central Asia (Zerjal et a. 2002), were alsofrequent in South Siberian populations studied here.Haplogroup N3, present at its highest frequency inTofalars (25%) and Buryats (18.9%), was quite fre-quent in all other Siberian populations (with theexception of Kalmyks) as well as in the Russians(14.0%) studied. Haplogroup N* chromosomes werepresent in 8.5% of the Siberian samples reaching thehighest frequencies in Khakassians (28.3%) and Tofa-lars (34.4%). It was quite frequent also in Evenks(18%), Tuvinians (14.2%) and Shors (13.7%). With theexception of haplogroup K* (with an overall frequencyof 6.4%) all of the remaining haplogroups were presentat frequencies of less than 2% in Siberia. In general,the haplogroup diversity in Siberia (average value is0.82) is significantly higher than that in Eastern Europe(average value is 0.74; P=0.0001) and in Central/Eastern Asia (average value is 0.79; P=0.034).
It should be noted that Y-chromosome haplogroupfrequency distribution in 81 Buryats studied by Karafetet al. (2001) coincide perfectly with our sample. Twodata sets differ only in frequency of haplogroup N3,which accounts for 18.9% chromosomes in our sampleversus 28.4% in Buryats from Karafet et al. (2001).
Table
1Haplogroupdistribution(no.ofindividuals
and%
values
inparenthesis)andY-chromosomaldiversity
inpopulationsstudied
Population
nP*
R1*
R1a1
N*
N3
BR*
DE*
CF*
GI
JH
EK*
LHaplogroup
diversity
±SE
Altaians-Kizhi
92
26(28.3)
1(1.1)
38(41.3)
2(2.2)
5(5.4)
03(3.3)
12(13.0)
01(1.1)
2(2.2)
2(2.2)
00
00
0.735±0.031
Teleuts
47
06(12.8)
26(55.3)
05(10.6)
00
4(8.5)
3(6.4)
02(4.3)
1(2.1)
00
00
0.667±0.068
Khakassians
53
4(7.6)
4(7.6)
15(28.3)
15(28.3)
7(13.2)
00
3(5.7)
00
2(3.8)
00
03(5.7)
00.819±0.029
Shors
51
1(2.0)
10(19.6)
30(58.8)
7(13.7)
1(2.0)
00
1(2.0)
1(2.0)
00
00
00
00.607±0.063
Todjins
36
8(22.2)
1(2.8)
11(30.6)
1(2.8)
4(11.1)
00
3(8.3)
1(2.8)
01(2.8)
00
1(2.8)
5(13.9)
00.838±0.036
Sojots
34
3(8.8)
08(23.5)
3(8.8)
4(11.8)
00
6(17.6)
01(2.9)
00
00
9(26.5)
00.838±0.029
Buryats
238
4(1.7)
2(0.8)
5(2.1)
3(1.3)
45(18.9)
00
152(63.9)
4(1.7)
1(0.4)
1(0.4)
00
021(8.8)
00.550±0.033
Kalm
yks
68
8(11.8)
2(2.9)
4(5.9)
2(2.9)
00
048(70.6)
00
00
00
3(4.4)
1(1.5)
0.488±0.071
Evenks
50
03(6.0)
7(14.0)
9(18.0)
8(16.0)
00
20(40.0)
2(4.0)
01(2.0)
00
00
00.772±0.040
Tofalars
32
1(3.1)
4(12.5)
4(12.5)
11(34.4)
8(25.0)
00
2(6.3)
00
1(3.1)
00
01(3.1)
00.807±0.043
Tuvinians
113
40(35.4)
1(0.9)
20(17.7)
16(14.2)
11(9.7)
00
8(7.1)
4(3.5)
1(0.9)
1(0.9)
00
1(0.9)
10(8.9)
00.807±0.023
Mongolians
47
2(4.3)
2(4.3)
1(2.1)
3(6.4)
1(2.1)
00
27(57.4)
00
1(2.1)
00
010(21.3)
00.629±0.067
Koreans
83
00
00
00
1(1.2)
10(12.0)
00
00
00
72(86.7)
00.236±0.057
Russians
414
9(2.2)
28(6.8)
200(48.3)
1(0.2)
58(14.0)
1(0.2)
01(0.2)
9(2.2)
5(1.2)
66(15.9)
6(1.5)
4(1.0)
19(4.6)
7(1.7)
00.715±0.019
595
The similar frequency distribution is observed also be-tween our Evenks and Evenks from Yenisei regionstudied by Lell et al. (2002), whereas a small sample ofOkhotsk Evenks from Lell et al. (2002) and Evenks fromKarafet et al. (2001) differ significantly from our samplein frequencies of haplogroups R1a1 and N*. A similarcase of even more significant frequency differenceswithin the same ethnic group occur between our Tofa-lars and the 19 Tofalars studied by Lell et al. (2002).Both samples have the same (highest in Siberia) fre-quency of haplogroup N* (34.4 and 36.8%, respec-tively), whereas the frequency of haplogroup N3 inTofalars from Lell et al. (2002) exceed significantly thesame value for Tofalars studied here (47.4 and 25%,respectively). Moreover, haplogroups R1* and R1a1were revealed in our sample with the same frequency of12.5%, whereas only haplogroup R1a1 with a low fre-quency (5.3%) was found in Tofalars studied by Lellet al. (2002). There are also some differences in haplo-group distribution pattern observed between two Tuvi-nian samples. A lower frequencies of haplogroups N3(9.7 vs. 17.5%), C (7.1 vs. 30%) and N* (14.2 vs. 27.5%)as well as the higher frequencies of haplogroups P* (35.4vs. 15%) and R1a1 (17.7 vs. 7.5%) distinguished our 113Tuvinians from 40 Tuvinians studied by Lell et al.(2002). Such frequency differences observed betweensamples from the same ethnic group could be best ex-plained by inadequate sample sizes (in some cases) orwithin-population structure.
Population structure and affinities
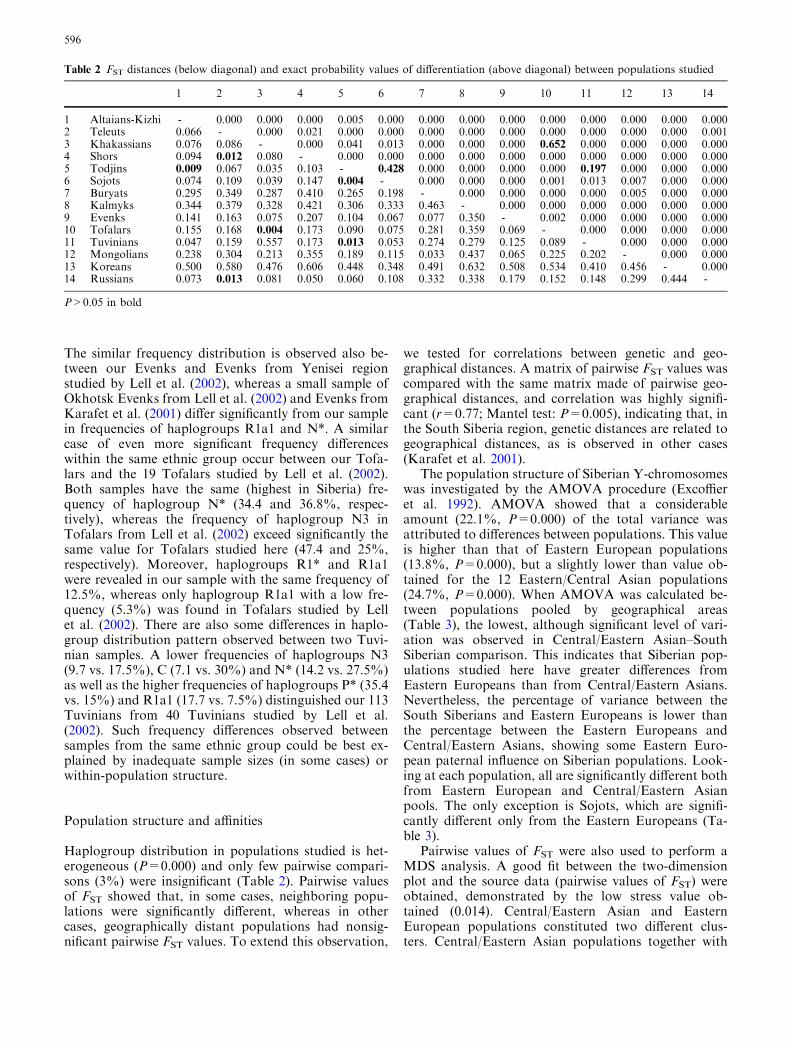
Haplogroup distribution in populations studied is het-erogeneous (P=0.000) and only few pairwise compari-sons (3%) were insignificant (Table 2). Pairwise valuesof FST showed that, in some cases, neighboring popu-lations were significantly different, whereas in othercases, geographically distant populations had nonsig-nificant pairwise FST values. To extend this observation,
we tested for correlations between genetic and geo-graphical distances. A matrix of pairwise FST values wascompared with the same matrix made of pairwise geo-graphical distances, and correlation was highly signifi-cant (r=0.77; Mantel test: P=0.005), indicating that, inthe South Siberia region, genetic distances are related togeographical distances, as is observed in other cases(Karafet et al. 2001).
The population structure of Siberian Y-chromosomeswas investigated by the AMOVA procedure (Excoffieret al. 1992). AMOVA showed that a considerableamount (22.1%, P=0.000) of the total variance wasattributed to differences between populations. This valueis higher than that of Eastern European populations(13.8%, P=0.000), but a slightly lower than value ob-tained for the 12 Eastern/Central Asian populations(24.7%, P=0.000). When AMOVA was calculated be-tween populations pooled by geographical areas(Table 3), the lowest, although significant level of vari-ation was observed in Central/Eastern Asian–SouthSiberian comparison. This indicates that Siberian pop-ulations studied here have greater differences fromEastern Europeans than from Central/Eastern Asians.Nevertheless, the percentage of variance between theSouth Siberians and Eastern Europeans is lower thanthe percentage between the Eastern Europeans andCentral/Eastern Asians, showing some Eastern Euro-pean paternal influence on Siberian populations. Look-ing at each population, all are significantly different bothfrom Eastern European and Central/Eastern Asianpools. The only exception is Sojots, which are signifi-cantly different only from the Eastern Europeans (Ta-ble 3).
Pairwise values of FST were also used to perform aMDS analysis. A good fit between the two-dimensionplot and the source data (pairwise values of FST) wereobtained, demonstrated by the low stress value ob-tained (0.014). Central/Eastern Asian and EasternEuropean populations constituted two different clus-ters. Central/Eastern Asian populations together with
Table 2 FST distances (below diagonal) and exact probability values of differentiation (above diagonal) between populations studied
1 2 3 4 5 6 7 8 9 10 11 12 13 14
1 Altaians-Kizhi - 0.000 0.000 0.000 0.005 0.000 0.000 0.000 0.000 0.000 0.000 0.000 0.000 0.0002 Teleuts 0.066 - 0.000 0.021 0.000 0.000 0.000 0.000 0.000 0.000 0.000 0.000 0.000 0.0013 Khakassians 0.076 0.086 - 0.000 0.041 0.013 0.000 0.000 0.000 0.652 0.000 0.000 0.000 0.0004 Shors 0.094 0.012 0.080 - 0.000 0.000 0.000 0.000 0.000 0.000 0.000 0.000 0.000 0.0005 Todjins 0.009 0.067 0.035 0.103 - 0.428 0.000 0.000 0.000 0.000 0.197 0.000 0.000 0.0006 Sojots 0.074 0.109 0.039 0.147 0.004 - 0.000 0.000 0.000 0.001 0.013 0.007 0.000 0.0007 Buryats 0.295 0.349 0.287 0.410 0.265 0.198 - 0.000 0.000 0.000 0.000 0.005 0.000 0.0008 Kalmyks 0.344 0.379 0.328 0.421 0.306 0.333 0.463 - 0.000 0.000 0.000 0.000 0.000 0.0009 Evenks 0.141 0.163 0.075 0.207 0.104 0.067 0.077 0.350 - 0.002 0.000 0.000 0.000 0.00010 Tofalars 0.155 0.168 0.004 0.173 0.090 0.075 0.281 0.359 0.069 - 0.000 0.000 0.000 0.00011 Tuvinians 0.047 0.159 0.557 0.173 0.013 0.053 0.274 0.279 0.125 0.089 - 0.000 0.000 0.00012 Mongolians 0.238 0.304 0.213 0.355 0.189 0.115 0.033 0.437 0.065 0.225 0.202 - 0.000 0.00013 Koreans 0.500 0.580 0.476 0.606 0.448 0.348 0.491 0.632 0.508 0.534 0.410 0.456 - 0.00014 Russians 0.073 0.013 0.081 0.050 0.060 0.108 0.332 0.338 0.179 0.152 0.148 0.299 0.444 -
P>0.05 in bold
596
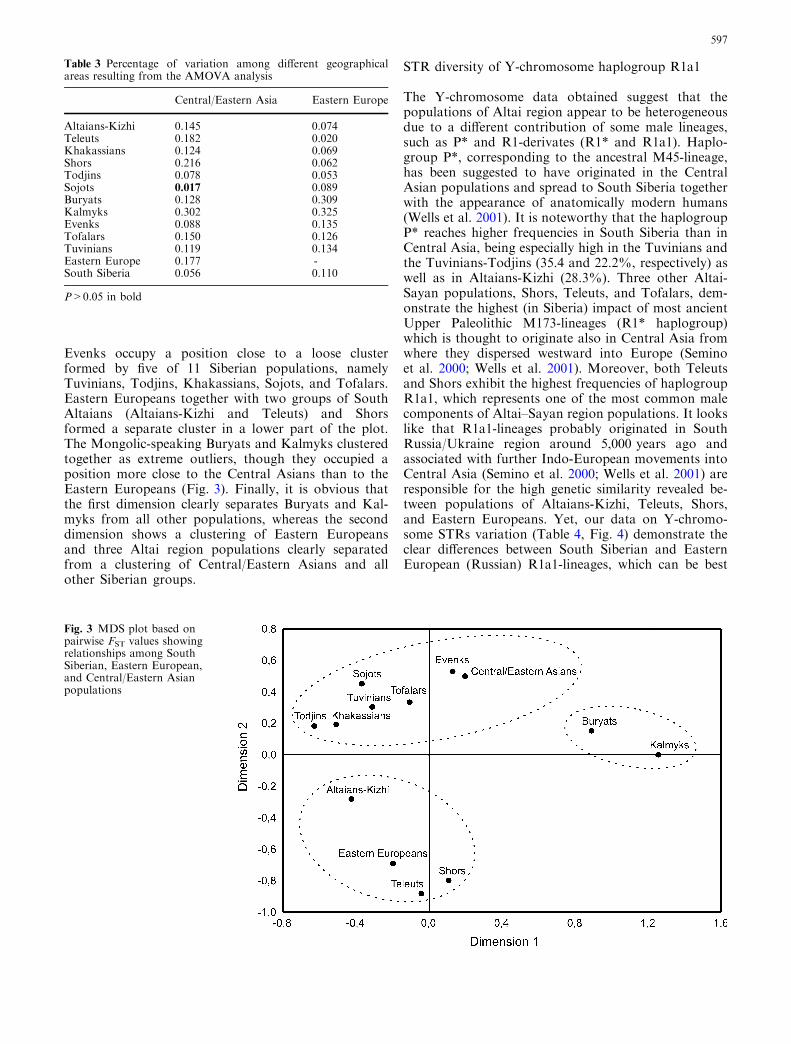
Evenks occupy a position close to a loose clusterformed by five of 11 Siberian populations, namelyTuvinians, Todjins, Khakassians, Sojots, and Tofalars.Eastern Europeans together with two groups of SouthAltaians (Altaians-Kizhi and Teleuts) and Shorsformed a separate cluster in a lower part of the plot.The Mongolic-speaking Buryats and Kalmyks clusteredtogether as extreme outliers, though they occupied aposition more close to the Central Asians than to theEastern Europeans (Fig. 3). Finally, it is obvious thatthe first dimension clearly separates Buryats and Kal-myks from all other populations, whereas the seconddimension shows a clustering of Eastern Europeansand three Altai region populations clearly separatedfrom a clustering of Central/Eastern Asians and allother Siberian groups.
STR diversity of Y-chromosome haplogroup R1a1
The Y-chromosome data obtained suggest that thepopulations of Altai region appear to be heterogeneousdue to a different contribution of some male lineages,such as P* and R1-derivates (R1* and R1a1). Haplo-group P*, corresponding to the ancestral M45-lineage,has been suggested to have originated in the CentralAsian populations and spread to South Siberia togetherwith the appearance of anatomically modern humans(Wells et al. 2001). It is noteworthy that the haplogroupP* reaches higher frequencies in South Siberia than inCentral Asia, being especially high in the Tuvinians andthe Tuvinians-Todjins (35.4 and 22.2%, respectively) aswell as in Altaians-Kizhi (28.3%). Three other Altai-Sayan populations, Shors, Teleuts, and Tofalars, dem-onstrate the highest (in Siberia) impact of most ancientUpper Paleolithic M173-lineages (R1* haplogroup)which is thought to originate also in Central Asia fromwhere they dispersed westward into Europe (Seminoet al. 2000; Wells et al. 2001). Moreover, both Teleutsand Shors exhibit the highest frequencies of haplogroupR1a1, which represents one of the most common malecomponents of Altai–Sayan region populations. It lookslike that R1a1-lineages probably originated in SouthRussia/Ukraine region around 5,000 years ago andassociated with further Indo-European movements intoCentral Asia (Semino et al. 2000; Wells et al. 2001) areresponsible for the high genetic similarity revealed be-tween populations of Altaians-Kizhi, Teleuts, Shors,and Eastern Europeans. Yet, our data on Y-chromo-some STRs variation (Table 4, Fig. 4) demonstrate theclear differences between South Siberian and EasternEuropean (Russian) R1a1-lineages, which can be best
Fig. 3 MDS plot based onpairwise FST values showingrelationships among SouthSiberian, Eastern European,and Central/Eastern Asianpopulations
Table 3 Percentage of variation among different geographicalareas resulting from the AMOVA analysis
Central/Eastern Asia Eastern Europe
Altaians-Kizhi 0.145 0.074Teleuts 0.182 0.020Khakassians 0.124 0.069Shors 0.216 0.062Todjins 0.078 0.053Sojots 0.017 0.089Buryats 0.128 0.309Kalmyks 0.302 0.325Evenks 0.088 0.135Tofalars 0.150 0.126Tuvinians 0.119 0.134Eastern Europe 0.177 -South Siberia 0.056 0.110
P>0.05 in bold
597

Table
4Frequency
ofR1a1haplotypes
inSouth
SiberiansandRussians
Haplotype
No.ofrepeats
atlocus
Populationsa
Rus(121)
DYS
19
DYS
385a
DYS
385b
DYS
389I
DYS
389II
DYS
390
DYS
391
DYS
392
DYS
393
DYS
437
DYS
438
DYS
439
Tv
(15)
Td
(1)
Sh
(23)
Kh
(18)
Evk
(7)
St
(7)
Tel
(20)
Alt
(35)
Tf
(3)
Br
(5)
Sib
(total)
(134)
116
11
15
13
17
23
11
11
13
14
11
10
10
00
00
00
00
10
215
11
15
13
16
24
11
11
13
14
11
10
00
10
00
00
00
10
315
11
15
13
16
24
11
11
13
14
11
11
00
01
00
00
00
10
416
11
15
13
16
24
11
11
13
14
11
10
00
33
00
00
00
61
516
11
15
13
16
24
10
12
14
14
11
10
00
00
10
00
00
10
615
11
15
13
17
25
12
11
13
14
12
10
00
00
10
00
00
10
716
11
14
13
17
24
11
11
13
14
11
10
00
00
02
00
00
22
816
11
14
13
17
24
12
11
13
14
11
10
00
01
00
10
00
20
916
11
14
13
17
24
12
11
13
14
11
11
00
01
00
00
00
10
10
14
11
15
13
17
24
11
11
13
14
11
10
00
00
20
00
00
20
11
15
12
15
13
17
24
11
11
13
14
11
10
00
20
00
00
00
20
12
15
11
15
13
17
24
11
11
13
14
11
10
00
82
00
00
00
10
1
13
15
11
15
13
17
24
10
11
13
14
11
10
00
07
00
20
00
90
14
16
11
15
13
17
24
11
11
13
14
11
10
00
10
00
00
00
12
15
16
12
17
14
17
24
11
11
13
14
11
11
00
00
00
01
00
10
16
16
11
14
13
18
24
11
11
13
14
11
10
11
01
05
00
00
80
17
15
11
15
13
18
24
10
11
13
14
11
10
00
01
00
00
00
10
18
17
11
15
13
18
24
11
11
13
14
11
10
00
01
00
00
00
10
19
16
12
14
14
18
24
911
13
14
11
10
00
10
00
00
00
10
20
16
11
14
13
16
25
10
11
13
14
11
11
10
00
00
00
00
14
21
16
11
14
13
16
25
11
11
13
14
11
10
00
00
00
00
02
21
22
16
11
13
13
17
25
10
11
13
14
11
10
00
00
00
01
00
10
23
16
11
14
13
17
25
10
11
13
14
11
11
00
00
00
10
00
10
24
16
11
14
13
17
25
11
11
13
14
11
10
00
00
10
00
00
12
25
15
11
15
13
17
25
11
11
13
14
11
10
00
10
00
00
01
20
26
16
11
15
13
17
25
11
11
13
14
11
10
10
00
10
00
11
46
27
15
11
14
14
17
25
11
11
13
14
11
11
00
10
00
00
00
10
28
15
11
14
14
17
25
10
11
13
14
11
11
10
00
00
00
00
10
29
16
11
14
14
17
25
11
11
13
14
11
11
40
50
00
20
00
11
030
16
11
14
14
17
25
11
11
13
14
11
10
00
00
00
45
00
90
31
15
11
17
14
17
25
11
11
13
14
11
11
00
00
00
20
00
20
32
16
11
14
13
18
25
11
11
13
14
10
10
10
00
00
00
00
10
33
16
11
14
13
18
25
11
11
13
14
11
10
10
00
10
01
00
30
34
16
11
14
13
18
25
11
12
13
14
11
10
10
00
00
00
00
10
35
16
11
15
13
18
25
11
11
13
14
11
11
00
00
00
00
20
20
36
17
11
15
13
18
25
11
11
14
14
11
11
00
00
00
00
01
10
37
16
11
16
13
18
25
10
11
13
14
11
10
10
00
00
00
00
10
38
16
11
11
14
18
25
11
11
13
14
11
10
00
00
00
01
00
10
39
15
11
14
14
18
25
11
11
13
14
11
10
00
00
00
21
00
31
40
16
11
14
14
18
25
11
11
13
14
11
10
20
00
00
311
00
16
041
16
11
14
14
18
25
10
11
13
14
11
10
00
00
00
12
00
31
42
16
11
14
14
18
25
11
11
13
14
12
10
00
00
00
01
00
10
43
16
12
14
14
18
25
10
11
13
14
11
10
00
00
00
01
00
10
44
16
11
14
15
18
25
11
11
13
14
11
10
00
00
00
01
00
10
45
16
11
17
14
17
26
11
11
13
14
11
11
00
00
00
03
00
30
46
17
11
17
14
17
26
11
11
13
14
11
11
00
00
00
01
00
10
598

Table
4(C
ontd.)
Haplotype
No.ofrepeats
atlocus
Populationsa
Rus(121)
DYS
19
DYS
385a
DYS
385b
DYS
389I
DYS
389II
DYS
390
DYS
391
DYS
392
DYS
393
DYS
437
DYS
438
DYS
439
Tv
(15)
Td
(1)
Sh
(23)
Kh
(18)
Evk
(7)
St
(7)
Tel
(20)
Alt
(35)
Tf
(3)
Br
(5)
Sib
(total)
(134)
47
16
11
11
14
18
26
11
11
13
14
11
10
00
00
00
20
00
20
48
16
11
14
14
18
26
10
11
13
14
11
10
00
00
00
01
00
10
49
16
11
17
14
18
26
10
11
13
14
11
11
00
00
00
02
00
20
50
16
11
17
14
18
26
11
11
13
14
11
11
00
00
00
01
00
10
51
16
11
18
14
18
26
10
11
13
14
11
11
00
00
00
01
00
10
52
16
11
14
13
17
25
11
11
13
14
11
11
00
00
00
00
00
04
53
16
11
15
13
17
26
11
11
13
14
11
10
00
00
00
00
00
03
54
15
11
14
13
16
25
10
11
13
14
11
11
00
00
00
00
00
03
55
16
10
14
13
17
25
10
11
13
14
11
10
00
00
00
00
00
02
56
16
11
14
13
16
26
11
11
13
14
11
11
00
00
00
00
00
02
57
16
11
14
13
16
26
10
11
13
14
11
11
00
00
00
00
00
02
58
16
12
14
13
16
25
10
11
13
14
11
11
00
00
00
00
00
02
59
16
11
14
13
17
26
11
11
13
14
11
10
00
00
00
00
00
02
60
15
11
14
13
17
24
11
11
13
14
11
10
00
00
00
00
00
02
61
15
11
15
13
17
25
11
11
13
14
11
11
00
00
00
00
00
02
62
15
11
15
13
18
25
11
11
13
14
11
10
00
00
00
00
00
02
63
17
11
14
13
17
25
11
11
13
14
11
10
00
00
00
00
00
01
64
16
11
14
13
17
23
10
11
13
14
11
10
00
00
00
00
00
01
65
16
12
15
13
16
25
11
11
13
14
11
10
00
00
00
00
00
01
66
15
12
14
13
16
25
10
11
13
14
11
11
00
00
00
00
00
01
67
16
11
15
13
18
25
11
11
13
14
11
10
00
00
00
00
00
01
68
15
11
11
12
17
23
11
11
13
14
12
10
00
00
00
00
00
01
69
16
11
15
14
16
26
10
11
13
14
11
10
00
00
00
00
00
01
70
16
10
14
13
16
24
10
11
13
14
11
11
00
00
00
00
00
01
71
15
11
16
13
18
25
10
11
13
14
11
10
00
00
00
00
00
01
72
17
11
15
13
16
25
11
11
13
14
11
10
00
00
00
00
00
01
73
17
11
14
13
16
25
11
11
13
14
11
10
00
00
00
00
00
01
74
15
11
13
13
16
25
10
11
13
14
11
11
00
00
00
00
00
01
75
16
12
15
13
16
24
10
11
13
14
11
10
00
00
00
00
00
01
76
16
11
14
13
16
25
11
11
13
14
11
12
00
00
00
00
00
01
77
15
11
15
13
17
25
10
11
13
14
11
10
00
00
00
00
00
01
78
15
11
15
13
16
25
10
11
13
14
11
10
00
00
00
00
00
01
79
16
11
14
13
17
25
11
11
13
14
11
13
00
00
00
00
00
01
80
16
11
14
14
19
24
11
11
13
14
12
10
00
00
00
00
00
01
81
17
11
14
13
19
25
11
11
13
14
11
10
00
00
00
00
00
01
82
16
11
11
13
17
25
11
11
13
14
11
10
00
00
00
00
00
01
83
16
11
14
13
16
26
11
11
13
14
11
10
00
00
00
00
00
01
84
16
11
17
12
17
25
11
11
13
14
11
10
00
00
00
00
00
01
85
17
11
14
14
17
25
11
11
13
14
11
10
00
00
00
00
00
01
86
16
11
14
13
16
25
10
11
13
14
11
12
00
00
00
00
00
01
87
16
11
14
13
17
24
11
11
14
14
11
10
00
00
00
00
00
01
88
16
11
14
14
17
25
10
11
13
14
11
10
00
00
00
00
00
01
89
16
11
15
14
17
25
10
11
13
14
11
11
00
00
00
00
00
01
90
16
11
15
13
17
24
11
11
14
14
11
10
00
00
00
00
00
01
91
15
11
14
13
16
24
10
11
14
14
11
11
00
00
00
00
00
01
92
15
11
15
13
18
24
11
11
13
14
11
10
00
00
00
00
00
01
93
16
11
14
13
17
24
10
11
13
14
11
11
00
00
00
00
00
01
599

Table
4(C
ontd.)
Haplotype
No.ofrepeats
atlocus
Populationsa
Rus(121)
DYS
19
DYS
385a
DYS
385b
DYS
389I
DYS
389II
DYS
390
DYS
391
DYS
392
DYS
393
DYS
437
DYS
438
DYS
439
Tv
(15)
Td
(1)
Sh
(23)
Kh
(18)
Evk
(7)
St
(7)
Tel
(20)
Alt
(35)
Tf
(3)
Br
(5)
Sib
(total)
(134)
94
16
11
14
13
18
26
11
11
13
14
11
10
00
00
00
00
00
01
95
17
10
10
14
17
25
10
11
13
14
11
10
00
00
00
00
00
01
96
16
11
14
13
17
25
11
11
14
14
11
12
00
00
00
00
00
01
97
16
12
14
13
16
25
10
11
13
14
11
12
00
00
00
00
00
01
98
16
11
15
13
16
25
10
11
13
14
11
12
00
00
00
00
00
01
99
17
11
14
13
17
25
10
11
13
14
11
13
00
00
00
00
00
01
100
15
11
14
13
16
26
11
11
13
14
11
10
00
00
00
00
00
01
101
16
11
14
13
17
25
10
11
13
14
12
11
00
00
00
00
00
01
102
16
11
15
13
17
25
10
11
13
14
11
10
00
00
00
00
00
01
103
15
11
11
13
16
25
10
11
13
14
11
12
00
00
00
00
00
01
104
15
11
14
13
16
25
10
11
13
14
11
10
00
00
00
00
00
01
105
17
11
13
13
17
24
11
11
13
14
11
12
00
00
00
00
00
01
106
16
10
15
13
17
25
11
11
13
14
11
10
00
00
00
00
00
01
107
16
11
15
13
17
25
11
11
13
14
11
90
00
00
00
00
00
1108
14
11
15
13
17
26
10
11
13
14
11
10
00
00
00
00
00
01
109
17
11
14
14
18
23
11
11
13
14
11
10
00
00
00
00
00
01
110
16
11
14
13
17
26
10
11
13
14
11
10
00
00
00
00
00
01
111
16
11
16
13
17
25
10
11
13
14
11
11
00
00
00
00
00
01
112
16
11
13
15
17
24
11
11
13
14
11
10
00
00
00
00
00
01
113
17
11
13
13
18
25
11
11
13
14
11
11
00
00
00
00
00
01
114
15
11
14
13
16
25
911
13
14
11
10
00
00
00
00
00
01
115
16
11
15
13
17
24
11
11
13
14
11
11
00
00
00
00
00
01
116
17
11
14
14
16
26
11
11
13
14
12
10
00
00
00
00
00
01
117
16
11
13
13
17
25
11
11
13
14
11
12
00
00
00
00
00
01
118
16
11
12
13
17
25
11
11
13
14
11
11
00
00
00
00
00
01
119
15
11
14
13
17
25
11
11
13
14
11
11
00
00
00
00
00
01
120
17
11
14
13
17
25
12
11
13
14
11
10
00
00
00
00
00
01
121
16
11
14
13
17
25
10
11
13
14
11
10
00
00
00
00
00
01
122
17
11
13
13
17
25
11
11
13
14
11
11
00
00
00
00
00
01
123
16
11
14
13
18
25
10
11
14
14
11
10
00
00
00
00
00
01
124
17
11
13
13
17
25
10
11
13
14
11
11
00
00
00
00
00
01
125
16
11
15
13
17
25
11
11
13
14
11
12
00
00
00
00
00
01
126
17
11
14
13
18
25
11
11
13
14
11
11
00
00
00
00
00
01
127
16
12
14
13
17
25
11
11
13
14
11
10
00
00
00
00
00
01
128
16
11
14
13
18
23
11
11
13
14
11
10
00
00
00
00
00
01
129
16
11
15
13
17
25
11
11
14
15
11
11
00
00
00
00
00
01
130
16
11
15
13
16
25
11
12
13
14
11
10
00
00
00
00
00
01
131
16
11
14
13
17
27
10
11
13
14
11
10
00
00
00
00
00
01
132
15
11
14
13
17
25
11
11
13
14
11
10
00
00
00
00
00
01
133
15
12
14
14
17
25
11
11
13
14
11
12
00
00
00
00
00
01
134
16
11
15
13
17
24
10
11
13
14
11
11
00
00
00
00
00
01
135
15
11
14
13
17
25
10
11
13
14
11
10
00
00
00
00
00
01
136
16
11
14
13
18
25
11
11
13
14
11
11
00
00
00
00
00
01
aPopulationscoded
asfollows:
TvTuvinians,
TdTodjins,
ShShors,KhKhakassians,
Evk
Evenks,
Stsojots,Tel
Teleuts,AltAltaians-Kizhi,TfTofalars,BrBuryats.Sample
sizesare
given
inparentheses.
Haplotypes
sharedbetweenSouth
SiberiansandRussiansare
shownin
bold.
600

explained by apparently ancient than very recent eventsin South Siberian population history.
The analysis of 11 Y-chromosomal microsatellitesrevealed 51 different haplotypes among the 134 SouthSiberians carrying haplogroup R1a1 (haplotype diver-sity: 0.959±0.007) and 95 haplotypes among the 121Russians (0.994±0.002). In general, 136 STR haplo-types were detected among R1a1 chromosomes studied(Table 4). Only ten of the 51 South Siberian R1a1-haplotypes were shared between the South Siberians andEastern Europeans (Russians), reflecting thus a smalladmixture with recent migrants of European descent.Both groups were also significantly different based onRst using those STRs (Rst=0.093, P=0.000). Themodal haplotype (haplotype 24 in Table 4) containingthe most common allele at each locus was found in bothpopulations. The most frequent haplotype seen in theSouth Siberian sample (haplotype 40) is two mutationalsteps from the modal haplotype (at loci DYS389I andDYS389II). The most frequent haplotype observed inRussians (haplotype 26) is one step from the modalhaplotype (at locus DYS385). These are the most
frequent regional haplotypes that are three mutationalsteps from each other (at loci DYS385, DYS389I, andDYS389II). Divergency estimates based on Y-chromo-some microsatellite variation indicate that, despite thehaplotype diversity value of Eastern European R1a1-lineages exceeds that in South Siberia, the estimated agesfor this haplogroup are almost equal in both regionalgroups—11,270±4,070 years in South Siberia and11,380±3,200 years in Eastern Europe. These values arevery close to the divergence time between the two re-gional groups studied (10,310±3,140 years). These re-sults suggest that an isolation of the regional groupsoccurred soon after the origin of the R1a1 haplogroup.
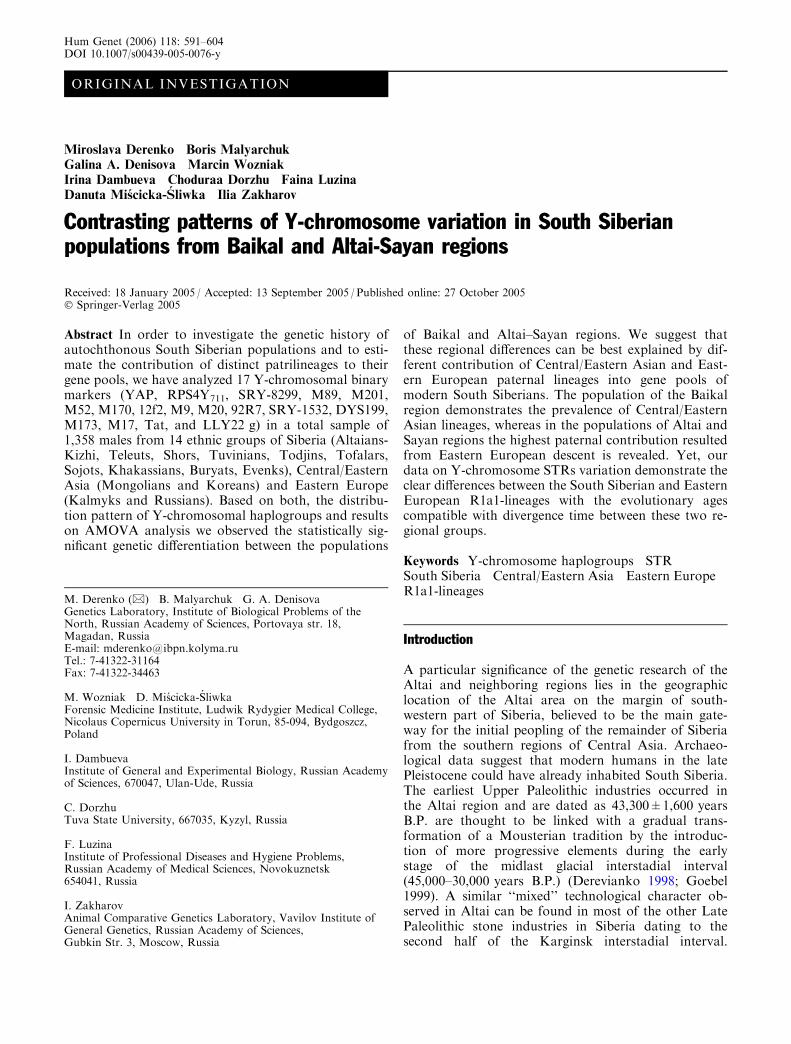
The modal haplotype was also at the center of a MJnetwork relating haplotypes within R1a1 lineage(Fig. 4). The pattern of clustering in the networks wasrelatively complex, with a major ‘‘star cluster’’ and twominor subclusters with distinct, South Altaian andEastern European, geographic distributions. The firstamong them is represented by R1a1 Y-chromosomesfound solely in Altaians-Kizhi and Teleuts, but thesecond one is formed by the Russians and Altaians.
Fig. 4 Median-joining networkof haplogroup R1a1 based oneleven STR loci (DYS19,DYS385a/b, DYS389I,DYS389II, DYS390, DYS391,DYS392, DYS393, DYS437,DYS438, DYS439) in 134R1a1-chromosomes from tenpopulations of South Siberia(Tuvinians, Todjins, Shors,Khakassians, Evenks, Sojots,Teleuts, Altaians-Kizhi,Tofalars, and Buryats) and in121 Eastern Europeans(Russians). The phylogeneticrelationships between the 136microsatellite haplotypesdetermined by using theprogram NETWORK 4.1.0.9(Fluxus Engineering Web site).Circles represent microsatellitehaplotypes with areaproportional to frequencies,and colors indicate the region oforigin. South Siberianhaplotypes are shown in black,while Eastern European(Russian) haplotypes are shownin white
601
The coalescent time of the South Altaian subcluster wasestimated as 4,940±1,894 years, whereas the age ofEastern European subcluster was 9,920±3,151 years.
Conclusion
In this study we analyzed 28 Y-chromosome poly-morphic markers in a representative set of ethnicgroups of Siberia, Central/Eastern Asia, and EasternEurope to investigate the genetic variation in theaboriginal South Siberian populations. We observedthe statistically significant genetic differentiation be-tween the populations of Baikal and Altai–Sayan re-gions. These regional differences can be best explainedby different contribution of the Central/Eastern Asianand Eastern European paternal lineages into the genepools of modern South Siberians. The most easternpopulation of Baikal region, Buryats together withKalmyks and Mongolians show the highest frequenciesof haplogroup C lineages, which may represent themajor Central/Eastern Asian contribution into theirgene pools. On the other hand, the populations of Altaiand Sayan region are characterized by a considerableimpact of Eastern European lineages. Meanwhile,analysis of Y-STR haplotype diversity within R1a1haplogroup demonstrates the clear differences betweenthe South Siberian and Eastern European R1a1-lin-eages with the evolutionary ages compatible withdivergence time between these two regional groups.
It is noteworthy that analysis of mtDNA variabilityin Siberian populations also revealed the regional dif-ferences in distribution of Eastern Asian and WesternEurasian lineages. The highest influx of Western Eur-asian mtDNA lineages was observed in populations ofthe Altai and East Sayan region (up to 34.5% in Alta-ians), whereas in Buryats and Sojots from Baikal regionit was markedly lower (less than 10%) (Derenko et al.2003). Such east-to-west cline in the frequencies ofWestern Eurasian-specific mtDNA haplotypes observedin South Siberia was considered concordant with thearchaeological and paleoanthropological views aboutthe early presence of Western Eurasians in South Siberiaregion (Alekseev 1998).
Thus, the genetic heterogeneity of South Siberianpopulations revealed both by Y-chromosome andmtDNA variability data could be compatible with thehypothesis of more than one prehistoric migration fromdifferent sources in Eurasia postulated by paleoanthro-pological, archaeological and linguistical data. Furtherwider sampling, additional typing of Y-chromosomal,mitochondrial and autosomal markers are likely tothrow more light on the origin of different geneticcomponents in the South Siberians.
Acknowledgements We thank all the donors for making this workpossible, A. Jakubowska, K. Filipenko, A. Lunkina and M.Perkova for technical assistance. We also thank L.A. Zhivotovskyfor his help concerning the statistical analyses of STR data.
This research has been supported by the Russian Foundation forBasic Research through the grants 03-04-48162 and 04-04-48746;by the grant from the Polish State Committee for Scientific Re-search (3P04C 04823); by the grant from the Far-East Branch ofthe Russian Academy of Sciences (03-3-A-06-047) and by theProgram of Basic Research of Russian Academy of Sciences‘‘Dynamics of plant, animal and human gene pools’’. M.D. wassupported in part by the Jozef Mianowski Fund.
References
Alekseev V (1998) The physical specificities of Paleolithic hominidsin Siberia. In: Derev’anko AP (ed) The Paleolithic of Siberia:New discoveries and interpretations. University of IllinoisPress, Urbana, pp 329–335
Alexeev VP (1989) Historical anthropology and ethnogenesis.Nauka, Moscow
Alexeev VP, Gohman II (1984) Anthropology of Asiatic part of theUSSR. Nauka, Moscow
Bandelt H-J, Forster P, Rohl A (1999) Median-joining networksfor inferring intraspecific phylogenies. Mol Biol Evol 16:37–48
Bandelt H-J, Forster P, Sykes BC, Richards MB (1995) Mito-chondrial portraits of human populations using median net-works. Genetics 141:743–753
Bortolini MC, Salzano FM, Thomas MG, Stuart S, Nasanen SP,Bau CH, Hutz MH, Layrisse Z, Petzl-Erler ML, Tsuneto LT,Hill K, Hurtado AM, Castro-de-Guerra D, Torres MM, GrootH, Michalski R, Nymadawa P, Bedoya G, Bradman N, LabudaD, Ruiz-Linares A (2003) Y-chromosome evidence for differingancient demographic histories in the Americas. Am J HumGenet 73:524–539
Cavalli-Sforza LL, Menozzi P, Piazza A (1994) The history andgeography of human genes. Princeton University Press,Princeton
Chlachula J (2001) Pleistocene climate change, natural environ-ments and palaeolithic occupation of the Altai area, west-cen-tral Siberia. Quaternary International 80–81:131–167
Derbeneva OA, Sukernik RI, Volodko NV, Hosseini SH, Lott MT,Wallace DC (2002) Analysis of mitochondrial DNA diversity inthe Aleuts of the Commander islands and its implications forthe genetic history of Beringia. Am J Hum Genet 71:415–21
Derenko MV, Grzybowski T, Malyarchuk BA, Czarny J, Misci-cka-Sliwka D, Zakharov IA (2001) The presence of mitochon-drial haplogroup X in Altaians from South Siberia. Am J HumGenet 69:237–241
Derenko MV, Grzybowski T, Malyarchuk BA, Dambueva IK,Denisova GA, Czarny J, Dorzhu CM, Kakpakov VT, Misci-cka-Sliwka D, Wozniak M, Zakharov IA (2003) Diversity ofmitochondrial DNA lineages in South Siberia. Ann Hum Genet67:391–411
Derenko MV, Malyarchuk BA, Dambueva IK, Shaikhaev GO,Dorzhu CM, Nimaev DD, Zakharov IA (2000) MitochondrialDNA variation in two South Siberian Aboriginal populations:implications for the genetic history of North Asia. Hum Biol72:945–973
Derenko MV, Malyarchuk BA, Denisova GA, Dorzhu CM, Ka-ramchakova ON, Luzina FA, Lotosh EA, Dambueva IK, Za-kharov IA (2002) Polymorphism of Y-chromosome diallelic lociin native populations of Altai-Sayan region. Rus J Genet38:309–314
Derevianko AP (1998) Human occupation of nearby regions andthe role of population movements in the Paleolithic of Siberia.In: Derev’yanko AP (ed) The Paleolithic of Siberia: New Dis-coveries and Interpretations. University of Illinois Press, Ur-bana, pp 336–351
Derevianko AP, Zenin VN (1996) Preliminary results of fieldinvestigations of the Late Palaeolithic site Shestakhovo in 1996.In: Derevianko AP, Molodin VI (eds) New archaeological andethnographic discoveries in Siberia (in Russian). Institute ofArchaeology and Ethnography Press, Novosibirsk, pp 60–63
602

Excoffier L, Smouse P, Quattro J (1992) Analysis of molecularvariance inferred from metric distances among DNA haplo-types: application to human mitochondrial DNA restrictiondata. Genetics 131:479–491
Fedorova SA, Bermisheva MA, Villems R, Maksimova NR,Khusnutdinova EK (2003) Analysis of mitochondrial DNAhaplotypes in Yakut population. Mol Biol (Mosk) 37: 643–653
Flores C, Maca-Meyer N, Perez JA, Gonzalez AM, Larruga JM,Cabrera VM (2003) A predominant European ancestry ofpaternal lineages from Canary Islanders. Ann Hum Genet67:138–52
Galushkin SK, Spitsyn VA, Crawford MH (2001) Genetic structureof Mongolic-speaking Kalmyks. Hum Biol 73:823–834
Goebel T (1999) Pleistocene human colonization of Siberia andpeopling of the Americas: an ecological approach. EvolAnthropol 8:208–227
Hammer MF, Karafet TM, Redd AJ (2001) Hierarchical patternsof global human Y-chromosome diversity. Mol Biol Evol18:1189–1203
Karafet TM, Osipova LP, Gubina MA, Posukh OL, Zegura SL,Hammer MF (2002) High levels of Y-chromosome differentia-tion among native Siberian populations and the genetic signa-ture of a boreal hunter-gatherer way of life. Hum Biol 74:761–89
Karafet TM, Posukh OL, Osipova LP (1994) Results and per-spectives of human population studies in Siberia (in Russian).Siberian Journal of Ecology 2:105–118
Karafet TM, Xu R, Du R, Wang W, Feng S, Wells RS, Redd AJ,Zegura SL, Hammer MF (2001) Paternal population history ofEast Asia: sources, patterns and microevolutionaty processes.Am J Hum Genet 69:615–628
Karafet TM, Zegura SL, Posukh O, Osipova L, Bergen A, Long J,Goldman D, Klitz W, Harihara S, de Kniff P, Wiebe V, Grif-fiths RC, Templeton AR, Hammer MF (1999) Ancestral Asiansource(s) of New World Y-chromosome founder haplotypes.Am J Hum Genet 64:817–831
Ke Y, Su B, Song X, Lu D, Chen L, Li H, Qi C, Marzuki S, DekaR, Underhill P, Xiao C, Shriver M, Lell J, Wallace D, Wells RS,Seielstad M, Oefner P, Zhu D, Jin J, Huang W, Chakraborty R,Chen Z, Jin L (2001) African origin of modern humans in EastAsia: a tale of 12,000 Y chromosomes. Science 292:1151–1153
Kruskal JB (1964) Multidimensional scaling by optimizing good-ness of fit to a nonmetric hypothesis. Psychometrika 29:1–27
Lell JT, Sukernik RI, Starikovskaya YB, Su B, Jin L, Schurr TG,Underhill PA, Wallace DC (2002) The dual origin and Siberianaffinities of Native American Y chromosomes. Am J HumGenet 70:192–206
Medvedev G, Cauwe N, Vorob’eva G, Coupe D, Claes L, LepninaE, Modrie S, Mukharramov S, Osadchy S, Pettitte P, RebrikovP, Rogovsky E, Sitlivyi V, Sulerzhitsky L, Khenzykhenova D(1996) The Malta Paleolithic locality. ARCOM Press, Irkutsk
Okladnikov AP (1981) The Palaeolithic of Central Asia. Moltyn-Am (Mongolia) (in Russian). Nauka, Novosibirsk
Pakendorf B, Wiebe V, Tarskaia LA, Spitsyn VA, Soodyall H,Rodewald A, Stoneking M (2003) Mitochondrial DNA evi-dence for admixed origins of central Siberian populations. Am JPhys Anthropol 120:211–224
Puzyrev VP, Stepanov VA, Golubenko MV, Puzyrev KV, Mak-simova NR, Khar’kov VN, Spiridonova MG, Nogovitsyna AN(2003) MtDNA and Y-chromosome lineages in the Yakutpopulation. Genetika 39:975–981
Raymond M, Rousset F (1995) An exact test of population dif-ferentiation. Evolution 49:1280–1283
Rosser ZH, Zerjal T, Hurles ME, Adojaan M, Alavantic D, Am-orim A, Amos W, Armenteros M, Arroyo E, Barbujani G,Beckman G, Beckman L, Bertranpetit J, Bosch E, Bradley DG,Brede G, Cooper G, Corte-Real HBSM, Knijff P, Decorte R,Dubrova YE, Evgrafov O, Gilissen A, Glisic S, Golge M, HillE, Jeziorowska A, Kalaydjieva L, Kayser M, Kivisild T, Kra-vchenco SA, Krumina A, Kucinskas V, Lavinha J, Livshits LA,Malaspina P, Maria S, McElreavey K, Meitinger TA, Mi-kelsaar AV, Mitchell RJ, Nafa K, Nicholson J, Nørby S,
Pandya A, Parik J, Patsalis PC, Pereira L, Peterlin B, PielbergG, Prata MJ, Previdere C, Roewer L, Rootsi S, RubinszteinDC, Saillard J, Santos FR, Stefanescu G, Sykes BC, Tolun A,Villems R, Tyler-Smith C, Jobling MA (2000) Y-chromosomaldiversity in Europe is clinal and influenced primarily by geog-raphy, rather than by language. Am J Hum Genet 67:1526–1543
Rychkov YG, Sheremetyeva VA (1980) The genetics of circum-polar populations of Eurasia related to the problem of humanadaptation. In: Milan F (ed) The human biology of circumpolarpopulations, Cambridge University, London, pp 37–80
Rychkov YG, Zhukova OV, Sheremetyeva VA, Spitsyn VA, BrookSI, Lebedeva IA, Afanasyeva IS, Balanovskaya EV, NazarovaAF, Borodina SR, Udina IG, Shneider YV, Signeyev VI, Pet-rishchev VN, Rautian GS, Syskova NN, Tichomirova EV(2000) Gene pool of population of Russia and contiguouscountries. In: Rychkov YG (eds) Gene pool and genegeographyof population (in Russian). Nauka, Saint Peterburg, pp 13–611
Santos FR, Pandya A, Tyler-Smith C, Pena SD, Schanfield M,Leonard WR, Osipova L, Crawford MH, Mitchell RJ (1999)The central Siberian origin for native American Y chromo-somes. Am J Hum Genet 64: 619–628
Schneider S, Roessli D, Excoffier L (2000) Arlequin v. 2.000: asoftware for population genetics data analysis. Switzerland,Genetics and Biometry Laboratory, University of Geneva,Geneva
Schurr TG, Sukernik RI, Starikovskaya YB, Wallace DC (1999)Mitochondrial DNA variation in Koryaks and Itel’men: pop-ulation replacement in the Okhotsk Sea-Bering Sea regionduring the Neolithic. Am J Phys Anthropol 108:1–39
Semino O, Passarino G, Oefner PJ, Lin AA, Arbuzova S, BeckmanLE, De Benedictis G, Francalacci P, Kouvatsi A, Limborska S,Marcikiae M, Mika A, Mika B, Primorac D, Santachiara-Benerecetti AS, Cavalli-Sforza LL, Underhill PA (2000) Thegenetic legacy of Paleolithic Homo sapiens in extant Europeans:a Y chromosome perspective. Science 290:1155–1159
Shi H, Dong YL, Wen B, Xiao CJ, Underhill PA, Shen PD,Chakraborty R, Jin L, Su B (2005) Y-chromosome evidence ofsouthern origin of the East Asian-specific haplogroup O3-M122. Am J Hum Genet 77:408–419
Shields GF, Schmiechen AM, Frazier BL, Redd A, Voevoda MI,Reed JK, Ward RH (1993) mtDNA sequences suggest a recentevolutionary divergence for Beringian and northern NorthAmerican populations. Am J Hum Genet 53:549–62
Starikovskaya YB, Sukernik RI, Schurr TG, Kogelnik AM, Wal-lace DC (1998) mtDNA diversity in Chukchi and SiberianEskimos: implications for the genetic history of AncientBeringia and the peopling of the New World. Am J Hum Genet63:1473–91
Su B, Xiao J, Underhill P, Deka R, Zhang W, Akey J, Huang W,Shen D, Lu D, Luo J, Chu J, Tan J, Shen P, Davis R, Cavalli-Sforza L, Chakraborty R, Xiong M, Du R, Oefner P, Chen Z,Jin L (1999) Y-Chromosome evidence for a northward migra-tion of modern humans into Eastern Asia during the last IceAge. Am J Hum Genet 65:1718–1724
Sukernik RI, Shur TG, Starikovskaia EB, Walles DC (1996)Mitochondrial DNA variation in native inhabitants of Siberiawith reconstructions of the evolutional history of the AmericanIndians. Restriction polymorphism. Genetika 32:432–439
Torroni A, Sukernik RI, Schurr TG, Starikorskaya YB, CabellMF, Crawford MH, Comuzzie AG, Wallace DC (1993)mtDNA variation of aboriginal Siberians reveals distinct ge-netic affinities with Native Americans. Am J Hum Genet53:591–608
Underhill PA, Shen P, Lin AA, Jin L, Passarino G, Yang WH,Kauffman E, Bonne-Tamir B, Bertranpetit J, Francalacci P,Ibrahim M, Jenkins T, Kidd JR, Mehdi SQ, Seielstad MT,Wells RS, Piazza A, Davis RW, Feldman MW, Cavalli-SforzaLL, Oefner PJ (2000) Y chromosome sequence variation andthe history of human populations. Nat Genet 26:358–361
Vasiliev SA (1993) The Upper Paleolithic of northern Asia. CurrAnthropol 34:82–92
603
Vasiliev SA, Yamskikh AF, Yamskikh GI, Svezhentsev YS, Ka-sparov AK (1999) Stratigraphy and palaeoecology of the UpperPalaeolithic sites near the Maima village (Upper Yenisei valley,Siberia). In: Chlachula J, Kemp RA, Tyracek J (eds) Quater-nary of Siberia. Quaternary Geology, Paleogeography andPalaeolithic Archaeology. Anthropozoikum 23:29–35
Wells RS, Yuldasheva N, Ruzibakiev R, Underhill PA, Evseeva I,Blue-Smith J, Jin L, Su B, Pitchappan R, Shanmugalakshmi S,Balakrishnan K, Read M, Pearson NM, Zerjal T, Webster MT,Zholoshvili I, Jamarjashvili E, Gambarov S, Nikbin B, DostievA, Aknazarov O, Zalloua P, Tsoy I, Kitaev M, MirrakhimovM, Chariev A, Bodmer WF (2001) The Eurasian heartland: acontinental perspective on Y-chromosome diversity. Proc NatlAcad Sci USA 98:10244–10249
Y Chromosome Consortium (2002) A nomenclature system for thetree of human Y-chromosomal binary haplogroups. GenomeRes 2:339–348
Zerjal T, Dashnyam B, Pandya A, Kayser M, Roewer L, SantosFR, Schiefenhovel W, Fretwell N, Jobling MA, Harihara S,Shimizu K, Semjidmaa D, Sajantila A, Salo P, Crawford MH,
Ginter EK, Evgrafov OV, Tyler-Smith C (1997) Genetic rela-tionships of Asians and Northern Europeans, revealed by Y-chromosomal DNA analysis. Am J Hum Genet 60:1174–1183
Zerjal T, Wells RS, Yuldasheva N, Ruzibakiev R, Tyler-Smith C(2002) A genetic landscape reshaped by recent events: Y-chro-mosomal insights into Central Asia. Am J Hum Genet 71:466–482
Zhivotovsky LA (2001) Estimating divergence time with the use ofmicrosatellite genetic distances: impacts of population growthand gene flow. Mol Biol Evol 18:700–709
Zhivotovsky LA, Underhill PA, Cinnioglu C, Kayser M, Morar B,Kivisild T, Scozzari R, Cruciani F, Destro-Bisol G, Spedini G,Chambers GK, Herrera RJ, Yong KK, Gresham D, Tournev I,Feldman MW, Kalaydjieva L (2004) The effective mutation rateat Y chromosome short tandem repeats, with application tohuman population-divergence time. Am J Hum Genet 74:50–61
604