Embed Size (px)
Citation preview
Comparison of learning between Digital gallery and Hands-on laboratory.
1
Master thesis in Science Communication
Mahtab DavariSupervisor: Ernst van GroningenLocal supervisor: Julian Kingston

2
Content
1. Introduction-------------------------------------------------------------- 6 1.1. Aim of the project-------------------------------------------------- 6 1.2. Theoretical Background------------------------------------------- 7 1.2.1. Media and high- tech virtual space in museum--------- 7 1.2.2.Learning theory----------------------------------------------- 9 1.2.3.Learning and conceptual change--------------------------- 10 1.2.4.Concept mapping--------------------------------------------- 11 1.2.5.Proposition of concept mapping---------------------------- 13 1.3. Acknowledgments-------------------------------------------------- 142. Methods ------------------------------------------------------------------ 143. Experiments, Observations, and measurement------------------- 154. Results-------------------------------------------------------------------- 19 4.1.Results of Digital gallery------------------------------------------- 19 4.1.1. Proposition qualities on pre-test and post-test concept maps in the Digital gallery----------------------------------
19
4.1.2 .The frequency of categorized concepts in post-test in the Digital gallery------------------------------------------------
20
4.1.3. The rubric evaluation in the Digital gallery-------------- 21 4.1.4. Frequency of concepts in post-test in the Digital gallery 22 4.1.5. The most common misconceptions appeared in post-test of Digital gallery--------------------------------------------
24
4.1.6. learning gain in the Digital galley------------------------- 25 4.2. Results of Hands-on Laboratory---------------------------------- 28 4.2.1. Proposition qualities on pre-test and post-test concept maps in the Hands-on laboratory--------------------------
28
4.2.2. The frequency of categorized concepts in post-test in the Hands-on laboratory-----------------------------------------
29
4.2.3. The rubric evaluation in the Hands-on laboratory------ 30 4.2.4. Frequency of concepts in post-test in the Hands-on laboratory----------------------------------------------------- 31 4.2.5. The most common misconceptions appeared in post-test of Hands-on laboratory--------------------------------
32
4.2.6. learning gain in the Hands-on Laboratory--------------- 33 4.3. Comparison between Digital gallery and Hands-on laboratory 36 4.3.1. Independent sample Groups t-test------------------------ 31
4.3.2. Understanding the output t-test by SPSS--------------- 38 4.3.2.1. T-test results of learning for Digital gallery by Gender----------------------------------------------- 39 4.3.2.2. T-test results of learning for Hands-on laboratory by Gender------------------------------------------- 41
3
4.3.2.3. T-test results of comparing Digital gallery and Hands-on laboratory leanings--------------------
43
5. Discussion--------------------------------------------------------------- 45 5.1. Conclusion from results------------------------------------------- 45 5.2. Other Observations------------------------------------------------- 48 5.3 .Reliability and validity-------------------------------------------- 48 5.4. Suggestions for future--------------------------------------------- 50References-------------------------------------------------------------------- 52Appendix A. Before and After Form for Digital gallery--------------- 54Appendix B. Hands-on laboratory, before and after sheets------------ 56Appendix C. The results of t-test for LO --------------------------------- 58Appendix D. Samples of Concept maps done by students------------- 59Appendix E. Plot boxes of learning Ln, Lo respectively---------------- 61Appendix F. Correlation between learning and concept map quality in Digital gallery and Hands-on laboratory------------------- 62Appendix G. Digital gallery and Hands-on laboratory images--------- 63
4
Abstract
This thesis has been done in ROM (Royal Ontario Museum) located in Toronto Canada.It focuses on learning in two parts of the museum. It tries to find out how much each part is effective in terms of learning. Studies have been done in the Digital gallery, which has been equipped with digital video projector and workstation that allows visitors to interact with the collections in 2 or 3 dimensional spaces while they are watching the presenting film. The rest of the study was in Hands-on laboratory, which allows students to examine artifacts and discuss their findings The method was used in this research is Concept mapping .In Digital gallery, 24 schools surveys in the form of pre-post- test by help of the concept mapping method has been done. In Hands-on laboratory, 12 schools have been studied by using the combination of interviewing and written pre post-test of concept mapping.
Keywords
Keywords: Concept mapping, Digital gallery, Hands-on laboratory, learning.
5
1. Introduction
This thesis has been done in ROM (Royal Ontario Museum) located in Toronto Canada which is one of the world’s largest museum.
According to ROM‘s web site http://www.rom.on.ca/about/index.php.
“The ROM is defined as much by its diverse collections of world cultures and natural history as by the international research that supports them.”
This project was done to see the effectiveness of media in learning in ROM, especially for students. It has been done in two educational environments, Digital gallery, and Hands-On laboratory.
Digital gallery is a high-tech gallery that allows visitors to interact with the ROM's collections in virtual two- and three- dimensional space. Visitors can zoom, move, and turn the artifacts images that have been 3-D laser scanned. These interactions can be done while they are watching a show by using touch screen in front of them. They get some instructions of how to use their touch screen monitors before starting the film and during the film.
Hands-on laboratory ,which is an interactive space ,offers young visitors ,school students ,an abundance of hands-on activities and real artifacts that bring to life the mystery, excitement, and fascinating journey of discovery. Students can see and touch real artifacts from ancient times, discuss and guess what they were used and made out of .Artifacts are ready before class is started and each table has its own theme, such as work and household, government, beauty....
1.1. Aim of the project
The theme of this thesis is to find out the effectiveness of education in two different parts of didactic environment in the museum and comparing the results.The final purpose is to concentrate on these questions:
o Have the visitors learnt any thing?o If so, what they have learnt?o Are there any differences between these two environments?o If so what are the differences?
The visitors that have been studied were the school groups, which were studying Grade 5 to 8 (age 10-14).
6
1.2. Theoretical Background
This thesis title is” Comparison of learning in Digital gallery and Hands-on laboratory” which focuses on learning part and effectiveness of system of leaning with using media technology and without using it.
Next approach in the introduction is to mention some descriptions about media, learning theory and the methods that have been applied for evaluation and measurements.
1.2.1. Media and high- tech virtual space in the museum
Today,” media” includes anything from newspapers and TV, magazines and videos to digital broadcasting of different forms. The communication science and learning can be taken placed by help of these various forms of broadcasting, therefore, the need of better public understanding of concepts and science has motivated scientific attention to media coverage. The mass media are used as the virtual and informal learning tools.Since, most museums are looking for the new way of making their educational environment more interactive and modern, therefore, interactive new digital media play an increasingly important role in the museum nowadays.
Interactive electronic media exhibits, and presentations make beautiful music with museum designs, mainly because they are an extremely effective means of engaging visitors directly while communicating a message to them in a short time.
Digital technologies have found a home in the modern museum in the forms of interactive touch-screen, CDs, computer games, large-screen installations, and video walls with multiple images, digital centers, information systems, 3-D animation, and virtual reality. Such technologies have changed the physical character of the museum because it allows visitors to enjoy in the previous unknown and boring galleries and interact with objects in ways that previously unimagined.
However, integrating media elements into museum designs can be tricky.Interactivities have to be engaging and responsive so visitors do not lose interest. Choosing the right media presentation is also important, with touch screens, and multi-user projection experiences. One example of this popular media that is used in the museums is Digital gallery. The Digital galley that is under our study is a high-tech gallery that makes visitors able to interact with artifacts in virtual two- and three- dimensional space. Visitors can zoom, move, and turn the artifacts images that
7
have been 3-D laser scanned. These interactions can be done while they are watching a show by using touch screen in front of them.
Salmi (2005) in “Open learning environment “ believed that the weakness of using mass media, from television to any other screen- based media, is that they are not able to transfer information that the audience receives when they touch some thing in exhibit. It means hands-on effect in learning is missed when any mass media replaced.He also believed that strong visual sense provided by media technology could control human brain to good effect. Moving forward, interactive media elements could play an even larger role in museum experiences. Digital devices that are in constant communication with the museum, all used technology, and handheld devices may all have big roles in the experiences to come. What is important is as executors think about pedagogical value of the electronic artifact they might do well to consider what lessons can be learnt from the past, given the perennial nature of debates on the introduction of new museum technologies.
What is clear is that visitors enjoy using interactive exhibits and that electronic media and digital technologies have been secured a home in the twenty-first century museum.
8
1.2.2. Learning theory
Since this project focus is on learning, it is better to have a closer look at the definition of learning theory in exhibition. The interactive exhibits can be educational. Hein (1991) have mentioned some principles of learning in the theory of constructivism:
1- Learning is an active process in which the learner uses sensory input and constructs meaning out of it. The more traditional formulation of this idea involves the terminology of the active learner, which emphasize that the learner needs to do something. Learning is not the passive acceptance of knowledge, which exists "out there" but that learning involves the learner, is engaging with the world.
2- People learn to learn as they learn: learning consists both of constructing meaning and of constructing systems of meaning. For example, if we learn the chronology of dates of a series of historical events, we are simultaneously learning the meaning of a chronology, or when we experience a physics experiences, we can learn other facts, which are engaged in this experience. Each meaning we construct makes us better able to give meaning to other sensations, which can fit a similar pattern.
3- The crucial action of constructing meaning is mental: some thing related to the mind. Physical actions, hands-on experience may be necessary for learning, especially for children, but it is not sufficient. We need to provide activities, which engage the mind as well as the hands.
4- We do not learn isolated facts and abstract theories separate from the rest of our lives, we learn in relationship to what else we know, what we believe. This fact, it becomes clear that this point is actually a corollary of the idea that learning is active and social. We cannot separate our learning from our lives.
5- One needs knowledge to learn: it is not possible to assimilate new knowledge without having some structure developed from previous knowledge to build on. The more we know, the more we can learn. Hein (1991) believes that” any effort to teach must be connected to the state of the learner must provide a path into the subject for the learner based on that Learner’s previous knowledge.”
6 -Learning is a social activity: our learning is intimately associated with our connection with other human beings, our teachers, our peers, our family as well as casual acquaintances, including the people before us or next to us at the exhibit. We are more likely to be successful in our efforts to educate if we recognize this principle rather than try to avoid it.
9

7-For significant learning we need to revisit ideas, ponder them try them out, play with them and use them. This cannot happen in 5-10 minutes that usually spent in a gallery .If you reflect on anything you have learned, you soon realize that it is the product of repeated exposure and thought.
One of the key issues is that learning is an active process; Hein states it in the first principles. For example, “Constructing systems,” “connected,” and “intimately associated” are all words describing an action that is taking place within a person that learning is an active process. The construction of meaning and learning is taking place in the head of the individuals, people are carrying knowledge.
Since our learning is a social activity, which is intimately associated with our connection and interaction with other human beings, for significant learning, we need to revisit ideas, rethink about what we were thinking according to what other people’s suggestions and what they inferred specially from new phenomena. Therefore, it turns out that having enough time to try out everything, play with them and use them and deduct them and also in case of confusion have an opportunity to discuss to remove the confusion or getting an idea are essential for learning. What we can say is, communication is necessary, especially for informal learnig.We also have to mentioned that for the full understanding and getting right answer, these points are introduction, we need to be taught by a right and skilled person (instructor).
When the results of leaning from the Digital gallery and the Hands-on laboratory for comparisons achieved, these above definitions, such as intimate connection, active process, previous knowledge, hands-on experience that should be considered
1.2.3. Learning and conceptual change
Since, this research evaluation focus is on pre-post test, so we are dealing with changing idea from pre-test to post-test according to what students have learned.
Conceptual change is defined as learning that changes an existing and previous conception such as belief, idea, or way of thinking .This means that a shift or restructuring of existing knowledge and beliefs is what distinguishes conceptual change from other types of learning.The conceptual change, an existing conception or previous knowledge is fundamentally changed or even replaced, and becomes the conceptual framework that students use to solve problems and to explain a phenomena.
Some factors determine conceptual change.Rebich and Gautier (2005) have stated that: The basis for many conceptual change theories is that learning is a process of integration that involves both individual and social processes and consists of revising or fitting new information into existing mental models.
10
Hynd (1998) says: Since not all learning is considered conceptual change and conceptual change involves modifications in core knowledge and beliefs it is generally not easily achieved and occurs as a continuous gradual process.
Carey (1985) says: “Metacognitive, which is an understanding of one’s thinking, is considered a necessary but not sufficient condition for conceptual change.”
In learning evaluation, prior knowledge could be considered as an important factor, which can affect learning. Therefore, new knowledge and new concept change should be recognized and separated from the knowledge based on prior knowledge. This separation can help to find the learning progress.
1.2.3. Concept mapping
Concept mapping which has been used as a technique for evaluation of learning in this research is:A cognitive process in which graphical tools are used for organizing and representing knowledge. This technique was developed by Professor Joseph D.Novak at Cornell University in 1960’s.
Concept maps provide learner with a visual representation of ideas or concepts. Concept map helps to measure the growth of student learning and as students create concept maps, they repeat ideas in their mind by using their own words. By using concept maps’ evaluations, like misdirection or misconnect, teachers will be informed of what students do not understand.
Dormer (2004) stated that Buzan who invented a popular related technique called Mind Mapping has said that:
“A mind map consists of a central word or concept, around the central word you draw the 5 to 10 main ideas that relate to that word. You then take each of those child words and again draw the 5 to 10 main ideas that relate to each of those words.” (See fig.1, the central idea is Water)
11
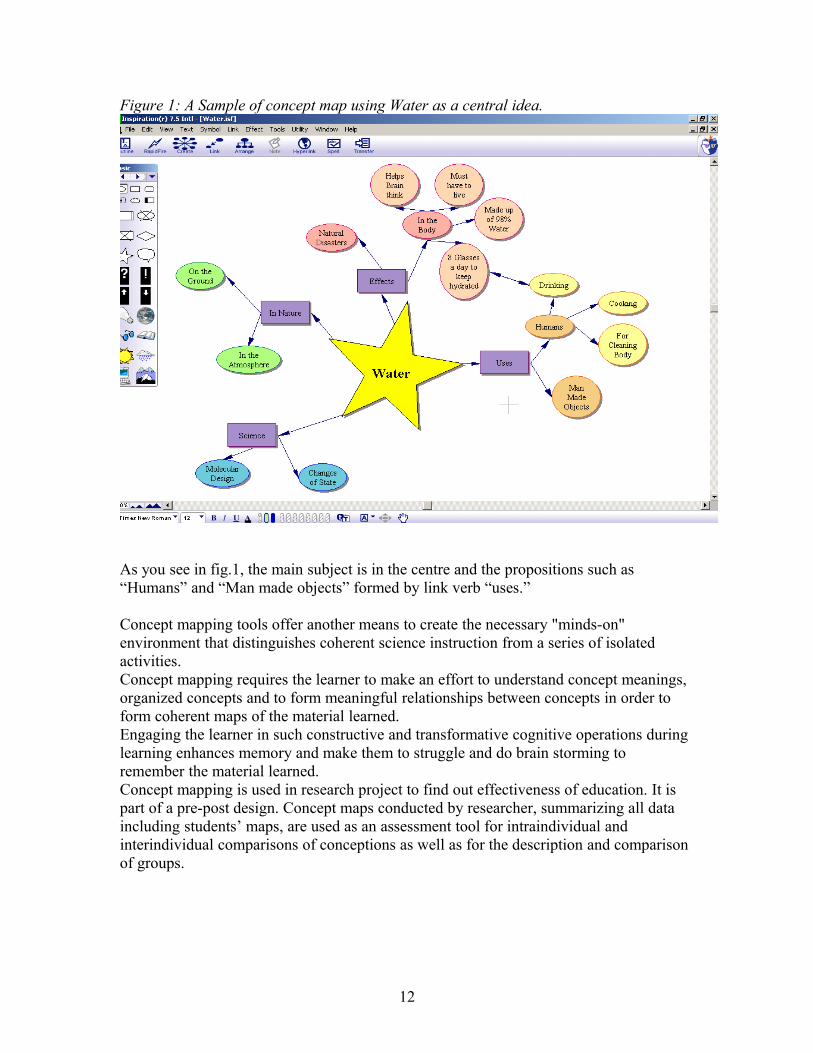
Figure 1: A Sample of concept map using Water as a central idea.
As you see in fig.1, the main subject is in the centre and the propositions such as “Humans” and “Man made objects” formed by link verb “uses.”
Concept mapping tools offer another means to create the necessary "minds-on" environment that distinguishes coherent science instruction from a series of isolated activities. Concept mapping requires the learner to make an effort to understand concept meanings, organized concepts and to form meaningful relationships between concepts in order to form coherent maps of the material learned. Engaging the learner in such constructive and transformative cognitive operations during learning enhances memory and make them to struggle and do brain storming to remember the material learned.Concept mapping is used in research project to find out effectiveness of education. It is part of a pre-post design. Concept maps conducted by researcher, summarizing all data including students’ maps, are used as an assessment tool for intraindividual and interindividual comparisons of conceptions as well as for the description and comparison of groups.
12
1.2.4. Proposition of concept mapping
The basic element of the concept map is a proposition. A proposition is a pair of concepts whose relationship is specified in the form of a link. Concepts are things usually referred to by nouns or noun phrases, while links are usually verbs.
Propositions were classified into four categories: useful propositions, useful examples, weak, and misconceptions.
Useful proposition and useful examples: All concepts, which are useful and related to the main subject.Useful propositions that simply correspond to the examples of members within a category.For example, in our case, “The Ancient Egypt” worshipped Gods and Goddesses such as “Osiris “which was the “Gods of underworld.
Misconceptions: A misconception occurs when some one believed in a concept, which is objectively false.
Guzzetti (1993) has defined the term misconceptions in his book called “promoting conceptual change in science” as a pejorative or reserve it for a specific type of non-scientific conception.
Rebich (2005) believed that misconceptions are common features of learners' prior knowledge throughout the sciences and have proven resistant to instruction. He also says, “Revision of misconceptions is costly at the level of cognitive processing if revision of a number of related models is required’.
In our case, misconception can be any wrong connection or irrelevant concept to the subject.e.g.misplacing kings name with Gods name. It can be anything that could have been learnt, defined, or taught incorrectly.
Weak conceptions: Weak propositions or weak conception that indicates the learner or students are likely to have an incomplete understanding of the relationship between the concepts in question, and misconceptions. In our case weak conceptions are determined by the percentage of the incomplete concept mapping comparing with what has been defined as a base concept mapping (frame work).
13
1.3. Acknowledgments
The author of the current thesis wishes to express appreciation to ROM museum in Toronto Canada, for giving an opportunity to work with them from April to July 2007.Special thanks to my supervisor in ROM, in education department, Julian Kingston, thanks for his time, support, and his ideas. My appreciations goes to all Education Department, Gayle Gibson for her patient to answer my questions and letting me follow her classes and put the artifacts away after class, Jo Cown for her help and her useful advices, Ian M.and Bep S.for letting me to help them to wrap and fold the planetarium some times, Jacques for his ideas and letting me follow his French classes. Jeff for his help and letting me know about Greek artifacts.
I really appreciate Kathleen D. Jane and all other teachers who were running Ancient Egypt class that helped me to do my evaluation in all their classes.
I also would like to send my appreciation to Facilitators of Digital gallery Richard, Barbra Gandolfo, Beverly Burjaw, and all other Facilitators for their helps.
Thank you Ernst van Groningen my supervisor at Högskolan Dalarna for his supports and my examiner Hannu Salmi for reading my thesis and his brilliant comments.Great thank you to my family who supported me, encouraged me, and helped me all the time.
2. Methods The work of this thesis is divided into several parts:
1- Studying about concept /mind mapping subjects and gathering information about the subject that was supposed to be mapped by students. It has been done by watching the film and looking at the scripts of presentation and making a concept map base as a framework.
2- Contacting visitors by email ahead of time (mostly teachers) by looking at the weekly visitor schedules and inform them what we are supposed to do and send them some samples and ask them to prepare their students.
3- Designing the pre and the post-evaluation sheets (test sheets) with the proper examples.
4- Explaining the visitors what they have to do.
14
In Digital gallery, every body had time to participate in both pre and post-evaluation. In Hands-on laboratory ,because another activity has to be done simultaneously, so just 5 ,6 students were asked to be interviewed to complete a pre-test and ask them to complete the post-test by themselves (to correct their first guess and add what ever they learnt from other students presented objects).
The sample of test sheets (before after) has been shown in Appendix A.
3. Experiments, Observations, and measurement
The information that has been collected from the Digital gallery has been inserted into two different tables:
1- Raw tables which score the new concept by comparing with framework (concept base). If one or more of the concepts were missing from the map, a score of 0 was given, A positive score (+1) was given if the stem concept was linked accurately to the correct answer and if this concept is connected to other right concepts .The score will be increased by the number of right connections.
2- Evaluation tables, which evaluate the pre and post-test based on the quality. The table fields include misconceptions, the weak conceptions, the useful conceptions and useful examples were scored by percentage. In addition, the successfulness of used concept map for each student was also measured and scored.
The framework, which has been used as an evaluation base, is as follows .For our case, the subject was “Ancient Egyptian” .The subject has been divided into below categories in the Digital gallery.
a) Mummifications: animals, humans, first mummy, Canopic jars (resemble), way of Mummification b) Pyramid c) Kings and pharoses d) Gods and Goddess e) Artifacts: necklace, Dagger, scarab, boat, Hieroglyphics (cylinder seal), mirror, cat Mummy. d) Extra: war, Nile, believes Plum tree and date, Nakht, Hieroglyphics on the wall.
15
The collected information in the Hands-on laboratory has been inserted in two tables. In the Hands-on laboratory, the subject is still the same “Ancient Egypt” but it focus on Artifacts and Gods and Goddesses.The first tables’ fields are different from the Digital galley table fields. Its test evaluation base is divided into 5 concepts. It has been asked students to map at last 4 artifacts including artifacts’ names, the reason of using them, their materials, their category themes (beauty, tombs, mummification, writing, religion, household and work, after life, God and Goddesses) .They also have to answer what Ancient Egyptian worshipped and believed. The system of scoring is the same as Digital galley that mentioned in raw table.
The evaluation table, which evaluates the pre and post-test, is the same as the one used in the Digital gallery. The table fields include the misconceptions, the weak conceptions, the useful conceptions and useful examples that scored by percentage. In addition, the successfulness of used concept map for each student has also been measured and scored.
The evaluation of results has been done in three aspects in both Digital gallery and Hands-on laboratory:
1- Learning gain (Ln) calculates learning in terms of new concepts in post- test with subtracting old concepts of pre- test from it.
2- Overall learning gain (Lo) which calculates learning without subtracting old concepts from pre- test.
According to McDaniel, Bradford C. (2004) definitions of Learning Gains are as follows:
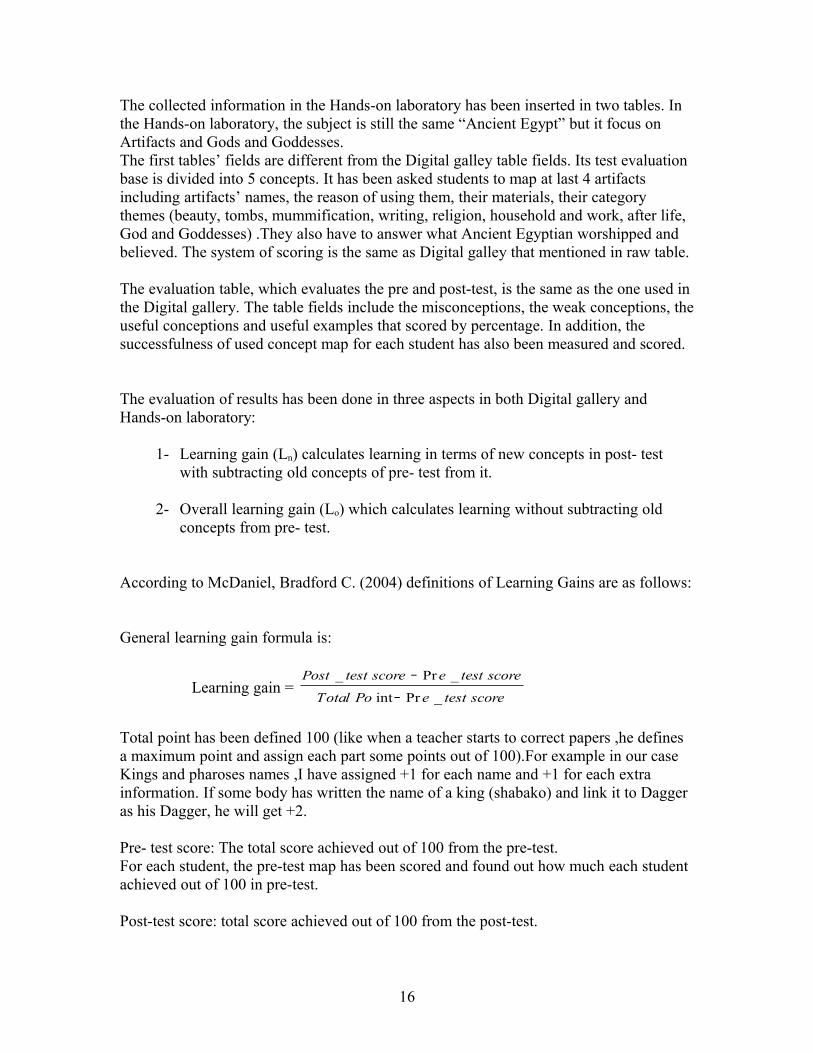
General learning gain formula is:
Learning gain = _ Pr _
int Pr _
Post test score e test score
Total Po e test score
−
−
Total point has been defined 100 (like when a teacher starts to correct papers ,he defines a maximum point and assign each part some points out of 100).For example in our case Kings and pharoses names ,I have assigned +1 for each name and +1 for each extra information. If some body has written the name of a king (shabako) and link it to Dagger as his Dagger, he will get +2.
Pre- test score: The total score achieved out of 100 from the pre-test.For each student, the pre-test map has been scored and found out how much each student achieved out of 100 in pre-test.
Post-test score: total score achieved out of 100 from the post-test.
16

For each student, the post-test map has been scored and found out how much each student achieved out of 100 in post-test.
New concepts score is the score achieved in post-test out of 100 by subtracting total old concept in pre-test from total concepts in post-test. For example, if some body got 60 out of total in post-test and 40 points of that point are the repetition concepts from pre- test, his score will be 20.This score is called new concept score.
Old concept score is the same as pre-test score.
Therefore, the learning gain (Ln) which calculates learning in terms of new concepts in post- test with subtracting old concepts of pre- test formula is as follows:
L n= 100
New concepts Score
old concepts score−
Overall learning gain (Lo), without subtracting old concepts from pre- test formula is as follows:
Lo =_ Pr _
100 Pr _
Post test score e test score
e test score
−
−
3- The rubric is provided as a generic guideline to assess test in terms of using a concept map.
The purpose for using a concept map is to enhance the capacity of the targeted concept to be understood. Therefore, the evaluation procedure must assess the comprehension of that concept.
17
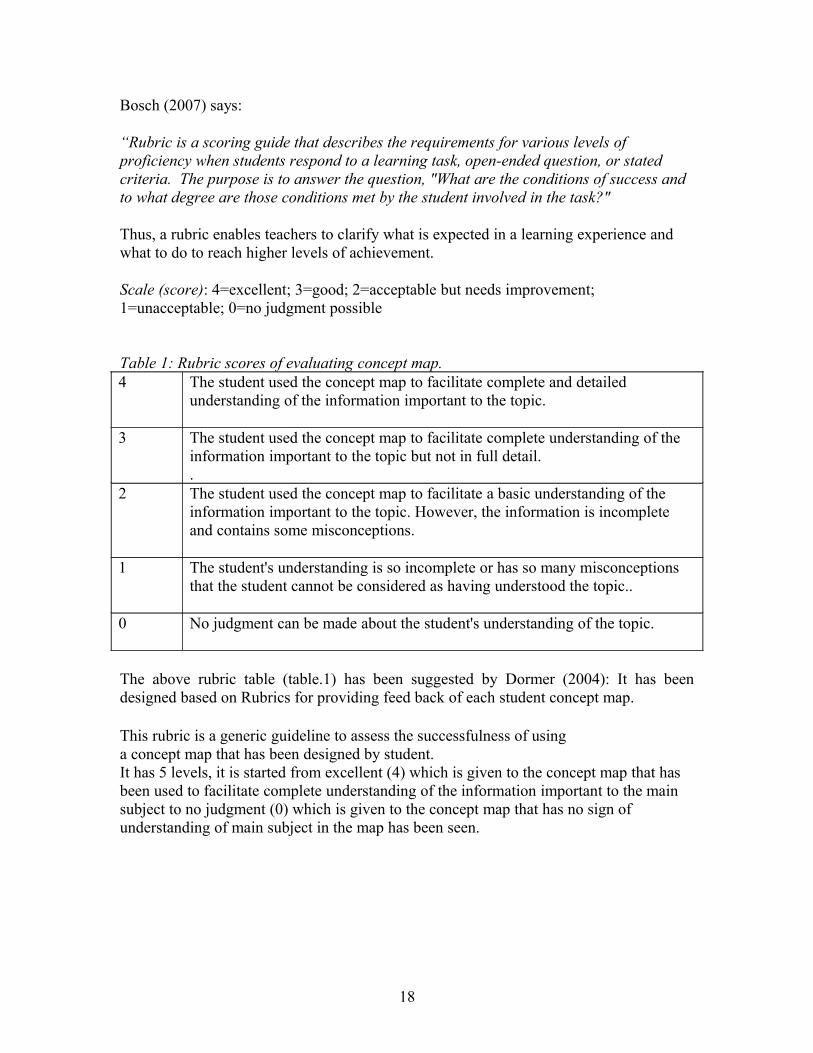
Bosch (2007) says:
“Rubric is a scoring guide that describes the requirements for various levels of proficiency when students respond to a learning task, open-ended question, or stated criteria. The purpose is to answer the question, "What are the conditions of success and to what degree are those conditions met by the student involved in the task?"
Thus, a rubric enables teachers to clarify what is expected in a learning experience and what to do to reach higher levels of achievement.
Scale (score): 4=excellent; 3=good; 2=acceptable but needs improvement; 1=unacceptable; 0=no judgment possible
Table 1: Rubric scores of evaluating concept map.4 The student used the concept map to facilitate complete and detailed
understanding of the information important to the topic.
3 The student used the concept map to facilitate complete understanding of the information important to the topic but not in full detail..
2 The student used the concept map to facilitate a basic understanding of the information important to the topic. However, the information is incomplete and contains some misconceptions.
1 The student's understanding is so incomplete or has so many misconceptions that the student cannot be considered as having understood the topic..
0 No judgment can be made about the student's understanding of the topic.
The above rubric table (table.1) has been suggested by Dormer (2004): It has been designed based on Rubrics for providing feed back of each student concept map.
This rubric is a generic guideline to assess the successfulness of using a concept map that has been designed by student. It has 5 levels, it is started from excellent (4) which is given to the concept map that has been used to facilitate complete understanding of the information important to the main subject to no judgment (0) which is given to the concept map that has no sign of understanding of main subject in the map has been seen.
18
4. ResultsThis part shows the results of the evaluation in both Digital gallery and Hands-on laboratory by applying six different perspectives.
4.1. Results of Digital gallery.
Results are divided into 6 parts.
4.1.1. Proposition qualities on pre-test and post-test concept maps in the Digital gallery.
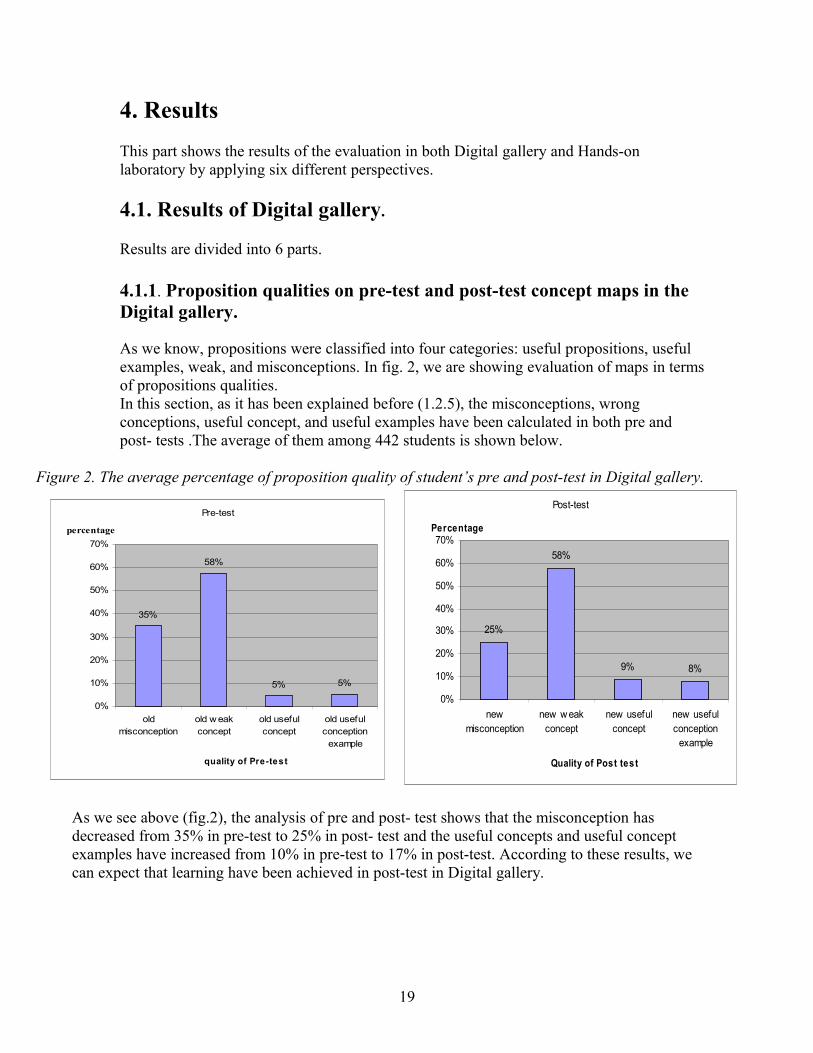
As we know, propositions were classified into four categories: useful propositions, useful examples, weak, and misconceptions. In fig. 2, we are showing evaluation of maps in terms of propositions qualities.In this section, as it has been explained before (1.2.5), the misconceptions, wrong conceptions, useful concept, and useful examples have been calculated in both pre and post- tests .The average of them among 442 students is shown below.
Figure 2. The average percentage of proposition quality of student’s pre and post-test in Digital gallery.
Pre-test
35%
58%
5% 5%
0%
10%
20%
30%
40%
50%
60%
70%
oldmisconception
old w eakconcept
old usefulconcept
old usefulconception
example
quality of Pre-test
percentage
Post-test
25%
58%
9% 8%
0%
10%
20%
30%
40%
50%
60%
70%
newmisconception
new w eakconcept
new usefulconcept
new usefulconception
example
Quality of Post test
Percentage
As we see above (fig.2), the analysis of pre and post- test shows that the misconception has decreased from 35% in pre-test to 25% in post- test and the useful concepts and useful concept examples have increased from 10% in pre-test to 17% in post-test. According to these results, we can expect that learning have been achieved in post-test in Digital gallery.
19
4.1.2. The frequency of categorized concepts in post-test in the Digital gallery.
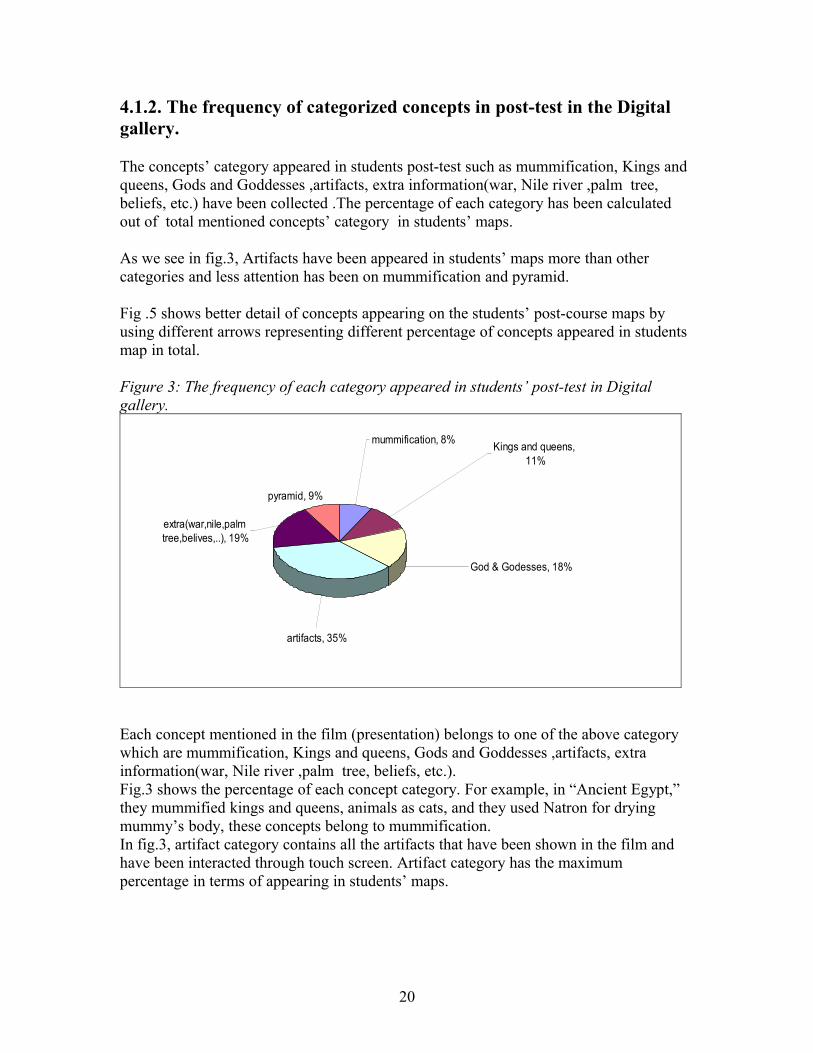
The concepts’ category appeared in students post-test such as mummification, Kings and queens, Gods and Goddesses ,artifacts, extra information(war, Nile river ,palm tree, beliefs, etc.) have been collected .The percentage of each category has been calculated out of total mentioned concepts’ category in students’ maps.
As we see in fig.3, Artifacts have been appeared in students’ maps more than other categories and less attention has been on mummification and pyramid.
Fig .5 shows better detail of concepts appearing on the students’ post-course maps by using different arrows representing different percentage of concepts appeared in students map in total.
Figure 3: The frequency of each category appeared in students’ post-test in Digital gallery.
extra(war,nile,palm tree,belives,..), 19%
pyramid, 9%
mummification, 8% Kings and queens, 11%
God & Godesses, 18%
artifacts, 35%
Each concept mentioned in the film (presentation) belongs to one of the above category which are mummification, Kings and queens, Gods and Goddesses ,artifacts, extra information(war, Nile river ,palm tree, beliefs, etc.).Fig.3 shows the percentage of each concept category. For example, in “Ancient Egypt,” they mummified kings and queens, animals as cats, and they used Natron for drying mummy’s body, these concepts belong to mummification.In fig.3, artifact category contains all the artifacts that have been shown in the film and have been interacted through touch screen. Artifact category has the maximum percentage in terms of appearing in students’ maps.
20
4.1.3. The rubric evaluation in the Digital gallery
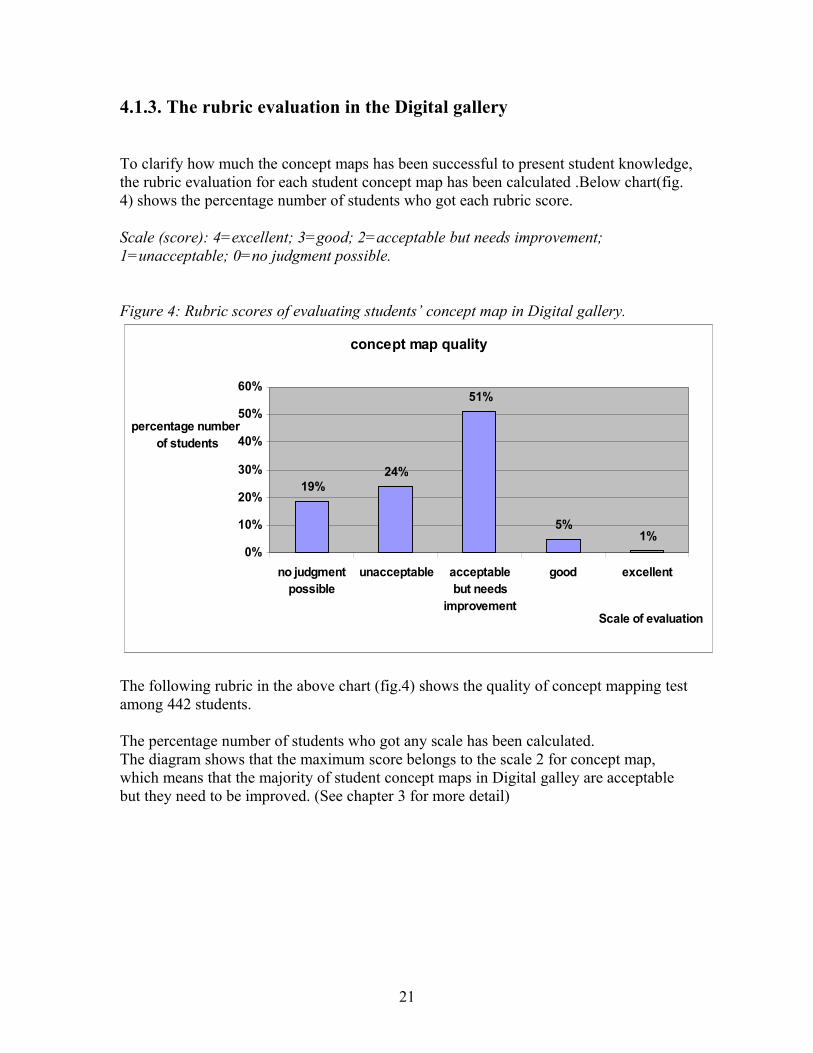
To clarify how much the concept maps has been successful to present student knowledge, the rubric evaluation for each student concept map has been calculated .Below chart(fig.4) shows the percentage number of students who got each rubric score.
Scale (score): 4=excellent; 3=good; 2=acceptable but needs improvement; 1=unacceptable; 0=no judgment possible.
Figure 4: Rubric scores of evaluating students’ concept map in Digital gallery.
concept map quality
19%24%
51%
5%1%
0%
10%
20%
30%
40%
50%
60%
no judgmentpossible
unacceptable acceptablebut needs
improvement
good excellent
Scale of evaluation
percentage number of students
The following rubric in the above chart (fig.4) shows the quality of concept mapping test among 442 students.
The percentage number of students who got any scale has been calculated.The diagram shows that the maximum score belongs to the scale 2 for concept map, which means that the majority of student concept maps in Digital galley are acceptable but they need to be improved. (See chapter 3 for more detail)
21

4.1.4. Frequency of concepts in post-test in the Digital gallery.
Frequency of concept mapping appearing on student’s post- test maps that did not appear on their pre-test maps has been calculated.
Figure 5: Frequencies of concepts appearing on the students’ post-test maps in Digital gallery.
Fig. 5 shows the frequency of each concept by percentage number of times appearing each concept in total of 442 students maps. We see that concept maps are not only a powerful tool for capturing, representing, and archiving knowledge of individuals, but also a powerful tool to create new knowledge.
22
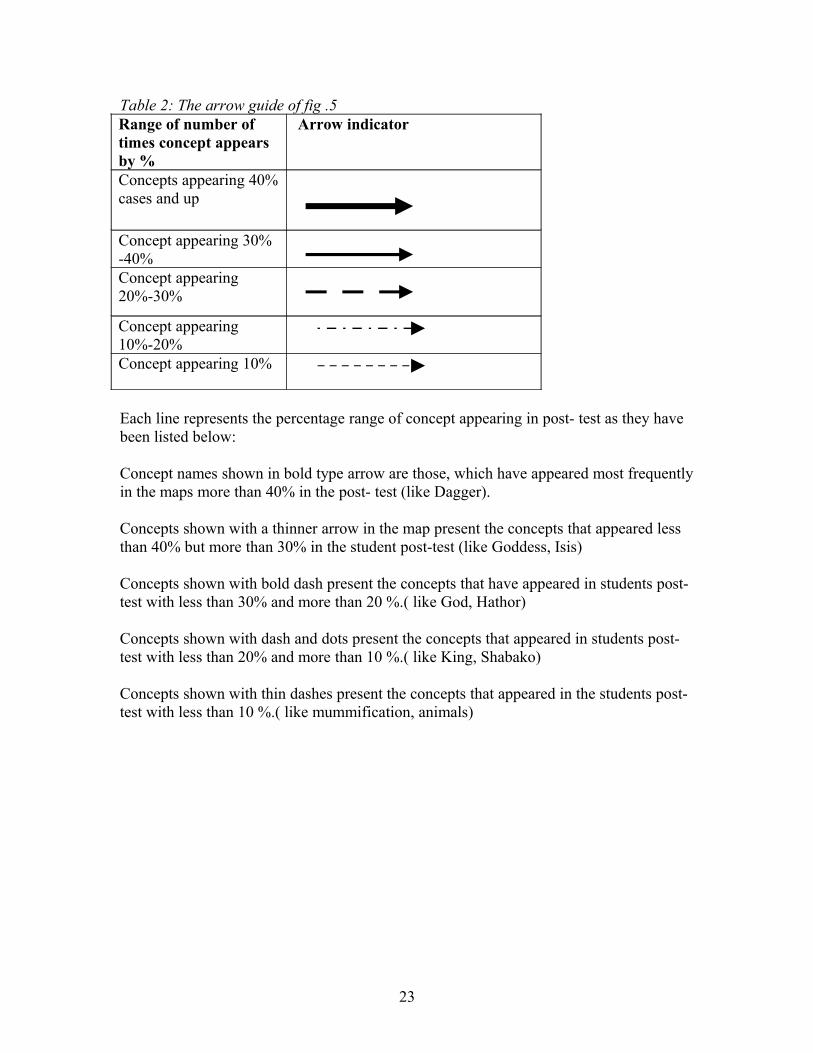
Table 2: The arrow guide of fig .5Range of number of times concept appears by %
Arrow indicator
Concepts appearing 40% cases and up
Concept appearing 30% -40%Concept appearing 20%-30%
Concept appearing 10%-20%Concept appearing 10%
Each line represents the percentage range of concept appearing in post- test as they have been listed below:
Concept names shown in bold type arrow are those, which have appeared most frequently in the maps more than 40% in the post- test (like Dagger).
Concepts shown with a thinner arrow in the map present the concepts that appeared less than 40% but more than 30% in the student post-test (like Goddess, Isis)
Concepts shown with bold dash present the concepts that have appeared in students post-test with less than 30% and more than 20 %.( like God, Hathor)
Concepts shown with dash and dots present the concepts that appeared in students post-test with less than 20% and more than 10 %.( like King, Shabako)
Concepts shown with thin dashes present the concepts that appeared in the students post-test with less than 10 %.( like mummification, animals)
23
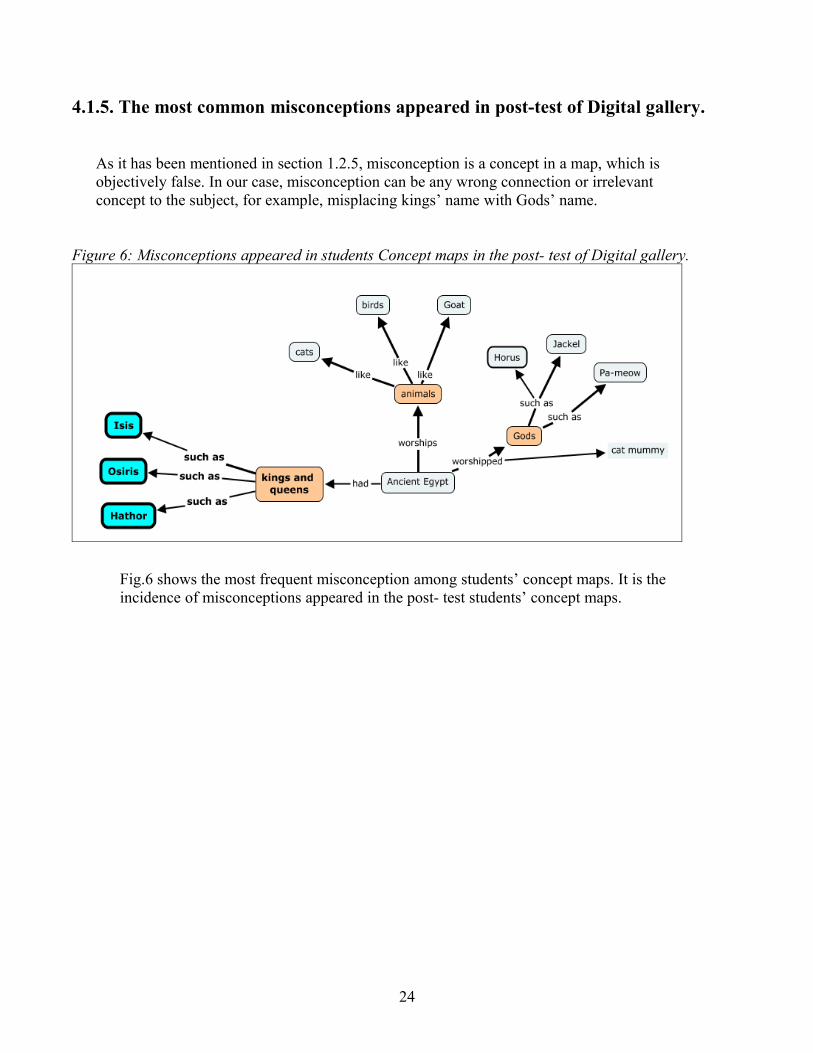
4.1.5. The most common misconceptions appeared in post-test of Digital gallery.
As it has been mentioned in section 1.2.5, misconception is a concept in a map, which is objectively false. In our case, misconception can be any wrong connection or irrelevant concept to the subject, for example, misplacing kings’ name with Gods’ name.
Figure 6: Misconceptions appeared in students Concept maps in the post- test of Digital gallery.
Fig.6 shows the most frequent misconception among students’ concept maps. It is the incidence of misconceptions appeared in the post- test students’ concept maps.
24
4.1.6-learning gain in the Digital galley.
Learning gain was calculated for each student in Digital gallery. These individual learning gains were averaged to give the section learning gain. For that purpose, the learning gain formulas mentioned in the chapter .3 have been applied.
Ln= (new concepts appeared in post- test learning with subtracting old concepts in pre test).
Lo = (Overall learning rate without subtracting old concepts from pre test).
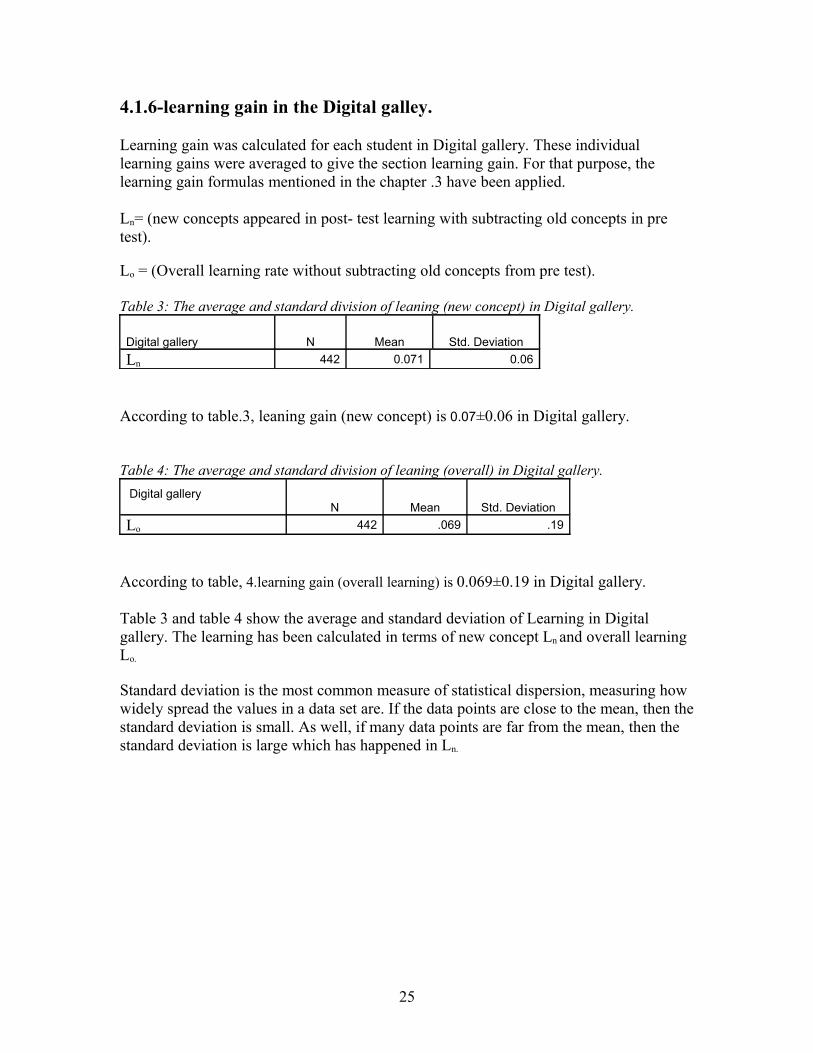
Table 3: The average and standard division of leaning (new concept) in Digital gallery.
Digital gallery N Mean Std. DeviationLn 442 0.071 0.06
According to table.3, leaning gain (new concept) is 0.07±0.06 in Digital gallery.
Table 4: The average and standard division of leaning (overall) in Digital gallery. Digital gallery
N Mean Std. DeviationLo 442 .069 .19
According to table, 4.learning gain (overall learning) is 0.069±0.19 in Digital gallery.
Table 3 and table 4 show the average and standard deviation of Learning in Digital gallery. The learning has been calculated in terms of new concept Ln and overall learning Lo.
Standard deviation is the most common measure of statistical dispersion, measuring how widely spread the values in a data set are. If the data points are close to the mean, then the standard deviation is small. As well, if many data points are far from the mean, then the standard deviation is large which has happened in Ln.
25
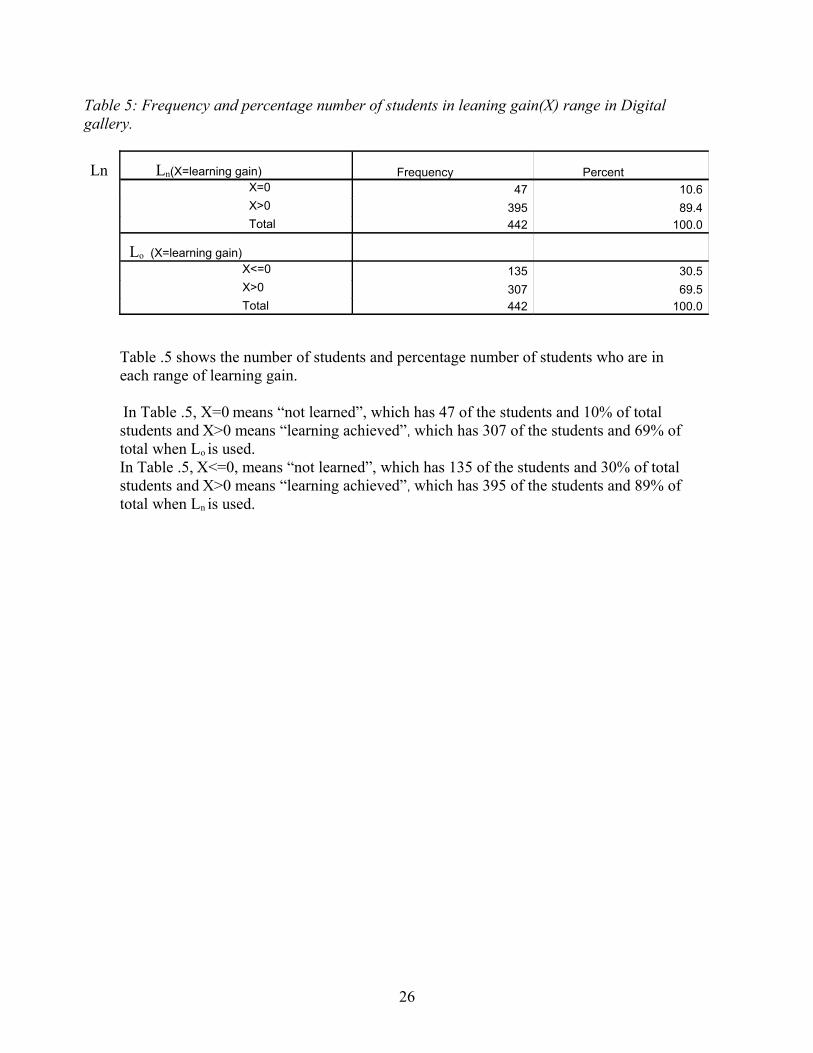
Table 5: Frequency and percentage number of students in leaning gain(X) range in Digital gallery.
Ln Ln(X=learning gain) Frequency Percent X=0 47 10.6 X>0 395 89.4
Total 442 100.0
Lo (X=learning gain)X<=0 135 30.5X>0 307 69.5
Total 442 100.0
Table .5 shows the number of students and percentage number of students who are in each range of learning gain.
In Table .5, X=0 means “not learned”, which has 47 of the students and 10% of total students and X>0 means “learning achieved”, which has 307 of the students and 69% of total when Lo is used.In Table .5, X<=0, means “not learned”, which has 135 of the students and 30% of total students and X>0 means “learning achieved”, which has 395 of the students and 89% of total when Ln is used.
26
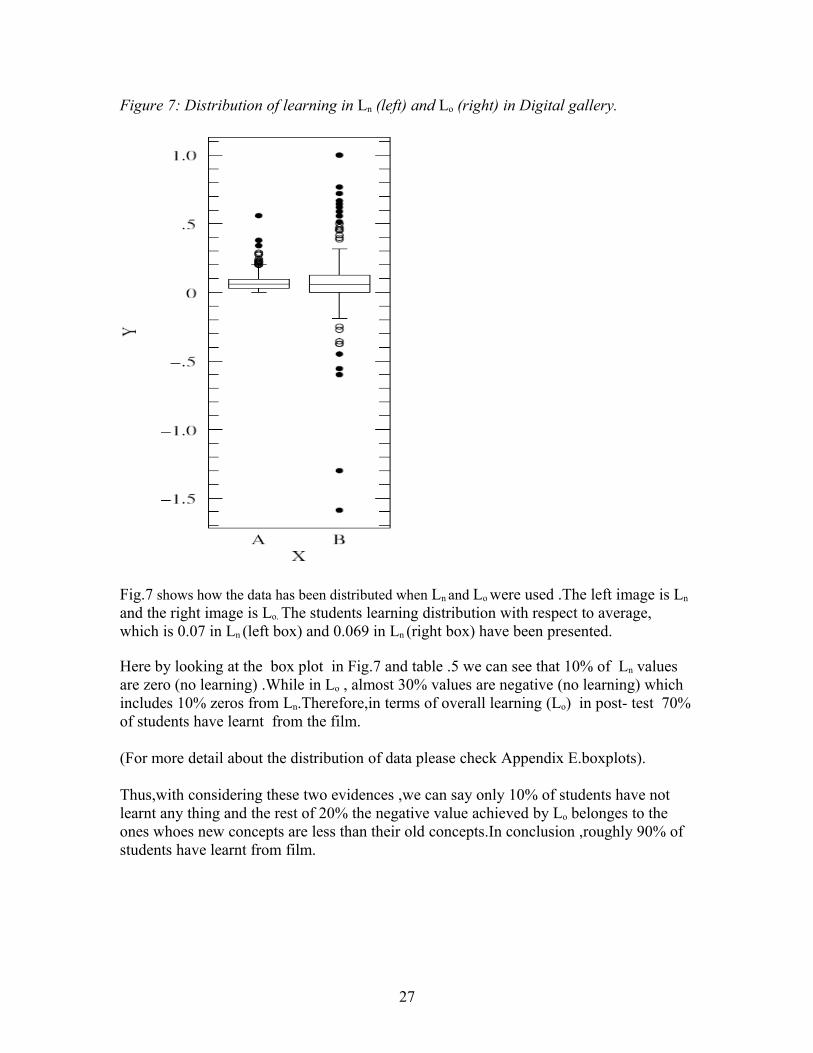
Figure 7: Distribution of learning in Ln (left) and Lo (right) in Digital gallery.
Fig.7 shows how the data has been distributed when Ln and Lo were used .The left image is Ln
and the right image is Lo. The students learning distribution with respect to average, which is 0.07 in Ln (left box) and 0.069 in Ln (right box) have been presented.
Here by looking at the box plot in Fig.7 and table .5 we can see that 10% of Ln values are zero (no learning) .While in Lo , almost 30% values are negative (no learning) which includes 10% zeros from Ln.Therefore,in terms of overall learning (Lo) in post- test 70% of students have learnt from the film.
(For more detail about the distribution of data please check Appendix E.boxplots).
Thus,with considering these two evidences ,we can say only 10% of students have not learnt any thing and the rest of 20% the negative value achieved by Lo belonges to the ones whoes new concepts are less than their old concepts.In conclusion ,roughly 90% of students have learnt from film.
27
4.2. Results of Hands-on Laboratory
Results are divided into 6 parts.
4.2.1. Proposition qualities on pre-test and post-test concept maps in the Hands-on laboratory
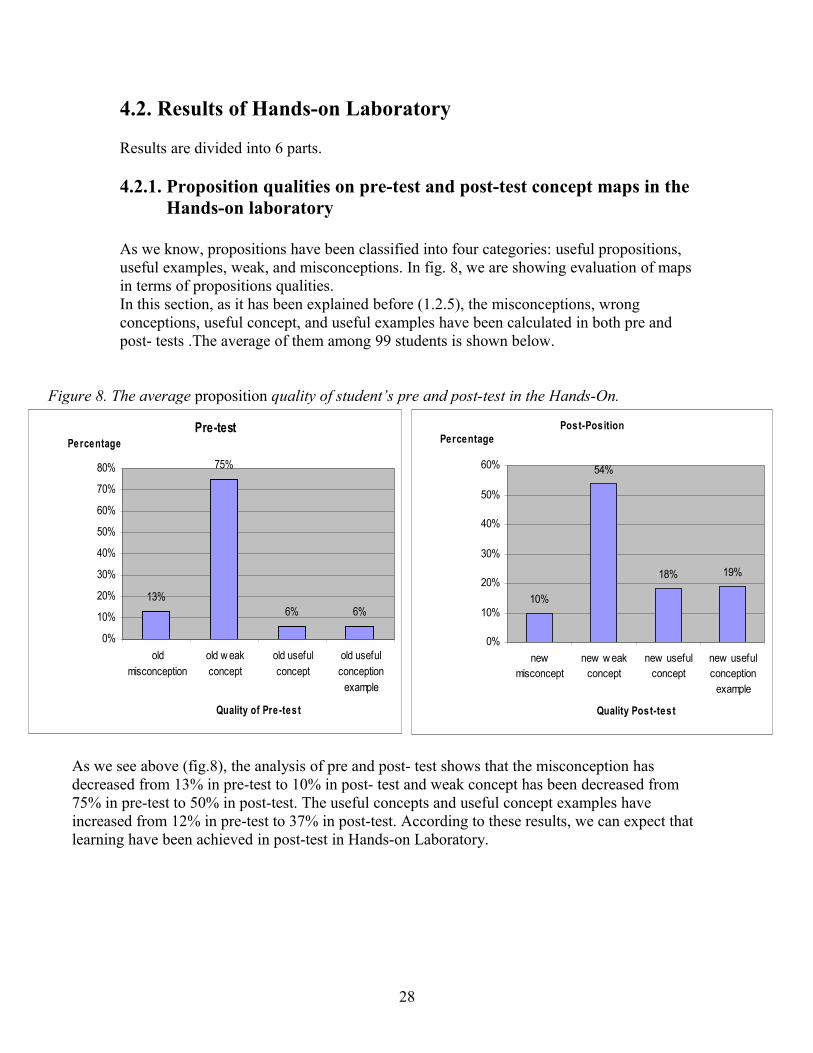
As we know, propositions have been classified into four categories: useful propositions, useful examples, weak, and misconceptions. In fig. 8, we are showing evaluation of maps in terms of propositions qualities.In this section, as it has been explained before (1.2.5), the misconceptions, wrong conceptions, useful concept, and useful examples have been calculated in both pre and post- tests .The average of them among 99 students is shown below.
Figure 8. The average proposition quality of student’s pre and post-test in the Hands-On.
Pre-test
13%
75%
6% 6%
0%
10%
20%
30%
40%
50%
60%
70%
80%
oldmisconception
old w eakconcept
old usefulconcept
old usefulconception
example
Quality of Pre -tes t
PercentagePost-Position
10%
54%
18% 19%
0%
10%
20%
30%
40%
50%
60%
newmisconcept
new w eakconcept
new usefulconcept
new usefulconception
example
Quality Post-test
Percentage
As we see above (fig.8), the analysis of pre and post- test shows that the misconception has decreased from 13% in pre-test to 10% in post- test and weak concept has been decreased from 75% in pre-test to 50% in post-test. The useful concepts and useful concept examples have increased from 12% in pre-test to 37% in post-test. According to these results, we can expect that learning have been achieved in post-test in Hands-on Laboratory.
28
4.2.2 The frequency of categorized concepts in post-test in the Hands-on laboratory.
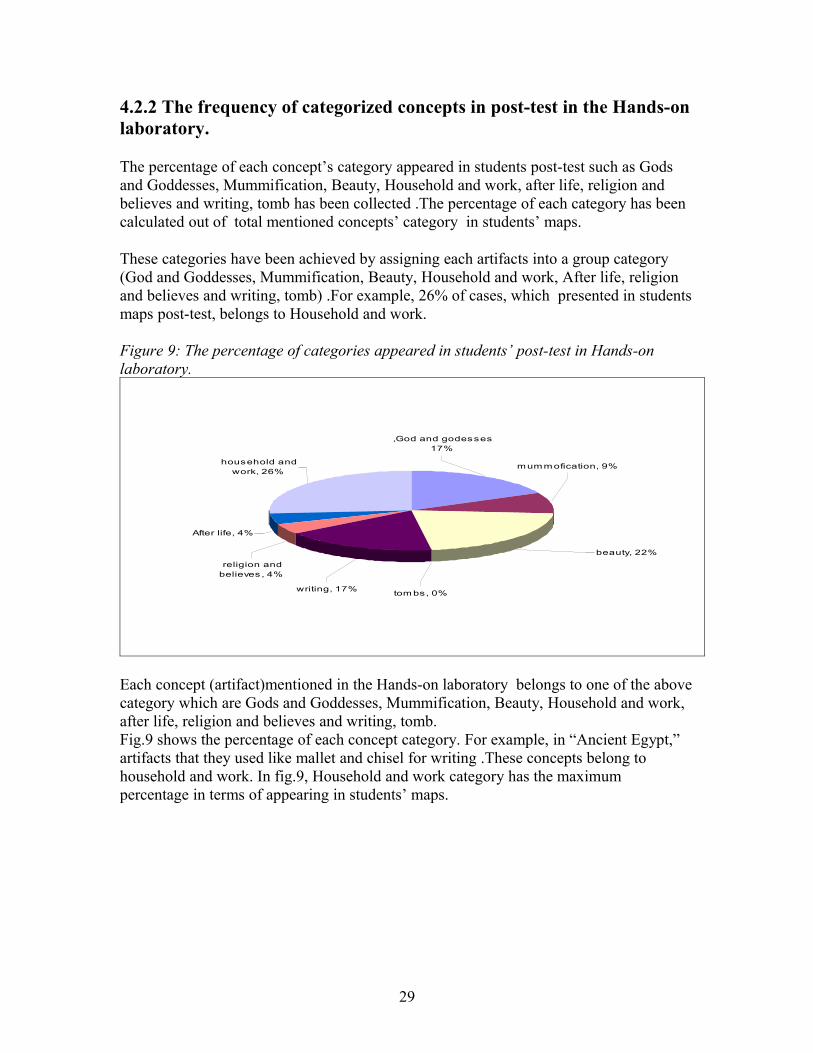
The percentage of each concept’s category appeared in students post-test such as Gods and Goddesses, Mummification, Beauty, Household and work, after life, religion and believes and writing, tomb has been collected .The percentage of each category has been calculated out of total mentioned concepts’ category in students’ maps.
These categories have been achieved by assigning each artifacts into a group category (God and Goddesses, Mummification, Beauty, Household and work, After life, religion and believes and writing, tomb) .For example, 26% of cases, which presented in students maps post-test, belongs to Household and work.
Figure 9: The percentage of categories appeared in students’ post-test in Hands-on laboratory.
After life, 4%
household andwork, 26%
religion andbelieves , 4%
tom bs, 0%writing, 17%
beauty, 22%
,God and godesses17%
mummofication, 9%
Each concept (artifact)mentioned in the Hands-on laboratory belongs to one of the above category which are Gods and Goddesses, Mummification, Beauty, Household and work, after life, religion and believes and writing, tomb.Fig.9 shows the percentage of each concept category. For example, in “Ancient Egypt,” artifacts that they used like mallet and chisel for writing .These concepts belong to household and work. In fig.9, Household and work category has the maximum percentage in terms of appearing in students’ maps.
29
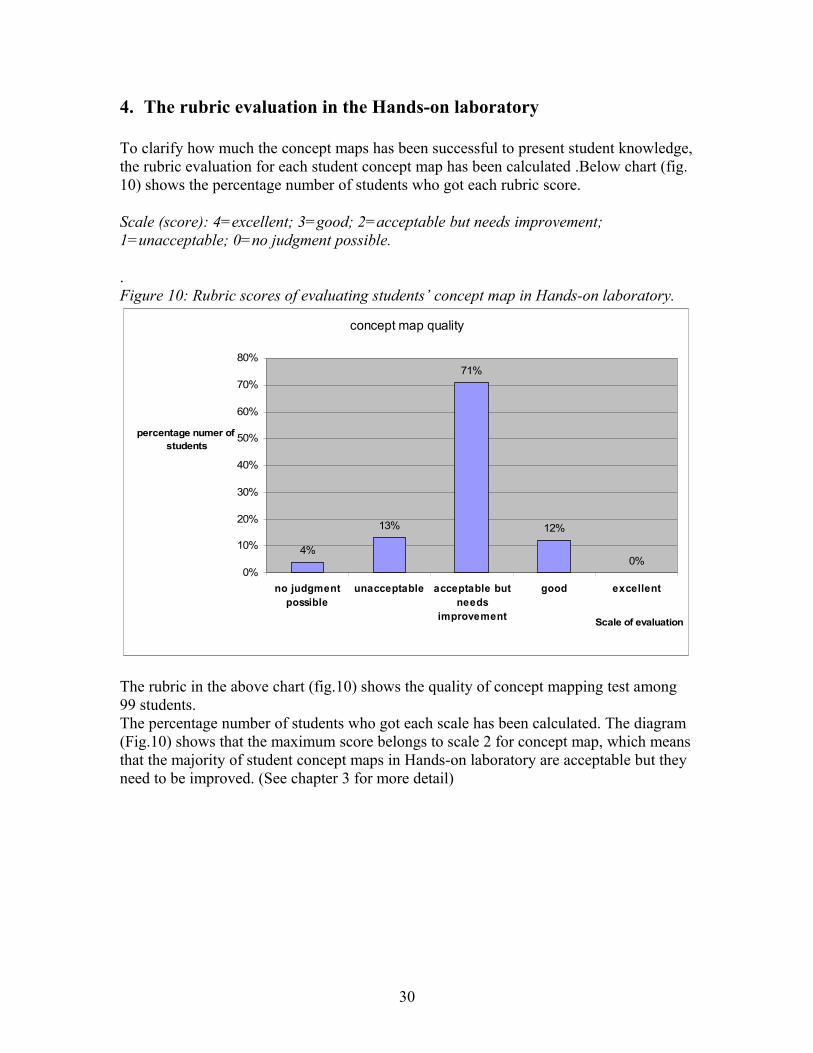
4. The rubric evaluation in the Hands-on laboratory
To clarify how much the concept maps has been successful to present student knowledge, the rubric evaluation for each student concept map has been calculated .Below chart (fig.10) shows the percentage number of students who got each rubric score.
Scale (score): 4=excellent; 3=good; 2=acceptable but needs improvement; 1=unacceptable; 0=no judgment possible.
. Figure 10: Rubric scores of evaluating students’ concept map in Hands-on laboratory.
concept map quality
4%
13%
71%
12%
0%0%
10%
20%
30%
40%
50%
60%
70%
80%
no judgmentpossible
unacceptable acceptable butneeds
improvement
good excellent
Scale of evaluation
percentage numer of students
The rubric in the above chart (fig.10) shows the quality of concept mapping test among 99 students. The percentage number of students who got each scale has been calculated. The diagram (Fig.10) shows that the maximum score belongs to scale 2 for concept map, which means that the majority of student concept maps in Hands-on laboratory are acceptable but they need to be improved. (See chapter 3 for more detail)
30
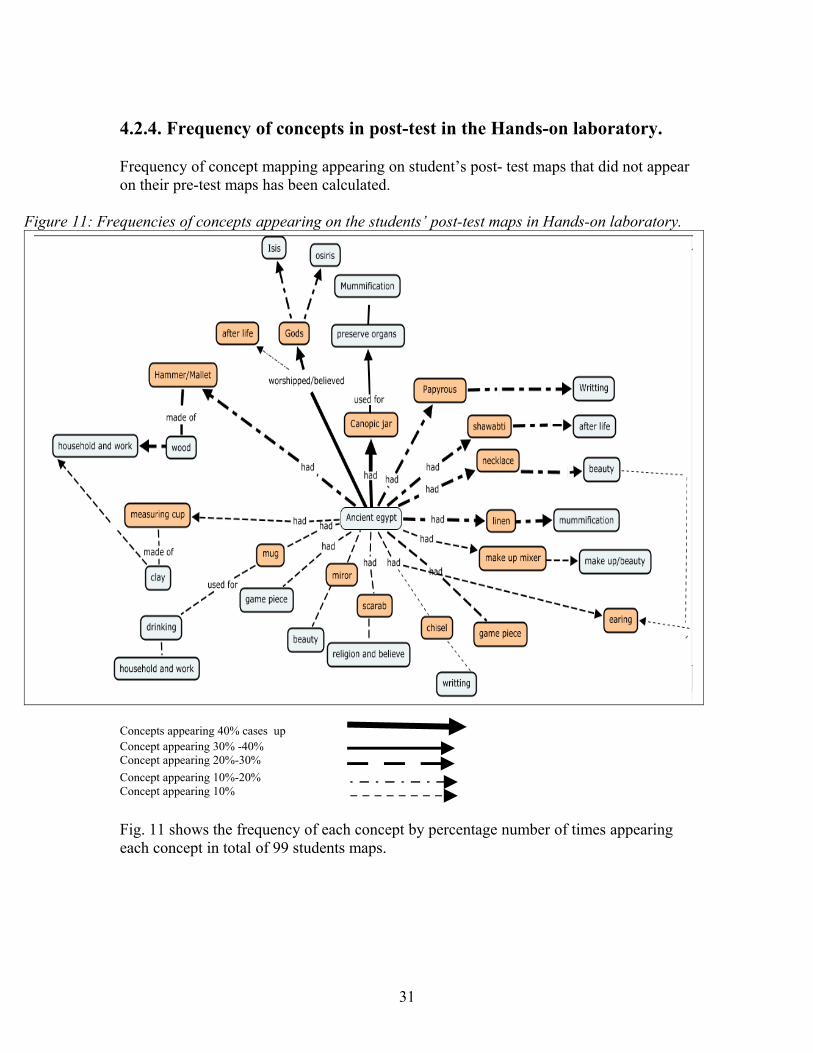
4.2.4. Frequency of concepts in post-test in the Hands-on laboratory.
Frequency of concept mapping appearing on student’s post- test maps that did not appear on their pre-test maps has been calculated.
Figure 11: Frequencies of concepts appearing on the students’ post-test maps in Hands-on laboratory.
Concepts appearing 40% cases up Concept appearing 30% -40%Concept appearing 20%-30%Concept appearing 10%-20%Concept appearing 10%
Fig. 11 shows the frequency of each concept by percentage number of times appearing each concept in total of 99 students maps.
31
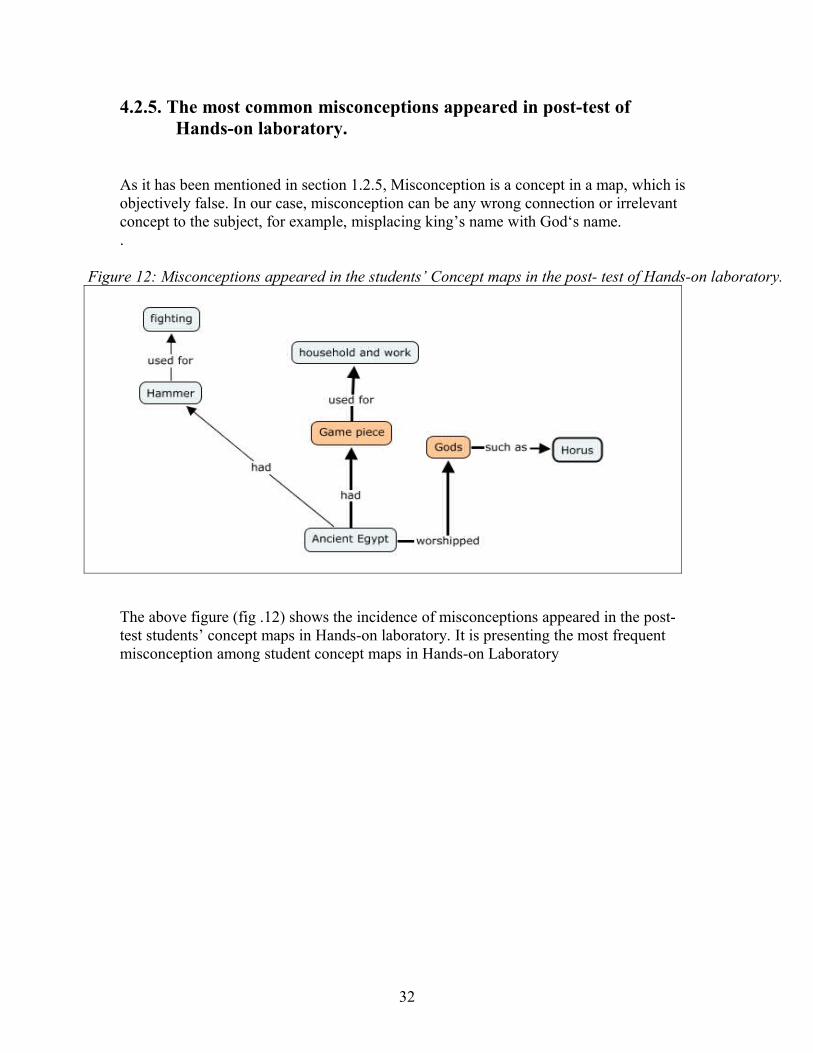
4.2.5. The most common misconceptions appeared in post-test of Hands-on laboratory.
As it has been mentioned in section 1.2.5, Misconception is a concept in a map, which is objectively false. In our case, misconception can be any wrong connection or irrelevant concept to the subject, for example, misplacing king’s name with God‘s name..
Figure 12: Misconceptions appeared in the students’ Concept maps in the post- test of Hands-on laboratory.
The above figure (fig .12) shows the incidence of misconceptions appeared in the post- test students’ concept maps in Hands-on laboratory. It is presenting the most frequent misconception among student concept maps in Hands-on Laboratory
32
4.2.6. Learning gain in the Hands-on Laboratory
Learning gain was calculated for each student in the Hands-on Laboratory. These individual learning gains were averaged to give the section learning gain. For that purpose, the learning gain formulas mentioned in chapter 3 have been applied.
Ln = (new concepts appeared in post- test learning with subtracting old concepts in pre- test).
Lo = (Overall learning rate without subtracting old concepts from pre test).
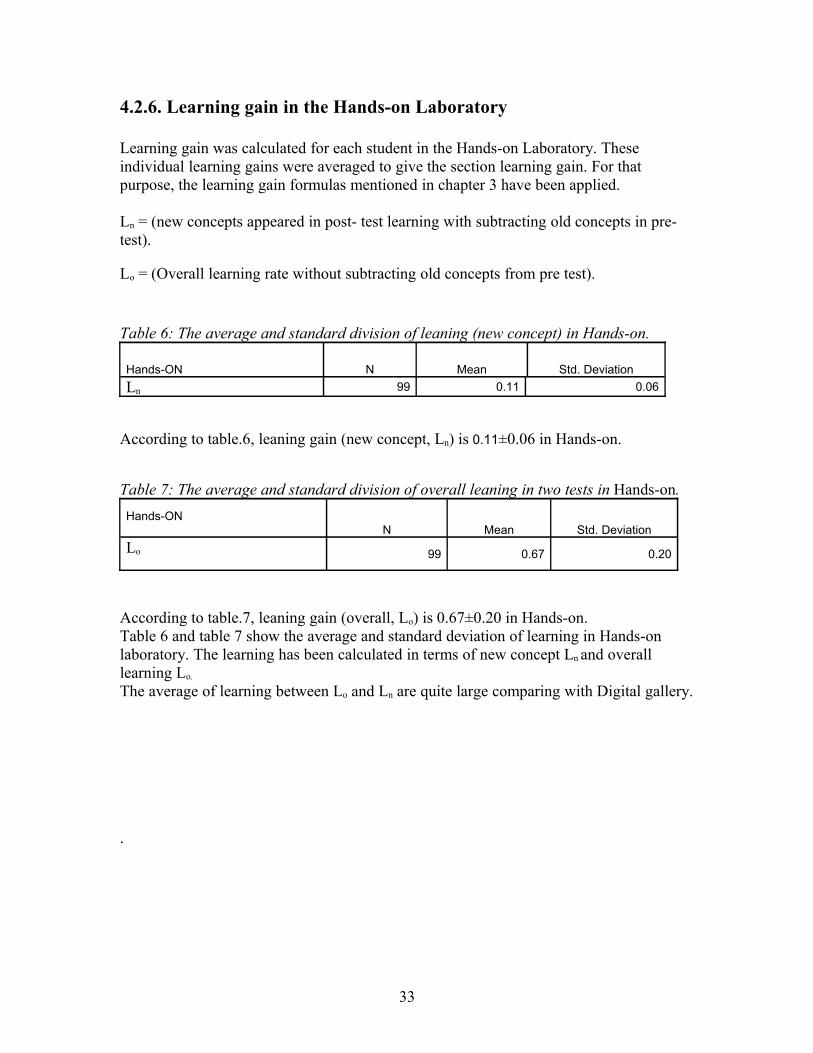
Table 6: The average and standard division of leaning (new concept) in Hands-on.
Hands-ON N Mean Std. DeviationLn 99 0.11 0.06
According to table.6, leaning gain (new concept, Ln) is 0.11±0.06 in Hands-on.
Table 7: The average and standard division of overall leaning in two tests in Hands-on.Hands-ON
N Mean Std. DeviationLo 99 0.67 0.20
According to table.7, leaning gain (overall, Lo) is 0.67±0.20 in Hands-on.Table 6 and table 7 show the average and standard deviation of learning in Hands-on laboratory. The learning has been calculated in terms of new concept Ln and overall learning Lo.
The average of learning between Lo and Ln are quite large comparing with Digital gallery.
.
33
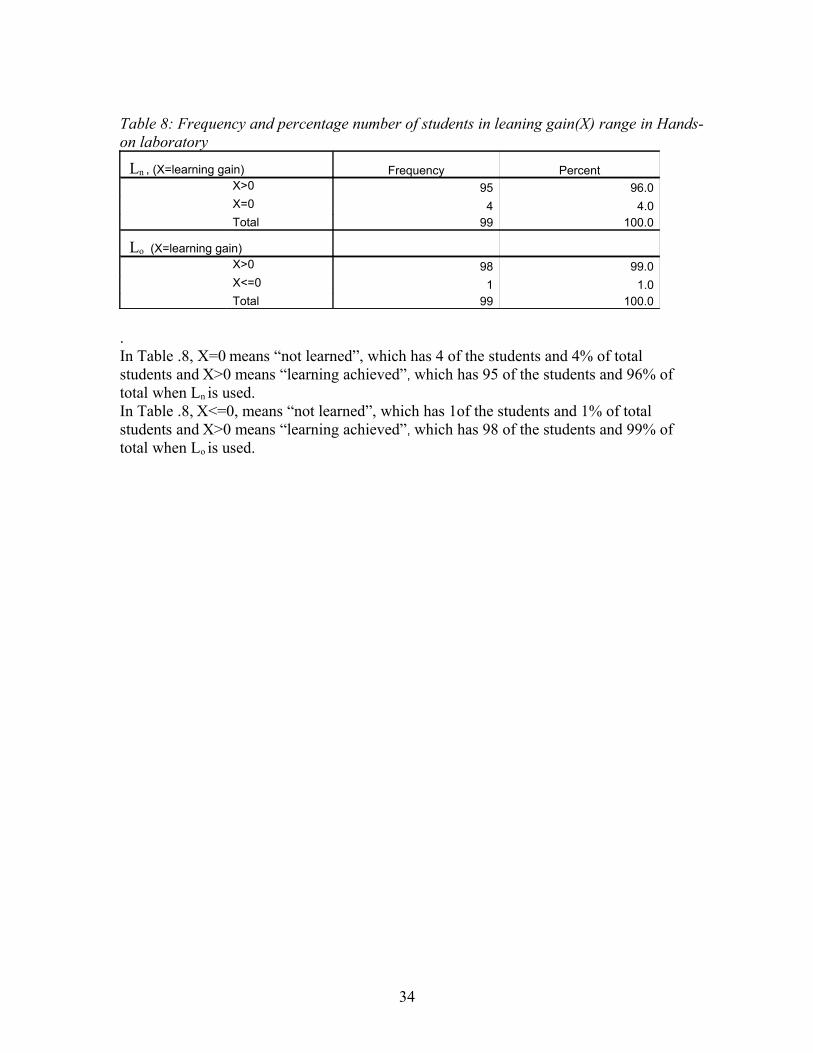
Table 8: Frequency and percentage number of students in leaning gain(X) range in Hands-on laboratory Ln , (X=learning gain) Frequency Percent
X>0 95 96.0X=0 4 4.0
Total 99 100.0
Lo (X=learning gain)X>0 98 99.0X<=0 1 1.0
Total 99 100.0
.In Table .8, X=0 means “not learned”, which has 4 of the students and 4% of total students and X>0 means “learning achieved”, which has 95 of the students and 96% of total when Ln is used.In Table .8, X<=0, means “not learned”, which has 1of the students and 1% of total students and X>0 means “learning achieved”, which has 98 of the students and 99% of total when Lo is used.
34

Figure 14: Distribution of learning in Ln (left) and Lo (right) in Hands-on laboratory.
Fig.14 shows how the data has been distributed when Ln and Lo were used .The left image is Ln and the right image is Lo. The students learning distribution with respect to average, which is 0.11 in Ln (left box) and 0.67 in Ln (right box) have been presented.
Here by looking at the box plot (Fig.14) and table 8, we can see that Ln has several points ( 4% of Ln values) that are zero (no learning). For more details and better understanding of the distribution of data please check Appendix E.boxplots
In Lo , almost 1% values are negative (not learned) which includes 1% zeros from Ln.Therefore,in terms of overall learning (based on Lo) in post- test 96% of students have learned from film.
Therefore,with considering these two evideces ,we can say only 1% of students have not learnt any thing and the 4% the negative value achieved by Ln belonges to the ones whoes new concepts are zero.In conclusion ,roughly 99% of students have learnt.
35
4.3. Comparison between Digital gallery and Hands-on Laboratory
By looking back to the previous result, we can see the difference between Digital gallery and Hands-on laboratory in terms of learning. It shows that learning in Hands-on laboratory is significantly more than Digital galley.
In order to find that this difference is real, it is better to use a test in which works with random samples. The test that has been chosen is called t-test. For our case, SPSS, an analytical soft ware, has been used to do the t-test.This test not only is done to find out if there is any difference between Digital gallery and Hands-on laboratory but also to find out if there is any difference in terms of learning between girls and boys in both Digital gallery and Hands-on laboratory.Before, I just have to go through some concepts about this test.
4.3.1. Independent sample Groups t-test
The t-test is one way to compare whether the average difference between two groups is significant or if it is due to random chance.
Newsom (2006) says:“Independent sample group’s t-test is used when we have a continuous dependent variable and we are interested in comparing two groups. The situation in which the between groups t-test is appropriate is to state that t-test involves independent variable and a continuous dependent variable. The independent variable is the one assumed the cause and the dependent variable is the result or the outcome. The means of the dependent variable for participants in the two groups is compared. Therefore, the t-test is to see if the independent, grouping variable produces a large difference between the means on the dependent.”
If the means of the two groups are large relative to what we would expect to occur from sample to sample, we consider the difference significant. If the difference between the group means is small relative to the amount of sampling variability, the difference will not be significant. We can think of the formula conceptually as a ratio like this:
t = difference between groupssampling variability
When the value on the top of the equation is large, or the value on the bottom of the equation is small, the overall ratio will be large. The larger the value of t, the farther out on the sampling curve it will be, and, thus, the more likely that it will be significant.
36
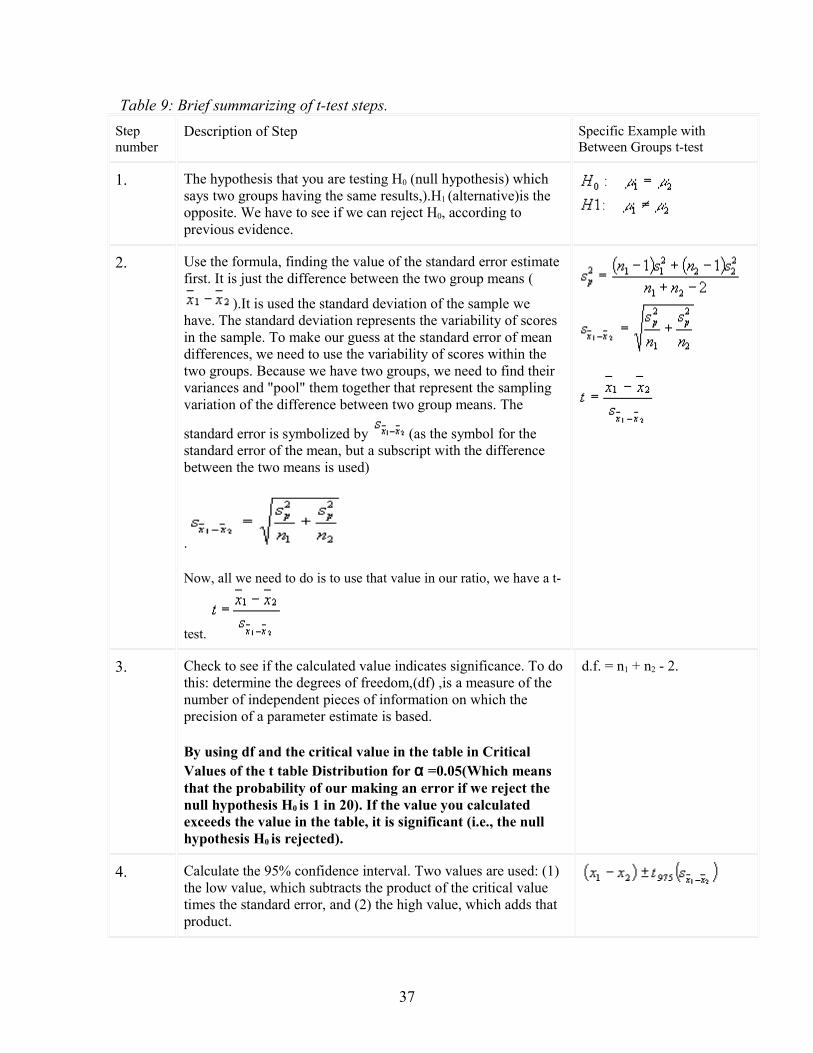
Table 9: Brief summarizing of t-test steps.Step number
Description of Step Specific Example with Between Groups t-test
1. The hypothesis that you are testing H0 (null hypothesis) which says two groups having the same results,).H1 (alternative)is the opposite. We have to see if we can reject H0, according to previous evidence.
2. Use the formula, finding the value of the standard error estimate first. It is just the difference between the two group means (
).It is used the standard deviation of the sample we have. The standard deviation represents the variability of scores in the sample. To make our guess at the standard error of mean differences, we need to use the variability of scores within the two groups. Because we have two groups, we need to find their variances and "pool" them together that represent the sampling variation of the difference between two group means. The
standard error is symbolized by (as the symbol for the standard error of the mean, but a subscript with the difference between the two means is used)
.
Now, all we need to do is to use that value in our ratio, we have a t-
test.
3. Check to see if the calculated value indicates significance. To do this: determine the degrees of freedom,(df) ,is a measure of the number of independent pieces of information on which the precision of a parameter estimate is based.
By using df and the critical value in the table in Critical Values of the t table Distribution for α =0.05(Which means that the probability of our making an error if we reject the null hypothesis H0 is 1 in 20). If the value you calculated exceeds the value in the table, it is significant (i.e., the null hypothesis H0 is rejected).
d.f. = n1 + n2 - 2.
4. Calculate the 95% confidence interval. Two values are used: (1) the low value, which subtracts the product of the critical value times the standard error, and (2) the high value, which adds that product.
37
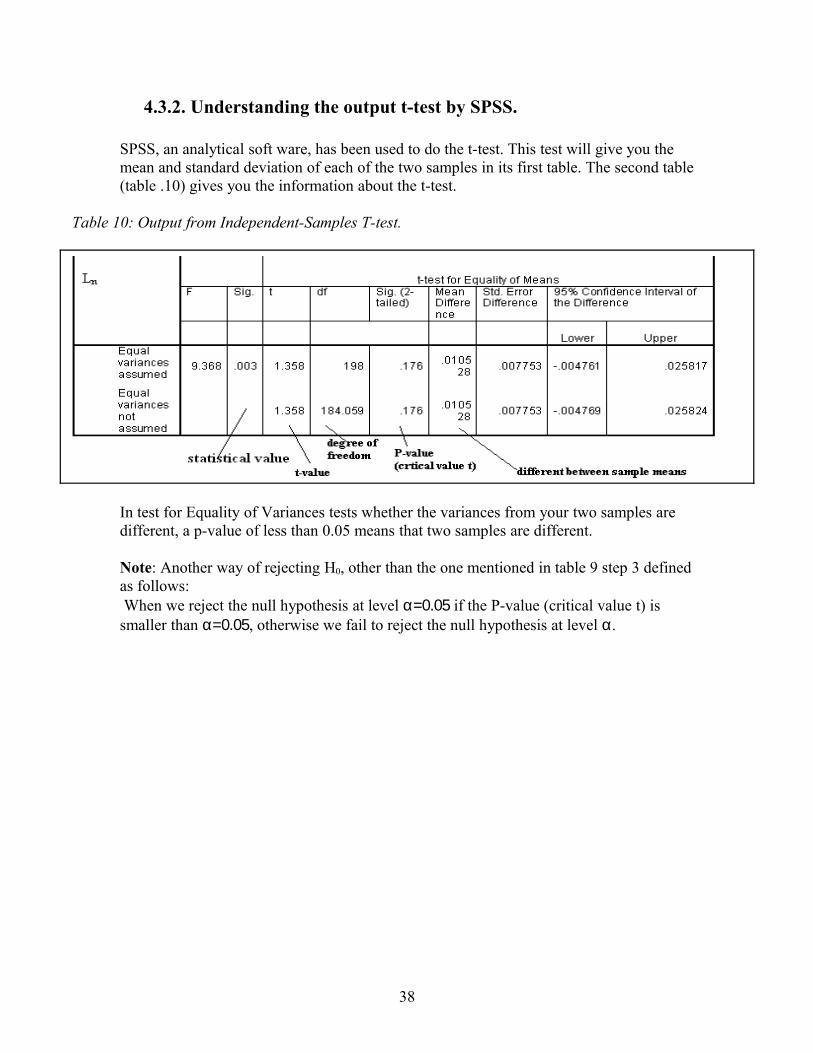
4.3.2. Understanding the output t-test by SPSS.
SPSS, an analytical soft ware, has been used to do the t-test. This test will give you the mean and standard deviation of each of the two samples in its first table. The second table (table .10) gives you the information about the t-test.
Table 10: Output from Independent-Samples T-test.
In test for Equality of Variances tests whether the variances from your two samples are different, a p-value of less than 0.05 means that two samples are different.
Note: Another way of rejecting H0, other than the one mentioned in table 9 step 3 defined as follows: When we reject the null hypothesis at level α=0.05 if the P-value (critical value t) is smaller than α=0.05, otherwise we fail to reject the null hypothesis at level α.
38
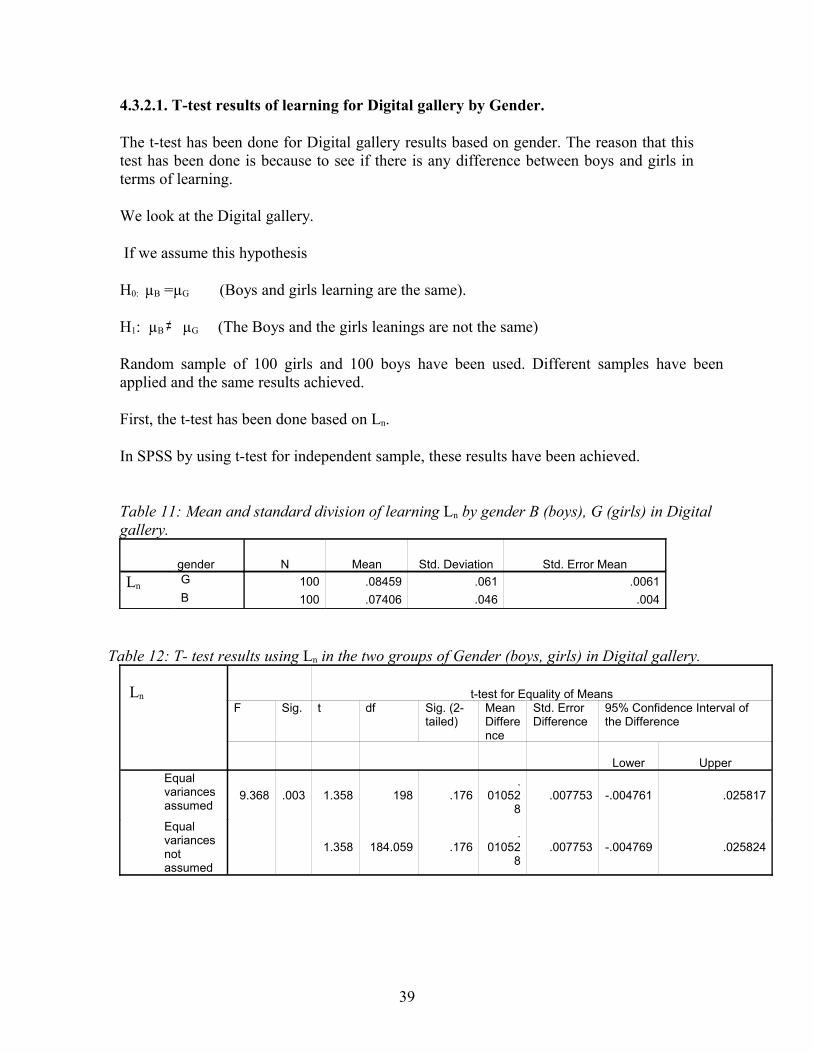
4.3.2.1. T-test results of learning for Digital gallery by Gender.
The t-test has been done for Digital gallery results based on gender. The reason that this test has been done is because to see if there is any difference between boys and girls in terms of learning.
We look at the Digital gallery.
If we assume this hypothesis
H0: µB =µG (Boys and girls learning are the same).
H1: µB ≠ µG (The Boys and the girls leanings are not the same)
Random sample of 100 girls and 100 boys have been used. Different samples have been applied and the same results achieved.
First, the t-test has been done based on Ln.
In SPSS by using t-test for independent sample, these results have been achieved.
Table 11: Mean and standard division of learning Ln by gender B (boys), G (girls) in Digital gallery.
gender N Mean Std. Deviation Std. Error MeanLn G 100 .08459 .061 .0061 B 100 .07406 .046 .004
Table 12: T- test results using Ln in the two groups of Gender (boys, girls) in Digital gallery.
Ln
t-test for Equality of MeansF Sig. t df Sig. (2-
tailed)Mean Difference
Std. Error Difference
95% Confidence Interval of the Difference
Lower Upper
Equal variances assumed
9.368 .003 1.358 198 .176.
010528
.007753 -.004761 .025817
Equal variances not assumed
1.358 184.059 .176.
010528
.007753 -.004769 .025824
39
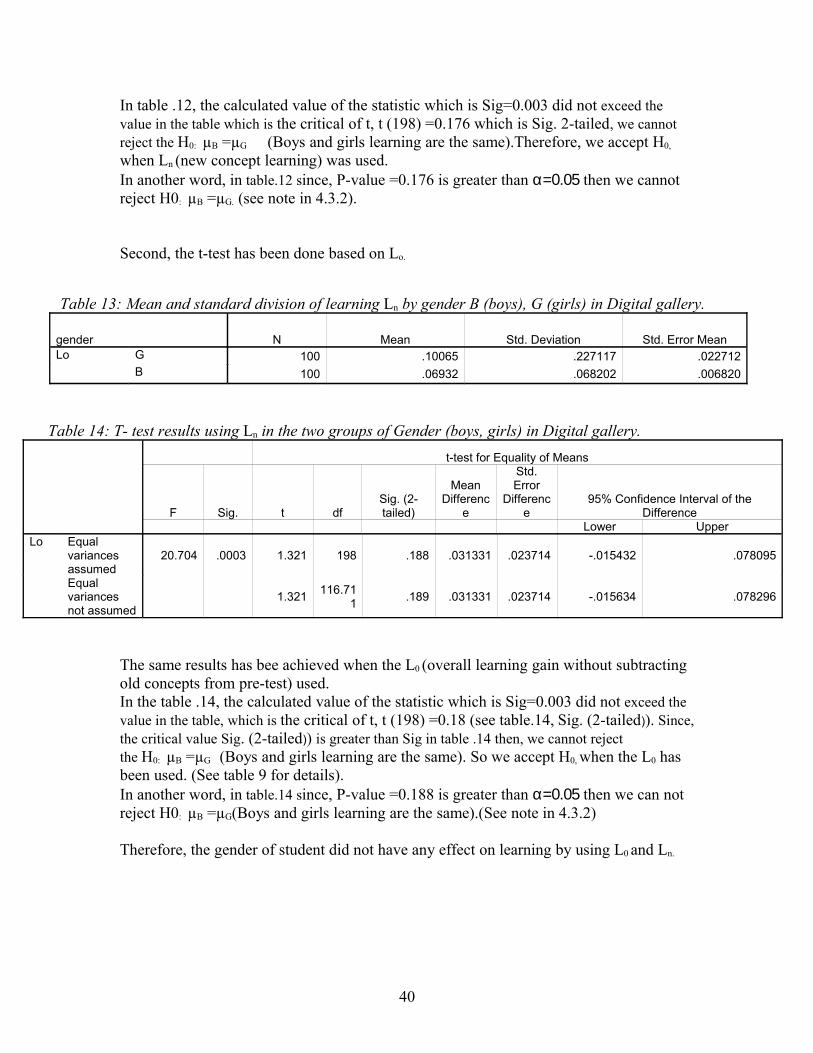
In table .12, the calculated value of the statistic which is Sig=0.003 did not exceed the value in the table which is the critical of t, t (198) =0.176 which is Sig. 2-tailed, we cannot reject the H0: µB =µG (Boys and girls learning are the same).Therefore, we accept H0,
when Ln (new concept learning) was used.In another word, in table.12 since, P-value =0.176 is greater than α=0.05 then we cannot reject H0: µB =µG. (see note in 4.3.2).
Second, the t-test has been done based on Lo.
Table 13: Mean and standard division of learning Ln by gender B (boys), G (girls) in Digital gallery. gender N Mean Std. Deviation Std. Error MeanLo G 100 .10065 .227117 .022712 B 100 .06932 .068202 .006820
Table 14: T- test results using Ln in the two groups of Gender (boys, girls) in Digital gallery.
t-test for Equality of Means
F Sig. t dfSig. (2-tailed)
Mean Differenc
e
Std. Error
Difference
95% Confidence Interval of the Difference
Lower UpperLo Equal
variances assumed
20.704 .0003 1.321 198 .188 .031331 .023714 -.015432 .078095
Equal variances not assumed
1.321 116.711 .189 .031331 .023714 -.015634 .078296
The same results has bee achieved when the L0 (overall learning gain without subtracting old concepts from pre-test) used.In the table .14, the calculated value of the statistic which is Sig=0.003 did not exceed the value in the table, which is the critical of t, t (198) =0.18 (see table.14, Sig. (2-tailed)). Since, the critical value Sig. (2-tailed)) is greater than Sig in table .14 then, we cannot reject the H0: µB =µG (Boys and girls learning are the same). So we accept H0, when the L0 has been used. (See table 9 for details).In another word, in table.14 since, P-value =0.188 is greater than α=0.05 then we can not reject H0: µB =µG(Boys and girls learning are the same).(See note in 4.3.2)
Therefore, the gender of student did not have any effect on learning by using L0 and Ln.
40

4.3.2.2. T-test results of learning for the Hands-on laboratory by Gender.
The t-test has been done for the Hands-on laboratory results based on gender. The reason that this test has been done is because to see if there is any difference between boys and girls in terms of learning.
If we assume this hypothesis:
H0: µB =µG (Boys and girls learning are the same).
H1: µB ≠ µG (The Boys and the girls leanings are not the same)
Random sample of 36 girls and 36 have been used. Different samples have been applied and the same results achieved.
By using SPSS, t-test for independent sample, these results have been achieved.
.First, the t-test has been done based on Ln.
Table 15: Mean and standard division of learning Ln by gender b (boys), g (girls) in Hands-on laboratory.
Gender N Mean Std. Deviation Std. Error MeanLn g 36 .1032 .071 .011 b 36 .1068 .050 .008
Table 16: T- test results using Ln in the two groups of Gender (boys, girls) in Hands-on laboratory.
t-test for Equality of Means
F Sig. t dfSig. (2-tailed) Mean Difference
Std. Error Difference
95% Confidence Interval of the
Difference Lower Upper
Ln
Equal variances assumed
1.515 .223 -.247 70 .806 -.0036 .014 -.03280 .02558
Equal variances not assumed
-.247 62.854 .806 -.0036 .014 -.03286 .02564
41
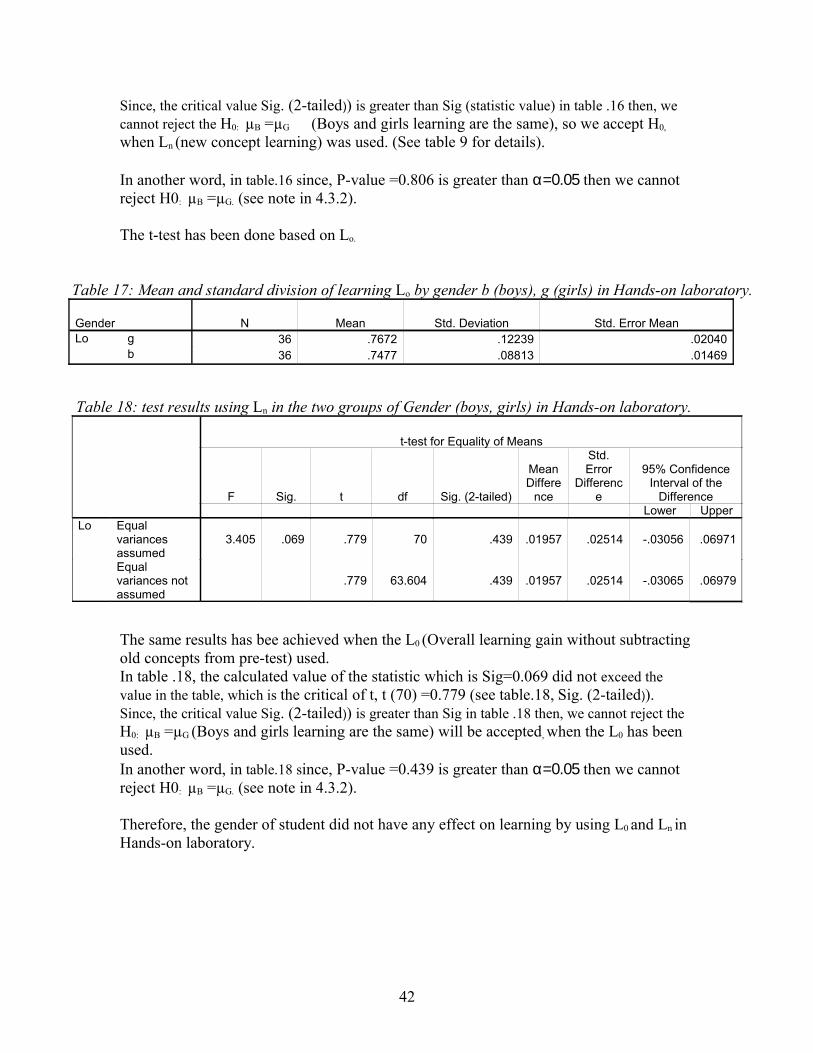
Since, the critical value Sig. (2-tailed)) is greater than Sig (statistic value) in table .16 then, we cannot reject the H0: µB =µG (Boys and girls learning are the same), so we accept H0,
when Ln (new concept learning) was used. (See table 9 for details).
In another word, in table.16 since, P-value =0.806 is greater than α=0.05 then we cannot reject H0: µB =µG. (see note in 4.3.2).
The t-test has been done based on Lo.
Table 17: Mean and standard division of learning Lo by gender b (boys), g (girls) in Hands-on laboratory. Gender N Mean Std. Deviation Std. Error MeanLo g 36 .7672 .12239 .02040 b 36 .7477 .08813 .01469
Table 18: test results using Ln in the two groups of Gender (boys, girls) in Hands-on laboratory.
The same results has bee achieved when the L0 (Overall learning gain without subtracting old concepts from pre-test) used.In table .18, the calculated value of the statistic which is Sig=0.069 did not exceed the value in the table, which is the critical of t, t (70) =0.779 (see table.18, Sig. (2-tailed)). Since, the critical value Sig. (2-tailed)) is greater than Sig in table .18 then, we cannot reject the H0: µB =µG (Boys and girls learning are the same) will be accepted, when the L0 has been used.In another word, in table.18 since, P-value =0.439 is greater than α=0.05 then we cannot reject H0: µB =µG. (see note in 4.3.2).
Therefore, the gender of student did not have any effect on learning by using L0 and Ln in Hands-on laboratory.
42
t-test for Equality of Means
F Sig. t df Sig. (2-tailed)
Mean Differe
nce
Std. Error
Difference
95% Confidence Interval of the
Difference Lower Upper
Lo Equal variances assumed
3.405 .069 .779 70 .439 .01957 .02514 -.03056 .06971
Equal variances not assumed
.779 63.604 .439 .01957 .02514 -.03065 .06979

4.3.2.3. T-test results of comparing Digital gallery and Hands-on laboratory leaning.
The t-test results achieved by using Ln are reasonable for discussion.
With random sample of 79 and 79 of 2 groups of students from Digital gallery and Hands-on laboratory.
If we assume this hypothesis:
H0: µ1 =µ2 (learning in Digital gallery and Hands-on laboratory are the same).
H1: µ1 ≠ µ2 (learning in Digital gallery and Hands-on laboratory are not the same).
By using SPSS, t-test for independent sample, these results have been achieved.
Table 19: Mean and standard division of the sample of 79-79 students of Digital gallery (D) and Hands-On (H).
N Mean Std. Deviation Std. Error MeanLn D 79 .08756 .034385 .003869 H
79 .10748 .037361 .004203
Table 20: T- test results of learning for the two groups in Digital gallery (D) and Hands-On laboratory (H).
According to table .20 results, we can see that the value of the statistic is “Sig” is 0.217 while the critical value of t, t (156) =0.001
43
t-test for Equality of Means
F Sig. t dfSig. (2-tailed)
Mean Differenc
eStd. Error Difference
95% Confidence Interval of the
Difference Lower Upper
Ln Equal variances assumed
1.539 .217 -3.487 156 .001 -.019919 .005713-.
031203
-.008635
Equal variances not assumed
-3.487 155.937 .001 -.019919 .005713-.
031203
-.008634
According to step 3 of table 9, we concluded that the statistic value is larger than critical value, we can easily reject H0, in which H0: µ1 =µ2 (learning in Digital gallery and Hands-on laboratory are the same).
In another word, in table.20 since, P-value =0.01 is less than α=0.05 then we can reject H0: µB =µG. (see note in 4.3.2).
It means that learning in the two learning environments (Digital gallery and Hands-on laboratory) are not equal and what we got in learning gain is reliable. Therefore, we can safely conclude that the average of (difference mean between two groups) 0.019 is not due to chance alone.
Note 1: Since only 3% of students who visited the Digital gallery and Hands-on laboratory are from other grades and 97% are grade 5, it would not be a reliable sample if dividing them by grade (age) .It has also no discussable difference been found between this small sample and the larger.
Note 2: When Lo was used, Sig. (2-tailed) =Sig=0 (in Appendix C. tables), which are representing critical values in t –table and value of the statistic Sig respectively, we cannot say anything about the test. .Therefore this part has not been shown here .For more details, check Appendix .C. for results.
44
5. DiscussionIn this part, the results achieved from previous section are discussed and some conclusions are drawn .It is also discussed about the reliability and validity of the results and some suggestions for future improvements have been mentioned based on the observations and results.
5.1. Conclusion from the results.
By looking back to the previous section (chapter 4), it has been tried to answer the questions that was mentioned in 1.1.
Have the visitors learned any thing? If so, what they have learned? Are there any differences between these two environments? if so what are the differences?”
According to the proposition qualities in pre-test and post-test concept maps, what has been concluded is, learning might be found roughly from useful conceptions and useful examples in the post-test.
For both Digital gallery and Hands-on laboratory, learning has been achieved .This can be easily seen from the results in “Proposition qualities” which showed that the total percentage of useful concepts and useful examples have been increased from pre-test to post-test.
In “Preposition qualities” for both Digital gallery and Hands-on laboratory, not only the total percentage of useful concepts and useful examples increased but also the percentage of total misconceptions and weak conceptions have been decreased from pre-test to post-test.
The reason the misconceptions, wrong misconception, and learning gain have been applied is not only for finding the irrelevant concepts, wrong link, or only for learning achieved in the test, but also for separating and removing the concept that seems to be chosen by chance.For example, in Digital gallery analysis, if a concept in post- test seemed irrelevant to the presentation or it was in the presentation but miss-connected, it was considered as a misconception. Also for instance, if a correct concept and link was found as the repetition of pre-test in post-test, even it was mentioned in the presentation, has not considered as learning (in Ln).So they have been removed as a concept that has been chosen by chance.
45
In 4.1.2 and 4.2.2, the concepts that were more common among students’ test sheet has been categorized and presented. This part shows what has been really learnt in each area and the percentage of frequency of concepts among 442 students in Digital gallery and 99 students in Hands-on laboratory This part gets more sense when we look at the 4.1.4 and 4.2.4, which shows real concept in each category and their percentage of these concepts frequency by help of different arrow shape.
Most common concept belongs to the artifacts, which have been presented in the film and have been interacted through touchable screen of workstation in the Digital gallery. In Hands-on Laboratory, most common category belongs to Household and work.By looking at the frequency of concept in concept mapping in Digital gallery and Hands-on laboratory, we can quickly conclude that the variety of conception in the Digital gallery have been more than Hands-on laboratory.
Dormer (2004) believed that: Concept mapping can be done for these purposes: • To create ideas (brainstorming, etc.).• To design a complex structure (long texts, hypermedia, etc.); • To communicate complex ideas; • To aid learning by explicitly integrating new and old knowledge.• To enhance the capacity of the targeted concept to be understood and to assess understanding or diagnose misunderstanding.
To satisfy the last purpose, we need to present the most common misconceptions and links, which have been shown by using concept maps presenting wrong link in both Digital gallery and Hands-on. Dromer (2004) says, the evaluation procedure must assess the comprehension of that concept. Therefore, the rubric evaluation in each learning environment showed that how much student’s concept maps were successful to transfer knowledge.In both Digital gallery and Hands-on we got the same results .Majority of students map showed that the students used the concept map to facilitate a basic understanding of the information important to the topic. However, the information, which has been achieved from student test, is incomplete and contains some misconceptions but it shows knowledge transformation.
In the learning part, we have found out that how much learning has been achieved in two respects.Lo formula learning showed that the amount of general and overall learning regardless of the relevant concepts were new or not.Ln formula learning just focused on new concept considering that concepts are not repetition from pre test.The results achieved either by Ln and Lo, showed that the average learning in Hands-On was significantly more than Digital galley.
46
To ensure the results in learning gain are always true, different samples of two groups have been tested and t-test has been applied to see if this difference is real.
T-test showed that there is difference between Digital gallery and Hands-on.Eventually, Hands-on laboratory has been more effective in terms of learning.
The relation between introduction for learning theory and what has been achieved, are:Since our learning is a social activity, which is intimately associated with our connection and interaction with other human beings, our teachers, our peers, our classmates, our family as well as casual acquaintances so, for significant learning, we need to revisit ideas, rethink about what we were thinking according to what other people’s suggestions and what they inferred specially from new phenomena. Therefore, it turns out that having enough time to try out everything, play with them and use them and deduct them and also in case of confusion have an opportunity to discuss to remove the confusion or at least get an idea are essential for learning. What we can say is, communication is necessary, especially for informal learnig.We also have to mentioned that for the full understanding and getting right answer, these points are introduction, we need to be taught by a right and skilled person (instructor).
This cannot happen in 5-10 minutes that usually spent in a gallery (and certainly not in the few seconds usually spent contemplating a single museum object.) If you reflect on anything you have learned, you soon realize that it is the product of repeated exposure and thought. Even, or especially, moments of profound insight, can be traced back to longer periods of preparation.
These above definitions that also been experienced in Digital gallery and Hands on laboratory. Probably the reason that children’s' learning was more in Hands-on laboratory than Digital galley partly is because of present of casual acquaintance and discussion in Hands- on Laboratory . In addition, according to the results, the Hands-on part in both Digital gallery and Hands-on lab has shown more effective in terms of learning. For example the most effective and frequent answers have been seen in artifacts which have been showed in the film and interacted simultaneously by computer in Digital gallery.
47
5.2. Other Observations
Since 97% of students who visited the Digital gallery and Hands-on laboratory were from other grade 5 and only 3% were from other grades, it was not reliable sample for dividing them by grade (age).On the other hand, no discussable difference has been found between the small sample and the larger one.
In order to see if there is any relation between the quality of concept map and learning of students, correlation method has been used. correlation is a way to measure how associated or related two variables are.
According to the results in Appendix F. for both Digital gallery and Hands-on laboratory, there are no linear relation between learning and the concept map’s quality score. Therefore, we cannot say, for example, by increasing the concept map quality, the learning is increased or decreased or vice versa. Consequently, there is no relation between learning value and concept map’s quality. (See two charts in Appendix F).
Another observation was comparing four students’ concept maps that have done the concept map test in museum and the same concept map test in their school. This was done to see if any significant changes were found between the two concept maps of each student. No certain or reliable conclusion from comparison of two maps has been drawn. Some maps which have done in school, had some more information than the one done in the museum, some had less information.
There were no difference between the concept maps that have been done in museum and the ones that have been done in school in terms of concept map quality as well.
(Only one school sent me back their post-test result out of 12 .Only 4 students were the same students who were participated in pre and post-test results in the museum)
5.3 Reliability and validity
Experimental research includes measurements - direct or recorded observations. How to do a study that is both valid - measures what we want to measure and nothing else - and reliable - gives reproducible data - is not always easy to know. While validity cannot really be measured, there are statistical tricks to control the reliability, like randomly dividing the studied population in two groups and compare the result between the groups. By doing a study several times, with several methods, or on several separate populations were performed, and all the studies give the same result, then it even should be possible to generalize the results.
48
The validity and reliability of the results has been tested in two respects, using average of learning gain and t-test. Several different random samples have been tested and the same results have been achieved.
This means, the study has been done several times, with several methods, or on several separate populations, and all the studies have given the same result, then it even should be possible to generalize the results.
Other variations, somehow connected, is whether the structured or unstructured method of evaluation like our enquiry forms have only closed answers or open answers (which will be more difficult to categorize for statistical analysis). R&D can have the form of action research, where we ourselves are active in what is studied. Even if it is generally regarded as so hard to keep unwanted parameters under control. It is frequently advised to have a control when we will study how an activity has changed the behavior of the studied group.
What has been done is, that has been tried to record some factors that affect the visitors’ behaviours and feedbacks. The students that have been prepared by their teachers before coming to the museum for the specific evaluation, their evaluation forms gave the better results. For example, the students who were familiar with concept map and had already been prepared by teacher about the subject that they were supposed to be asked in museum, they were able to complete the form easier.
The school groups, which arrived on time, since they had time to complete the task, their number of empty evaluation forms were less.
The evaluation that has been done by help and cooperation of teacher had better results(less empty pages).
For the reliability of this method, concept mapping, which has been used for this research, we have to say, the results have been matched with a reality that, learner can be taught to create a concept map in a short time. Ruiz Primo (2000) says, “Raters do not introduce error variability into the scores; then, it can be concluded that concept maps can be reliably scored even when complex judgments such as quality of proposition are required.” Therefore, scores based on the quality proposition are reliable, since, any combination of concept for each students and also finding the most frequent concepts in students map could provide critical information about student’s knowledge about a topic.
Calculating learning gain by using the pre-scores and post-scores for each student provide a good estimate of student‘s level of performance. Finally, rubric evaluation shows how the student concept maps were successful to transfer and present knowledge.
49

5.4. Suggestions for future
In a realistic study, we try to do our observations under controlled circumstances and measure variables that can be treated with statistical methods including being able to calculate uncertainties making it possible to prove that e.g. a certain effect has been reached. An idealistic study instead permits us to move upon interesting facts since we do the study more open-minded and our observations may drift away into the unpredicted.
According to what I have observed and got some suggestions from teachers and facilitators in ROM, I tried to mention them in this part.
In Digital gallery, we have seen that some shows “Canadian Heritages” did not get more attention and interest compare with other shows like “Ancient Egypt.” what I have found and I recommend are as follows:
1- Lots of information tried to be covered in maybe 50-minute shows, not only through show but also through touch screen artifact, which made it so complicated to follow up presentation and artifacts presented in screen. Especially if some body wants to read extra information about the presented artifacts through computer simultaneously, he will be lost.
2-Simplicity is a main factor to make teaching interesting and effective, however, we should not forget that, simplicity is about subtracting the obvious, and adding the meaningful concept, which is an art.
Feldman (2002) in his paper “The Simplicity Principle in Human Concept Learning” says: “some kind of simplicity principle is an essential component of human learning. However, complexity-minimization may be carried out in any number of different “codes” or representation languages.”
Thus, making something easy to understand should not have a bad effect on quality. It has to be in such a way that helps learning. Complexity minimization should be in a way that helped to remove any ambiguity about the subject. Some times, using funny and popular examples to resemble a complex sample can be a good way to make a complex concept understandable.
3-Visitors interests and knowledge should be considered.
Some subjects have their own fan. Some subjects or design is good for some level of education and not suitable and interesting for other certain levels or groups.
50

Therefore, I think, not only we have to consider this issue but also we have to inform learner (audience) that, for instance, this program is designed for specifically this age, grade...Etc.
Here, it might be said that, the number of visitors will be decreased. Therefore, a comprehensive and attractive design is required in a way that can satisfy majority of visitors. Again, it is not easy and it requires designing a proper plan with a good supervision.
I think “try and error” method is not always a good choice for improving a plan; it is going to waste a lot of money and time, everything has to be adjusted and set before start.
Front-end evaluation, ask visitors suggestions and executors and managers ideas can help a lot before starting any program.
51
6. References
Bosch, N. (2007). A Different Place: Using Rubrics to Guide Evaluation Rubric Examples http://www.adifferentplace.org/rubrics.htm.
Champagne, A., Gunstone, R., and Klopfer, L. (1985).Effecting changes in cognitive structures among physics students. Cognitive structure and conceptual Change. Orlando, FL, Academic Press.
Carey, S. (1985). Conceptual change in childhood, Cambridge, MA, MIT Press.http://books.google.ca/books?id=QZrB3YVGzMMC&pg=PA405&ots=qBI0gShRkL&dq=Carey,+S.+(1985).+Conceptual+change+in+childhood,+Cambridge&sig=DqV3xN1tz5KGNErM2jorXDLNtfY#PPA375,M1.
Driver, R, Asoko, H., Leach, J., Mortimer, E., and Scott, P. (1994) .Constructing scientific knowledge in the classroom, Educational Researcher.
Dormer, S. (2004). Concept Mapping. Australian Capital Territory. http://www.det.act.gov.au/department/pdf/elt_5.0_Programming.pdf.
Feldman, J. (2002).The Simplicity Principle in Human Concept Learning. Dept. of Psychology, Center for Cognitive Science. Rutgers University. New Brunswick. Piscataway, NJ.http://wexler.free.fr/library/files/feldman%20(0)%20the%20simplicity%20principle%20in%20human%20concept%20learning.pdf.
Fischer, H. (2002). Concept mapping as a tool for research in science education. Free University of Berlin, Germany.
Guzzetti, B.J, Snyder, T.E., Glass, G.V., and Gamas, W.S. (1993). Promoting conceptual change in science: a comparative meta-analysis of instructional interventions from reading education and science education, Reading Research Quarterly. 28, p.116-159.
Hein G. E. (1991). Constructivist Learning Theory, the Museum, and the Needs ofPeople, CECA (International Committee of Museum Educators) Conference, JerusalemIsrael, 15-22 October 1991.
Hein, G. E. (1998). Learning in the Museum. Great Britain Rutledge.
52
Hynd, C. (1998). Conceptual change in a high school physics class.Mahwah: NJ, Lawrence Earlbaum Associates.http://books.google.com/books?id=377aMzRBTekC&pg=PA27&lpg=PA27&dq=hynd+c+1998+conceptual+change+in+a+high+school+physics+class&source=web&ots=WmameyJOV3&sig=JJsSpIaRURKlxV79-bNouqXE4Uo
Mason, L. (2002) .Developing epistemological thinking to foster conceptual changes in different domain, Dordrecht, NL, Kluwer Academic Publishers.
Mayer, R.E. (2002).Understanding conceptual change: a commentary. Dordrecht, NL, Kluwer Academic Publishers.
McDaniel, C. N., Bradford C. L., Hanna, M.H, and Roy, H. (2004).a Lecture-Based and a Web-Enhanced, Interactive Introductory Biology Course. Department of Biology.Rensselaer Polytechnic Institute. Troy: NY.
http://bioliteracy.net/Readings/papersSubmittedPDF/McDaniel%20et%20al.pdf.
Newsom, J. T. (2006). Between Groups t-test. Institute on Aging. School of Community health. Portland State University.http://www.upa.pdx.edu/IOA/newsom/default.htm.
Rebich S, Gautier C. (2005) Concept Mapping to Reveal Prior Knowledge and Conceptual Change in a Mock Summit Course on Global Climate Change, Journal of Geosciences Education, v. 53, n. 4, September, 2005,
Ruiz Primo, M.A. (2000).On the Use of Concept Maps as an Assessment Tool in Science: What we have learned so Far, Vol. 2, No. 1.School of Education Stanford University: Stanford, California, USA.
Salmi, H. (2005).Open Learning Environments: Combining Web-based Virtual and Hands-on Science Center learning, Heureka, The Finish Science centre, Finland and University of Dalarna,327-346.In Book “E-learning and virtual science centers”, ed. by Tan, L. & Subramaniam, R. Hershey, Idea Group -Information Science Publishing.
53
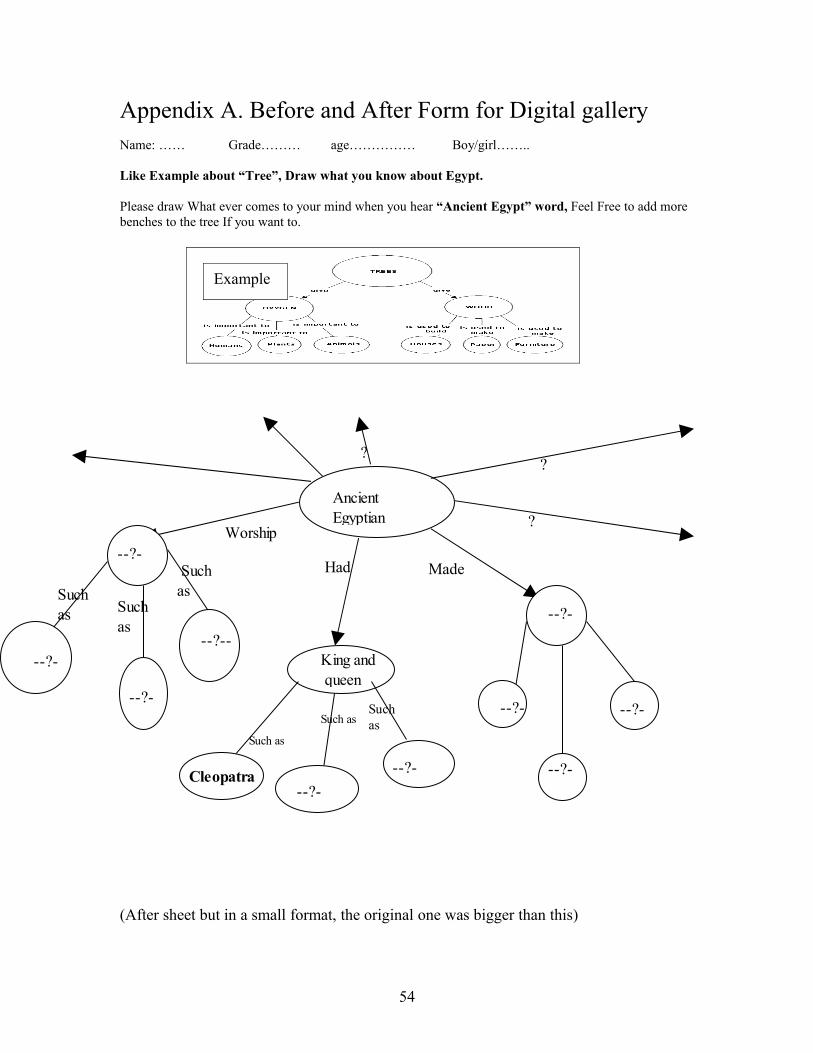
Appendix A. Before and After Form for Digital galleryName: …… Grade……… age…………… Boy/girl……..
Like Example about “Tree”, Draw what you know about Egypt.
Please draw What ever comes to your mind when you hear “Ancient Egypt” word, Feel Free to add more benches to the tree If you want to.
(After sheet but in a small format, the original one was bigger than this)
54
Ancient Egyptian
Worship
Such as
--?--
--?--
Such as
--?--
--?--
Such as
Had
Such as
Cleopatra--?--
--?--
--?--
--?--
--?--
Such asSuch as
--?--
Made
?
King and queen
? ?
Example
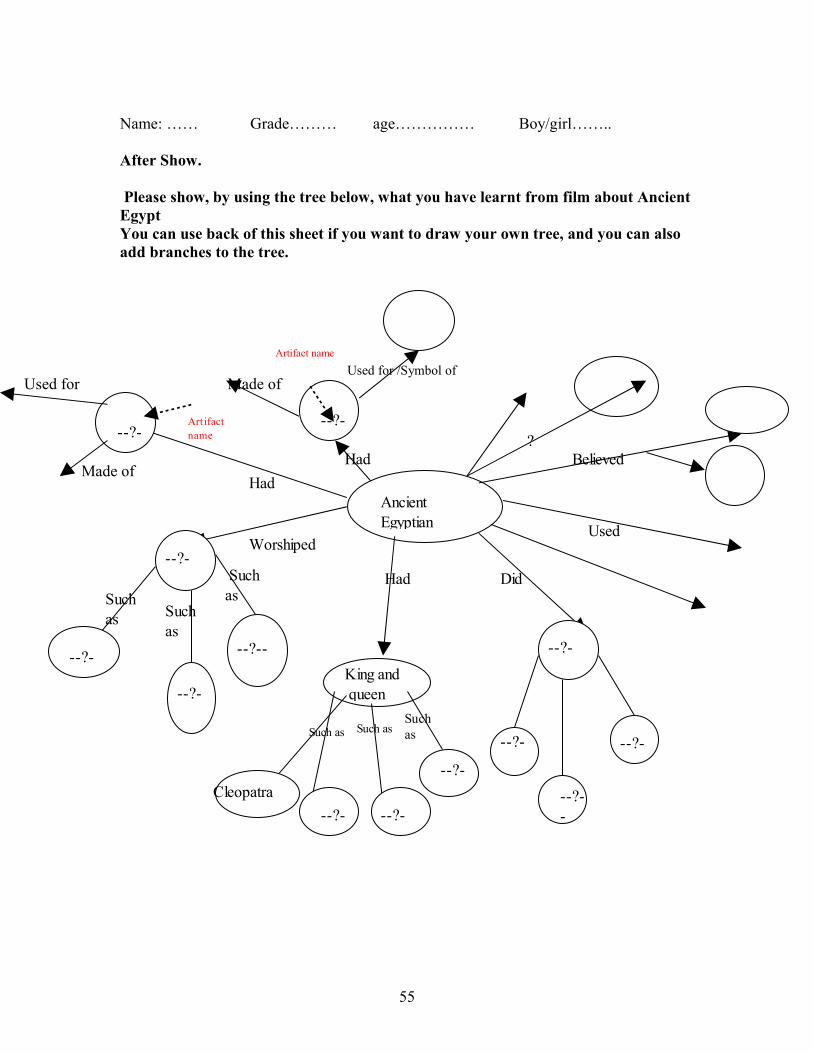
Artifact name
Used for /Symbol ofUsed for Made of
Name: …… Grade……… age…………… Boy/girl……..
After Show.
Please show, by using the tree below, what you have learnt from film about Ancient EgyptYou can use back of this sheet if you want to draw your own tree, and you can also add branches to the tree.
55
Ancient Egyptian
Worshiped
Such as
--?--
--?--
Such as
--?--
--?--
Such as
Had
Such as
--?--
--?--
--?--
--?--
--?--
Such asSuch as --?-
-
Used
King and queen
Believed ?
Did
Cleopatra
--?--
HadMade of
--?--
Had
--?--
Artifact name
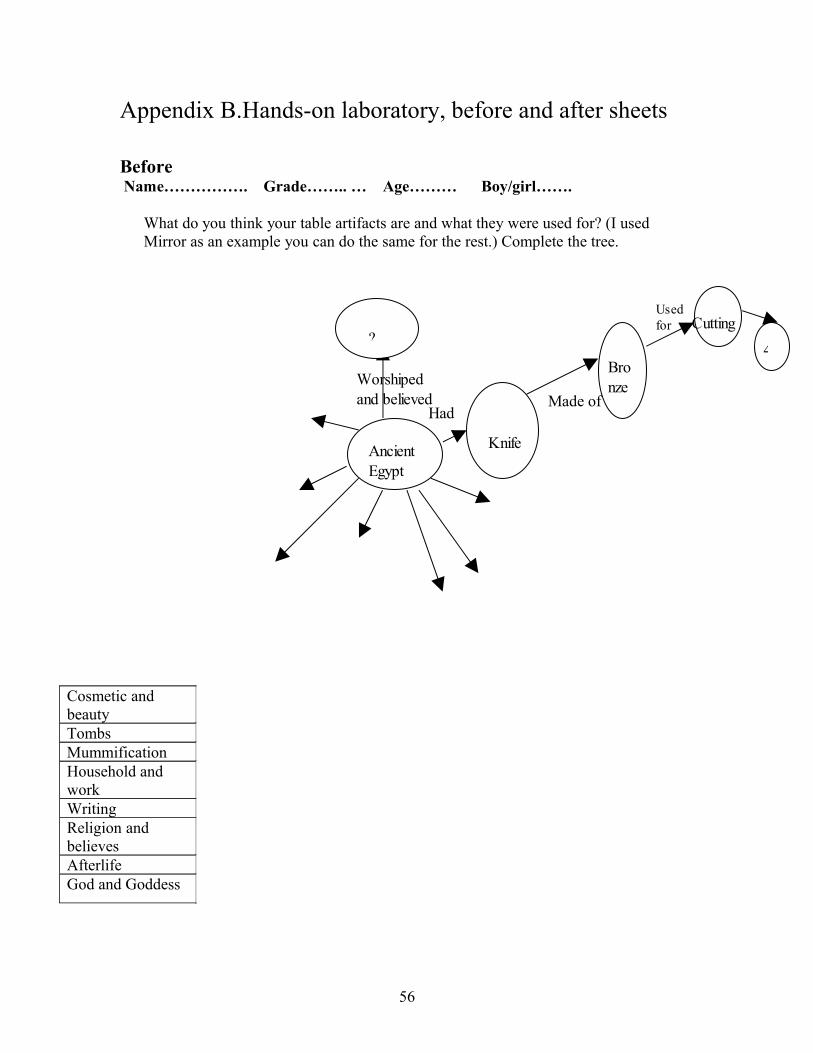
Appendix B.Hands-on laboratory, before and after sheets
Before Name……………. Grade…….. … Age……… Boy/girl…….
What do you think your table artifacts are and what they were used for? (I used Mirror as an example you can do the same for the rest.) Complete the tree.
Ancient Egypt
HadMade of
Used for
Worshiped and believed
?
Knife
Bronze
Cutting
4
56
Cosmetic and beautyTombsMummificationHousehold and workWritingReligion and believesAfterlifeGod and Goddess
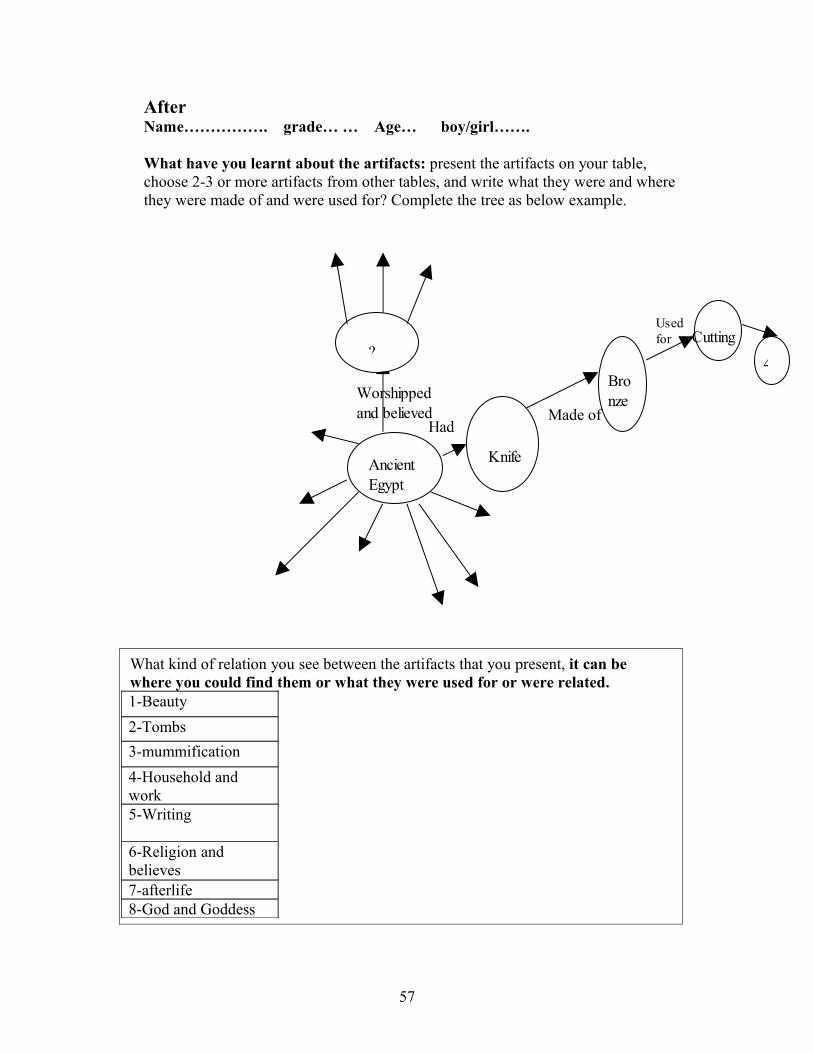
AfterName……………. grade… … Age… boy/girl…….
What have you learnt about the artifacts: present the artifacts on your table, choose 2-3 or more artifacts from other tables, and write what they were and where they were made of and were used for? Complete the tree as below example.
Ancient Egypt
HadMade of
Used for
Worshipped and believed
?
Knife
Bronze
Cutting
4
57
What kind of relation you see between the artifacts that you present, it can be where you could find them or what they were used for or were related.1-Beauty2-Tombs3-mummification4-Household and work5-Writing
6-Religion and believes7-afterlife8-God and Goddess
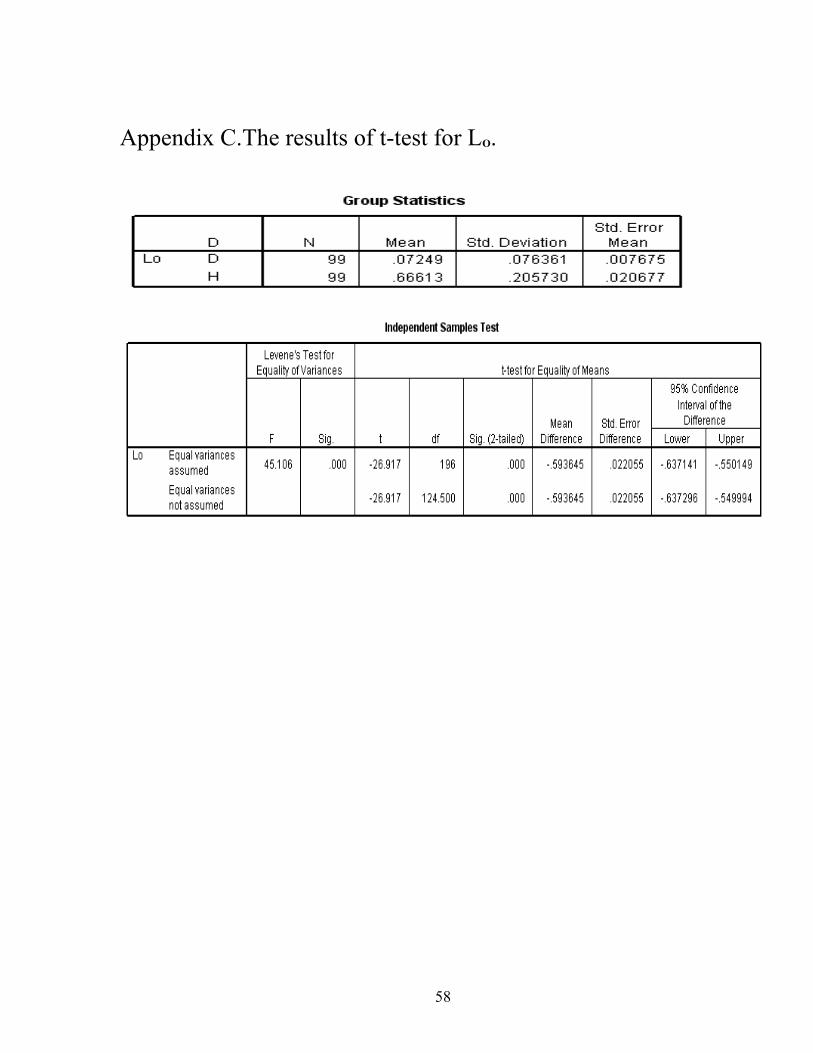
Appendix C.The results of t-test for LO.
58
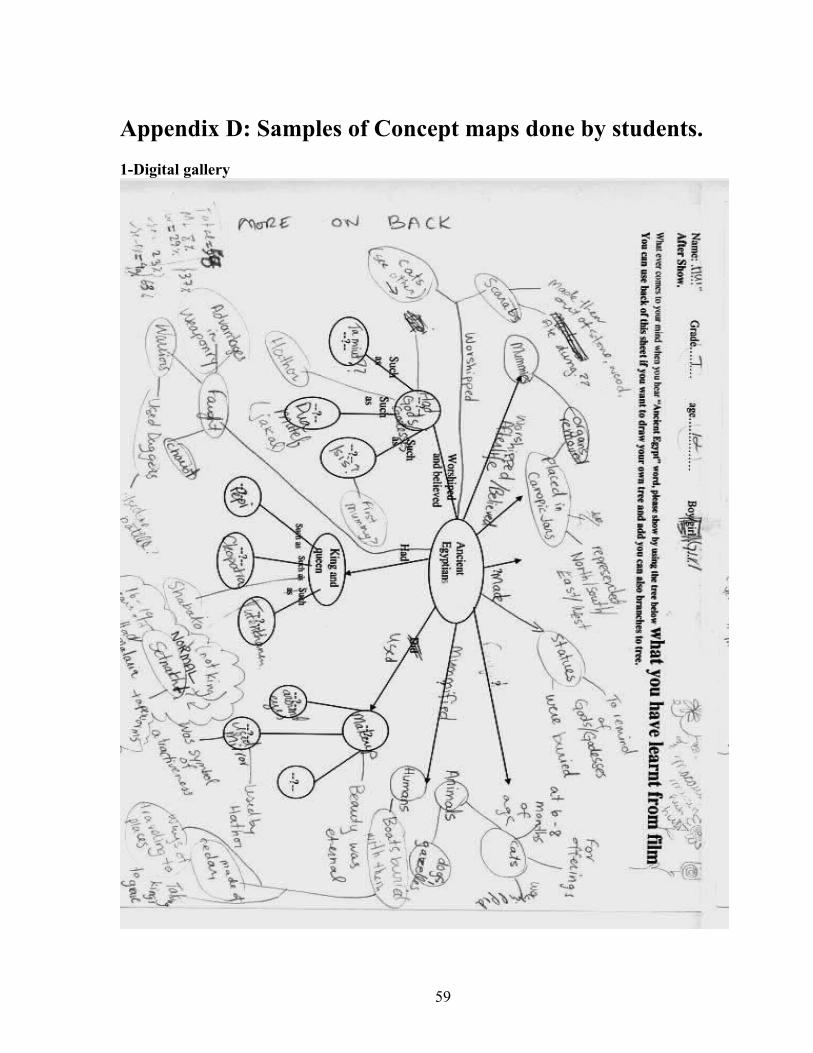
Appendix D: Samples of Concept maps done by students.1-Digital gallery
59
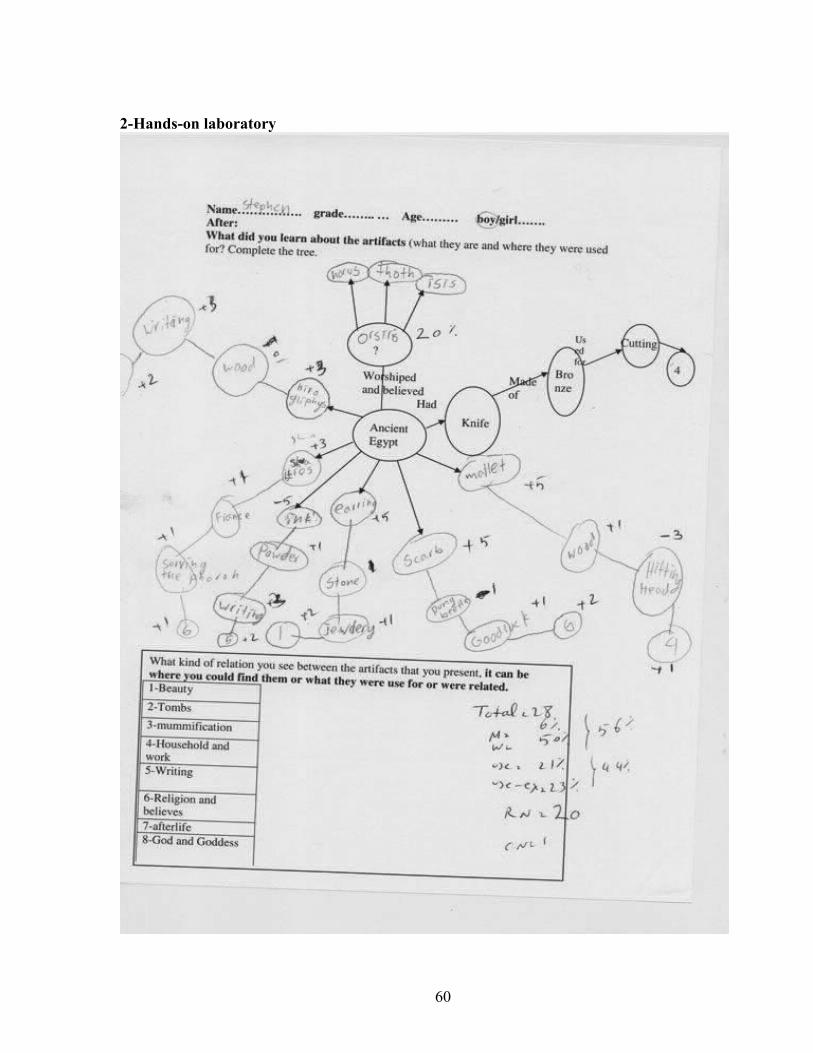
2-Hands-on laboratory
60

Appendix E. Plot boxes of learning Ln, Lo respectively.
1- It shows the distribution of learning in Ln (left) and Lo (right) in Digital gallery.
2-It shows the distribution of learning in Ln (left) and Lo (right) in Hands-on.
61

Appendix F. Correlation between learning and concept map quality in Digital gallery and Hands-on laboratory.
1-Digital gallery
Correlation(Digital gallry)
-2
-1.5
-1
-0.5
0
0.5
1
0 1 2 3 4 5
concept quality
Learning
2-Hands-on laboratory
correlation(Hands on)
-0.2
0
0.2
0.4
0.6
0.8
1
1.2
0 1 2 3 4
concept quality
learning
62

Appendix G: Digital gallery and Hands-on laboratory images.
1-These two blow pictures show Digital galley environment.
63
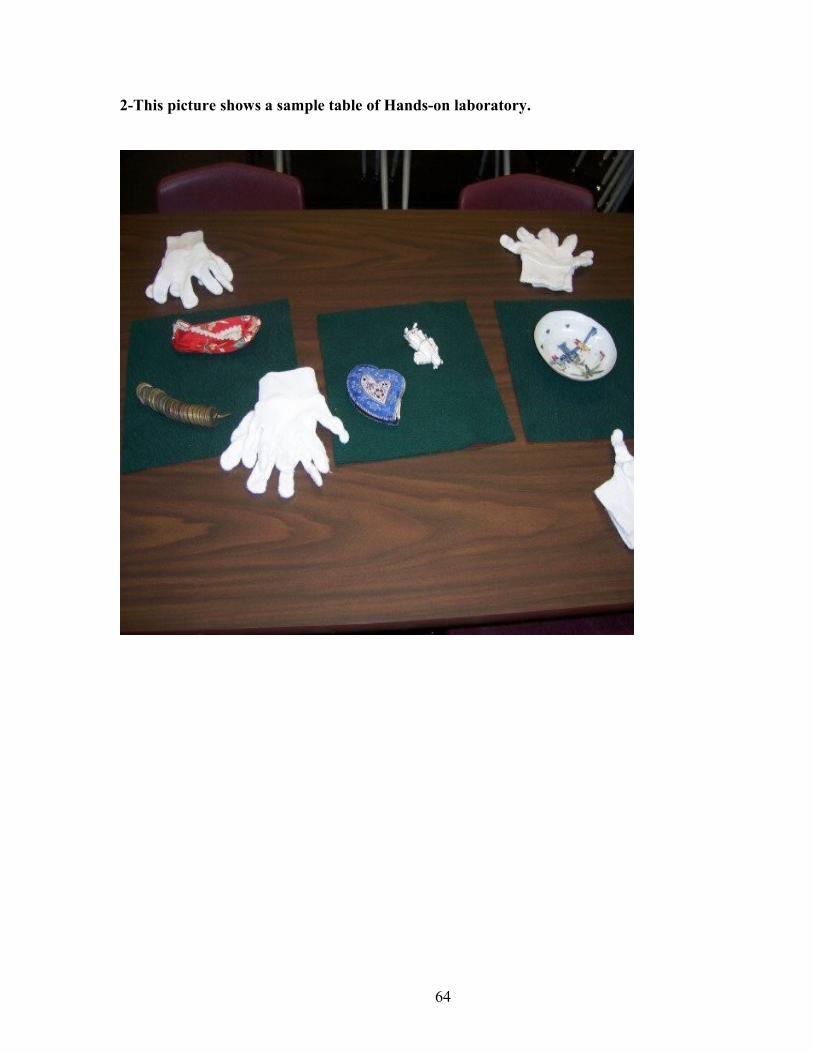
2-This picture shows a sample table of Hands-on laboratory.
64