Embed Size (px)
Citation preview
Contraction and Convergence
Using the Economic Downturn to Move Towards a More Equal Society
Molly Scott Cato, Cardiff School of Management, UWIC, Cardiff
Reviews of the UK Labour governments between 1997 and 2010 indicate that their policies to
tackle inequality have been ineffective. This paper examines some structural causes of
inequality and explains how it has been exacerbated by the fiscal crisis. It proposes a framing
of this debate in terms of a convergence of incomes during the Recession to match the
divergence that occurred during the boom and suggests policies to effect such a convergence.
Keywords: inequality, fiscal crisis, public spending.
JEL codes: G01 - Financial Crises; H27 - Other Sources of Revenue; H63 - Debt; Debt
Management
1. Introduction
The massive public investment made by the UK government to prevent the collapse of the
financial system in the UK has been the subject of much comment, and its consequences in
terms of public-spending cuts are only now beginning to emerge. What is already clear is that,
in spite of a stated commitment to tackle poverty, the New Labour government actually
presided over a widening of the gap between the richest and poorest in UK society. To some
extent, this growing inequality can be seen as the obverse of the banking bailout, since the
inflation of monetary value without economic activity to support it led to large increases in
the salaries of those at the upper end of the income scale, as well as creating the instability
which eventually led to financial collapse (Cato, 2009; Pettifor, 2006). Given the emphasis on
work as the solution to poverty in Labour rhetoric and policy-making (Driver, 2008), an
emphasis which is unlikely to be reversed by new coalition government that has been in
power since the election of May 2010, the recession—and inevitable increase in
unemployment and under-employment and pressure on wages rises it will bring with it—can
be expected to undermine yet further attempts to reduce inequality.
This paper explores a number of reasons why the fundamentals of the working of the
UK economy are collusive in an unequal distribution of both income and assets. It suggests
that, during the years of economic expansion, this policy was accepted, but that the reduction
in national income that is likely to result from tighter fiscal policies, combined with the
planetary limitation that sustainability requires, will radically change this picture. I argue that,
just as the expansion of the economy saw a widening of the distance between those at the top
and those at the bottom of the income distribution, so the shrinkage in the size of our
economy could achieve some benefit if it were to be combined with a convergence between
the incomes of rich and poor. Towards the end of the paper I suggest some policies that might
effect this convergence.
The paper begins with a short introduction to Labour’s record on inequality, and its
social consequences. Section 3 deals with fiscal issues and discusses how income and asset
inequality are related, and why the focus on addressing inequality through taxation and
income support might be less efficient that a direct focus on asset inequality. Section 4
outlines how the funding of public spending through a national debt exacerbates the
inequality potential of policies that focus on income rather than assets as means of income
redistribution. In Section 5 I suggest the use of an intellectual concept of ‘contraction and
convergence’ which might help to shift the perception of inequality policy, and I sketch out a
number of policies by which the contraction might be combined with a convergence, thus
ensuring we move towards an economy that is generating less growth but higher levels of
well-being. Section 6 offers some conclusions.
2. Inequality under New Labour and Its Social Consequences
In his analysis of the anti-poverty policies of the Labour governments from 1997 onwards,
Driver (2008: 165), is clear about the limited nature of their success:
Trends in income inequality under Labour can be compared with the Conservative years
using the Gini coefficient. During the 1980s, as we saw earlier, the Gini coefficient rose from
0.25 to 0.34. A further peak was reached of 0.35 under Labour in 2000-01. It then fell slightly
during Labour’s second term, only to start back up as Labour entered its third term. Overall,
income inequality in Britain appears to have remained much the same across most measures
after 10 years of Labour in government.
The overall picture is one where the better-off amongst the poor—and particularly those who
are in work—have seen their relative position improve, but this has been bought at the cost of
the poorest of the poor. In addition, because of unrestrained salary growth at the top end of
the distribution, overall inequality rates barely changed.
The last three years of the Labour government saw significant increases in inequality,
which by 2009 had reached its highest level since comparable data were first collected in
1961. Incomes ceased to grow in all groups except the very highest and during the past
decade incomes have grown fastest in the highest-income group and slowest in the lowest-
income group (Brewer et al., 2009). Table 1 indicates the shifts in income during the period
of New Labour government. The initial improvement in the position of the poorest, which
was largely a result of active labour-market policies and particularly the introduction of the
Working Families Tax Credit was reversed in the third term, raising questions about the
efficacy of that policy (Godwin and Lawson, 2009). Figure 1 illustrates the rise in inequality
measured by the Gini coefficient1.

Table 1. Real income growth by quintile group under New Labour, 1996-2009
Government Quintile
Poorest II III IV Richest Mean
Labour I (1996–97 to 2000–01) 2.4 2.7 2.4 2.5 2.7 3.1
Labour II (2000–01 to 2004–05) 2.6 2.5 2.0 1.6 1.4 1.7
Labour III (2004–05 to 2007–08) –0.9 0.2 0.5 0.6 1.2 1.1
Whole Labour period (1997-08) 1.6 2.0 1.7 1.6 1.8 2.0
Figure 1. The Gini coefficient, 1979 to 2007–08 (GB)
Note: The Gini coefficient has been calculated using incomes before housing costs have been deducted.
Source: Calculations by Alastair Muriel of ONS using Family Expenditure Survey and Family Resources Survey, various years.
This inequality has damaging psychological and physiological consequences. There is
understandable anxiety in the medical community surrounding the statistical evidence that
those in professional occupations live considerably longer than those in manual occupations.
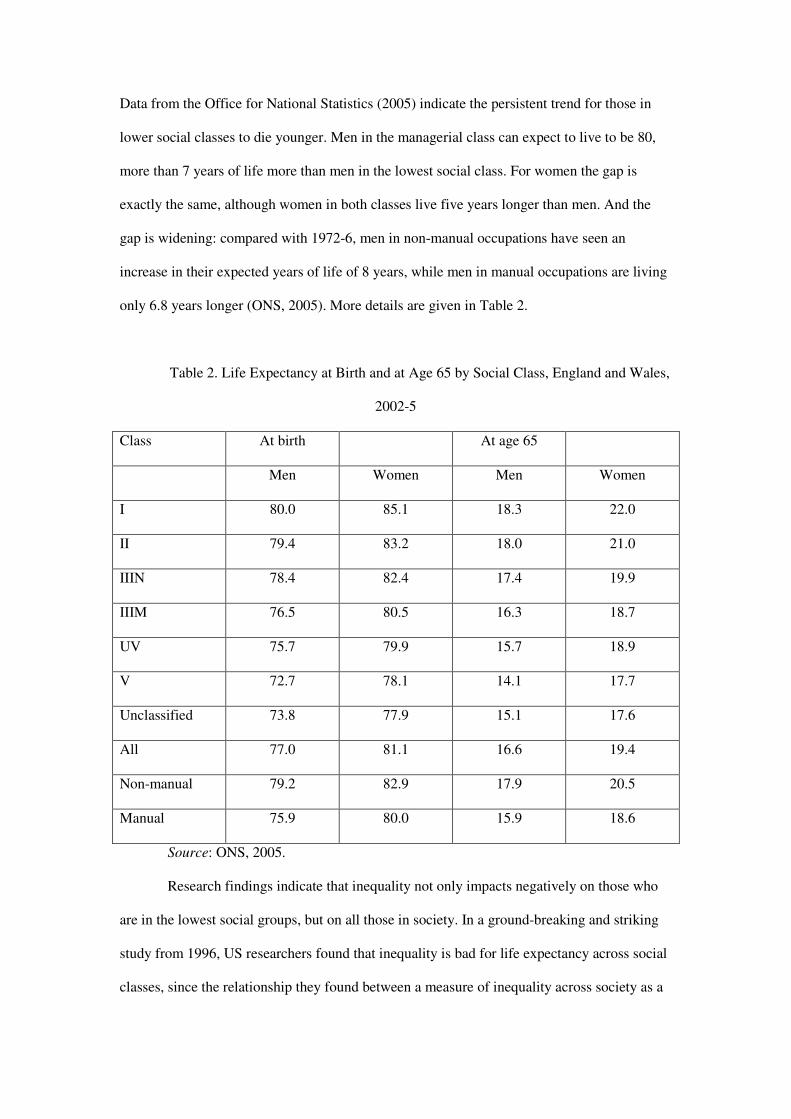
Data from the Office for National Statistics (2005) indicate the persistent trend for those in
lower social classes to die younger. Men in the managerial class can expect to live to be 80,
more than 7 years of life more than men in the lowest social class. For women the gap is
exactly the same, although women in both classes live five years longer than men. And the
gap is widening: compared with 1972-6, men in non-manual occupations have seen an
increase in their expected years of life of 8 years, while men in manual occupations are living
only 6.8 years longer (ONS, 2005). More details are given in Table 2.
Table 2. Life Expectancy at Birth and at Age 65 by Social Class, England and Wales,
2002-5
Class At birth At age 65
Men Women Men Women
I 80.0 85.1 18.3 22.0
II 79.4 83.2 18.0 21.0
IIIN 78.4 82.4 17.4 19.9
IIIM 76.5 80.5 16.3 18.7
UV 75.7 79.9 15.7 18.9
V 72.7 78.1 14.1 17.7
Unclassified 73.8 77.9 15.1 17.6
All 77.0 81.1 16.6 19.4
Non-manual 79.2 82.9 17.9 20.5
Manual 75.9 80.0 15.9 18.6
Source: ONS, 2005.
Research findings indicate that inequality not only impacts negatively on those who
are in the lowest social groups, but on all those in society. In a ground-breaking and striking
study from 1996, US researchers found that inequality is bad for life expectancy across social
classes, since the relationship they found between a measure of inequality across society as a
whole (measured by the Gini coefficient) and the life expectancy of that society remained
after they had controlled for poverty. They called this finding the Robin Hood Index, in
recognition of our national redistribution myth. The authors conclude:
The paper suggests that that there is a relation between income distribution and life
expectancy. It concluded that variations between states in the inequality of income were
associated with increased mortality from several causes. Relative poverty, i.e. the size of the
gap between the wealthy and less well off, seems to matter in its own right: the greater the
gap between the rich and poor, the lower the average life expectancy. This association is
independent of that between absolute income and life expectancy. Therefore it matters, not
only how affluent a country is, but also how economic gains are distributed among its
members (Kennedy, et al., 1996).
In an unequal society it is not just life expectancy that suffers, but a whole range of factors
from obesity to premature motherhood and the probability of being attacked or going to gaol.
All relate to a person’s status in the hierarchy and their level of income (Wilkinson and
Pickett, 2009).
Since Peter Mandelson’s tasteless comment during the first New Labour government
that they were ‘intensely relaxed about people getting filthy rich’ (Adams, 2008), it has been
clear that the focus of policy was on increasing the size of the national pie, rather than being
concerned with how that pie was divided up. So long as there was more for everyone, the fact
that some were increasing their share much more rapidly than others was not a policy concern.
There is now a wealth of evidence to show that, in terms of the well-being of citizens, this is a
misguided policy. Inequality matters: it undermines the level of trust between citizens,
increases rates of crime and ill-health, and makes people unhappier.
However, this policy is also misguided for a more fundamental reason. The
environmental crisis means that we are reaching, or have already reached, the limit to the size
of the national pie. The closing of the planetary frontier increases the salience of political
concerns about the distribution of resources. Hence a sustainable economy will need to be an
inherently equal economy:
Henry Wallich, a former governor of the Federal Reserve and professor of economics at Yale,
said: “Growth is a substitute for equality of income. So long as there is growth there is hope,
and that makes large income differentials tolerable.” But this relation holds both ways round.
It is not simply that growth is a substitute for equality, it is that greater equality makes growth
much less necessary. It is a precondition for a steady-state economy. (Wilkinson and Pickett,
2009: 221-2).
So inequality matters because it is destructive of solidarity within society, because it blights
lives and causes early deaths, and because it is a central explanation of the pressure on the
planet that has resulted in an environmental crisis. The end of the period of boom and the new
economic reality of contraction, recession or a period of slow growth adds to the salience of
this concern: during the years of expansion it has been possible to sideline debate about the
division of the national wealth, leading to a divergence in levels of income. The contraction of
the economy that is already taking place, and is likely to continue and even increase in
intensity as public-spending cuts reduce aggregate demand, will re-energise debate about the
way in which our national wealth is shared, and is likely to lead to an intensification of the
struggle over national output.
3. Not Earning But Owning
In the UK it is assumed that the origin of money to be spent on services we all benefit from
should be individual taxation, and individual taxation of earnings. A full 46.6% of
government revenue comes from this source (direct income tax and National Insurance
contributions), with another 15% coming from VAT (Adam and Browne, 2009; further details
are given in Table 3). Corporation tax provides only 8% and of the other sources, fuel duty is
the largest component contributing 4.6%. This emphasis on taxing individuals from their
incomes exacerbates inequality, especially with a tax system whose top rate of tax is only
40%, which creates much higher marginal tax rates for the poor than for the rich (Kay and
King, 1990). A combination of low wages and high marginal tax rates contributes to a
situation where, even with the hugely expensive system of tax credits in place (Godwin and
Lawson, 2009), half of children living in poverty actually live in households where there is an
adult in work (Driver, 2008).
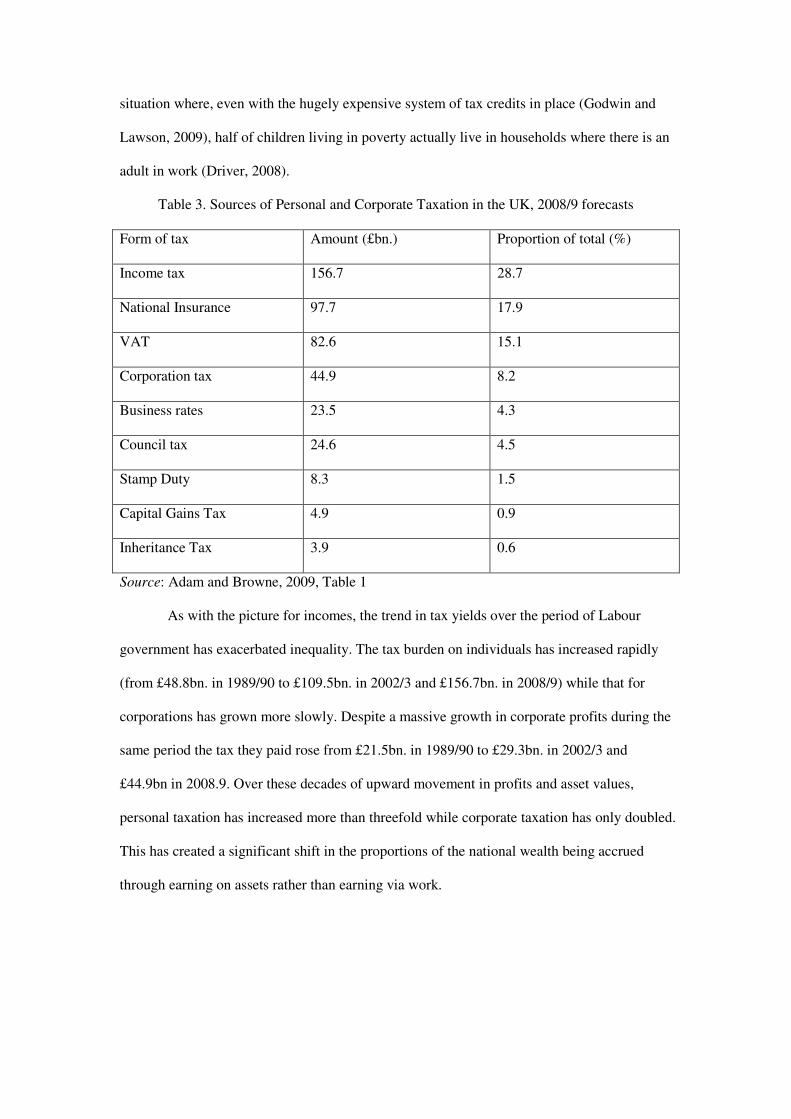
Table 3. Sources of Personal and Corporate Taxation in the UK, 2008/9 forecasts
Form of tax Amount (£bn.) Proportion of total (%)
Income tax 156.7 28.7
National Insurance 97.7 17.9
VAT 82.6 15.1
Corporation tax 44.9 8.2
Business rates 23.5 4.3
Council tax 24.6 4.5
Stamp Duty 8.3 1.5
Capital Gains Tax 4.9 0.9
Inheritance Tax 3.9 0.6
Source: Adam and Browne, 2009, Table 1
As with the picture for incomes, the trend in tax yields over the period of Labour
government has exacerbated inequality. The tax burden on individuals has increased rapidly
(from £48.8bn. in 1989/90 to £109.5bn. in 2002/3 and £156.7bn. in 2008/9) while that for
corporations has grown more slowly. Despite a massive growth in corporate profits during the
same period the tax they paid rose from £21.5bn. in 1989/90 to £29.3bn. in 2002/3 and
£44.9bn in 2008.9. Over these decades of upward movement in profits and asset values,
personal taxation has increased more than threefold while corporate taxation has only doubled.
This has created a significant shift in the proportions of the national wealth being accrued
through earning on assets rather than earning via work.
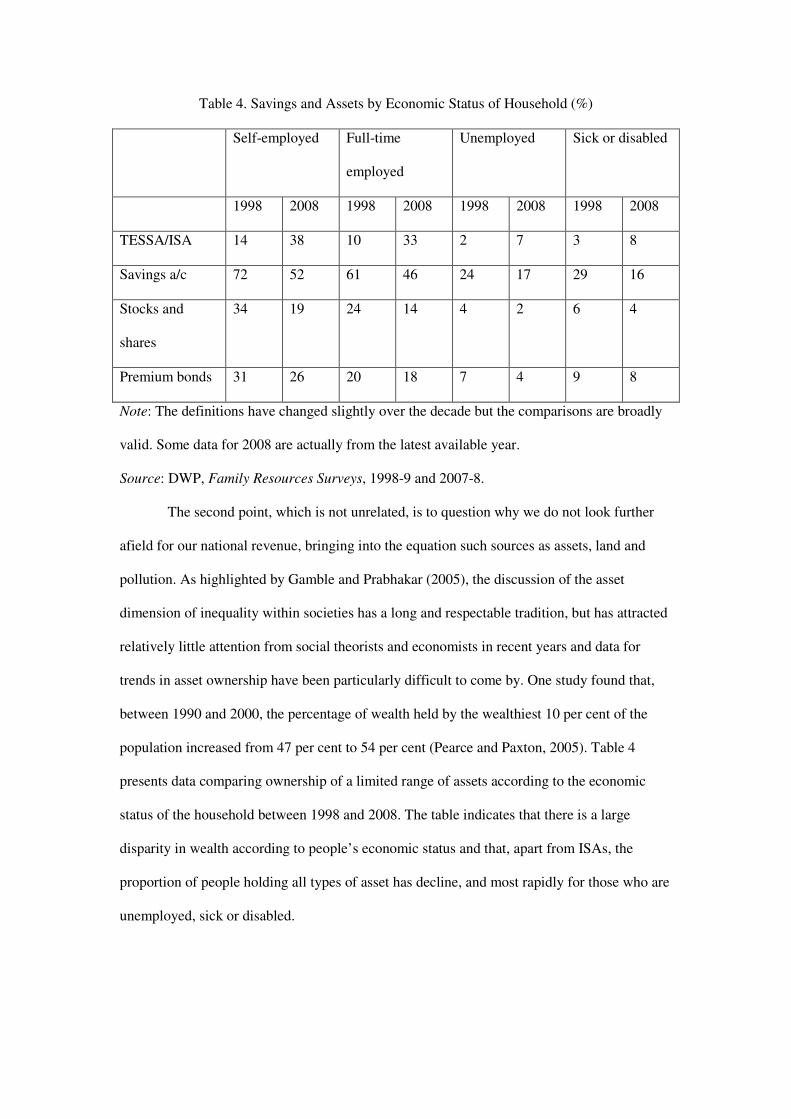
Table 4. Savings and Assets by Economic Status of Household (%)
Self-employed Full-time
employed
Unemployed Sick or disabled
1998 2008 1998 2008 1998 2008 1998 2008
TESSA/ISA 14 38 10 33 2 7 3 8
Savings a/c 72 52 61 46 24 17 29 16
Stocks and
shares
34 19 24 14 4 2 6 4
Premium bonds 31 26 20 18 7 4 9 8
Note: The definitions have changed slightly over the decade but the comparisons are broadly
valid. Some data for 2008 are actually from the latest available year.
Source: DWP, Family Resources Surveys, 1998-9 and 2007-8.
The second point, which is not unrelated, is to question why we do not look further
afield for our national revenue, bringing into the equation such sources as assets, land and
pollution. As highlighted by Gamble and Prabhakar (2005), the discussion of the asset
dimension of inequality within societies has a long and respectable tradition, but has attracted
relatively little attention from social theorists and economists in recent years and data for
trends in asset ownership have been particularly difficult to come by. One study found that,
between 1990 and 2000, the percentage of wealth held by the wealthiest 10 per cent of the
population increased from 47 per cent to 54 per cent (Pearce and Paxton, 2005). Table 4
presents data comparing ownership of a limited range of assets according to the economic
status of the household between 1998 and 2008. The table indicates that there is a large
disparity in wealth according to people’s economic status and that, apart from ISAs, the
proportion of people holding all types of asset has decline, and most rapidly for those who are
unemployed, sick or disabled.
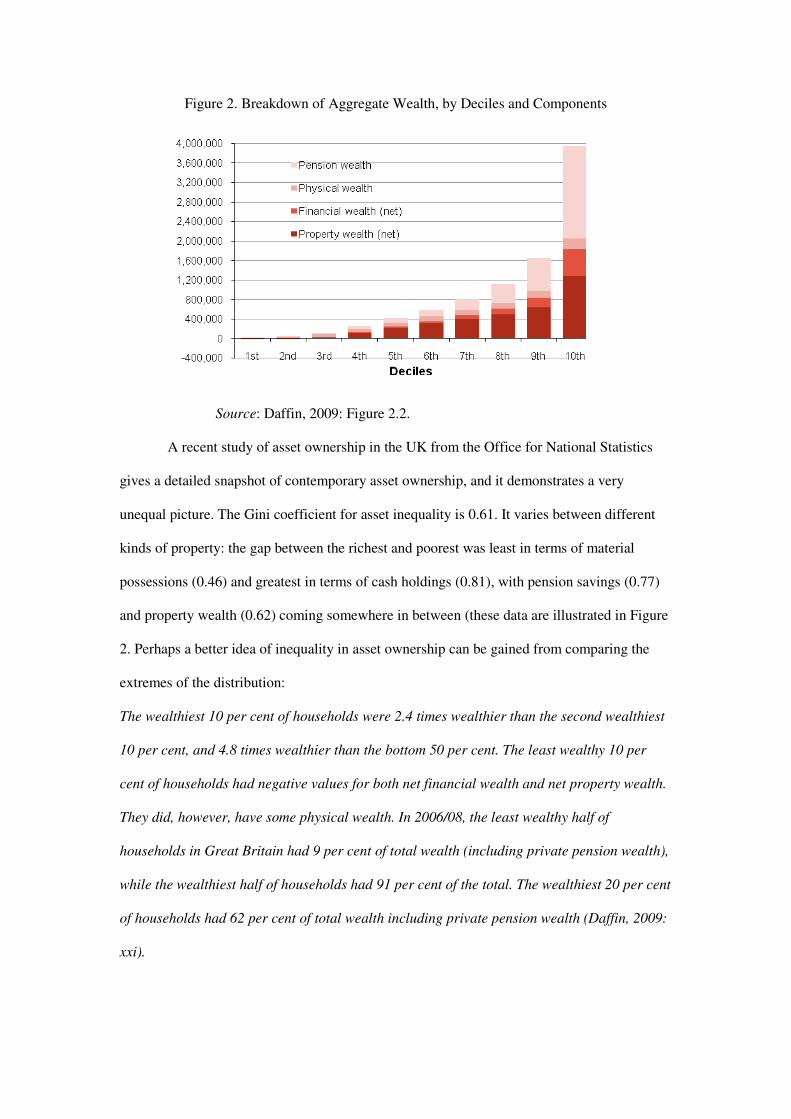
Figure 2. Breakdown of Aggregate Wealth, by Deciles and Components
Source: Daffin, 2009: Figure 2.2.
A recent study of asset ownership in the UK from the Office for National Statistics
gives a detailed snapshot of contemporary asset ownership, and it demonstrates a very
unequal picture. The Gini coefficient for asset inequality is 0.61. It varies between different
kinds of property: the gap between the richest and poorest was least in terms of material
possessions (0.46) and greatest in terms of cash holdings (0.81), with pension savings (0.77)
and property wealth (0.62) coming somewhere in between (these data are illustrated in Figure
2. Perhaps a better idea of inequality in asset ownership can be gained from comparing the
extremes of the distribution:
The wealthiest 10 per cent of households were 2.4 times wealthier than the second wealthiest
10 per cent, and 4.8 times wealthier than the bottom 50 per cent. The least wealthy 10 per
cent of households had negative values for both net financial wealth and net property wealth.
They did, however, have some physical wealth. In 2006/08, the least wealthy half of
households in Great Britain had 9 per cent of total wealth (including private pension wealth),
while the wealthiest half of households had 91 per cent of the total. The wealthiest 20 per cent
of households had 62 per cent of total wealth including private pension wealth (Daffin, 2009:
xxi).
4. The Fiscal Crisis and Inequality
In spite of the widespread concern about the extent of both deficit and debt in the UK in 2010,
its impact on the allocation of wealth in our society has not been widely considered. (The
increase in the public debt is shown in Figure 3, which covers the past ten years and for which
only the final two years represent a projection). Most commentators are unclear about the
precise workings of the government’s debt management system, and do not understand how
managing the public finances through debt has always been a subtle means of transferring the
nation’s wealth from those who work and pay taxes to those who own investments. The
government borrows money by selling gilts (government bonds, the equivalent of US
Treasuries) which are effectively bonds in the country, i.e. a promise to pay the purchaser the
sum they invested plus periodic interest payments for the life of the bond. The interest on the
bond is paid from taxation: income and the gilts are thus effectively guaranteed by the wealth
of the nation and the future productive potential of its working people.
Criticism of the national debt is a common thread in radical economics. For poor
countries national debts force them to engage with an unfair trading system to generate
enough foreign currency earnings to pay the interest (Pettifor, 2006). The national debts of
rich countries are less immediately troubling, since if your credit rating is good and your
currency well regarded, you have considerable leeway in accruing external debt. In this
setting the debts are rather a pump that operates to transfer money from the poor to the rich,
since the earnings on government bonds are paid for through taxation of those who have to
work because they do not have enough money to live by making investments, including in
bonds. Hence the national debt of the UK is making the rich richer and the poor poorer just as
the national debt of Tanzania or Peru is.
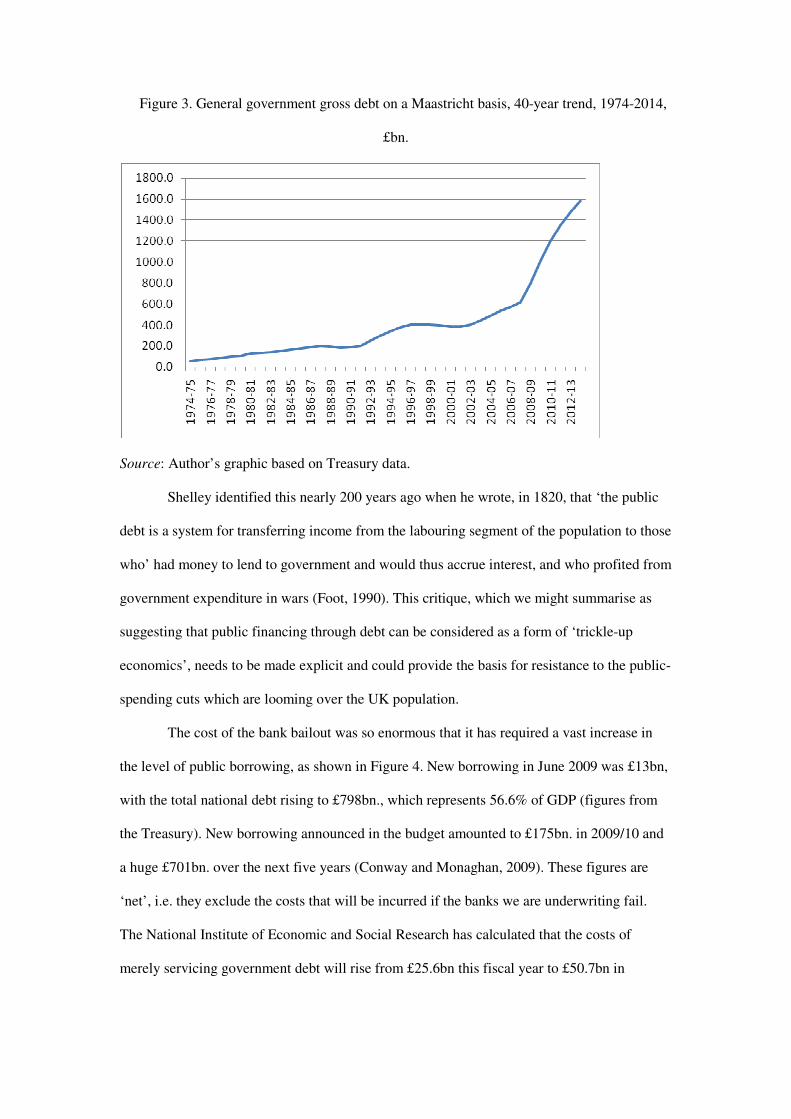
Figure 3. General government gross debt on a Maastricht basis, 40-year trend, 1974-2014,
£bn.
Source: Author’s graphic based on Treasury data.
Shelley identified this nearly 200 years ago when he wrote, in 1820, that ‘the public
debt is a system for transferring income from the labouring segment of the population to those
who’ had money to lend to government and would thus accrue interest, and who profited from
government expenditure in wars (Foot, 1990). This critique, which we might summarise as
suggesting that public financing through debt can be considered as a form of ‘trickle-up
economics’, needs to be made explicit and could provide the basis for resistance to the public-
spending cuts which are looming over the UK population.
The cost of the bank bailout was so enormous that it has required a vast increase in
the level of public borrowing, as shown in Figure 4. New borrowing in June 2009 was £13bn,
with the total national debt rising to £798bn., which represents 56.6% of GDP (figures from
the Treasury). New borrowing announced in the budget amounted to £175bn. in 2009/10 and
a huge £701bn. over the next five years (Conway and Monaghan, 2009). These figures are
‘net’, i.e. they exclude the costs that will be incurred if the banks we are underwriting fail.
The National Institute of Economic and Social Research has calculated that the costs of
merely servicing government debt will rise from £25.6bn this fiscal year to £50.7bn in
2013/14. The interest payments are slightly less than UK total spending on defence (Kirkup,
2009).
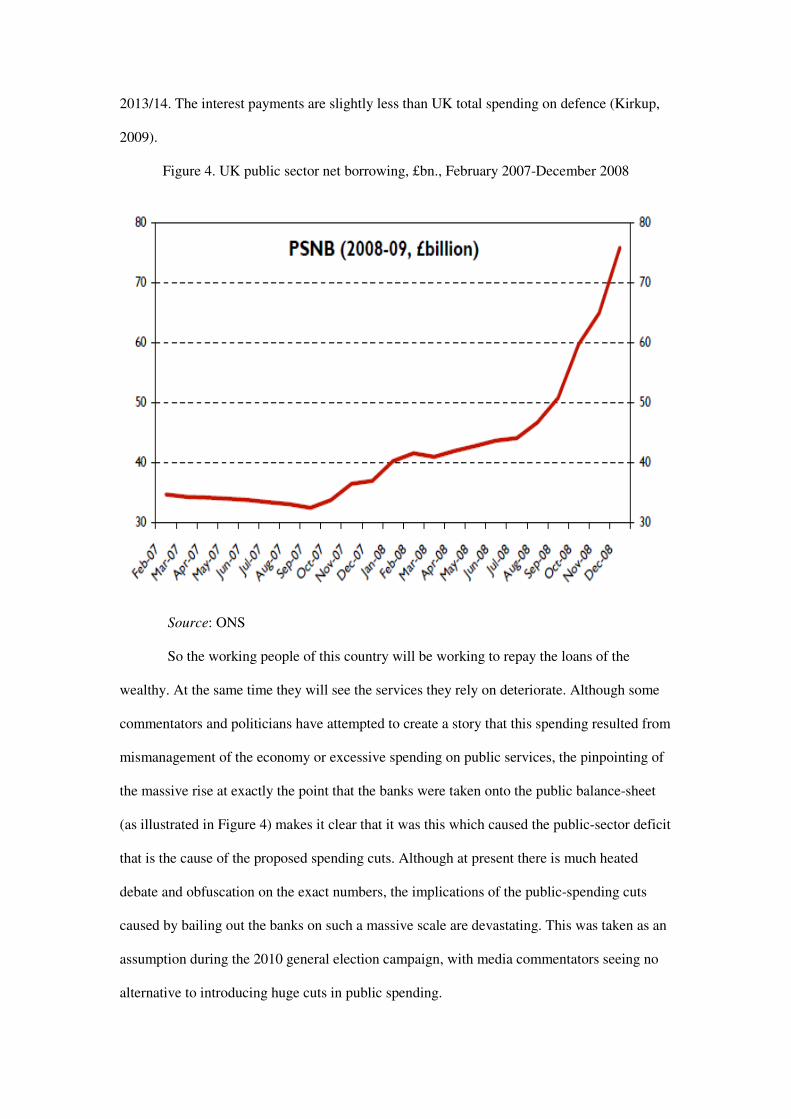
Figure 4. UK public sector net borrowing, £bn., February 2007-December 2008
Source: ONS
So the working people of this country will be working to repay the loans of the
wealthy. At the same time they will see the services they rely on deteriorate. Although some
commentators and politicians have attempted to create a story that this spending resulted from
mismanagement of the economy or excessive spending on public services, the pinpointing of
the massive rise at exactly the point that the banks were taken onto the public balance-sheet
(as illustrated in Figure 4) makes it clear that it was this which caused the public-sector deficit
that is the cause of the proposed spending cuts. Although at present there is much heated
debate and obfuscation on the exact numbers, the implications of the public-spending cuts
caused by bailing out the banks on such a massive scale are devastating. This was taken as an
assumption during the 2010 general election campaign, with media commentators seeing no
alternative to introducing huge cuts in public spending.
However, there is an alternative. The quantitative easing policy makes it clear that,
rather than creating money as debt, the government can spend it into circulation (see
Robertson and Huber, 2000). Its value could belong to the public for investment in
infrastructure and for redistribution, rather than the value of privatized money creation
belonging to banks and their shareholders (Mellor, 2010). The long-running debate about the
possibility of creating money in this way is now at an end. There is no need to create money
as debt; instead, the government can just require its bank, the Bank of England, to create a
credit in its bank account. But the money created through this policy has not been spent into
the economy as a Citizens’ Income, as in Japan, or even loaned to small businesses to prevent
the Recession from becoming a Depression. It has been used to buy back our national debt—
and thus prevent the markets from losing faith in our ability to make good on them—and to
pay off the bad debts of financial corporations.
If we only consider the social consequences of this sort of borrowing it is clear that it
is simply unpayable and the economic effort amongst those who work will be unsustainable.
But the environmental consequences are even more serious. Just as the closure of the
planetary frontier increases the salience of issues of distribution, so the creation of money as
debt automatically imposes pressure for more economic growth regardless of the
environmental consequences (Mellor, 2010). As indicated above, paying for national
spending through borrowing automatically requires an increase in the economic activity of the
country. A debt-based economic policy creates an in-built pressure on the planet and its
resources. When the government creates money through issuing bonds it creates a parallel
future demand for goods and services—goods and services which can only be produced using
energy and resources. So the system of paying for future consumption by public debt, just like
the system of creating money as private debt, is a central cause of exponential economic
growth and the environmental destruction it brings with it. Building up an ecological debt that
is far more serious than a mere balance-sheet for, as the climate camp banner have it, ‘The
planet doesn’t do bailouts’.
5. Looking Further Afield for Policy Solutions
The ‘contraction and convergence’ referred to in the title to this paper is a policy suggestion
to tackle the problem of climate change.2 Beginning from an assumption of global equality, it
suggests that the world’s nations should commit to a cap on total emissions established by the
latest scientific consensus (the contraction) and then converge their economies to reach this
over the next 20 years. The implicit assumption of the scheme is that the threat of climate
change results as much from inequality as it does from over-expansion, and we might draw an
analogy with the inequality within our own society. As demonstrated in Figure 1, the growing
economy over the past 40 years in the UK has led to an increasing divergence between the
incomes of those at the extremes of the distribution; the shrinkage in our economy which we
are undergoing could similarly be matched by a convergence in incomes. What policies might
we suggest to achieve such a convergence?
In terms of specific policies, the first area that I suggest we look at—and a promising
target for any government concerned to close the public-spending gap—would be the taxation
of assets rather than incomes. The case for a land value tax has been attracting increasing
attention as other sources of taxation revenue are squeezed (see e.g. Tax Justice Focus, 2010).
It would be, as identified by McLean (2005), ‘a tax on land value, or more strictly on the
economic rent deriving from land value’. Because of its targeting on rent, it is popular with
some libertarian economists, who identify rent as the key source of inefficiency in an
economy (Brittan, 2001). However, it can also help to achieve many welfare objectives,
which can help to explain why Andy Burnham, former Health Secretary and one of the
contenders in the Labour leadership contest, has proposed such a form of taxation in his
manifesto, bringing the LVT to the forefront of political debate for the first time in the UK
(the policy was introduced in Ireland during 2009 as part of the coalition agreement between
the Irish Green Party and Fine Fail).
From a radical perspective, land is a common source of wealth for the inhabitants of a
nation, and should therefore be shared fairly between them. Taxing owners of land and
distributing the receipts to those who do not own would be a crucial aspect of predistribution.
The most significant appeal of a Land Value Tax is the vast receipts it could yield. In
McLean’s words (2005: 27), ‘Neither class of taxation comes anywhere near capturing the
windfall gains of which Winston Churchill spoke in 1909, nor anywhere near recouping any
of them for the public sector.’
The politics of asset taxation is unlikely to ever be more favourable than it is in 2010,
when the outcry against the earnings from assets is at its height and there is political support
for both windfall taxers on bankers’ bonues and a Tobin Tax on speculative exchange
transactions. This provides exactly the right climate for a thorough revision of Capital Gains
and Inheritance Taxes to remove the various exemptions and loopholes which those facing
higher liabilities are able to exploit The design of asset taxes to cover mobile assets which,
unlike land, can easily be shifted to more favourable regimes, would need to be carefully
considered to gain the maximum yield with minimum evasion. Any of the changes in asset
taxation suggested here would clearly need to be combined with a revision of the international
regime governing tax havens (Palan et al., 2010). In terms of inheritance tax, consideration
might be given to a recommendation from the Fabian Society in 2003 that the rate should
relate to the wealth of the inheritor rather than the inheritee:
Taxing recipients rather than donors would properly reflect the purpose of inheritance tax,
namely the taxation of unearned wealth. Taxing recipients also ensures that the tax rate is
related to the circumstances of the recipient. Levying the tax on recipients might in theory
lead to donors leaving their wealth to a larger number of people and therefore achieving a
wider and more equal distributions of wealth (Patrick and Jacobs, 2003).
The logic and fairness of this position is presently being outweighed by arguments against
Inheritance Tax by those who actually benefit from it. Since only around 5% of estates are
liable for IHT (Adam and Browne, 2009: Table 15), it is clearly a redistributive tax.
A second important step towards the necessary convergence is for a joining up of the
objectives of government policy and a holistic approach to the welfare and benefits system.
As I have done in Section 4 above, Robertson (2009) links the issue of money creation to that
of inequality, arguing for a switch to money creation as credit rather than debt, thus removing
the built-in injustice of the public-debt system of public financing explained above. Instead of
funding redistributive policies by money extracted from the economy via taxation, and
creating the need for future taxation by funding public investment from borrowed money,
money could be created directly by government both for public investment, and for funding a
Citizens’ Income scheme (Hutchinson, 2005; Murray, 2008). Elsewhere Robertson (1990) has
referred to this as ‘predistribution’ rather than redistribution. The quantitative easing policy
has shown that creating money in this way is politically possible when the need is there. In
other countries, such as Japan and Australia, money created in this way was spent into the
economic via a payment to citizens, rather than spent into the corporate finance sector, as in
the UK.
The argument for a citizens’ income or national dividend can be made on the basis of
equity, but the policy is also supported by some free-market economists on the basis that it
would free up the labour-market and, by removing the poverty trap, improve work incentives.
The new Secretary of State for Work and Pensions has produced a discussion document
which makes similar points, arguing that ‘interactions between benefits and Tax Credits make
the transition to work risky and uncertain’ (Duncan Smith, 2010: 7) and suggesting the need
for a simplified system for the sake of efficiency as well as the benefit of claimants. Many of
the features of a citizens’ income are apparent in the Universal Credit as proposed in this
command paper. The major difference is that the Citizens’ Income proposal would not
include a requirement to work. Whether this is a significant difference largely depends on the
untested assumption amongst those on the right of the political debate that many of those on
low incomes would rather live on the very meager income that is suggested under CI
proposals than work.
Finally, we might consider the introduction of a maximum wage to balance the
minimum wage. A maximum wage policy (Ramsay, 2005) could operate on a national basis
or at the level of the individual firm. A multiplier on the median income could be set, say ten
times, with a 100% tax rate being set on earnings beyond this level. Alternatively, a
maximum differential between lowest and highest incomes within firms could be used, with
those earning more than five times the lowest income again facing 100% tax rates on their
additional income. As well as bringing the significant social benefits associated with more
equal societies (Wilkinson and Pickett, 2009), such policies could also prove attractive during
an economic contraction, since they would result in shifts towards the greater sharing of work
across the labour-market, as well as higher tax yields.
6. Conclusion
For economists and social theorists alike, the imminent future for the British economy
presents a picture of unmitigated gloom. Boxed in by unprecedented levels of debt on the one
side, and the need to move rapidly towards a lower level of consumption-related CO2
emissions on the other, it is difficult to avoid the conclusion that all will suffer declines in
their standard of living, and that the vulnerable may suffer worst of all. This is in spite of
polling evidence suggesting that there was no public appetite for reductions in public
spending in the run-up to the 2010 general election (Curtice, 2010). This paper proposes an
alternative perspective by drawing attention to some of the structural mechanisms that tend to
entrench inequality. If the pain is truly to be shared, then the economic contraction should be
accompanied by a convergence in incomes. This would ensure positive outcomes in terms of
social cohesion and associated welfare gains which could outweigh the reduction in levels of
absolute income.
I began this paper by outlining how inequality is seriously damaging to our health—
individually and as a society. There is a growing head of steam for campaigns to effect greater
equality, but the focus of these campaigns tends to be on redistribution rather than
predistribution: initial ownership rights and the allocation of assets and income. Whether
through the purchase of government bonds, or the renting out of property, it is owning, not
earning, that is the source of the inequality in our society. If all assets reverted to the state on
death and were then available to be allocated to new citizens, as that well-known radical J. S.
Mill proposed, then the hard fight for redistribution would be unnecessary.
Driver’s pessimistic conclusion to his review of the poverty policies of the New
Labour governments it that they have ‘failed to resolve the fundamental inequalities of wealth
and income that are the main drivers of poverty across society’. As the data in Section 2 (and
particularly the wealth of data contained in the work by Wilkinson and Picket, 2009) above
make clear, this is a serious indictment, since it is the inequality of societies that has such
serious social consequences, not merely the absolute levels of income of the poorest. The
economic contraction, and the cuts in public spending that are only just beginning, will
challenge Labour’s modest achievements in tackling inequality in two ways: first by reducing
the number of those who can be helped by work-focused poverty-reduction policies; and
second, by increasing the pressure on the poor to contribute to the repayment of the national
debt.
Given that much of this economic pain is now inevitable, how could resistance to its
worst impacts on the poorest and most vulnerable in society be framed? I would suggest that
the idea of a contraction combined with a convergence might provide an organising concept
for the as yet somewhat inchoate sense of injustice around the continued extraction of value
by the better paid, while at the same time the less well-off are seeing their incomes reduced to
fund this.
Acknowledgements
Thanks to Alastair Muriel and Antonia Strickland of ONS.
Notes
1. The Gini coefficient compares the actual distribution of incomes in a country with a
perfectly equal distribution to create a ratio that can range between 0 and 1, where 0
represents complete equality and 1 complete inequality.
2. The Contraction & Convergence model was developed by the Global Commons Institute in
London. More information is available from their website: http://www.gci.org.uk/
References
Adam, S. and J. Browne. 2009. A survey of the UK tax system. London: Institute for Fiscal
Studies.
Adams, T. 2008. ‘The comeback kid: Peter Mandelson’, Observer, 21st Dec.
Brewer, M., A. Muriel, D. Phillips, and L. Sibieta. 2009. Poverty and inequality in Britain:
2009. London: Institute for Fiscal Studies.
Brittan, S. 2001. ‘How land taxes could pay for urban renewal’, Financial Times, 30 Aug.
Cato, M. S. 2009. A new financial architecture based on a global carbon standard. Ecopolitics,
Vol. 3: pp. 61-78; reprinted in Barry, J. and Leonard, L. (eds.), Advances in
Ecopolitics, iii.
Conway, E. and A. Monaghan. 2009. ‘UK government debt: almost 9p of each £1 in tax will
be needed to pay the interest’, Daily Telegraph online.
Curtice, J. 2010. Election 2010: a new mood on tax and spend? Policy & Politics, Vol. 38 No.
2, pp. 325-9.
Daffin, C. 2009. Wealth in Great Britain: main results from the Wealth and Assets Survey
2006/08. Richmond: OPSI.
Driver, S. 2008. Poverty, social justice and the Labour government, 1997-2007’. Benefits, Vol
16, No. 2, pp. 157-67.
Duncan Smith, I. 2010. 21st century welfare, Cm 7913. London: TSO.
Foot, P. (ed.), 1990. Shelley’s revolutionary year: Shelley’s political poems and the essay, A
Philosophical View of Reform. London: Red Words.
Gamble, A. and R. Prabhakar. 2005. ‘Assets and poverty’. Theoria, Vol. 52 No. 107, pp. 1-18.
Godwin, M. and C. Lawson. 2009. The Working Tax Credit and Child Tax Credit, 2003-08: a
critical analysis. Benefits, Vol. 17 No. 1, pp. 3-14.
Hutchinson, F. 2005. If Citizen’s Income is the answer, what is the question? European
Business Review, Vol. 17 No. 2, pp. 193-200.
Kay, J. and King, M. (1990), The British Tax System. Oxford: Oxford University Press.
Kennedy, B.P., K. Ichiro, D. and Prothrow-Stith. 1996. ‘Income distribution and mortality:
cross sectional ecological study of the Robin Hood Index in the United States. British
Medical Journal, Vol. 312, pp. 1004-1007.
Kirkup, J. 2009. ‘Britain's national debt to reach £1.4 trillion under 2009 Budget’, 22 Apr.
Maxwell, D. and A. Vigor. 2005. Time for Land Value Tax. London: ippr.
McLean, I. (2005), The politics of land tax: then and now, in Maxwell and Vigor.
Mellor, M. 2010. The Future of Money: From Financial Crisis to Public Resource. London:
Pluto.
Murray, C. 2008. ‘Guaranteed income as a replacement for the welfare state’. Basic Income
Studies Vol. 3 No. 2.
ONS (Office for National Statistics). 2005. Trends in life expectancy by social class. London:
TSO.
Palan, R., R. Murphy, and C. Chavagneux. 2010. Tax havens: how globalization really works.
Ithaca, NY: Cornell University Press.
Patrick, R. and M. Jacobs. 2003. Wealth's fair measure. London: Fabian Society.
Pearce, N. and Paxton, W. 2005. Social justice: building a fairer Britain. London: IPPR.
Pettifor, A. 2006. The Coming First World Debt Crisis. Basingstoke: Macmillan.
Ramsay, M. 2005. A modest proposal: the case for a maximum wage. Contemporary Politics,
Vol. 11 No. 4, pp. 201-16.
Robertson, J. 1990. Future wealth: a new economics for the 21st century. London: Cassell.
Robertson, J. 2009. ‘Sharing the value of common resources’, special issue of Basic Income
Studies on Basic Income, Green Politics and Post-Productivism, December.
Robertson, J. and J. Huber. 2000. Creating new money: a monetary reform for the
information age. London: New Economics Foundation.
Tax Justice Focus. 2010. Taxing natural rents, Vol. 6.
Wilkinson, R. and K. Pickett. 2009. The Spirit Level: Why Unequal Societies Almost Always
do Better. Harmondsworth: Penguin.