Embed Size (px)
Citation preview

Munich Personal RePEc Archive
Contract Intensive Money
Clague, Christopher and Keefer, Philip and Knack, Stephen
and Olson, Mancur
World Bank
January 1999
Online at https://mpra.ub.uni-muenchen.de/25717/
MPRA Paper No. 25717, posted 11 Oct 2010 02:56 UTC
CONTRACT-INTENSIVE MONEY:
Contract Enforcement, Property Rights, and Economic Performance
Christopher Clague,* Philip Keefer,
#
Stephen Knack,+ and Mancur Olson
*
October 7, 2010
The authors thank the US Agency for International Development for supporting this
research through the Center on Institutional Reform and Informal Sector (IRIS) at the
University of Maryland. They are grateful to Gary Anderson, Suzanne Gleason, Christos
Kostopoulos, Jennifer Mellor, and Ricardo Sanhueza for able research assistance, to two
anonymous referees, Brian Fikkert, John Helliwell, Robert Klitgaard, Paolo Mauro, and
Anand Swamy for valuable comments, and to Robert Barro and Holger Wolf, Ross Levine,
and Ted Haner for generously providing data. The authors are solely responsible for all
remaining errors.
*IRIS and Department of Economics, Univ. of Maryland at College Park
# Development Research Group, The World Bank
+IRIS, Univ. of Maryland

1
I. Introduction
Markets are commonplace in all types of societies, including the poorest, and they
exist even in remarkably unfavorable conditions. Herodotus, for example, describes
Phoenician merchants who traded even with distant tribes with whom they shared no
government or language. A long-standing literature on “silent trade” among those who
cannot communicate directly includes accounts of tribes that traded when at war (Grierson,
1904). Long experience with black markets in many countries confirms that markets persist
even when they are prohibited. Nevertheless, some markets that are essential for economic
development are less common and more easily repressed. These are markets in which
economic actors make exchanges requiring significant and irreversible commitments in the
present, whether in the form of goods manufactured and shipped or fixed investments made,
in the expectation of payment or a stream of returns in the future.
These markets are less likely to exist when institutions for the protection of property
rights and contract enforcement are absent. The importance of these institutions is now
widely acknowledged, and emphasized in the work of North (1990), Rosenberg and Birdzell
(1986) and others. Recent studies of growth have employed subjective indicators of
contract enforcement and the security of property rights (e.g. Knack and Keefer, 1995 and
Borner, Brunetti and Weder, 1995) to provide significant empirical support for the
proposition that the absence of these institutions is a severe impediment to growth. This
paper makes two contributions to the literature. First, it introduces a new, easily accessed
and objective measure of the enforceability of contracts and the security of property rights.
Second, it uses this measure to provide additional and more direct evidence about the
importance of secure property and contract rights for economic growth and investment. In
2
the analysis below, we briefly review the arguments that link the quality of third-party
contract enforcement to growth and investment. We then show how the new measure,
which we call “contract-intensive money” or CIM, relates to the subjective measures
employed in the literature. We test empirically the proposition that this variable, as a
measure of the security of contract and property rights, is positively related to income,
growth and investment.
II. Why does government enforcement of contracts matter?
The markets that are most likely to persist even in unfriendly environments are those
in which exchange is simultaneous and self-enforcing. These markets are common, either
because many exchanges simply meet the conditions for self-enforcement or because they
are so lucrative that the absence of self-enforcement makes even risky exchanges
worthwhile. However, many transactions require a different kind of market, one more likely
to need third-party enforcement. These are non-simultaneous transactions, in which the
quid is needed at one time or place and the quo at another. When there is lending and
borrowing, capital is lent in expectation of a later return. When a demander and a supplier
are some distance apart, one must be at risk for the value of the goods in transit. When
there is insurance, some parties must make payments now in hope of indemnification if
specified contingencies occur. In all of these cases, the gains from trade cannot be realized
unless the parties expect that the contracts they make will be carried out.
For example, we do not often see sophisticated capital markets where there is no
third-party enforcement of loan contracts or of rules protecting agreements between
shareholders and management, or between minority and majority shareholders (see La Porta
et al, 1996). Firms in societies without third-party enforcement are usually restricted to
3
capital that can be obtained through saving or family connections. Gains from either
capital-intensive or large-scale production are accordingly lost in these societies. The
absence of these exchanges hinders investment and growth. Since investment is usually
required for innovation and the purchase of new technologies as well as capital deepening,
contract enforcement also affects the rate of growth.
The contract-intensive money indicator of property rights enforcement that we
introduce below indicates the countries and periods in which non-simultaneous transactions
are more difficult to enforce. Inadequacies in government-provided third-party enforcement
are likely to be a principal reason for these difficulties.1 It is true, even in societies with the
best legal systems, most disagreements are resolved without being taken to court
(Williamson, 1983, 1985). One reason, as David Hume (also Hayek, 1948, and many others
since) noted long ago, is that a reputation for honoring commitments is valuable. Other
agreements are made self-enforcing by allowing valuables to be held hostage (as, most
simply, in a pawn shop loan). It is not even the case that third-party resolution of disputes is
solely the province of government, since arbitration and dispute settlement services are also
available in the private sector. Moreover, countries are likely to vary in their capacity to
support reputation and other self-enforcement mechanisms.2
Nevertheless, the market has clear limits in enforcing contracts. Reputation is of
more limited utility for transactions in which the actors involved deal with each other
1 The importance of third-party enforcement of contracts has long been recognized. In 1651 Thomas
Hobbes said that, in the absence of government, the party that “performs first has no assurance that the other will perform after, because the bonds of words are too weak to bridle men’s ambition, avarice, anger, and other passions without the fear of some coercive power” (1958, p 15). The distinction between self-enforcing
transactions and those that require third-party enforcement are key to the arguments in North (1990). Olson
(1992) analyzes the difficulties of the transition from communism in terms of this distinction.

4
infrequently. Neither reputation nor socially-acceptable hostages are useful when
transactions are exceptionally large or performance can only be verified over a long period
of time. Private institutions that disseminate information on contract violations are less
useful when the reasons for breach of contract cannot be conveyed; when firms that receive
the information fail to impose the appropriate punishment strategy; when firms that breach
contracts are able to mask their identities; and when the contractual arrangements that
undergird the existence of the organization that collects and disseminates information about
breaches of contract are themselves unenforceable.
Even after accounting for the effects of self-enforcement, then, the government still
has four crucial roles to play in contract enforcement and the protection of property rights.
First, it provides third-party enforcement when no self-enforcing mechanism exists.
Second, it may itself constitute the entity that communicates breaches of contract. Third, it
may enforce the arrangements that private actors use to constitute themselves as a formal
group (such as a trade association). Fourth, and most elementally, the government ensures
peace: if there is a Hobbesian anarchy, a reputation for effective violence is worth more
than one for honoring commercial contracts. But whatever authority has the power to
maintain peace also has the power to enforce or to abrogate contracts. It follows that even if
private agents could, without recourse to governments or other third parties, engage in every
profitable investment or exchange by relying on self-enforcement, they would still confront
the possibility that the government could expropriate them. Differences in the behavior of
governments therefore make for cross-country differences in property rights, contract
enforcement, and levels of productivity and growth.
2 For example, Knack and Keefer (1997) find an association between the protection of property rights and
5
III. Testing the Theory: Contract-Intensive Money
In testing our argument that secure property and contract rights are crucial for
productivity and growth, we take advantage of a fortuitous circumstance, that enforcement
problems underlying the use of different forms of money and credit mirror enforcement
problems underlying trade in goods and services in much the way a negative resembles a
print. Though the gains from issuing money ensure that it is available everywhere, the types
of money that are most widely used vary greatly from country to country. In some
countries, currency is the only money that is widely used. In others, individuals and firms
are more likely to use the types of money that are held in banks or invested in other
financial institutions or instruments. Characteristics of third-party contract enforcement in
countries are likely to explain much of the difference in firm and individual preferences
governing the choice of money to use. This, and the fact that data on both types of money
usage are regularly reported and widely available, make a monetary measure of the security
of property and contract rights an attractive one to investigate.
There are several reasons why the same governmental deficiencies that require self-
enforcement of transactions also lead economic actors to prefer currency. If contracts are
generally unreliable, there can be no assurance that the money lent to financial institutions is
safe. Moreover, when financial institutions cannot rely on third-party-enforcement of loan
contracts -- and when property rights are not clear, so that lenders do not have secure rights
to mortgaged assets in the event of borrowers' defaults -- then they cannot earn as much
with the depositors' money. This means in turn that there will be less financial
intermediation and higher charges for banking services. Finally, where governments choose
to prohibit many transactions, creating black markets in which contracts are inherently
levels of interpersonal trust in countries.
6
insecure, the discretion afforded by currency is likely to make it a favored medium of
exchange.
In societies where contract and property rights are secure and well defined, on the
other hand, even transactions that are heavily reliant on outside enforcement can be
advantageous, and currency is normally used only for small transactions. In such
environments, it is also profitable to provide extensive banking and financial intermediation
services. Individuals and firms are increasingly able to invest their currency in bank
deposits or financial instruments, and are likely to prefer these to currency for several
reasons. They are normally safer and more convenient than currency. These instruments
are also more lucrative, since interest is generally paid on such deposits, unlike currency
holdings. As is evident from the work of Townsend (1983), when more sophisticated forms
of money and trade credit are available, individuals and firms not only can trade without a
double coincidence of wants, but they are also spared much of the opportunity cost of
significant intervals between the receipt and the spending of money. A final advantage of
using monies in financial institutions is that this provides records that enhance the legal
rights of the parties and thereby reduce their risks.
Thus the extent to which societies can capture not only the gains from self-enforcing
transactions, but also those potential trades that are intensive in contract enforcement and
property rights, can be approximated by the relative use of currency in comparison with
"contract-intensive money." We define contract-intensive money (CIM) as the ratio of non-
currency money to the total money supply, or (M2-C)/M2, where M2 is a broad definition of
the money supply and C is currency held outside banks. Fortunately, there are data on the
7
quantities of both currency and M2 for almost all countries.3 Each firm and individual can
decide, after taking account of the type of governance in that society, in what form it wants
to holds its assets. Where citizens believe that there is sufficient third-party enforcement,
they are more likely to allow other parties to hold their money in exchange for some
compensation, and CIM is correspondingly higher.
The discussion suggests the following set of hypotheses.
First, if CIM is a good proxy for contractual enforcement more generally, then the higher a
country's CIM ratio, the larger the share of GDP that should be generated by industries that
are especially dependent on third-party enforcement, such as those involved with insurance
and capital markets.
Second, the higher CIM, the more gains from economies of scale and specialization a
country should reap and thus the higher its capital stock, productivity, and per capita
income.
Third, the higher CIM, the greater the ability of firms to raise capital, the higher the rate of
investment and (other things, like the opportunity for catch-up growth, equal) the faster the
rate of economic growth. However, secure individual rights to contract enforcement and to
property will help most in obtaining those gains from trade and specialization that can be
completed only over a long period of time, such as those involving long-term loans.
3 Currency comes from line 14a of International Financial Statistics, “currency outside deposit money banks.” It does not include foreign currency in circulation, since there are no reliable measures of this, although
foreign currency deposits in financial institutions, which are easily measured, are included in M2. M2 is
defined by IFS as the sum of money and quasi-money, or the sum of lines 14a (currency outside banks), 24
(demand deposits), 15 (time deposits), and 25 (time and savings deposits, including foreign currency deposits
of resident sectors other than central government). We cannot control for variations in the mix of different
types of money in M2. For example, we would expect that where the incentives to hold currency increase, so
also do incentives to substitute out of time deposits and into demand deposits. However, all components of
M2, including time and demand deposits, share the critical feature that they rely on economic actors to
surrender control over their money to third parties for some period of time.

8
Therefore, CIM should be more closely associated with the gains from trade in the capital
market than with the gains from trade in the economy as a whole, and thus better correlated
with investment than with growth.
Note that we are not suggesting that the greater use of more sophisticated, non-
currency monies causes better economic performance; we are hypothesizing instead that
better institutions, especially with respect to contract enforcement, enable a society to obtain
a wider array of (real) gains from trade, and, at the same time, facilitate the use of more
sophisticated forms of money. Thus CIM is a reflection or measure of the type of
governance that improves economic performance rather than a cause of that performance.
Before we turn to the statistical tests of our hypotheses, we examine, in Section IV,
some especially instructive country cases. Since the CIM ratio not only offers a precise test
of our theory, but also a new measure of the quality of governance and institutions, we
relate it, in Section V, to other measures of quality of governance. We then present in
Sections VI-VIII a variety of evidence that stronger economic performance is associated
with higher values of CIM. Sections IX and X respond to possible objections to our tests.
Section XI concludes.
IV. CIM Case Studies
If CIM is a good measure of the security of contract and property rights, dramatic
political events or changes of regime affecting these rights should change the CIM ratio.
They do, and in directions that are consistent with our argument. We looked for countries
that experienced sharp and sudden political changes and present CIM time series graphs,
along with a brief summary of political events for each of these countries, below. Where

9
data are available from IFS Yearbooks, we trace CIM from 1960 forward; for other
countries, the beginning date is 1969.
1. Iran
The Shah ruled Iran from the 1950s until he was overthrown by a revolution led by
Khomeini in 1978. The new regime had no respect for the rights of those who had been
allied with the old regime or who did not fully support the new regime and follow its
religious doctrine. There was a period of revolutionary turmoil and a dramatic change in
the social order. Iraq launched a war against Iran in September 1980 that lasted until 1988.
CIM was at relatively high and stable levels under the Shah, then dropped sharply with
Khomeini's takeover, the revolutionary turmoil, and the attack by Iraq. As the new regime
established a relatively stable order and as the war with Iraq came to an end, the CIM ratio
increased and approached its former level.
2. The Gambia
Sir Dawda Jawara led Gambia from 1962 through 1992, winning re-election in
several meaningful elections. In October of 1980, however, the Gambian government had,
out of fear of a coup by its own military, requested that Senegal station troops in the
Gambia. In 1981, while Sir Dawda was out of the country, left-wing rebels staged a coup
that was suppressed only with the help of Senegalese troops. The data indicate a substantial
upward trend in the contract-intensive money ratio from 1969 to 1990 (consistent with the
general stability of the regime) that is interrupted in the 1978-82 period.
3. Chile
Following a period of unsustainable expansionary policies, accelerating inflation,
and some moves by the Allende government away from a market economy based on private
10
property, a military government took over in 1973. Within a few years the new government
dramatically changed economic management in the direction of economic orthodoxy in
microeconomic, monetary, and fiscal policies. The late 1970s and early 1980s witnessed a
degree of unorthodoxy in the use of exchange-rate policy to combat inflation, and these
policies, perhaps combined with the explosion of the Mexican debt crisis in 1982, produced
a banking crisis in 1982, followed by a severe recession. By 1985 the severe recession was
over, macroeconomic policy seemed to be back on track, and the regime continued to
pursue its economically orthodox policies including deregulation and privatization of the
economy. The data show a marked decline in CIM in the early 1970s, followed by a
dramatic rise in the ratio in the late 1970s, remaining at a very high level since the
mid-1980s. The ratio exhibited only a moderate negative reaction to the macroeconomic
and financial crisis of the early 1980s, suggesting that CIM was not very sensitive to the
problems of the financial sector and that its increase in the late 1970s and its steadiness at a
high level in the 1980s was mainly a consequence of the security of contract enforcement
and property rights.
4. Brazil
There was a similar dramatic change in economic policy in Brazil after the military
coup in 1964. Recession occurred in 1965 and 1966, as the new regime brought inflation
down from the high level in the last years under Goulart. From 1967 to 1974 there was
what has been described as "the economic miracle," and growth remained high during the
1970s, although it was based on excessive foreign borrowing and was ultimately
unsustainable.

11
The data for Brazil from the IFS yearbooks do not correspond to the data on the IFS
tapes for the years 1969-70. Thus there is a break in the series. The data in the earlier
series show a fairly constant level of CIM during 1960-64, followed by a jump in 1965 and
a gradual rise in the late 1960s. The later series shows a further rise during the 1970s and
1980s. The data for Brazil stop in 1985.
5. Grenada
According to the Europa Yearbook, Grenada functioned as a democracy during its
pre-independence years in the 1960s and up through independence in 1974. But Grenada
was not a placid democracy like its neighbor, Barbados. In the late 1970s the opposition
accused Prime Minister Gairy of being autocratic and corrupt, and in 1979, Maurice Bishop,
the leader of the left-wing PRG (People's Revolutionary Government), led a bloodless coup.
The constitution was suspended. During 1980 and 1981 there was an increase in repression
and mounting fears by the PRG of an invasion by the U.S. During 1982 Grenada was
aligning itself with Cuba and the USSR. In 1983 the armed forces were put on alert out of
fear of a US invasion. Bishop tried to conciliate the U.S., but was assassinated in a coup by
more radical forces. The U.S. invasion occurred in October 1983. By December, most
American troops had pulled out. There were preparations during 1984 for elections, which
were held in December. Though there was tension over the trial of the coup leaders and
restrictions on some left-wing politicians in 1988 and 1989, there was a return to democracy
and relative stability.
12
Though there is a break in the data series for Grenada in 1983,4 the year of the
second coup and the U.S. intervention, the data are nonetheless instructive. From the
mid-1970s to 1983, when political developments must have made contract and property
rights less secure, there was a large decline in CIM. The new data series starting in 1984
shows an increase in CIM along with the installation and gradual consolidation of a new
democratic regime.
6. Turkey
The following summary paraphrases Haggard and Kaufman (1992, p. 289). The
democratic government began losing control over the economy in the late 1970s. There was
political fragmentation under proportional representation: government coalitions proved
difficult to form, were hostage to the demands of small anti-system parties, and were pulled
toward policy positions more radical than those of most of the electorate. In these
circumstances it was difficult to cut government expenditure or adjust to the withdrawal of
foreign lending. A stabilization program was announced in January 1980, but the
government was quickly deadlocked over political issues and was ousted by the military in
September. An economist, Ozal, became the leading economic policy maker under the
military, and he won the (less-than-free) election held in 1983. In 1988, after democracy
had been restored, he was re-elected.
4 The Eastern Caribbean Central Bank was established in that year, and the currency figures become more
precise starting in 1984. Prior to that year, the numbers of Eastern Caribbean Dollars circulating in Grenada
were based on estimates, while after that year, the ECCB placed a letter "G" on the EC Dollars issued there
and was therefore able to track the currency circulation precisely. This information was kindly supplied by Mr.
Kawar of the IMF.

13
The data show a flat level of the CIM ratio from 1972 to 1975, followed by a decline
to 1978. There was a slight recovery in 1979 and 1980, a jump in 1981, followed by a
gradual rise to 1986, and then another mild decline in the late 1980s.
7. Indonesia
In the 1960s the country suffered serious macroeconomic and political instability. In
1965 an attempted communist takeover failed and was followed by a civil war in which
millions were killed and the Communists suppressed. In 1966 Western-trained economists
gained Suharto's ear and a stabilization program was carried out in the late 1960s. After
1970 Indonesia was ruled by a stable single-party government with an economic
bureaucracy that was, because of the low level of independent interest-group mobilization
and the absence of electoral pressures, relatively insulated and able to continue orthodox
economic policies. (See also Haggard and Kaufman, 1992, p. 289).
The data show a fairly flat level of CIM in the early 1960s; there are no data for
1963 and 1964. There is some rise from 1965 to 1968, consistent with the end of the civil
war, followed by a dramatic and sustained rise from 1970 onward as the new regime
showed evidence of considerable staying power, predictable enforcement of contract and
property rights, and prudence in the management of economic policy.
Most of the foregoing countries fall into two main groups. In one group of countries
-- Chile, Brazil, and Indonesia -- weak governments with ill-chosen interventionist
economic policies were replaced by strong military dictatorships in which economic
technocrats had considerable influence. In all three cases, the CIM ratio rose dramatically
after the change in government and economic policies. In the second group of countries --
The Gambia, Grenada, and Turkey -- a democratic regime suffered a period of political

14
uncertainty with an actual or threatened military coup, and then after a time democratic
stability was restored. During the period of turmoil there was a decline in the CIM ratio but
this ratio rose again after the restoration of democracy. These patterns are consistent with
related work the authors have done (see Clague, Keefer, Knack and Olson, 1996) suggesting
that the security of contract and property rights is greater under strong and secure autocrats
than under those of short tenure or in transient democracies and reaches the highest levels in
lasting democracies.
V. CIM and Complementary Measures of the Quality of Governance
The specific country examples offer reassurance that contract-intensive money
mirrors real changes in politics, institutions, and economic policies. In this section we
provide evidence that it is also positively correlated with independent measures of quality of
governance and institutions used in prior studies. These independent measures are
systematic subjective ratings generated by scholars, such as Gastil's indexes of political
freedoms and civil liberties (used, for example, in Scully 1988) or produced by private firms
that meet the market test by selling their measures of political and institutional risk to
investors, such as the ICRG, BERI and BI ratings (introduced by Knack and Keefer, 1995,
Mauro, 1995, and used by many others).
There is a danger that these subjective measures may be influenced by outcomes --
when economic performance is good, the evaluators may be subtly induced to report that
governance is also good. The CIM ratio may also have some limitations; a study of the
period averages for individual countries in Appendix C suggests that some of the cross-
country variation in CIM may be idiosyncratic and have little to do with differences in
15
contract enforcement and security of property.5 Fortunately, because the subjective
measures and CIM --which is an objective outcome of portfolio decisions by individuals
and firms in the countries at issue -- are generated by different and independent processes,
they almost certainly have no idiosyncracies or biases in common. Thus it is a good sign
for CIM, and for the subjective measures, that CIM’s correlations with these
complementary measures of institutional quality are fairly high and remarkably consistent
(at .62 or .63). Each type of measure adds credibility to the other.
Beyond its objectivity and precision as an indicator of property rights security, CIM
also has the virtue of being readily available on a timely basis for a large number of
countries (and for many of them the data go back quite a number of years). Since CIM
appears to be both a credible and a useful new measure of the quality of a country’s
institutions and economic policies, we proceed to test its relationship to economic
outcomes.
VI. Governance and the Size of Finance and other Contract-dependent Sectors
The first hypothesis suggested by the foregoing discussion is that those sectors of the
economy that are especially dependent on contract enforcement should be relatively larger
in those countries with better contract enforcement and property rights. Levine (1998)
provides evidence that subjective indicators of property rights are an important determinant
of the extent of financial intermediation in a country and concludes that “countries that
effectively enforce compliance with laws [governing the legal rights of creditors, among
other things] tend to have better-developed banks than countries where enforcement is lax
(p. 598).” In this section, we expand on this theme by showing that CIM as well as the
5 For example, South Africa has the 3rd-highest value, while Malawi ranks above Belgium.
16
subjective measures are positively associated with the development of a wide range of
contract-intensive activities.
The insurance industry, for example, is exceptionally dependent on contract
enforcement, since those who pay premia receive nothing on the spot and can benefit from
insurance only if the policy contract is honored when there is a valid claim, often long after
the contract has been signed. Accordingly, we obtained data on insurance premia as a
percent of Gross National Product up to 1994 from the International Insurance Council and
tested whether CIM and other measures of institutional quality predicted average insurance
premia (from the five years 1990 through 1994) over GDP for the period. Since the demand
for insurance may be related to income and wealth, we controlled for per capita GDP
(1990). As Table 1 shows, there is a statistically significant positive association between
CIM (and ICRG and BERI) and the relative size of the insurance industry. Each 10-
percentage point rise in CIM is associated with a rise in the insurance share of GDP of
about 1.2 percentage points -- a sizable amount, since on average the insurance sector
comprises four percent of GDP.
To obtain the broadest reasonable measure of the industries that are especially
dependent on contract enforcement, we took the aggregate of the finance, insurance, real
estate, and business services sectors as a percentage of GDP from the UN National
Accounts data. This measure was available for more countries and years than was the
insurance data, so we use the average of this variable over the 1980-90 decade as the
dependent variable in equation of Table 1. Again, all three of the measures of institutional
quality are positively related to the size of the financial sector, holding per capita income
(1980) constant, and all but one of the relationships is statistically significant.

17
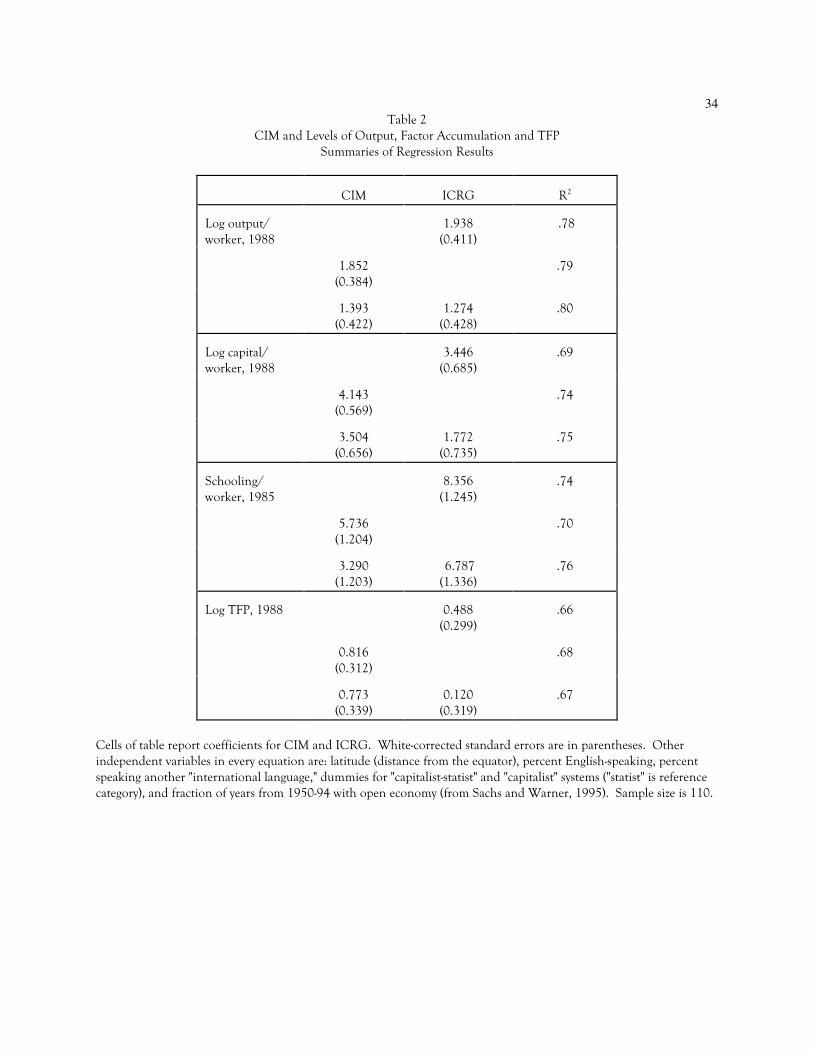
VII. CIM and the Level of Income and Wealth
The second hypothesis generated by our argument is that the better are institutions as
measured by CIM, the greater the degree of specialization and the gains from trade and the
higher the level of capital accumulation, productivity, and per capita income. We test this
hypothesis using the specifications introduced by Hall and Jones (1996) in their study of the
determinants of income per worker in 1988. Hall and Jones include the ICRG index of
property rights along with several other independent variables listed in the note to our Table
2. We replicate their regressions for the countries in their sample for which CIM data are
available, except that we replace ICRG with CIM in one case, and add CIM in another
(leaving ICRG as one of the Hall and Jones base regressors). Coefficients and standard
errors for CIM and ICRG (but not for the other Hall-Jones regressors) are shown in Table 2.
Adjusted R-squares in the first two rows of the top panel of Table 2 show that CIM's
explanatory power slightly exceeds that of ICRG and that CIM is a significant determinant
of income per worker even in the presence of ICRG.
Hall and Jones also estimate determinants of factor accumulation, first physical
capital and, second, human capital. The second panel replicates their regressions of capital
stock per worker, as estimated by them, on the same independent variables, with results
broadly similar to those in the first panel. The third panel replicates the Hall-Jones human
capital equation, in which they use the Barro-Lee (1993) educational attainment measure for
1985 as the dependent variable. Again, CIM (with or without ICRG in the model) is
significantly related to factor accumulation. Finally, Hall and Jones estimated total factor
productivity as a residual, regressing these estimates on the same set of independent
variables. The bottom panel of Table 2 shows that total factor productivity is significantly
related to CIM. The correlation between CIM and the level of economic development does
18
not depend on the Hall-Jones specification; we obtained similar results with other
specifications.
VIII. CIM, Investment, and Growth
In this section, we enter contract-intensive money into widely-used cross-country
investment and growth regressions. Variable definitions, data sources and descriptive
statistics used in these regressions are provided in the Appendix. The independent variables
we employ in addition to CIM are conventional in this literature (see Barro, 1991, and
Levine and Renelt, 1992). Higher initial GDP per capita should be associated with lower
productivity of additional investment and lower subsequent growth. The relative price of
investment goods as a percentage of the U.S. level, should be negatively associated with
investment. Schooling attainment, measured as the mean years of completed education for
the population aged 25 and over is a proxy for human capital.6 Bruno and Easterly (1998)
and others have found that inflation can have a negative effect on investment and growth.
To ensure that inflation's effects on currency demand do not influence our results, we
therefore add a measure of inflation to each regression. This is the depreciation in the real
value of money introduced by Cukierman and Webb (1995), i.e., DEP = INF/(100+INF),
where INF is the rate of inflation in percent. (We consider inflation in more detail in
Section X).
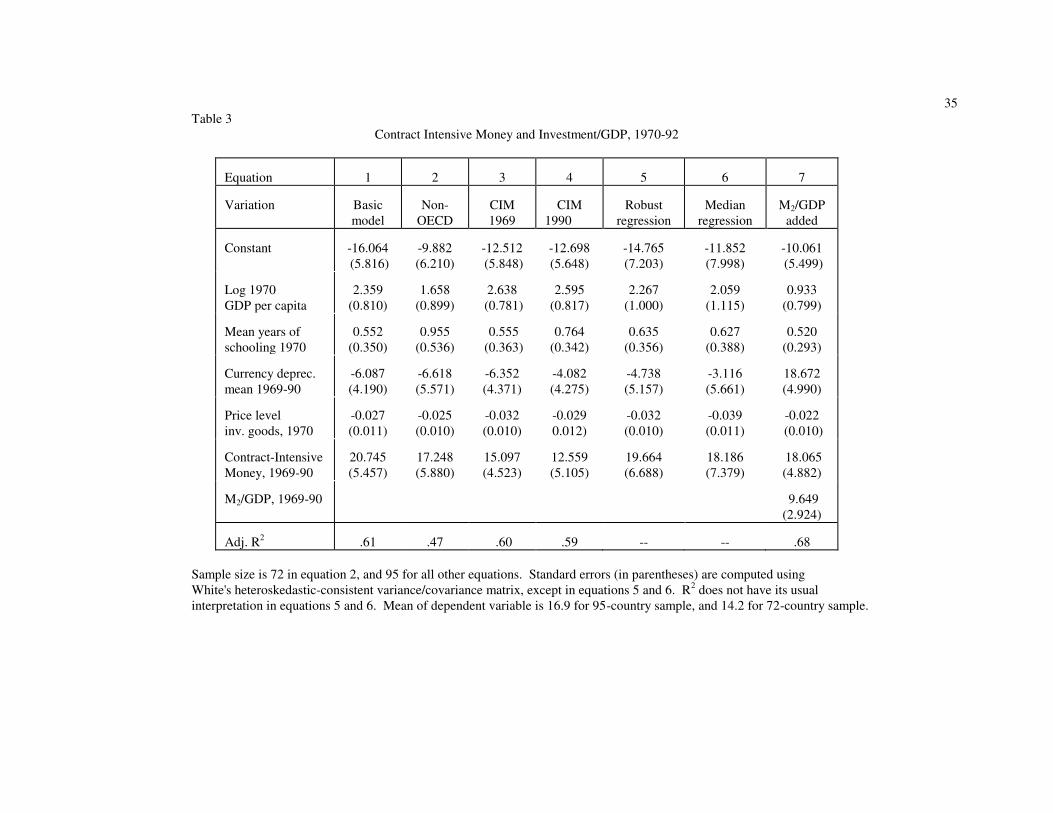
The regression results on the determination of the ratio of investment/GDP,
averaged over the 1969-90 period for which CIM data are consistently available for a large
sample, are shown in Table 3. Equation 1 shows a strong, positive, and highly significant
6 Pritchett (1996) finds that school enrollment is not a good proxy for the stock of educational capital and that
increases in the stock of educational capital do not predict increases in output. The conventional specification
19
relationship between CIM and investment. Results for CIM are very similar for a
subsample of developing (non-OECD) nations in equation 2, indicating that CIM is not
merely capturing broad differences between the groups of developed and developing
nations.
Standardized estimates of CIM’s association with investment are large relative to
those of other independent variables. A one-standard-deviation increase in CIM (i.e. an
increase of .14) in equation 1 is associated with an increase in investment as a proportion of
GDP of one-third of a standard deviation, or about three percentage points. This effect
exceeds the impact of a one standard deviation increase of any one of the other four
independent variables.
Since CIM and economic performance are measured contemporaneously in our
analysis, our correlations conceivably capture effects of the latter on the former.
Accordingly, in equations 3 and 4 respectively, we substitute the initial-year (1969) and
end-year (1990) values of CIM for its 1969-90 average. The coefficient for initial CIM
exceeds that for the end-of-period (1990) CIM value. When both are entered together in a
regression (not shown), the coefficient for initial CIM is more than double that of the final
CIM, and only initial CIM is statistically significant. Both results are contrary to what we
would expect if our estimates using the 1969-90 average were biased upward by reverse
causality.
To ensure that the association between CIM and investment in equation 1 is not
sensitive to outliers, we report results of robust and median regressions in equations 5 and
6. The CIM coefficient is changed very little.
may nonetheless be justified since school enrollment may be a proxy measure of the desire and capability of a
country’s government to provide public goods that the market would otherwise underprovide.
20
Adding other regressors such as the real interest rate, population growth, indicators
of trade openness, and government size similarly leaves the CIM coefficient substantially
unchanged.7 Finally, we obtain similar results for CIM when the average of private
investment/GDP for 1970-85 as constructed by Barro (1991), and the average of equipment
investment/GDP for 1975-85 as estimated by DeLong and Summers (1991), are substituted
for total investment.8
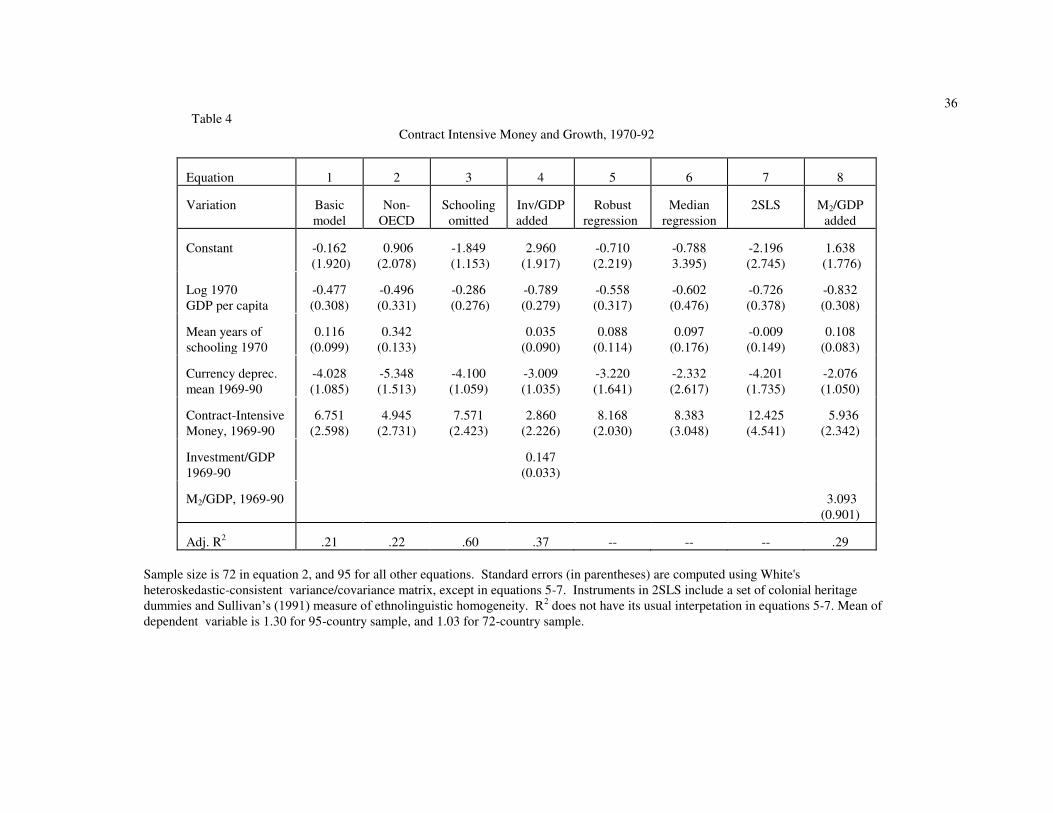
Growth equations are reported in Table 4. The growth regressors are the same as
those used for investment, expect that the price of investment goods is omitted. In equation
1, CIM is positively and significantly related to growth. Each standard deviation increase in
CIM is associated with an increase in annual per capita growth of nearly one-half of a
standard deviation, or nearly one percentage point. The association between CIM and
growth is slightly weaker when developed nations are excluded, in equation 2. The growth
regressors are the same as those used for investment except that the price of investment
goods is omitted.
Equation 3 omits the school enrollment variables, which is arguably endogenous to
CIM. Where contract and property rights are enforced, the returns to specialized education
may rise, and will also aid in the development of credit markets, which may make education
beyond the primary level feasible for the poor (Galor and Zeira, 1993). As expected, the
CIM coefficient increases somewhat when schooling is omitted in equation 3.
7 A "monetarist" interpretation of CIM also suggests that real interest rates should be controlled for. Doing
so only trivially affects the CIM coefficient and at a substantial cost in sample size due to gaps in the interest
rate data. We therefore do not include the real interest rate in all regressions.
8 Results described in this paragraph are available on request. We use total investment from Summers and
Heston (1991) as our primary investment variable because it is likely measured more accurately than are
estimates of private or equipment investment.
21
The addition of investment/GDP as a regressor in equation 4 indicates that much of
the impact of the contract enforcement and governance as measured by CIM is through
investment effects rather than through efficiency effects. The CIM coefficient in equation 4
is less than one-half its value in equations 1 through 3. This result is consistent with the
conceptual framework outlined in section II.
Results from robust and median regressions reported in equations 5 and 6 indicated
that the association between CIM and growth is not sensitive to a few significant
observations. The CIM coefficients in these tests are slightly larger than in equation 1. As
in the case of investment, results also are little affected by adding other commonly-used
regressors such as population growth, trade intensity, and government size.
Unlike the case with CIM and investment, there is some evidence that the CIM-
growth relationship may partially arise from reverse causality. The coefficient for end-of-
period (1990) CIM exceeds that of initial (1969) CIM when these two variables are
substituted for the period average of CIM (whether in separate regressions or together).
Accordingly, we attempt in equation 6 to test the growth impact of the exogenous
component of CIM using two stage least squares.
The instruments for CIM include the other right hand side variables (currency
depreciation, initial income, and schooling), the percentage of a country’s population
belonging to the largest ethnic group, and a set of colonial heritage dummies, indicating
whether a nation was colonized by the British, the French, the Spanish, the Portuguese, or
by others (e.g., the Dutch, Belgians, Italians or Japanese), or was never colonized. The test
of overidentifying restrictions fails to reject the null hypothesis that the instruments do not
belong in the growth equation. Results in equation 7 indicate that the exogenous
component of CIM is significantly correlated with growth.

22
The tests reported in tables 3 and 4 are all cross-sectional tests on country averages
over the 1969-90 period. Our focus here is not as much on short-term policy changes as on
continuing institutions for contract enforcement and property rights that, in stable
environments, should not change much from year to year. We have not, in general, run tests
treating each country-year in our sample as a separate observation. Nonetheless, we briefly
summarize here severe tests of CIM’s relationship to economic performance, focusing only
on the idiosyncratic variations over time in CIM, investment, and income in each country.
We do this using two-way fixed effects models, with country and year fixed effects, both
with the annual data and with decade averages. These tests should capture most
connections CIM has with short- and medium-term changes in policy and with the less
stable countries where there are major institutional changes in a given year or decade. We
find that variations over time within countries in CIM are significantly correlated with
changes in investment, but not with changes in growth.
IX. Is CIM a measure of the contracting environment or financial sector
development?
Significant research has identified a strong and causal relationship between financial
development and growth (King and Levine 1993a, Levine 1998), leading lead one to
reasonably ask whether contract-intensive money is simply an alternative measure of
financial sector development. This is a difficult question since, as Levine (1998) has
shown, financial sector development is itself very sensitive to subjective measures of the
security of property and contract rights in a country. We offer several arguments in favor of
the conclusion that CIM is properly regarded as a broad measure of the general security of
contracts and property rights in all sectors of a country and not primarily those in the
financial sector.
23
Measures of financial development reflect basic contractual features of a country,
but they also track specific characteristics of the financial sector, such as the extent to which
the sector facilitates diversification and the monitoring of managers (see Levine, 1997).
Conversely, measures of the security of property rights, including CIM, while indirectly
related to the capacity of the financial sector to diversify risk, should more directly and
strongly capture the overall security of transactions in a country, including not only
financial sector transactions, but all contracts that put substantial resources at risk of
contractual non-compliance (such as contracts between independent power producers and
utilities). They should also capture not only the risk of government expropriation of
financial assets (for example, through bank nationalization), but the expropriation through
arbitrary regulation or outright confiscation of any type of fixed asset.
One piece of evidence that CIM is more appropriately categorized as a general
indicator of contractual and property rights rather than as an indicator of financial
development is its significant correlation with subjective measures of institutional quality,
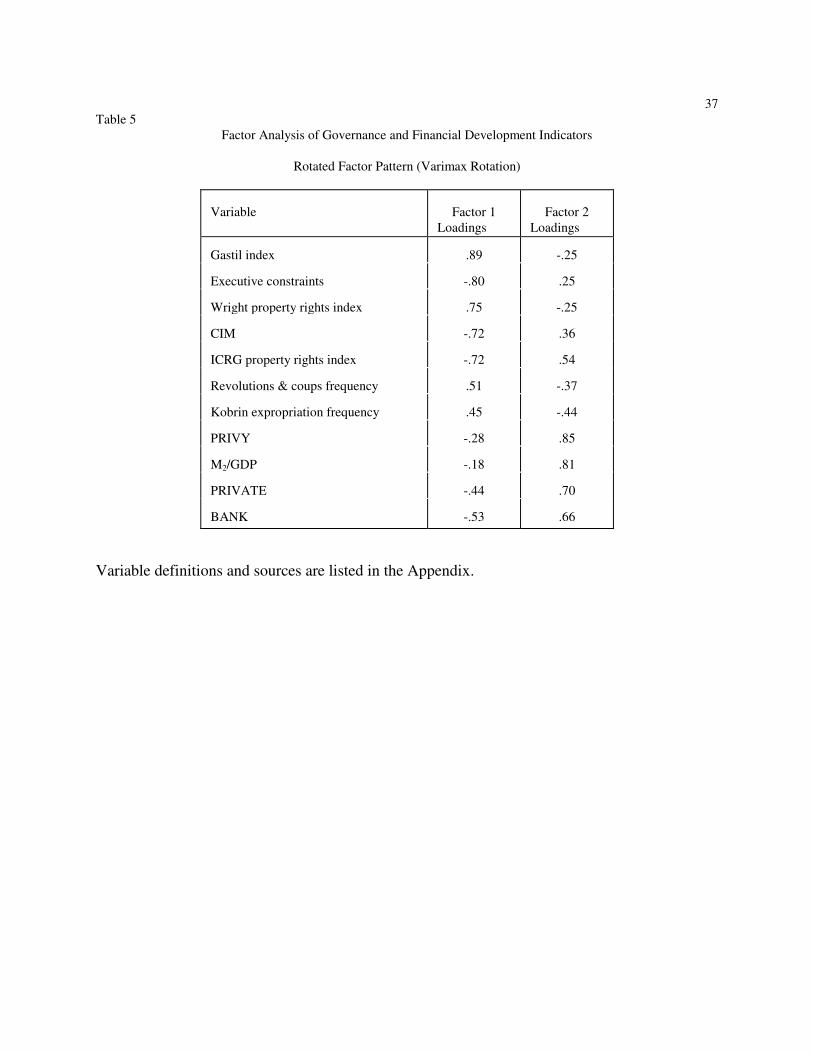
discussed earlier. A more rigorous test of the proposition is to conduct a factor analysis of
many different measures of "quality of governance and institutions," on the one hand, and
"financial development" on the other, using the four indicators of financial depth in King
and Levine (1993a), CIM, and six different measures of institutions in the factor analysis.
We allow the analysis to identify two factors. As Table 5 shows, the institutional variables,
including CIM, load most heavily on Factor 1. The absolute value of the Factor 1 loading
of CIM is twice that of its Factor 2 loading. The four indicators of financial development,
PRIVY, M2/GDP, PRIVATE and BANK (described in the data appendix), all load more
heavily onto the second factor. These are the results one would expect if CIM is
24
predominantly an indicator of the security of contracts and property rather than of financial
development.
A third piece of evidence that CIM is more of an institutional than a financial sector
variable emerges from our country examples. These show that CIM tracks dramatic
political developments that have little to do directly with the financial sector, although they
may, simultaneously, also influence the usual measures of financial development.
Finally, CIM and indicators of financial development seem to capture different
aspects of economic growth and investment. If we return to the growth and investment
equations of the previous section, adding King and Levine's primary measure of financial
depth, M2/GDP, leaves the CIM coefficient essentially unchanged. This is evident in
equations 7 of Tables 3 and 4, where the CIM coefficient is only slightly less after the
inclusion of the measure of financial depth than it is in the base sample. Financial depth is
also significant, further reinforcing the notion that the variables capture different aspects of
the institutional and economic environment in countries. CIM isolates the impact of
improved contract enforcement and property rights security, which has a generalized effect
that encompasses but is not exclusive to the financial sector. M2/GDP captures the specific
attributes of the financial sector that increase growth and investment, including the effect of
the financial sector on the ability of economic agents to diversify risk and exert control over
managers.
On the basis of these tests, we argue that CIM, even though it is derived from data in
the money markets, is nevertheless most appropriately regarded as a more general measure
of the quality of governance and institutions. There are policy implications of this
conclusion. Countries with low CIM (or low scores on other, more subjective measures of
property rights and contract security) would be advised to examine closely government

25
policies related to enforcement of contracts between private economic actors and the due
process guarantees that governments afford firms and individuals when they create and
implement policies. Countries that exhibit low indicators of financial development need to
address both the general contractual environment that inhibits growth of the financial sector
and also examine specific policy issues that affect the sector, including the presence of
discriminatory taxation (King and Levine, 1993b), laws unfavorable to creditors, and poorly
developed bankruptcy procedures.
X. Alternative explanations for the CIM findings
There are three possible problems that could arise in interpreting the foregoing
results. The first is that CIM might be an artifact of inflation, interest rates, or monetary
policies. CIM is related to inflation in two contrary ways. On the one hand, inflation
reduces the value of money and raises nominal interest rates, and therefore provides an
incentive to shift money from currency and non-interest bearing accounts into interest-
paying time deposits or into foreign currency accounts. This increases CIM. If changes in
CIM were driven by changes in inflation in this way, it would be less likely that we would
find positive associations between CIM and growth, investment, or other, subjective
indicators of the security of property and contract rights.
On the other hand, with very high rates of inflation there is also greater uncertainty
about the rate of inflation and even about the viability of the existing governmental and
financial institutions. This makes deposits in financial institutions, and especially deposits
with limits or penalties on timing of withdrawals, riskier, and tends to reduce CIM. If this
effect dominates, higher CIM would be associated with lower inflation; since lower

26
inflation is likely to be associated with higher growth and investment, the possibility arises
of a spurious positive relationship between CIM and these economic outcomes.
We have two pieces of evidence that our CIM results are not simply an artifact of
inflation-related phenomena. First, all of our results are robust to the inclusion of inflation,
as Tables 3 and 4 demonstrate. Second, we find that only when the rate of inflation is very
high – above about 60% per year – is it associated with lower CIM. Below this level,
however, higher rates of inflation are associated with higher CIM, creating a bias for most
of our observations against finding a positive relationship between CIM and growth and
investment.
The second possible problem with interpretation arises if CIM is only a proxy for
savings.9
Countries with high savings rates (due, for example, to age profiles of their
populations) might, because time deposits and other financial instruments are better
vehicles for saving than currency, have high values of CIM. Since national saving rates are
highly correlated with national investment rates, the association of CIM with investment
might be a product of these influences. We examine this issue in two ways, and find no
support for the conclusion that CIM is simply a proxy for savings rates. First, in a fixed
effects regression of the annual observations of CIM on income and saving, with time and
country dummies, we find that the coefficient of saving is extremely small. This result is
robust to a variety of specifications. Second, we find that CIM is also a strong predictor of
components of total investment -- private investment and equipment investment -- that are
9 We owe this suggestion to Brian Fikkert.
27
not forced, through accounting identities, to be as strongly associated with savings rates as
is total investment.
XI. Conclusions
This paper contributes to a growing literature that emphasizes the institutional or
governmental prerequisites of markets. While it is true that the markets for many self-
enforcing transactions emerge spontaneously and bring some gains from trade everywhere,
many of the markets that a society needs if it is to develop and achieve its economic
potential are missing in most countries. In this paper we the claim that only countries where
governments give private parties the capacity to make credible commitments that they could
not otherwise make, and thereby achieve gains from trade that they could not otherwise
obtain, achieve their economic potential.
This paper contributes to a growing literature that emphasizes the institutional or
governmental foundations of well-functioning markets. While it is true that the markets for
many self-enforcing transactions emerge spontaneously and bring some gains from trade
everywhere, many of the markets that a society needs if it is to develop and achieve its
economic potential are missing in most countries. In this paper we use our new measure of
the security of contract enforcement and property rights, Contract-Intensive Money, to
support the claim that only countries where governments give private parties the capacity to
make credible commitments that they could not otherwise make, and thereby achieve gains
from trade that they could not otherwise obtain, achieve their economic potential.
We base the importance of CIM on the following three propositions: (1) the
contract-intensive money ratio is a measure of the proportion of transactions that rely on
third-party enforcement; (2) this proportion is a good indicator of the reliability of contract

28
enforcement and the security of property rights in countries; and (3) contract enforcement
reliability and property rights security are important for high levels of productivity and rapid
economic growth.
While it is difficult to test these propositions one at a time, we have marshalled a
good deal of evidence that is consistent with all three. In a series of case studies of dramatic
change in politics and governance, CIM changed in ways consistent with these propositions.
CIM is also correlated with other, subjective measures of the quality of governance and
institutions that are now widely used in the literature.
Consistent with the theory, countries with relatively high values of CIM -- and
relatively high scores on other measures of quality of governance -- have relatively more
insurance and financial development. This is true even though we control for the level of
per capita income. Governments that give their citizens the capacity to obtain more gains
from trade and specialization also improve economic performance in other ways. The
empirical evidence developed in the paper indicates that CIM is strongly associated with the
size of the capital stock, the level of per capita income, and the total factor productivity of
countries. We also find that countries with a high level of CIM tend to grow faster and to
exhibit higher rates of investment.
The paper concludes by investigating three interpretations of these results that
diverge from the one that we offer, that CIM is a measure of the security of property and
contract rights, and that it is the insecurity of these rights that suppresses investment and
growth. We present evidence, however, that is inconsistent with these three interpretations:
differences across countries in levels of CIM are not predominantly due to differences with
respect to financial sector development, inflation, or savings.
29
In sum, this paper introduces a measure of the security of economic rights that is
available for many countries and for long periods, constituting, therefore, a valuable new
resource for empirical studies. Because this measure is objective, and not based on
subjective evaluations, we are also able in this paper to present the most persuasive
evidence to date that economic growth and investment significantly accelerate when
governments impartially protect and precisely define the rights of all participants in the
economy.

30
References
Barro, Robert J. (1991). "Economic Growth in a Cross Section of Countries." Quarterly
Journal of Economics, 106(2), 407-43.
Barro, Robert J. and Jong-Wha Lee (1993). "International Comparisons of Educational
Attainment." Journal of Monetary Economics, 32(3), 363-94.
Borner, S., A. Brunetti and B. Weder (1995). Political Credibility and Economic
Development, (New York: St. Martin’s Press).
Bruno, Michael and William Easterly (1998). “Inflation Crises and Long-run Growth.” Journal of Monetary Economics. 41(1): 3-26.
Clague, Christopher, Philip Keefer, Stephen Knack and Mancur Olson (1996). "Property
and Contract Rights in Autocracies and Democracies." Journal of Economic
Growth, 1(2), 243-76.
Cukierman, Alex, and Steven Webb (1995). "Political Influence on the Central Bank:
International Evidence." World Bank Economic Review, 9(3), 397-423.
DeLong, J. Bradford and Larry Summers (1991). "Equipment Investment and Economic
Growth." Quarterly Journal of Economics, 106(2), 445-502.
Easterly, William (1993). "How Much Do Distortions Affect Growth?" Journal of
Monetary Economics, 32(2), 187-212.
The Europa World Yearbook (various years). London: Europa Publications Limited.
Galor, Oded and J. Zeira (1993). “Income Distribution and Macroeconomics.” Review of
Economic Studies, 60: 35-52.
Grierson, P.J.H. (1904). The Silent Trade. Edinburgh: William Green and Sons.
Haggard, Stephan, and Robert R. Kaufman (1992). The Politics of Economic Adjustment:
International Constraints, Distributive Conflicts, and the State. Princeton, NJ:
Princeton University Press.
Hall, Robert, and Charles Jones (1996). "The Productivity of Nations." NBER Working
Paper No. 5812.
Hayek, Friedrich A. (1948). "The Meaning of Competition," in his Individualism and
Economic Order, Chicago, IL: University of Chicago Press, 92-106.
International Monetary Fund (various issues). International Financial Statistics Yearbook.
Hobbes, Thomas (1958 [1651]). Leviathan. Indianapolis, IN, Bobbs-Merrill.

31
King, Robert G. and Ross Levine (1993a). "Finance and Growth: Schumpeter Might Be
Right." Quarterly Journal of Economics, 108(3), 717-37.
_____(1993b). “Finance, Entrepreneurship and Growth.” Journal of Monetary Economics,
32, 513-42.
Knack, Stephen, and Philip Keefer (1995). "Institutions and Economic Performance: Cross-
Country Tests Using Alternative Institutional Measures." Economics and Politics,
7(3), 207-27.
Knack, Stephen and Philip Keefer (1997). "Does Social Capital Have an Economic
Payoff?" Quarterly Journal of Economics. 112 (4).
La Porta, Rafael, Florencio Lopez-de-Silanes, Andrei Shleifer, and Robert W. Vishny
(forthcoming). "Law and Finance." Journal of Political Economy.
Levine, Ross (1997). “Financial development and economic growth: views and an agenda.” Journal of Economic Literature, 35: 688 – 726 (June).
_____(1998). “The Legal Environment, Banks, and Long-Run Economic Growth.” Journal of Money, Credit and Banking, 30: 3 (August, Part 2), 596-613.
_____and David Renelt (1992). "A Sensitivity Analysis of Cross-Country Growth
Regression." American Economic Review, 82(4), 942-63.
Mauro, Paolo (1995). "Corruption and Growth." Quarterly Journal of Economics, 110(3),
681-712.
North, Douglass C. (1990). Institutions, Institutional Change, and Economic Performance.
Cambridge and New York: Cambridge University Press.
Olson, Mancur (1992). "The Hidden Path to a Successful Economy," in The Emergence of
Market Economies in Eastern Europe. Ed. Christopher Clague and Gordon Rausser.
Cambridge, MA & Oxford, Blackwell, 55-76.
_____(1993). "Dictatorship, Democracy and Development." American Political Science
Review, 87(3), 567-76.
_____(1996). "Big Bills Left on the Sidewalk: Why some Nations Are Rich, and Others
Poor." Journal of Economic Perspectives, 10(2), 3-24.
Pritchett, Lant (1996). "Where Has All the Education Gone?" Policy Research Working
Paper no. 1581, The World Bank.
Rosenberg, Nathan and L. E. Birdzell (1986). How the West Grew Rich: The Economic
Transformation of the Industrial World. New York: Basic Books.
Scully, Gerald W. (1988). "The Institutional Framework and Economic Development."
Journal of Political Economy, 96(3), 652-62.

32
Summers, Robert and Alan Heston (1991). "The Penn World Table (Mark V): An
Expanded Set of International Comparisons, 1950-88." Quarterly Journal of
Economics, 106(2), 327-68.
Townsend, Robert M. (1983). "Financial Structure and Economic Activity." American
Economic Review, 73(5), 895-911.
Williamson, Oliver (1983). "Credible Commitments: Using Hostages to Support
Exchange." American Economic Review, 73(4), 519-40.
_____(1985). The Economic Institutions of Capitalism. New York: The Free Press.

33
Table 1
Contract Intensive Money and the Financial Sector
Equation
1
2
3
4
5
6
Dependent variable:
Insurance/GDP 1990-94
Finance/GDP 1980-90
Constant
-17.060
(2.498)
-4.471
(4.453)
-8.137
(3.275)
-12.516
(2.515)
-12.006
(3.685)
-11.969
(6.547) Initial (log) GDP per
capita
1.679
(0.456)
0.385
(0.694)
0.534
(0.581)
1.822
(0.447)
2.295
(0.484)
2.535
(1.031) Contract Intensive
Money
7.682
(2.765)
11.007
(2.686)
ICRG
0.153
(0.048)
0.186
(0.062)
BERI
1.132
(0.308)
0.392
(0.445) Adj. R
2
.47
.41
.55
.41
.34
.26
N
57
62
44
104
78
45
Mean, D.V.
3.90
4.07
4.31
10.7
10.3
12.1
Standard errors (in parentheses) are computed using White's heteroskedastic-consistent variance/covariance matrix. Finance/GDP is the percentage of
GDP accounted for by finance, insurance, real estate and business services, from UN National Accounts data.
34
Table 2
CIM and Levels of Output, Factor Accumulation and TFP
Summaries of Regression Results
CIM
ICRG
R2
Log output/
worker, 1988
1.938
(0.411)
.78
1.852
(0.384)
.79
1.393
(0.422)
1.274
(0.428)
.80
Log capital/
worker, 1988
3.446
(0.685)
.69
4.143
(0.569)
.74
3.504
(0.656)
1.772
(0.735)
.75
Schooling/
worker, 1985
8.356
(1.245)
.74
5.736
(1.204)
.70
3.290
(1.203)
6.787
(1.336)
.76
Log TFP, 1988
0.488
(0.299)
.66
0.816
(0.312)
.68
0.773
(0.339)
0.120
(0.319)
.67
Cells of table report coefficients for CIM and ICRG. White-corrected standard errors are in parentheses. Other
independent variables in every equation are: latitude (distance from the equator), percent English-speaking, percent
speaking another "international language," dummies for "capitalist-statist" and "capitalist" systems ("statist" is reference
category), and fraction of years from 1950-94 with open economy (from Sachs and Warner, 1995). Sample size is 110.
35
Table 3
Contract Intensive Money and Investment/GDP, 1970-92
Equation
1
2
3
4
5
6
7
Variation
Basic
model
Non-
OECD
CIM
1969
CIM
1990
Robust
regression
Median
regression
M2/GDP
added Constant
-16.064
(5.816)
-9.882
(6.210)
-12.512
(5.848)
-12.698
(5.648)
-14.765
(7.203)
-11.852
(7.998)
-10.061
(5.499) Log 1970
GDP per capita
2.359
(0.810)
1.658
(0.899)
2.638
(0.781)
2.595
(0.817)
2.267
(1.000)
2.059
(1.115)
0.933
(0.799) Mean years of
schooling 1970
0.552
(0.350)
0.955
(0.536)
0.555
(0.363)
0.764
(0.342)
0.635
(0.356)
0.627
(0.388)
0.520
(0.293) Currency deprec.
mean 1969-90
-6.087
(4.190)
-6.618
(5.571)
-6.352
(4.371)
-4.082
(4.275)
-4.738
(5.157)
-3.116
(5.661)
18.672
(4.990) Price level
inv. goods, 1970
-0.027
(0.011)
-0.025
(0.010)
-0.032
(0.010)
-0.029
0.012)
-0.032
(0.010)
-0.039
(0.011)
-0.022
(0.010) Contract-Intensive
Money, 1969-90
20.745
(5.457)
17.248
(5.880)
15.097
(4.523)
12.559
(5.105)
19.664
(6.688)
18.186
(7.379)
18.065
(4.882) M2/GDP, 1969-90
9.649
(2.924) Adj. R
2
.61
.47
.60
.59
--
--
.68
Sample size is 72 in equation 2, and 95 for all other equations. Standard errors (in parentheses) are computed using
White's heteroskedastic-consistent variance/covariance matrix, except in equations 5 and 6. R2 does not have its usual
interpretation in equations 5 and 6. Mean of dependent variable is 16.9 for 95-country sample, and 14.2 for 72-country sample.
36
Table 4
Contract Intensive Money and Growth, 1970-92
Equation
1
2
3
4
5
6
7
8
Variation
Basic
model
Non-
OECD
Schooling
omitted
Inv/GDP
added
Robust
regression
Median
regression
2SLS
M2/GDP
added Constant
-0.162
(1.920)
0.906
(2.078)
-1.849
(1.153)
2.960
(1.917)
-0.710
(2.219)
-0.788
3.395)
-2.196
(2.745)
1.638
(1.776) Log 1970
GDP per capita
-0.477
(0.308)
-0.496
(0.331)
-0.286
(0.276)
-0.789
(0.279)
-0.558
(0.317)
-0.602
(0.476)
-0.726
(0.378)
-0.832
(0.308) Mean years of
schooling 1970
0.116
(0.099)
0.342
(0.133)
0.035
(0.090)
0.088
(0.114)
0.097
(0.176)
-0.009
(0.149)
0.108
(0.083) Currency deprec.
mean 1969-90
-4.028
(1.085)
-5.348
(1.513)
-4.100
(1.059)
-3.009
(1.035)
-3.220
(1.641)
-2.332
(2.617)
-4.201
(1.735)
-2.076
(1.050) Contract-Intensive
Money, 1969-90
6.751
(2.598)
4.945
(2.731)
7.571
(2.423)
2.860
(2.226)
8.168
(2.030)
8.383
(3.048)
12.425
(4.541)
5.936
(2.342) Investment/GDP
1969-90
0.147
(0.033)
M2/GDP, 1969-90
3.093
(0.901) Adj. R
2
.21
.22
.60
.37
--
--
--
.29
Sample size is 72 in equation 2, and 95 for all other equations. Standard errors (in parentheses) are computed using White's
heteroskedastic-consistent variance/covariance matrix, except in equations 5-7. Instruments in 2SLS include a set of colonial heritage
dummies and Sullivan’s (1991) measure of ethnolinguistic homogeneity. R2 does not have its usual interpetation in equations 5-7. Mean of
dependent variable is 1.30 for 95-country sample, and 1.03 for 72-country sample.
37
Table 5
Factor Analysis of Governance and Financial Development Indicators
Rotated Factor Pattern (Varimax Rotation)
Variable
Factor 1
Loadings
Factor 2
Loadings Gastil index
.89
-.25
Executive constraints
-.80
.25
Wright property rights index
.75
-.25
CIM
-.72
.36
ICRG property rights index
-.72
.54
Revolutions & coups frequency
.51
-.37
Kobrin expropriation frequency
.45
-.44
PRIVY
-.28
.85
M2/GDP
-.18
.81
PRIVATE
-.44
.70
BANK
-.53
.66
Variable definitions and sources are listed in the Appendix.
38
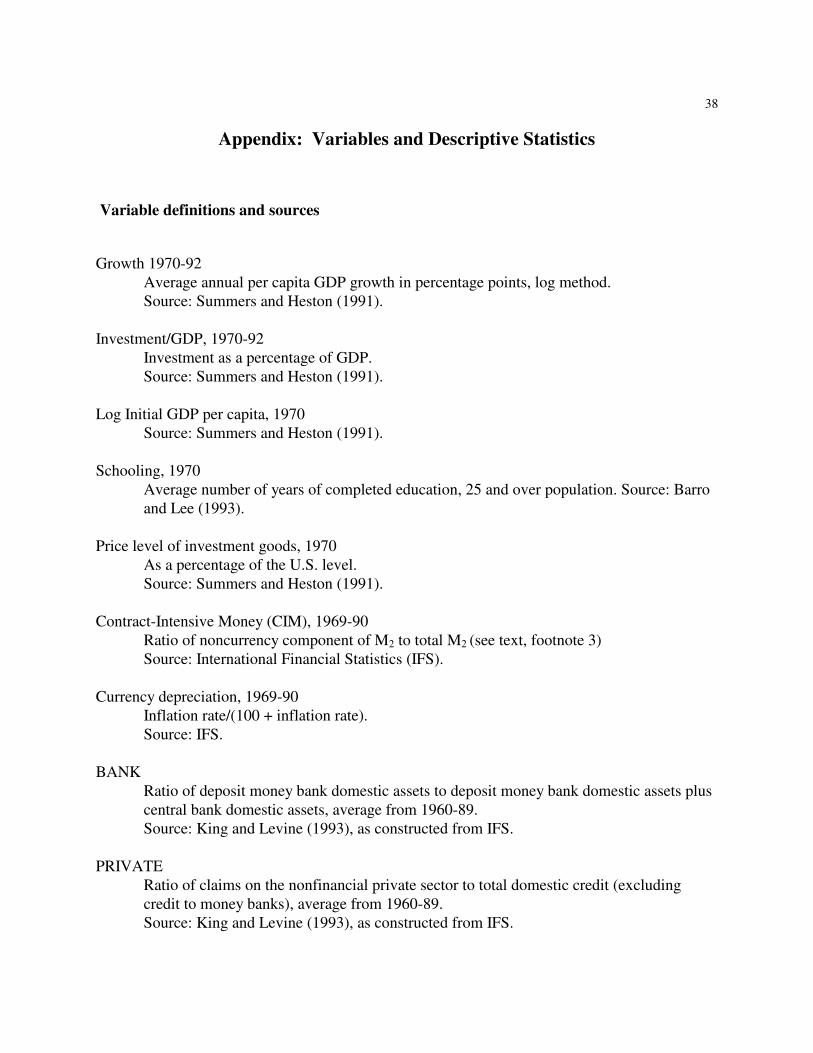
Appendix: Variables and Descriptive Statistics
Variable definitions and sources
Growth 1970-92
Average annual per capita GDP growth in percentage points, log method.
Source: Summers and Heston (1991).
Investment/GDP, 1970-92
Investment as a percentage of GDP.
Source: Summers and Heston (1991).
Log Initial GDP per capita, 1970
Source: Summers and Heston (1991).
Schooling, 1970
Average number of years of completed education, 25 and over population. Source: Barro
and Lee (1993).
Price level of investment goods, 1970
As a percentage of the U.S. level.
Source: Summers and Heston (1991).
Contract-Intensive Money (CIM), 1969-90
Ratio of noncurrency component of M2 to total M2 (see text, footnote 3)
Source: International Financial Statistics (IFS).
Currency depreciation, 1969-90
Inflation rate/(100 + inflation rate).
Source: IFS.
BANK
Ratio of deposit money bank domestic assets to deposit money bank domestic assets plus
central bank domestic assets, average from 1960-89.
Source: King and Levine (1993), as constructed from IFS.
PRIVATE
Ratio of claims on the nonfinancial private sector to total domestic credit (excluding
credit to money banks), average from 1960-89.
Source: King and Levine (1993), as constructed from IFS.

39
PRIVY
Ratio of claims on the nonfinancial private sector to GDP, average from 1960-89.
Source: King and Levine (1993), as constructed from IFS.
M2/GDP, 1969-90
Source: IFS.
Revolutions + Coups
Average number per year, 1960-88.
Source: Arthur Banks, SUNY Binghamton.
Gastil Index
Sum of political freedoms and civil liberties indexes, each scaled 1-7, averaged from
1973-86.
Source: Scully (1992).
ICRG Index
Sum of 5 subjective variables each scaled 1-10: rule of law, quality of bureaucracy,
corruption, risk of expropriation, and government repudiation of contracts.
Source: Knack and Keefer (1995), as constructed from International Country Risk Guide,
1982-90.
BERI Index
Sum of 4 subjective variables each scaled 1-4: bureaucratic delays, contract
enforceability, nationalization potential, and infrastructure quality.
Source: Knack and Keefer (1995), as constructed from Business Environmental Risk
Intelligence, 1972-90.
BI Index
Sum of 4 subjective variables each scaled 1-10: bureaucracy and red tape, quality of legal
system and judiciary, risk of nationalization, and corruption.
Source: Constructed from selected Business International (1982-89) variables used in
Mody and Wheeler (1992).
Wright Property Rights Index
Subjective 1-4 rating, with higher scores indicating worse protection of property rights.
Source: As reported in Scully (1992).
Kobrin Expropriation
1-4 ordinal scale defined by frequency of expropriations or nationalizations in 1960-79
period, with higher values indicating greater frequency.
Source: As reported in Kobrin (1985).
Executive Constraints

40
1-7 ordinal scale of constraints on power of the executive, with higher scores indicating
more constraints.
Source: Gurr (1990).
Descriptive Statistics for
95-country sample used in tables 3 and 4
Mean Std. dev.
Growth, 1970-92 1.30 1.96
Inv/GDP, 1970-92 16.9 8.4
Log per capita GDP, 1970 7.75 0.95
School attainment 1970 3.62 2.79
Currency depreciation 1969-90 0.13 0.11
Price of inv. goods, 1970 97.7 60.8
CIM, 1969-90 0.78 0.13
M2/GDP, 1969-90 0.43 0.25