Embed Size (px)
Citation preview
MAIN REPORT
Continuoustenantomnibus
survey2016
1
CONTENTS
1.0 INTRODUCTION ................................................................................................................ 4
1.1 Background ............................................................................................................................. 4
1.2 Objectives................................................................................................................................ 4
1.3 Reporting................................................................................................................................. 5
2.0 KEY FINDINGS ................................................................................................................... 6
3.0 CHARACTERISTICS OF STOCK AND HOUSEHOLD PROFILE .................................................... 8
3.1 Housing Executive stock .......................................................................................................... 8
3.2 Household profile (ALL HOUSEHOLD MEMBERS) ................................................................... 8
3.3 Profile of household reference person (HRP) ......................................................................... 9
4.0 HOUSING EXECUTIVE SERVICES ....................................................................................... 12
4.1 Overall service provided by the Housing Executive .............................................................. 12
4.2 Repairs service ...................................................................................................................... 12
4.3 Satisfaction with quality, condition and size of home .......................................................... 14
4.4 Future intentions (over the next 5 years) ............................................................................. 15
4.5 Contact with the Housing Executive ..................................................................................... 15
4.6 Respondents’ Attitudes to Home and Estate ........................................................................ 16
5.0 HOUSING BENEFIT, RENT PAYMENTS AND FINANCIAL INCLUSION .................................... 18
5.1 Housing Benefit ..................................................................................................................... 18
5.2 Rent Payments ...................................................................................................................... 18
5.3 Financial inclusion ................................................................................................................. 20
6.0 TENANT INVOLVEMENT, CONSULTATION AND COMMUNICATION ................................... 23
6.1 Tenant involvement .............................................................................................................. 23
6.2 Tenant consultation .............................................................................................................. 23
6.3 Communication ..................................................................................................................... 25
7.0 DIGITAL INCLUSION ......................................................................................................... 27
7.1 Access to the internet ........................................................................................................... 27
7.2 Mobile phone ........................................................................................................................ 29
8.0 CLIENT RESPONSE TO SURVEY ......................................................................................... 31
APPENDIX 1 Appendix tables
APPENDIX 2 Background to survey
Acknowledgements
2
LIST OF FIGURES
Figure 3.1 Household types by number of bedrooms ........................................................................ 7
Figure 3.2 Gender of HRP ................................................................................................................... 8
Figure 3.3: HRP benefits received ........................................................................................................ 9
Figure 3.4: HRP health problem/illness or disability ........................................................................... 9
Figure 4.1: Overall satisfaction 2014-2016 ........................................................................................ 11
Figure 4.2: Proportion of respondents who had reported a repair, 2014-2016 ................................ 12
Figure 4.3: General satisfaction with the repair service by Region, 2015-2016 ............................... 12
Figure 5.1: Satisfaction that rent provides value for money, 2015-2016 ......................................... 19
Figure 5.2: Satisfaction that rent provides value for money by Housing Benefit status ................... 20
Figure 5.3: Respondent current and/or savings accounts ownership by Age of HRP ....................... 20
Figure 6.1: Respondent interest in becoming involved in tenant initiatives ..................................... 22
Figure 6.2: How well respondents felt they were consulted by the Housing Executive 2014-2016 .. 23
Figure 6.3: Percentage of respondents who felt well consulted by the Housing Executive, by Age of
HRP – 2016 ...................................................................................................................... 23
Figure 6.4: Extent to which respondents felt the Housing Executive was good at keeping them
informed about things that might affect them, 2013-2016 ............................................. 25
Figure 7.1: Percentage respondents who had access to the internet 2012-2016 ............................. 27
Figure 7.2: Households’ main method of accessing internet, 2015-2016 ......................................... 28
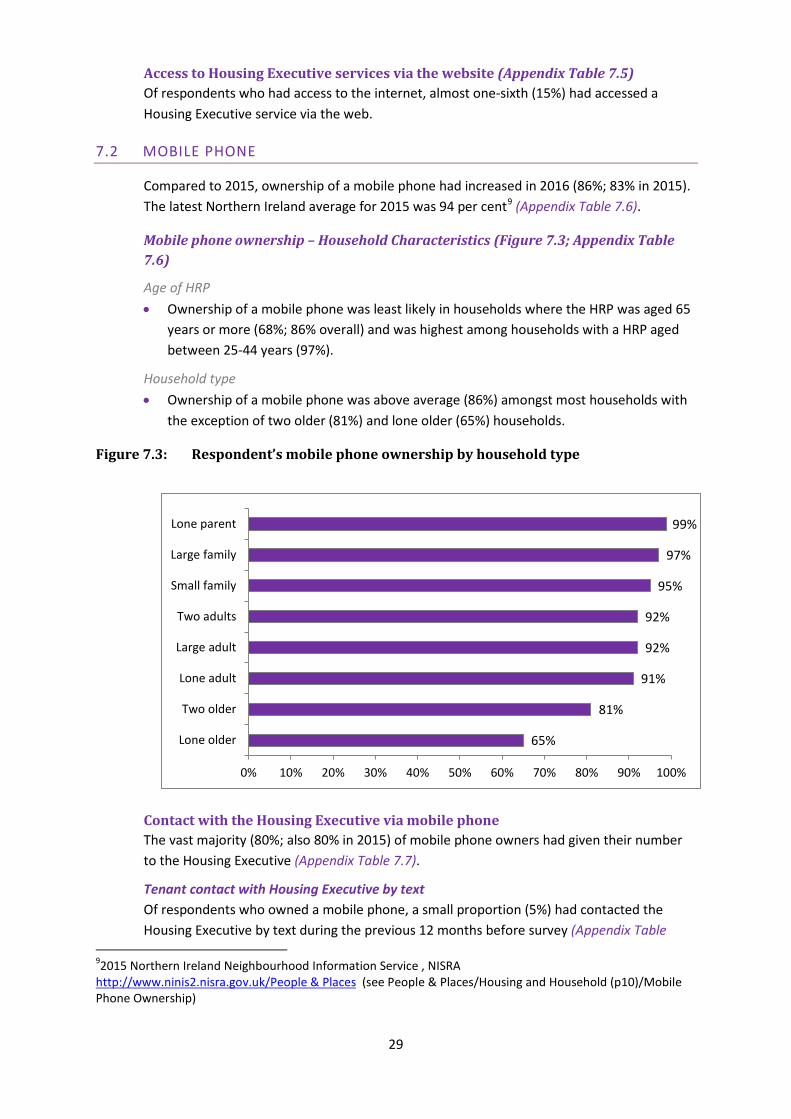
Figure 7.3: Respondent’s mobile phone ownership by household type ........................................... 29
3
TABLES IN TEXT
Table 1.1 Omnibus topics – 2016 ....................................................................................................... 5
Table 4.1: Satisfaction with aspects of completed repair, 2012-2016 (%) ....................................... 14
Table 4.2: Satisfaction with how respondents query was dealt with by office staff (%) .................. 16
4
1.0 Introduction
1.1 BACKGROUND
The Continuous Tenant Omnibus Survey (CTOS) provides extensive and up-to-date information on the Housing Executive’s tenant population and a valuable insight into attitudes to, and satisfaction with, Housing Executive services. It is a vital source of information, not only for guiding the development of public sector housing policy, but also for quality assessments and monitoring performance, allowing the organisation to assess the extent to which we meet key corporate objectives as set out in the Corporate & Business Plans for both Regional Services and Landlord services.
Regional Services:
• Objective one - “Identification of housing requirements across Northern Ireland”.
• Objective two – “Investing in homes and neighbourhoods”.
• Objective three – “Improving people’s homes”.
• Objective four – “Transforming people’s lives”.
• Objective five – “Enabling sustainable neighbourhoods and regeneration”.
Landlord Services:
• Objective one – “Delivering quality services”.
• Objective three – “Fostering vibrant communities”.
The CTOS also plays a vital role in delivering, at a Regional and Area level, housing management performance-related data on key service areas. This helps management to concentrate attention on areas of weaker performance and provides Area, Region and Centre with a consistent basis for monitoring performance, in keeping with the Housing Executive’s Journey to Excellence.
Additionally, the Survey contributes to the measurement of business improvement activity and the quality of services delivered to our tenants as findings from the CTOS support the Housing Executive’s applications for EQFM Excellence Model, Customer Service Excellence (CSE) award and the NI Quality Award. The Survey also identifies areas where the quality of services needs to be improved.
1.2 OBJECTIVES
• To provide a comprehensive socio-economic profile of Housing Executive tenants and their views and attitudes to service provision in 2016 at Northern Ireland, Regional and Area level;
• To facilitate a comparative analysis of tenants’ views over time;
• To allow collection of specific information for various client groups in the Housing Executive, to inform the formulation of future policy or programmes; and
5
• To allow the flexibility associated with rapid response by the Research Unit to carry out research, through the use of omnibus sections, into specific issues without the delays and expense associated with the commissioning of individual small surveys.
1.3 REPORTING
Housing Services presented key findings from the 2016 Survey to the Housing Executive Board in June 2017.
This report is a summary of the main findings from the 2016 CTOS. Where appropriate, the findings are compared with CTOS findings from previous years. However, where small changes of less than two percentage points occur in year-on-year comparisons, care should be taken when interpreting results, as differences may be due to sample size related margins of error rather than actual changes in views on the level of service (see Appendix 2 for margin of error table).
Percentages in the tabular report are detailed to one decimal place. However, for ease of reporting, the percentages in the textual analysis are in whole numbers1.
During 2016, Omnibus topics were reported at the end of each specific data collection period. The clients received tabular data and, where requested, an omnibus report; these are also available, on request, from the Research Unit. Table 1.1 below lists all omnibus topics included in 2016.
Table 1.1 Omnibus topics – 2016
Quarter Topic Client Q1 – Jan-Mar Energy in the home Sustainable Development
Community Relations Housing Services Rural Sustainable Development
Q 2 – Apr-Jun Social Rent Policy Department for Communities Q 3 – Jul-Sep Anti-social behaviour Income Collection and Neighbourhoods
Digital Inclusion Digital Engagement Team Q4 – Oct-Dec Health and Disability Research & Equality Unit
Income and Household Bills Income Collection and Neighbourhoods
1 Therefore, .5 or higher is rounded up and .4 or below is rounded down.
6
2.0 Key Findings • Lone adult (23%; 24%in 2015) and lone older (22%; also 22% in 2015) households
remain the most common household types.
• Almost one-third of HRPs (30%; 29% in 2015) were retired and one-fifth (20%; 22% in 2015) were permanently sick/disabled. A slightly higher proportion of HRPs were employed (21%; 19% in 2015) than HRPs who were unemployed (18%; 19% in 2015).
• In 2016, almost nine in ten (87%) respondents were satisfied with the overall service provided by the Housing Executive, a five percentage point increase from 2015 (82%).
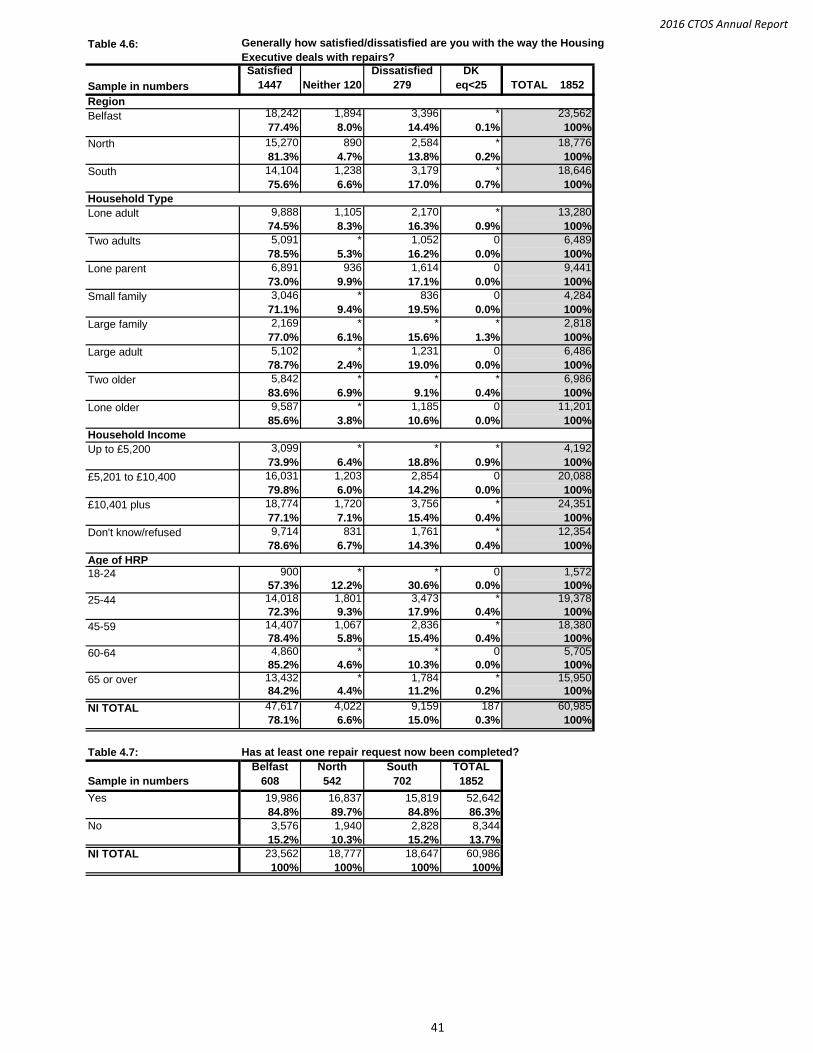
• Almost three-quarters (72%; 69% in 2015) of respondents had made a repair request within the previous 12 months of being interviewed. Of these respondents, the majority (88%; 86%) continue to make their repair request by telephone. Compared to 2015, respondent satisfaction with how the Housing Executive deals with repairs remains similar (78%; 77% in 2015).
• Of the respondents reporting a repair (72%), at the time of interview, the majority (86%; also 86% in 2015) had had at least one repair completed. Of these respondents, 86 per cent (84% in 2015) reported they were satisfied with the completed repair service.
• Eighty-six per cent (86%; 85% in 2015) of all respondents were satisfied with the overall quality of their home. Similarly, 85 per cent (84% in 2015) were satisfied with the general condition of their property.
• Four of every five households were in receipt of Housing Benefit (80%; 81% in 2015). Analysed by household type, higher proportions of lone older (89%), lone parent (86%) and lone adult (81%) households were in receipt of Housing Benefit.
• More than four-fifths (88%; also 88% in 2015) of respondents were satisfied that their rent provided value for money. Analysed by receipt of Housing Benefit, nine in ten (90%) households that received some level of Housing Benefit were satisfied, compared to almost eight in ten (78%) households that did not receive any Housing Benefit.
• The majority (88%) of respondents had ownership of some type of current/saving account. Less than one-tenth (9%) of respondents did not have a current/savings account and three per cent refused to respond.
• There was very little interest, among respondents, in becoming involved in any of a number of community forums, such as a local residents group (4%).
• Almost three-quarters (72%; 67% in 2015) of respondents were satisfied that the Housing Executive listens to their views and acts upon them. By age, the majority (83%) of HRPs who were 65 years old or over were of this opinion, compared to HRPs aged 64 years or younger (68%).
• Almost eight in ten (79%) respondents felt that the Housing Executive was good at keeping them informed about things that might affect them as a tenant. By Region, a
7
higher proportion of respondents in the North Region (83%) were of this opinion compared to the South (78%) and Belfast (77%) Regions.
• In 2016, almost six in ten (58%) of all households had access to the internet, compared to more than half (53%) in 2015. Access to the internet was more prevalent among those households with a HRP below 60 years of age.
• Use of a mobile/smartphone (50%) was the main method used by respondents to access the internet, followed by personal laptop/tablet (41%).
8
69%
60%48% 45% 43%
38% 40% 36% 35%
21% 20% 13% 13% 10% 8% 9% 7% 5%
1% 0%
1 bed 2 bed 3 bed 4+ bed
Adult Children Older All Households
3.0 Characteristics of Stock and Household Profile
This chapter reports on the Housing Executive’s occupied stock in 2016, the socio-economic profile of the Household Reference Person (HRP) and the total resident population as at January 2016. Findings are reported by household type and Household Reference Person (HRP)2.
3.1 HOUSING EXECUTIVE STOCK
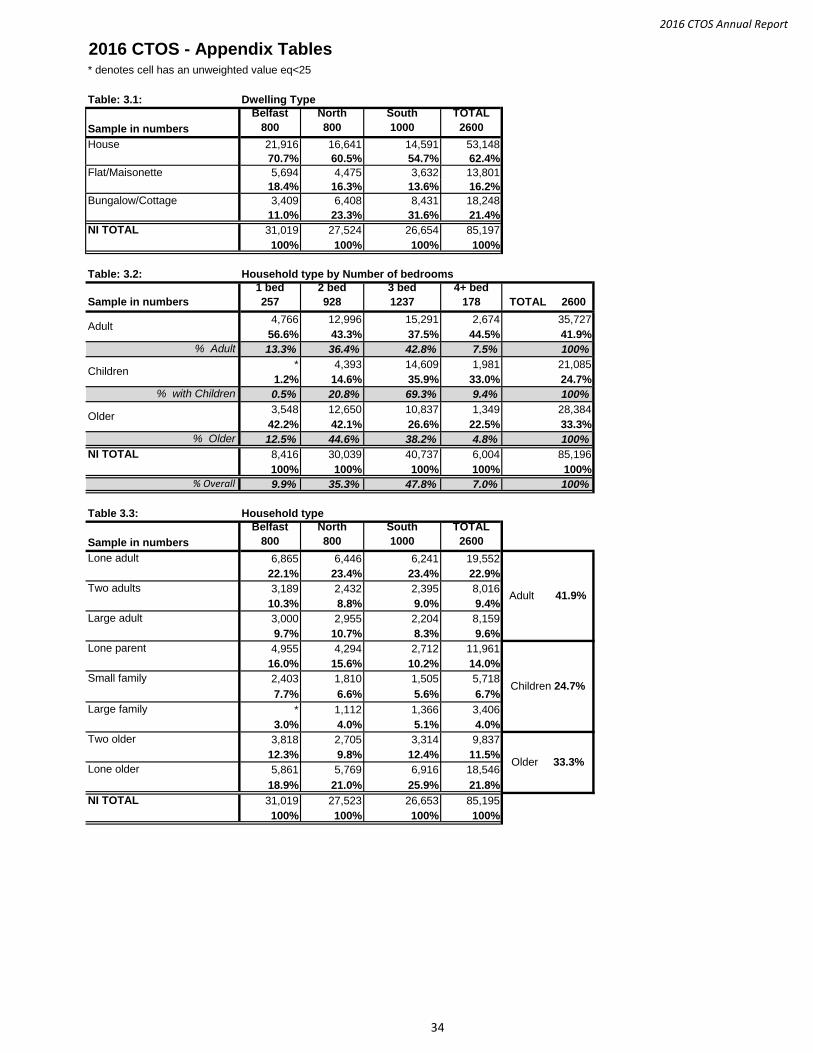
As at January 2016 the Housing Executive had an occupied stock of approximately 85,000 properties. More than three-fifths (62%) of Housing Executive dwellings were houses, more than one-fifth (21%) were bungalows/cottages and approximately one-sixth (16%) were flats/maisonettes (Appendix Table 3.1).
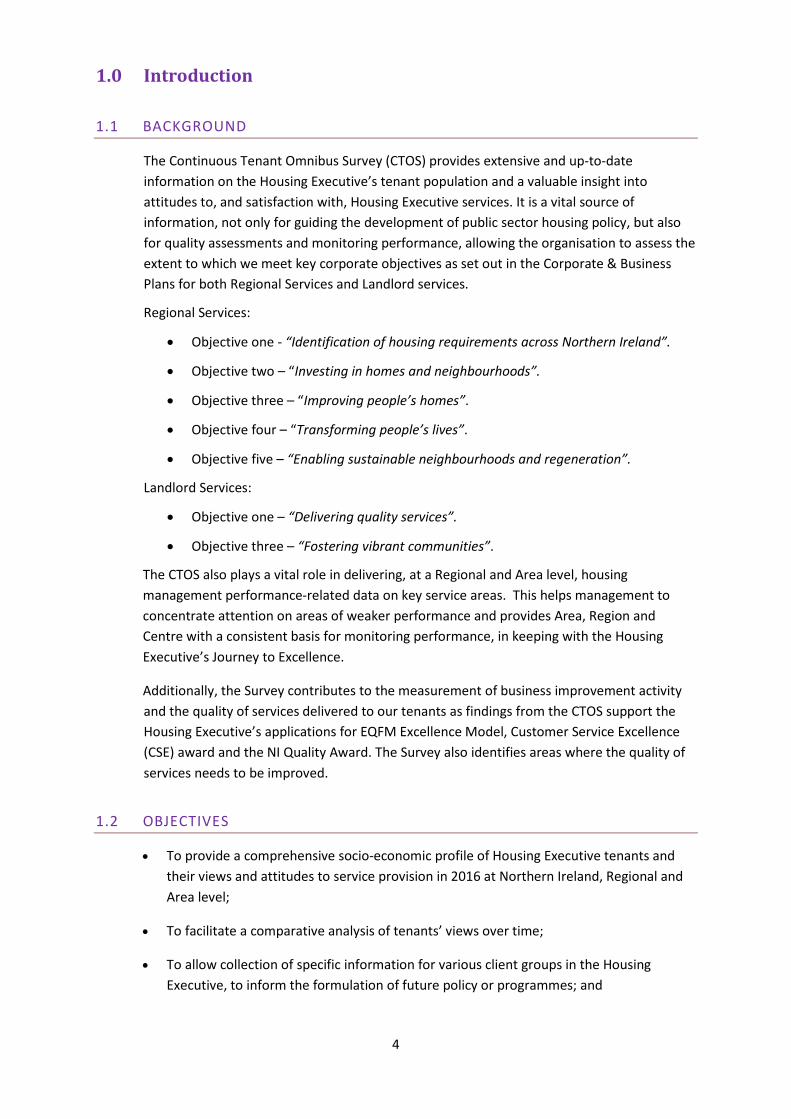
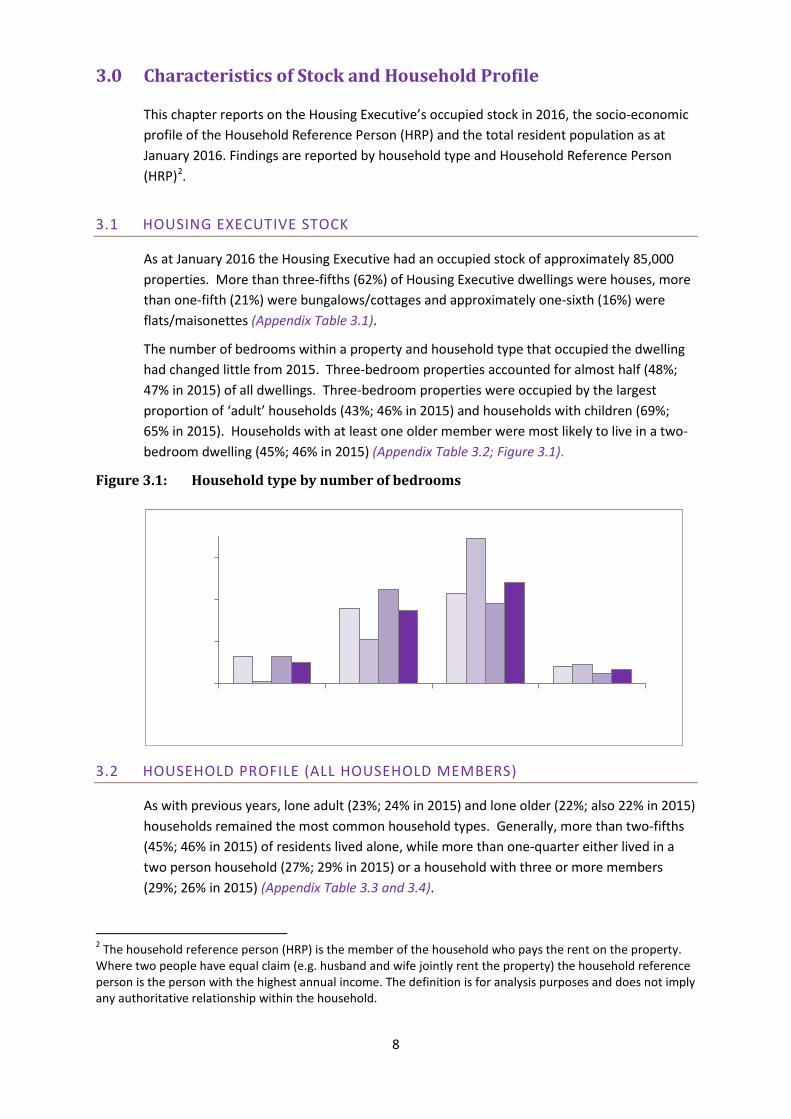
The number of bedrooms within a property and household type that occupied the dwelling had changed little from 2015. Three-bedroom properties accounted for almost half (48%; 47% in 2015) of all dwellings. Three-bedroom properties were occupied by the largest proportion of ‘adult’ households (43%; 46% in 2015) and households with children (69%; 65% in 2015). Households with at least one older member were most likely to live in a two-bedroom dwelling (45%; 46% in 2015) (Appendix Table 3.2; Figure 3.1).
Figure 3.1: Household type by number of bedrooms
3.2 HOUSEHOLD PROFILE (ALL HOUSEHOLD MEMBERS)
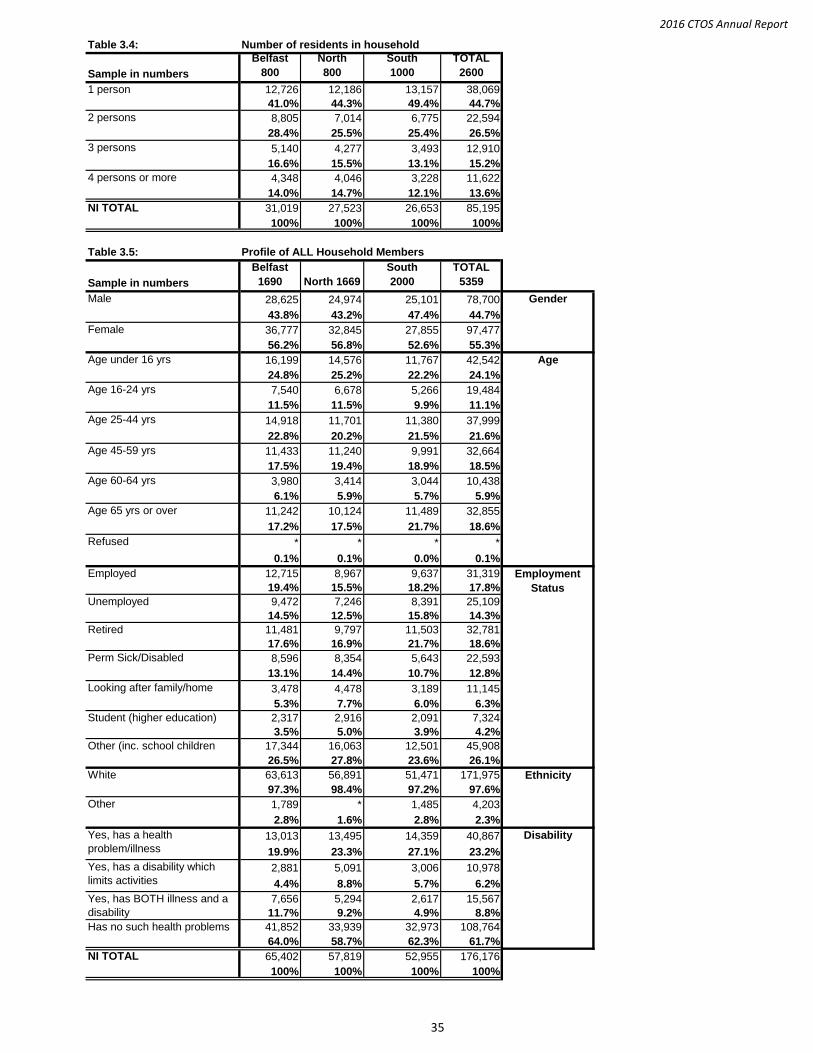
As with previous years, lone adult (23%; 24% in 2015) and lone older (22%; also 22% in 2015) households remained the most common household types. Generally, more than two-fifths (45%; 46% in 2015) of residents lived alone, while more than one-quarter either lived in a two person household (27%; 29% in 2015) or a household with three or more members (29%; 26% in 2015) (Appendix Table 3.3 and 3.4).
2 The household reference person (HRP) is the member of the household who pays the rent on the property. Where two people have equal claim (e.g. husband and wife jointly rent the property) the household reference person is the person with the highest annual income. The definition is for analysis purposes and does not imply any authoritative relationship within the household.
9
The total estimated resident population within the Housing Executive’s occupied stock for 2016 was approximately 176,000, giving an average household size of 2.07 (1.99 in 2015 and 2.08 in 2014), which is lower than the average household size for Northern Ireland as a whole at 2.53 (also 2.5 in the previous year).
Compared to 2015 there was very little change in 2016 in the make-up of households (Appendix Table 3.5).
Gender More than half of all residents were female (55%; 54% in 2015) and less than half (45%; 46% in 2015) were male.
Age Of all residents, one-quarter (25%; 24% in 2015) were 60 years or older and slightly less than one-quarter (24%; 22% in 2015) were under 16 years old.
Employment Almost one-fifth of residents were retired (19%; 18% in 2015) or employed (18%; 17% in 2015), with less than one-sixth unemployed (14%; 16% in 2015).
Ethnicity As in 2015, the ethnicity of almost all (98%; also 98% in 2015) residents was white.
Disability/Long term illness Of all household members, more than one-third (38%; 39% in 2015) were reported to have a long term illness/disability.
3.3 PROFILE OF HOUSEHOLD REFERENCE PERSON (HRP)
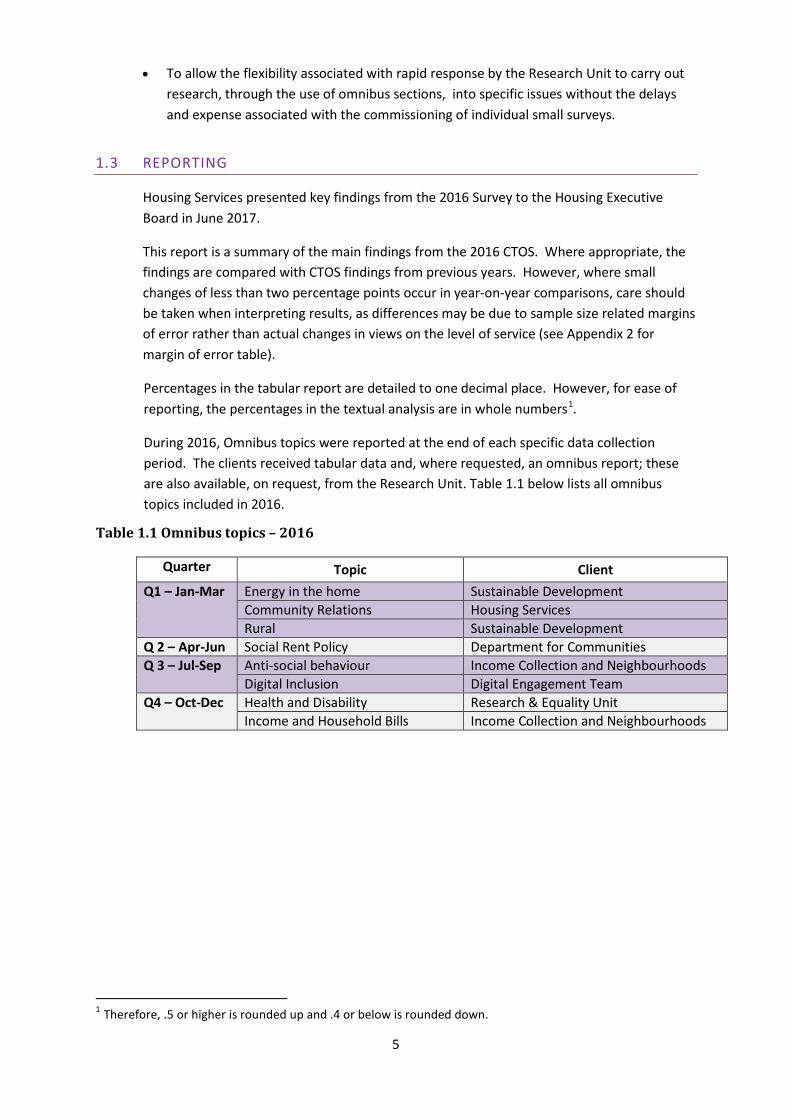
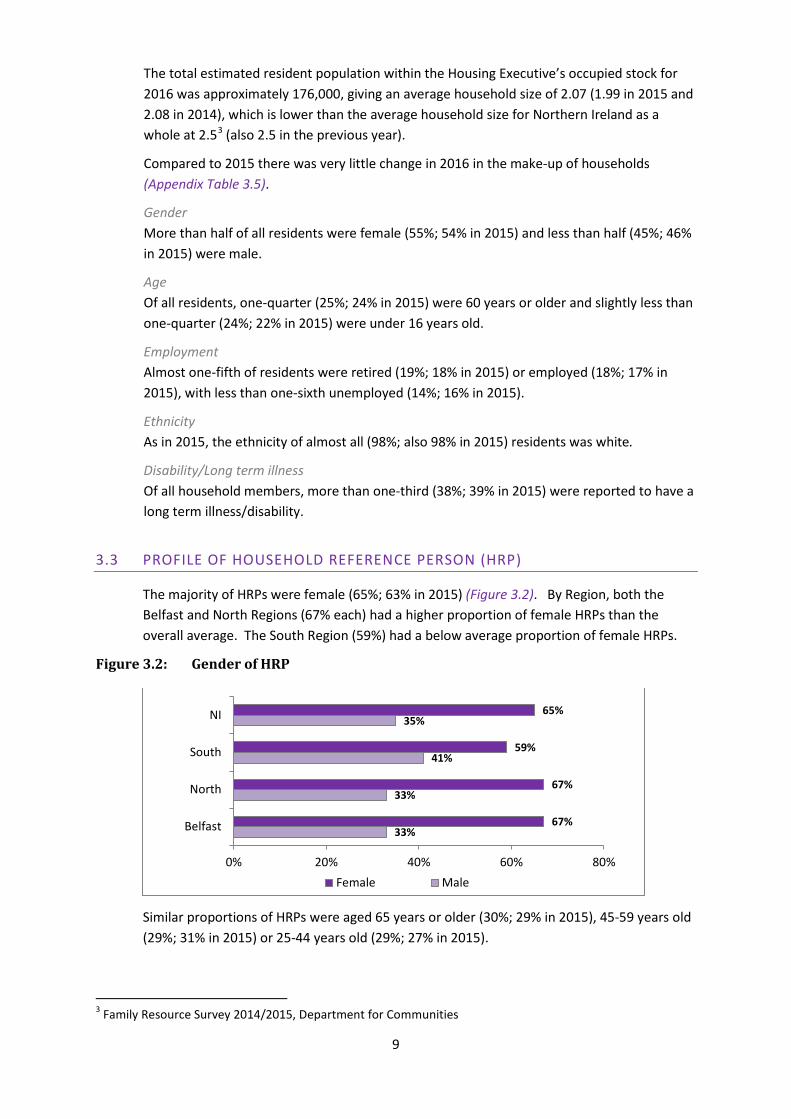
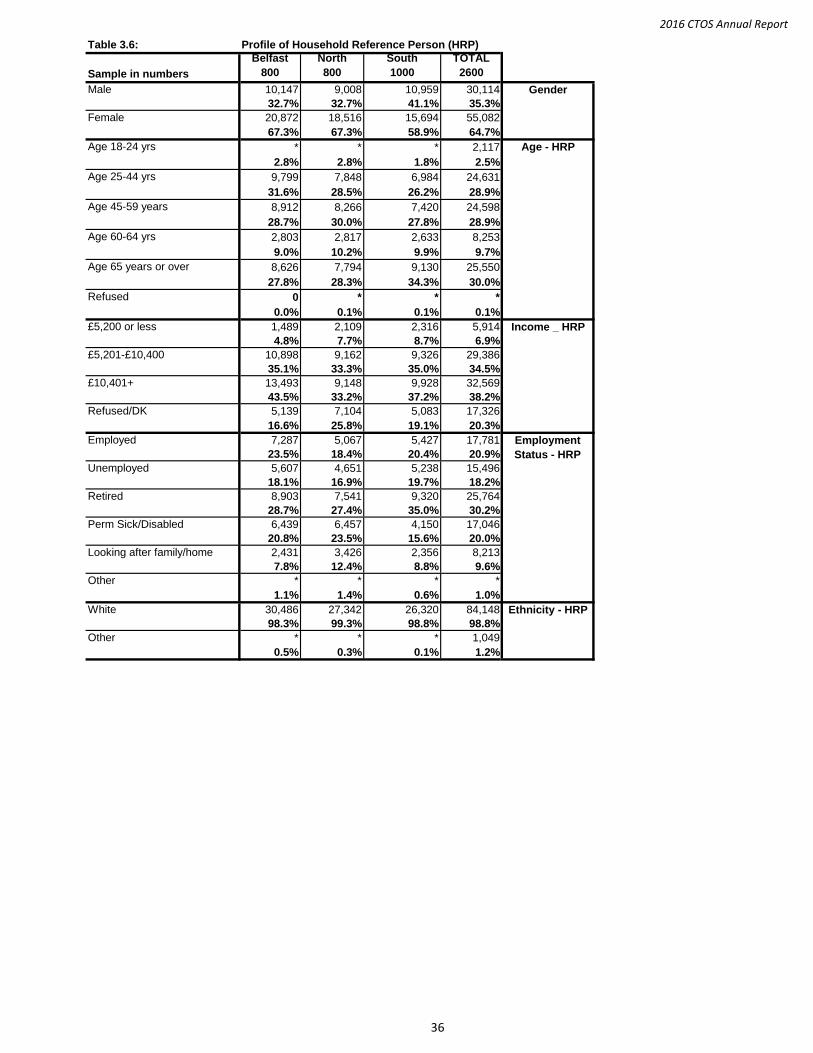
The majority of HRPs were female (65%; 63% in 2015) (Figure 3.2). By Region, both the Belfast and North Regions (67% each) had a higher proportion of female HRPs than the overall average. The South Region (59%) had a below average proportion of female HRPs.
Figure 3.2: Gender of HRP
Similar proportions of HRPs were aged 65 years or older (30%; 29% in 2015), 45-59 years old (29%; 31% in 2015) or 25-44 years old (29%; 27% in 2015).
3 Family Resource Survey 2014/2015, Department for Communities
33%
33%
41%
35%
67%
67%
59%
65%
0% 20% 40% 60% 80%
Belfast
North
South
NI
Female Male
10
90%77% 80% 78%
70%
60%
50%
40% 34% 37%
30% 27% 28% 26% 25% 22% 22% 21% 18% 20% 19% 16% 16% 14%
10% 7% 10% 7% 8% 5% 6% 3% 5%
0%
2016 2015
Compared to 2015, fewer households (41%; 46% in 2015) in 2016 had an annual income of less than £10,400 (£200 per week). Less than one-tenth (7%; 9% in 2015) had an annual income of £5,200 or less (£100 or less per week) while the largest proportion (38%; 36% in 20155) had an annual income of £10,401 or more.
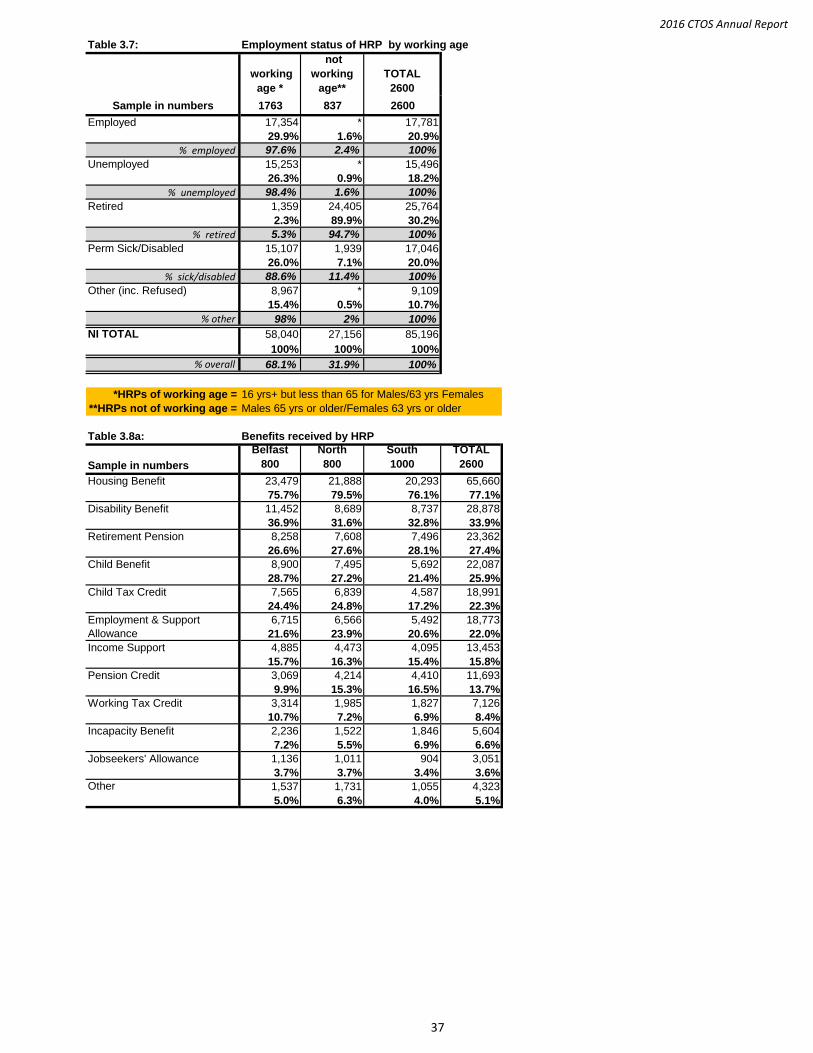
Three in ten HRPs (30%; 29% in 2015) were retired, while slightly more than one-fifth (21%; 19% in 2015) were employed and less than one-fifth (18%; 19% in 2015) were unemployed.
HRPs of Working Age by Employment Status Overall, more than two-thirds (68%; 70% in 2015) of HRPs were of working age4. Of this sub-group, the largest proportion (30%; 26% in 2015) were in employment, followed by slightly more than one-quarter who were unemployed (26%; 27% in 2015) or permanently sick/disabled (26%; 24% in 2015) (Appendix Table 3.7).
More than three-in-ten (32%; 30% in 2015) HRPs were not of working age5, the vast majority of whom were retired (90%; 85% in 2015).
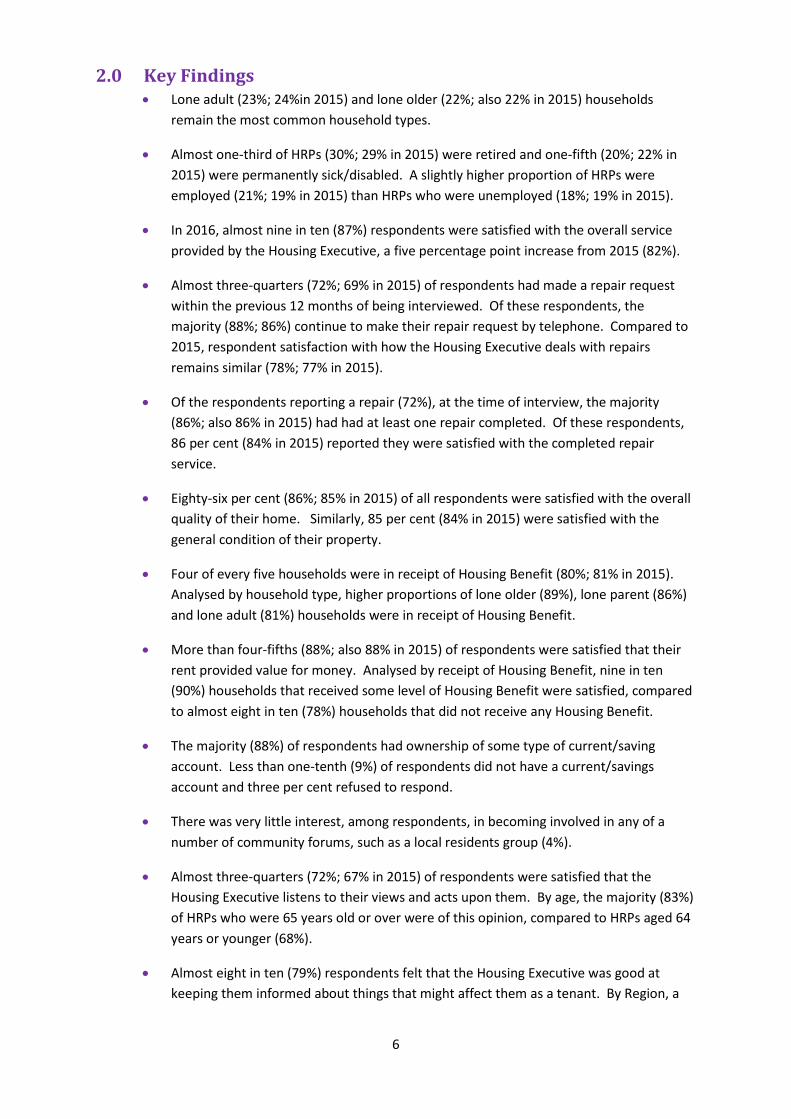
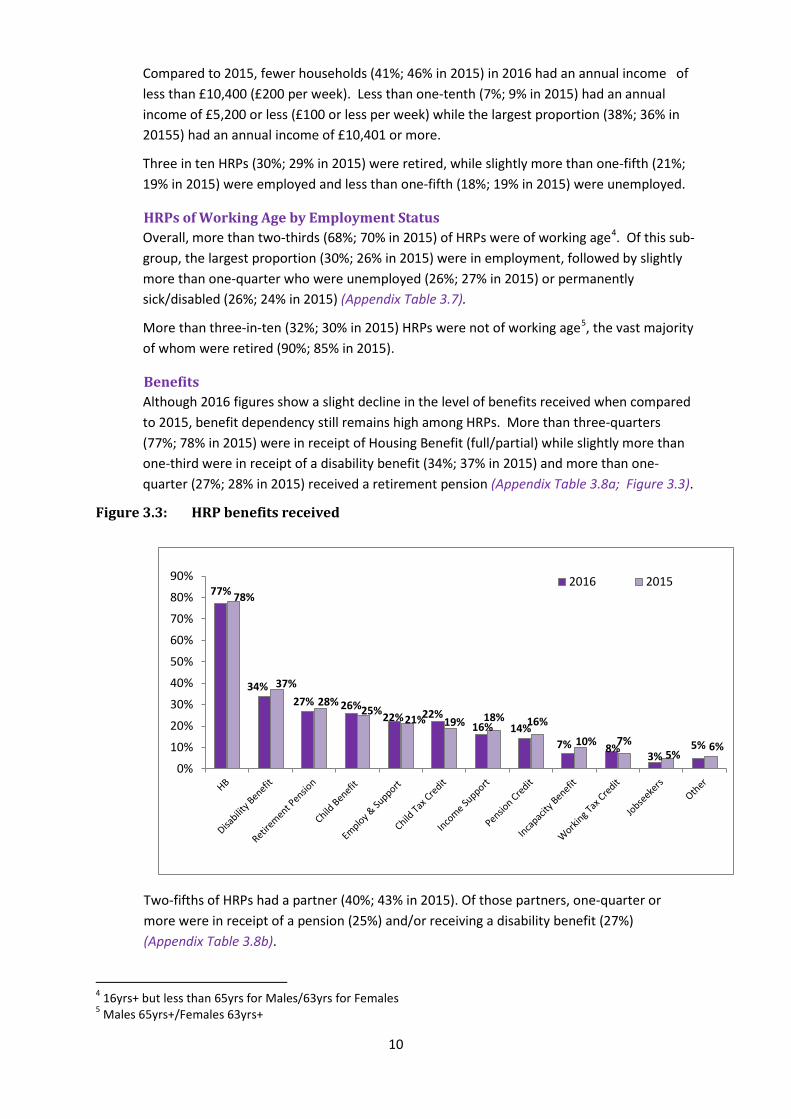
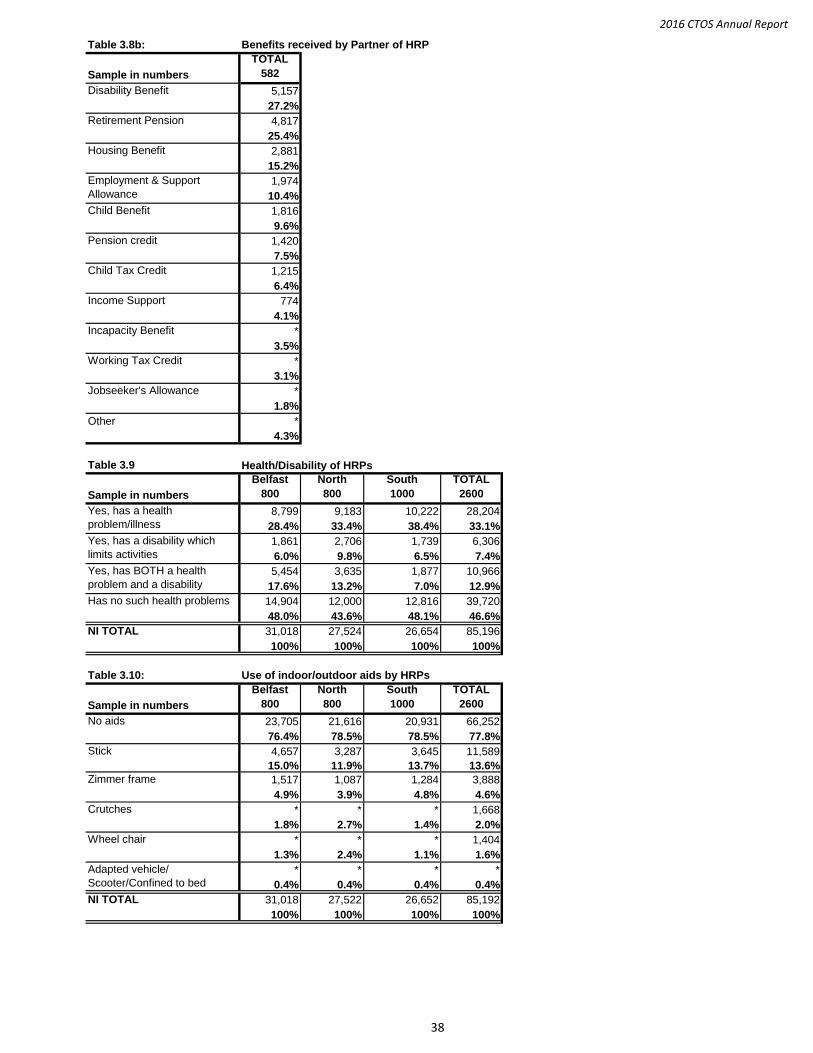
Benefits Although 2016 figures show a slight decline in the level of benefits received when compared to 2015, benefit dependency still remains high among HRPs. More than three-quarters (77%; 78% in 2015) were in receipt of Housing Benefit (full/partial) while slightly more than one-third were in receipt of a disability benefit (34%; 37% in 2015) and more than one-quarter (27%; 28% in 2015) received a retirement pension (Appendix Table 3.8a; Figure 3.3).
Figure 3.3: HRP benefits received
Two-fifths of HRPs had a partner (40%; 43% in 2015). Of those partners, one-quarter or more were in receipt of a pension (25%) and/or receiving a disability benefit (27%) (Appendix Table 3.8b).
4 16yrs+ but less than 65yrs for Males/63yrs for Females 5 Males 65yrs+/Females 63yrs+
11
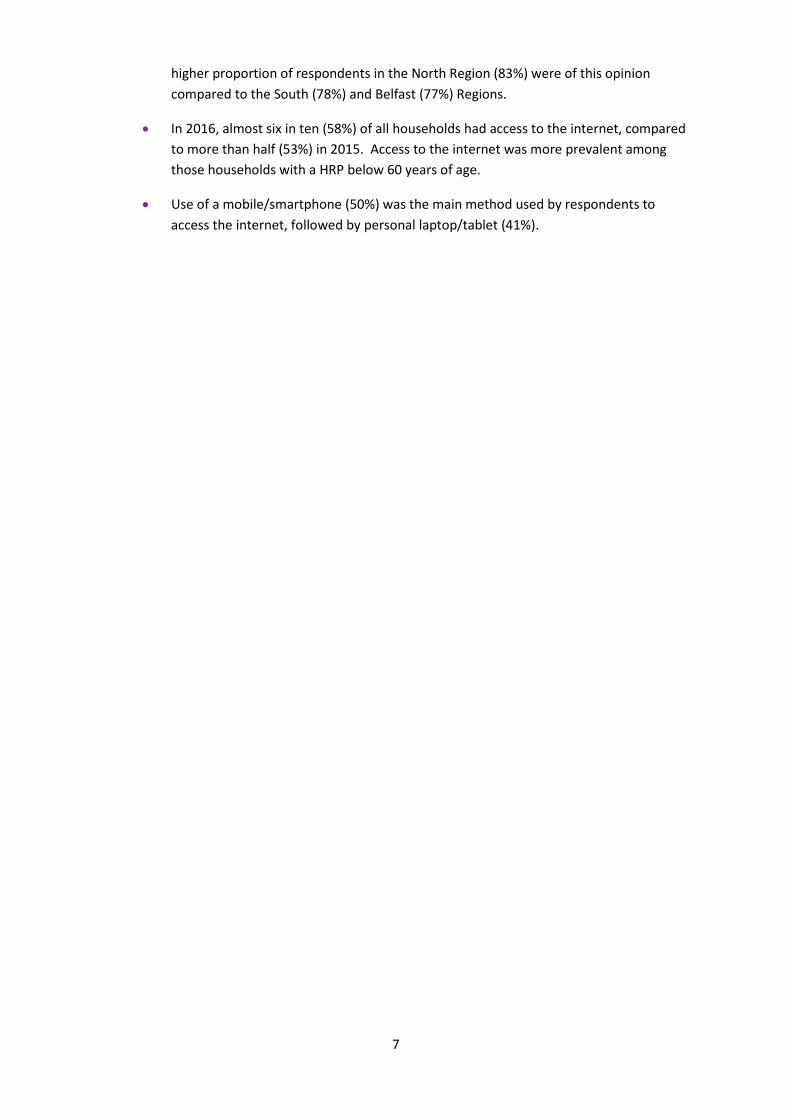
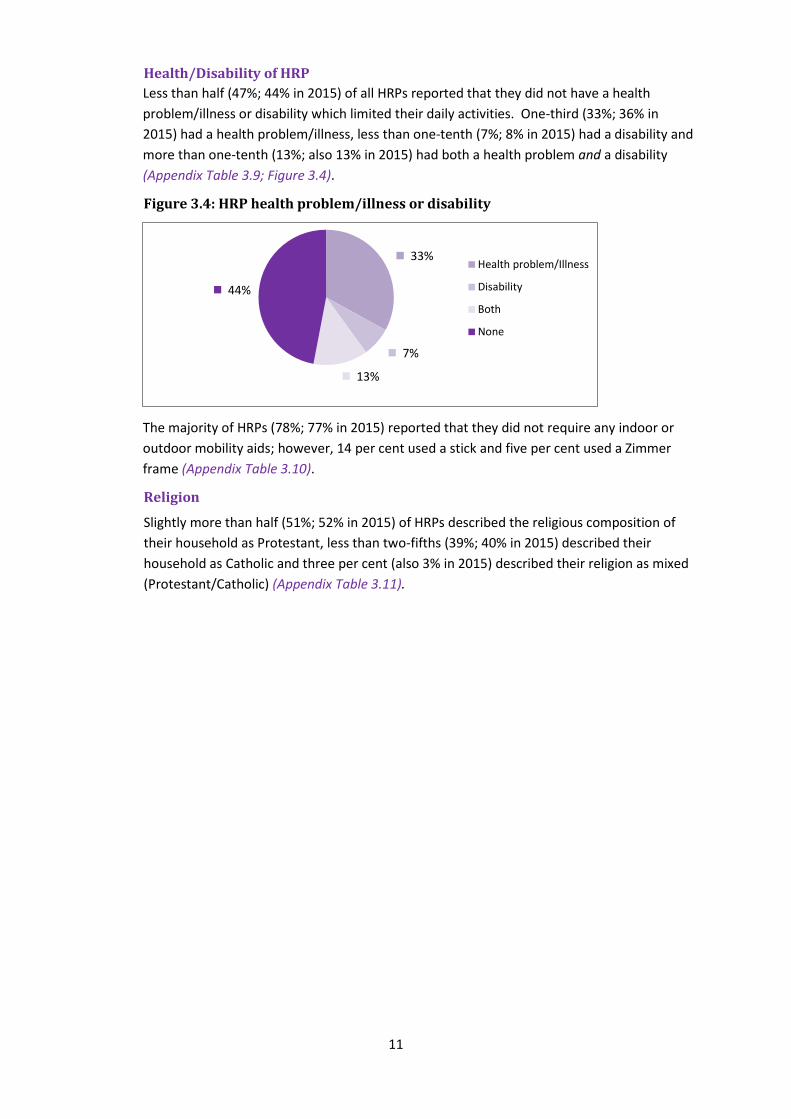
Health/Disability of HRP Less than half (47%; 44% in 2015) of all HRPs reported that they did not have a health problem/illness or disability which limited their daily activities. One-third (33%; 36% in 2015) had a health problem/illness, less than one-tenth (7%; 8% in 2015) had a disability and more than one-tenth (13%; also 13% in 2015) had both a health problem and a disability (Appendix Table 3.9; Figure 3.4).
Figure 3.4: HRP health problem/illness or disability
33%
7%
13%
44%
Health problem/Illness
Disability
Both
None
The majority of HRPs (78%; 77% in 2015) reported that they did not require any indoor or outdoor mobility aids; however, 14 per cent used a stick and five per cent used a Zimmer frame (Appendix Table 3.10).
Religion
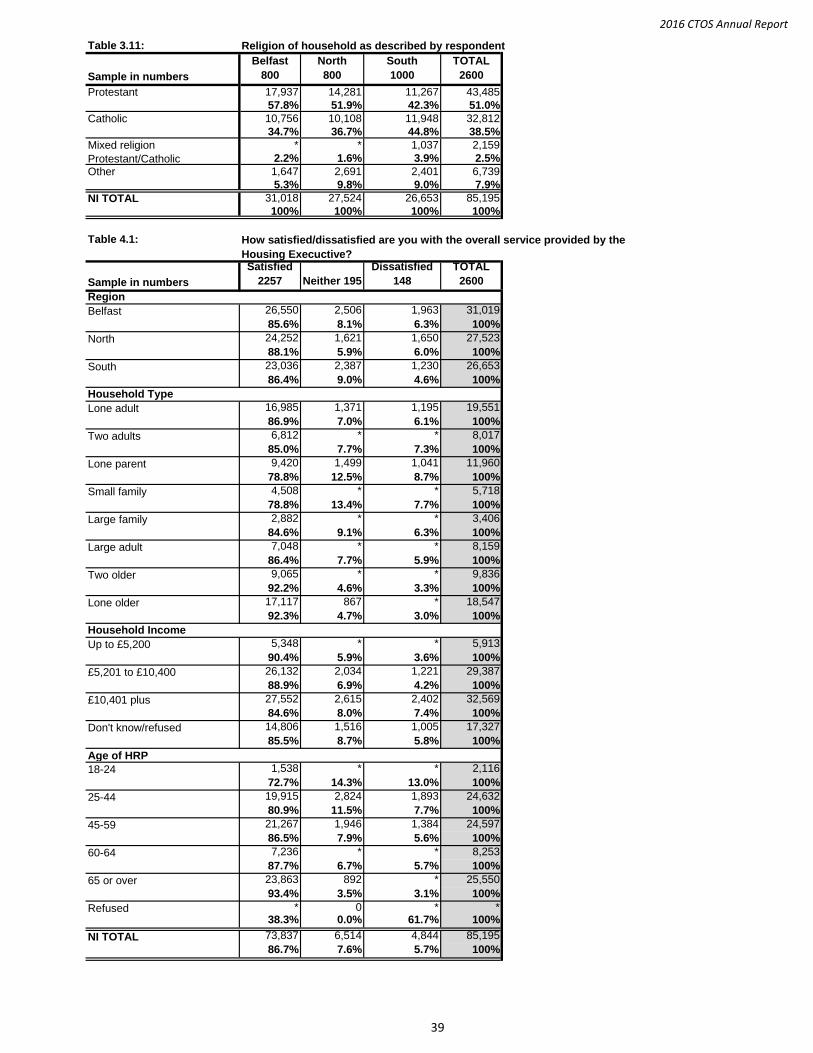
Slightly more than half (51%; 52% in 2015) of HRPs described the religious composition of their household as Protestant, less than two-fifths (39%; 40% in 2015) described their household as Catholic and three per cent (also 3% in 2015) described their religion as mixed (Protestant/Catholic) (Appendix Table 3.11).
12
4.0 Housing Executive Services
This chapter reports on tenants’ views of our overall service delivery and how tenants feel we performed in some key service areas.
4.1 OVERALL SERVICE PROVIDED BY THE HOUSING EXECUTIVE
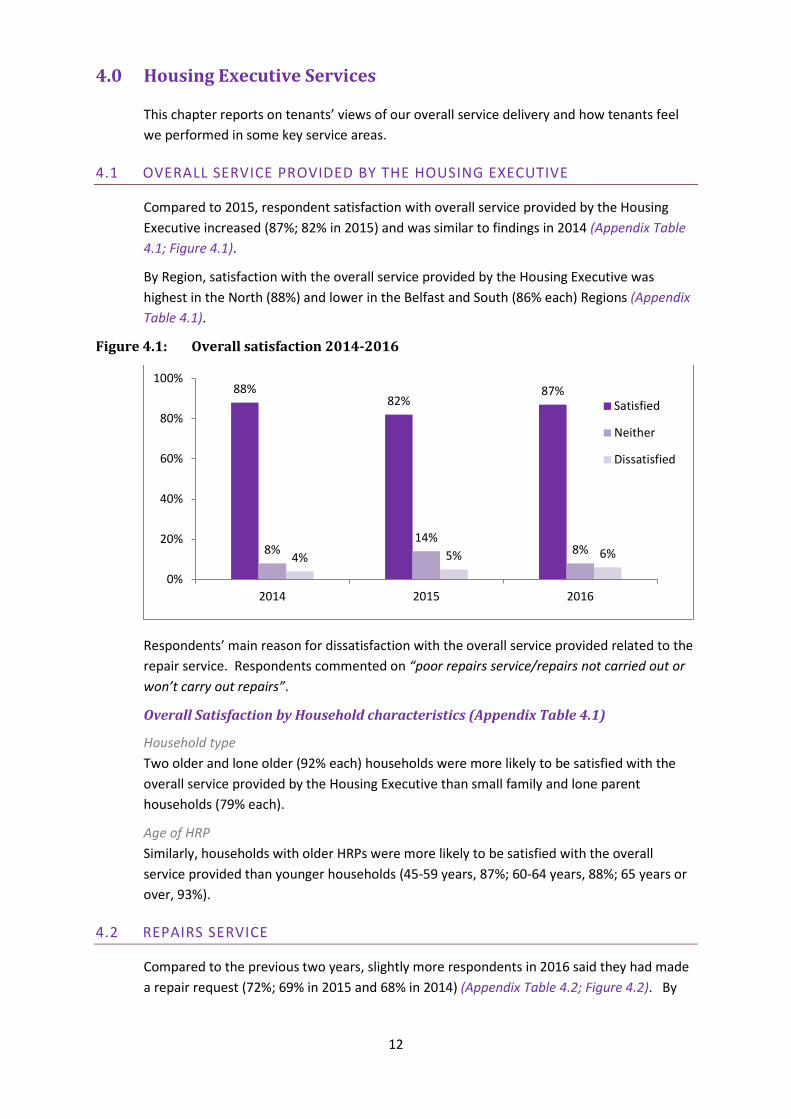
Compared to 2015, respondent satisfaction with overall service provided by the Housing Executive increased (87%; 82% in 2015) and was similar to findings in 2014 (Appendix Table 4.1; Figure 4.1).
By Region, satisfaction with the overall service provided by the Housing Executive was highest in the North (88%) and lower in the Belfast and South (86% each) Regions (Appendix Table 4.1).
Figure 4.1: Overall satisfaction 2014-2016
Respondents’ main reason for dissatisfaction with the overall service provided related to the repair service. Respondents commented on “poor repairs service/repairs not carried out or won’t carry out repairs”.
Overall Satisfaction by Household characteristics (Appendix Table 4.1)
Household type Two older and lone older (92% each) households were more likely to be satisfied with the overall service provided by the Housing Executive than small family and lone parent households (79% each).
Age of HRP Similarly, households with older HRPs were more likely to be satisfied with the overall service provided than younger households (45-59 years, 87%; 60-64 years, 88%; 65 years or over, 93%).
4.2 REPAIRS SERVICE
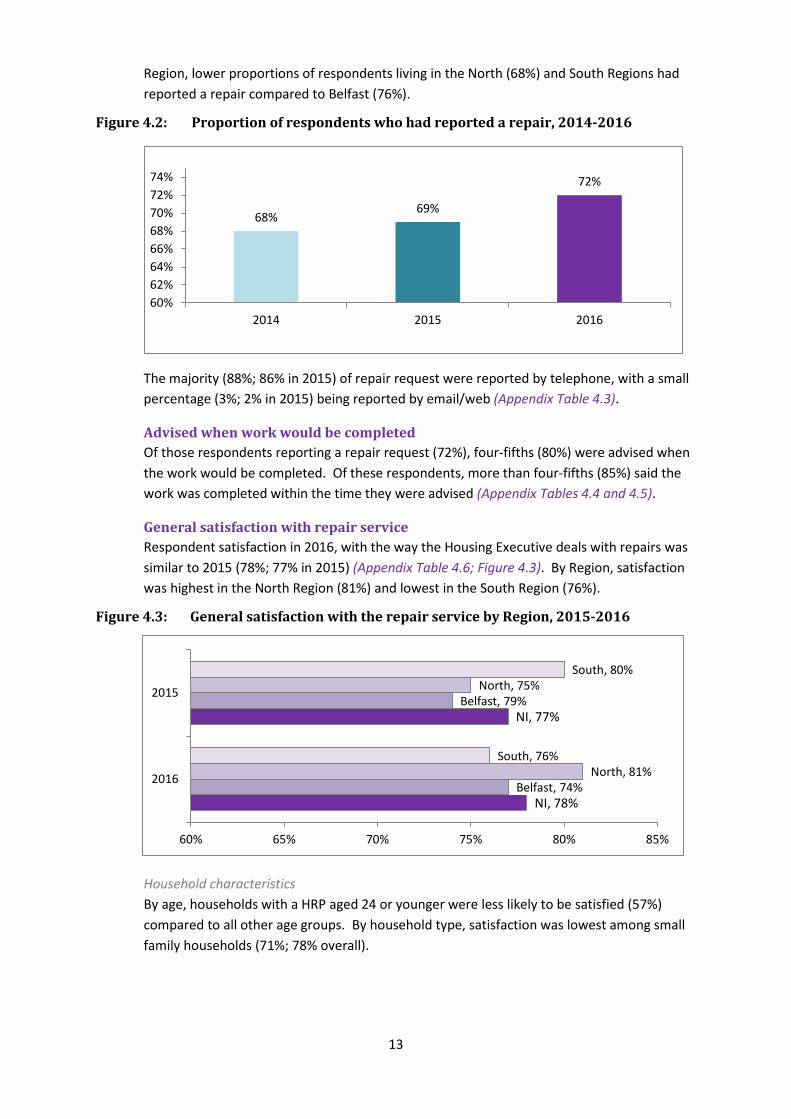
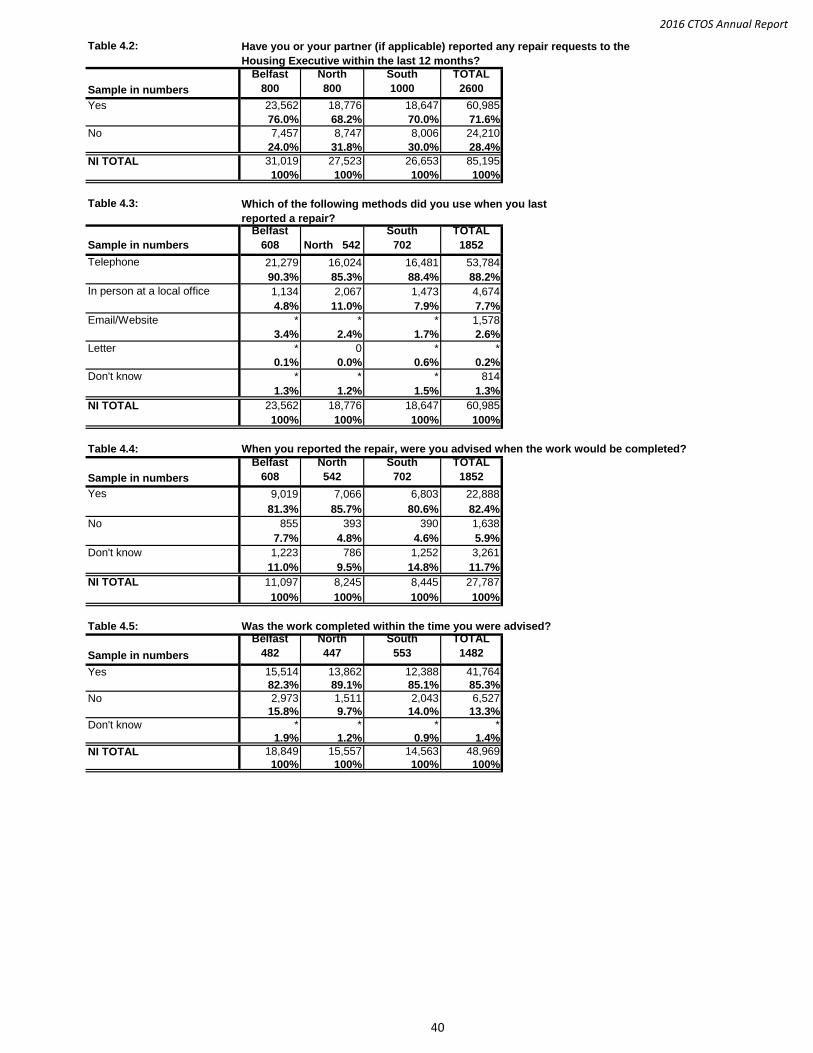
Compared to the previous two years, slightly more respondents in 2016 said they had made a repair request (72%; 69% in 2015 and 68% in 2014) (Appendix Table 4.2; Figure 4.2). By
88% 82%
87%
8% 14%
8% 4% 5% 6%
0%
20%
40%
60%
80%
100%
2014 2015 2016
Satisfied
Neither
Dissatisfied
13
74% 72% 72%
69% 70% 68% 68%66%64%62%60%
2014 2015 2016
Region, lower proportions of respondents living in the North (68%) and South Regions had reported a repair compared to Belfast (76%).
Figure 4.2: Proportion of respondents who had reported a repair, 2014-2016
The majority (88%; 86% in 2015) of repair request were reported by telephone, with a small percentage (3%; 2% in 2015) being reported by email/web (Appendix Table 4.3).
Advised when work would be completed Of those respondents reporting a repair request (72%), four-fifths (80%) were advised when the work would be completed. Of these respondents, more than four-fifths (85%) said the work was completed within the time they were advised (Appendix Tables 4.4 and 4.5).
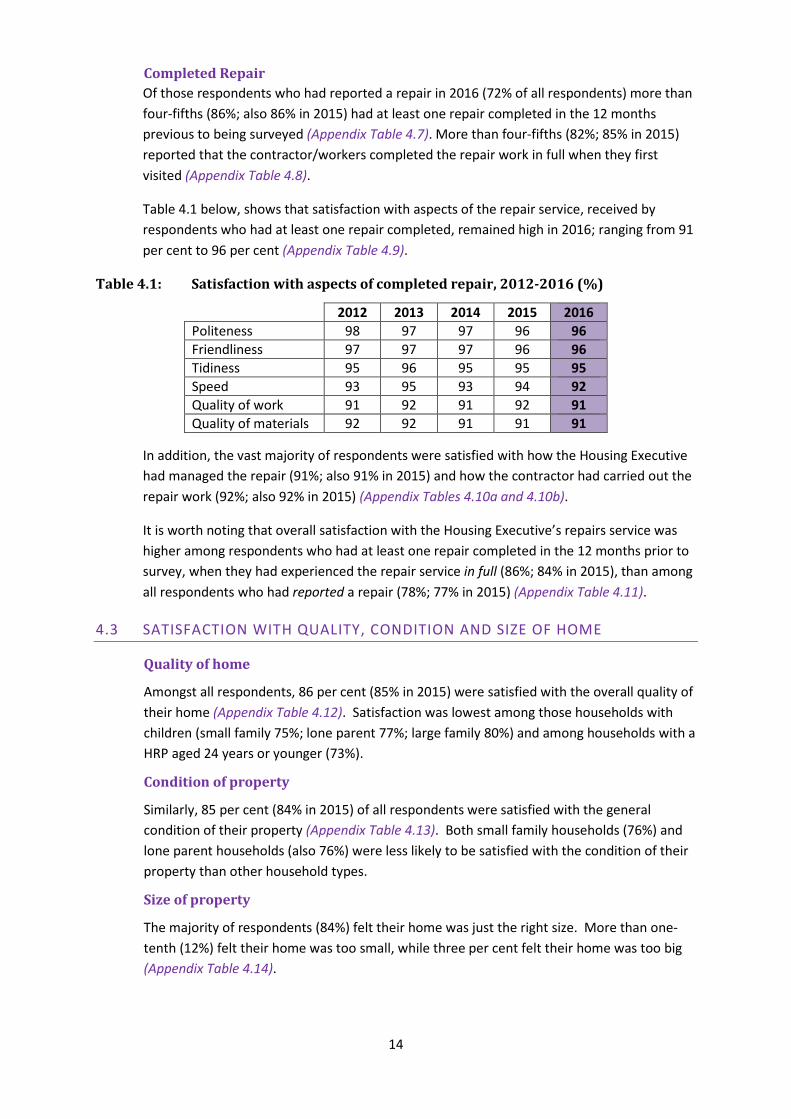
General satisfaction with repair service Respondent satisfaction in 2016, with the way the Housing Executive deals with repairs was similar to 2015 (78%; 77% in 2015) (Appendix Table 4.6; Figure 4.3). By Region, satisfaction was highest in the North Region (81%) and lowest in the South Region (76%).
Figure 4.3: General satisfaction with the repair service by Region, 2015-2016
NI, 78%
NI, 77%
Belfast, 74%
Belfast, 79%
North, 81%
North, 75%
South, 76%
South, 80%
60% 65% 70% 75% 80% 85%
2016
2015
Household characteristics By age, households with a HRP aged 24 or younger were less likely to be satisfied (57%) compared to all other age groups. By household type, satisfaction was lowest among small family households (71%; 78% overall).
14
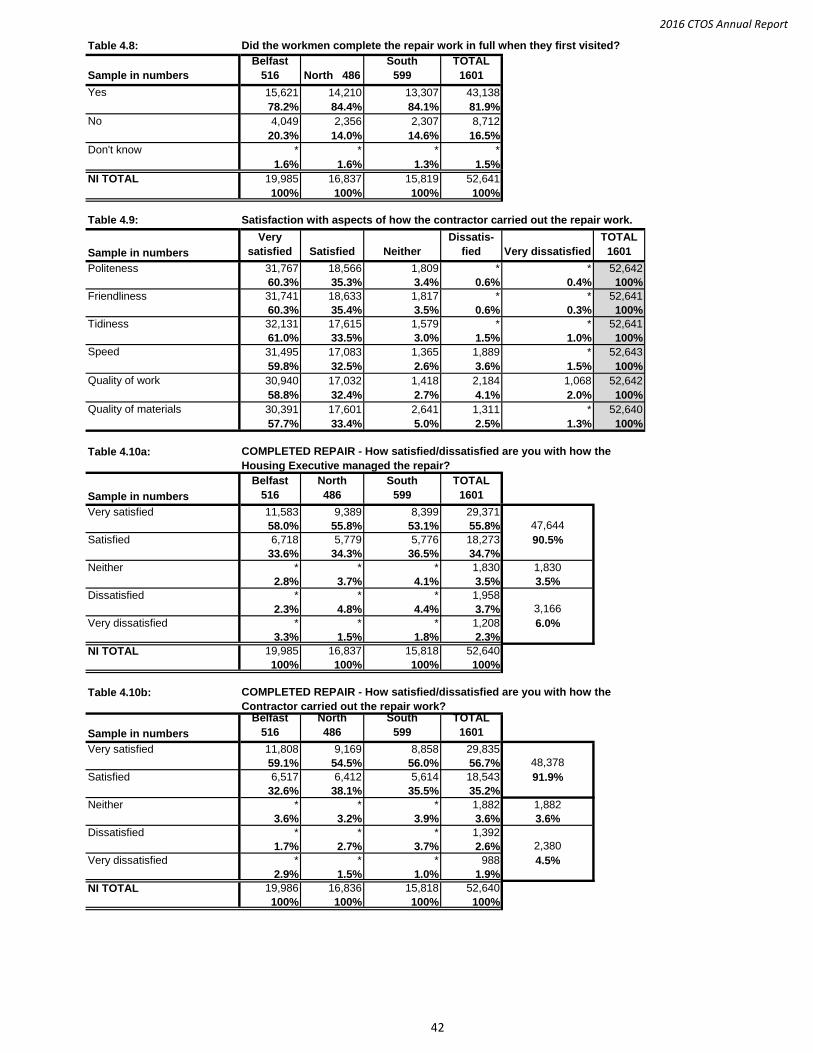
Completed Repair Of those respondents who had reported a repair in 2016 (72% of all respondents) more than four-fifths (86%; also 86% in 2015) had at least one repair completed in the 12 months previous to being surveyed (Appendix Table 4.7). More than four-fifths (82%; 85% in 2015) reported that the contractor/workers completed the repair work in full when they first visited (Appendix Table 4.8).
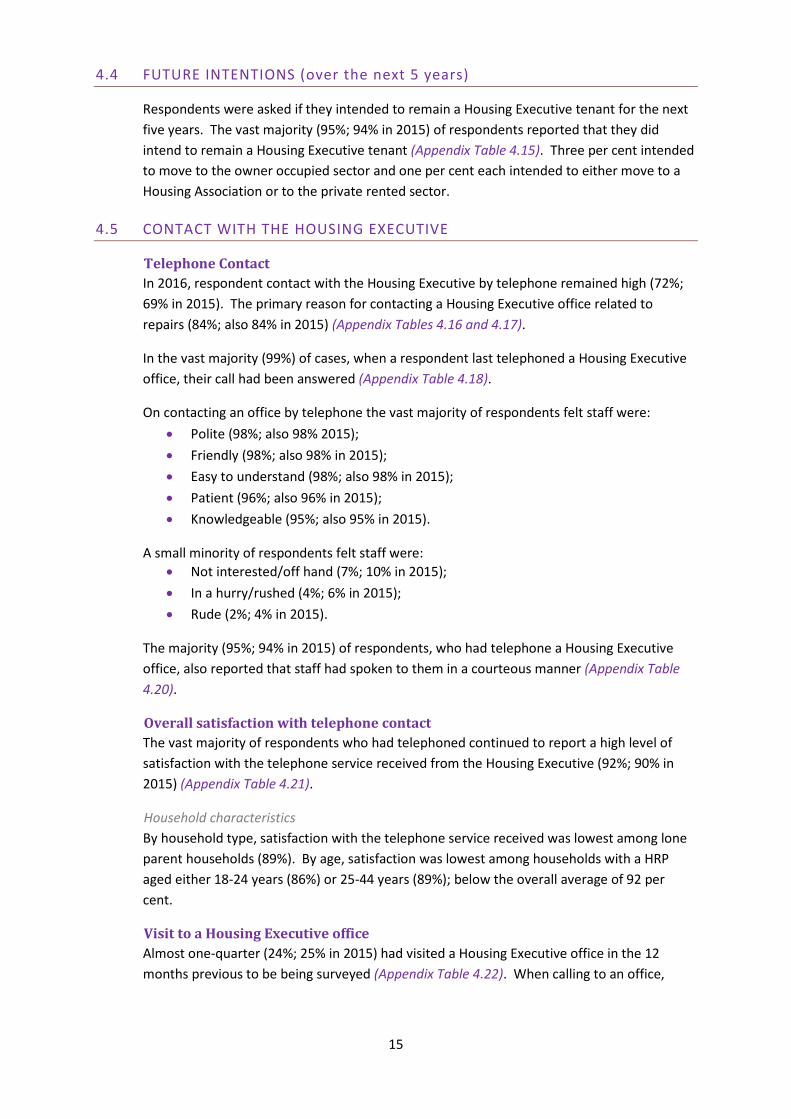
Table 4.1 below, shows that satisfaction with aspects of the repair service, received by respondents who had at least one repair completed, remained high in 2016; ranging from 91 per cent to 96 per cent (Appendix Table 4.9).
Table 4.1: Satisfaction with aspects of completed repair, 2012-2016 (%)
2012 2013 2014 2015 2016 Politeness 98 97 97 96 96 Friendliness 97 97 97 96 96 Tidiness 95 96 95 95 95 Speed 93 95 93 94 92 Quality of work 91 92 91 92 91 Quality of materials 92 92 91 91 91
In addition, the vast majority of respondents were satisfied with how the Housing Executive had managed the repair (91%; also 91% in 2015) and how the contractor had carried out the repair work (92%; also 92% in 2015) (Appendix Tables 4.10a and 4.10b).
It is worth noting that overall satisfaction with the Housing Executive’s repairs service was higher among respondents who had at least one repair completed in the 12 months prior to survey, when they had experienced the repair service in full (86%; 84% in 2015), than among all respondents who had reported a repair (78%; 77% in 2015) (Appendix Table 4.11).
.3 SATISFACTION WITH QUALITY, CONDITION AND SIZE OF HOME
Quality of home
Amongst all respondents, 86 per cent (85% in 2015) were satisfied with the overall quality of their home (Appendix Table 4.12). Satisfaction was lowest among those households with children (small family 75%; lone parent 77%; large family 80%) and among households with a HRP aged 24 years or younger (73%).
Condition of property
Similarly, 85 per cent (84% in 2015) of all respondents were satisfied with the general condition of their property (Appendix Table 4.13). Both small family households (76%) and lone parent households (also 76%) were less likely to be satisfied with the condition of their property than other household types.
Size of property
The majority of respondents (84%) felt their home was just the right size. More than one-tenth (12%) felt their home was too small, while three per cent felt their home was too big (Appendix Table 4.14).
4
15
4.4 FUTURE INTENTIONS (over the next 5 years)
Respondents were asked if they intended to remain a Housing Executive tenant for the next five years. The vast majority (95%; 94% in 2015) of respondents reported that they did intend to remain a Housing Executive tenant (Appendix Table 4.15). Three per cent intended to move to the owner occupied sector and one per cent each intended to either move to a Housing Association or to the private rented sector.
4.5 CONTACT WITH THE HOUSING EXECUTIVE
Telephone Contact In 2016, respondent contact with the Housing Executive by telephone remained high (72%; 69% in 2015). The primary reason for contacting a Housing Executive office related to repairs (84%; also 84% in 2015) (Appendix Tables 4.16 and 4.17).
In the vast majority (99%) of cases, when a respondent last telephoned a Housing Executive office, their call had been answered (Appendix Table 4.18).
On contacting an office by telephone the vast majority of respondents felt staff were: • Polite (98%; also 98% 2015); • Friendly (98%; also 98% in 2015); • Easy to understand (98%; also 98% in 2015); • Patient (96%; also 96% in 2015); • Knowledgeable (95%; also 95% in 2015).
A small minority of respondents felt staff were: • Not interested/off hand (7%; 10% in 2015); • In a hurry/rushed (4%; 6% in 2015); • Rude (2%; 4% in 2015).
The majority (95%; 94% in 2015) of respondents, who had telephone a Housing Executive office, also reported that staff had spoken to them in a courteous manner (Appendix Table 4.20).
Overall satisfaction with telephone contact The vast majority of respondents who had telephoned continued to report a high level of satisfaction with the telephone service received from the Housing Executive (92%; 90% in 2015) (Appendix Table 4.21).
Household characteristics By household type, satisfaction with the telephone service received was lowest among lone parent households (89%). By age, satisfaction was lowest among households with a HRP aged either 18-24 years (86%) or 25-44 years (89%); below the overall average of 92 per cent.
Visit to a Housing Executive office Almost one-quarter (24%; 25% in 2015) had visited a Housing Executive office in the 12 months previous to be being surveyed (Appendix Table 4.22). When calling to an office,
16
more than four-fifths of visitors (87%; 90% in 2015) had waited less than 15 minutes to be attended to by staff (56% in less than 5 minutes; 53% in 2015) (Appendix Table 4.23).
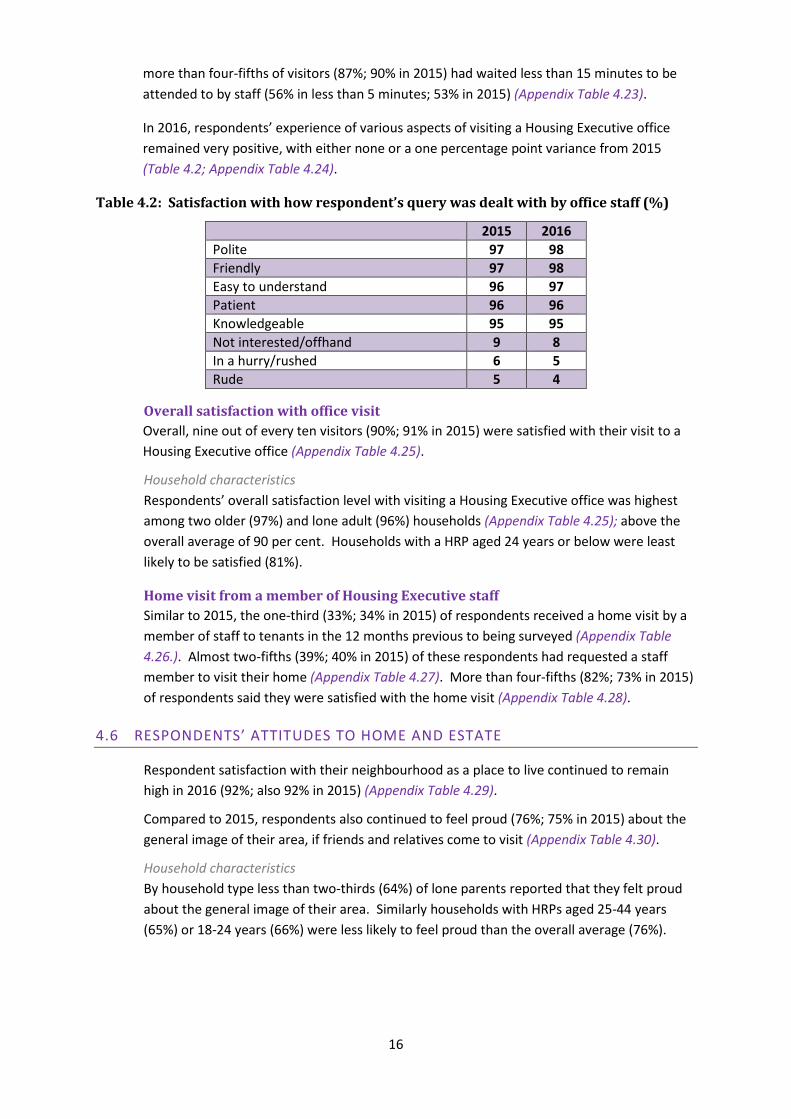
In 2016, respondents’ experience of various aspects of visiting a Housing Executive office remained very positive, with either none or a one percentage point variance from 2015 (Table 4.2; Appendix Table 4.24).
Table 4.2: Satisfaction with how respondent’s query was dealt with by office staff (%)
2015 2016 Polite 97 98 Friendly 97 98 Easy to understand 96 97 Patient 96 96 Knowledgeable 95 95 Not interested/offhand 9 8 In a hurry/rushed 6 5 Rude 5 4
Overall satisfaction with office visit Overall, nine out of every ten visitors (90%; 91% in 2015) were satisfied with their visit to a Housing Executive office (Appendix Table 4.25).
Household characteristics Respondents’ overall satisfaction level with visiting a Housing Executive office was highest among two older (97%) and lone adult (96%) households (Appendix Table 4.25); above the overall average of 90 per cent. Households with a HRP aged 24 years or below were least likely to be satisfied (81%).
Home visit from a member of Housing Executive staff Similar to 2015, the one-third (33%; 34% in 2015) of respondents received a home visit by a member of staff to tenants in the 12 months previous to being surveyed (Appendix Table 4.26.). Almost two-fifths (39%; 40% in 2015) of these respondents had requested a staff member to visit their home (Appendix Table 4.27). More than four-fifths (82%; 73% in 2015) of respondents said they were satisfied with the home visit (Appendix Table 4.28).
4.6 RESPONDENTS’ ATTITUDES TO HOME AND ESTATE
Respondent satisfaction with their neighbourhood as a place to live continued to remain high in 2016 (92%; also 92% in 2015) (Appendix Table 4.29).
Compared to 2015, respondents also continued to feel proud (76%; 75% in 2015) about the general image of their area, if friends and relatives come to visit (Appendix Table 4.30).
Household characteristics By household type less than two-thirds (64%) of lone parents reported that they felt proud about the general image of their area. Similarly households with HRPs aged 25-44 years (65%) or 18-24 years (66%) were less likely to feel proud than the overall average (76%).

17
Location
Households in Belfast (67%; 70% in 2015) were least likely to feel a sense of pride about the general image of their area in 2016; nine percentage points below the overall average (76%), (Appendix Table 4.30).
5.0 Housing Benefit, Rent Payments and Financial Inclusion
The 2016 CTOS continued to ask questions regarding tenant uptake of Housing Benefit, rent payment and access to financial products. The results provide valuable insight which informs strategies aimed at providing better quality services and support when needed to Housing Executive tenants. What follows is an analysis of 2016 findings by household characteristics and location and, where appropriate, comparisons with the 2015 CTOS.
5.1 HOUSING BENEFIT
Housing Benefit status 6 There continues to be a high level (80%; 81% in 2015) of Housing Executive households in receipt of Housing Benefit.
Housing Benefit status - Household Characteristics (Appendix Table 5.1)
Household Income • As expected, households with an income of £10,400 or below were more likely to be in
receipt of Housing Benefit (up to £5,200, 91%; between £5,201 and £10,400, also 91%) than those households with an income of £10,401 or more (68%).
Household type • The proportion of lone older (89%) and lone parent (86%) households were above the
overall average (80%) of households in receipt of Housing Benefit.
• Two adult (67%) households were least likely of all households to receive Housing Benefit.
Location • Households living in the Belfast Region were least likely to receive Housing Benefit
(78%; 79% in 2015), compared to those households living in either the South (79%; also 79% in 2015) or North Region (82%; 84% in 2015) Regions.
Housing Benefit service provided The vast majority (96%) of Housing Benefit recipients were satisfied with the service provided (Appendix Table 5.2). Overall, large family households (89%) were least likely to be satisfied with the Housing Benefit service.
5.2 RENT PAYMENTS
All respondents were asked if they had any difficulty making their rent payment during the previous 12 months before interview. Whilst more than two-thirds (68%; 67% in 2015) of respondents reported that they were in receipt of full Housing Benefit and therefore were not subject to rent payments, a small proportion (5%; also 5% in 2015) reported that, in the past 12 months, they had experienced difficulty in paying their rent. The remaining 27 per
6 The CTOS Housing Benefit figures rely on respondents accurately reporting their circumstances. However, they are broadly in line with Housing Executive operational figures.
18
cent (28% in 2015) had not experienced any difficultly in paying their rent during the same period (Appendix Tables 5.3).
Paying rent by direct debit/standing order Of the households that did pay some level of rent (32%), less than one-sixth (approximately 3,900 households) reported having experienced difficulty in making their rent payment within the last 12 months (Appendix 5.4a).
The main reasons why respondents were experiencing difficulty in making their rent payments related to (Appendix 5.4b):
• Low income/benefit dependency; • Unexpected ‘other’ bills; • Illness i.e. loss of earnings; • Rent arrears; and • Unemployment.
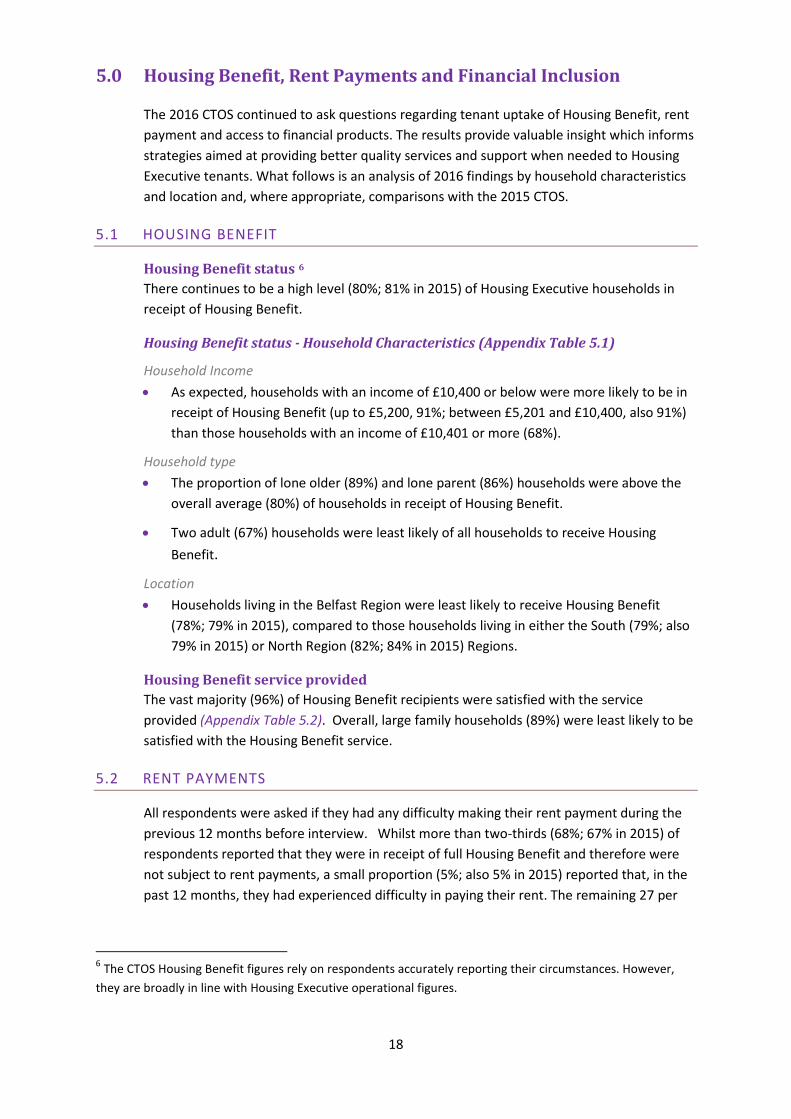
Satisfaction that rent provides value for money In 2016, satisfaction that rent provides value for money remained the same as in 2015 at 88 per cent (Figure 5.1; Appendix Table 5.5).
Figure 5.1: Satisfaction that rent provides value for money, 2015-2016
2015 88% 7% 5%
2016 88% 6% 7%
70% 80% 90% 100%
Satisfied Neither Dissatisfied
Satisfaction that rent provides value for money – Household Characteristics
Age of HRP
• Households with a HRP aged 45+ years (45-59 years, 87%; 60-64 years, 91%; 65+ years, 92%) were more likely to be satisfied that their rent provides value for money compared to households with a younger HRP (18-24 years, 82%; 25-44 years, 83%).
Household type • Lone parent (81%), large family (83%) and two adult (84%) households were least likely
to satisfied that their rent provides value for money.
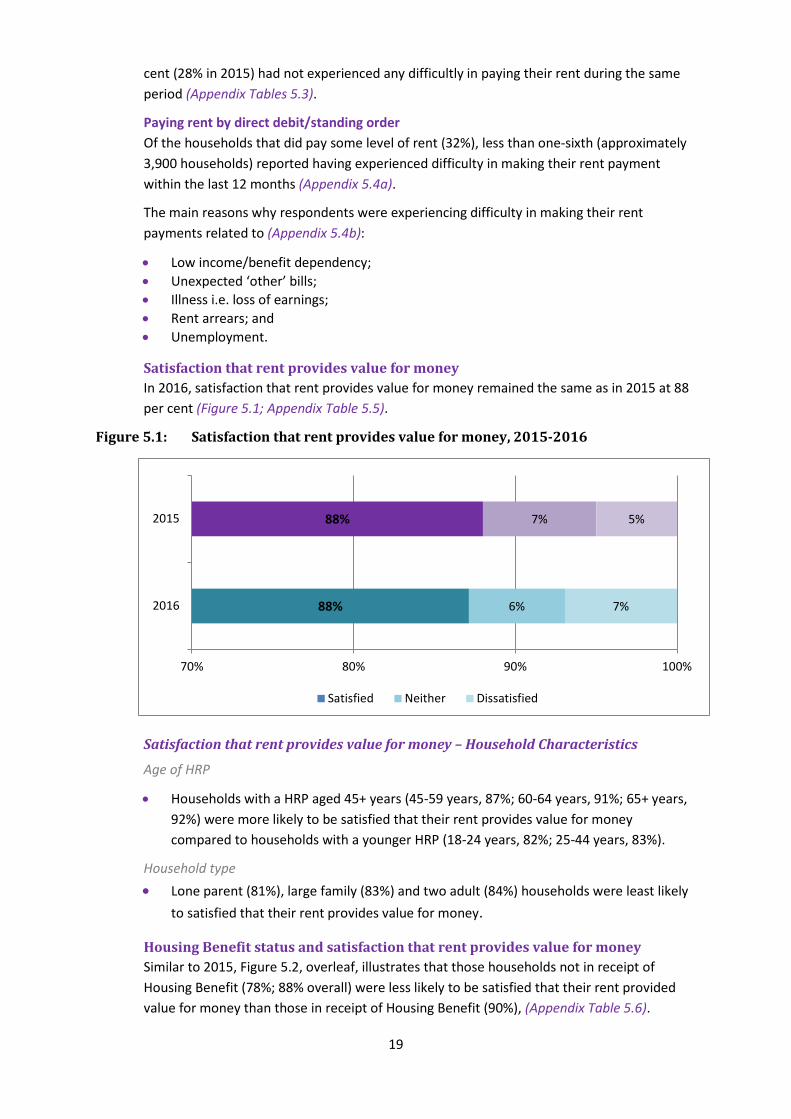
Housing Benefit status and satisfaction that rent provides value for money Similar to 2015, Figure 5.2, overleaf, illustrates that those households not in receipt of Housing Benefit (78%; 88% overall) were less likely to be satisfied that their rent provided value for money than those in receipt of Housing Benefit (90%), (Appendix Table 5.6).
19
20
Figure 5.2: Satisfaction that rent provides value for money by Housing Benefit status
5.3 FINANCIAL INCLUSION
Current and/or savings account ownership Respondents were asked about their ownership of particular current or savings accounts.
Overall, more than four-fifths (88%) of respondents had some kind of current and/or savings account; although almost one-tenth (9%) did not have either of these account types (Appendix Table 5.7).
Current and/or savings account ownership - Household Characteristics
Household Type • Lone older (83%) and two older (85%) households were below the overall average (88%)
of households with a current and/or savings account. • Current and/or savings account ownership was highest amongst small family (94%) and
lone parent households (93%).
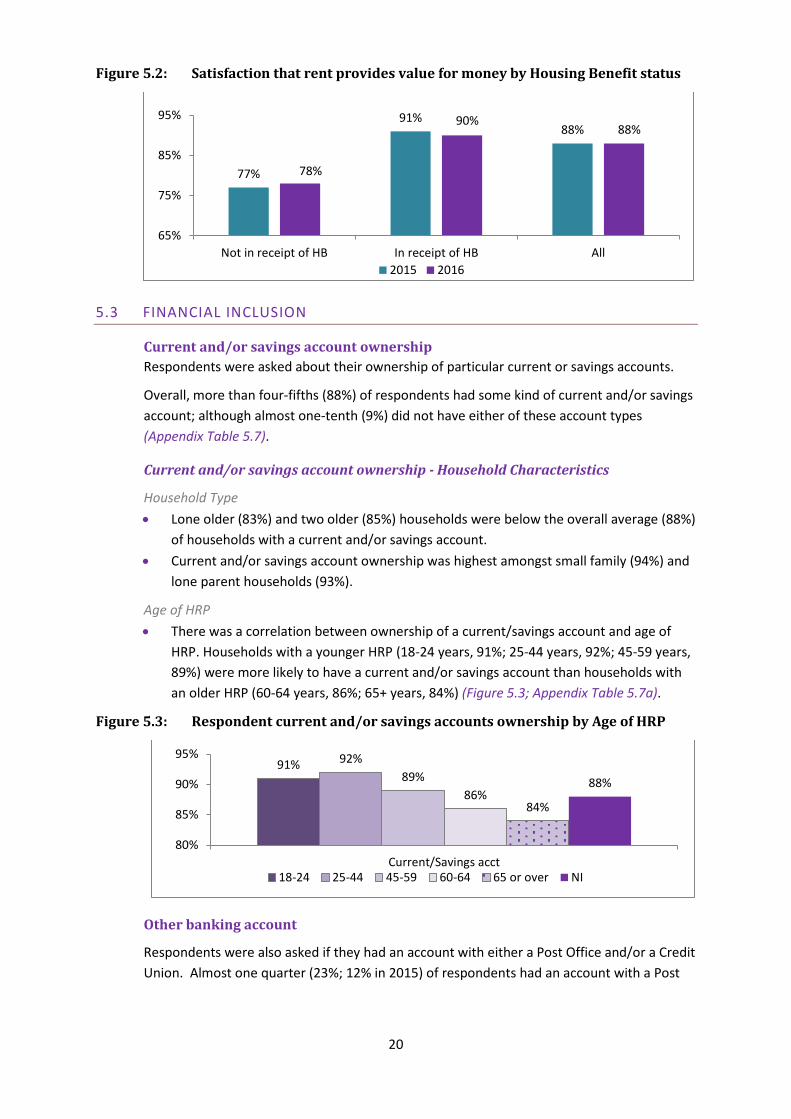
Age of HRP • There was a correlation between ownership of a current/savings account and age of
HRP. Households with a younger HRP (18-24 years, 91%; 25-44 years, 92%; 45-59 years, 89%) were more likely to have a current and/or savings account than households with an older HRP (60-64 years, 86%; 65+ years, 84%) (Figure 5.3; Appendix Table 5.7a).
Figure 5.3: Respondent current and/or savings accounts ownership by Age of HRP
95% 92% 91% 89% 90% 88%
86% 84% 85%
80%Current/Savings acct
18-24 25-44 45-59 60-64 65 or over NI
Other banking account
Respondents were also asked if they had an account with either a Post Office and/or a Credit Union. Almost one quarter (23%; 12% in 2015) of respondents had an account with a Post
77%
91% 88%
78%
90% 88%
65%
75%
85%
95%
Not in receipt of HB In receipt of HB All2015 2016
21
Office and less than one-tenth (7%; 6% in 2015) had an account with a Credit Union (Appendix Table 5.7b).
Debit payment card and/or credit card ownership
Almost two-thirds (63%; 62% in 2015) of respondents had a debit payment card and/or credit card; the remainder (38%) had no such products or refused to respond (Appendix Table 5.8).
Debit payment card and/or credit card ownership – Household Characteristics
Age of HRP • Those respondents living in households with HRPs in the younger age groups (18-24 year
olds and 25 to 44 year olds) were more likely (both 76%; 63% overall) to have a debit payment card and/or credit card than those living in households with older HRPs (65 years or over, 46%; 17 percentage points below the overall average of 63%).
Household Income • There was a correlation between household income and ownership of a debit payment
card and/or credit card in that those respondents living in higher income households (£10,401 or more) were more likely (73%) to have such products than those respondents living in the lowest income households (£5,200 or less or £5,201 - £10,400, both 58%).
Household Type • Both small family and lone parent (79% each) households had a higher level of debit
payment card and/or credit card ownership than other households.
• Half or less of two older (50%) and lone older (47%) households were least likely to have owned a payment card and/or credit card.
Location • Debit payment card and/or credit card ownership was highest amongst respondents in
the South (67%) Region followed by respondents living in the North (61%) and Belfast (60%) Regions.
Rent Payment by Direct Debit or Standing Order (Appendix Table 5.9 – 5.11)
Respondents were asked if they paid their rent by direct debit or standing order. Almost seven in ten (69%) respondents reported that they were in receipt of full Housing Benefit (Appendix Table 5.9)7 and therefore did not pay rent. Of those households that did pay some level of rent (31% of all respondents), almost one-third (31%) paid their rent by Direct Debit or Standing Order; a ten percentage point decreased from the previous year.
More than half (69%; 59% in 2015) did not pay their rent by Direct Debit or Standing Order. The main reason given for not using these payment methods was that they preferred to budget by cash (81%; 72% in 2015). However, one-tenth (10%; 11% in 2015) of this sub-group said they would consider this method of payment in the future (Appendix Tables 5.10 – 5.12).
7 There is a one percentage point variance in the proportion of respondents who had previously reported to be in receipt of full Housing Benefit when asked about their rent payments (see 4.2).
22
Home contents insurance While one-quarter (25%; 26% in 2015) of respondents said the contents of their home were insured, slightly more than seven-in-ten (72%) reported that they did not have a home contents insurance; a small percentage (3%) did not know (Appendix Table 5.13).
Reasons why respondents did not have home contents insurance included (Appendix Table 5.14):
• Had not got round to getting insurance (42%); • Quotes received were too expensive (32%); • Don’t think I need insurance (21%); and • Don’t know how to get insurance (3%).
23
6.0 Tenant involvement, consultation and communication
Landlord Services Mission Statement is “To provide our customers with good quality services/support when they need it.” The Housing Executive encourages tenants, and their representatives, to become actively involved and participate in the decision making process in the delivery of housing services.
In 2016 the CTOS included a number of new questions regarding tenant involvement, or becoming involved, in various tenant participation opportunities, as well as respondents’ views on how well the Housing Executive consults and communicates with its tenants. What follows is an examination of the 2016 findings by location and household characteristics.
6.1 TENANT INVOLVEMENT
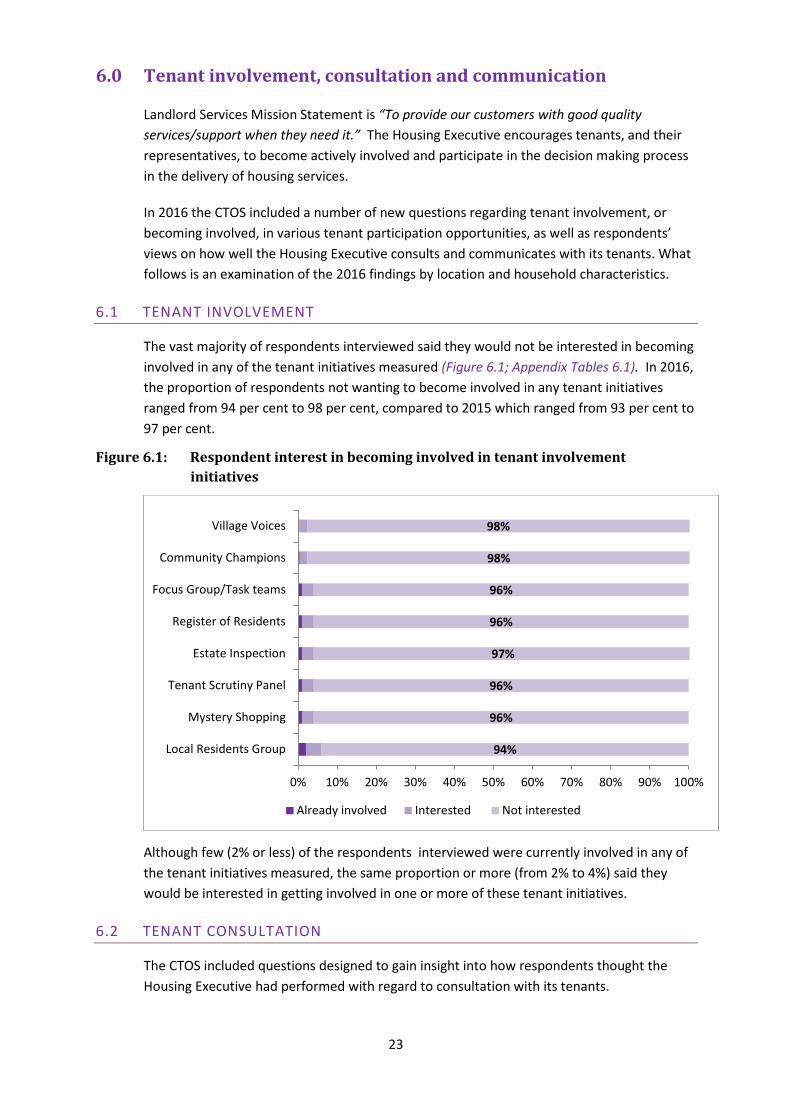
The vast majority of respondents interviewed said they would not be interested in becoming involved in any of the tenant initiatives measured (Figure 6.1; Appendix Tables 6.1). In 2016, the proportion of respondents not wanting to become involved in any tenant initiatives ranged from 94 per cent to 98 per cent, compared to 2015 which ranged from 93 per cent to 97 per cent.
Figure 6.1: Respondent interest in becoming involved in tenant involvement initiatives
Although few (2% or less) of the respondents interviewed were currently involved in any of the tenant initiatives measured, the same proportion or more (from 2% to 4%) said they would be interested in getting involved in one or more of these tenant initiatives.
6.2 TENANT CONSULTATION
The CTOS included questions designed to gain insight into how respondents thought the Housing Executive had performed with regard to consultation with its tenants.
94%
96%
96%
97%
96%
96%
98%
98%
0% 10% 20% 30% 40% 50% 60% 70% 80% 90% 100%
Local Residents Group
Mystery Shopping
Tenant Scrutiny Panel
Estate Inspection
Register of Residents
Focus Group/Task teams
Community Champions
Village Voices
Already involved Interested Not interested
24
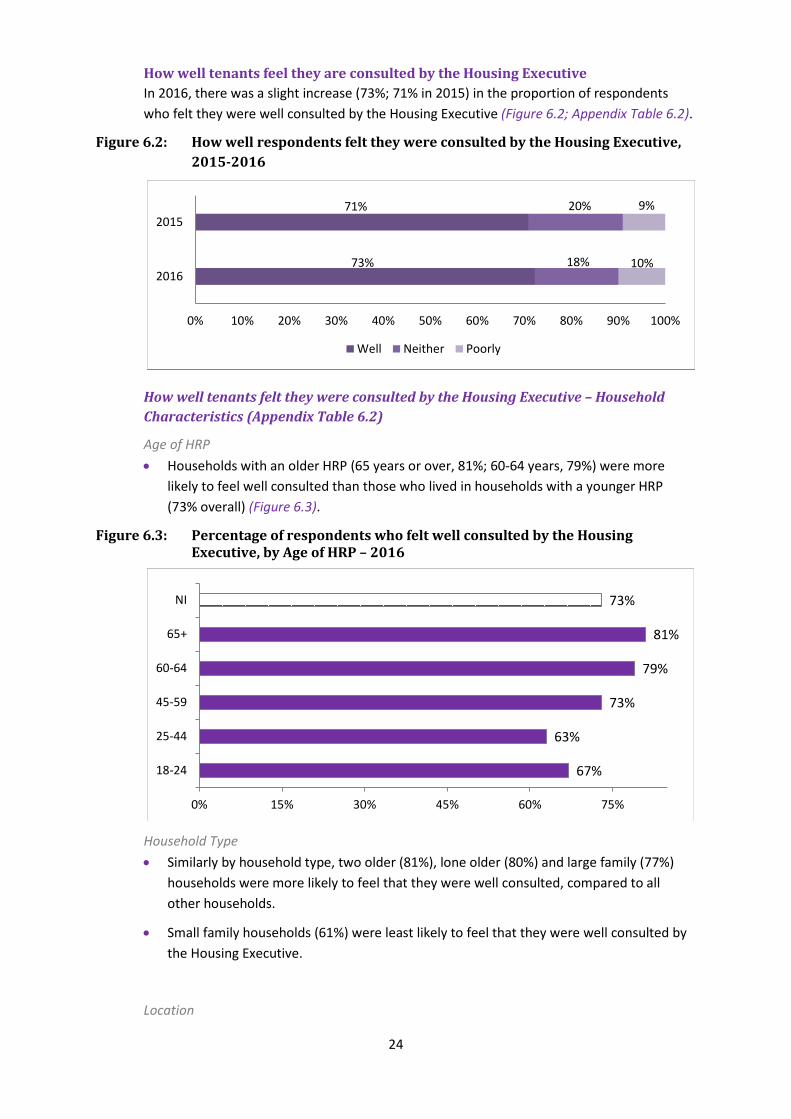
How well tenants feel they are consulted by the Housing Executive In 2016, there was a slight increase (73%; 71% in 2015) in the proportion of respondents who felt they were well consulted by the Housing Executive (Figure 6.2; Appendix Table 6.2).
Figure 6.2: How well respondents felt they were consulted by the Housing Executive, 2015-2016
How well tenants felt they were consulted by the Housing Executive – Household Characteristics (Appendix Table 6.2)
Age of HRP • Households with an older HRP (65 years or over, 81%; 60-64 years, 79%) were more
likely to feel well consulted than those who lived in households with a younger HRP (73% overall) (Figure 6.3).
Figure 6.3: Percentage of respondents who felt well consulted by the Housing Executive, by Age of HRP – 2016
NI 73%
65+ 81%
60-64 79%
45-59 73%
25-44 63%
18-24 67%
0% 15% 30% 45% 60% 75%
Household Type • Similarly by household type, two older (81%), lone older (80%) and large family (77%)
households were more likely to feel that they were well consulted, compared to all other households.
• Small family households (61%) were least likely to feel that they were well consulted by the Housing Executive.
Location
73%
71%
18%
20%
10%
9%
0% 10% 20% 30% 40% 50% 60% 70% 80% 90% 100%
2016
2015
Well Neither Poorly
25
• Almost four-fifths (79%; 6 percentage points above the overall average of 73%) of respondents living in the North Region said they were well consulted, compared with 71 per cent in the South Region and 69 per cent in the Belfast Region.
Satisfaction that the Housing Executive listens and acts upon views– Household Characteristics (Appendix Table 6.3) More than seven in ten (72%; 67% in 2015 and 72% in 2014) respondents were satisfied that the Housing Executive listens to tenants’ views and acts upon them.
Age of HRP • Respondents living in households with a HRP aged 65 or over (83%) were most likely to
be satisfied, while households with a HRP aged 18-24 years (62%) were the least satisfied of all households.
Household Type • More than eight in ten lone older (83%) and two older (81%) households were satisfied,
compared to six in ten (60%) of lone parent households (72% overall average).
Location • Respondents living in the Belfast Region were less likely to be satisfied that the Housing
Executive listens to their views and acts upon them (68%) than those living in the South (73%) and North (77%) Regions.
6.3 COMMUNICATION
The 2016 CTOS included questions on how the Housing Executive communicates with tenants. Where possible, comparisons have been made with findings from previous years.
Newsletter –Streets Ahead In the first instance, respondents were asked whether they were aware of the Housing Executive’s newsletter, Streets Ahead (formerly Housing News), which is sent to tenants on an annual basis. Respondents’ awareness of the Housing Executive newsletter remained the same as in 2015 (79% in both years); a slight increase from 2014 (77%), (Appendix Table 6.4).
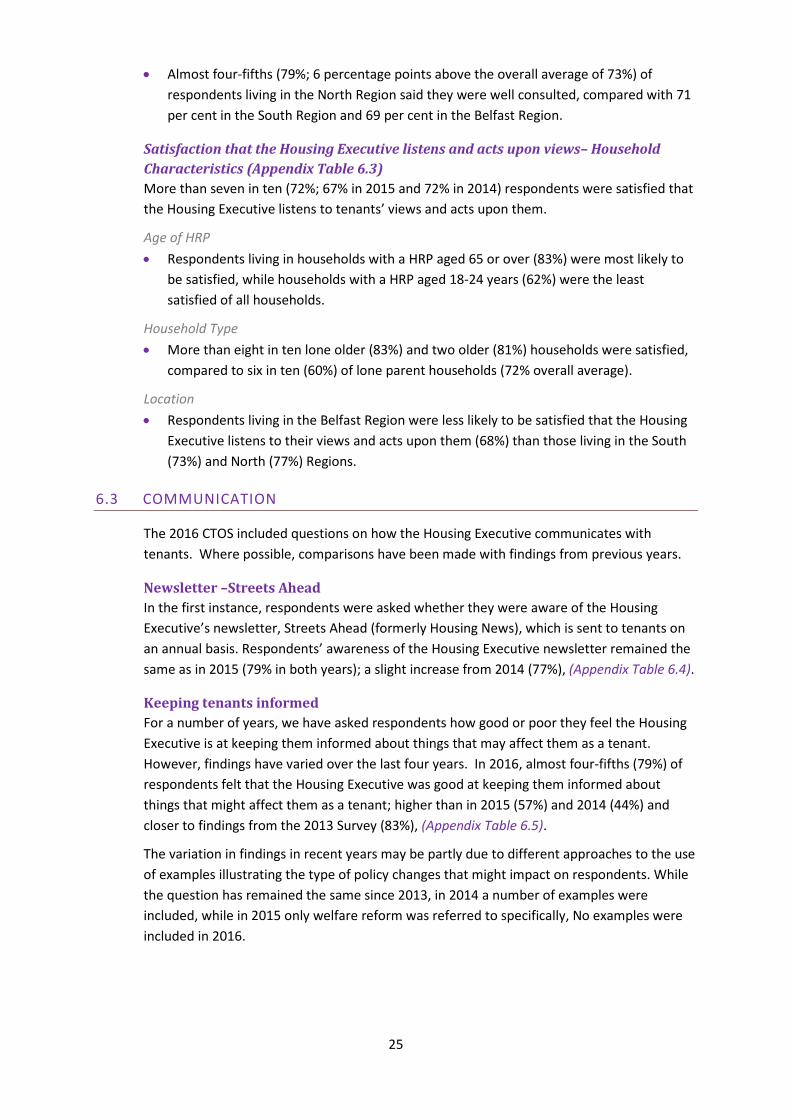
Keeping tenants informed For a number of years, we have asked respondents how good or poor they feel the Housing Executive is at keeping them informed about things that may affect them as a tenant. However, findings have varied over the last four years. In 2016, almost four-fifths (79%) of respondents felt that the Housing Executive was good at keeping them informed about things that might affect them as a tenant; higher than in 2015 (57%) and 2014 (44%) and closer to findings from the 2013 Survey (83%), (Appendix Table 6.5).
The variation in findings in recent years may be partly due to different approaches to the use of examples illustrating the type of policy changes that might impact on respondents. While the question has remained the same since 2013, in 2014 a number of examples were included, while in 2015 only welfare reform was referred to specifically, No examples were included in 2016.
26
Figure 6.4: Extent to which respondents felt the Housing Executive was good at keeping them informed about things that might affect them, 2013-2016
Keeping tenants informed – Household Characteristics (Appendix Table 6.5)
Household Income • By household income, there was some variance in opinion. Households on a higher
income bracket (£10,401 plus, 78%; 79% overall) were less likely to feel the Housing Executive was good at keeping them informed about things that might affect them as a tenant than households on lower incomes (up to £5,200, 88%; £5,201 to £10,400, 81%).
Age • Respondents feeling positive about being kept informed increased by age of the HRP.
Households with a HRP aged 18 – 24 years were least likely to feel positive (66%) compared to households with a HRP of 65 years or older (88%) who felt the Housing Executive was good at keep them informed.
Being kept informed by, and getting in touch with, the Housing Executive
The main method by which respondents wanted to be kept informed and get in touch with the Housing Executive was by telephone (86% of respondents; also 86% in 2015). Just more than four-fifths of all respondents (43%; 47% in 2015) said they would be happy to be informed or get in touch by writing and more than one-quarter (27%; 26% in 2015) to visit an office.
There were notable changes in levels of interest in other types of contact, namely text (14%; 22% in 2015) and/or by email (10%; 13% in 2015), but neither had decreased to levels reported in 2014 (3% and 4% respectively).
The proportion of respondents who indicated that they would be happy to have contact with Housing Executive through social media remained similar to last year (Facebook 3%; 2% in 2015/Twitter 1%; <1% in 2015), (Appendix Table 6.6).
79%
57%
44%
83%
14%
32%
27%
13%
7%
11%
29%
3%
0% 20% 40% 60% 80% 100%
2016
2015
2014
2013
Good Neither Poor
7.0 Digital Inclusion
A growing emphasis across government for digital online services and transactions to be the primary means of interacting with the public, coupled with the Housing Executive’s Journey to Excellence customer-focused approach, means there is a compelling business case for us to enable online transactions and communications with our tenants through the promotion of digital inclusion.
In 2016, questions were asked to capture information on households’ access to the internet, the methods by which access was gained (e.g. computer/laptop/ tablet/smartphone etc.) and which would be respondents’ main method of access to the internet. Were possible, comparisons were made with the previous year.
7.1 ACCESS TO THE INTERNET
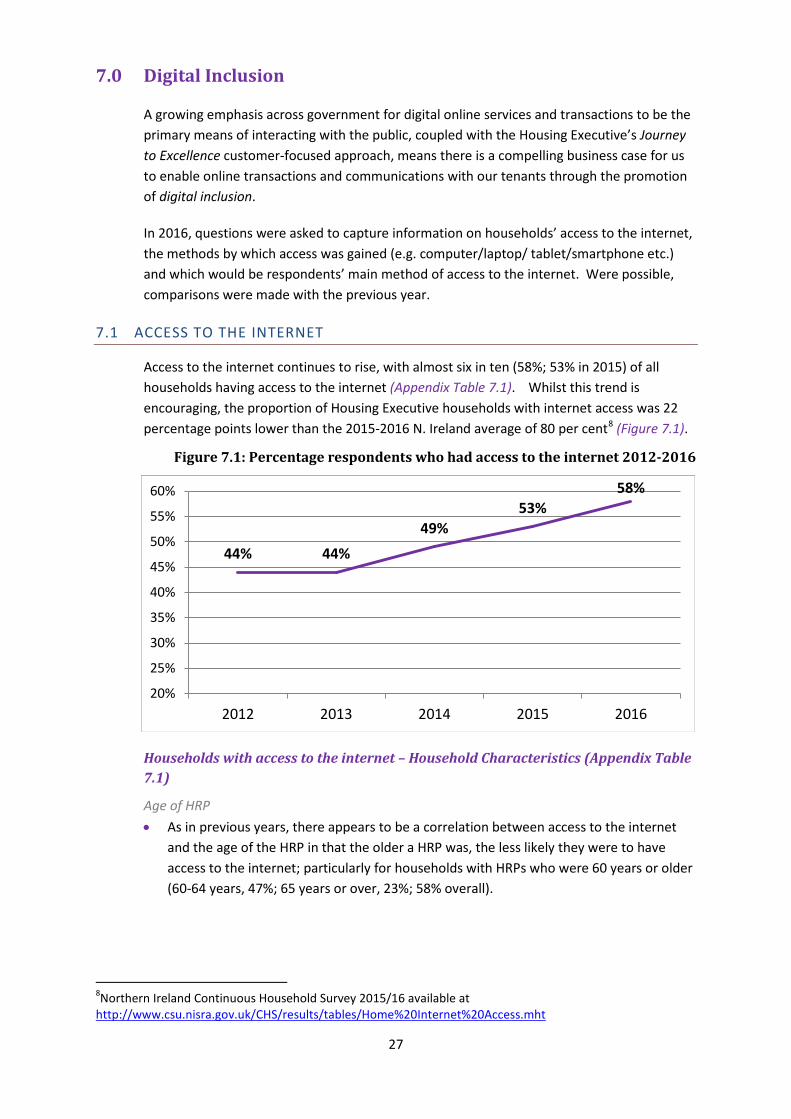
Access to the internet continues to rise, with almost six in ten (58%; 53% in 2015) of all households having access to the internet (Appendix Table 7.1). Whilst this trend is encouraging, the proportion of Housing Executive households with internet access was 22 percentage points lower than the 2015-2016 N. Ireland average of 80 per cent8 (Figure 7.1).
Figure 7.1: Percentage respondents who had access to the internet 2012-2016
Households with access to the internet – Household Characteristics (Appendix Table 7.1)
Age of HRP • As in previous years, there appears to be a correlation between access to the internet
and the age of the HRP in that the older a HRP was, the less likely they were to have access to the internet; particularly for households with HRPs who were 60 years or older (60-64 years, 47%; 65 years or over, 23%; 58% overall).
8Northern Ireland Continuous Household Survey 2015/16 available at http://www.csu.nisra.gov.uk/CHS/results/tables/Home%20Internet%20Access.mht
27
44% 44%
49% 53%
58%
20%
25%
30%
35%
40%
45%
50%
55%
60%
2012 2013 2014 2015 2016
28
• Conversely, more than four-fifths of households with a HRP aged 18-24 years had access to the internet (81%). Households with a HRP aged 25-44 years (86%) had a much higher rate of internet access than the Housing Executive’s overall average of 58 per cent; above the N. Ireland average of 80 per cent.
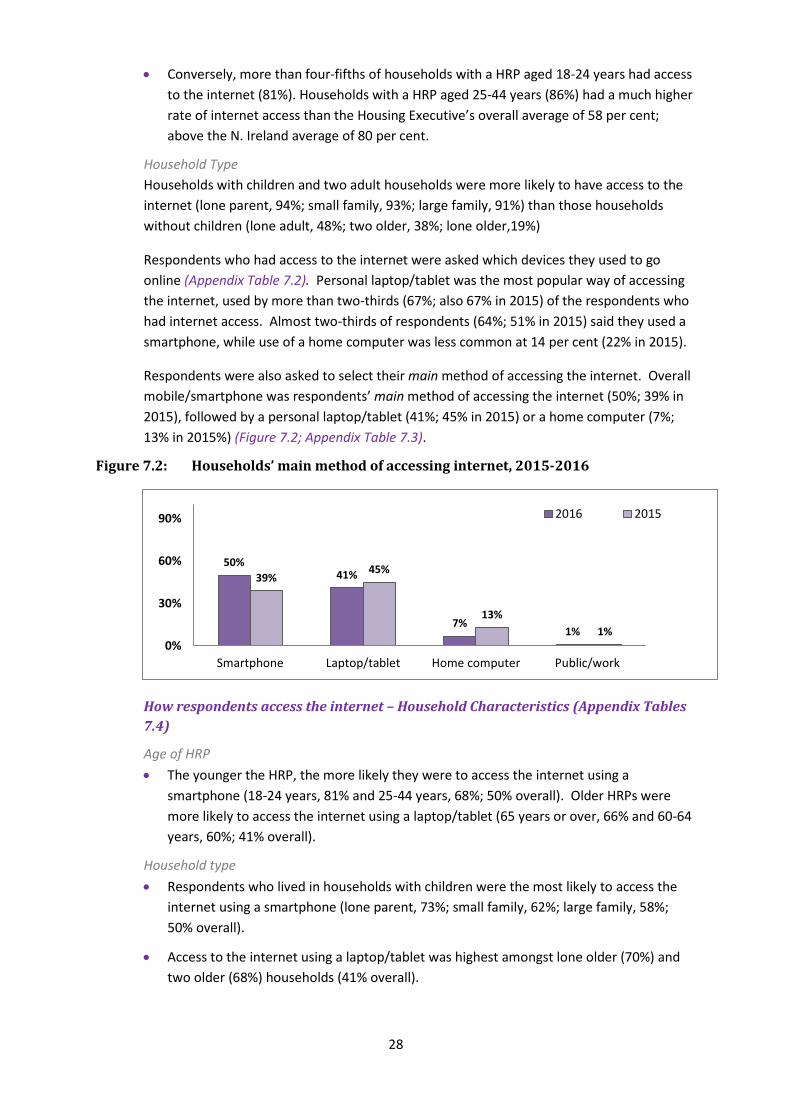
Household Type Households with children and two adult households were more likely to have access to the internet (lone parent, 94%; small family, 93%; large family, 91%) than those households without children (lone adult, 48%; two older, 38%; lone older,19%)
Respondents who had access to the internet were asked which devices they used to go online (Appendix Table 7.2). Personal laptop/tablet was the most popular way of accessing the internet, used by more than two-thirds (67%; also 67% in 2015) of the respondents who had internet access. Almost two-thirds of respondents (64%; 51% in 2015) said they used a smartphone, while use of a home computer was less common at 14 per cent (22% in 2015).
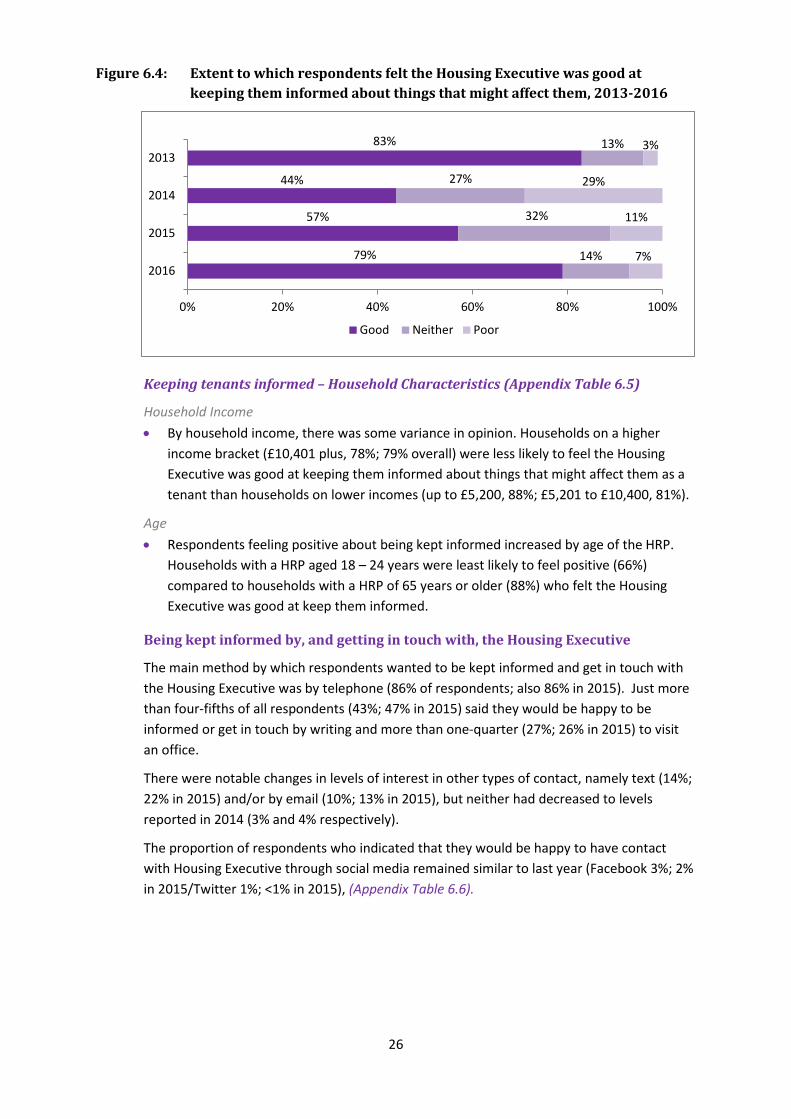
Respondents were also asked to select their main method of accessing the internet. Overall mobile/smartphone was respondents’ main method of accessing the internet (50%; 39% in 2015), followed by a personal laptop/tablet (41%; 45% in 2015) or a home computer (7%; 13% in 2015%) (Figure 7.2; Appendix Table 7.3).
Figure 7.2: Households’ main method of accessing internet, 2015-2016
90%
60% 50% 45% 39% 41%
30%13%
7% 1% 1%
0%Smartphone Laptop/tablet Home computer Public/work
2016 2015
How respondents access the internet – Household Characteristics (Appendix Tables 7.4)
Age of HRP • The younger the HRP, the more likely they were to access the internet using a
smartphone (18-24 years, 81% and 25-44 years, 68%; 50% overall). Older HRPs were more likely to access the internet using a laptop/tablet (65 years or over, 66% and 60-64 years, 60%; 41% overall).
Household type • Respondents who lived in households with children were the most likely to access the
internet using a smartphone (lone parent, 73%; small family, 62%; large family, 58%; 50% overall).
• Access to the internet using a laptop/tablet was highest amongst lone older (70%) and two older (68%) households (41% overall).
Lone parent 99%
Large family 97%
Small family 95%
Two adults 92%
Large adult 92%
Lone adult 91%
Two older 81%
Lone older 65%
0% 10% 20% 30% 40% 50% 60% 70% 80% 90% 100%
Access to Housing Executive services via the website (Appendix Table 7.5) Of respondents who had access to the internet, almost one-sixth (15%) had accessed a
Housing Executive service via the web.
7.2 MOBILE PHONE
Compared to 2015, ownership of a mobile phone had increased in 2016 (86%; 83% in 2015). The latest Northern Ireland average for 2015 was 94 per cent9 (Appendix Table 7.6).
Mobile phone ownership – Household Characteristics (Figure 7.3; Appendix Table 7.6)
Age of HRP • Ownership of a mobile phone was least likely in households where the HRP was aged 65
years or more (68%; 86% overall) and was highest among households with a HRP aged between 25-44 years (97%).
Household type • Ownership of a mobile phone was above average (86%) amongst most households with
the exception of two older (81%) and lone older (65%) households.
Figure 7.3: Respondent’s mobile phone ownership by household type
Contact with the Housing Executive via mobile phone The vast majority (80%; also 80% in 2015) of mobile phone owners had given their number to the Housing Executive (Appendix Table 7.7).
Tenant contact with Housing Executive by text Of respondents who owned a mobile phone, a small proportion (5%) had contacted the Housing Executive by text during the previous 12 months before survey (Appendix Table
92015 Northern Ireland Neighbourhood Information Service , NISRA http://www.ninis2.nisra.gov.uk/People & Places (see People & Places/Housing and Household (p10)/Mobile Phone Ownership)
29
30
7.8). However, when asked if they would contact a Housing Executive service by text, more than one-fifth (23%) of this sub-group reported that they would (Appendix Tables 7.9).
Contact from the Housing Executive by text Respondents who owned a mobile phone were also asked if they would allow the Housing Executive to contact them by text in relation to a number of key service areas.
Almost three-fifths (57%) said they would allow the Housing Executive to contact them by text/SMS about repairs. Two-fifths or less would allow contact regarding planned improvement schemes (40%), and/or general information/advice (39%), and/or Housing Benefit (36%). One-third or less of mobile phone owners would allow contact via text regarding anti-social behaviour (33%) and/or their rent account/paying rent (28%); while less than one-fifth would allow contact via text regarding a housing application/transfer (19%) (Appendix Table 7.10).
31
8.0 Client response to survey BELOW IS RESPONSE TO LAST YEARS SURVEY (for Client information only):
The annual CTOS provides the Housing Executive with a unique ability of tapping into the lives of our tenants in real time. It provides the organisation with an in-depth understanding of our tenants and their views on our service delivery. As well as providing management with a measurement of customer satisfaction, the Survey is also a vital source of information which allows us to continually assess the profile of our tenants, to tailor our services and shape future strategies around the needs of our customers, who can challenge and lobby us to effect the changes in their neighbourhoods via our housing community network structure.
In keeping with our Journey to Excellence we aim to put the customer first in a prompt and timely manner.
“Identifying what is value for our customers’ and organising ourselves to deliver that every time”
Importantly, findings help the organisation to horizon scan in the formulation of future policy and potential programmes. “What is important to our tenants is important to us!” Tenants have highlighted in this year’s CTOS that the quality and upkeep of their home and good communication from their landlord are key issues for them.
Customer experience is an integral part of Build Yes
“To provide our customers with good quality services/support when they
need it, shaped around them.”
Two key findings identify that more than four-fifths of respondents reported that they were satisfied with the general condition of their property (84%) and further, with the overall quality of their home (85%). In 2015, more than seven in ten (71%) respondents felt that the Housing Executive had consulted with them well; a measurement which remains similar to previous years.
Rental income is vital to the continuation of our service provision and it is worth noting that 88 per cent of our tenants think that this provides value for money. In addition, respondent satisfaction with the overall service we provide continues to remain high at 82%. It is hoped that these trends will continue throughout our journey to excellence.
32
It is encouraging that tenant access to the internet continues to rise. However, this is still below the Northern Ireland average.
A lack of computer skills and inability to access the internet can exclude people from a range of opportunities, for example, job searches and shopping around online for the best deals on essential expenses such as car insurance and cheaper electricity tariffs.
In October 2016, Landlord Services introduced a small digital inclusion pilot project in four local areas. The pilot offers tenants access to the internet at a reduced cost. The aim of the project is to increase tenant awareness of and access to the digital world and the benefits this can bring. The project is for two years and will be regularly monitored.
The Housing Executive will continue to invest £4 million annually into our communities to support community development.
The Housing Executives new repair contracts include “social clauses” e.g. local access to apprentice jobs and attracting investment into local areas.
The CTOS will continue to measure these areas of service delivery.
33
APPENDIX 1
TABLES
2016 CTOS Annual Report
Table: 3.1: Dwelling Type
Sample in numbers
Belfast
800
North
800
South
1000
TOTAL
2600
21,916 16,641 14,591 53,148
70.7% 60.5% 54.7% 62.4%
5,694 4,475 3,632 13,801
18.4% 16.3% 13.6% 16.2%
3,409 6,408 8,431 18,248
11.0% 23.3% 31.6% 21.4%
31,019 27,524 26,654 85,197
100% 100% 100% 100%
Table: 3.2: Household type by Number of bedrooms
Sample in numbers
1 bed
257
2 bed
928
3 bed
1237
4+ bed
178 TOTAL 2600
4,766 12,996 15,291 2,674 35,727
56.6% 43.3% 37.5% 44.5% 41.9%
% Adult 13.3% 36.4% 42.8% 7.5% 100%
* 4,393 14,609 1,981 21,085
1.2% 14.6% 35.9% 33.0% 24.7%
% with Children 0.5% 20.8% 69.3% 9.4% 100%
3,548 12,650 10,837 1,349 28,384
42.2% 42.1% 26.6% 22.5% 33.3%
% Older 12.5% 44.6% 38.2% 4.8% 100%
8,416 30,039 40,737 6,004 85,196
100% 100% 100% 100% 100%
% Overall 9.9% 35.3% 47.8% 7.0% 100%
Table 3.3: Household type
Sample in numbers
Belfast
800
North
800
South
1000
TOTAL
2600
6,865 6,446 6,241 19,552
22.1% 23.4% 23.4% 22.9%
3,189 2,432 2,395 8,016
10.3% 8.8% 9.0% 9.4%
3,000 2,955 2,204 8,159
9.7% 10.7% 8.3% 9.6%
4,955 4,294 2,712 11,961
16.0% 15.6% 10.2% 14.0%
2,403 1,810 1,505 5,718
7.7% 6.6% 5.6% 6.7%
* 1,112 1,366 3,406
3.0% 4.0% 5.1% 4.0%
3,818 2,705 3,314 9,837
12.3% 9.8% 12.4% 11.5%
5,861 5,769 6,916 18,546
18.9% 21.0% 25.9% 21.8%
31,019 27,523 26,653 85,195
100% 100% 100% 100%
House
Flat/Maisonette
Bungalow/Cottage
NI TOTAL
Lone adult
Adult
Children
Older
NI TOTAL
Adult 41.9%
Children 24.7%
NI TOTAL
Lone older
Small family
Large family
Large adult
Older 33.3%
Two adults
Lone parent
Two older
2016 CTOS - Appendix Tables * denotes cell has an unweighted value eq<25
34
2016 CTOS Annual Report
Table 3.4: Number of residents in household
Sample in numbers
Belfast
800
North
800
South
1000
TOTAL
2600
12,726 12,186 13,157 38,069
41.0% 44.3% 49.4% 44.7%
8,805 7,014 6,775 22,594
28.4% 25.5% 25.4% 26.5%
5,140 4,277 3,493 12,910
16.6% 15.5% 13.1% 15.2%
4,348 4,046 3,228 11,622
14.0% 14.7% 12.1% 13.6%
31,019 27,523 26,653 85,195
100% 100% 100% 100%
Table 3.5: Profile of ALL Household Members
Sample in numbers
Belfast
1690 North 1669
South
2000
TOTAL
5359
28,625 24,974 25,101 78,700
43.8% 43.2% 47.4% 44.7%
36,777 32,845 27,855 97,477
56.2% 56.8% 52.6% 55.3%
16,199 14,576 11,767 42,542
24.8% 25.2% 22.2% 24.1%
7,540 6,678 5,266 19,484
11.5% 11.5% 9.9% 11.1%
14,918 11,701 11,380 37,999
22.8% 20.2% 21.5% 21.6%
11,433 11,240 9,991 32,664
17.5% 19.4% 18.9% 18.5%
3,980 3,414 3,044 10,438
6.1% 5.9% 5.7% 5.9%
11,242 10,124 11,489 32,855
17.2% 17.5% 21.7% 18.6%
* * * *
0.1% 0.1% 0.0% 0.1%
12,715 8,967 9,637 31,319
19.4% 15.5% 18.2% 17.8%
9,472 7,246 8,391 25,109
14.5% 12.5% 15.8% 14.3%
11,481 9,797 11,503 32,781
17.6% 16.9% 21.7% 18.6%
8,596 8,354 5,643 22,593
13.1% 14.4% 10.7% 12.8%
3,478 4,478 3,189 11,145
5.3% 7.7% 6.0% 6.3%
2,317 2,916 2,091 7,324
3.5% 5.0% 3.9% 4.2%
17,344 16,063 12,501 45,908
26.5% 27.8% 23.6% 26.1%
63,613 56,891 51,471 171,975
97.3% 98.4% 97.2% 97.6%
1,789 * 1,485 4,203
2.8% 1.6% 2.8% 2.3%
13,013 13,495 14,359 40,867
19.9% 23.3% 27.1% 23.2%
2,881 5,091 3,006 10,978
4.4% 8.8% 5.7% 6.2%
7,656 5,294 2,617 15,567
11.7% 9.2% 4.9% 8.8%
41,852 33,939 32,973 108,764
64.0% 58.7% 62.3% 61.7%
65,402 57,819 52,955 176,176
100% 100% 100% 100%
Yes, has BOTH illness and a
disability
Has no such health problems
Disability
Ethnicity
Other
NI TOTAL
1 person
2 persons
3 persons
4 persons or more
NI TOTAL
Male
Female
Age 65 yrs or over
Employed
Unemployed
Retired
Age 60-64 yrs
Employment
Status
Perm Sick/Disabled
Looking after family/home
Age
Yes, has a health
problem/illness
Yes, has a disability which
limits activities
Student (higher education)
Other (inc. school children
White
Refused
Age 45-59 yrs
Gender
Age under 16 yrs
Age 16-24 yrs
Age 25-44 yrs
35
2016 CTOS Annual Report
Table 3.6: Profile of Household Reference Person (HRP)
Sample in numbers
Belfast
800
North
800
South
1000
TOTAL
2600
10,147 9,008 10,959 30,114
32.7% 32.7% 41.1% 35.3%
20,872 18,516 15,694 55,082
67.3% 67.3% 58.9% 64.7%
* * * 2,117
2.8% 2.8% 1.8% 2.5%
9,799 7,848 6,984 24,631
31.6% 28.5% 26.2% 28.9%
8,912 8,266 7,420 24,598
28.7% 30.0% 27.8% 28.9%
2,803 2,817 2,633 8,253
9.0% 10.2% 9.9% 9.7%
8,626 7,794 9,130 25,550
27.8% 28.3% 34.3% 30.0%
0 * * *
0.0% 0.1% 0.1% 0.1%
1,489 2,109 2,316 5,914
4.8% 7.7% 8.7% 6.9%
10,898 9,162 9,326 29,386
35.1% 33.3% 35.0% 34.5%
13,493 9,148 9,928 32,569
43.5% 33.2% 37.2% 38.2%
5,139 7,104 5,083 17,326
16.6% 25.8% 19.1% 20.3%
7,287 5,067 5,427 17,781
23.5% 18.4% 20.4% 20.9%
5,607 4,651 5,238 15,496
18.1% 16.9% 19.7% 18.2%
8,903 7,541 9,320 25,764
28.7% 27.4% 35.0% 30.2%
6,439 6,457 4,150 17,046
20.8% 23.5% 15.6% 20.0%
2,431 3,426 2,356 8,213
7.8% 12.4% 8.8% 9.6%
* * * *
1.1% 1.4% 0.6% 1.0%
30,486 27,342 26,320 84,148
98.3% 99.3% 98.8% 98.8%
* * * 1,049
0.5% 0.3% 0.1% 1.2%
Unemployed
Retired
Other
Gender
Ethnicity - HRP
Employment
Status - HRP
Refused
Perm Sick/Disabled
Age - HRP
Income _ HRP
Male
Female
Age 18-24 yrs
Age 25-44 yrs
Refused/DK
Age 45-59 years
Age 60-64 yrs
Looking after family/home
Age 65 years or over
£5,200 or less
£5,201-£10,400
£10,401+
Employed
White
Other
36
2016 CTOS Annual Report
Table 3.7: Employment status of HRP by working age
working
age *
not
working
age**
TOTAL
2600
Sample in numbers 1763 837 2600
17,354 * 17,781
29.9% 1.6% 20.9%
% employed 97.6% 2.4% 100%
15,253 * 15,496
26.3% 0.9% 18.2%
% unemployed 98.4% 1.6% 100%
1,359 24,405 25,764
2.3% 89.9% 30.2%
% retired 5.3% 94.7% 100%
15,107 1,939 17,046
26.0% 7.1% 20.0%
% sick/disabled 88.6% 11.4% 100%
8,967 * 9,109
15.4% 0.5% 10.7%
% other 98% 2% 100%
58,040 27,156 85,196
100% 100% 100%
% overall 68.1% 31.9% 100%
*HRPs of working age = 16 yrs+ but less than 65 for Males/63 yrs Females
**HRPs not of working age = Males 65 yrs or older/Females 63 yrs or older
Table 3.8a: Benefits received by HRP
Sample in numbers
Belfast
800
North
800
South
1000
TOTAL
2600
23,479 21,888 20,293 65,660
75.7% 79.5% 76.1% 77.1%
11,452 8,689 8,737 28,878
36.9% 31.6% 32.8% 33.9%
8,258 7,608 7,496 23,362
26.6% 27.6% 28.1% 27.4%
8,900 7,495 5,692 22,087
28.7% 27.2% 21.4% 25.9%
7,565 6,839 4,587 18,991
24.4% 24.8% 17.2% 22.3%
6,715 6,566 5,492 18,773
21.6% 23.9% 20.6% 22.0%
4,885 4,473 4,095 13,453
15.7% 16.3% 15.4% 15.8%
3,069 4,214 4,410 11,693
9.9% 15.3% 16.5% 13.7%
3,314 1,985 1,827 7,126
10.7% 7.2% 6.9% 8.4%
2,236 1,522 1,846 5,604
7.2% 5.5% 6.9% 6.6%
1,136 1,011 904 3,051
3.7% 3.7% 3.4% 3.6%
Other 1,537 1,731 1,055 4,323
5.0% 6.3% 4.0% 5.1%
Housing Benefit
Working Tax Credit
Incapacity Benefit
Child Tax Credit
Pension Credit
Retirement Pension
Jobseekers' Allowance
Disability Benefit
Income Support
Employment & Support
Allowance
Child Benefit
Other (inc. Refused)
NI TOTAL
Employed
Unemployed
Retired
Perm Sick/Disabled
37
2016 CTOS Annual Report
Table 3.8b: Benefits received by Partner of HRP
Sample in numbers
TOTAL
582
5,157
27.2%
4,817
25.4%
2,881
15.2%
1,974
10.4%
1,816
9.6%
1,420
7.5%
1,215
6.4%
774
4.1%
*
3.5%
*
3.1%
*
1.8%
Other *
4.3%
Table 3.9
Sample in numbers
Belfast
800
North
800
South
1000
TOTAL
2600
8,799 9,183 10,222 28,204
28.4% 33.4% 38.4% 33.1%
1,861 2,706 1,739 6,306
6.0% 9.8% 6.5% 7.4%
5,454 3,635 1,877 10,966
17.6% 13.2% 7.0% 12.9%
14,904 12,000 12,816 39,720
48.0% 43.6% 48.1% 46.6%
31,018 27,524 26,654 85,196
100% 100% 100% 100%
Table 3.10: Use of indoor/outdoor aids by HRPs
Sample in numbers
Belfast
800
North
800
South
1000
TOTAL
2600
23,705 21,616 20,931 66,252
76.4% 78.5% 78.5% 77.8%
4,657 3,287 3,645 11,589
15.0% 11.9% 13.7% 13.6%
1,517 1,087 1,284 3,888
4.9% 3.9% 4.8% 4.6%
* * * 1,668
1.8% 2.7% 1.4% 2.0%
* * * 1,404
1.3% 2.4% 1.1% 1.6%
* * * *
0.4% 0.4% 0.4% 0.4%
31,018 27,522 26,652 85,192
100% 100% 100% 100%
NI TOTAL
Disability Benefit
Retirement Pension
Employment & Support
Allowance
Pension credit
Wheel chair
Housing Benefit
Stick
No aids
Child Tax Credit
Working Tax Credit
Child Benefit
Income Support
Incapacity Benefit
Adapted vehicle/
Scooter/Confined to bed
Zimmer frame
Health/Disability of HRPs
Crutches
NI TOTAL
Yes, has a health
problem/illness
Yes, has a disability which
limits activities
Yes, has BOTH a health
problem and a disability
Has no such health problems
Jobseeker's Allowance
38
2016 CTOS Annual Report
Table 3.11: Religion of household as described by respondent
Sample in numbers
Belfast
800
North
800
South
1000
TOTAL
2600
17,937 14,281 11,267 43,485
57.8% 51.9% 42.3% 51.0%
10,756 10,108 11,948 32,812
34.7% 36.7% 44.8% 38.5%
* * 1,037 2,159
2.2% 1.6% 3.9% 2.5%
1,647 2,691 2,401 6,739
5.3% 9.8% 9.0% 7.9%
31,018 27,524 26,653 85,195
100% 100% 100% 100%
Table 4.1:
Sample in numbers
Satisfied
2257 Neither 195
Dissatisfied
148
TOTAL
2600
Region
26,550 2,506 1,963 31,019
85.6% 8.1% 6.3% 100%
24,252 1,621 1,650 27,523
88.1% 5.9% 6.0% 100%
23,036 2,387 1,230 26,653
86.4% 9.0% 4.6% 100%
Household Type
16,985 1,371 1,195 19,551
86.9% 7.0% 6.1% 100%
6,812 * * 8,017
85.0% 7.7% 7.3% 100%
9,420 1,499 1,041 11,960
78.8% 12.5% 8.7% 100%
4,508 * * 5,718
78.8% 13.4% 7.7% 100%
2,882 * * 3,406
84.6% 9.1% 6.3% 100%
7,048 * * 8,159
86.4% 7.7% 5.9% 100%
9,065 * * 9,836
92.2% 4.6% 3.3% 100%
17,117 867 * 18,547
92.3% 4.7% 3.0% 100%
Household Income
5,348 * * 5,913
90.4% 5.9% 3.6% 100%
26,132 2,034 1,221 29,387
88.9% 6.9% 4.2% 100%
27,552 2,615 2,402 32,569
84.6% 8.0% 7.4% 100%
14,806 1,516 1,005 17,327
85.5% 8.7% 5.8% 100%
Age of HRP1,538 * * 2,116
72.7% 14.3% 13.0% 100%
19,915 2,824 1,893 24,632
80.9% 11.5% 7.7% 100%
21,267 1,946 1,384 24,597
86.5% 7.9% 5.6% 100%
7,236 * * 8,253
87.7% 6.7% 5.7% 100%
23,863 892 * 25,550
93.4% 3.5% 3.1% 100%
* 0 * *38.3% 0.0% 61.7% 100%
73,837 6,514 4,844 85,195
86.7% 7.6% 5.7% 100%
Large family
Large adult
Belfast
North
Small family
60-64
65 or over
18-24
Lone older
Up to £5,200
£5,201 to £10,400
Don't know/refused
NI TOTAL
Two adults
Lone parent
45-59
Refused
25-44
Lone adult
£10,401 plus
Two older
South
How satisfied/dissatisfied are you with the overall service provided by the
Housing Execuctive?
NI TOTAL
Protestant
Catholic
Mixed religion
Protestant/CatholicOther
39
2016 CTOS Annual Report
Table 4.2:
Sample in numbers
Belfast
800
North
800
South
1000
TOTAL
2600
23,562 18,776 18,647 60,985
76.0% 68.2% 70.0% 71.6%
7,457 8,747 8,006 24,210
24.0% 31.8% 30.0% 28.4%
31,019 27,523 26,653 85,195
100% 100% 100% 100%
Table 4.3:
Sample in numbers
Belfast
608 North 542
South
702
TOTAL
1852
21,279 16,024 16,481 53,784
90.3% 85.3% 88.4% 88.2%
1,134 2,067 1,473 4,674
4.8% 11.0% 7.9% 7.7%
* * * 1,578
3.4% 2.4% 1.7% 2.6%
* 0 * *
0.1% 0.0% 0.6% 0.2%
* * * 814
1.3% 1.2% 1.5% 1.3%
23,562 18,776 18,647 60,985
100% 100% 100% 100%
Table 4.4: When you reported the repair, were you advised when the work would be completed?
Sample in numbers
Belfast
608
North
542
South
702
TOTAL
1852
9,019 7,066 6,803 22,888
81.3% 85.7% 80.6% 82.4%
855 393 390 1,638
7.7% 4.8% 4.6% 5.9%
1,223 786 1,252 3,261
11.0% 9.5% 14.8% 11.7%
11,097 8,245 8,445 27,787
100% 100% 100% 100%
Table 4.5: Was the work completed within the time you were advised?
Sample in numbers
Belfast
482
North
447
South
553
TOTAL
1482
15,514 13,862 12,388 41,764
82.3% 89.1% 85.1% 85.3%
2,973 1,511 2,043 6,527
15.8% 9.7% 14.0% 13.3%
* * * *
1.9% 1.2% 0.9% 1.4%
18,849 15,557 14,563 48,969
100% 100% 100% 100%NI TOTAL
Have you or your partner (if applicable) reported any repair requests to the
Housing Executive within the last 12 months?
Which of the following methods did you use when you last
reported a repair?
Don't know
Letter
Yes
Don't know
NI TOTAL
No
NI TOTAL
No
NI TOTAL
Don't know
Yes
No
Telephone
In person at a local office
Email/Website
Yes
40
2016 CTOS Annual Report
Table 4.6:
Sample in numbers
Satisfied
1447 Neither 120
Dissatisfied
279
DK
eq<25 TOTAL 1852
Region18,242 1,894 3,396 * 23,562
77.4% 8.0% 14.4% 0.1% 100%
15,270 890 2,584 * 18,776
81.3% 4.7% 13.8% 0.2% 100%
14,104 1,238 3,179 * 18,646
75.6% 6.6% 17.0% 0.7% 100%
Household Type
9,888 1,105 2,170 * 13,280
74.5% 8.3% 16.3% 0.9% 100%
5,091 * 1,052 0 6,489
78.5% 5.3% 16.2% 0.0% 100%
6,891 936 1,614 0 9,441
73.0% 9.9% 17.1% 0.0% 100%
3,046 * 836 0 4,284
71.1% 9.4% 19.5% 0.0% 100%
2,169 * * * 2,818
77.0% 6.1% 15.6% 1.3% 100%
5,102 * 1,231 0 6,486
78.7% 2.4% 19.0% 0.0% 100%
5,842 * * * 6,986
83.6% 6.9% 9.1% 0.4% 100%
9,587 * 1,185 0 11,201
85.6% 3.8% 10.6% 0.0% 100%
Household Income
3,099 * * * 4,192
73.9% 6.4% 18.8% 0.9% 100%
16,031 1,203 2,854 0 20,088
79.8% 6.0% 14.2% 0.0% 100%
18,774 1,720 3,756 * 24,351
77.1% 7.1% 15.4% 0.4% 100%
9,714 831 1,761 * 12,354
78.6% 6.7% 14.3% 0.4% 100%
Age of HRP900 * * 0 1,572
57.3% 12.2% 30.6% 0.0% 100%
14,018 1,801 3,473 * 19,378
72.3% 9.3% 17.9% 0.4% 100%
14,407 1,067 2,836 * 18,380
78.4% 5.8% 15.4% 0.4% 100%
4,860 * * 0 5,705
85.2% 4.6% 10.3% 0.0% 100%
13,432 * 1,784 * 15,950
84.2% 4.4% 11.2% 0.2% 100%
47,617 4,022 9,159 187 60,985
78.1% 6.6% 15.0% 0.3% 100%
Table 4.7:
Sample in numbers
Belfast
608
North
542
South
702
TOTAL
1852
19,986 16,837 15,819 52,642
84.8% 89.7% 84.8% 86.3%
3,576 1,940 2,828 8,344
15.2% 10.3% 15.2% 13.7%
23,562 18,777 18,647 60,986
100% 100% 100% 100%
Don't know/refused
18-24
Large family
£10,401 plus
NI TOTAL
65 or over
60-64
Small family
Lone parent
Two adults
Lone adult
South
North
Belfast
25-44
45-59
Lone older
Two older
Large adult
Generally how satisfied/dissatisfied are you with the way the Housing
Executive deals with repairs?
Has at least one repair request now been completed?
£5,201 to £10,400
Up to £5,200
Yes
No
NI TOTAL
41
2016 CTOS Annual Report
Table 4.8:
Sample in numbers
Belfast
516 North 486
South
599
TOTAL
1601
15,621 14,210 13,307 43,138
78.2% 84.4% 84.1% 81.9%
4,049 2,356 2,307 8,712
20.3% 14.0% 14.6% 16.5%
* * * *
1.6% 1.6% 1.3% 1.5%
19,985 16,837 15,819 52,641
100% 100% 100% 100%
Table 4.9: Satisfaction with aspects of how the contractor carried out the repair work.
Sample in numbers
Very
satisfied Satisfied Neither
Dissatis-
fied Very dissatisfied
TOTAL
1601
31,767 18,566 1,809 * * 52,642
60.3% 35.3% 3.4% 0.6% 0.4% 100%
31,741 18,633 1,817 * * 52,641
60.3% 35.4% 3.5% 0.6% 0.3% 100%
32,131 17,615 1,579 * * 52,641
61.0% 33.5% 3.0% 1.5% 1.0% 100%
31,495 17,083 1,365 1,889 * 52,643
59.8% 32.5% 2.6% 3.6% 1.5% 100%
30,940 17,032 1,418 2,184 1,068 52,642
58.8% 32.4% 2.7% 4.1% 2.0% 100%
30,391 17,601 2,641 1,311 * 52,640
57.7% 33.4% 5.0% 2.5% 1.3% 100%
Table 4.10a:
Sample in numbers
Belfast
516
North
486
South
599
TOTAL
1601
11,583 9,389 8,399 29,371
58.0% 55.8% 53.1% 55.8%
6,718 5,779 5,776 18,273
33.6% 34.3% 36.5% 34.7%
* * * 1,830 1,830
2.8% 3.7% 4.1% 3.5% 3.5%
* * * 1,958
2.3% 4.8% 4.4% 3.7%
* * * 1,208
3.3% 1.5% 1.8% 2.3%
19,985 16,837 15,818 52,640
100% 100% 100% 100%
Table 4.10b:
Sample in numbers
Belfast
516
North
486
South
599
TOTAL
1601
11,808 9,169 8,858 29,835
59.1% 54.5% 56.0% 56.7%
6,517 6,412 5,614 18,543
32.6% 38.1% 35.5% 35.2%
* * * 1,882 1,882
3.6% 3.2% 3.9% 3.6% 3.6%
* * * 1,392
1.7% 2.7% 3.7% 2.6%
* * * 988
2.9% 1.5% 1.0% 1.9%
19,986 16,836 15,818 52,640
100% 100% 100% 100%
Did the workmen complete the repair work in full when they first visited?
COMPLETED REPAIR - How satisfied/dissatisfied are you with how the
Housing Executive managed the repair?
COMPLETED REPAIR - How satisfied/dissatisfied are you with how the
Contractor carried out the repair work?
48,378
Satisfied 91.9%
Neither
Dissatisfied
2,380
90.5%
Neither
Speed
No
Very dissatisfied 6.0%
Satisfied
3,166
47,644
4.5%
NI TOTAL
NI TOTAL
Very satisfied
Very dissatisfied
Yes
Dissatisfied
Quality of materials
Tidiness
Quality of work
Politeness
Friendliness
Don't know
NI TOTAL
Very satisfied
42
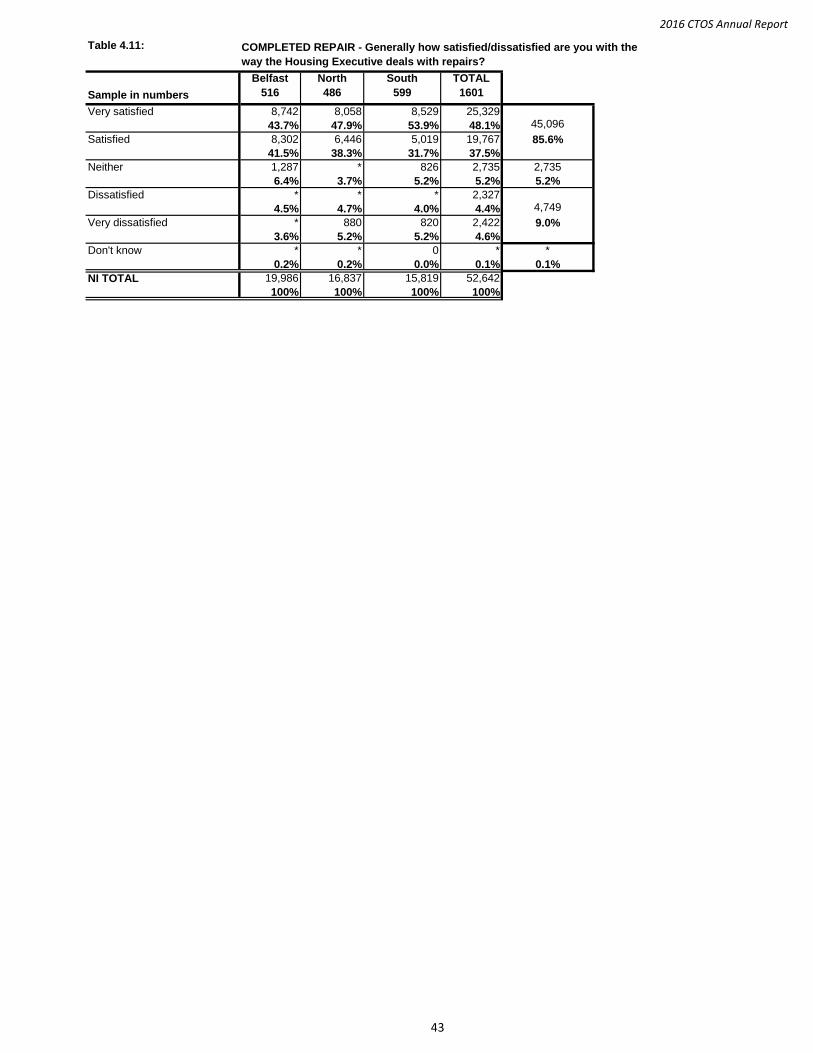
2016 CTOS Annual Report
Table 4.11:
Sample in numbers
Belfast
516
North
486
South
599
TOTAL
1601
8,742 8,058 8,529 25,329
43.7% 47.9% 53.9% 48.1%
8,302 6,446 5,019 19,767
41.5% 38.3% 31.7% 37.5%
1,287 * 826 2,735 2,735
6.4% 3.7% 5.2% 5.2% 5.2%
* * * 2,327
4.5% 4.7% 4.0% 4.4%
* 880 820 2,422
3.6% 5.2% 5.2% 4.6%
* * 0 * *
0.2% 0.2% 0.0% 0.1% 0.1%
19,986 16,837 15,819 52,642
100% 100% 100% 100%
NI TOTAL
Don't know
Very satisfied
Dissatisfied4,749
COMPLETED REPAIR - Generally how satisfied/dissatisfied are you with the
way the Housing Executive deals with repairs?
45,096
Satisfied 85.6%
Neither
Very dissatisfied 9.0%
43
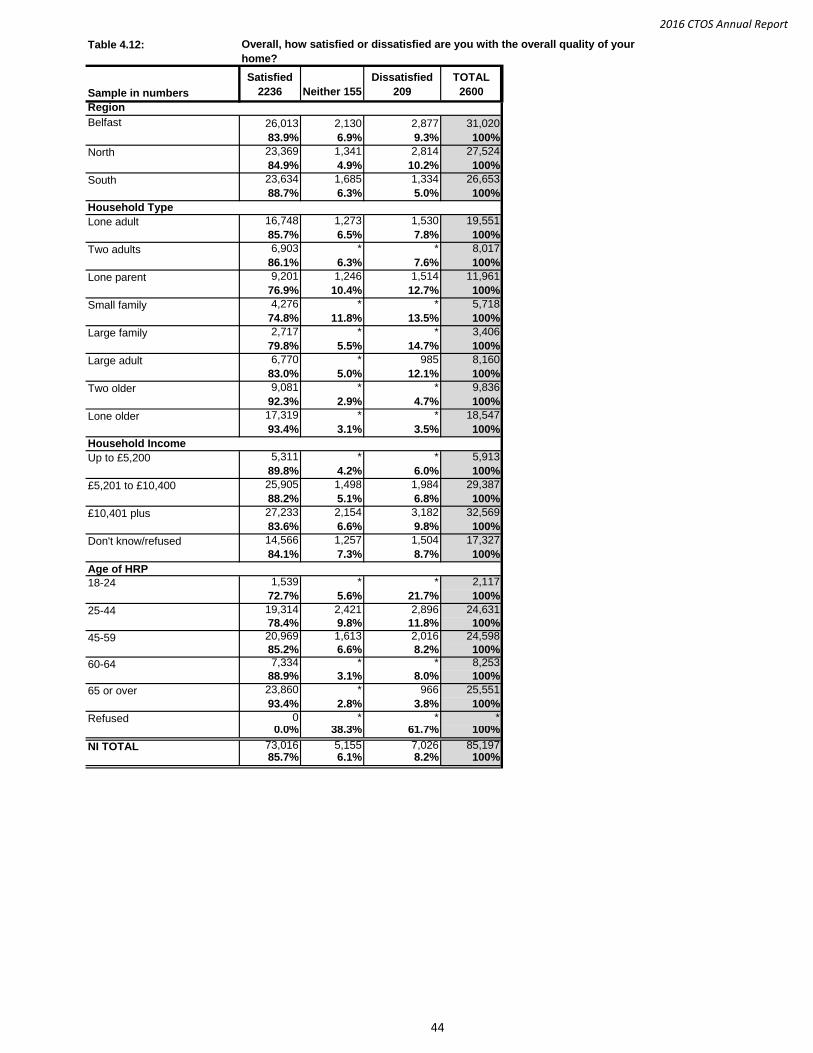
2016 CTOS Annual Report
Table 4.12:
Sample in numbers
Satisfied
2236 Neither 155
Dissatisfied
209
TOTAL
2600
Region
26,013 2,130 2,877 31,020
83.9% 6.9% 9.3% 100%
23,369 1,341 2,814 27,524
84.9% 4.9% 10.2% 100%
23,634 1,685 1,334 26,653
88.7% 6.3% 5.0% 100%
Household Type
16,748 1,273 1,530 19,551
85.7% 6.5% 7.8% 100%
6,903 * * 8,017
86.1% 6.3% 7.6% 100%
9,201 1,246 1,514 11,961
76.9% 10.4% 12.7% 100%
4,276 * * 5,718
74.8% 11.8% 13.5% 100%
2,717 * * 3,406
79.8% 5.5% 14.7% 100%
6,770 * 985 8,160
83.0% 5.0% 12.1% 100%
9,081 * * 9,836
92.3% 2.9% 4.7% 100%
17,319 * * 18,547
93.4% 3.1% 3.5% 100%
Household Income
5,311 * * 5,913
89.8% 4.2% 6.0% 100%
25,905 1,498 1,984 29,387
88.2% 5.1% 6.8% 100%
27,233 2,154 3,182 32,569
83.6% 6.6% 9.8% 100%
14,566 1,257 1,504 17,327
84.1% 7.3% 8.7% 100%
Age of HRP1,539 * * 2,117
72.7% 5.6% 21.7% 100%
19,314 2,421 2,896 24,631
78.4% 9.8% 11.8% 100%
20,969 1,613 2,016 24,598
85.2% 6.6% 8.2% 100%
7,334 * * 8,253
88.9% 3.1% 8.0% 100%
23,860 * 966 25,551
93.4% 2.8% 3.8% 100%
0 * * *0.0% 38.3% 61.7% 100%
73,016 5,155 7,026 85,19785.7% 6.1% 8.2% 100%
Large family
Two adults
Lone adult
South
North
Belfast
Overall, how satisfied or dissatisfied are you with the overall quality of your
home?
Don't know/refused
18-24
£5,201 to £10,400
£10,401 plus
65 or over
NI TOTAL
Two older
Large adult
Refused
60-64
45-59
25-44
Up to £5,200
Lone older
Small family
Lone parent
44
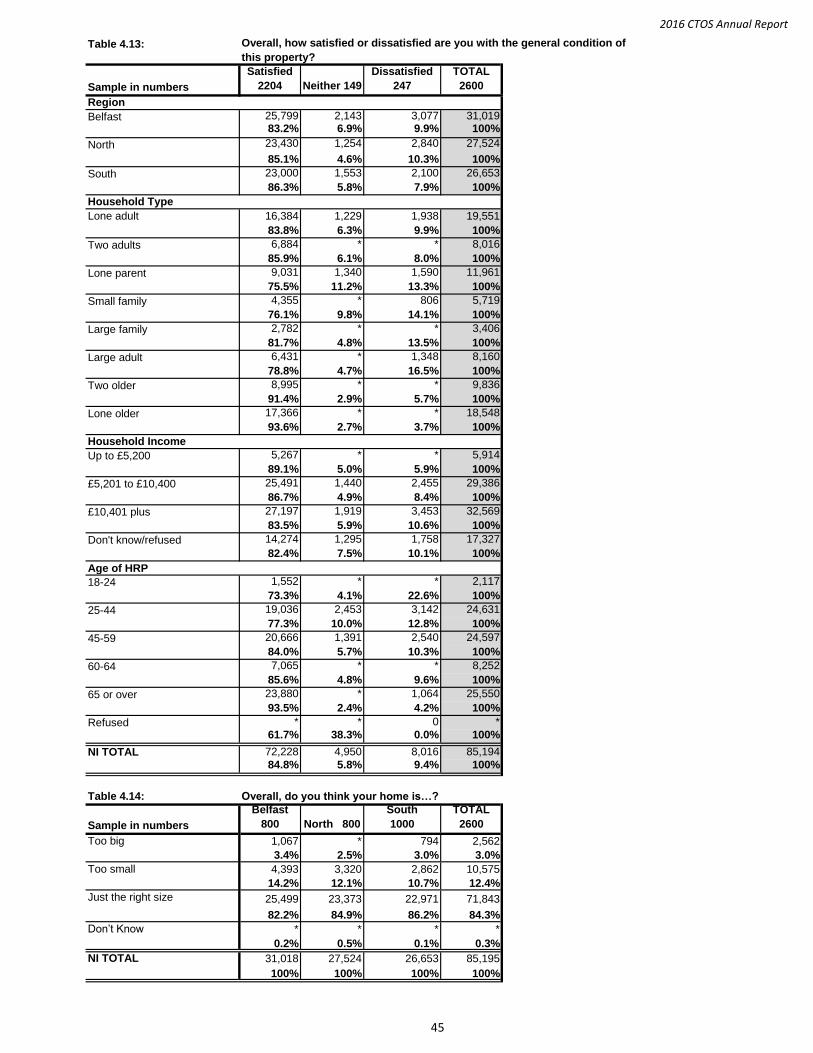
2016 CTOS Annual Report
Table 4.13:
Sample in numbers
Satisfied
2204 Neither 149
Dissatisfied
247
TOTAL
2600
Region
25,799 2,143 3,077 31,01983.2% 6.9% 9.9% 100%
23,430 1,254 2,840 27,524
85.1% 4.6% 10.3% 100%
23,000 1,553 2,100 26,653
86.3% 5.8% 7.9% 100%
Household Type
16,384 1,229 1,938 19,551
83.8% 6.3% 9.9% 100%
6,884 * * 8,016
85.9% 6.1% 8.0% 100%
9,031 1,340 1,590 11,961
75.5% 11.2% 13.3% 100%
4,355 * 806 5,719
76.1% 9.8% 14.1% 100%
2,782 * * 3,406
81.7% 4.8% 13.5% 100%
6,431 * 1,348 8,160
78.8% 4.7% 16.5% 100%
8,995 * * 9,836
91.4% 2.9% 5.7% 100%
17,366 * * 18,548
93.6% 2.7% 3.7% 100%
Household Income
5,267 * * 5,914
89.1% 5.0% 5.9% 100%
25,491 1,440 2,455 29,386
86.7% 4.9% 8.4% 100%
27,197 1,919 3,453 32,569
83.5% 5.9% 10.6% 100%
14,274 1,295 1,758 17,327
82.4% 7.5% 10.1% 100%
Age of HRP
1,552 * * 2,117
73.3% 4.1% 22.6% 100%
19,036 2,453 3,142 24,631
77.3% 10.0% 12.8% 100%
20,666 1,391 2,540 24,597
84.0% 5.7% 10.3% 100%
7,065 * * 8,252
85.6% 4.8% 9.6% 100%
23,880 * 1,064 25,550
93.5% 2.4% 4.2% 100%
* * 0 *
61.7% 38.3% 0.0% 100%
72,228 4,950 8,016 85,194
84.8% 5.8% 9.4% 100%
Table 4.14:
Sample in numbers
Belfast
800 North 800
South
1000
TOTAL
2600
1,067 * 794 2,562
3.4% 2.5% 3.0% 3.0%
4,393 3,320 2,862 10,575
14.2% 12.1% 10.7% 12.4%
25,499 23,373 22,971 71,843
82.2% 84.9% 86.2% 84.3%
* * * *
0.2% 0.5% 0.1% 0.3%
31,018 27,524 26,653 85,195
100% 100% 100% 100%
Belfast
South
Lone adult
18-24
25-44
45-59
Refused
Up to £5,200
£5,201 to £10,400
£10,401 plus
Don't know/refused
60-64
65 or over
Overall, do you think your home is…?
Overall, how satisfied or dissatisfied are you with the general condition of
this property?
Two adults
Lone parent
Small family
Large family
Large adult
Two older
Lone older
Too small
North
NI TOTAL
Too big
Just the right size
Don’t Know
NI TOTAL
45
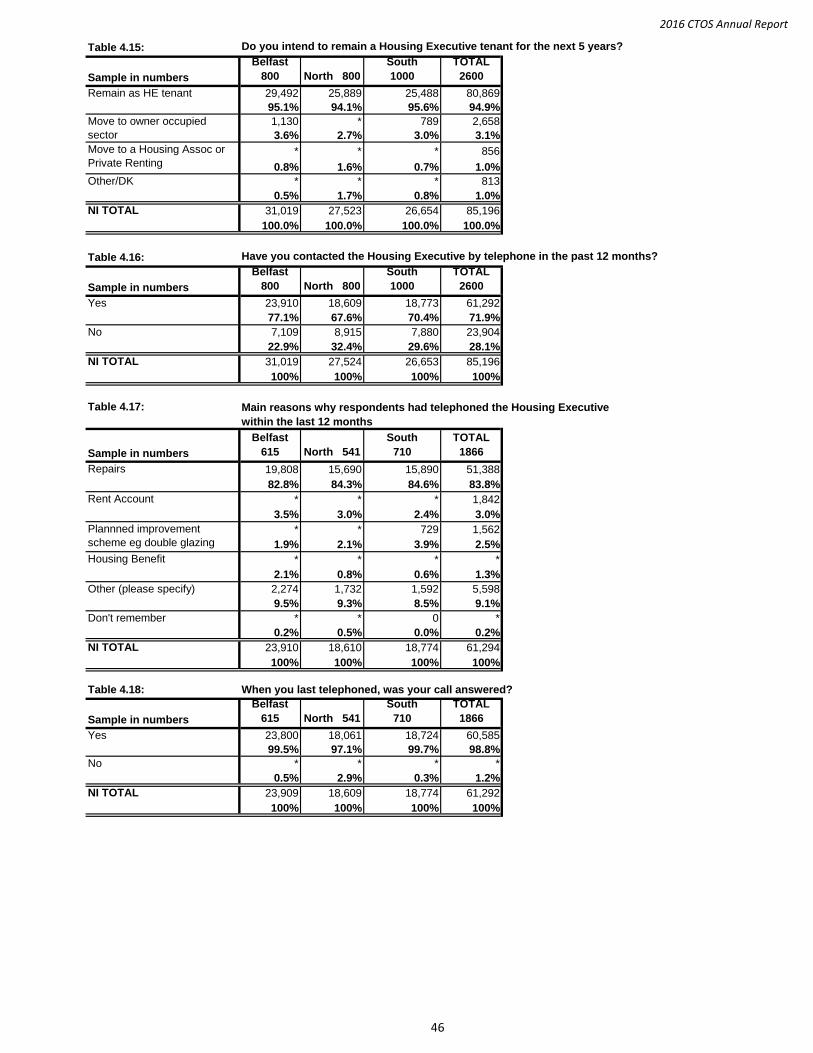
2016 CTOS Annual Report
Table 4.15:
Sample in numbers
Belfast
800 North 800
South
1000
TOTAL
2600
29,492 25,889 25,488 80,869
95.1% 94.1% 95.6% 94.9%
1,130 * 789 2,658
3.6% 2.7% 3.0% 3.1%
* * * 856
0.8% 1.6% 0.7% 1.0%
* * * 813
0.5% 1.7% 0.8% 1.0%
31,019 27,523 26,654 85,196
100.0% 100.0% 100.0% 100.0%
Table 4.16:
Sample in numbers
Belfast
800 North 800
South
1000
TOTAL
2600
23,910 18,609 18,773 61,292
77.1% 67.6% 70.4% 71.9%
7,109 8,915 7,880 23,904
22.9% 32.4% 29.6% 28.1%
31,019 27,524 26,653 85,196
100% 100% 100% 100%
Table 4.17:
Sample in numbers
Belfast
615 North 541
South
710
TOTAL
1866
19,808 15,690 15,890 51,388
82.8% 84.3% 84.6% 83.8%
* * * 1,842
3.5% 3.0% 2.4% 3.0%
* * 729 1,562
1.9% 2.1% 3.9% 2.5%
* * * *
2.1% 0.8% 0.6% 1.3%
2,274 1,732 1,592 5,598
9.5% 9.3% 8.5% 9.1%
* * 0 *
0.2% 0.5% 0.0% 0.2%
23,910 18,610 18,774 61,294
100% 100% 100% 100%
Table 4.18: When you last telephoned, was your call answered?
Sample in numbers
Belfast
615 North 541
South
710
TOTAL
1866
23,800 18,061 18,724 60,585
99.5% 97.1% 99.7% 98.8%
* * * *
0.5% 2.9% 0.3% 1.2%
23,909 18,609 18,774 61,292
100% 100% 100% 100%
Main reasons why respondents had telephoned the Housing Executive
within the last 12 months
Housing Benefit
Other (please specify)
Repairs
No
Rent Account
NI TOTAL
Yes
Do you intend to remain a Housing Executive tenant for the next 5 years?
Have you contacted the Housing Executive by telephone in the past 12 months?
No
NI TOTAL
Yes
Don't remember
Plannned improvement
scheme eg double glazing
NI TOTAL
Move to a Housing Assoc or
Private Renting
Other/DK
NI TOTAL
Remain as HE tenant
Move to owner occupied
sector
46
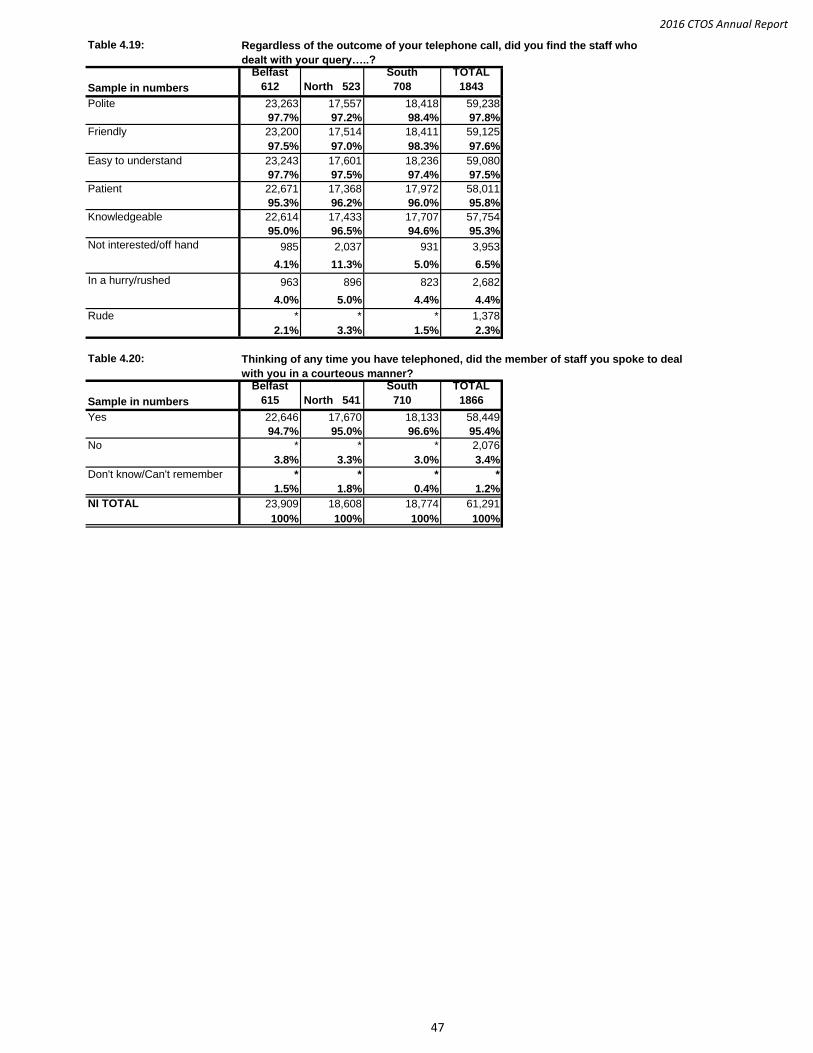
2016 CTOS Annual Report
Table 4.19:
Sample in numbers
Belfast
612 North 523
South
708
TOTAL
1843
23,263 17,557 18,418 59,238
97.7% 97.2% 98.4% 97.8%
23,200 17,514 18,411 59,125
97.5% 97.0% 98.3% 97.6%
23,243 17,601 18,236 59,080
97.7% 97.5% 97.4% 97.5%
22,671 17,368 17,972 58,011
95.3% 96.2% 96.0% 95.8%
22,614 17,433 17,707 57,754
95.0% 96.5% 94.6% 95.3%
985 2,037 931 3,953
4.1% 11.3% 5.0% 6.5%
963 896 823 2,682
4.0% 5.0% 4.4% 4.4%
* * * 1,378
2.1% 3.3% 1.5% 2.3%
Table 4.20:
Sample in numbers
Belfast
615 North 541
South
710
TOTAL
1866
22,646 17,670 18,133 58,449
94.7% 95.0% 96.6% 95.4%
* * * 2,076
3.8% 3.3% 3.0% 3.4%
Don't know/Can't remember * * * *
1.5% 1.8% 0.4% 1.2%
23,909 18,608 18,774 61,291
100% 100% 100% 100%
Regardless of the outcome of your telephone call, did you find the staff who
dealt with your query…..?
No
NI TOTAL
In a hurry/rushed
Rude
Thinking of any time you have telephoned, did the member of staff you spoke to deal
with you in a courteous manner?
Easy to understand
Friendly
Polite
Patient
Not interested/off hand
Knowledgeable
Yes
47
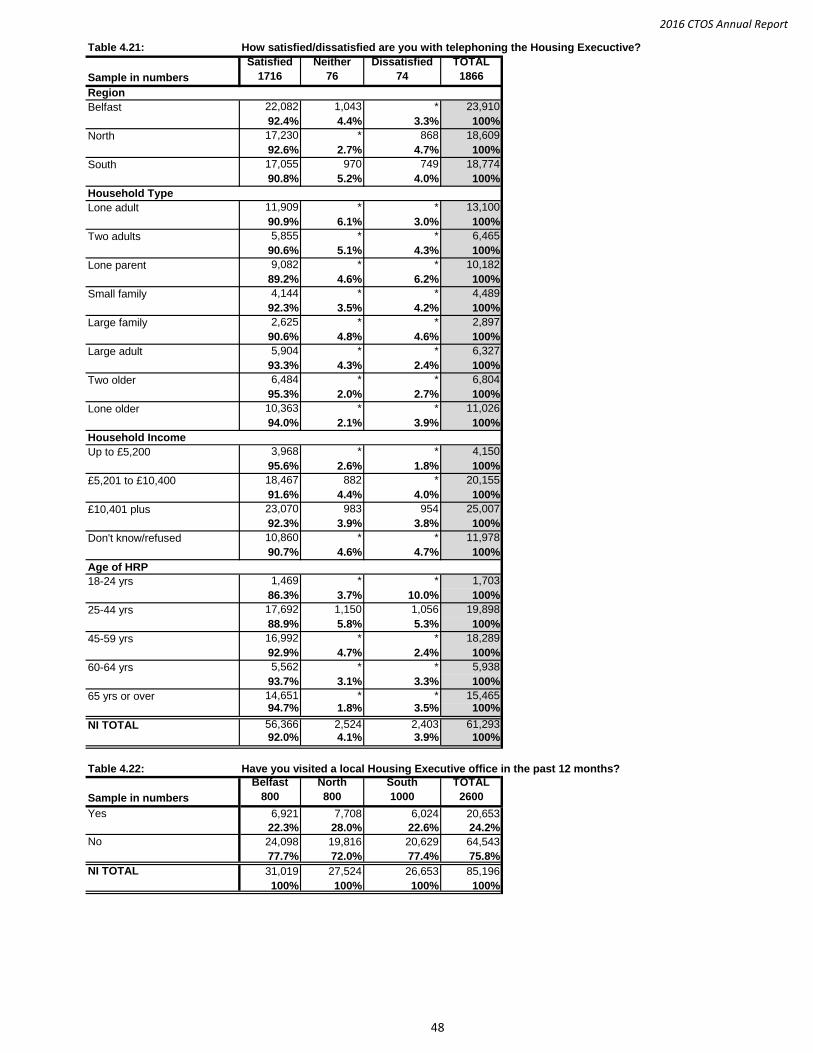
2016 CTOS Annual Report
Table 4.21: How satisfied/dissatisfied are you with telephoning the Housing Execuctive?
Sample in numbers
Satisfied
1716
Neither
76
Dissatisfied
74
TOTAL
1866
Region
22,082 1,043 * 23,910
92.4% 4.4% 3.3% 100%
17,230 * 868 18,609
92.6% 2.7% 4.7% 100%
17,055 970 749 18,774
90.8% 5.2% 4.0% 100%
Household Type
11,909 * * 13,100
90.9% 6.1% 3.0% 100%
5,855 * * 6,465
90.6% 5.1% 4.3% 100%
9,082 * * 10,182
89.2% 4.6% 6.2% 100%
4,144 * * 4,489
92.3% 3.5% 4.2% 100%
2,625 * * 2,897
90.6% 4.8% 4.6% 100%
5,904 * * 6,327
93.3% 4.3% 2.4% 100%
6,484 * * 6,804
95.3% 2.0% 2.7% 100%
10,363 * * 11,026
94.0% 2.1% 3.9% 100%
Household Income
3,968 * * 4,150
95.6% 2.6% 1.8% 100%
18,467 882 * 20,155
91.6% 4.4% 4.0% 100%
23,070 983 954 25,007
92.3% 3.9% 3.8% 100%
10,860 * * 11,978
90.7% 4.6% 4.7% 100%
Age of HRP
1,469 * * 1,703
86.3% 3.7% 10.0% 100%
17,692 1,150 1,056 19,898
88.9% 5.8% 5.3% 100%
16,992 * * 18,289
92.9% 4.7% 2.4% 100%
5,562 * * 5,938
93.7% 3.1% 3.3% 100%
14,651 * * 15,46594.7% 1.8% 3.5% 100%
56,366 2,524 2,403 61,293
92.0% 4.1% 3.9% 100%
Table 4.22: Have you visited a local Housing Executive office in the past 12 months?
Sample in numbers
Belfast
800
North
800
South
1000
TOTAL
2600
6,921 7,708 6,024 20,653
22.3% 28.0% 22.6% 24.2%
24,098 19,816 20,629 64,543
77.7% 72.0% 77.4% 75.8%
31,019 27,524 26,653 85,196
100% 100% 100% 100%
North
60-64 yrs
Two adults
Large family
Large adult
Two older
Lone older
Up to £5,200
Lone parent
Small family
18-24 yrs
Yes
No
NI TOTAL
Belfast
£5,201 to £10,400
Don't know/refused
65 yrs or over
NI TOTAL
South
Lone adult
25-44 yrs
45-59 yrs
£10,401 plus
48
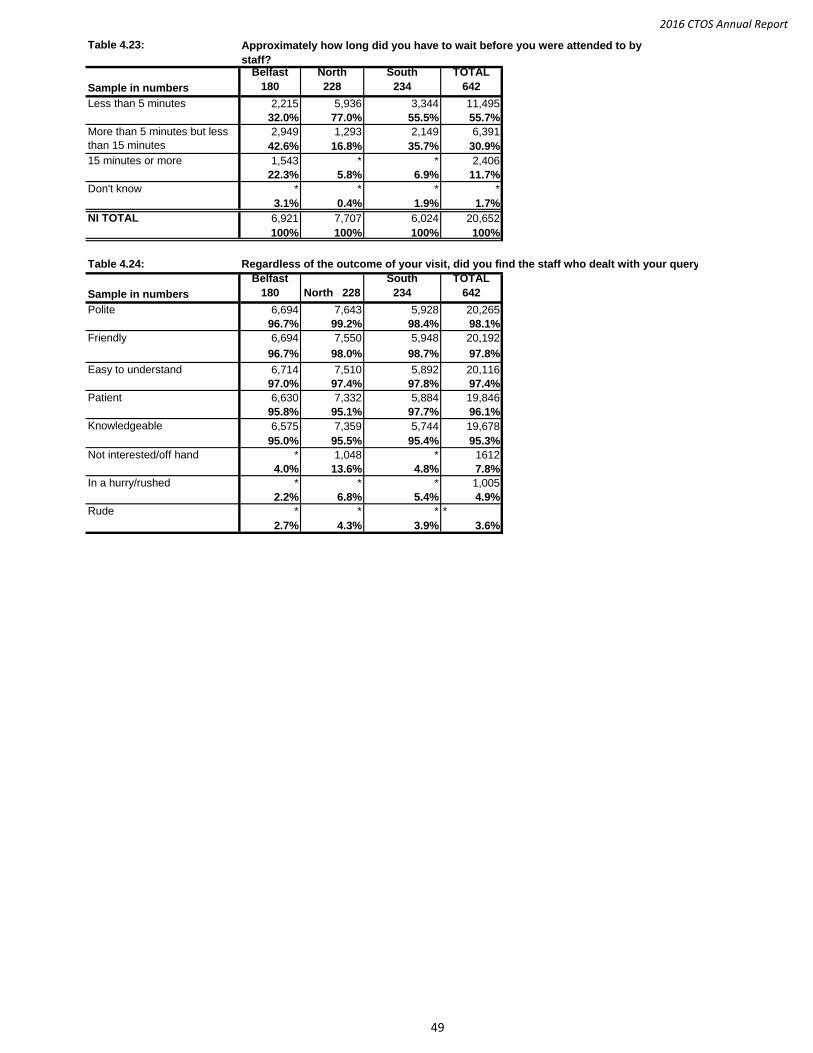
2016 CTOS Annual Report
Table 4.23:
Sample in numbers
Belfast
180
North
228
South
234
TOTAL
642
2,215 5,936 3,344 11,495
32.0% 77.0% 55.5% 55.7%
2,949 1,293 2,149 6,391
42.6% 16.8% 35.7% 30.9%
1,543 * * 2,406
22.3% 5.8% 6.9% 11.7%
* * * *
3.1% 0.4% 1.9% 1.7%
6,921 7,707 6,024 20,652
100% 100% 100% 100%
Table 4.24: Regardless of the outcome of your visit, did you find the staff who dealt with your query....
Sample in numbers
Belfast
180 North 228
South
234
TOTAL
642
6,694 7,643 5,928 20,265
96.7% 99.2% 98.4% 98.1%
6,694 7,550 5,948 20,192
96.7% 98.0% 98.7% 97.8%
6,714 7,510 5,892 20,116
97.0% 97.4% 97.8% 97.4%
6,630 7,332 5,884 19,846
95.8% 95.1% 97.7% 96.1%
6,575 7,359 5,744 19,678
95.0% 95.5% 95.4% 95.3%
* 1,048 * 1612
4.0% 13.6% 4.8% 7.8%
* * * 1,005
2.2% 6.8% 5.4% 4.9%
* * * *
2.7% 4.3% 3.9% 3.6%
NI TOTAL
Approximately how long did you have to wait before you were attended to by
staff?
Polite
Patient
Knowledgeable
Rude
Friendly
Easy to understand
Not interested/off hand
In a hurry/rushed
15 minutes or more
More than 5 minutes but less
than 15 minutes
Less than 5 minutes
Don't know
49
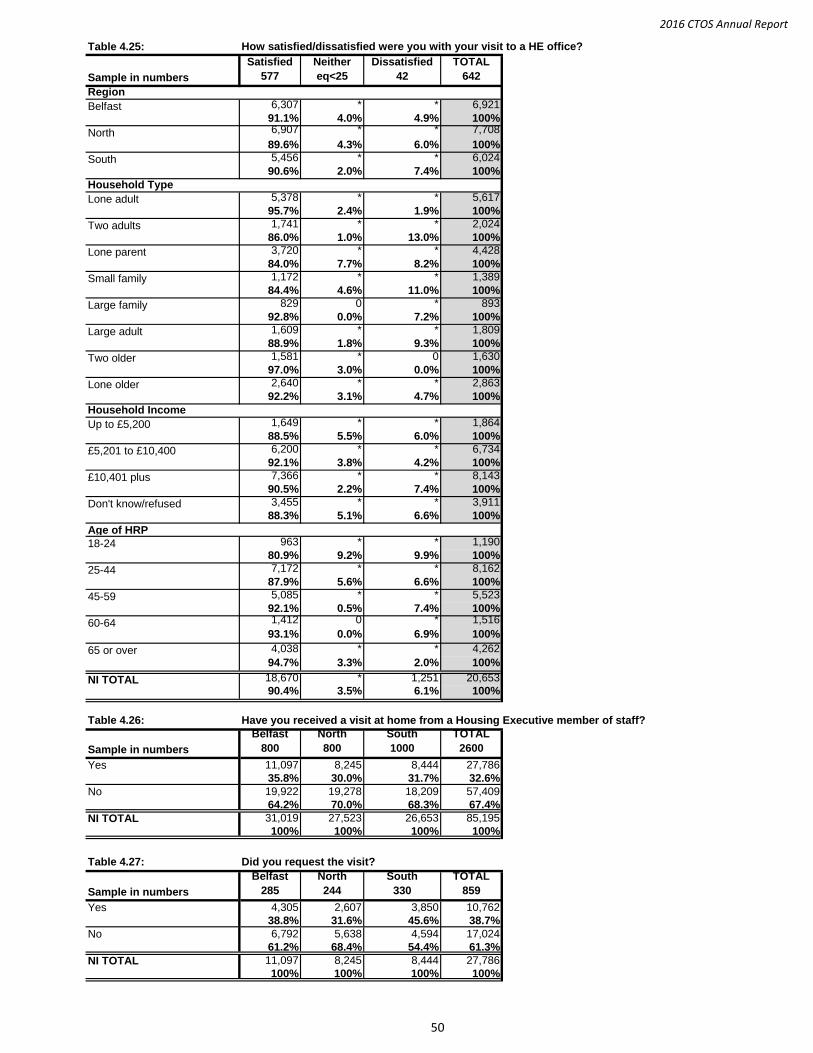
2016 CTOS Annual Report
Table 4.25:
Sample in numbers
Satisfied
577
Neither
eq<25
Dissatisfied
42
TOTAL
642
Region6,307 * * 6,921
91.1% 4.0% 4.9% 100%6,907 * * 7,708
89.6% 4.3% 6.0% 100%
5,456 * * 6,024
90.6% 2.0% 7.4% 100%
Household Type5,378 * * 5,617
95.7% 2.4% 1.9% 100%
1,741 * * 2,024
86.0% 1.0% 13.0% 100%
3,720 * * 4,428
84.0% 7.7% 8.2% 100%
1,172 * * 1,389
84.4% 4.6% 11.0% 100%
829 0 * 893
92.8% 0.0% 7.2% 100%
1,609 * * 1,809
88.9% 1.8% 9.3% 100%
1,581 * 0 1,630
97.0% 3.0% 0.0% 100%
2,640 * * 2,863
92.2% 3.1% 4.7% 100%
Household Income1,649 * * 1,864
88.5% 5.5% 6.0% 100%
6,200 * * 6,734
92.1% 3.8% 4.2% 100%
7,366 * * 8,143
90.5% 2.2% 7.4% 100%
3,455 * * 3,911
88.3% 5.1% 6.6% 100%
Age of HRP963 * * 1,190
80.9% 9.2% 9.9% 100%
7,172 * * 8,162
87.9% 5.6% 6.6% 100%
5,085 * * 5,523
92.1% 0.5% 7.4% 100%1,412 0 * 1,516
93.1% 0.0% 6.9% 100%
4,038 * * 4,262
94.7% 3.3% 2.0% 100%
18,670 * 1,251 20,653
90.4% 3.5% 6.1% 100%
Table 4.26: Have you received a visit at home from a Housing Executive member of staff?
Sample in numbers
Belfast
800
North
800
South
1000
TOTAL
2600
11,097 8,245 8,444 27,786
35.8% 30.0% 31.7% 32.6%
19,922 19,278 18,209 57,409
64.2% 70.0% 68.3% 67.4%
31,019 27,523 26,653 85,195
100% 100% 100% 100%
Table 4.27: Did you request the visit?
Sample in numbers
Belfast
285
North
244
South
330
TOTAL
859
4,305 2,607 3,850 10,762
38.8% 31.6% 45.6% 38.7%
6,792 5,638 4,594 17,024
61.2% 68.4% 54.4% 61.3%
11,097 8,245 8,444 27,786
100% 100% 100% 100%
How satisfied/dissatisfied were you with your visit to a HE office?
North
45-59
Belfast
Lone adult
Two adults
Large family
Lone parent
Small family
Don't know/refused
Lone older
Up to £5,200
South
Yes
Yes
No
18-24
25-44
£5,201 to £10,400
£10,401 plus
Large adult
Two older
60-64
NI TOTAL
65 or over
NI TOTAL
NI TOTAL
No
50
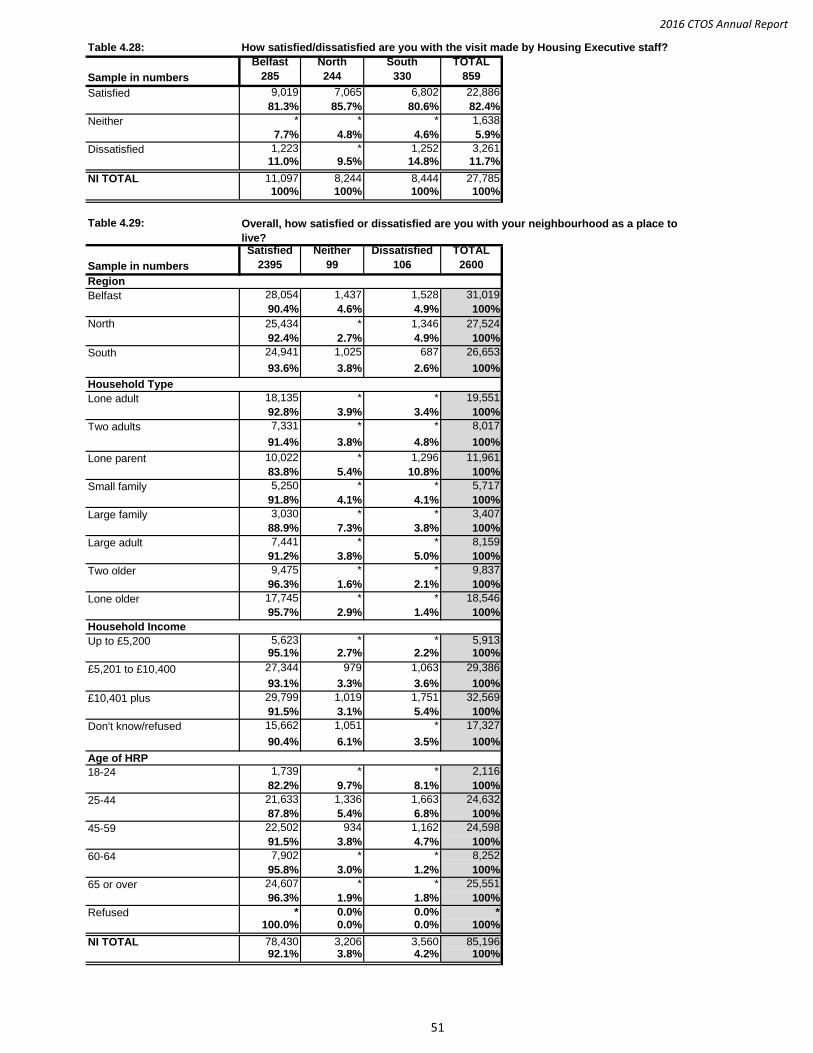
2016 CTOS Annual Report
Table 4.28:
Sample in numbers
Belfast
285
North
244
South
330
TOTAL
859
9,019 7,065 6,802 22,886
81.3% 85.7% 80.6% 82.4%
* * * 1,638
7.7% 4.8% 4.6% 5.9%
1,223 * 1,252 3,261
11.0% 9.5% 14.8% 11.7%
11,097 8,244 8,444 27,785
100% 100% 100% 100%
Table 4.29:
Sample in numbers
Satisfied
2395
Neither
99
Dissatisfied
106
TOTAL
2600
Region
28,054 1,437 1,528 31,019
90.4% 4.6% 4.9% 100%
25,434 * 1,346 27,524
92.4% 2.7% 4.9% 100%
24,941 1,025 687 26,653
93.6% 3.8% 2.6% 100%
Household Type
18,135 * * 19,551
92.8% 3.9% 3.4% 100%
7,331 * * 8,017
91.4% 3.8% 4.8% 100%
10,022 * 1,296 11,961
83.8% 5.4% 10.8% 100%
5,250 * * 5,717
91.8% 4.1% 4.1% 100%
3,030 * * 3,407
88.9% 7.3% 3.8% 100%
7,441 * * 8,159
91.2% 3.8% 5.0% 100%
9,475 * * 9,837
96.3% 1.6% 2.1% 100%
17,745 * * 18,546
95.7% 2.9% 1.4% 100%
Household Income
5,623 * * 5,91395.1% 2.7% 2.2% 100%
27,344 979 1,063 29,386
93.1% 3.3% 3.6% 100%
29,799 1,019 1,751 32,569
91.5% 3.1% 5.4% 100%
15,662 1,051 * 17,327
90.4% 6.1% 3.5% 100%
Age of HRP
1,739 * * 2,116
82.2% 9.7% 8.1% 100%
21,633 1,336 1,663 24,632
87.8% 5.4% 6.8% 100%
22,502 934 1,162 24,598
91.5% 3.8% 4.7% 100%
7,902 * * 8,252
95.8% 3.0% 1.2% 100%
24,607 * * 25,551
96.3% 1.9% 1.8% 100%
* 0.0% 0.0% *100.0% 0.0% 0.0% 100%
78,430 3,206 3,560 85,19692.1% 3.8% 4.2% 100%
How satisfied/dissatisfied are you with the visit made by Housing Executive staff?
Overall, how satisfied or dissatisfied are you with your neighbourhood as a place to
live?
NI TOTAL
65 or over
18-24
25-44
45-59
60-64
North
South
Lone adult
Two adults
Lone parent
Small family
Large family
NI TOTAL
Lone older
Up to £5,200
Don't know/refused
Refused
Large adult
Belfast
Satisfied
Two older
£5,201 to £10,400
£10,401 plus
Neither
Dissatisfied
51
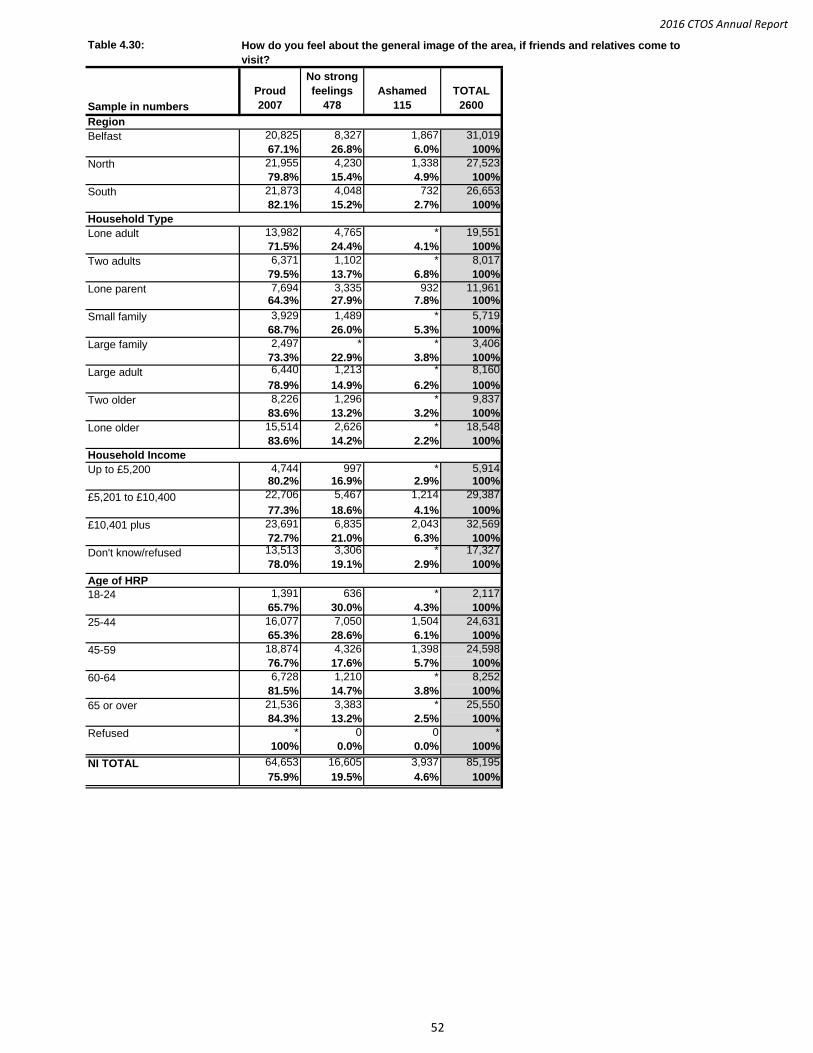
2016 CTOS Annual Report
Table 4.30:
Sample in numbers
Proud
2007
No strong
feelings
478
Ashamed
115
TOTAL
2600
Region
20,825 8,327 1,867 31,019
67.1% 26.8% 6.0% 100%
21,955 4,230 1,338 27,523
79.8% 15.4% 4.9% 100%
21,873 4,048 732 26,653
82.1% 15.2% 2.7% 100%
Household Type
13,982 4,765 * 19,551
71.5% 24.4% 4.1% 100%
6,371 1,102 * 8,017
79.5% 13.7% 6.8% 100%
7,694 3,335 932 11,96164.3% 27.9% 7.8% 100%
3,929 1,489 * 5,719
68.7% 26.0% 5.3% 100%
2,497 * * 3,406
73.3% 22.9% 3.8% 100%6,440 1,213 * 8,160
78.9% 14.9% 6.2% 100%
8,226 1,296 * 9,837
83.6% 13.2% 3.2% 100%
15,514 2,626 * 18,548
83.6% 14.2% 2.2% 100%
Household Income
4,744 997 * 5,91480.2% 16.9% 2.9% 100%
22,706 5,467 1,214 29,387
77.3% 18.6% 4.1% 100%
23,691 6,835 2,043 32,569
72.7% 21.0% 6.3% 100%13,513 3,306 * 17,327
78.0% 19.1% 2.9% 100%
Age of HRP1,391 636 * 2,117
65.7% 30.0% 4.3% 100%
16,077 7,050 1,504 24,631
65.3% 28.6% 6.1% 100%
18,874 4,326 1,398 24,598
76.7% 17.6% 5.7% 100%
6,728 1,210 * 8,252
81.5% 14.7% 3.8% 100%
21,536 3,383 * 25,550
84.3% 13.2% 2.5% 100%
* 0 0 *
100% 0.0% 0.0% 100%
64,653 16,605 3,937 85,195
75.9% 19.5% 4.6% 100%
How do you feel about the general image of the area, if friends and relatives come to
visit?
NI TOTAL
18-24
25-44
Don't know/refused
Belfast
Small family
Large family
Large adult
Lone adult
Two adults
Lone parent
North
South
Refused
Two older
Lone older
60-64
65 or over
45-59
Up to £5,200
£5,201 to £10,400
£10,401 plus
52
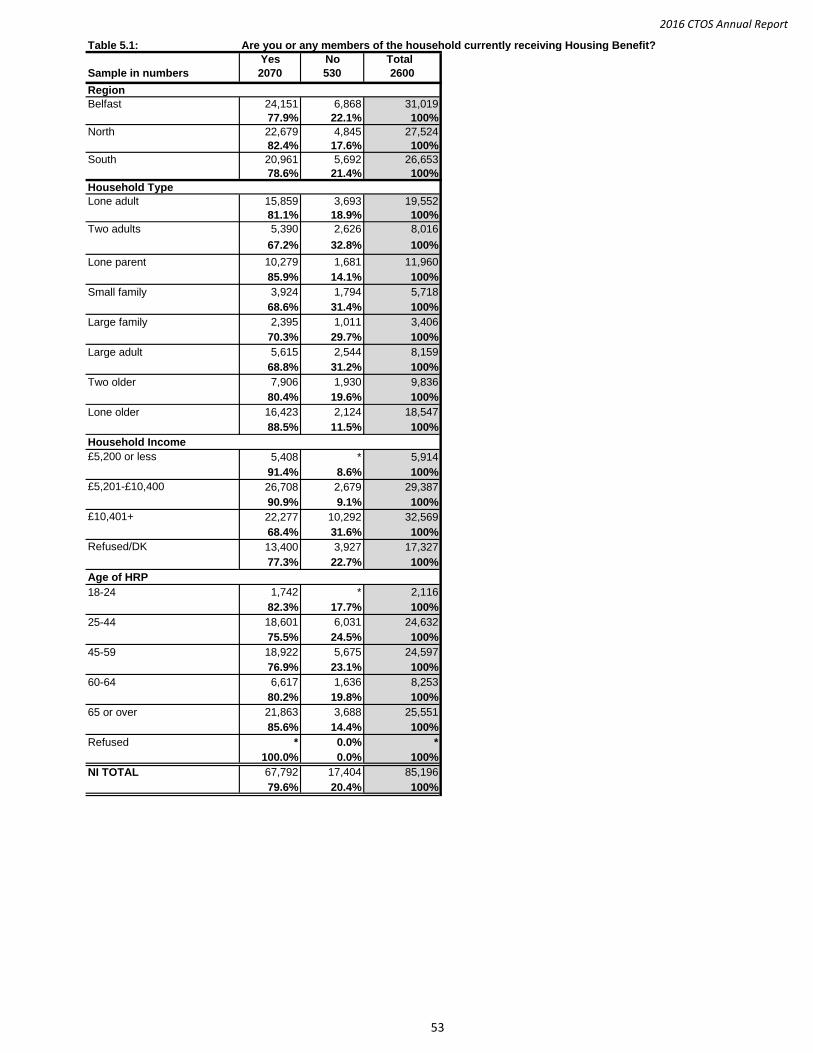
2016 CTOS Annual Report
Table 5.1: Are you or any members of the household currently receiving Housing Benefit?
Yes No Total
Sample in numbers 2070 530 2600
Region
Belfast 24,151 6,868 31,019
77.9% 22.1% 100%
North 22,679 4,845 27,524
82.4% 17.6% 100%
South 20,961 5,692 26,653
78.6% 21.4% 100%
Household Type
Lone adult 15,859 3,693 19,552
81.1% 18.9% 100%
Two adults 5,390 2,626 8,016
67.2% 32.8% 100%
Lone parent 10,279 1,681 11,960
85.9% 14.1% 100%
Small family 3,924 1,794 5,718
68.6% 31.4% 100%
Large family 2,395 1,011 3,406
70.3% 29.7% 100%
Large adult 5,615 2,544 8,159
68.8% 31.2% 100%
Two older 7,906 1,930 9,836
80.4% 19.6% 100%
Lone older 16,423 2,124 18,547
88.5% 11.5% 100%
Household Income
£5,200 or less 5,408 * 5,914
91.4% 8.6% 100%
£5,201-£10,400 26,708 2,679 29,387
90.9% 9.1% 100%
£10,401+ 22,277 10,292 32,569
68.4% 31.6% 100%
Refused/DK 13,400 3,927 17,327
77.3% 22.7% 100%
Age of HRP
18-24 1,742 * 2,116
82.3% 17.7% 100%
25-44 18,601 6,031 24,632
75.5% 24.5% 100%
45-59 18,922 5,675 24,597
76.9% 23.1% 100%
60-64 6,617 1,636 8,253
80.2% 19.8% 100%
65 or over 21,863 3,688 25,551
85.6% 14.4% 100%
Refused * 0.0% *
100.0% 0.0% 100%
NI TOTAL 67,792 17,404 85,196
79.6% 20.4% 100%
53
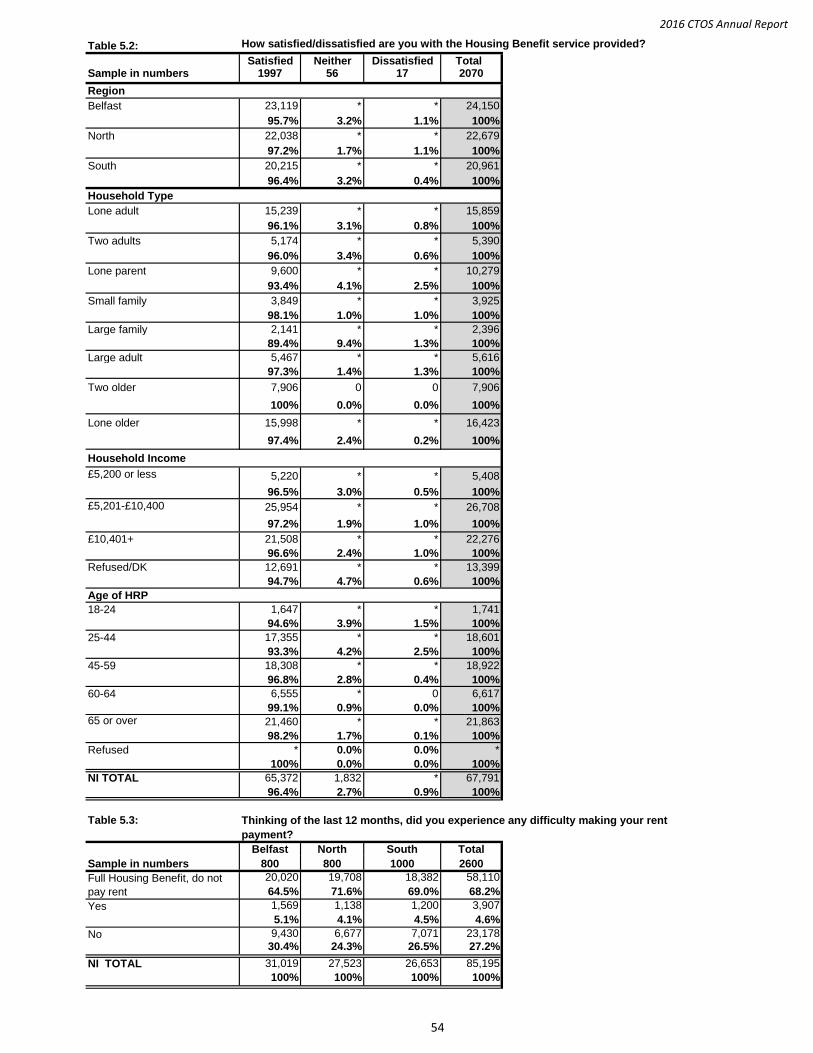
2016 CTOS Annual Report
Table 5.2: How satisfied/dissatisfied are you with the Housing Benefit service provided?
Satisfied Neither Dissatisfied Total Sample in numbers 1997 56 17 2070
Region
Belfast 23,119 * * 24,150
95.7% 3.2% 1.1% 100%
North 22,038 * * 22,679
97.2% 1.7% 1.1% 100%
South 20,215 * * 20,961
96.4% 3.2% 0.4% 100%
Household Type
Lone adult 15,239 * * 15,859
96.1% 3.1% 0.8% 100%
Two adults 5,174 * * 5,390
96.0% 3.4% 0.6% 100%
Lone parent 9,600 * * 10,279
93.4% 4.1% 2.5% 100%
Small family 3,849 * * 3,925
98.1% 1.0% 1.0% 100%
Large family 2,141 * * 2,396
89.4% 9.4% 1.3% 100%
Large adult 5,467 * * 5,616
97.3% 1.4% 1.3% 100%
Two older 7,906 0 0 7,906
100% 0.0% 0.0% 100%
Lone older 15,998 * * 16,423
97.4% 2.4% 0.2% 100%
Household Income
£5,200 or less 5,220 * * 5,408
96.5% 3.0% 0.5% 100%
£5,201-£10,400 25,954 * * 26,708
97.2% 1.9% 1.0% 100%
£10,401+ 21,508 * * 22,276
96.6% 2.4% 1.0% 100%
Refused/DK 12,691 * * 13,399
94.7% 4.7% 0.6% 100%
Age of HRP
18-24 1,647 * * 1,741
94.6% 3.9% 1.5% 100%
25-44 17,355 * * 18,601
93.3% 4.2% 2.5% 100%
45-59 18,308 * * 18,922
96.8% 2.8% 0.4% 100%
60-64 6,555 * 0 6,617
99.1% 0.9% 0.0% 100%65 or over 21,460 * * 21,863
98.2% 1.7% 0.1% 100%
Refused * 0.0% 0.0% *
100% 0.0% 0.0% 100%
NI TOTAL 65,372 1,832 * 67,791
96.4% 2.7% 0.9% 100%
Table 5.3:
Belfast North South Total
Sample in numbers 800 800 1000 2600
20,020 19,708 18,382 58,110
64.5% 71.6% 69.0% 68.2%
Yes 1,569 1,138 1,200 3,907
5.1% 4.1% 4.5% 4.6%
No 9,430 6,677 7,071 23,178
30.4% 24.3% 26.5% 27.2%
NI TOTAL 31,019 27,523 26,653 85,195
100% 100% 100% 100%
Thinking of the last 12 months, did you experience any difficulty making your rent
payment?
Full Housing Benefit, do not
pay rent
54
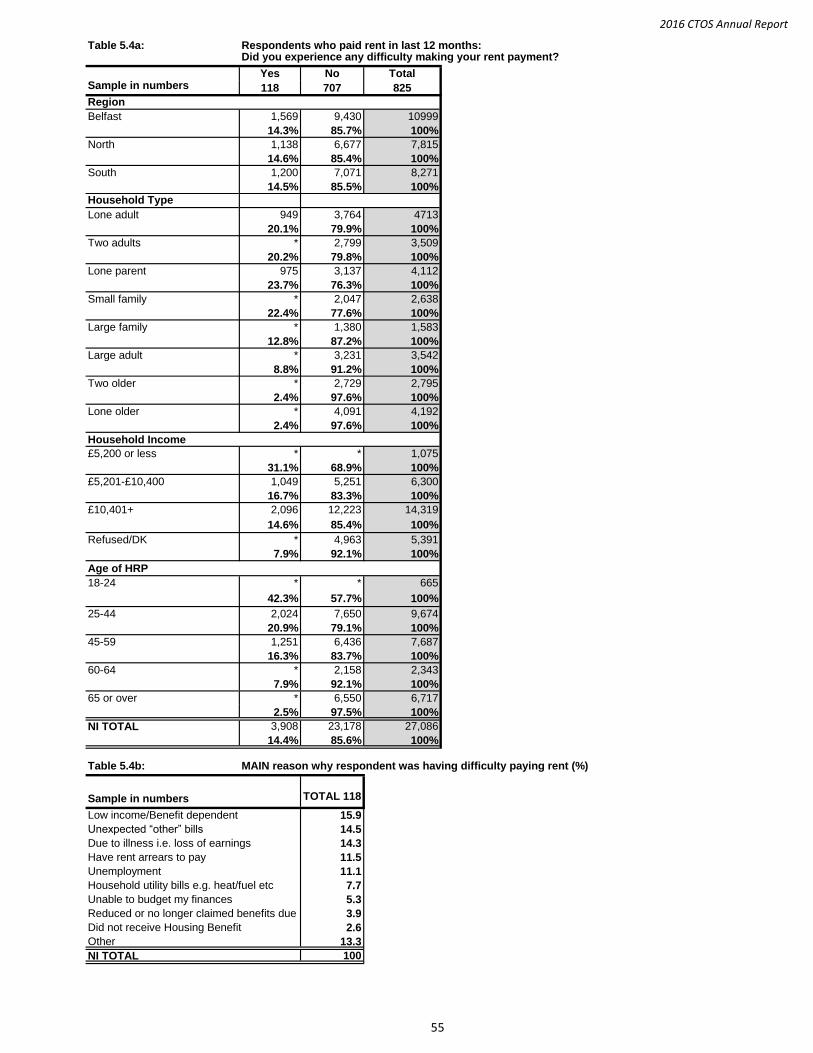
2016 CTOS Annual Report
Table 5.4a: Respondents who paid rent in last 12 months:Did you experience any difficulty making your rent payment?
Yes No TotalSample in numbers 118 707 825
Region
Belfast 1,569 9,430 10999
14.3% 85.7% 100%
North 1,138 6,677 7,815
14.6% 85.4% 100%
South 1,200 7,071 8,271
14.5% 85.5% 100%
Household Type
Lone adult 949 3,764 4713
20.1% 79.9% 100%
Two adults * 2,799 3,509
20.2% 79.8% 100%
Lone parent 975 3,137 4,112
23.7% 76.3% 100%
Small family * 2,047 2,638
22.4% 77.6% 100%
Large family * 1,380 1,583
12.8% 87.2% 100%
Large adult * 3,231 3,542
8.8% 91.2% 100%
Two older * 2,729 2,795
2.4% 97.6% 100%
Lone older * 4,091 4,192
2.4% 97.6% 100%
Household Income
£5,200 or less * * 1,075
31.1% 68.9% 100%
£5,201-£10,400 1,049 5,251 6,300
16.7% 83.3% 100%
£10,401+ 2,096 12,223 14,319
14.6% 85.4% 100%
Refused/DK * 4,963 5,391
7.9% 92.1% 100%
Age of HRP
18-24 * * 665
42.3% 57.7% 100%
25-44 2,024 7,650 9,674
20.9% 79.1% 100%
45-59 1,251 6,436 7,687
16.3% 83.7% 100%
60-64 * 2,158 2,343
7.9% 92.1% 100%
65 or over * 6,550 6,717
2.5% 97.5% 100%
NI TOTAL 3,908 23,178 27,086
14.4% 85.6% 100%
Table 5.4b: MAIN reason why respondent was having difficulty paying rent (%)
TOTAL 118
15.9
14.5
14.3
11.5
11.1
7.7
5.3
3.9
2.6
13.3
100
Due to illness i.e. loss of earnings
Have rent arrears to pay
Other
Unable to budget my finances
Reduced or no longer claimed benefits due
NI TOTAL
Sample in numbers
Low income/Benefit dependent
Unexpected “other” bills
Did not receive Housing Benefit
Unemployment
Household utility bills e.g. heat/fuel etc
55
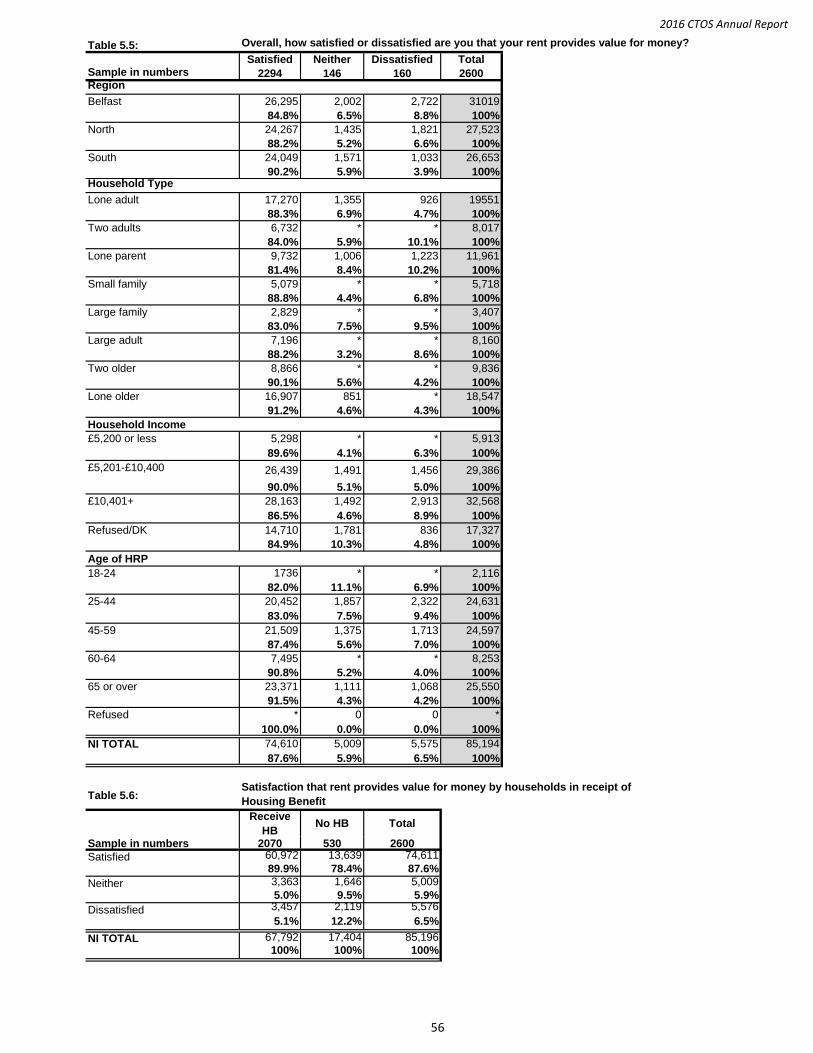
2016 CTOS Annual Report
Table 5.5: Overall, how satisfied or dissatisfied are you that your rent provides value for money?
Satisfied Neither Dissatisfied Total
2294 146 160 2600Region
Belfast 26,295 2,002 2,722 31019
84.8% 6.5% 8.8% 100%
North 24,267 1,435 1,821 27,523
88.2% 5.2% 6.6% 100%
South 24,049 1,571 1,033 26,653
90.2% 5.9% 3.9% 100%Household Type
Lone adult 17,270 1,355 926 19551
88.3% 6.9% 4.7% 100%
Two adults 6,732 * * 8,017
84.0% 5.9% 10.1% 100%
Lone parent 9,732 1,006 1,223 11,961
81.4% 8.4% 10.2% 100%
Small family 5,079 * * 5,718
88.8% 4.4% 6.8% 100%
Large family 2,829 * * 3,407
83.0% 7.5% 9.5% 100%
Large adult 7,196 * * 8,160
88.2% 3.2% 8.6% 100%
Two older 8,866 * * 9,836
90.1% 5.6% 4.2% 100%
Lone older 16,907 851 * 18,547
91.2% 4.6% 4.3% 100%
Household Income
£5,200 or less 5,298 * * 5,913
89.6% 4.1% 6.3% 100%
£5,201-£10,400 26,439 1,491 1,456 29,386
90.0% 5.1% 5.0% 100%
£10,401+ 28,163 1,492 2,913 32,568
86.5% 4.6% 8.9% 100%
Refused/DK 14,710 1,781 836 17,327
84.9% 10.3% 4.8% 100%
Age of HRP
18-24 1736 * * 2,116
82.0% 11.1% 6.9% 100%
25-44 20,452 1,857 2,322 24,631
83.0% 7.5% 9.4% 100%
45-59 21,509 1,375 1,713 24,597
87.4% 5.6% 7.0% 100%
60-64 7,495 * * 8,253
90.8% 5.2% 4.0% 100%
65 or over 23,371 1,111 1,068 25,550
91.5% 4.3% 4.2% 100%
Refused * 0 0 *
100.0% 0.0% 0.0% 100%
NI TOTAL 74,610 5,009 5,575 85,194
87.6% 5.9% 6.5% 100%
Table 5.6:
Receive
HBNo HB Total
Sample in numbers 2070 530 260060,972 13,639 74,611
89.9% 78.4% 87.6%
3,363 1,646 5,009
5.0% 9.5% 5.9%3,457 2,119 5,576
5.1% 12.2% 6.5%
NI TOTAL 67,792 17,404 85,196
100% 100% 100%
Satisfaction that rent provides value for money by households in receipt of
Housing Benefit
Sample in numbers
Satisfied
Neither
Dissatisfied
56
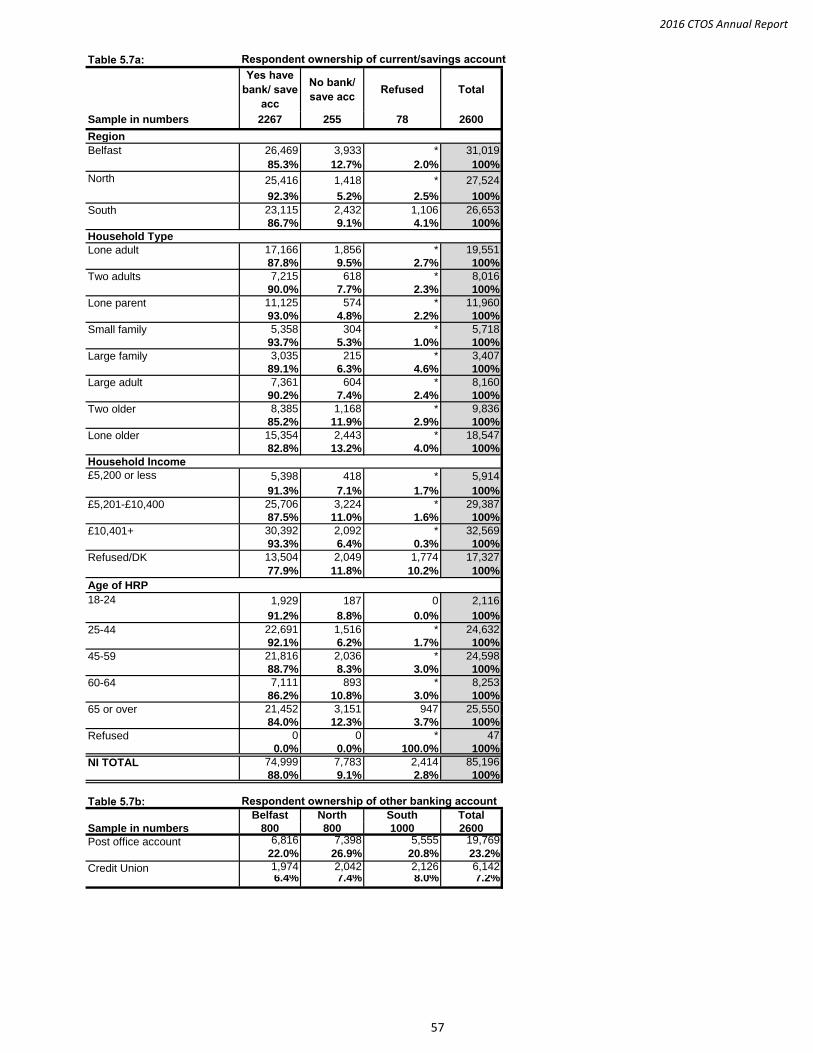
2016 CTOS Annual Report
Table 5.7a:
Yes have
bank/ save
acc
No bank/
save accRefused Total
Sample in numbers 2267 255 78 2600
Region
26,469 3,933 * 31,019
85.3% 12.7% 2.0% 100%
25,416 1,418 * 27,524
92.3% 5.2% 2.5% 100%
23,115 2,432 1,106 26,653
86.7% 9.1% 4.1% 100%
Household Type
17,166 1,856 * 19,551
87.8% 9.5% 2.7% 100%
7,215 618 * 8,016
90.0% 7.7% 2.3% 100%
11,125 574 * 11,960
93.0% 4.8% 2.2% 100%
5,358 304 * 5,718
93.7% 5.3% 1.0% 100%
3,035 215 * 3,407
89.1% 6.3% 4.6% 100%
7,361 604 * 8,160
90.2% 7.4% 2.4% 100%
8,385 1,168 * 9,836
85.2% 11.9% 2.9% 100%
15,354 2,443 * 18,547
82.8% 13.2% 4.0% 100%
Household Income
£5,200 or less 5,398 418 * 5,914
91.3% 7.1% 1.7% 100%
£5,201-£10,400 25,706 3,224 * 29,387
87.5% 11.0% 1.6% 100%
£10,401+ 30,392 2,092 * 32,569
93.3% 6.4% 0.3% 100%
Refused/DK 13,504 2,049 1,774 17,327
77.9% 11.8% 10.2% 100%
Age of HRP
1,929 187 0 2,116
91.2% 8.8% 0.0% 100%
22,691 1,516 * 24,632
92.1% 6.2% 1.7% 100%
21,816 2,036 * 24,598
88.7% 8.3% 3.0% 100%
7,111 893 * 8,253
86.2% 10.8% 3.0% 100%
21,452 3,151 947 25,550
84.0% 12.3% 3.7% 100%
0 0 * 47
0.0% 0.0% 100.0% 100%
NI TOTAL 74,999 7,783 2,414 85,196
88.0% 9.1% 2.8% 100%
Table 5.7b:
Belfast North South Total
Sample in numbers 800 800 1000 26006,816 7,398 5,555 19,769
22.0% 26.9% 20.8% 23.2%
Credit Union 1,974 2,042 2,126 6,1426.4% 7.4% 8.0% 7.2%
Respondent ownership of current/savings account
Post office account
Respondent ownership of other banking account
Belfast
18-24
North
Two adults
Small family
Large family
Large adult
South
Lone adult
Lone parent
25-44
45-59
60-64
Refused
65 or over
Two older
Lone older
57
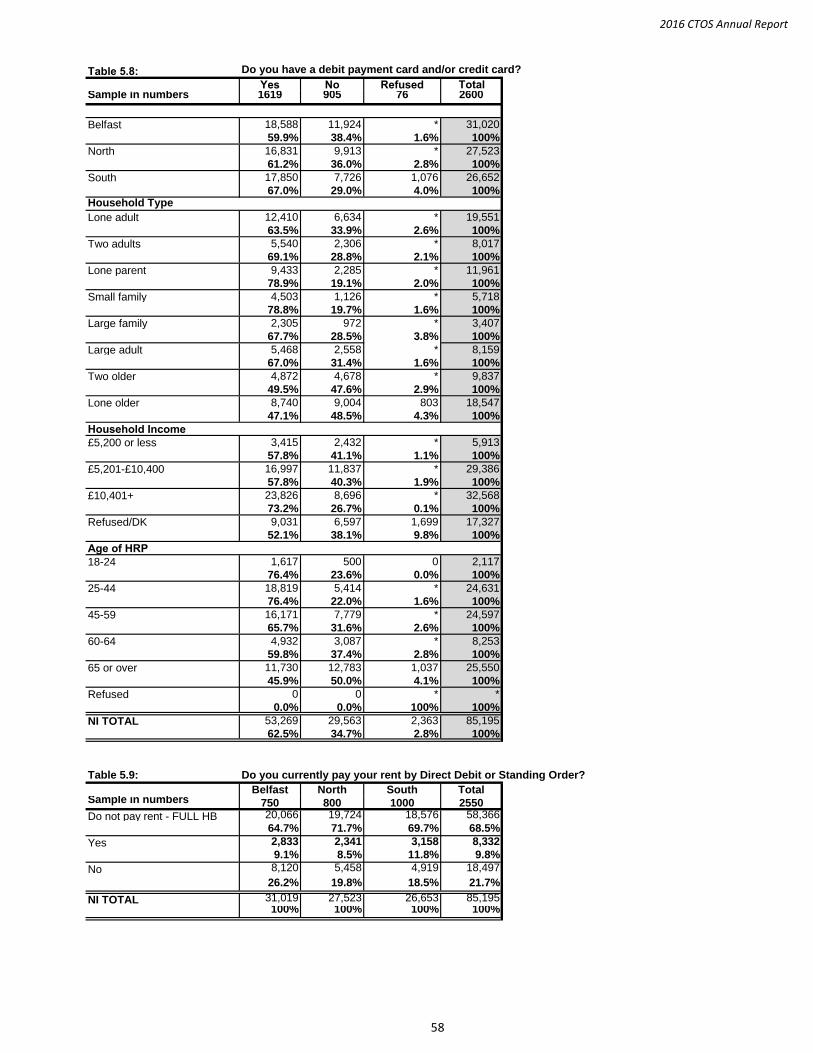
2016 CTOS Annual Report
Table 5.8: Do you have a debit payment card and/or credit card?
Yes No Refused TotalSample in numbers 1619 905 76 2600
Belfast 18,588 11,924 * 31,020
59.9% 38.4% 1.6% 100%
North 16,831 9,913 * 27,523
61.2% 36.0% 2.8% 100%
South 17,850 7,726 1,076 26,652
67.0% 29.0% 4.0% 100%Household Type
Lone adult 12,410 6,634 * 19,551
63.5% 33.9% 2.6% 100%
Two adults 5,540 2,306 * 8,017
69.1% 28.8% 2.1% 100%
Lone parent 9,433 2,285 * 11,961
78.9% 19.1% 2.0% 100%
Small family 4,503 1,126 * 5,718
78.8% 19.7% 1.6% 100%
Large family 2,305 972 * 3,407
67.7% 28.5% 3.8% 100%
Large adult 5,468 2,558 * 8,159
67.0% 31.4% 1.6% 100%
Two older 4,872 4,678 * 9,837
49.5% 47.6% 2.9% 100%
Lone older 8,740 9,004 803 18,547
47.1% 48.5% 4.3% 100%
Household Income
£5,200 or less 3,415 2,432 * 5,913
57.8% 41.1% 1.1% 100%
£5,201-£10,400 16,997 11,837 * 29,386
57.8% 40.3% 1.9% 100%
£10,401+ 23,826 8,696 * 32,568
73.2% 26.7% 0.1% 100%
Refused/DK 9,031 6,597 1,699 17,327
52.1% 38.1% 9.8% 100%
Age of HRP
18-24 1,617 500 0 2,117
76.4% 23.6% 0.0% 100%
25-44 18,819 5,414 * 24,631
76.4% 22.0% 1.6% 100%
45-59 16,171 7,779 * 24,597
65.7% 31.6% 2.6% 100%
60-64 4,932 3,087 * 8,253
59.8% 37.4% 2.8% 100%
65 or over 11,730 12,783 1,037 25,550
45.9% 50.0% 4.1% 100%
Refused 0 0 * *
0.0% 0.0% 100% 100%
NI TOTAL 53,269 29,563 2,363 85,195
62.5% 34.7% 2.8% 100%
Table 5.9: Do you currently pay your rent by Direct Debit or Standing Order?
Belfast North South TotalSample in numbers 750 800 1000 2550
Do not pay rent - FULL HB 20,066 19,724 18,576 58,366
64.7% 71.7% 69.7% 68.5%
Yes 2,833 2,341 3,158 8,332
9.1% 8.5% 11.8% 9.8%
No 8,120 5,458 4,919 18,497
26.2% 19.8% 18.5% 21.7%
NI TOTAL 31,019 27,523 26,653 85,195100% 100% 100% 100%
58
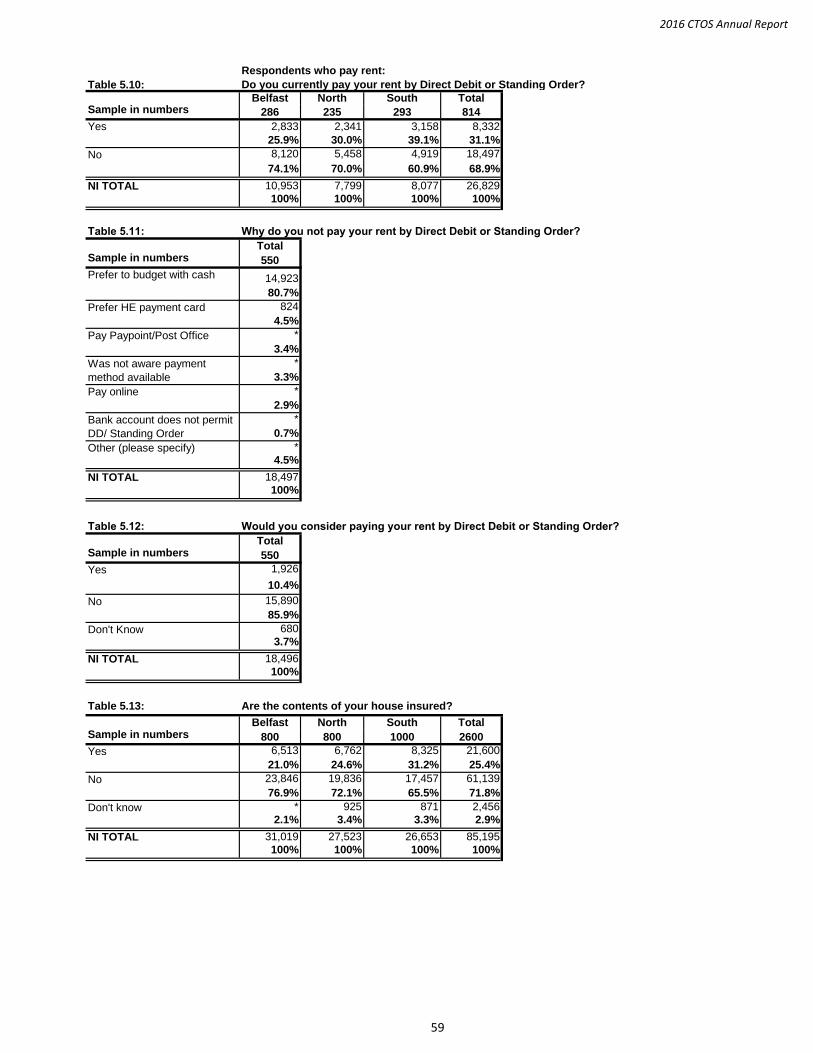
2016 CTOS Annual Report
Respondents who pay rent:
Table 5.10: Do you currently pay your rent by Direct Debit or Standing Order?
Belfast North South TotalSample in numbers 286 235 293 814
Yes 2,833 2,341 3,158 8,332
25.9% 30.0% 39.1% 31.1%
No 8,120 5,458 4,919 18,497
74.1% 70.0% 60.9% 68.9%
NI TOTAL 10,953 7,799 8,077 26,829
100% 100% 100% 100%
Table 5.11: Why do you not pay your rent by Direct Debit or Standing Order?
TotalSample in numbers 550
14,923
80.7%
824
4.5%
*
3.4%
*
3.3%
*
2.9%
*
0.7%
*
4.5%
NI TOTAL 18,497
100%
Table 5.12: Would you consider paying your rent by Direct Debit or Standing Order?
TotalSample in numbers 550
1,926
10.4%
15,890
85.9%
680
3.7%
NI TOTAL 18,496
100%
Table 5.13: Are the contents of your house insured?
Belfast North South TotalSample in numbers 800 800 1000 2600
Yes 6,513 6,762 8,325 21,600
21.0% 24.6% 31.2% 25.4%
No 23,846 19,836 17,457 61,139
76.9% 72.1% 65.5% 71.8%
Don't know * 925 871 2,456
2.1% 3.4% 3.3% 2.9%
NI TOTAL 31,019 27,523 26,653 85,195
100% 100% 100% 100%
Pay online
No
Don't Know
Prefer to budget with cash
Prefer HE payment card
Yes
Pay Paypoint/Post Office
Was not aware payment
method available
Bank account does not permit
DD/ Standing Order
Other (please specify)
59
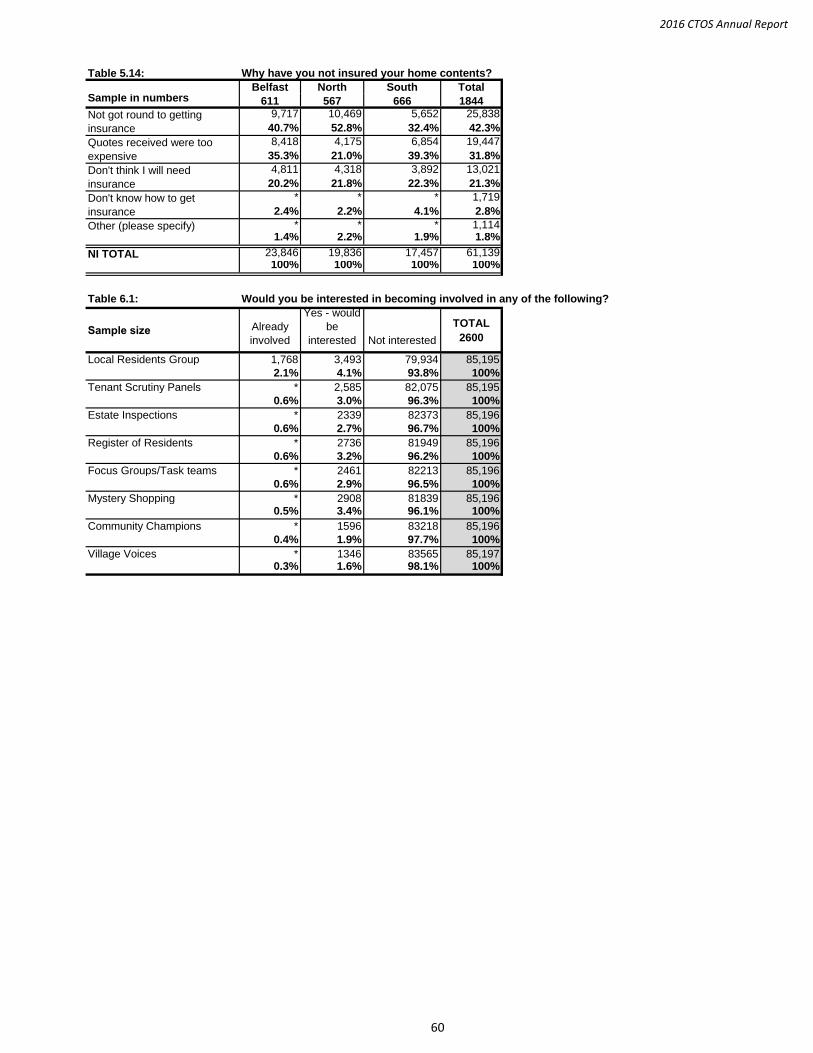
2016 CTOS Annual Report
Table 5.14: Why have you not insured your home contents?
Belfast North South TotalSample in numbers 611 567 666 1844
9,717 10,469 5,652 25,838
40.7% 52.8% 32.4% 42.3%
8,418 4,175 6,854 19,447
35.3% 21.0% 39.3% 31.8%
4,811 4,318 3,892 13,021
20.2% 21.8% 22.3% 21.3%
* * * 1,719
2.4% 2.2% 4.1% 2.8%
* * * 1,1141.4% 2.2% 1.9% 1.8%
NI TOTAL 23,846 19,836 17,457 61,139100% 100% 100% 100%
Table 6.1: Would you be interested in becoming involved in any of the following?
Sample size Already
involved
Yes - would
be
interested Not interested
TOTAL
2600
Local Residents Group 1,768 3,493 79,934 85,195
2.1% 4.1% 93.8% 100%
Tenant Scrutiny Panels * 2,585 82,075 85,195
0.6% 3.0% 96.3% 100%
Estate Inspections * 2339 82373 85,196
0.6% 2.7% 96.7% 100%
Register of Residents * 2736 81949 85,196
0.6% 3.2% 96.2% 100%
Focus Groups/Task teams * 2461 82213 85,196
0.6% 2.9% 96.5% 100%
Mystery Shopping * 2908 81839 85,1960.5% 3.4% 96.1% 100%
Community Champions * 1596 83218 85,196
0.4% 1.9% 97.7% 100%
Village Voices * 1346 83565 85,1970.3% 1.6% 98.1% 100%
Not got round to getting
insurance
Quotes received were too
expensive
Don't think I will need
insurance
Don't know how to get
insurance
Other (please specify)
60
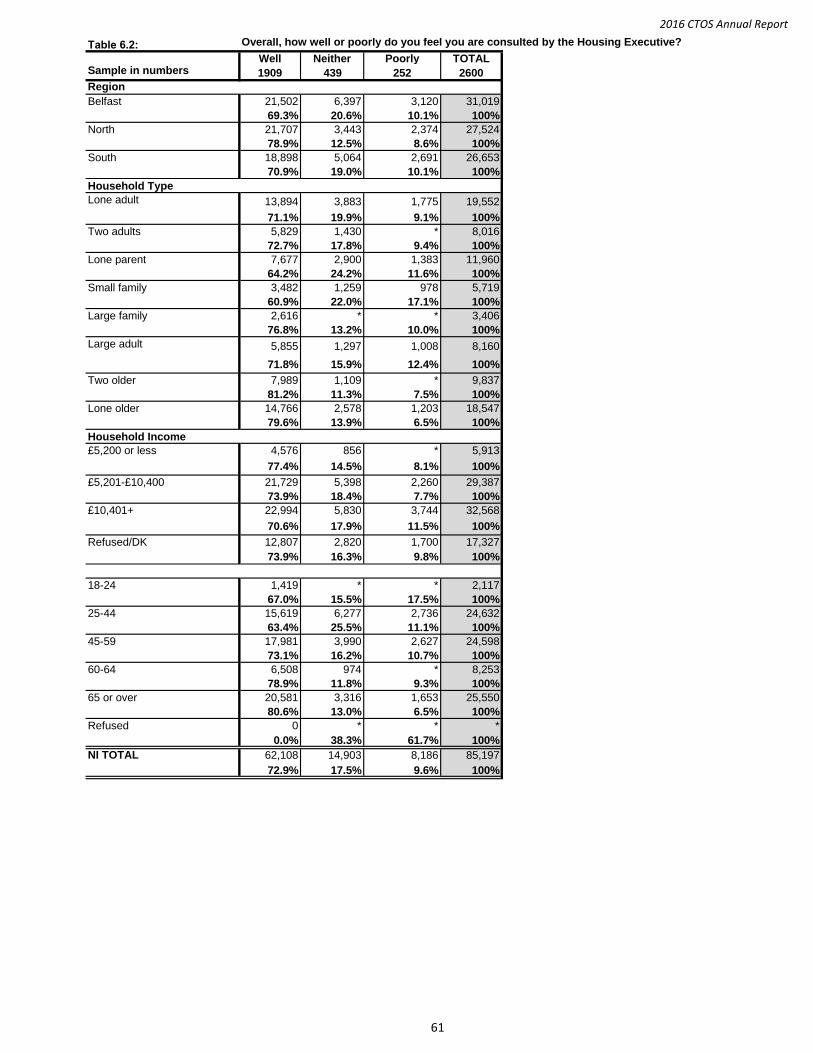
2016 CTOS Annual Report
Table 6.2: Overall, how well or poorly do you feel you are consulted by the Housing Executive?
Well Neither Poorly TOTALSample in numbers 1909 439 252 2600
Region
Belfast 21,502 6,397 3,120 31,019
69.3% 20.6% 10.1% 100%
North 21,707 3,443 2,374 27,524
78.9% 12.5% 8.6% 100%
South 18,898 5,064 2,691 26,653
70.9% 19.0% 10.1% 100%
Household Type
Lone adult 13,894 3,883 1,775 19,552
71.1% 19.9% 9.1% 100%
Two adults 5,829 1,430 * 8,016
72.7% 17.8% 9.4% 100%
Lone parent 7,677 2,900 1,383 11,960
64.2% 24.2% 11.6% 100%
Small family 3,482 1,259 978 5,719
60.9% 22.0% 17.1% 100%
Large family 2,616 * * 3,406
76.8% 13.2% 10.0% 100%
Large adult 5,855 1,297 1,008 8,160
71.8% 15.9% 12.4% 100%
Two older 7,989 1,109 * 9,837
81.2% 11.3% 7.5% 100%
Lone older 14,766 2,578 1,203 18,547
79.6% 13.9% 6.5% 100%
Household Income
£5,200 or less 4,576 856 * 5,913
77.4% 14.5% 8.1% 100%
£5,201-£10,400 21,729 5,398 2,260 29,387
73.9% 18.4% 7.7% 100%
£10,401+ 22,994 5,830 3,744 32,568
70.6% 17.9% 11.5% 100%
Refused/DK 12,807 2,820 1,700 17,327
73.9% 16.3% 9.8% 100%
18-24 1,419 * * 2,117
67.0% 15.5% 17.5% 100%
25-44 15,619 6,277 2,736 24,632
63.4% 25.5% 11.1% 100%
45-59 17,981 3,990 2,627 24,598
73.1% 16.2% 10.7% 100%
60-64 6,508 974 * 8,253
78.9% 11.8% 9.3% 100%
65 or over 20,581 3,316 1,653 25,550
80.6% 13.0% 6.5% 100%
Refused 0 * * *
0.0% 38.3% 61.7% 100%
NI TOTAL 62,108 14,903 8,186 85,197
72.9% 17.5% 9.6% 100%
61
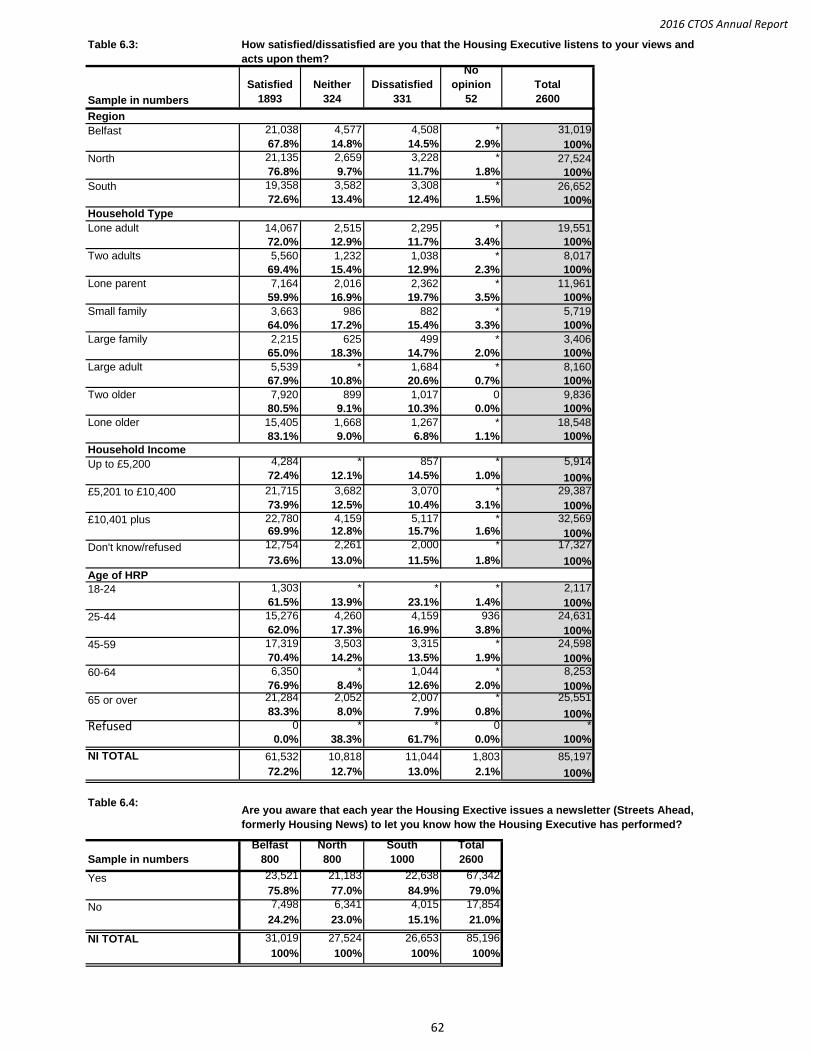
2016 CTOS Annual Report
Table 6.3:
Satisfied Neither Dissatisfied
No
opinion Total
Sample in numbers 1893 324 331 52 2600
Region
21,038 4,577 4,508 * 31,019
67.8% 14.8% 14.5% 2.9% 100%21,135 2,659 3,228 * 27,524
76.8% 9.7% 11.7% 1.8% 100%19,358 3,582 3,308 * 26,652
72.6% 13.4% 12.4% 1.5% 100%
Household Type
14,067 2,515 2,295 * 19,551
72.0% 12.9% 11.7% 3.4% 100%
5,560 1,232 1,038 * 8,017
69.4% 15.4% 12.9% 2.3% 100%
7,164 2,016 2,362 * 11,961
59.9% 16.9% 19.7% 3.5% 100%
3,663 986 882 * 5,719
64.0% 17.2% 15.4% 3.3% 100%
2,215 625 499 * 3,406
65.0% 18.3% 14.7% 2.0% 100%
5,539 * 1,684 * 8,160
67.9% 10.8% 20.6% 0.7% 100%
7,920 899 1,017 0 9,836
80.5% 9.1% 10.3% 0.0% 100%
15,405 1,668 1,267 * 18,548
83.1% 9.0% 6.8% 1.1% 100%
Household Income4,284 * 857 * 5,914
72.4% 12.1% 14.5% 1.0% 100%21,715 3,682 3,070 * 29,387
73.9% 12.5% 10.4% 3.1% 100%22,780 4,159 5,117 * 32,56969.9% 12.8% 15.7% 1.6% 100%12,754 2,261 2,000 * 17,327
73.6% 13.0% 11.5% 1.8% 100%
Age of HRP1,303 * * * 2,117
61.5% 13.9% 23.1% 1.4% 100%15,276 4,260 4,159 936 24,631
62.0% 17.3% 16.9% 3.8% 100%17,319 3,503 3,315 * 24,598
70.4% 14.2% 13.5% 1.9% 100%6,350 * 1,044 * 8,253
76.9% 8.4% 12.6% 2.0% 100%21,284 2,052 2,007 * 25,551
83.3% 8.0% 7.9% 0.8% 100%Refused 0 * * 0 *
0.0% 38.3% 61.7% 0.0% 100%
61,532 10,818 11,044 1,803 85,197
72.2% 12.7% 13.0% 2.1% 100%
Table 6.4:
Belfast North South Total
Sample in numbers 800 800 1000 2600
Yes 23,521 21,183 22,638 67,342
75.8% 77.0% 84.9% 79.0%
No 7,498 6,341 4,015 17,854
24.2% 23.0% 15.1% 21.0%
NI TOTAL 31,019 27,524 26,653 85,196
100% 100% 100% 100%
NI TOTAL
Lone older
Lone parent
South
Don't know/refused
18-24
25-44
60-64
Belfast
Up to £5,200
£5,201 to £10,400
65 or over
North
Large family
Large adult
Lone adult
Two adults
£10,401 plus
Two older
Small family
45-59
How satisfied/dissatisfied are you that the Housing Executive listens to your views and
acts upon them?
Are you aware that each year the Housing Exective issues a newsletter (Streets Ahead,
formerly Housing News) to let you know how the Housing Executive has performed?
62
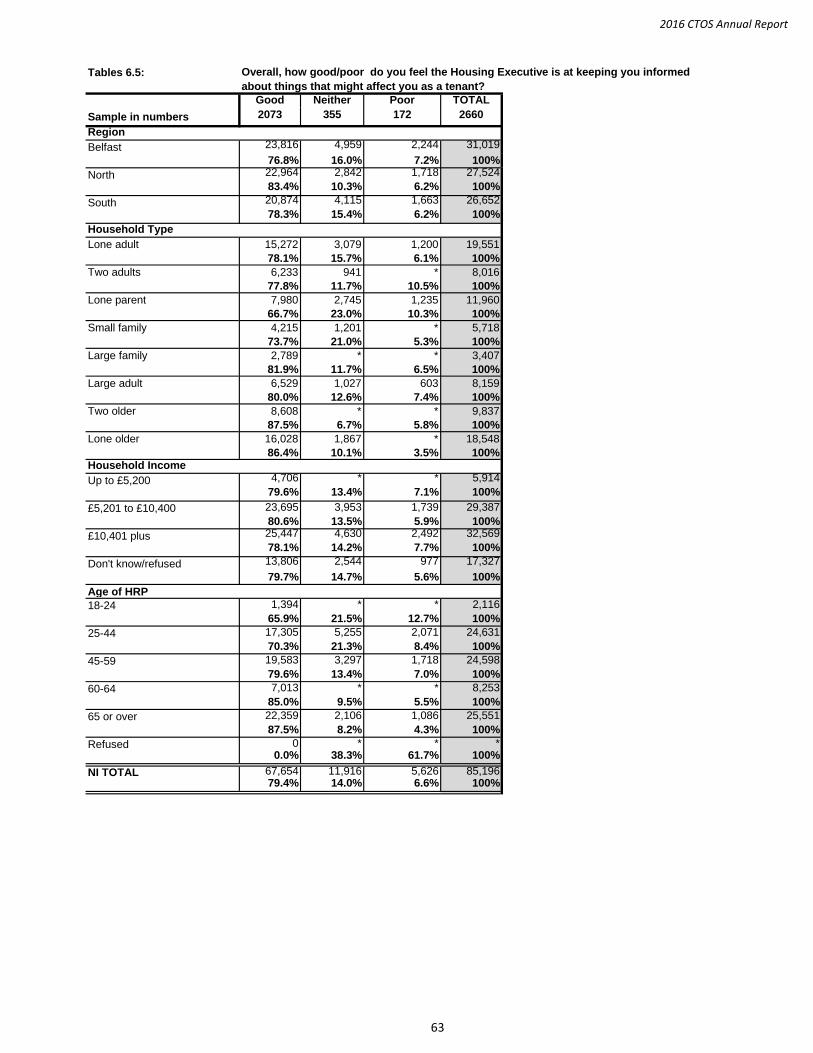
2016 CTOS Annual Report
Tables 6.5:
Good Neither Poor TOTAL
Sample in numbers 2073 355 172 2660
Region23,816 4,959 2,244 31,019
76.8% 16.0% 7.2% 100%22,964 2,842 1,718 27,524
83.4% 10.3% 6.2% 100%
20,874 4,115 1,663 26,652
78.3% 15.4% 6.2% 100%
Household Type
15,272 3,079 1,200 19,551
78.1% 15.7% 6.1% 100%
6,233 941 * 8,016
77.8% 11.7% 10.5% 100%
7,980 2,745 1,235 11,960
66.7% 23.0% 10.3% 100%
4,215 1,201 * 5,718
73.7% 21.0% 5.3% 100%
2,789 * * 3,407
81.9% 11.7% 6.5% 100%
6,529 1,027 603 8,159
80.0% 12.6% 7.4% 100%
8,608 * * 9,837
87.5% 6.7% 5.8% 100%
16,028 1,867 * 18,548
86.4% 10.1% 3.5% 100%Household Income
4,706 * * 5,914
79.6% 13.4% 7.1% 100%
23,695 3,953 1,739 29,387
80.6% 13.5% 5.9% 100%25,447 4,630 2,492 32,569
78.1% 14.2% 7.7% 100%
13,806 2,544 977 17,327
79.7% 14.7% 5.6% 100%
Age of HRP1,394 * * 2,116
65.9% 21.5% 12.7% 100%
17,305 5,255 2,071 24,631
70.3% 21.3% 8.4% 100%
19,583 3,297 1,718 24,598
79.6% 13.4% 7.0% 100%
7,013 * * 8,253
85.0% 9.5% 5.5% 100%
22,359 2,106 1,086 25,551
87.5% 8.2% 4.3% 100%
0 * * *0.0% 38.3% 61.7% 100%
67,654 11,916 5,626 85,19679.4% 14.0% 6.6% 100%
18-24
60-64
65 or over
£5,201 to £10,400
Up to £5,200
Small family
South
Lone adult
25-44
45-59
Large adult
Refused
Large family
Belfast
North
£10,401 plus
Don't know/refused
Two adults
Two older
Lone older
Lone parent
Overall, how good/poor do you feel the Housing Executive is at keeping you informed
about things that might affect you as a tenant?
NI TOTAL
63
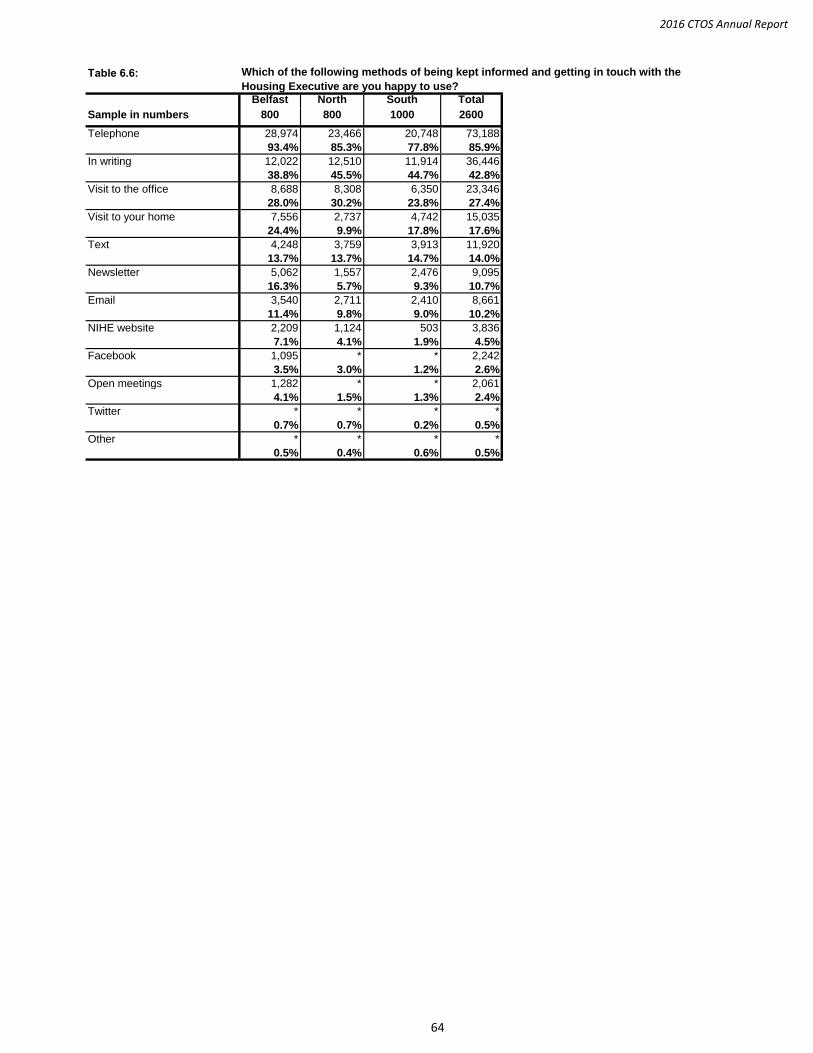
2016 CTOS Annual Report
Table 6.6:
Belfast North South Total
Sample in numbers 800 800 1000 2600
Telephone 28,974 23,466 20,748 73,188
93.4% 85.3% 77.8% 85.9%
In writing 12,022 12,510 11,914 36,446
38.8% 45.5% 44.7% 42.8%
Visit to the office 8,688 8,308 6,350 23,346
28.0% 30.2% 23.8% 27.4%
Visit to your home 7,556 2,737 4,742 15,035
24.4% 9.9% 17.8% 17.6%
Text 4,248 3,759 3,913 11,920
13.7% 13.7% 14.7% 14.0%
Newsletter 5,062 1,557 2,476 9,095
16.3% 5.7% 9.3% 10.7%
Email 3,540 2,711 2,410 8,661
11.4% 9.8% 9.0% 10.2%
NIHE website 2,209 1,124 503 3,836
7.1% 4.1% 1.9% 4.5%
Facebook 1,095 * * 2,242
3.5% 3.0% 1.2% 2.6%
Open meetings 1,282 * * 2,061
4.1% 1.5% 1.3% 2.4%
Twitter * * * *
0.7% 0.7% 0.2% 0.5%
Other * * * *
0.5% 0.4% 0.6% 0.5%
Which of the following methods of being kept informed and getting in touch with the
Housing Executive are you happy to use?
64
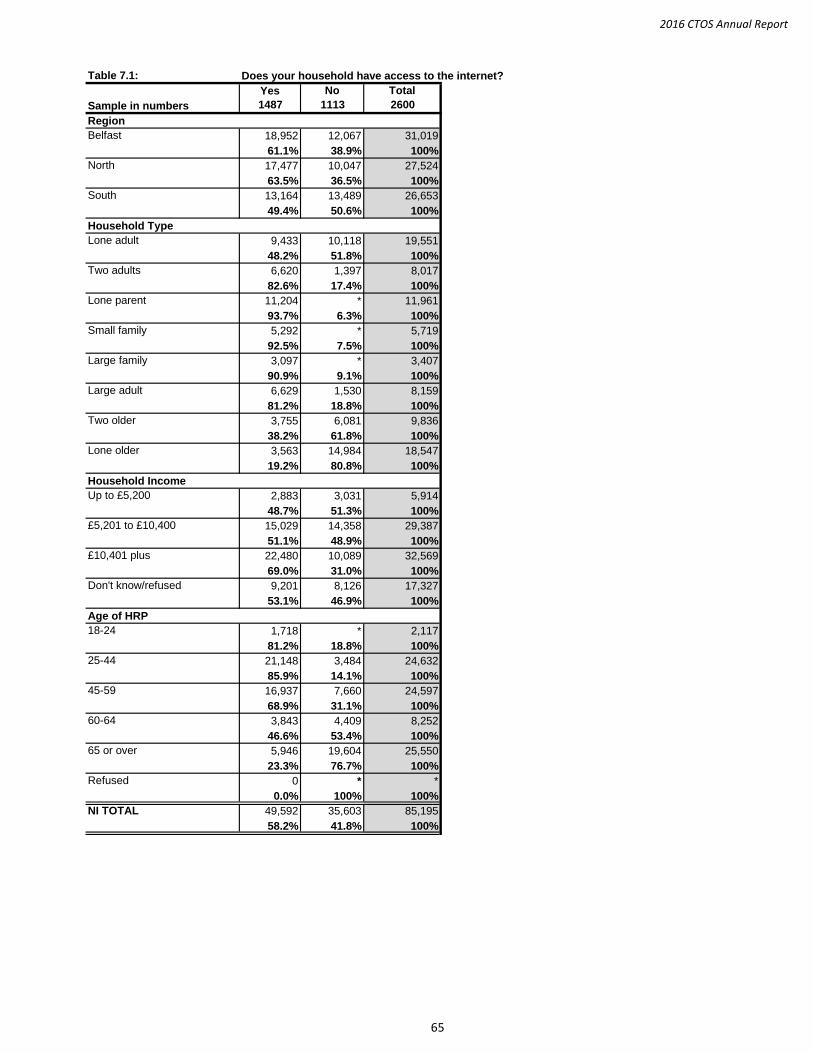
2016 CTOS Annual Report
Table 7.1: Does your household have access to the internet?
Yes No Total
Sample in numbers 1487 1113 2600
Region
Belfast 18,952 12,067 31,019
61.1% 38.9% 100%
North 17,477 10,047 27,524
63.5% 36.5% 100%
South 13,164 13,489 26,653
49.4% 50.6% 100%
Household Type
Lone adult 9,433 10,118 19,551
48.2% 51.8% 100%
Two adults 6,620 1,397 8,017
82.6% 17.4% 100%
Lone parent 11,204 * 11,961
93.7% 6.3% 100%
Small family 5,292 * 5,719
92.5% 7.5% 100%
Large family 3,097 * 3,407
90.9% 9.1% 100%
Large adult 6,629 1,530 8,159
81.2% 18.8% 100%
Two older 3,755 6,081 9,836
38.2% 61.8% 100%
Lone older 3,563 14,984 18,547
19.2% 80.8% 100%
Household Income
Up to £5,200 2,883 3,031 5,914
48.7% 51.3% 100%
£5,201 to £10,400 15,029 14,358 29,387
51.1% 48.9% 100%
£10,401 plus 22,480 10,089 32,569
69.0% 31.0% 100%
Don't know/refused 9,201 8,126 17,327
53.1% 46.9% 100%
Age of HRP
18-24 1,718 * 2,117
81.2% 18.8% 100%
25-44 21,148 3,484 24,632
85.9% 14.1% 100%
45-59 16,937 7,660 24,597
68.9% 31.1% 100%
60-64 3,843 4,409 8,252
46.6% 53.4% 100%
65 or over 5,946 19,604 25,550
23.3% 76.7% 100%
Refused 0 * *
0.0% 100% 100%
NI TOTAL 49,592 35,603 85,195
58.2% 41.8% 100%
65
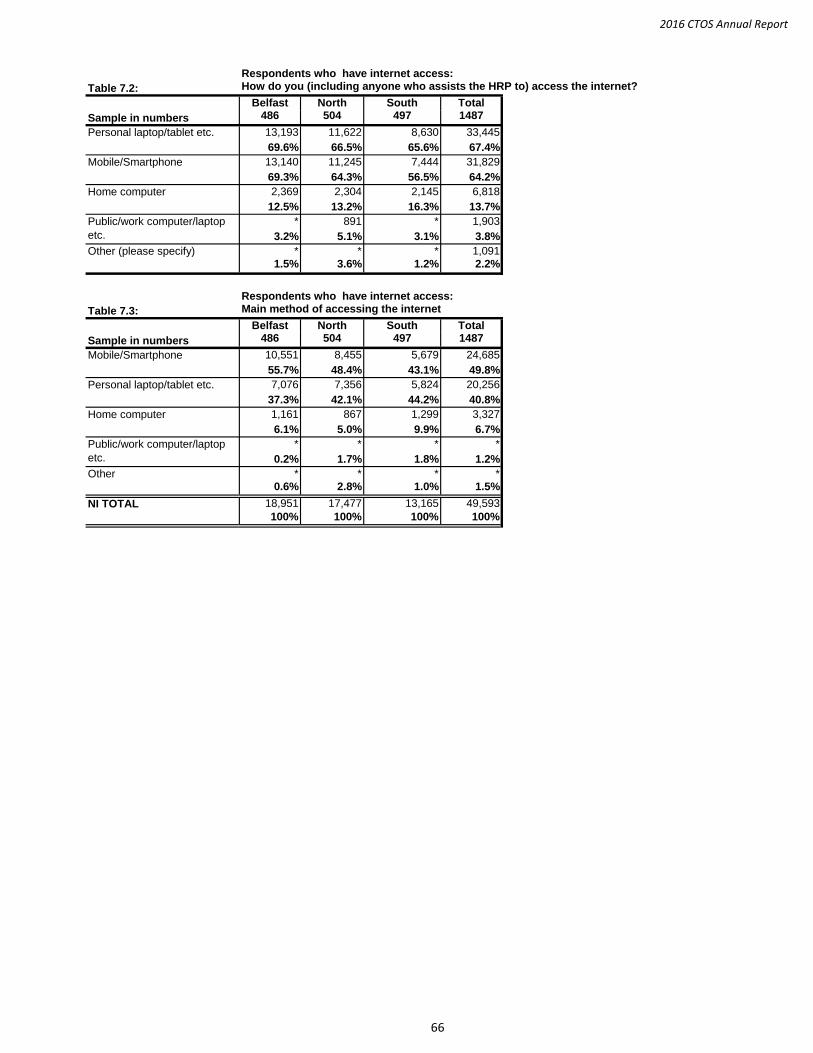
2016 CTOS Annual Report
Respondents who have internet access:
Table 7.2: How do you (including anyone who assists the HRP to) access the internet?
Belfast North South Total
Sample in numbers 486 504 497 1487
13,193 11,622 8,630 33,445
69.6% 66.5% 65.6% 67.4%
13,140 11,245 7,444 31,829
69.3% 64.3% 56.5% 64.2%
2,369 2,304 2,145 6,818
12.5% 13.2% 16.3% 13.7%
* 891 * 1,903
3.2% 5.1% 3.1% 3.8%
* * * 1,091
1.5% 3.6% 1.2% 2.2%
Respondents who have internet access:
Table 7.3: Main method of accessing the internet
Belfast North South Total
Sample in numbers 486 504 497 1487
10,551 8,455 5,679 24,685
55.7% 48.4% 43.1% 49.8%
7,076 7,356 5,824 20,256
37.3% 42.1% 44.2% 40.8%
1,161 867 1,299 3,327
6.1% 5.0% 9.9% 6.7%
* * * *
0.2% 1.7% 1.8% 1.2%
* * * *
0.6% 2.8% 1.0% 1.5%
18,951 17,477 13,165 49,593
100% 100% 100% 100%
Personal laptop/tablet etc.
Home computer
Public/work computer/laptop
etc.
Personal laptop/tablet etc.
Mobile/Smartphone
Home computer
Public/work computer/laptop
etc.
Other (please specify)
Mobile/Smartphone
NI TOTAL
Other
66
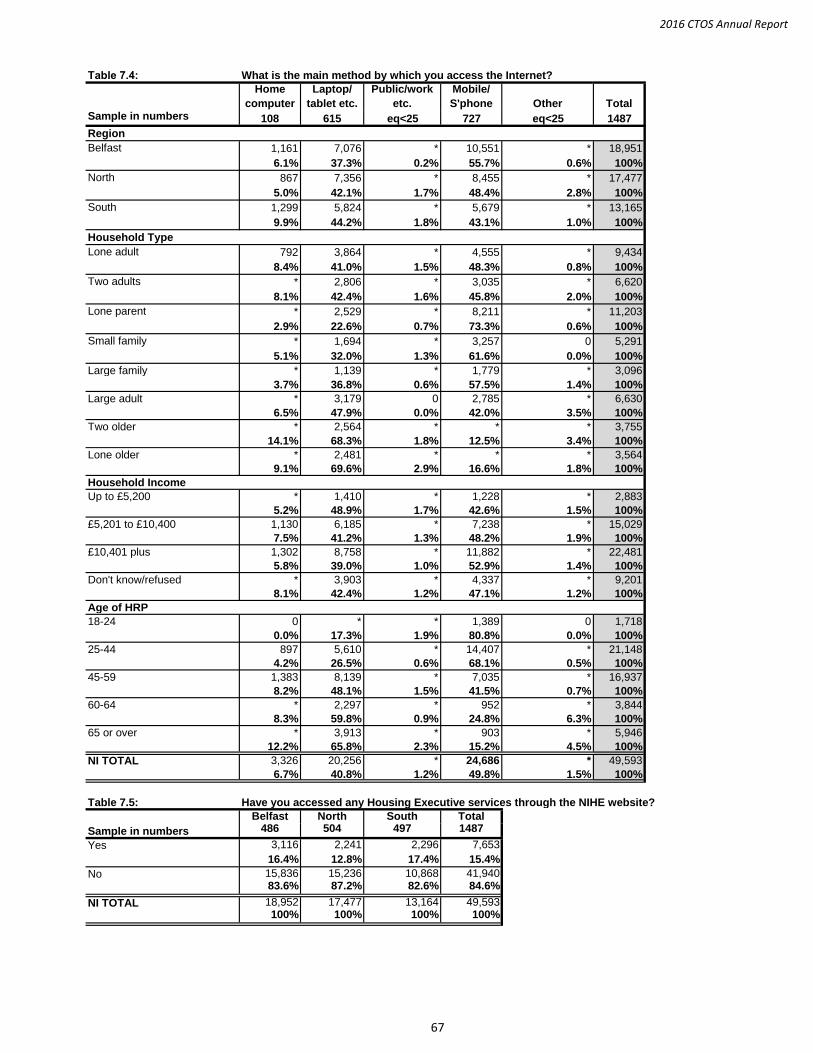
2016 CTOS Annual Report
Table 7.4: What is the main method by which you access the Internet?
Home
computer
Laptop/
tablet etc.
Public/work
etc.
Mobile/
S'phone Other TotalSample in numbers 108 615 eq<25 727 eq<25 1487
Region
Belfast 1,161 7,076 * 10,551 * 18,951
6.1% 37.3% 0.2% 55.7% 0.6% 100%
North 867 7,356 * 8,455 * 17,477
5.0% 42.1% 1.7% 48.4% 2.8% 100%
South 1,299 5,824 * 5,679 * 13,165
9.9% 44.2% 1.8% 43.1% 1.0% 100%
Household Type
Lone adult 792 3,864 * 4,555 * 9,434
8.4% 41.0% 1.5% 48.3% 0.8% 100%
Two adults * 2,806 * 3,035 * 6,620
8.1% 42.4% 1.6% 45.8% 2.0% 100%
Lone parent * 2,529 * 8,211 * 11,203
2.9% 22.6% 0.7% 73.3% 0.6% 100%
Small family * 1,694 * 3,257 0 5,291
5.1% 32.0% 1.3% 61.6% 0.0% 100%
Large family * 1,139 * 1,779 * 3,096
3.7% 36.8% 0.6% 57.5% 1.4% 100%
Large adult * 3,179 0 2,785 * 6,630
6.5% 47.9% 0.0% 42.0% 3.5% 100%
Two older * 2,564 * * * 3,755
14.1% 68.3% 1.8% 12.5% 3.4% 100%
Lone older * 2,481 * * * 3,564
9.1% 69.6% 2.9% 16.6% 1.8% 100%
Household Income
Up to £5,200 * 1,410 * 1,228 * 2,883
5.2% 48.9% 1.7% 42.6% 1.5% 100%
£5,201 to £10,400 1,130 6,185 * 7,238 * 15,029
7.5% 41.2% 1.3% 48.2% 1.9% 100%
£10,401 plus 1,302 8,758 * 11,882 * 22,481
5.8% 39.0% 1.0% 52.9% 1.4% 100%
Don't know/refused * 3,903 * 4,337 * 9,201
8.1% 42.4% 1.2% 47.1% 1.2% 100%
Age of HRP
18-24 0 * * 1,389 0 1,718
0.0% 17.3% 1.9% 80.8% 0.0% 100%
25-44 897 5,610 * 14,407 * 21,148
4.2% 26.5% 0.6% 68.1% 0.5% 100%
45-59 1,383 8,139 * 7,035 * 16,937
8.2% 48.1% 1.5% 41.5% 0.7% 100%
60-64 * 2,297 * 952 * 3,844
8.3% 59.8% 0.9% 24.8% 6.3% 100%
65 or over * 3,913 * 903 * 5,946
12.2% 65.8% 2.3% 15.2% 4.5% 100%
NI TOTAL 3,326 20,256 * 24,686 * 49,593
6.7% 40.8% 1.2% 49.8% 1.5% 100%
Table 7.5: Have you accessed any Housing Executive services through the NIHE website?
Belfast North South Total
Sample in numbers 486 504 497 1487
Yes 3,116 2,241 2,296 7,653
16.4% 12.8% 17.4% 15.4%
No 15,836 15,236 10,868 41,94083.6% 87.2% 82.6% 84.6%
NI TOTAL 18,952 17,477 13,164 49,593100% 100% 100% 100%
67
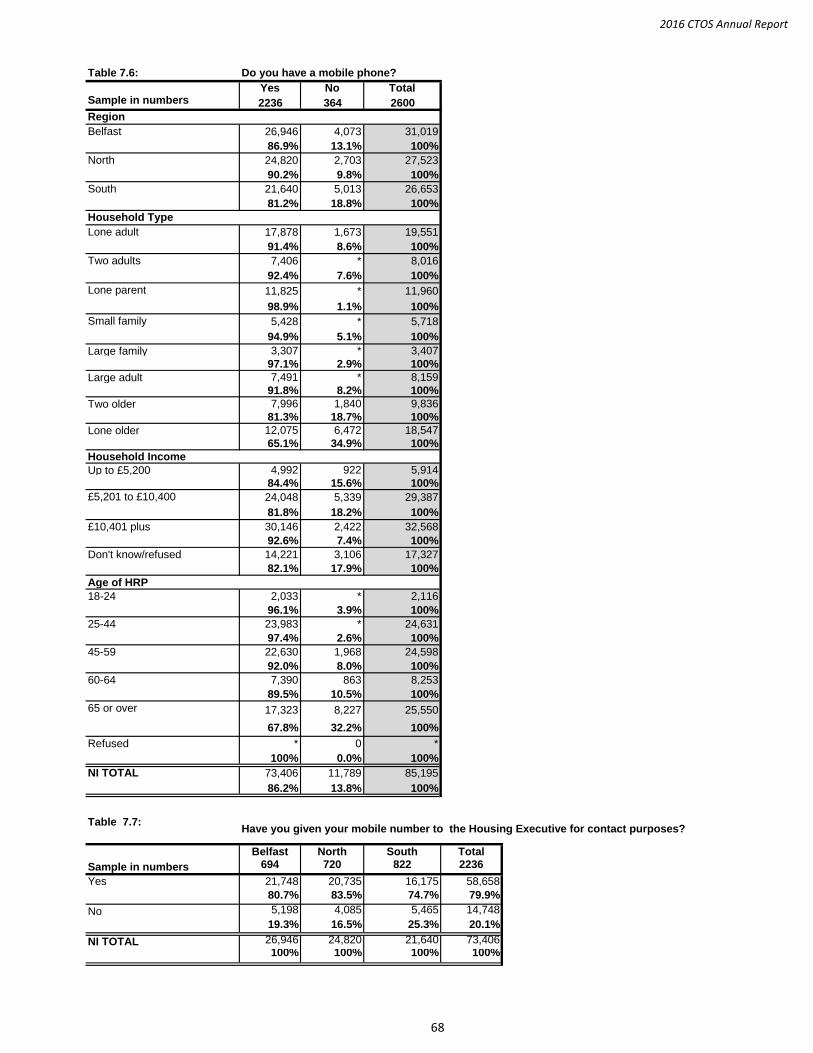
2016 CTOS Annual Report
Table 7.6: Do you have a mobile phone?
Yes No TotalSample in numbers 2236 364 2600
Region
Belfast 26,946 4,073 31,019
86.9% 13.1% 100%
North 24,820 2,703 27,523
90.2% 9.8% 100%
South 21,640 5,013 26,653
81.2% 18.8% 100%
Household Type
Lone adult 17,878 1,673 19,551
91.4% 8.6% 100%
Two adults 7,406 * 8,016
92.4% 7.6% 100%
Lone parent 11,825 * 11,960
98.9% 1.1% 100%
Small family 5,428 * 5,718
94.9% 5.1% 100%
Large family 3,307 * 3,407
97.1% 2.9% 100%
Large adult 7,491 * 8,159
91.8% 8.2% 100%
Two older 7,996 1,840 9,836
81.3% 18.7% 100%
Lone older 12,075 6,472 18,547
65.1% 34.9% 100%
Household Income
Up to £5,200 4,992 922 5,914
84.4% 15.6% 100%
£5,201 to £10,400 24,048 5,339 29,387
81.8% 18.2% 100%
£10,401 plus 30,146 2,422 32,568
92.6% 7.4% 100%
Don't know/refused 14,221 3,106 17,327
82.1% 17.9% 100%
Age of HRP
18-24 2,033 * 2,116
96.1% 3.9% 100%
25-44 23,983 * 24,631
97.4% 2.6% 100%
45-59 22,630 1,968 24,598
92.0% 8.0% 100%
60-64 7,390 863 8,253
89.5% 10.5% 100%
65 or over 17,323 8,227 25,550
67.8% 32.2% 100%
Refused * 0 *
100% 0.0% 100%
NI TOTAL 73,406 11,789 85,195
86.2% 13.8% 100%
Table 7.7:
Belfast North South Total
Sample in numbers 694 720 822 2236
Yes 21,748 20,735 16,175 58,658
80.7% 83.5% 74.7% 79.9%
No 5,198 4,085 5,465 14,748
19.3% 16.5% 25.3% 20.1%
NI TOTAL 26,946 24,820 21,640 73,406100% 100% 100% 100%
Have you given your mobile number to the Housing Executive for contact purposes?
68
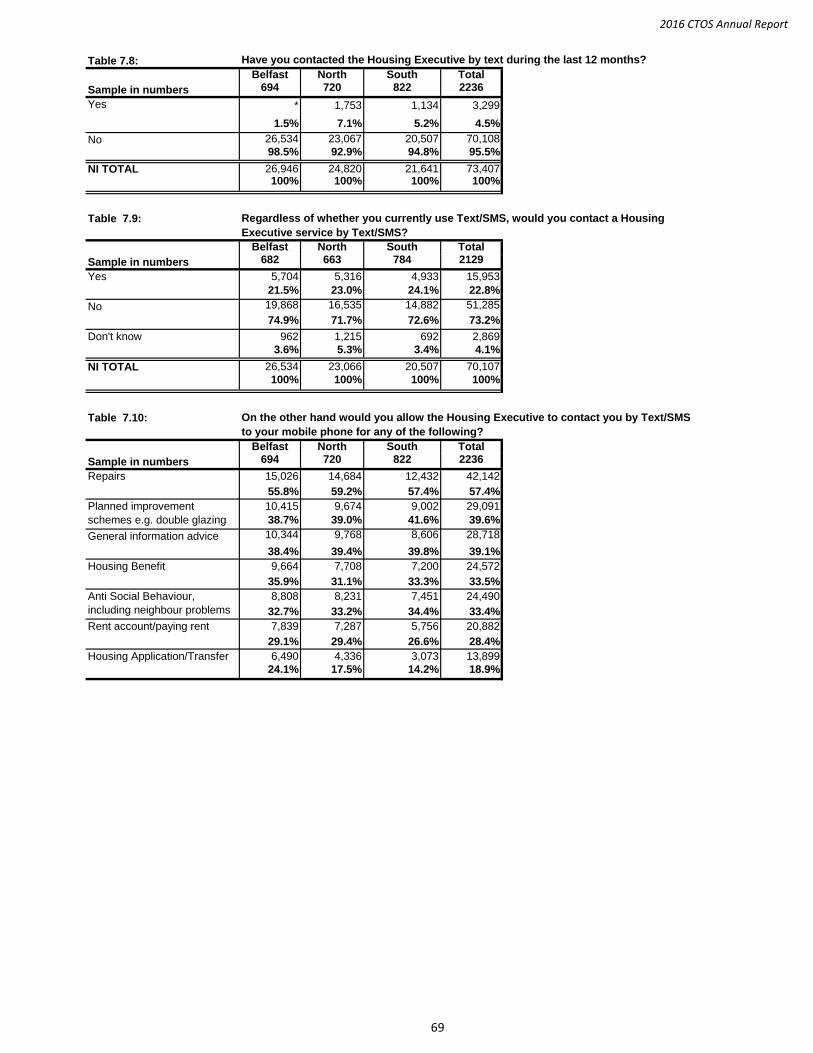
2016 CTOS Annual Report
Table 7.8: Have you contacted the Housing Executive by text during the last 12 months?
Belfast North South Total
Sample in numbers 694 720 822 2236
Yes * 1,753 1,134 3,299
1.5% 7.1% 5.2% 4.5%
No 26,534 23,067 20,507 70,108
98.5% 92.9% 94.8% 95.5%
NI TOTAL 26,946 24,820 21,641 73,407100% 100% 100% 100%
Table 7.9:
Belfast North South Total
Sample in numbers 682 663 784 2129
Yes 5,704 5,316 4,933 15,953
21.5% 23.0% 24.1% 22.8%
No 19,868 16,535 14,882 51,285
74.9% 71.7% 72.6% 73.2%
Don't know 962 1,215 692 2,869
3.6% 5.3% 3.4% 4.1%
NI TOTAL 26,534 23,066 20,507 70,107
100% 100% 100% 100%
Table 7.10:
Belfast North South Total
Sample in numbers 694 720 822 2236
15,026 14,684 12,432 42,142
55.8% 59.2% 57.4% 57.4%
10,415 9,674 9,002 29,091
38.7% 39.0% 41.6% 39.6%
General information advice 10,344 9,768 8,606 28,718
38.4% 39.4% 39.8% 39.1%
Housing Benefit 9,664 7,708 7,200 24,572
35.9% 31.1% 33.3% 33.5%
8,808 8,231 7,451 24,490
32.7% 33.2% 34.4% 33.4%
Rent account/paying rent 7,839 7,287 5,756 20,882
29.1% 29.4% 26.6% 28.4%
6,490 4,336 3,073 13,899
24.1% 17.5% 14.2% 18.9%
Planned improvement
schemes e.g. double glazing
Repairs
Regardless of whether you currently use Text/SMS, would you contact a Housing
Executive service by Text/SMS?
On the other hand would you allow the Housing Executive to contact you by Text/SMS
to your mobile phone for any of the following?
Anti Social Behaviour,
including neighbour problems
Housing Application/Transfer
69
2016 Continuous Tenant Omnibus Survey
70
APPENDIX 2
2016 Continuous Tenant Omnibus Survey
BACKGROUND TO THE SURVEY
INTRODUCTION
The 2016 Continuous Tenant Omnibus Survey (CTOS) was the twenty-third comprehensive assessment of
tenants’ attitudes to be carried out by the Northern Ireland Housing Executive since 1994. An independent
social research company, Perceptive Insight, was commissioned to conduct the fieldwork and process the
data. The Housing Executive’s Research Unit conducted the analysis and interpretation of the results.
The CTOS is a cornerstone of the Housing Executive’s service delivery in terms of the Northern Ireland Act
(1998). The Survey supports the Housing Executive’s applications for Customer Service Excellence (CSE) and
the NI Quality Award; it is also linked to all of Regional Services Corporate Objectives and also supports a
number of objectives, as set out in the Housing Executive’s Landlord Services Corporate Plan:
Landlord Services:
Objective one – “Delivering quality services”.
Objective two - “Delivering better homes“.
Objective three – “Fostering vibrant communities”.
The CTOS monitors the level of customer satisfaction with Housing Executive services and identifies areas
for improvement. Continuous nature of the survey, where information is gather continually throughout the
year, helps reduce bias from any media coverage which might affect how respondents answer questions or
by events such as the annual rent review.
The survey was carried out over twelve months, from January 2016 to December 2016. The questionnaire
consisted of a main section which was used in each of the four data collection periods and an omnibus
section which changed each period. The omnibus section allows client groups within the Housing Executive
to carry out very specific research and achieve results quickly which can be linked to general data collected
in the main section e.g. socio-economic characteristics, dwelling type or geographic location. Findings from
each omnibus topic were reported at the end of the data collection period.
As in previous years, the main section of the questionnaire in 2016 covered the following areas:
economic and demographic household information;
tenure history;
type of contact with the Housing Executive in the last 12 months;
tenant generated repairs;
tenant appraisal of service provision;
attitude to area or estate;
financial inclusion; and
digital inclusion.
AIMS OF THE SURVEY
The main aims of the CTOS are as follows:
i) to provide a comprehensive picture of Housing Executive tenants and their views and attitudes to
service provision in 2016 at Northern Ireland, and Regional level;
71
2016 Continuous Tenant Omnibus Survey
72
ii) to facilitate a comparative analysis of tenants' views over time;
iii) to allow collection of specific information for various client groups in the Housing Executive, to
inform the formulation of future policy or programmes; and
iv) to allow the flexibility associated with rapid response by the Research Unit to specific issues
without the delays and expense associated with the commissioning of individual small surveys.
METHODOLOGY
The Sample
In 2016, sampling for the CTOS reflected the new organisational structure. The sample was designed at a
target of 200 interviews (50 per quarter) in each of the new 13 Areas; with findings reported at Northern
Ireland, Regional and Area levels.
Random sampling was carried out quarterly, beginning in January 2016 (for the January to March data
collection period), from the Housing Executive’s HMS database.
By the end of the year, December 2016, 2,600 tenants had taken part in the Survey. Appendix tables
include base totals; thus, tables showing results for questions asked of all respondents have a base of 2,600
(i.e. the total number of respondents who participated in the survey).
The conduct of the fieldwork is summarised as follows:
interviews were carried out at a rate of approximately 16-17 per month in each Area;
approximately 50 tenants were interviewed per Area, per quarter;
2,600 tenants in 13 Area offices were interviewed over the year.
In order to ensure a 100 per cent response rate, the CTOS operated a system of substitution. Each quarter a
substitute sample of reserve addresses were randomly selected. If any tenant could not be contacted after
three calls, or if they were ill, or if they did not want to participate in the survey, they were replaced by
another tenant within the same local area. The response rate from the main list of addresses was 70% in
2016.
Margin of Error:
The proportion of respondents interviewed in a survey that give a particular answer, is only an estimate of
the proportion of all tenants who would have given that answer, i.e. there is room for error, plus or minus
the margin of error. The size of the error varies with the size of the percentage and the sample size. The
following table gives margins of error for various percentages and sample sizes at Northern Ireland and
Regional levels; at the 95% confidence level (95% confidence means that if the same survey were carried
out for 20 samples, exactly the same results would be obtained in 19 of those cases).
If a survey has a margin of error of 2.5 per cent, it means that if the survey was conducted 100 times –
asking a different sample of people each time – the overall percentage of people who responded the same
way would remain within 2.5 per cent of the original result in at least 95 of those 100 surveys. For example,
for a finding of 80% at the Northern Ireland level (2,600) the probable margin of error is ± 1.5. This means
there are 95 chances in 100 that the true figure lies between 78.5% and 81.5%.
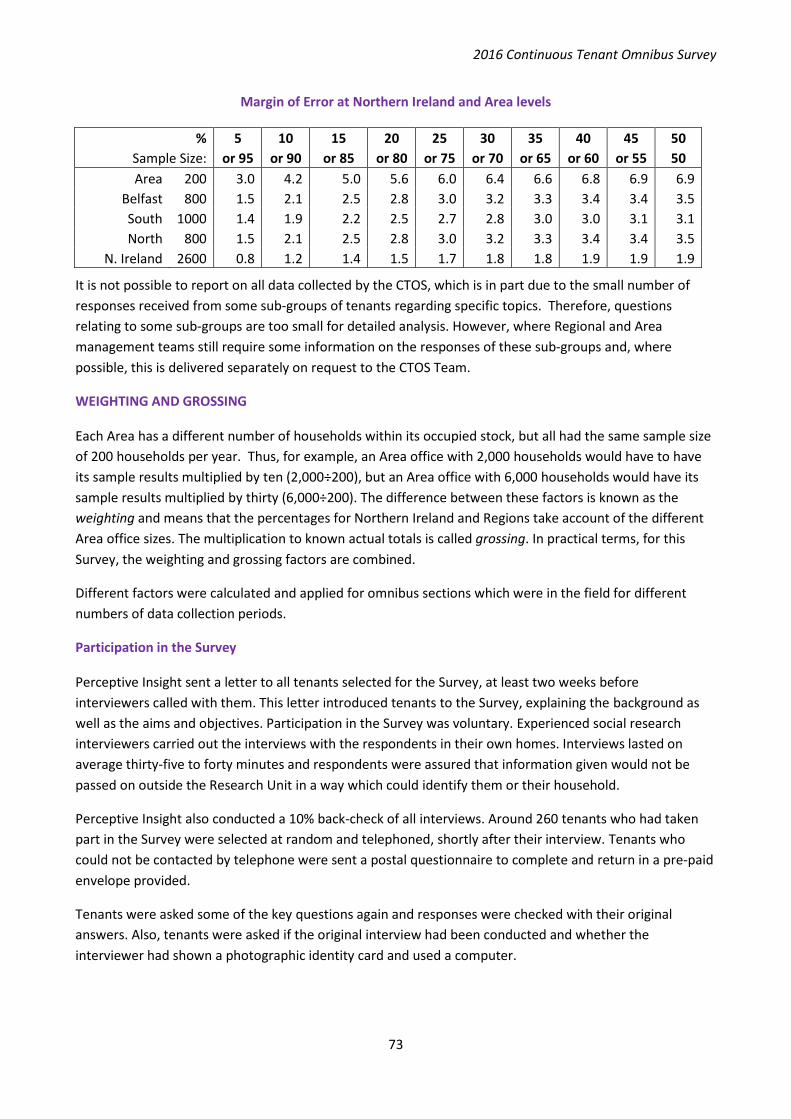
2016 Continuous Tenant Omnibus Survey
73
Margin of Error at Northern Ireland and Area levels
% 5 10 15 20 25 30 35 40 45 50
Sample Size: or 95 or 90 or 85 or 80 or 75 or 70 or 65 or 60 or 55 50
Area 200 3.0 4.2 5.0 5.6 6.0 6.4 6.6 6.8 6.9 6.9
Belfast 800 1.5 2.1 2.5 2.8 3.0 3.2 3.3 3.4 3.4 3.5
South 1000 1.4 1.9 2.2 2.5 2.7 2.8 3.0 3.0 3.1 3.1
North 800 1.5 2.1 2.5 2.8 3.0 3.2 3.3 3.4 3.4 3.5
N. Ireland 2600 0.8 1.2 1.4 1.5 1.7 1.8 1.8 1.9 1.9 1.9
It is not possible to report on all data collected by the CTOS, which is in part due to the small number of
responses received from some sub-groups of tenants regarding specific topics. Therefore, questions
relating to some sub-groups are too small for detailed analysis. However, where Regional and Area
management teams still require some information on the responses of these sub-groups and, where
possible, this is delivered separately on request to the CTOS Team.
WEIGHTING AND GROSSING
Each Area has a different number of households within its occupied stock, but all had the same sample size
of 200 households per year. Thus, for example, an Area office with 2,000 households would have to have
its sample results multiplied by ten (2,000÷200), but an Area office with 6,000 households would have its
sample results multiplied by thirty (6,000÷200). The difference between these factors is known as the
weighting and means that the percentages for Northern Ireland and Regions take account of the different
Area office sizes. The multiplication to known actual totals is called grossing. In practical terms, for this
Survey, the weighting and grossing factors are combined.
Different factors were calculated and applied for omnibus sections which were in the field for different
numbers of data collection periods.
Participation in the Survey
Perceptive Insight sent a letter to all tenants selected for the Survey, at least two weeks before
interviewers called with them. This letter introduced tenants to the Survey, explaining the background as
well as the aims and objectives. Participation in the Survey was voluntary. Experienced social research
interviewers carried out the interviews with the respondents in their own homes. Interviews lasted on
average thirty-five to forty minutes and respondents were assured that information given would not be
passed on outside the Research Unit in a way which could identify them or their household.
Perceptive Insight also conducted a 10% back-check of all interviews. Around 260 tenants who had taken
part in the Survey were selected at random and telephoned, shortly after their interview. Tenants who
could not be contacted by telephone were sent a postal questionnaire to complete and return in a pre-paid
envelope provided.
Tenants were asked some of the key questions again and responses were checked with their original
answers. Also, tenants were asked if the original interview had been conducted and whether the
interviewer had shown a photographic identity card and used a computer.
2016 Continuous Tenant Omnibus Survey
74
CAPI
Perceptive Insight interviewers administered the questionnaire, face-to-face with respondents, using a
Computer Assisted Personal Interviewing (CAPI) methodology. The software package used was Snap. CAPI
interviewing is the preferred format for the CTOS, because of the length of the questionnaire and the
number of skip sections. The advantages of CAPI are that it improves speed of response and data validity, it
minimises fieldwork errors and punching transcription errors and reduces the impact of respondent fatigue
during the interview.
HOW TO INTERPRET THE RESULTS OF THIS SURVEY
Because of the usual constraints on any sample design of time, cost and manpower, an Area sample size of
200 households is twice the 100 minimum sample size for valid results, where a line of questioning applies
to all or most of the respondents. However, it must be remembered that all sample surveys are subject to
sample errors as set out in the margin of error table on page 73. Therefore, some of the differences
between Areas in a given year and from year to year within the same Area may be more apparent than
real.
While addresses have been selected at random, the overriding need to achieve an equal number of
responses in each Area has necessitated the use of substitute addresses. This compromise, while it achieves
the object of equal achieved sample size, and hence equal sample error, may have been at the expense of
some incalculable, but probably small, variations in the validity of the results. As in any survey, there is also
the possibility, (which survey managers try to minimise by uniform training) that there may be some
interviewer variation. This may take the form of inflection in asking questions, which may result in differing
reaction by respondents, or a propensity to interpret respondents' answers differently. On balance, it is
desirable, from the point of view of the interviewers reaching the correct addresses, that each interviewer
remains in the same area throughout the survey. The drawback to this practice is that such interviewer
variation will be perpetuated throughout the year and some apparent differences may be created.
Where the Research Unit notices patterns of differential results between Areas within a year, or year-to-
year changes in an individual area, these are drawn to the attention of the fieldwork contractor who
conducts appropriate checks with the fieldwork staff. Unfortunately, some of the differences only become
apparent when the complete annual sample is analysed, when it may be too late to take appropriate
avoiding action.
None of these potential problems are unique to the Continuous Tenant Omnibus Survey - they also apply to
surveys conducted wholly in-house and must be accepted as one of the facts of life of conducting research.
The alternative, a 100% survey, is typified by the Census of Population, which requires a design and
organisation lead-in period of several years, and a corresponding data preparation and analysis period after
the Census date. This post-survey delay reduces the relevance of the results.
2016 Continuous Tenant Omnibus Survey
ACKNOWLEDGEMENTS
The Housing Executive’s Research Unit wishes to acknowledge the contribution of all those who were
involved in the 2016 Continuous Tenant Omnibus Survey, particularly the following:
The Housing Executive tenants who participated in the Survey, whose good will
and cooperation made the Survey possible;
Perceptive Insight, for conducting the fieldwork; and
the CTOS Project Advisory Group.
This year’s report, along with the CTOS Tenant Summary report, can be found on the Housing Executive’s
web site under completed research/Landlord Services:
http://www.nihe.gov.uk/index/corporate/housing_research/completed/attitudes_to_landlord_services.htm
CTOS Team:
Liz McCambridge ([email protected])
Shauna Mulgrew ([email protected])
Clare Johnston ([email protected])
Gerard Jervis ([email protected])
For any information on the Continuous Tenant Omnibus Survey please contact:
The Research Unit, Northern Ireland Housing Executive
2 Adelaide Street, Belfast BT2 8PB
Telephone: 03448 920 900
web: www.nihe.gov.uk
email: [email protected]
email: [email protected]
75