Embed Size (px)
Citation preview
Accepted Manuscript
Continuous monitoring of bedload discharge in a small, steep sandy channel
Ana Lucía, Alain Recking, José F. Martín-Duque, Yael Storz-Peretz, Jonathan
B. Laronne
PII: S0022-1694(13)00409-5
DOI: http://dx.doi.org/10.1016/j.jhydrol.2013.05.034
Reference: HYDROL 18915
To appear in: Journal of Hydrology
Received Date: 7 June 2012
Revised Date: 4 May 2013
Accepted Date: 18 May 2013
Please cite this article as: Lucía, A., Recking, A., Martín-Duque, J.F., Storz-Peretz, Y., Laronne, J.B., Continuous
monitoring of bedload discharge in a small, steep sandy channel, Journal of Hydrology (2013), doi: http://dx.doi.org/
10.1016/j.jhydrol.2013.05.034
This is a PDF file of an unedited manuscript that has been accepted for publication. As a service to our customers
we are providing this early version of the manuscript. The manuscript will undergo copyediting, typesetting, and
review of the resulting proof before it is published in its final form. Please note that during the production process
errors may be discovered which could affect the content, and all legal disclaimers that apply to the journal pertain.
Continuous monitoring of bedload discharge in a small, steep sandy channel 1
Ana Lucía1,2, Alain Recking3, José F. Martín-Duque1, Yael Storz-Peretz4, Jonathan B. 2
Laronne4,5* 3
1Department of Geodynamics and Institute of Geosciences (CSIC,UCM), Complutense 4
University of Madrid, Ciudad Universitaria, C/ José Antonio Novais No 2, Madrid E-5
28040, Spain. Telephone 0034913944857. Fax 0034913944845. 6
2Faculty of Science and Technology, Free University of Bolzano, Piazza Università, 5, 7
39100 Bolzano, Italy. 8
3Irstea 2 rue de la papeterie BP 76 38402 Saint Martin d'Hères Cedex 38402 France 9
4Department of Geography and Environmental Development, Ben-Gurion University of 10
the Negev, Beer-Sheva 84105, Israel. 11
5Laboratoire d’Etude des Transferts en Hydrologie et Environnement-LTHE, Université 12
Josef Fourier, 38041 Grenoble cedex 09, France. 13
*Corresponding author: Jonathan B. Laronne, [email protected] 14
15
Abstract 16
This paper reports on bedload flux and texture monitored in a natural, steep, sandy 17
ephemeral channel draining a small gullied sandy watershed, the Barranca de los Pinos 18
(1.32 ha), Spain. Bedload flux was continuously monitored with two independent Reid-19
type slot samplers; bedload texture was determined from the sediment collected in the 20
samplers. Channel morphology was surveyed with a high spatial resolution with a 21
Terrestrial Laser Scanner. 22
The monitored instantaneous bedload fluxes are among the highest measured in 23
natural rivers, characterized by high temporal and spatial variability related to the 24
presence of bedforms, shallow bars and sand sheets, and to the reworking of the dry bed 25
between and at the end of individual flow events. The grain size distribution of the 26
bedload indicates equal mobility; but bedload texture fluctuates, depicting the transport 27
of coarser bar surfaces and of finer-grained anabranch surfaces as well as of the overall 28
bed subsurface. 29
30
Key Words: Bedload flux, Sand-bed channel, Ephemeral stream, Steep stream, Reid-31
type slot sampler, Braiding 32
33
1 INTRODUCTION 34
Bedload transport is a fundamental process shaping stream channels. The 35
interrelationships between water, transport of sediment and bed configuration are 36
complex and the mechanical principles that govern their behaviour are not yet 37
adequately explained (Turowski, 2010). Bedload transport is a challenging area of 38
research due to its high temporal and spatial variability (Gomez, 1984), the interaction 39
of different sizes of bed material (Parker, 2008) and the fact that the transport of coarse 40
sediment itself may change channel geometry (Ashmore, 1991). The knowledge of 41
bedload transport mechanisms is of importance, not only academically to better 42
understand the underlying processes and forms, but also to aid managers and engineers 43
in informed and appropriate decision making concerning river and riverine 44
environments (Lancaster and Grant, 2003). 45
Bedload measurements have been undertaken under a variety of environmental 46
settings. These include river channels with different grain size distributions (sand to 47
boulder beds), bedforms and bed patchiness, gradients and hydrologic regime (perennial 48
to ephemeral). Measuring bedload transport is expensive, time consuming and also 49
dangerous in some settings, hence measurements of bedload are less common than those 50

of suspended sediment (Gray et al., 2010). In flumes, bedload has been monitored under 51
controlled conditions with uniform material (e.g., Meyer-Peter and Müller, 1948) and 52
with mixed size sediment (e.g., Iseya and Ikeda, 1987; Recking et al., 2009). In the field 53
bedload transport is difficult to measure due to the complexity of this phenomenon 54
(Haff, 1996) as it entails high spatial and temporal variability, complex grain size 55
distribution and large sizes, high flow velocities and turbid flow. Moreover it is difficult 56
to determine when and how sediment moves on the bed; also, the flow and bed may be 57
disturbed by deployment of bedload samplers (Holmes, 2010). Three types of devices 58
have been used to measure bedload transport in rivers. The first involves the use of 59
portable samplers, such as the Helley-Smith (Helley and Smith, 1971), Arnhem 60
(Schaank, 1937) or Delft-Nile (Van Rijn and Gaweesh, 1992) and portable traps (Bunte 61
et al., 2001). Data obtained with these samplers are limited to a single location for a 62
short time interval, but the samplers are movable between sites. The second includes 63
devices that allow the continuous direct measurement of bedload transport at fixed 64
locations, such as the continuous belt slot system at the East Fork River (Leopold and 65
Emmett, 1977), the channel-wide vortex slot (Milhous, 1973), the ultrasonic sensor 66
system developed in Rio Cordon (D'Agostino and Lenzi, 1999) and the Reid-type 67
recording slot sampler (Reid et al., 1980). The latter has been the most widespread 68
method, having been used successfully in permanent and ephemeral gravel bed rivers 69
worldwide (García et al., 2000; Laronne et al., 2003). 70
More recently, surrogate monitoring technologies, such as Acoustic Doppler 71
Current Profilers - ADCPs (Gaeuman and Jacobson, 2006a), geophones (Mizuyama et 72
al., 2010; Rickenmann and Fritschi, 2010) and hydrophones (Belleudy et al., 2010) have 73
been developed. These are non-contact devices collecting information indirectly and 74
allowing continuous monitoring of bedload transport under a larger number of 75

scenarios. However, these technologies are ―to some extent― in the experimental 76
phase, and require the collection of physical samples for calibration. Yet, these devices 77
will most likely be those used in the future to collect information on bedload transport 78
(Gray et al., 2010), 79
Bedload transport in sand-bed systems has been studied mostly in flumes, 80
(Ashmore, 1988; Bagnold, 1966; Einstein, 1950; Engelund, 1966; Engelund and 81
Hansen, 1967), but also with portable bedload samplers in large (Gaweesh and Van 82
Rijn, 1994) and small rivers (Billi, 2011). And more recently by the use of surrogate 83
techniques (Gaeuman and Jacobson, 2006b; Rennie and Villard, 2004). However, 84
datasets on bedload transport in natural ephemeral sand bed channels are relatively rare 85
and largely incomplete (Billi, 2011). This is given to the fact that sand bedded rivers are 86
usually large rivers, with high water discharge and low slopes. In these settings, there 87
are often large bedforms during higher flows, which make the continuous monitoring of 88
bedload impractical (Holmes, 2010). 89
Among ephemeral rivers, bedload transport has been mostly studied in gravelly 90
beds with higher bedload fluxes compared to their perennial counterparts (Laronne and 91
Reid, 1993); apparently, ephemeral steep sand bed rivers also have high bedload fluxes 92
(Billi, 2011). As the channel bed in ephemerals is unarmoured (Laronne and Reid, 93
1993), hysteresis in bedload flux is rarely observed (Powell et al., 2003). Single thread 94
ephemeral gravel bed rivers with moderate slopes exhibit a sequence of steeper bars and 95
less steep, finer-grained 'flats' (Powell et al., 2012). In steep sand bed rivers, the bed 96
tends to be flat, lacking bars, ripples and dunes; sheets are often observed in the channel 97
bed (Billi, 2008). 98
This paper aims to provide continuous bedload observations on a fluvial system 99
that has yet to be reported: a natural steep sand-bedded river with an ephemeral regime. 100
We attempt to understand bedload flux and texture and their relations with hydraulic 101
parameters. This objective is accomplished by acquisition and analysis of continuous 102
bedload flux data obtained with two Reid-type slot samplers installed in the stream bed. 103
We aim to comprehend their spatio-temporal variation, as well as to which extent 104
bedload flux varies with shear stress. 105
106
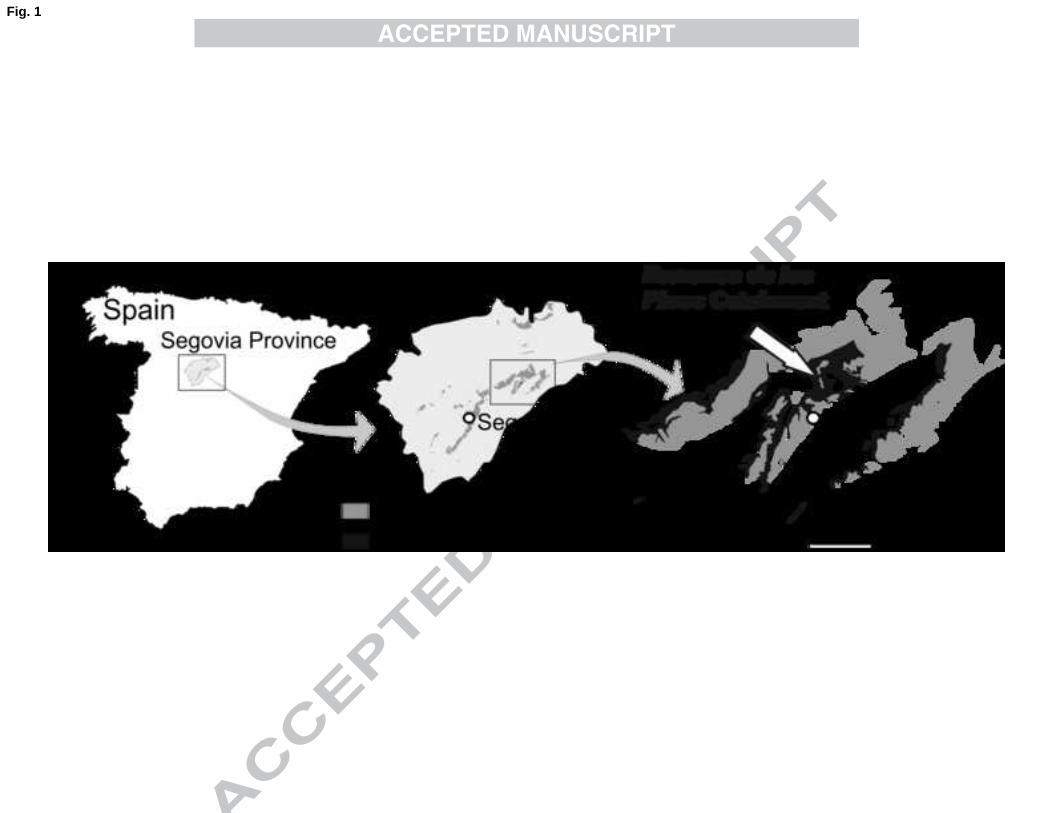
2 STUDY AREA 107
The Barranca de los Pinos is located in the Northern piedmont of the Guadarrama 108
Mountains, Segovia Province in Central Spain. The underlying topography consists of a 109
series of mesas and cuestas formed by Upper Cretaceous sediments and underlain by a 110
crystalline basement of gneisses (Fig. 1). The plateaus are topped by a caprock of 111
limestone and dolostone while the side slopes are clayey and gravelly sands that have 112
been deeply dissected by gullies. The mesas and cuestas are covered by native forest 113
(holm oak and junipers) and are grazed by sheep at certain periods of the year. The 114
climate is Mediterranean with cool summers (Csb) according to Köppen classification 115
(CNIG, 2004). It is characterized by a moderate average annual precipitation (680 mm) 116
and temperature (11.4ºC). 117
The Barranca de los Pinos is typical of the gullied catchments of the studied area 118
in terms of size, lithology and gradient of hillslopes, and channel. It has been chosen to 119
study different active geomorphic processes: gravitational processes in high gradient 120
slopes, water erosion on low gradient slopes and sediment transport including bedload 121
in the channel (Lucía et al., 2011). The catchment area (1.32 ha) is to a large extent 122
gullied (90.4%), with high gradient slopes (29.9% of the gullied area has slopes steeper 123
than 30º), narrow interfluves and a high drainage density (0.041 m m-2). The 124
longitudinal slope of the channel is 0.066 and its width at the monitoring site is 1.24 m, 125

varying in the range 1 - 1.5 m. The gullied reach has friable, vertical sandy walls, but at 126
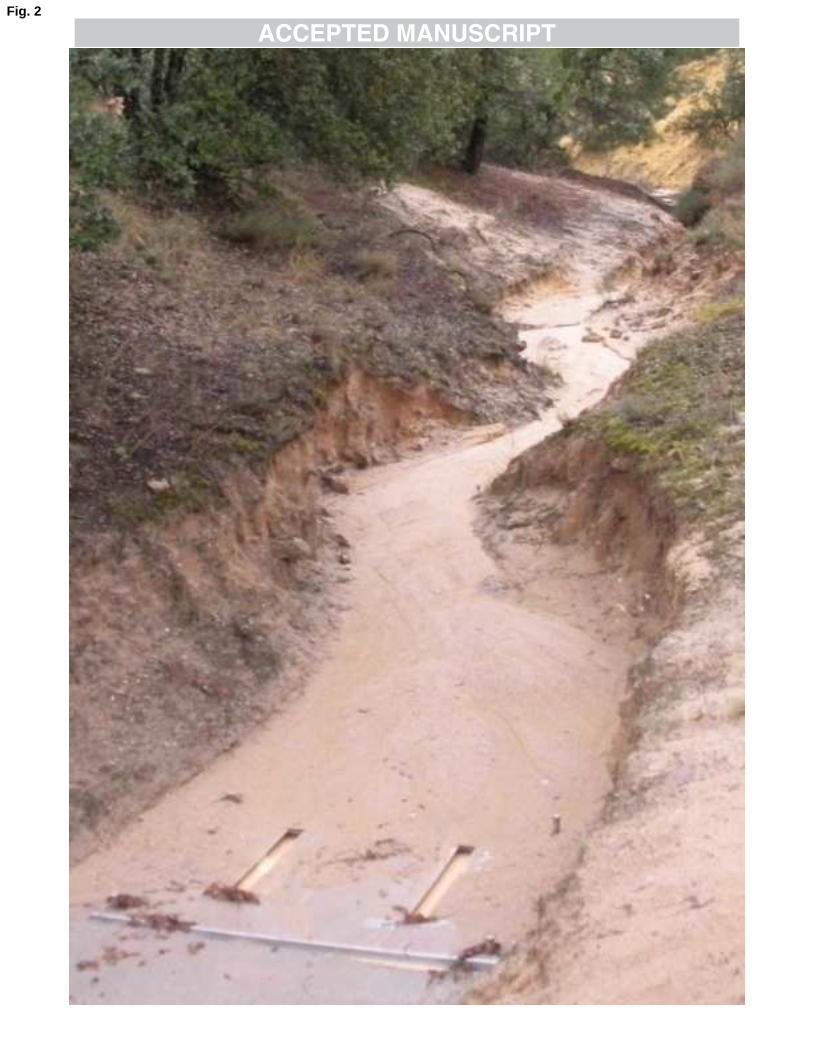
the sampling site they are stable (Fig. 2); the slopes of the right and left banks are 29.4º 127
and 78.8º, respectively and their height is approximately 70 cm. The channel bed lacks 128
topography or undulations with a maximum 2 cm relief. It is of low sinuosity, 1.08, 129
classified as straight to slightly sinuous (Leopold et al., 1964). The bed is formed by 130
coarse, poorly sorted and positively skewed sand (D50 = 0.555 mm; D84 = 0.995 mm; 131
D90 = 1.42 mm). Most (93.2%) of the bed material is sand sized, ranging from 0.062 to 132
2 mm . There are very small proportions of silts and clays (2.9%) and of gravel (3.9%), 133
the latter being subrounded to angular quartzite lag deposits from the sandy facies or 134
very angular carbonate rock fragments originally derived from the caprock and the 135
associated colluvium. 136
Steep, sandy channels are uncommon in Nature, as finer grained rivers usually 137
have lower gradients (Leopold et al., 1964). The studied channel is a rare combination 138
of a sand bed and steep longitudinal slope. It exists here because the gullies are 139
presently eroding fine-grained Upper Cretaceous sediments, deposited by large braided 140
and meandering rivers in an estuary mainly by fluvial but also by tidal activity (Alonso, 141
1981), conditions which are indicative of low gradient channels. The gullied character 142
of the catchment provides an unlimited sediment supply to the channel. The study area 143
has been described in detail elsewhere (Lucía et al., 2011). 144
145
3 METHODS 146
3.1 Water stage 147
Water stage was measured at the study site by a vented pressure transducer located in 148
one of the bedload slot samplers. Water density was assumed constant at 1043 kg m-3. 149
3.2 Bed topography and texture 150

The topography of the channel bed was acquired from a point cloud data obtained with 151
a Terrestrial Laser Scanner (TLS), which is based on Light Detection and Ranging 152
(LiDAR) technology. The TLS is non-intrusive and has high precision; the instrument 153
used (Leica Scan Station 2) measures up to 50,000 points per second with a 2 mm 154
precision at a scanning distance <120 m. Scanning was undertaken at least from two 155
different locations to avoid shadowed areas (Buckley et al., 2008). The scanned channel 156
reach is 12 m long (ten times the channel width) and it is located immediately upstream 157
of the bedload sampler. The slope of the channel banks formed an asymmetric 158
trapezoid, from which the hydraulic radius was calculated. 159
To determine the bulk Grain Size Distribution (GSD) of the bed-material, an 160
11.6 kg sample was scraped from the upper 1 ̶ 2 cm of a 2 m2 area of the channel bed. 161
Only one area was sampled given the uniformity along the channel; nonetheless, this 162
area is longer than the channel width. The sample was dried and sieved at 1 intervals 163
and lower-truncated at 0.062 mm (sand-silt split). Grain size descriptions were 164
calculated using Gradistat (Blott and Pye, 2001). 165
3.3 Bedload 166
Bedload discharge was automatically and continuously monitored by two independent, 167
cross-sectionally aligned Reid-type (formerly termed Birkbeck) bedload slot samplers 168
(Reid et al., 1980). The cumulative mass of sediment entering each sampler is 169
monitored by a vented pressure transducer connected to a pneumatic pillow filled with 170
water, upon which an internal box is located. The hydrostatic pressure of the water 171
column is monitored by a separate vented pressure transducer located between the outer 172
and inner boxes of the right sampler. For a given time period, the pressure difference 173
between the two sensors is due to the addition of mass of bedload entering the sampler 174

(Laronne et al., 2003). Data from all the vented pressure transducers are read every 10 s 175
and the average of three readings is logged every 30 s. 176
The volume of each inner box is 0.225 m3 and was sized based on prior sediment 177
yield assessment so that the box would not overfill during a typically frequent, low 178
magnitude event (Lucía et al., 2011). Slot width is variable, the maximum (160 mm) 179
representing 26% of the channel width. Ideally the slot width should be ten times larger 180
than the size of the sediment to be sampled, and a compromise is required between the 181
sampled sediment diameter, the representative width and the average sampling duration 182
required for samplers to fill. During the sampling period the slot was set at 5 or 10 cm, 183
much larger than the bed material grain size (50-100 times the D84) . The length of the 184
slot was based on the saltation length for sand calculated as follows (Van Rijn, 1984): 185
λb/D = 3D* 0.6 T0.9 186
where λb is the saltation length with an accuracy of 50%, D is the particle diameter, D* 187
the dimensionless particle parameter defined as: 188
D*=D50[(ρs/ρw)g/ν2]1/3 189
where ν is the kinematic viscosity, ρs and ρw are the mass densities of sediment and 190
water, g is gravity and T the transport stage parameter, which is defined as: 191
T = [(u*2)-(u*cr)2]/ (u*
cr)2 192
where u* is the bed shear velocity equal to g0.5/C’, C’ is the Chézy coefficient related to 193
the grains, and u*cr is the critical shear velocity according to Shields (equal to 194
[θcr*((ρs/ρw)-1)g D50]0.5). Applying this equation and using the D50, 0.04 as the Manning 195
parameter (Arcement and Schneider, 1989) and a maximum water depth of 30 cm, the 196
saltation length was estimated to be 36 cm (±50%); therefore, the maximum length was 197
predicted to be 54 cm. Indeed, the slot length at 65 cm is sufficient for the predicted 198
transport conditions, thus having a 20% safety factor. 199

The sampler has a lateral window allowing observation of sediment 200
stratification, hence enabling the collection of facies-based sediment samples. In all but 201
few cases, sample weight was 100 times larger than the weight of the largest particle as 202
recommended by Church et al. (1987). Bedload samples collected before April 2010 203
were dried and sieved with 1 sieves and those collected after this date were sieved 204
using 0.5 sieves because it became evident that finer textural detail was required. The 205
smallest sieve size used was 0.062 mm, essentially the lowest truncation. As these 206
bedload samplers are of the recording type, the time during which a given layer of 207
bedload sediment was deposited can be determined. This allowed correlating bedload 208
texture with the channel-average shear stress, typifying the hydraulic conditions existing 209
when the sediment was transported (Powell et al., 2001). 210
All vented pressure transducers (Druck PTX-1830) were pre-calibrated. The 211
sensor measuring hydrostatic water pressure has a sensitivity of 0.06% (according to the 212
manufacturer). The sensitivity of this kind of weighting device comprising the pressure 213
transducer and the pillow is estimated to be 0.3 kg given its size, (Laronne et al., 2003). 214
However, sensitivity was also tested during calibration of this sampler. The calibration 215
was undertaken with metal pieces of known weight larger than 9 kg, as well as smaller 216
objects (0.25, 0.5, 1, 3 and 5 kg) while the sampler had a weight equivalent to (i) being 217
filled only with water, (ii) when half-filled with sediment and (iii) when almost full with 218
dry sediment. In all cases there was a significant linear correlation between the pressure 219
registered and the weight introduced to the sampler. Regression lines were compared 220
one to one with the regression line obtained with weights larger than 9 kg. The 221
comparison was made using an ANOVA test, analyzing both the slope and the intercept. 222
In this analysis, the slope is more relevant because it is the extent to which pressure 223
changes with weight in the sampler. Obtained p-values show that there are no 224

statistically significant differences among the slopes or the intercept at the 90% or 225
higher confidence level to an accuracy of 0.25 kg. This value was used to analyse the 226
data: increments of weight smaller than 0.25 kg were excluded in calculation of bedload 227
flux. 228
The temporal stability of this type of pressure transducer has been shown to be 229
quite good (Alexandrov et al., 2009). However, the properties of the pillow, which is 230
made of neoprene, may not be similarly stable. Therefore, the weighting device was 231
calibrated twice (in April of 2010 and February 2011), with results showing little 232
change in the slope of the regression lines: 3.08% in the right sampler and 10.1% in the 233
left sampler. Hence, for the events prior to August 2010 (the date in between the two 234
calibrations) the regression line obtained during the first calibration was used to predict 235
transported mass and that obtained with the second calibration was used thereafter. 236
3.4 Bedload data quality control 237
The reproducibility and quality of the bedload database is validated by the following 238
procedure: 239
1. At the onset of some very small flow events calculated bedload flux rates were 240
excluded due to two known errors: For a correct flux calculation the sampler has 241
to be filled with water, which may take a few minutes (one to five) during small 242
events. In other instances, the collected data were unrealistically high due to the 243
effect of bed over-steepening that was produced by the process of cleaning of 244
the upstream section of the sampler, after the previous event was recorded. 245
2. Slot sampling has been demonstrated in the lab (Poreh and Sagiv, 1970) and 246
under field conditions (Habersack et al., 2001) to be 100% efficient while 247
sampling sand to gravel bedload as long as they are not nearly full. When the 248
volume of sediment in the sampler approaches about 80% of its capacity, the 249
efficiency decreases due to internal vortices that can remove some of the 250
sediment from the samplers (Habersack et al., 2001). Data collected under these 251
conditions were removed due to sampling inefficiency. 252
3. During the latter stages of some hydrograph recessions, water depth over the 253
sampler decreased much slower than expected, most likely due to sand 254
deposition over the sampler or mud deposition within the sampler on the 255
pressure transducer. This effect was corrected by adjusting hydrograph recession 256
up to the inflection point to an exponential equation. From the inflection point 257
onwards, bedload data were correlated with depth recalculated by the 258
exponential equation. 259
260
4 RESULTS 261
4.1 Hydraulics 262
The Barranca de los Pinos is a truly ephemeral channel. Water was present in the 263
channel during 1.98% of the monitored time, merely 11 of 556 days. Twenty four flow 264
events were registered during 18 months, June 2009 – January 2011 (Table 1). All the 265
events were generated by rainfall with a return period smaller than two years. Three 266
events (9, 22 and 23) did not register accurately as they were small and short, with 267
difficulties that occur at the beginning of some events (see section 3.5) affecting the 268
entire event dataset; these were excluded. 269
Maximum registered water depth was 15.5 cm (averaged every 30 sec). Median 270
water depth was 2.6 cm, and the first and third quartiles were 1.0 cm and 4.5 cm 271
respectively. The longitudinal slope of the channel is considerable (0.066), so despite 272
the shallow water depth, shear stress was quite high, with a maximum instantaneous (30 273
s) value of 10.7 N m-2. Channel average shear stress was calculated as (Du Boys, 1879): 274
τ = ρw d S g 275
where τ is shear stress (N m−2), d is water depth (m) and S is bed slope 276
(nondimensional). 277
4.2 Bedload flux 278
During most of the events bedload transport was initiated soon after water appeared in 279
the channel. On average the onset occurred within 4.6 and 6.2 min in the right and left-280
hand samplers, excluding few events in which the hydrograph rise was exceptionally 281
slow (inclusion of these events increases the respective average gaps to 13.1 and 26.6 282
min). 283
One of the limitations of the Reid bedload sampler is its finite volume. However, 284
given the small size of the catchment and the brevity of some of the bedload-generating 285
flow events, there were nine events when both samplers did not fill entirely, and one 286
additional event during which only one of the samplers did not entirely fill. Bedload 287
flux was monitored at peak flow in six of 12 events when the samplers had filled. 288
When samplers were full the maximum cumulative mass varied between the 289
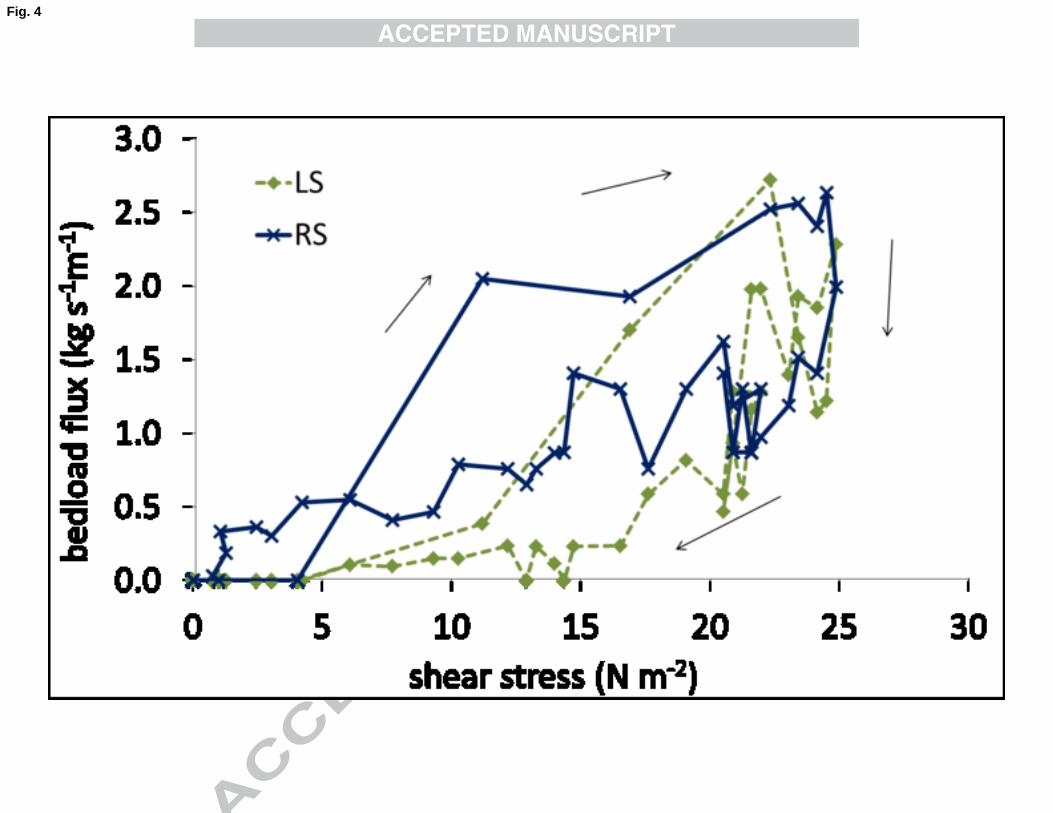
samplers (Table 1). This value is the integration of bedload fluxes for the sampling 290
period before sampler efficiency decreases. As bedload fluxes lower than the sensitivity 291
(0.25 kg in a given time interval) are excluded, the samplers may contain more sediment 292
than that calculated as the total cumulative mass. 293
Measured bedload fluxes were high for both samplers; the highest 30 s recorded 294
values were 25.4 and 19.5 kg s-1m-1 in the left and right sampler, respectively. During 295
the monitoring period, 2375 values of 1-minute averaged bedload flux were obtained; 296
their median, first quartile and third quartile were 0.33, 0.16 and 0.70 kg s-1m-1. In a 297
general sense, the relation between bedload flux and water depth may be simple or 298
complex (Cohen et al., 2010). In the analysed database (1-min averaged), the relation 299

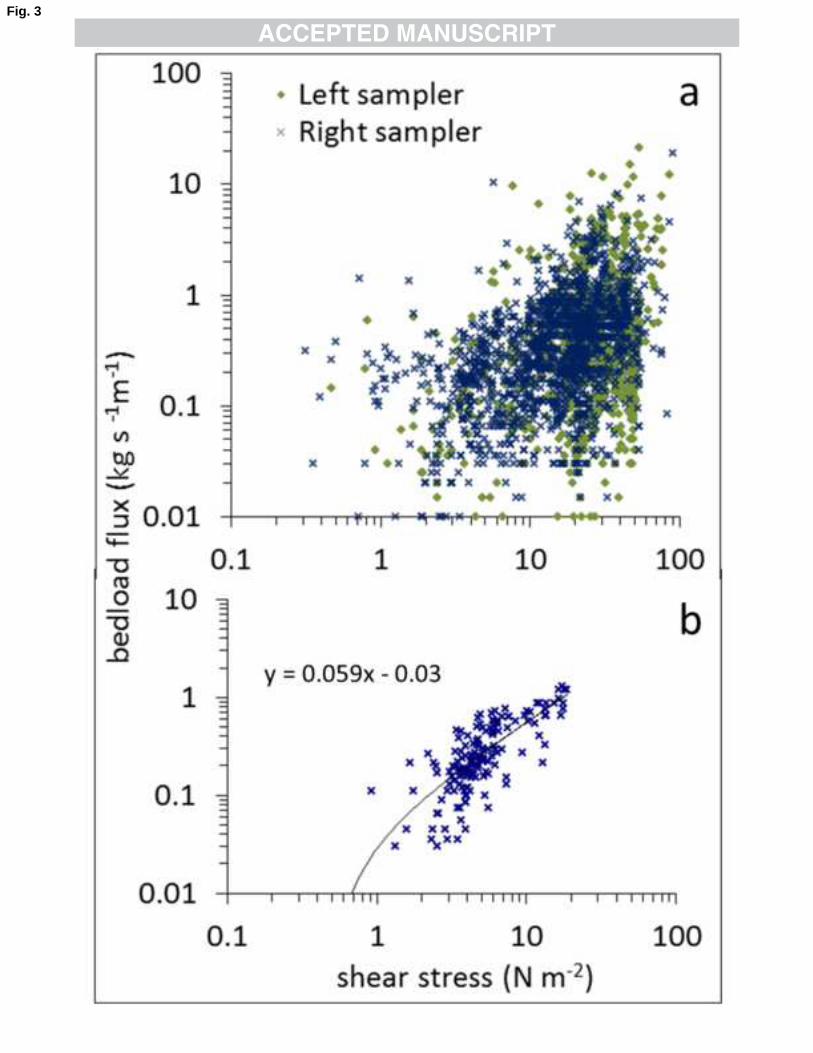
between the entire bedload flux vs shear stress is very scattered (Fig. 3a). However, 300
lower scatter characterizes some events (Fig. 3b). 301
4.2.1 Temporal variation 302
Given the large scatter in bedload flux, the variability of bedload transport rates is 303
examined by evaluating two types of temporal variability: hysteresis (variations in 304
bedload flux on rising vs falling hydrograph limbs) and waves (periodic fluctuations in 305
bedload flux unrelated to changes in flow stage). 306
The rate of change of water stage is considerably more rapid during the rising 307
limb than during the recession in many of the events. Hence most of the bedload flux 308
data were obtained from recessions by virtue of this portion of the hydrograph lasting 309
longer (Fig. 4). Observed instances of hysteresis in the variation of bedload flux with 310
water depth are without exception clockwise, with higher rates of transport occurring 311
during rising stage than during flow recession. This was documented in eight and nine 312
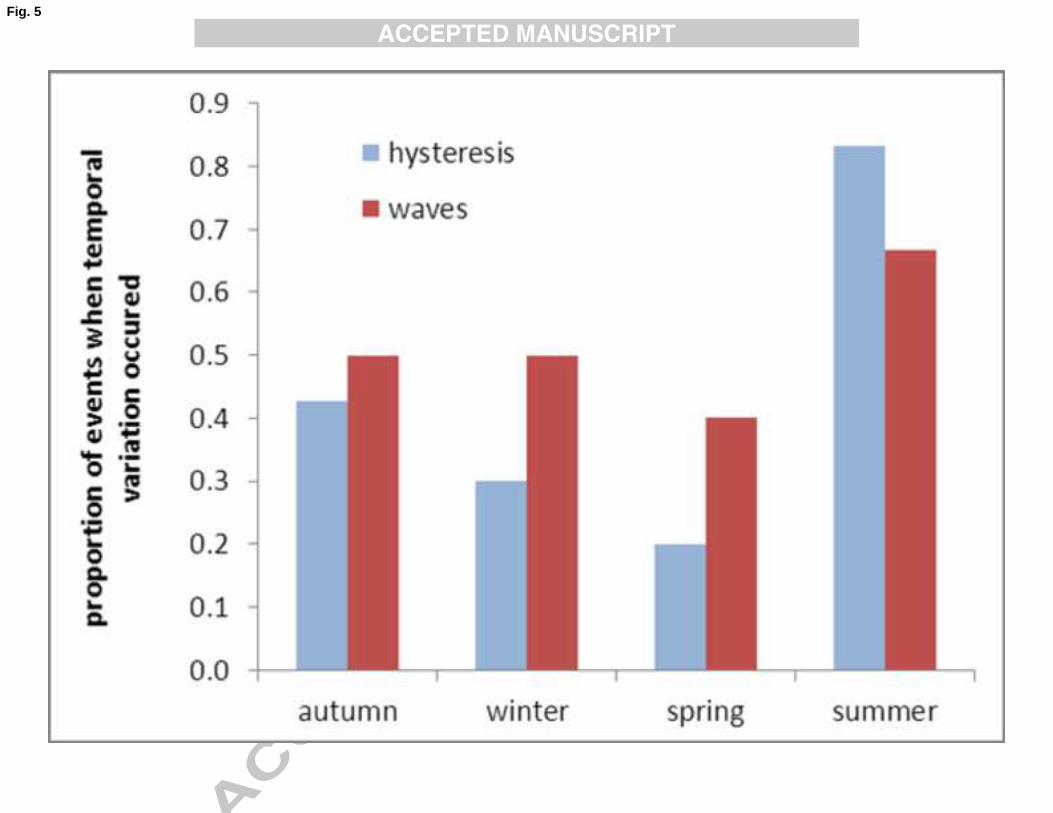
events among twenty in the left and right sampler, respectively. Bedload hysteresis was 313
observed mostly in summer and autumn. The proportion of events with hysteresis is 314
highest (83%) in the summer, and lowest (20%) in spring, followed by winter (30%) 315
and somewhat more (42%) in autumn (Fig. 5). 316
In some of the monitored flow events, or parts thereof, bedload flux 317
corresponded well to water depth (Fig. 6a). At other times, large oscillations of bedload 318
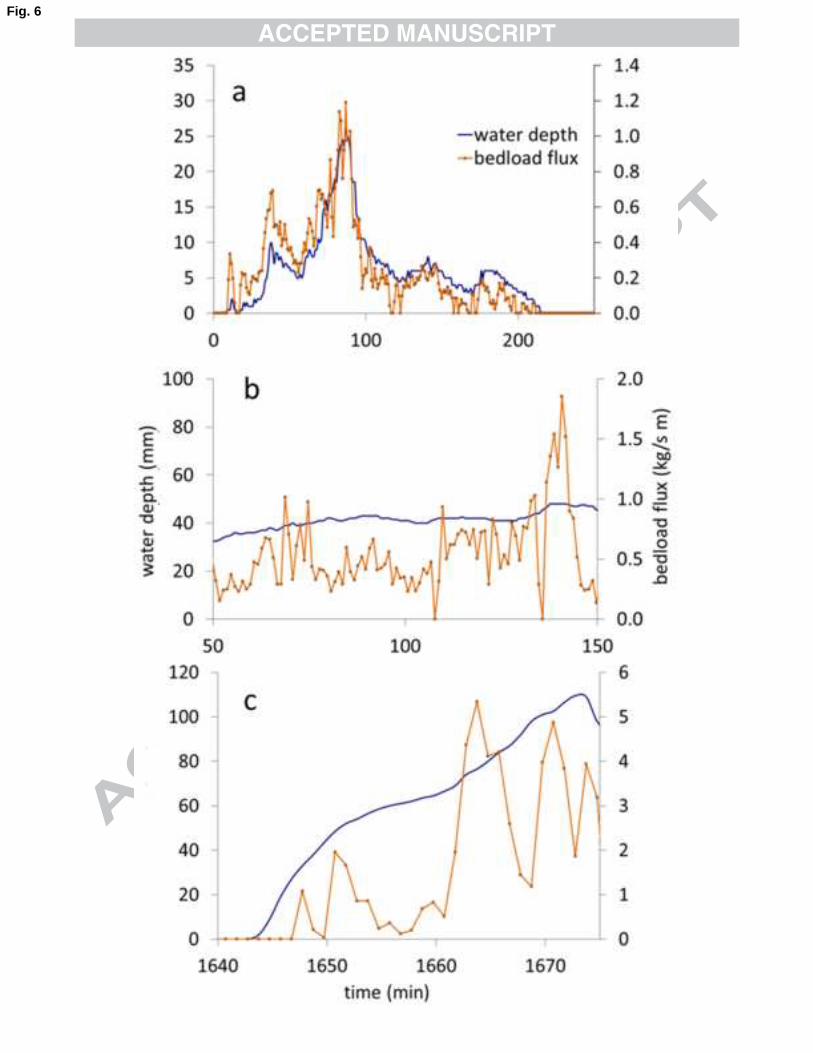
flux (waves) occur both, during steady flow (Fig. 6b) and unsteady flow (Fig. 6c). 319
Oscillations were documented in eight and nine events in the left and right samplers 320
respectively, indicating the frequency of waves in bedload response; the presence of 321
waves is independent of water depth. Notably, hysteresis and waves do not necessary 322
occur simultaneously. Wave occurrence varied seasonally less than did hysteresis. 323
Waves occured in 40% of the spring events and in 67% of the summer events (Fig. 5). 324

4.2.2 Spatial variation 325
Spatial variation of bedload flux was described based on the evaluation of 326
registered bedload flux differences between samplers and, separately, their temporal 327
responses. Considerable spatial variation (differences in bedload rates of more than the 328
50% or more than 5 minutes of interval in bedload flux registration) occurred in 11 of 329
20 events. In nine of the 11 events, bedload flux occurred later in the left sampler 330
compared to the right sampler. Bedload entrainment was recorded in the left sampler 331
when water depth attained a minimal threshold depth in the range 17-35 mm. The 332
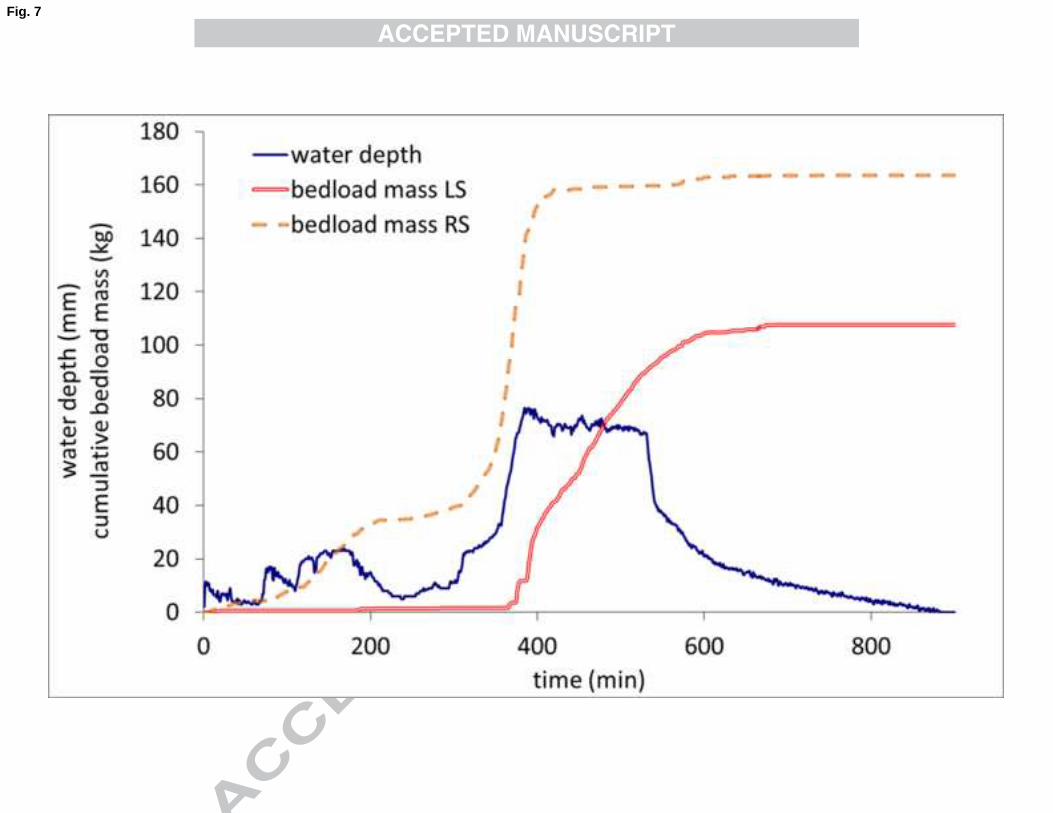
largest spatial differences in bedload flux occurred in shallow, bedload-transporting 333
flows during hydrograph rise (Fig. 7). 334
4.3 Bedload texture 335
Bedload collected in the Reid-type samplers showed an alternation of coarser and finer-336
grained sedimentary layers. Bedload texture was analysed from 276 facies-based 337
bedload samples. Correlating the thickness of the various facies with their cumulative 338
weight allowed inferring when the sample was collected (Laronne et al., 2003). The 339
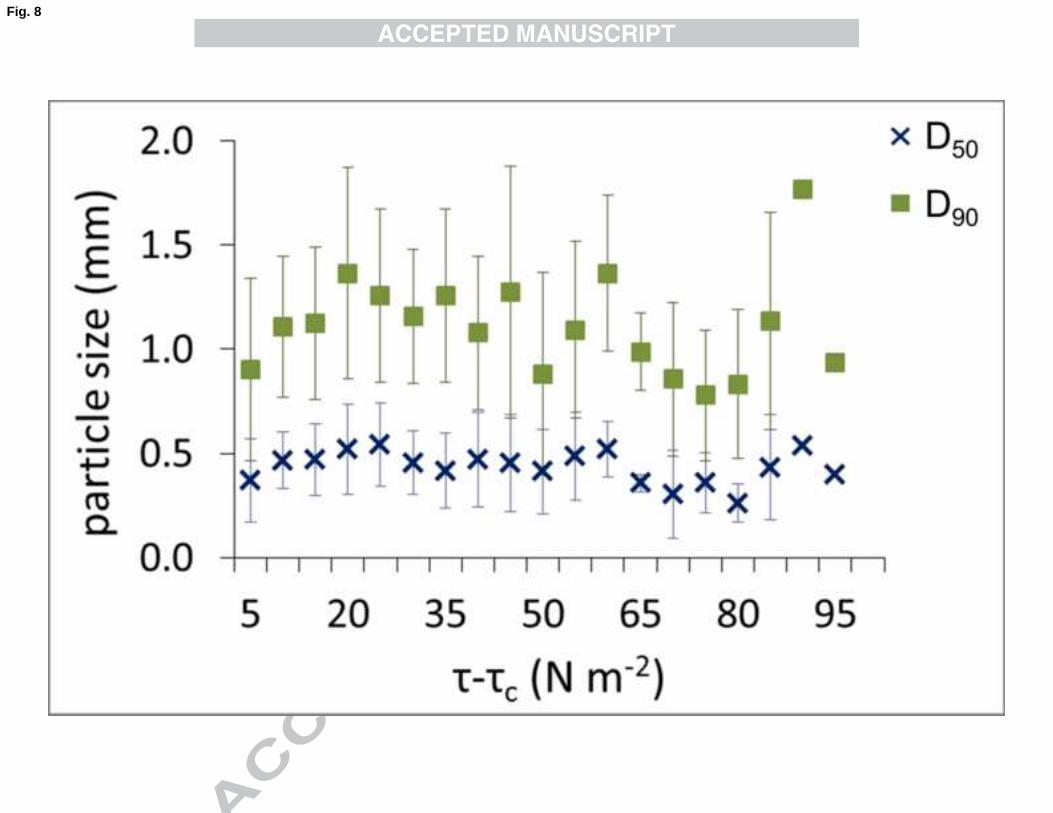
GSD of the samples were averaged and compared to the corresponding shear stress in 5 340
N m-2 bins. Interestingly, the GSD of bedload is unrelated to shear stress (Fig. 8) 341
indicating that selective transport cannot be deduced from these data The range in D50 342
variation is smaller than that for D90, but the relative variability is similar (Fig. 8), as 343
expected given their respective sizes (Whitaker and Potts, 2007). 344
4.4 Morphotexture of the channel bed 345
The explanation of (1) the alternation of GSD facies within the sampler despite non-346
selective bedload transport, as well as (2) the spatiotemporal variation of bedload flux 347
while flow depth remained essentially constant, appears to depend on the character of 348
channel bed morphology. Comparison of the median water depth with the relief of what 349
at first appeared to be a simple flat channel with minute topographic differences, in fact 350
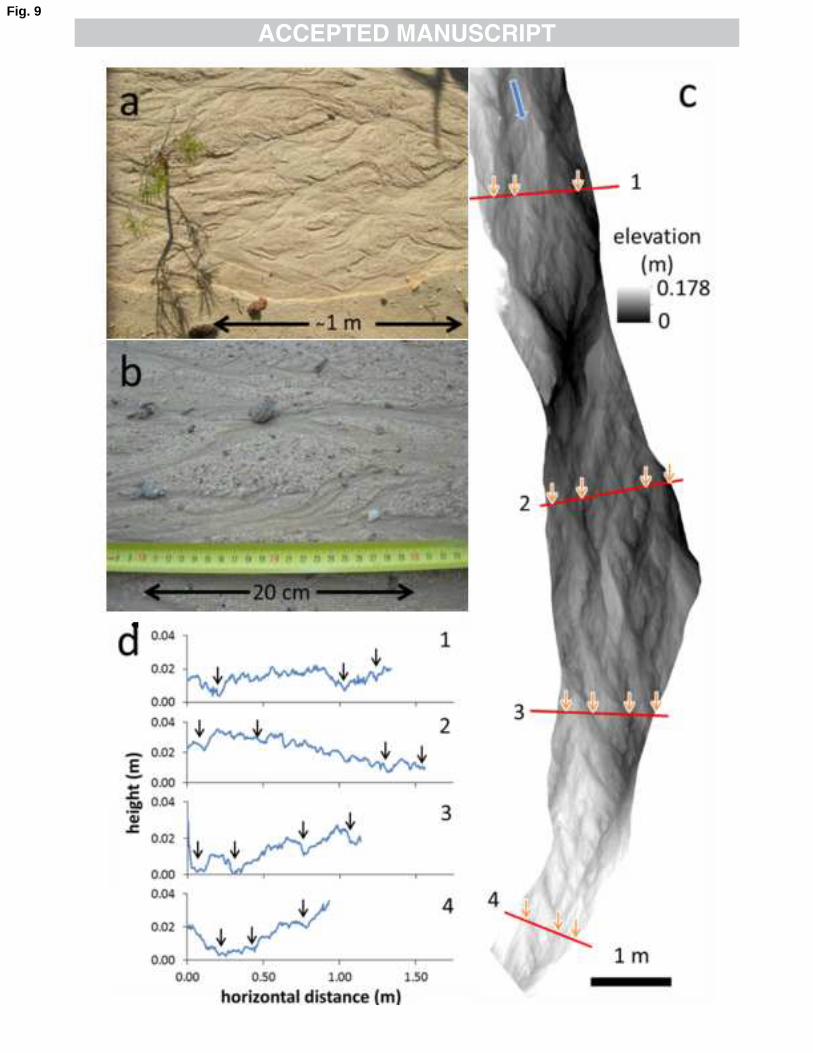
shows that both are of similar magnitude. A zoom into the ephemeral channel bed after 351
the occurrence of a bedload-generating flow event reveals that the bed is comprised of 352
bedforms with an apparent braided pattern (Fig. 9a). To describe the characteristics of 353
the channel bed in detail, a topographic survey was carried out with the Terrestrial Laser 354
Scanner (TLS). A 10 m channel reach of a tributary gully of the Barranca de los Pinos 355
was selected for this survey because the topographic characteristics are essentially 356
identical in both channels, and because the Barranca bed was disturbed by animal 357
trampling which destroyed its micro-topography. The scanned tributary joins with the 358
main stem immediately downstream of the Barranca monitoring station. 359
The DEM obtained with the high resolution (1 mm) topographic survey 360
demonstrates that the channel has a well-defined braided pattern (Fig. 9c) with complex 361
bars on which chutes are developed, having an average length, width and height of 91, 362
21 and 1.2 cm respectively. The average braiding index, defined as the number of 363
anabranches (arrows in Fig. 9d) per cross section (Egozi and Ashmore, 2008), is 3.5 364
(Fig. 9d). 365
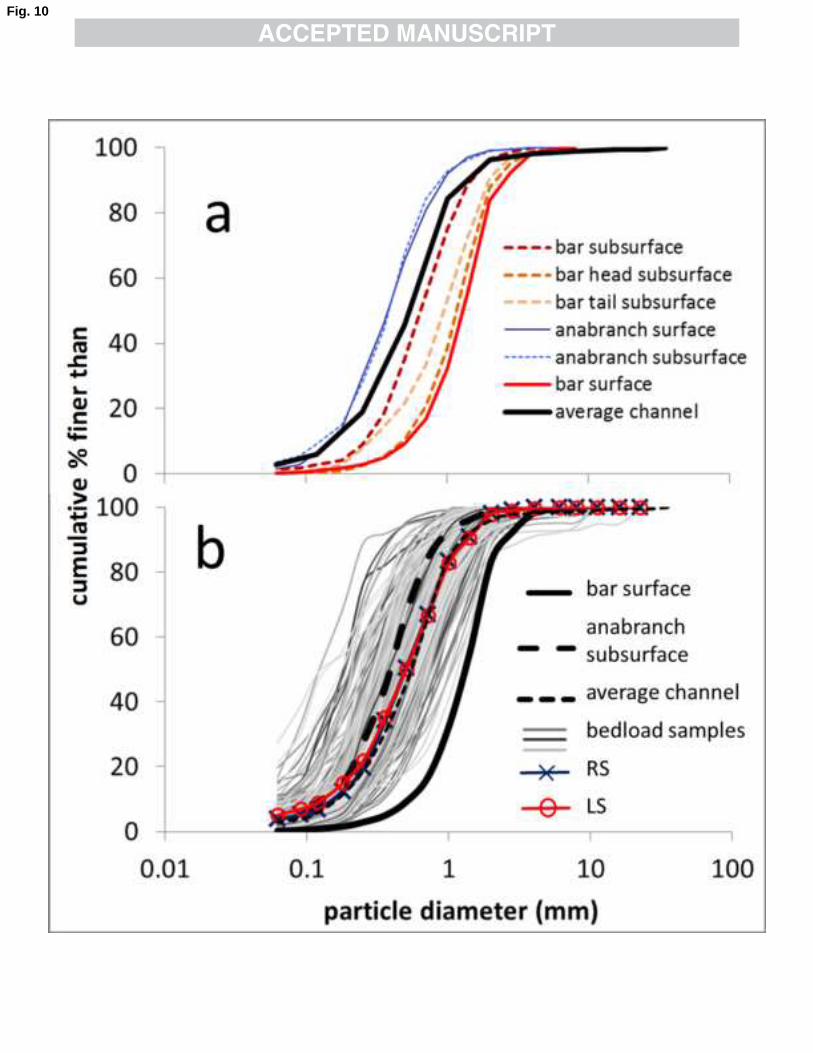
Considering the presence of these bedforms, a new sampling strategy was 366
undertaken to better characterize channel texture (Fig. 9b). Bar and anabranch surfaces 367
and subsurface were separately sampled, as was the general subsurface (Fig. 10a). The 368
sampling of the surface was undertaken by carefully scraping one-grain layer of surface 369
sediment. The subsurface was characterized by a bulk sample representing 1-2 cm of the 370
subsurface sediment. A large (3.4-fold) difference in grain size occurs between the D50 371
of the surface of anabranches (0.39 mm) and that of the bars (1.30 mm). That bar 372
surfaces are coarser-grained than the subsurface indicates that the bar surface is affected 373
by a phenomenon of segregation which is absent in the anabranches. The median of the 374
bar subsurface tail is 20% finer than the respective bar head, revealing the existence of a 375
bar-scale sorting process. 376
Comparing the GSD of the different parts of the channel with the samples of the 377
bedload retained in the samplers shows that bedload texture for many of the samples 378
was both coarser than that of the anabranch subsurface and finer than that of the bar 379
surface (Fig. 10b). Nearly half (44.5%) of all bedload samples were finer-grained and 380
the rest, a slightly larger fraction, coarser grained than the anabranches. Only two 381
bedload samples had a larger D90 than the respective centile of the bar surface. The 382
frequency of movement of the different sizes of bedload was analysed considering the 383
individual sampling duration and the total event sampling duration of each of the right 384
(RS) and left (LS) samplers (Fig. 10b). The GSD of the bedload collected in both 385
samplers is almost identical to the GSD of the average of the channel to 2 cm depth, 386
demonstrating that equal mobility characterized the entire duration of bedload 387
monitoring. However, since the analyzed bedload samples show an alternation of 388
coarser and finer-grained layers, and bedload transport was not selective with reference 389
to increasing shear stress (Fig. 8), it is suggested that the observed variations in GSD of 390
the bedload are related to bedform movement. 391
392
5 ANALYSIS 393
5.1 Prediction of bedload flux 394
In an attempt to determine the applicability of bedload equations to small, steep sand 395
bed channels, monitored bedload flux data were compared to selected bedload equations 396
(Fig. 11). Ten minute averaged data were used to diminish temporal variability inherent 397
in bedload transport (Ergenzinger et al., 1994). The ratio between calculated and 398
observed values ranged as much as three orders of magnitude. 399
The Smart and Jaeggi (1983) equation, established for flows on steep slopes and 400
nearly uniform sediments including sand, was first compared with our data. The 401
formula considerably overestimates with a median calculated/measured ratio equal to 16 402
(Fig. 11). The Smart and Jaeggi formula was established for straight channels with 403
minimal bedforms, whereas in our study bedload was measured in braided channels, 404
where form resistance is far from negligible. 405
Despite being developed for lower slopes and coarser sediment, the well-known 406
Meyer-Peter and Müeller or MPM (1948) formula was also examined as it has become 407
a standard for estimating bedload under a variety of settings. Bedload was 408
overestimated with a median ratio of 10 (Fig. 11). An improved fit, the range of 409
discrepancy decreased to about two orders of magnitude (corresponding to a median 410
ratio of one) was obtained by including the roughness correction n’/n=0.4 (where n’ is 411
the grain roughness and n is the total roughness); however flow velocity data were 412
unavailable to assess the appropriateness of this value. 413
The Ashmore (1988) equation was developed from data obtained in flume 414
experiments with conditions similar to the ones present in the Barranca de los Pinos 415
channel (sand and small gravel D90=4 mm, though with a gentler slope 0.01-0.015). It 416
was developed as a model for braided gravel bed rivers. The results show an 417
overestimation, with a median calculated/measured ratio of 3.6 (Fig. 11). This is not as 418
large as other ratios, well within the -0.1 to 10 range recently used for similar 419
comparison of bedload equations (Recking, 2010) in consideration of the uncertainties 420
of the empirical equations and of the queries associated with bedload measurements (see 421
hereafter). This equation implicitly takes into account form resistance associated with 422
the braided pattern, with no requirement for an a priori hydraulic correction as with 423
MPM. However, it was derived for the mean bed shear stress (calculated from the cross-424

sectionally averaged depth and width), whereas in this study, local depth (that over the 425
right slot sampler) was used. 426
In summary, such equations were expected at best to predict the median bedload 427
flux, though with admittedly large confidence intervals. Certainly none of these and 428
other tested bedload formulae can be expected to reproduce the large variations about 429
median (or mean) bedload fluxes, fluctuations which are inherent to bedload transport in 430
multithread channels. 431
5.2 Fluctuations in bedload flux 432
One of several reasons for variability in bedload transport is the fluctuating nature of 433
boundary conditions at a given location: slope (S), grain diameter (D) and flow depth 434
(approximately equal to the hydraulic radius (R) for shallow flows); these are the 435
building blocks of the Shields parameter or non-dimensional shear stress ( *): 436
* = R S/[D((ρw/ρs)-1)] 437
where R is hydraulic radius. These parameters varied in time and space in this study as 438
follows: 439
150% for sediment diameter when considering maximum and minimum D50 440
measured in the different parts of the channel (Fig. 10a); 441
±0.8% of the average slope ̶ the maximum fluctuation observed in some flume 442
experiments with high longitudinal slope (9%) (Recking et al., 2009); 443
water depth minus a range from 0 to 3 cm; 3 cm is the maximum bar height in 444
the cross section (Fig. 9d). 445
It is relevant to note that the calculated variations in these parameters do not completely 446
explain the large variability of observed bedload flux. Indeed, bedload fluctuations are 447
also linked to variation in the supply of sediment and occur in rivers under steady flow 448
(Ashmore, 1988; Cudden and Hoey, 2003; Ergenzinger et al., 1992; Gomez, 1983; 449
Gomez et al., 1989; Recking et al., 2009; Turowski, 2010). 450
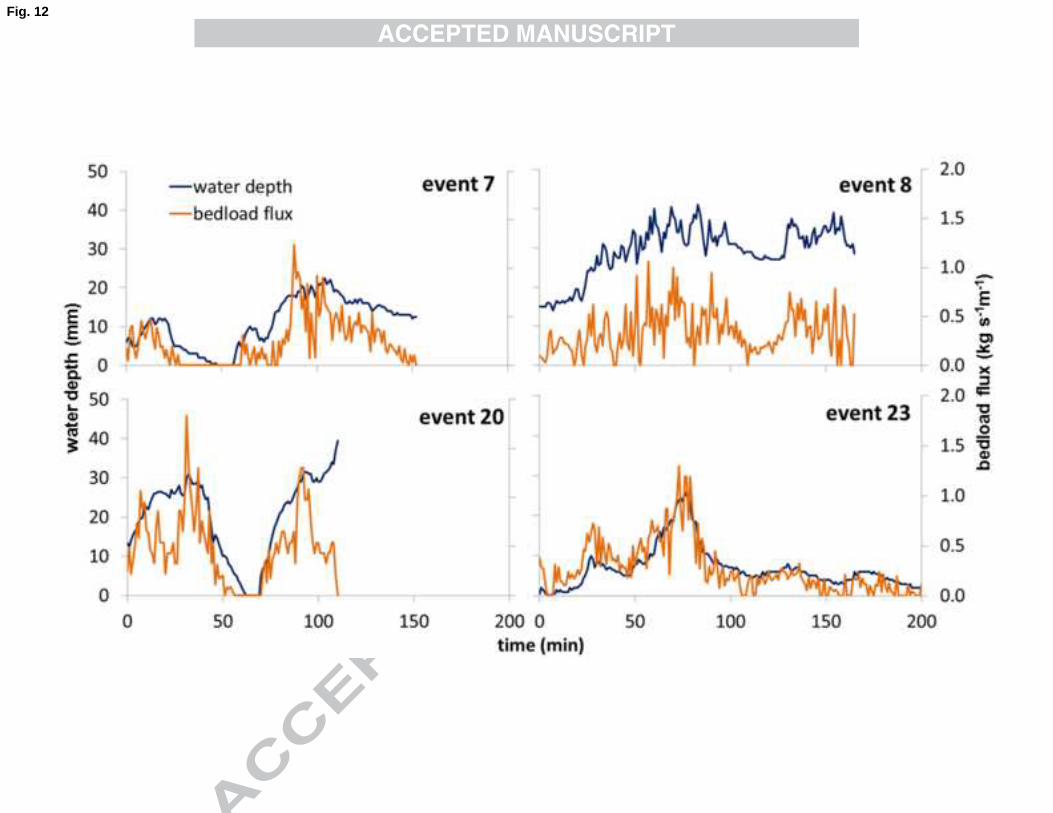
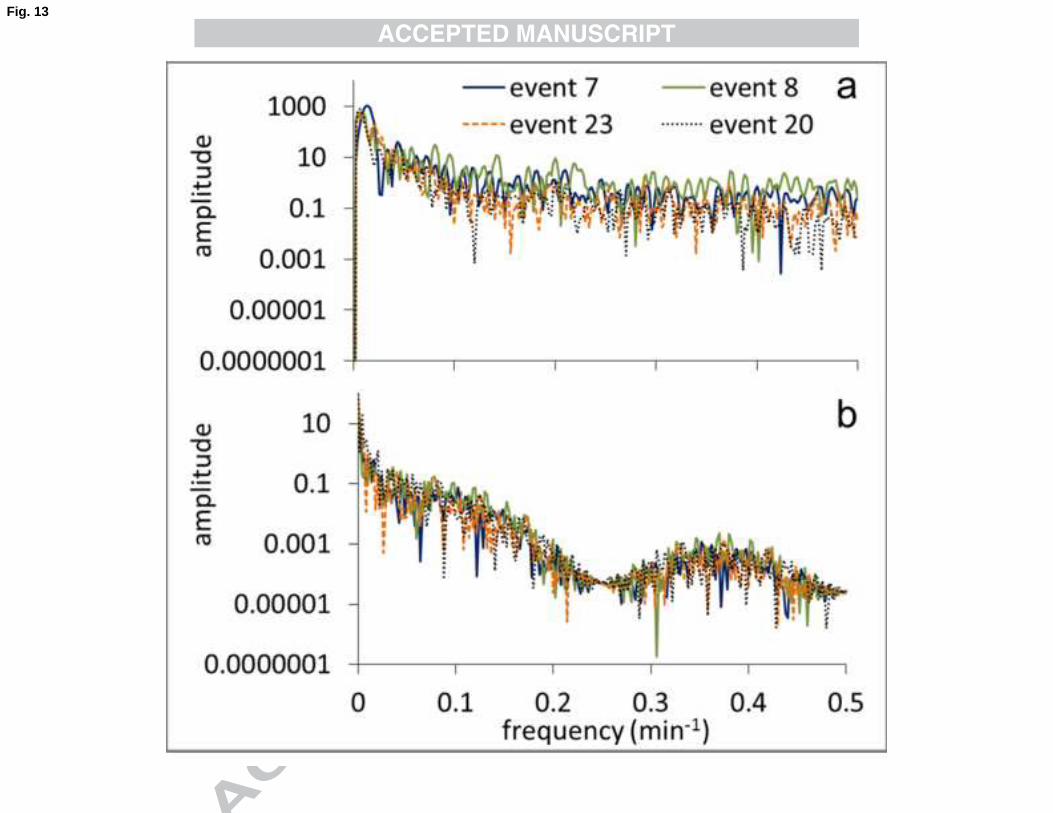
To determine whether such fluctuations occur and also their nature, frequencies 451
of the temporal variation of bedload flux and water depth were analysed using a Fourier 452
transformation (Recking et al., 2009). For this analysis, only data from the right bedload 453
sampler were used, because the vented pressure transmitter recording water depth is 454
located in the right slot sampler, and there are considerable variations in water depth 455
across the channel at shallow flows. Most of the events had a short duration, which 456
prevented undertaking a thorough Fourier analysis for all the events. Four events (7, 8, 457
20 and 23 ̶ Fig. 12) had a duration longer than 100 min, considered to be sufficiently 458
long to permit a time series analysis. These were sampled at 1 min interval. The four 459
events represent a range of flow characteristics while bedload flux remained within a 460
similar range of values. Although a clear peak of frequencies is not observed, all the 461
bedload flux signals have an identical spectral signature (Fig. 13b) despite the different 462
frequency spectrum of flow depth (Fig 13a). This suggests that fluctuations are in part 463
controlled by internal mechanisms such as bedform movement. While there were no 464
clear peaks in the bedload signal there was a progressive evolution covering all 465
frequencies, indicating that the phenomenon responsible for fluctuations is not discrete, 466
but continuous; e.g., bedload sheet movement or the braiding pattern, which incessantly 467
changes over time. 468
469
6 DISCUSSION 470
The obtained data allows characterizing bedload flux and GSD and its relation with the 471
shear stress in this environment, revealing a complex system with several particularities. 472
6.1 Bedload flux and hydraulics 473
The Barranca de los Pinos is distinctly ephemeral, with water and sediment movement 474
occurring during only about 2% of the study period, similar to many other ephemeral 475
streams (Reid et al., 1998). During this period, the mean water depth in the channel was 476
16 mm, ranging from 1 to 155 mm. Despite the shallow flow, bedload fluxes were high; 477
the 1st and 3rd quartiles were 0.33 and 0.70 kg s-1m-1 but maxima of more than 20 kg s-478
1m-1 were registered. These bedload fluxes are higher than fluxes continuously 479
monitored in perennial gravel bed rivers in different environments, ranging between 480
0.001 and 1 kg s-1m-1 with maxima rarely higher than 1 kg s-1m-1 (García et al., 2000; 481
Habersack et al., 2001; Laronne and Reid, 1993; Mao et al., 2010; Milhous, 1973; 482
Rickenmann and McArdell, 2007; Vericat and Batalla, 2010). They are also higher than 483
the few measured rates in small flow events in an ephemeral sandy river having a steep 484
longitudinal slope, the Gereb Oda (Billi, 2011) where measured bedload ranged from 485
0.01 to 1 kg s-1m-1. 486
Bedload fluxes obtained in the present study are comparable to those measured 487
in sandy gravel bed rivers draining active volcanic terrain such as Mt. Pinatubo after its 488
eruption (Hayes et al., 2002) with rates from 0.1 to 2.2 kg s-1m-1 and to upland 489
ephemeral, gravel bed rivers in the Israeli desert: Nahal Eshtemoa (Reid et al., 1998); 490
Nahal Yatir (Reid et al., 1996) and Nahal Rahaf and Qanna'im (Cohen and Laronne, 491
2005), where respective transport rates of 0.1 to 2.2, 0.01 to 8, 0.1 to 37 and 0.1 to 15 492
kg s-1m-1 have been measured, in four ephemeral gravel bed rivers with an identical 493
method and a 1-min averaging duration of bedload flux. In fact, bedload fluxes in the 494
Barranca were in a similar range and produced by the same magnitude of shear stresses 495
as in these ephemerals. While channel types are distinct there are similarities: they have 496
a segregated coarser bar surface, almost twice the median size of the subsurface (1.71 497
and 1.98 times coarser in the Nahal Yatir and in the Barranca respectively). However, in 498

the Barranca de los Pinos the slope is steeper whereas sedimentary grain size and water 499
depth are at least one order of magnitude smaller. The reasoning for the high Barranca 500
bedload fluxes is thought to be the ephemeral character of the channel (Laronne and 501
Reid, 1993), the fine texture of the channel bed, the steep longitudinal slope and the 502
high sediment supply (in the sense of Dietrich et al., 1989). 503
Ephemeral rivers continuously monitored using Reid bedload samplers have 504
been shown to have a high correlation between channel average bedload flux and cross-505
sectional averaged shear stress. Where cross-sectional variations do occur, they are 506
ascribed to variation in local shear stress (Powell et al., 1999). The dependence of total 507
bedload yield on average shear stress is also strong in miniature braided sandy channels 508
formed in flumes (Ashmore, 1988). However, in most of these relations a substantial 509
scatter was evident, as is in the channel of the Barranca de los Pinos. In this site, the 510
scatter is explained as a consequence of two types of temporal variation (hysteresis and 511
sediment waves) and spatial variability. 512
Despite substantial spatial and temporal scatter, measured bedload flux data 513
were compared to a set of standard bedload equations to evaluate the ability of these to 514
predict rates of bedload flux for braided sandy streams. Standard bedload equations tend 515
to underestimate bedload sediment yield when they are used with width- averaged input 516
data because they are non-linear (Gomez and Church, 1989; Ferguson, 2003; Paola, 517
1996); this is particularly true for braided rivers with highly irregular sections (Bertoldi 518
et al., 2009; Nicholas, 2000). The contrary (overestimation) was observed here when 519
estimates from the Meyer-Peter and Müller and Smart and Jaeggi equations were 520
compared against the Barranca de los Pinos database. This can be explained by two 521
reasons: first, calculations were not made with the width averaged data, but with a local 522
shear stress computed from the depth measured at the right slot sampler. Second, the 523

computed shear stress was not corrected for form-induced resistance, which was likely 524
higher than the grain shear stress. The empirical Ashmore (1988) equation developed in 525
a flume for gravel bedded braided rivers predicts better the bedload flux response, even 526
though it is to be applied to channel average values rather than to local bedload flux. 527
6.2 Morphotexture of the channel 528
The Barranca bed topography, as well as the temporal and spatial variability in bedload 529
flux and its texture, point to the existence and importance of bedforms. Bedforms are a 530
result of the interactions between coarse and fine fractions during bedload transport of 531
poorly sorted bed material (Dietrich et al., 1989), as observed in experiments at constant 532
water discharge in flumes (Ashmore, 1988; Iseya and Ikeda, 1987; Nelson et al., 2009; 533
Recking et al., 2009) and in sandy natural rivers (Whiting et al., 1988). 534
The observed bedforms in the channel of the Barranca de los Pinos could be bars 535
or sand sheets. Given their average dimensions: 91 cm long and 1.2 cm thick, they are 536
to be considered bars since their size is larger than the dimensions given for bedload 537
sheets ̶ a length of 100 to 600 grains and one or two grains thick (Whiting et al., 1988), 538
which, scaled to the studied channel, would be equivalent to 0.6 m long bedforms with a 539
thickness of 2 mm. The bedforms are also more extensive than bedload sheets observed 540
in the Gereb Oda, (Billi, 2011). The thickness of the bars in the Barranca is almost half 541
of the median water depth, similar to the height of bedforms described as bars that were 542
present in flume runs of braiding using sand (Ashmore, 1982). We have observed the 543
activity of these features during bedload generating events: they move and reform 544
similar to bars observed in flumes, but we have insufficient observations to state more. 545
From the available information, we deduce that the Barranca has two bedforms : 546
bars (based on the topography and bed material texture) as well as somewhat smaller 547
bedload sheets (based on oscillations/waves of bedload flux with time and the texture of 548
the bedload) moving over more stable bars in a braided pattern. This pattern has been 549
observed in flume experiments (Ashmore, 1988; Hoey and Sutherland, 1991) and in 550
gravel bed rivers (Church and Jones, 1982; Rice et al., 2009). Indeed, bars are formed 551
by the accumulation of successive bedload sheets (Rice et al., 2009). The topographic 552
signature of the sheets is not distinguished in the field nor in the TLS-based DEM; 553
nonetheless, they do contribute to the roughness detected on the bars (Fig. 9c). It is 554
apparent that bars are reshapped by the flow in the anabranches during the recessions as 555
we have observed in the few instances while present during recession and as suggested 556
elsewhere (Billi, 2008). 557
The bar surfaces, which are coarser-grained relative to the subsurface, indicate 558
the occurrence of segregation, a phenomenon observed in some gravel-bed channels and 559
explained by en masse deposition, particularly of the coarser sedimentary particles 560
(Duncan and Laronne, 1998) or else by the winnowing of fines (Leopold, 1994). The 561
equal mobility and the non-size selective transport (Batalla and Martin-Vide, 2001) of 562
Barranca sandy bedload indicates that the segregated surface is unstable (in the sense of 563
Gomez, 1984). Indeed the one-particle diameter surface layer of the bars is not well 564
packed, having no observed interlock. The coarser surface has been described as 565
resulting from bedload sheet transport (Recking et al., 2009). The latter is assumed to 566
result from a kinetic sieving process, being a very efficient sorting mechanism which 567
occurs in a moving layer, where the fine fraction is driven downward into the sediment 568
deposit and thereby produces a coarse bed surface (Frey and Church, 2012). 569
Compared to the segregated, sandy Barranca bars, those in ephemeral gravel bed 570
rivers have been shown to be to a large extent unsegregated (Laronne et al., 1994). The 571
miniature anabranches which are unsegregated, typical of other ephemeral systems 572
(Hassan et al., 2006; Laronne et al., 1994), have been explained to form by high 573

sediment yields and rapid recessions that minimize sediment winnowing. The processes 574
occurring on the channel bed during bedload transport appear to be similar to those 575
described in ephemeral gravel bed rivers. That the subsurface in the bar tail is finer-576
grained than in the bar head reveals that bar-scale sorting processes also occur, however 577
apparently not as efficiently as in gravel-bed rivers (Rice and Church, 2010). The lesser 578
textural gradient may owe its character to the finer overall texture and the better sorting 579
in the Barranca de los Pinos. 580
6.3 Interaction between morphotexture and bedload flux variability 581
Explanations for clockwise hysteresis in bedload transport are manifold: long lasting or 582
very intense flow exhausting the stored sediment, limited available sediment supply 583
(Humphries et al., 2012; Williams, 1989), sediment delivery from the channel bed and 584
banks or areas adjacent to the channel rather than from upstream sources and lack of 585
channel bed armouring (Hassan et al., 2005). However the Barranca has virtually 586
unlimited sediment supply, so limitations on sediment availability cannot explain the 587
hysteretic response. One process that may generate the clockwise hysteresis is the 588
destruction of the low relief of the Barranca bars between flow events. If so, bed 589
roughness will be lower and water velocity higher at the onset of the following event, 590
which may explain the clockwise hysteretic behaviour of bedload flux. As bedload 591
transport commences, bedforms are reformed to the braided pattern, increasing 592
roughness and decreasing bedload rates. 593
There are several mechanisms through which bedforms may be disturbed 594
between events. Observed animal trampling between flow events did destroy bedforms 595
above the site. Trampling increases roughness by giving rise to hoof-generated 596
indentations. Increased roughness due to trampling would thus result in lower bedload 597
fluxes during the rising limb, so trampling cannot explain the observed results. A 598

second relevant mechanism is the loss of the minuscule cohesion of the sandy surface 599
during a dry spell between flow events, when the subdued bedforms are blurred by 600
small gravitational movements along their borders, or by aeolian activity, in part 601
removing sediment from the bars and filling the minute anabranches (Good and Bryant, 602
1985). This could also explain why the braided pattern of the channel was unnoticed 603
before initiating the monitoring of water and sediment in the Barranca. Our data stands 604
to support the second above mentioned mechanism, because hysteresis is only present in 605
events occurring at least eight days after a preceding event. This may explain why the 606
proportion of hysteretic events is higher in summer than in other periods of the year, 607
since in this season rain events are more sporadic and the channel is dryer, meaning less 608
cohesion in the sandy bed surface. Relevantly, at the onset of some events, the GSD was 609
similar in both samplers, which may point to the existence of as yet undeveloped 610
bedforms. 611
The clockwise hysteresis in the Barranca cannot occur only due to a reduction of 612
the roughness during dry periods since this has been documented in natural rivers 613
(Gaeuman, 2010) and also under controlled flume conditions, with unlimited sediment 614
supply and nonuniform sediment. In the latter, the explanation has been the 615
reorganization of the bed surface, reducing the mobility of the finer sediments, thereby 616
decreasing bedload flux during the falling limb of the hydrographs (Mao, 2012). 617
Therefore, reorganization of the bed surface at the studied site may also reduce the 618
mobility of the finer sand, since the bar surfaces are coarser. 619
The observed spatial variability in bedload flux, when bedload was registered in 620
the left sampler only when water depth passed a threshold (see example Fig. 7), may 621
occur due to the presence of a bar, the bifurcation of which blocks water from flowing 622
to the left side at shallow depths. When water depth exceeded bar height, bedload was 623
registered over both samplers - over the entire 'braidplain' - reducing lateral differences 624
in bedload flux. This phenomenon is not always observed, possibly because the bar was 625
not developed in that position or because it was blurred by inter-event drying or 626
trampling, as explained above. 627
628
629
7 CONCLUSIONS 630
Local but continuous bedload flux data obtained in the Barranca de los Pinos are the 631
first available for natural sand-bedded channels. Their availability allow a glimpse into 632
the understanding of bedload transport in steep sandy channels, making headway in the 633
identification of the sources and causes of temporal and spatial variability. 634
1. Recorded bedload fluxes are among the highest measured to date comparable to 635
those registered in upland ephemeral gravel bed rivers or rivers draining active 636
volcanic landscapes, produced by high longitudinal slopes with fine-grained 637
channel bed material, indicating high supply of sediment. 638
2. The local bedload flux vs local shear stress database is characterized by a very 639
large scatter. Comparisons with bedload equations, even if developed for similar, 640
though channel average conditions, will predict a relationship that can differ as 641
much as an order of magnitude from measured values. 642
3. The scatter in bedload flux is produced by the existence of often unrecognized 643
miniature bedforms: bedload sheets moving over a subdued braided pattern, 644
thereby producing temporal and spatial variability in bedload flux. 645
4. These bedforms move and evolve during bedload-generating flow events, leading 646
to sediment waves interpreted as miniature bars with overriding bedload sheets. 647
The presence and emergence of very small central bars is the mechanism by 648
which spatial variability in bedload flux develops, similar to such processes in 649
large braided rivers. The bedforms in the miniature braided system are often 650
obliterated in the dry ephemeral channel between flow events, giving rise to 651
clockwise hysteretic bedload response due to bar reformation and the 652
reorganization of the bed surface. 653
5. The sediment texture of the channel presents differences as large as one order of 654
magnitude between the anabranch subsurface and the bar surface. Bedload texture 655
is thought to vary depending on the topography of the bed. The GSD of the entire 656
sampled bedload is similar to that of the bulk channel subsurface, implying that, 657
on average, bedload transport is generally of equal mobility also when the 658
segregated and unstable bar surfaces are mobile. 659
6. Measuring bedload in steep channels is a challenge also when the texture is sandy, 660
as it develops a braided pattern. For future studies, it is recommended to 661
accompany the monitoring of bedload with spatially distributed channel change 662
data and simultaneous and accurate water discharge measurements to calculate 663
hydraulic parameters such as stream power, average and local shear stress, thereby 664
furthering our understanding of relevant morphodynamic processes and 665
comparing them to those in other studied braided rivers. 666
667
Acknowledgements 668
This study was funded by Research Projects CGL-2006-07207 and CGL2010-21754-669
C02-01 of the Spanish Ministry of Science and Technology. Ana Lucía received benefit 670
from a pre-doctoral fellowship funded by the Complutense University of Madrid and 671
Jonathan Laronne participated through a Complutense University Exchange Program. 672
The German Federal Ministry of Education and Research (BMBF) funded the SUMAR 673
project, allowing YSP to participate in this study. The authors acknowledge the kind 674
collaboration of Saturnino de Alba for detrending the slope of the TLS data; Víctor and 675
Toño Muñoz, Cristina Martín-Moreno, Miguel Ángel Sanz-Santos, Ignacio Zapico, and 676
Agustín Blanco for their help in field work and Guillermo Pinto in the laboratory. We 677
acknowledge the comments of the editor, Konstantine P. Georgakakos, the associate 678
editor, Luca Mao and two anonymous reviewers; these considerably helped to improve 679
the original manuscript. 680
References 681
Alexandrov, Y., Cohen, H., Laronne, J.B., Reid, I., 2009. Suspended sediment load, bed 682
load, and dissolved load yields from a semiarid drainage basin: A 15-year study. 683
Water Resour. Res., 45(8): W08408. 684
Alonso, A., 1981. El cretácico de la provincial de Segovia (borde norte del Sistema 685
Central). Semin. estratigr., Ser. monogr., 7: 1-271. 686
Arcement, G.J., Jr., Schneider, V.R., 1989. Guide for selecting Manning's roughness 687
coefficients for natural channels and flood plains. Water-supply Paper 2339. 688
Ashmore, P., 1991. Channel morphology and bed load pulses in braided, gravel-bed 689
streams. Geogr. ann., Ser. A, Phys. geogr., 73(1): 37-52. 690
Ashmore, P.E., 1982. Laboratory modeling of gravel braided stream morphology. Earth 691
Surf. Process. Landf., 7: 201-225 692
Ashmore, P.E., 1988. Bed load transport in braided gravel-bed stream models. Earth 693
Surf. Process. Landf., 13(8): 677-695. 694
Bagnold, R.A., 1966. An approach to the sediment transport problem from general 695
physics. U.S. Geol. Surv. prof. pap., 422(I): 37. 696
Batalla, R.J., Martin-Vide, J.P., 2001. Thresholds of particle entrainment in a poorly 697
sorted sandy gravel-bed river. Catena, 44(3): 223-243. 698
Belleudy, P., Valette, A., Graff, B., 2010. Passive hydrophone monitoring of bedload in 699
river beds: first trials of signal spectral analyses. In: Gray, J.R., Laronne, J.B., 700
Marr, J.D.G. (Eds.), Bedload-surrogate monitoring technologies. U.S. Geol. 701
Surv. Sci. Investig. Rpt. 2010-5091, pp. 67-84. 702
Bertoldi, W., Ashmore, P., Tubino, M., 2009. A method for estimating the mean bed 703
load flux in braided rivers. Geomorphology, 103(3): 330-340. 704
Billi, P., 2008. Bedforms and sediment transport processes in the ephemeral streams of 705
Kobo basin, Northern Ethiopia. Catena, 75(1): 5-17. 706
Billi, P., 2011. Flash flood sediment transport in a steep sand-bed ephemeral stream. Int. 707
J. Sediment Res. , 26: 193-209. 708
Blott, S.J., Pye, K., 2001. GRADISTAT: a grain size distribution and statistics package 709
for the analysis of unconsolidated sediments. Earth Surf. Process. Landf., 26: 710
1237-1248. 711
Buckley, S., J, Howell, J.A., Enge, H.D., Kurz, T.H., 2008. Terrestrial laser scanning in 712
geology: data acquisition, processing and accuracy considerations. J. Geol. Soc. 713
(Lond.), 165: 625-638. 714
Bunte, K.I., Abt, S.R., Potyondy, J.P., 2001. Portable bedload traps with high sampling 715
intensity for representative sampling of gravel transport in wadable mountain 716
streams, Proc. 7th Interagency Sedimentation Conf., U.S. Subcomittee on 717
Sedimentation, Reno, Nevada, USA, pp. III-24-III-31. 718
CNIG (Ed.), 2004. Sección II. Grupo 9. Climatología Atlas nacional de España. 719
Ministerio de Fomento, Madrid. 720
Cohen, H., Laronne, J.B., 2005. High rates of sediment transport by flashfloods in the 721
Southern Judean Desert, Israel. Hydrol. Process., 19(8): 1687-1702. 722
Cohen, H., Laronne, J.B., Reid, I., 2010. Complex simplicity of bedload response 723
during flash floods in gravel-bed ephemeral rivers: a 10-year field study. Water 724
Resour. Res., 46: W11542. 725
Cudden, J.R., Hoey, T.B., 2003. The causes of bedload pulses in a gravel channel: the 726
implications of bedload grain-size distributions. Earth Surf. Process. Landf., 727
28(13): 1411-1428. 728
Church, M., Jones, D., 1982. Channel bars in gravel-bed rivers. In: Hey, R.D., Bathurst, 729
J.C., Thorne, C.R. (Eds.), Gravel bed rivers. John Wiley & Sons Ltd, Chichester, 730
pp. 291-338. 731
Church, M.A., McLean, D.G., Wolcott, J.F., 1987. River bed gravels: sampling and 732
analysis. In: Thorne, C.R., Bathurst, J.C., Hey, R.D. (Eds.), Sediment Transport 733
in Gravel-bed Rivers. John Wiley & Sons, New York, pp. 269-325. 734
D'Agostino, V., Lenzi, M.A., 1999. Bedload transport in the instrumented catchment of 735
the Rio Cordon: Part II: Analysis of the bedload rate. Catena, 36(3): 191-204. 736
Dietrich, W.E., Kirchner, J.W., Ikeda, H., Iseya, F., 1989. Sediment supply and the 737
development of the coarse surface layer in gravel-bedded rivers. Nature, 340: 738
215-217. 739
Du Boys, P., 1879. Étude du règime du Rhône et de l'action exercée par es eaux sur un 740
lit à fond de graviers indéfiniment affouillable. Annales des Ponts et Chausées, 741
18(5): 141-195. 742
Einstein, H., 1950. The bed-load function for sediment transportation in open channel 743
flows. U.S.Department of Agriculture.Technical Bulletin, 1026, 71 pp. 744
Engelund, F., 1966. Hydraulic resistance of alluvial streams. J. Hydraul. Div., Amer. 745
Soc. Civil Eng., 92(HY 2): 315-326. 746
Engelund, F., Hansen, E., 1967. A monograph on sediment transport in alluvial 747
streams., Copenhagen, Denmark. 748
Ergenzinger, P., de Jong, C., Laronne, J.B., Reid, I., 1994. Short term temporal 749
variations in bedload transport rates: Squaw Creek, Montana, Usa and Nahal 750
Yatir and Nahal Estemoa, Israel. In: Ergenzinger, P., Schmidt, K.-H. (Eds.), 751
Dynamics and Geomorphology of Mountain Rivers. Lecture Notes in Earth 752
Sciences. Institut für Georaphische Wissenschaften Frie Universität Berlin, 753
Berlin, pp. 251-264. 754
Ergenzinger, P., Reid, I., Laronne, J.B., Jong, C., 1992. Short term temporal variations 755
in the spatial pattern of bedload transport rate : Squaw Creek, Montana, USA 756
and Nahal Yattir & Eshtemoa, Israel. In: Bogen, J. (Ed.), Erosion and Sediment 757
Transport Monitoring Programmes in River Basins. AIHS - IAHS, pp. 77-81. 758
Gaeuman, D., 2010. Mechanics of bedload rating curve shifts and bedload hysteresis in 759
the Trinity River, California, 2nd Joint Federal Interagency Conference, Las 760
Vegas, NV, USA. 761
Gaeuman, D., Jacobson, R.B., 2006a. Acoustic bed velocity and bed load dynamics in a 762
large sand bed river. 111(F2). 763
Gaeuman, D., Jacobson, R.B., 2006b. Acoustic bed velocity and bed load dynamics in a 764
large sand bed river. J. Geophys. Res., 111(F02005): 14. 765
García, C., Laronne, J.B., Sala, M., 2000. Continuous monitoring of bedload flux in a 766
mountain gravel-bed river. Geomorphology, 34: 23-31. 767
Gaweesh, M.T.K., Van Rijn, L.C., 1994. Bed-load sampling in sand bed rivers. J. 768
Hydraul. Eng. Amer. Soc. Civil Eng., 120(12): 1364-1384. 769
Gomez, B., 1983. Temporal variations in bedload transport rates - the effect of 770
progressive bed armouring. Earth Surf. Process. Landf., 8(1): 41-54. 771
Gomez, B., 1984. Typology of segregated (armoured/paved) surfaces: Some comments. 772
Earth Surf. Process. Landf., 9(1): 19-24. 773
Gomez, B., Naff, R.L., Hubbell, D.W., 1989. Temporal variations in bedload transport 774
rates associated with the migration of bedforms. Earth Surf. Process. Landf., 775
14(2): 135-156. 776
Good, T.R., Bryant, I.D., 1985. Fluvio-aeolian sedimentation: an example from Banks 777
Island, N. W. T., Canada. Geogr. ann., Ser. A, Phys. geogr., 67(1/2): 33-46. 778
Gray, J.R., Laronne, J.B., Marr, J.D.G., 2010. Bedload-surrogate monitoring 779
technologies, 2010-5091, 37 pp. 780
Habersack, H., Nachtnebel, P.N., Laronne, J.B., 2001. The continuous measurement of 781
bedload discharge in a large alpine gravel bed river J. Hydraul. Res., 39(2): 125-782
133. 783
Haff, P.K., 1996. Limitations of predictive modeling in geomorphology. In: Rhoads, 784
B.L., Thorn, C.E. (Eds.), The Scientific Nature of Geomorphology. John Wiley 785
& Sons., pp. 337-358. 786
Hassan, M.A. et al., 2005. Sediment transport and channel morphology of small 787
forested streams. J. Am. Water Resour. Assoc. , 41: 853-876. 788
Hassan, M.A., Egozi, R., Parker, G., 2006. Experiments on the effect of hydrograph 789
characteristics on vertical grain sorting in gravel bed rivers. Water Resour. Res., 790
42(9). 791
Hayes, S.K., Montgomery, D.R., Newhall, C.G., 2002. Fluvial sediment transport and 792
deposition following the 1991 eruption of Mount Pinatubo. Geomorphology, 793
45(3-4): 211-224. 794
Helley, E.J., Smith, W., 1971. Development and calibration of a pressure-difference bed 795
load sampler. U.S. Geol. Surv. Open File Report, Washington D.C, USA, 18 pp. 796
Hoey, T.B., Sutherland, A.J., 1991. Channel morphology and bedload pulses in braided 797
rivers: a laboratory study. Earth Surf. Process. Landf., 16(5): 447-462. 798
Holmes, R.R.J., 2010. Measurement of bedload transport in sand-bed rivers: a look at 799
two indirect sampling methods In: Gray, J.R., Laronne, J.B., Marr, J.D.G. (Eds.), 800
Bedload-surrogate monitoring technologies. U.S. Geol. Surv. Sci. Investig. Rpt. 801
2010-5091. 802
Humphries, R., Venditti, J.G., Sklar, L.S., Wooster, J.K., 2012. Experimental evidence 803
for the effect of hydrographs on sediment pulse dynamics in gravel-bedded 804
rivers. Water Resour. Res., 48(1): 1-15. 805
Iseya, F., Ikeda, H., 1987. Pulsation in bedload transport rates induced by a longitudinal 806
sediment sorting; a flume study using sand and gravel mixtures. 69(A): 15-27. 807
Lancaster, S.T., Grant, G.E., 2003. You want me to predict what? In: Wilcock, P.R., 808
Iverson, R.M. (Eds.), Prediction in Geomorphology. Geophysical Monograph 809
135. American Geophysical Union, pp. 1-10. 810
Laronne, J.B. et al., 2003. The continuous monitoring of bedload flux in various fluvial 811
environments. In: Bogen, J., Fregus, T., Walling, D.E. (Eds.), Erosion and 812
sediment transport measurement in rivers: Technological and Methodological 813
Advances. Int'l Assoc. Hydrol. Sci. Publ., pp. 134-145. 814
Laronne, J.B., Reid, I., 1993. Very high rates of bedload sediment transport by 815
ephemeral desert rivers. Nature, 366(148-150). 816
Laronne, J.B., Reid, I., Yitshak, Y., Frostick, L.E., 1994. The non-layering of gravel 817
streambeds under ephemeral flood regimes. J. Hydrol., 159(1-4): 353-363. 818
Leopold, L.B., 1994. A view of the river. Hardvard University Press, Cambridge, 819
Massachusetts, 298 pp. 820
Leopold, L.B., Emmett, W.W., 1977. Bedload measurements, East Fork River, 821
Wyoming. Proc. Nat'l. Acad. Sci. U.S.A., 74: 2644-2648. 822
Leopold, L.B., Wolman, M.G., Miller, J.P., 1964. Fluvial processes in geomorphology. 823
Books in Geology. W.H. Freeman and Company, San Francisco. 824
Lucía, A., Laronne, J.B., Martín-Duque, J.F., 2011. Geodynamic processes on sandy 825
slope gullies in central Spain – field observations, methods and measurements in 826
a singular system. Geodin. Acta, 24(2): 61-79. 827
Mao, L., 2012. The effect of hydrographs on bed load transport and bed sediment 828
spatial arrangement. J. Geophys. Res., 117(F3): F03024. 829
Mao, L., Comiti, F., Lenzi, M.A., 2010. Bedload dynamics in steep mountain rivers: 830
insights from the Rio Cordon experimental station (Italian Alps). In: Gray, J.R., 831
Laronne, J.B., Marr, J.D.G. (Eds.), Bedload-surrogate monitoring technologies. 832
U.S. Geol. Surv. Sci. Investig. Rpt. 2010-5091, pp. 253-265. 833
Meyer-Peter, E., Müller, R., 1948. Formulas for bed-load transport, 2nd Meeting, 834
IAHR. IAHR, Stockholm, Sweden, pp. 39-64. 835
Milhous, R.T., 1973. Sediment transport in a gravel-bottomed stream. Unpublished PhD 836
Thesis, Oregon State University, Corvallis, 232 pp. 837
Mizuyama, T. et al., 2010. Calibration of a passive acoustic bedload monitoring system 838
in Japanese mountain rivers. In: Gray, J.R., Laronne, J.B., Marr, J.D.G. (Eds.), 839
Bedload-surrogate monitoring technologies. U.S. Geol. Surv. Sci. Investig. Rpt. 840
2010-5091, pp. 296-318. 841
Nicholas, A.P., 2000. Modelling bedload yield in braided gravel bed rivers. 842
Geomorphology, 36(1–2): 89-106. 843
Parker, G., 2008. Transport of gravel and sediment mixtures. In: García, M.H. (Ed.), 844
Sedimentation Engineering: processes, measurements, modeling, and practice. 845
Manual and Reports on Engineering Practice. ASCE, Reston, Virginia, pp. 165-846
252. 847
Powell, D.M., Laronne, J.B., Reid, I., 2003. The dynamics of bedload sediment 848
transport in low-order, upland, ephemeral gravel-bed rivers. Adv. environ. 849
monit. model., 1(2): 1-27. 850
Powell, D.M., Laronne, J.B., Reid, I., Barzilai, R., 2012. The bed morphology of upland 851
single-thread channels in semi-arid environments: evidence of repeating 852
bedforms and their wider implications for gravel-bed rivers. Earth Surf. Process. 853
Landf., 37(7): 741-753. 854
Powell, D.M., Reid, I., Laronne, J.B., 1999. Hydraulic interpretation of cross-stream 855
variations in bed-load transport. J. Hydraul. Eng. Amer. Soc. Civil Eng., 856
125(12): 1243-1252. 857
Powell, D.M., Reid, I., Laronne, J.B., 2001. Evolution of bed load grain size distribution 858
with increasing flow strength and the effect of flow duration on the caliber of 859
bed load sediment yield in ephemeral gravel bed rivers. Water Resour. Res., 860
37(5): 1463-1474. 861
Recking, A., Frey, P., Paquier, A., Belleudy, P., 2009. An experimental investigation of 862
mechanisms involved in bed load sheet production and migration. J. Geophys. 863
Res. , 114: 13. 864
Reid, I., Laronne, J.B., Powell, D.M., 1998. Flash-flood and bedload dynamics of desert 865
gravel-bed streams. Hydrol. Process., 12: 543-557. 866
Reid, I., Layman, J.T., Frostick, L.E., 1980. The continuous measurement of bedload 867
discharge. J. Hydraul. Res., 18(3): 243-249. 868
Reid, I., Powell, D.M., Laronne, J.B., 1996. Prediction of bed-load transport by desert 869
flash floods. J. Hydraul. Eng., 122(3): 170-173. 870
Rennie, C.D., Villard, P.V., 2004. Site specificity of bedload measurement using an 871
ADCP. J. Geophys. Res., 109(F3): F03003. 872
Rice, S.P., Church, M., 2010. Grain-size sorting within river bars in relation to 873
downstream fining along a wandering channel. Sedimentology, 57(1): 232-251. 874
Rice, S.P., Church, M., Wooldridge, C.L., Hickin, E.J., 2009. Morphology and 875
evolution of bars in a wandering gravel-bed river; lower Fraser river, British 876
Columbia, Canada. Sedimentology, 56(3): 709-736. 877
Rickenmann, D., Fritschi, B., 2010. Bedload transport measurements using piezoelectric 878
impact sensors and geophones. In: Gray, J.R., Laronne, J.B., Marr, J.D.G. 879
(Eds.), Bedload-surrogate monitoring technologies. U. S. Geol. Surv. Sci. 880
Investig. Rpt. 2010-5091, pp. 407-423. 881
Rickenmann, D., McArdell, B.W., 2007. Continuous measurement of sediment 882
transport in the Erlenbach stream using piezoelectric bedload impact sensors. 883
Earth Surf. Process. Landf., 32: 1362-1378. 884
Schaank, E.M.H., 1937. Discusion d Smetana, J.: Appareil pour le jaugeage du débit 885
solide entrainé sur le fond du cors d'eau, 1st Meet. Int. Ass. Hydraul. Struct. Res. 886
Append., pp. 93-120. 887
Smart, G., Jaeggi, M., 1983. Sediment transport on steep slopes. Mitteilungen der 888
Versuchsanstalt für Wasserbau, Hydrologie und Glaziologie, 64, Zurich, 91-191 889
pp. 890
Turowski, J.M., 2010. Probability distributions of bed load transport rates: A new 891
derivation and comparison with field data. Water Resour. Res., 46. 892
Van Rijn, L.C., 1984. Sediment transport. J. Hydraul. Eng., 110(10,11,12): 1431-1754. 893
Van Rijn, L.C., Gaweesh, M., 1992. A new total load sampler. J. Hydraul. Eng., 894
118(12). 895

Vericat, D., Batalla, R.J., 2010. Sediment transport from continuous monitoring in a 896
perennial Mediterranean stream. Catena, 82(2): 77-86. 897
Whitaker, A.C., Potts, D.F., 2007. Analysis of flow competence in an alluvial gravel 898
bed stream, Dupuyer Creek, Montana. Water Resour. Res., 43(7): W07433. 899
Whiting, P.J., Dietrich, W.E., Leopold, L.B., Drake, T.G., Shreve, R.L., 1988. Bedload 900
sheets in heterogeneous sediment. Geology, 16(2): 105-108. 901
Williams, G.P., 1989. Sediment concentration versus water discharge during single 902
hydrologic events in rivers. J. Hydrol., 111: 89-106. 903
904
Table captions 905 906 907 Table 1: Summary of the monitored bedload-generating flow events (June 2009 - 908
January 2010) in the Barranca de los Pinos. 909
910
Table 2: Summary of spatio-temporal variations in bedload flux based on monitored 911
flow events in the Barranca de los Pinos (June 2009 - January 2010). 912
913 Figure captions 914 915 916 Fig.1. Location of the study area. The mesas and cuestas are capped by limestone and 917
dolostone (grey). The hillslopes, dissected by gullies, are underlain by horizontally-918
bedded silica sand deposits, with thin intercalations of clay and gravel (black). 919
920
Fig. 2. Upstream view showing the two Reid-type bedload samplers in the Barranca de 921
los Pinos. 922
923
Fig. 3. Scatter graph of bedload flux vs shear stress for all bedload flux data in both 924
samplers (a); example of event (08/12/2010, event 23, right sampler) when bedload flux 925
is coherent with shear stress; r2 = 0.74 (b). 926
927
Fig. 4. Example of clockwise hysteresis (direction of arrows) during event 19 928
(11/10/2010). LS= left sampler; RS= right sampler. 929
930
Fig. 5. Seasonality of the two kinds of temporal variation of bedload flux. Wave 931
occurrence varied seasonally less than did hysteresis, the latter was more frequent in 932
summer. 933
Fig. 6. Flow event 23 on 08/12/2010, when bedload flux in right sampler varied with 934
water depth – see Fig. 3b. (a). Flow event 6 on 19/01/2010 when bedload flux in left 935
sampler varied temporally while water depth remained essentially stable (b). Flow event 936
5 on 15/01/2010 when bedload flux in left sampler varied temporally in a wave-like 937
manner during quasi-constant increase in water depth (c). 938
939
Fig. 7. Example of bedload-generating flow event 10 (16/03/2010) when considerable 940
spatial variation in bedload flux occurs. Water is initially very shallow, supplying 941
bedload only to the right sampler. Overcoming a threshold in water depth, bedload is 942
thereafter also transported on the left side of the channel. 943
944
Fig. 8. D50 and D90 vs c (shear stress minus the critical shear stress in both samplers 945
and averaged for 5 N m-2 bins. The critical shear stress was calculated using the Meyer 946
–Peter and Müller (1948) non-dimensional critical shear stress (0.047). 947
948
Fig. 9. Detail of the miniature braided pattern of the Barranca channel soon after a 949
bedload-generating flow event occurred (a); detail of the coarser bars and finer-grained 950
anabranches (b); high resolution DEM (0.4 x 0.4 mm) of a channel reach after 951
detrending the longitudinal slope (c), showing the braided pattern, the individual 952
bedforms (complex bars with chutes developing on top of them anabranches 953
surrounding them), and the location of cross sectional profiles along the braidplain 954
dominated by bars and anabranches (marked with arrows) (d). 955
956
Fig. 10. Texture of various riverbed units, with differences of one order of magnitude in 957
the texture of anabranch and bar surfaces (a). Grain size distributions of bedload 958
samples (thin light grey); the bold dashed black line represents the average anabranch 959
subsurface and the bold black line the bar surface. Bedload texture is on average well 960
represented by the average anabranch subsurface. Individual bedload samples are 961
considerably finer-grained than the subsurface and few others considerably coarser, 962
approaching that of the surface of bars. Time-weighted mean GSD of bedload (RS= 963
right sampler; LS= left sampler), is almost identical to the average channel GSD (b). 964
965
Fig. 11. Ratio of calculated/measured 10-min averaged bedload flux (iB) in both 966
samplers. Bars indicate ranges; boxes indicate the 25 and 75 centiles; the median is 967
represented by a dash in the boxes. 968
969
Fig. 12. Temporal variation of bedload flux (right-sampler) and water depth during 970
events when monitoring duration exceeded 100 min. 971
972
Fig. 13. Evaluating the presence of a dominant frequency of bedload flux waves based 973
on Fourier analysis of bedload data for events when monitoring duration exceeded 100 974
min; water depth signal (a) and bedload flux signal (b). 975
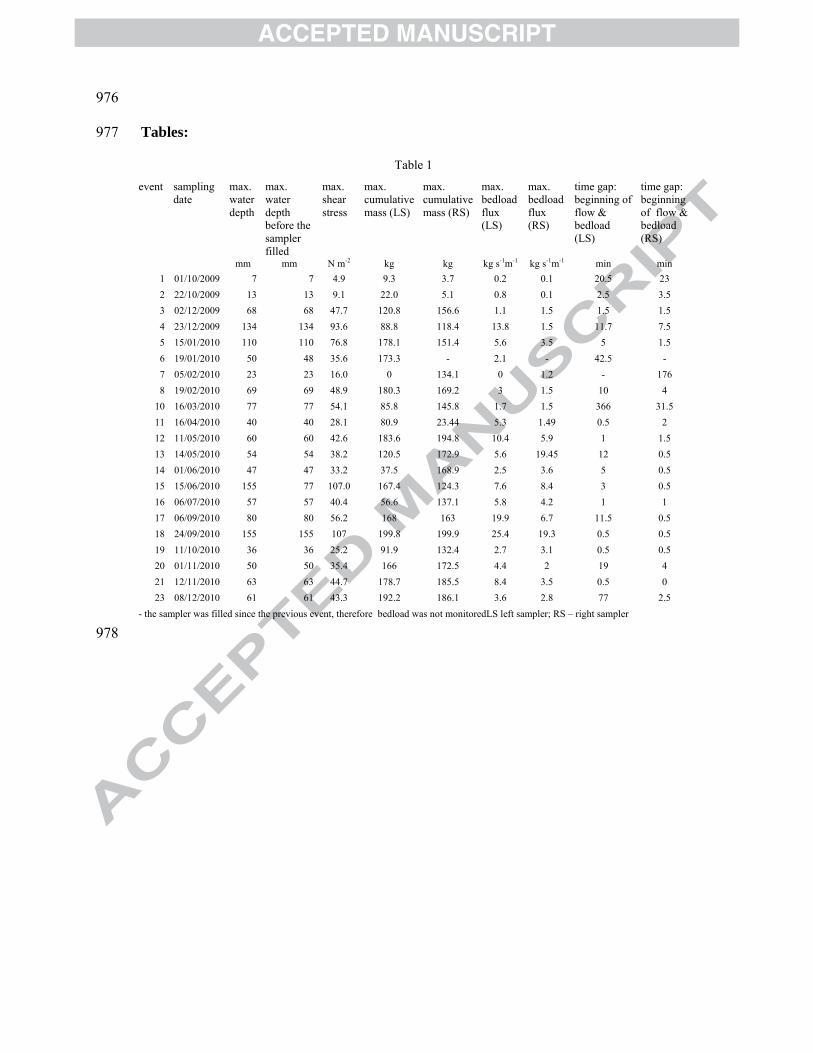
976
Tables: 977
Table 1
event sampling date
max. water depth
max. water depth before the sampler filled
max. shear stress
max. cumulative mass (LS)
max. cumulative mass (RS)
max. bedload flux (LS)
max. bedload flux (RS)
time gap: beginning of flow & bedload (LS)
time gap: beginning of flow & bedload (RS)
mm mm N m-2 kg kg kg s-1m-1 kg s-1m-1 min min 1 01/10/2009 7 7 4.9 9.3 3.7 0.2 0.1 20.5 23 2 22/10/2009 13 13 9.1 22.0 5.1 0.8 0.1 2.5 3.5 3 02/12/2009 68 68 47.7 120.8 156.6 1.1 1.5 1.5 1.5 4 23/12/2009 134 134 93.6 88.8 118.4 13.8 1.5 11.7 7.5 5 15/01/2010 110 110 76.8 178.1 151.4 5.6 3.5 5 1.5 6 19/01/2010 50 48 35.6 173.3 - 2.1 - 42.5 - 7 05/02/2010 23 23 16.0 0 134.1 0 1.2 - 176 8 19/02/2010 69 69 48.9 180.3 169.2 3 1.5 10 4
10 16/03/2010 77 77 54.1 85.8 145.8 1.7 1.5 366 31.5 11 16/04/2010 40 40 28.1 80.9 23.44 5.3 1.49 0.5 2 12 11/05/2010 60 60 42.6 183.6 194.8 10.4 5.9 1 1.5 13 14/05/2010 54 54 38.2 120.5 172.9 5.6 19.45 12 0.5 14 01/06/2010 47 47 33.2 37.5 168.9 2.5 3.6 5 0.5 15 15/06/2010 155 77 107.0 167.4 124.3 7.6 8.4 3 0.5 16 06/07/2010 57 57 40.4 56.6 137.1 5.8 4.2 1 1 17 06/09/2010 80 80 56.2 168 163 19.9 6.7 11.5 0.5 18 24/09/2010 155 155 107 199.8 199.9 25.4 19.3 0.5 0.5 19 11/10/2010 36 36 25.2 91.9 132.4 2.7 3.1 0.5 0.5 20 01/11/2010 50 50 35.4 166 172.5 4.4 2 19 4 21 12/11/2010 63 63 44.7 178.7 185.5 8.4 3.5 0.5 0 23 08/12/2010 61 61 43.3 192.2 186.1 3.6 2.8 77 2.5
- the sampler was filled since the previous event, therefore bedload was not monitoredLS left sampler; RS – right sampler
978
979
Bedload flux first ever continuously monitored in a natural steep sandy channel. 980
The bedload fluxes reported herein are among the highest observed in a natural setting. 981
The quasi-flat channel bed is actually braided, which produces variability in bedload 982 flux. 983
Bedload texture expresses bar-anabranch textural differentiation but also equal mobility. 984 985