Embed Size (px)
Citation preview

HAL Id: hal-03400273https://hal.archives-ouvertes.fr/hal-03400273
Preprint submitted on 24 Oct 2021
HAL is a multi-disciplinary open accessarchive for the deposit and dissemination of sci-entific research documents, whether they are pub-lished or not. The documents may come fromteaching and research institutions in France orabroad, or from public or private research centers.
L’archive ouverte pluridisciplinaire HAL, estdestinée au dépôt et à la diffusion de documentsscientifiques de niveau recherche, publiés ou non,émanant des établissements d’enseignement et derecherche français ou étrangers, des laboratoirespublics ou privés.
Distributed under a Creative Commons Attribution| 4.0 International License
Contribution of grain sorting to the bedload active layerdynamics
Alain Recking, Daniel Vazquez-Tarrio, Guillaume Piton
To cite this version:Alain Recking, Daniel Vazquez-Tarrio, Guillaume Piton. Contribution of grain sorting to the bedloadactive layer dynamics. 2021. �hal-03400273�

1
Recking, Vazquez & Piton (2021), personal draft version, to be submitted to the journal Special Issue related to the Gravel-bed River 9 conference
Contribution of grain sorting to the bedload active layer dynamics
Alain RECKING1, Daniel VAZQUEZ2, 3, Guillaume PITON1
1 Univ. Grenoble Alpes, INRAE, ETNA, Grenoble, France. 2 Geological Hazards Division, Geological Survey of Spain (IGME, CSIC), Madrid, Spain. 3 Departamento de Producción Agraria, Universidad Politécnica de Madrid, Madrid, Spain
Abstract
During the last 20 years, numerous sediment transport flume experiments have shown that grain sorting generates bed level fluctuations and bedload pulses. In this work, we first propose a new analysis of these experimental data. From this analysis, we derive a model for gravel bed rivers where both local slope and bedload are known to largely fluctuate through space and time, in the so-called ‘bedload active layer’. The model considers a maximum slope for local armoring equals to the mean bed slope affected by a coefficient which expresses the difference of mobility of the coarse fraction considered alone or in a mixture, and a minimum local slope for bed erosion equals to the mean bed slope corrected by a coefficient that depends on the armor ratio Ar (ratio of the surface to the sub-surface grains diameter) and the reach-averaged transport rate. The model is then compared with a compilation of scour-fill depths measured in the field. Results suggest that the slope fluctuations in 1D flume experiments are consistent with in-channel bed-level fluctuations associated to scour-fill processes in the active layer, with a maximum scour depth which is slope dependent. For the pulse intensity, we provide a justification to the simplified squared slope equation used to
compute solid concentration C = Qs/Q S² (with Qs the solid discharge, Q the water discharge and S the slope), which has often been used in place of standard bedload equations for modelling highly concentrated bedload transport events in mountain streams.
Plain Language Summary
Understanding how sediments are transported by rivers is essential because they largely control flood hydraulics, channel morphology and river ecology. What happens at the flow-grains interface is however complex, and for modelling purposes, it has for long been represented by a conceptual layer called the bedload ‘active layer’. In this work we reanalyze existing flume results aimed at unraveling the physical mechanism acting within the streambed, both in the granular zone and in contact with the flow. We propose a model which is then successfully tested against available field measurements. This model confirms that the pulsating nature of bedload in gravel bed rivers can largely be explained by grain sorting dynamics in the active layer.
This document is a draft paper written for the Gravel bed River 9 conference initially planned on January 2020, and finally postpone to January 2022.
It will be submitted for publication in the journal special issue of the conference

2
Recking, Vazquez & Piton (2021), personal draft version, to be submitted to the journal Special Issue related to the Gravel-bed River 9 conference
1. Introduction
Grain (size) sorting is a very efficient process by which grains of different size interact in a mixture. This process is omnipresent in all parts of the physics involving granular flows, and has large implications from industry to environment [Andreotti et al., 2011]. Mixture of grains also characterizes riverbed sediments, where evidences of grain sorting can be observed almost everywhere, both in the vertical and horizontal plans as shown in Figure 1.
Two main processes can drive grains to behave different ways in a mixture and finally to a spatial segregation of the different size classes in presence. The first process is a surface process, where smaller (and thus lighter) grains are more mobile than larger (and thus heavier) grains for a given shear stress exerted by the flow. However, such simple process is not always verified at the reach scale in riverbeds composed of a wide size range, because of hiding- and sur-exposing effects [Einstein and Chien, 1953; Egiazaroff, 1965; Parker and Klingeman, 1982]: despite they are lighter, finer grains are less mobile when protected by coarser immobile grains; conversely the mobility of the larger grains can be enhanced because of their larger exposure to the flow. At the reach scale, the most typical morphological feature associated with surface sorting is bed patchiness (Figure 1a) [Paola and Seal, 1995; Nelson et al., 2009; Guerit et al., 2014]. At a larger scale, it causes (in combination with abrasion) downstream fining, which means that finer sediments, lighter, are transported preferentially in the downstream direction [Seal et al., 1997; Toro-Escobar et al., 1997]. The second process responsible for segregation is a vertical motion of sediments within the mixture. The simplest form consists in infiltration or percolation of small grains in the voids between larger immobile grains [Perret et al., 2018]. But vertical sorting gains strongly in efficiency when the mixture becomes mobile, through the combined mechanisms of gravity-driven kinetic sieving [Middleton, 1970] and squeeze expulsion [Savage and Lun, 1988]. The result is a rapid migration of the coarser grains towards the surface and the burial of finer ones. This process which is present in all environments [Rosato et al., 1987] has been well described in dry granular flows [Gray, 2018] and have important implications for bedload transport in rivers [Frey and Church, 2009; Bacchi et al., 2014]. The main morphological feature associated with vertical sorting is bed armoring (Figure 1b), where a surface composed of large grains lies over a subsurface comprising much finer grains. Bed-surface armoring is very common in gravel bed rivers where it may be persistent during flood events [Wilcock and Mc Ardell, 1993; Church et al., 1998; Wilcock and Detemple, 2005; Clayton and Pitlick, 2007] because the shields stress is considered to barely exceed 1.2 times the critical Shield stress [Parker, 1978; Andrews, 1983] (i.e. the mixture is frequently ‘shaken’ but rarely fully and deeply destroyed and remobilized).
The study of grain sorting in sediment transport flume experiments can be traced back to early works [Gilbert, 1914; Iseya and Ikeda, 1987; Kuhnle and Southard, 1988; Lisle et al., 1991] but a growing interest to this question can be observed since the early 2000s [Kleinhans, 2002; Recking, 2006; Blom et al., 2008; Madej et al., 2009; Nelson et al., 2009; Bacchi et al., 2012; Saletti et al., 2015; Perret et al., 2018]. Results, obtained with a large range of slopes (from 0.5 to >10%), grain size distributions (sand to coarse gravel) and mixtures (unimodal to multimodal) have confirmed the very strong impact of grain sorting on bedload transport and the local morphodynamics (Figure 1c). Among interesting results these experiments have shown that even under quasi constant hydraulic conditions, bed surface armoring is not a uniform and constant process, but contrarily, is highly fluctuating through space and time, with successive local armor construction and destruction promoting very efficient exchanges between the transported and the bed material. The consequence is a very fluctuating bed state (local surface grain size and topography) associated with a bedload layer which is not a continuous carpet, but instead a succession of sediment pulses.

3
Recking, Vazquez & Piton (2021), personal draft version, to be submitted to the journal Special Issue related to the Gravel-bed River 9 conference
Figure 1 : (a) Surface sorting resulting in bed patchiness (b) Vertical sorting resulting in bed armoring with a coarse layer at the surface and fine sediments in the subsurface and (c) Surface
and vertical sorting in a step-pool
In the field, Parker and Klingeman [1982] also described the armor layer as a buffer zone promoting particle exchange between the transported and the bed material, and the pulsating nature of bedload transport was well documented [Gomez, 1983; Garcia et al., 2000; Cudden and Hoey, 2003; Vericat et al., 2006; Møen et al., 2010; Mao et al., 2014; Downs et al., 2016; Kreisler et al., 2017]. For numerical modelling purposes, this complexity of exchanges between the bedload and the bed material has been embedded under the concept of ‘bedload active layer’. Parker [2008] defined this concept as a ‘virtual’ stratum of active sediment exchange between bedload and the bed material, whose vertical extent is defined by the oscillations in the bed-level elevation associated to bedload fluctuations, even in the absence of clearly defined bedforms. In this definition, the active layer relates to the formation and break up of coarse clusters leading to local bed scour and fill at the length-scale of the surface D90 of the bed material size-distribution. Church and Haschenburger [2017] proposed to extend this definition by distinguishing between the ‘‘dynamical active layer’’ which is the current dynamically active streambed surface and ‘‘event active layer” which is the depth of event-scale scour and fill.
Selective entrainment and kinetic sorting participate to the bedload active layer dynamics. In this work we take advantage of existing flume results obtained by the Etna team (University of Grenoble Alps) during the last 20 years in order to push forward our understanding of the mechanism controlling the local bed slope and bedload fluctuations. We then use these results for discussing the field implications in gravel bed rivers, by comparison with available scour fill data.
2. The flume experiments and results
2.1 Presentation of the experiments
Table A1 given in Appendix summarizes a series of experiments dedicated to grain sorting during the last 20 years, which will support the present analysis. Experiments were conducted in several tilting flumes from 2 to 10 m long and 0.05 to 1 m wide. For each experiment, the channel was steadily fed

4
Recking, Vazquez & Piton (2021), personal draft version, to be submitted to the journal Special Issue related to the Gravel-bed River 9 conference
with water and sediments during long duration observations. These long duration experiments are a peculiarity of this experimental dataset: the complex behavior that we discuss in this paper requires grain size sorting to progressively self-organize the alluvial surface and subsurface and thus takes time to emerge. The flume slope was varied in the range 0.5 to 18% depending on the experiments. Discharge was measured with an electromagnetic flowmeter. Depths and velocity were measured by several technics, including point gauge and image analysis [Recking et al., 2008a; Piton et al., 2018]. The local slopes and topography were measured from staff gauges installed along the flume side wall or with the Structure-from-Motion technics [Piton et al., 2018; Piantini et al., 2021]. The sediment was fed with a system composed of a hopper connected to a conveyor belt, the velocity of which controlling the feeding rate. Various sediment mixtures of sands (0.1-2mm) and gravels (2-25 mm) were used. In a few runs (E1, E2, E3), the sediments at the flume outlet were measured continuously by video tracking [Frey et al., 2003]. Grains were painted with different colors for distinguishing visually grain sorting effects in the bed. Because the objective was to measure in-channel processes in response to given known input values, all inputs were maintained constant in all runs. It concerns solid and liquid discharge and the composition of the injected mixture too (i.e. no sediment recirculation). More detail on measurements and associated uncertainties are given in the papers cited as references. The slope and bedload fluctuations were well documented for Experiments E2, E3, E5, and E7 and the data used in this manuscript are presented in appendix.
2.2 Grain sorting and fluctuations
The following paragraphs summarize the main observations and conclusions already published in the aforementioned papers. It is worth stressing that the mechanisms described here were observed the same way in all runs, whatever the slope investigated in the range 0.5 to 18%. Among interesting results, all these experiments have built very unstable beds despite constant feedings rates, alternating successive local armor construction and armor breaking (Figure 2).
Figure 2 : a) Congested (armor) and b) smooth bed (no armor)
The temporal succession of these two bed states was systematically associated with fluctuations of the local slope and bedload transport intensity, as illustrated with the example shown in Figure 3 (see also video_1 in given supplementary material):
- Marginal transport and slope increase (‘stop’ phase): the slope increase is always associated with a very low output solid discharge of preferably coarse elements, which means that sediments injected in the flume mostly participate to the bed aggradation. Fine sediments are rapidly captured in the interstices of poorly mobiles coarse grains, while the bed surface progressively built an armor (Figure 2a).
- Peak transport and slope decrease (‘go’ phase): after armor breaking (Figure 2b) fine sediments previously stored in the bed are remobilized by the flow. In addition to feed the bedload layer, the fine sediments smooth the bed and drastically increase the transport efficiency, producing a peak of transport and a rapid slope decrease.

5
Recking, Vazquez & Piton (2021), personal draft version, to be submitted to the journal Special Issue related to the Gravel-bed River 9 conference
Figure 3 : Typical signal obtained in experiments with non-uniform mixtures, showing slope and bedload fluctuations, and the stop and go bedload transport. This figure corresponds to a zoom of run7 in experiment E2 at time 30h, the only run for which we measured a continuous outlet solid
discharge with image analysis.
2.3 The conditions of occurrence
The process of kinetic sorting is closely dependent on the flow condition, which can be characterized by the dimensionless shear stress, or Shields number:
𝜏∗ =𝜏
𝑔(𝜌𝑠 − 𝜌)𝐷=
𝑑𝑆
(𝑠 − 1)𝐷
(1)
Where is the shear stress, g is the acceleration of gravity, is the water density, s is the sediment
density, D is the grain diameter, d is the flow depth, S is the slope and s=s/. It was shown with
experiments E3 that the near mobility of the coarse fraction (when the Shields stress ratio */ c* computed for D84 is near 1) is the condition required for kinetic sorting to exist. Its consequence is the co-existence of two antagonists’ effects: on one hand, the coarse layer has a stabilizing effect by resisting to the water shear stress, allowing the construction of local steep (but poorly stable) slopes; on the other hand, by accumulating fines in the sublayer, it also creates a weaker layer, with poor shear resistance, contributing to the bed instability (Figure 4).
Figure 4 : sketch of the antagonist effects
Experiments E2 and E3 have shown that this process does not exist when */ c* << 1 (computed for
the larger grains such as D84). The process is rather maximized when */ c* is close to 1, diminish
when */ c* increases, and totally disappears when this ratio is over 2 (full mobility of the mixture). A large slope range has been investigated between 0.5 and 18%. On mild slope the observed armor was long to develop, incomplete and fragile; the steeper the slope and the thicker and more stable the armor, sometimes composed of several layers of coarse grains (see video_2 given in supplementary material).
2.4 Maximum slope and armor breaking
When the flume is fed continuously, the bed accumulates sediments and builds a slope by aggradation, with an armored surface. This slope cannot growth indefinitely and tends to stabilize reaching an equilibrium value, which is always the same for a given run. Once this maximum slope is

6
Recking, Vazquez & Piton (2021), personal draft version, to be submitted to the journal Special Issue related to the Gravel-bed River 9 conference
reached, large grains injected upstream does not built the armor anymore but are transported. A long phase of marginal local reorganization of the surface armor was sometime observed at this stage. At some point, a few clusters of large grains in motion, either fed from upstream or set in motion due to random effect as turbulence, destabilize the armor by impacting other grains at rest on a weak layer [Heyman et al., 2013]. The armor then breaks and a self-reinforcing process is triggered. Fine grains from the sublayer are progressively released and participate to transport. By filling the bed surface roughness, they smooth the bed, with an increase in transport rate efficiency of all size classes as a consequence, and the coarser grains in particular [Gilbert, 1914; Wilcock et al., 2001]. The more the armor is destroyed, the more fine sediments from the sublayer are released, and the more the process becomes efficient (see video_2 in supplementary material).
2.5 Bedload sheet and peak transport
The consequence of armor breaking is that, in a very short time, and for the same water discharge, bedload changes from a jerky low transport over a coarse and irregular bed (congested) into an intense continuous transport over a nearly flat (smoothed) bed. This generates peaks of transport reaching up to 2.5-3 times the average transport value, propagating in characteristic low and elongated bedforms, called bedload sheets, that are mainly composed of fine sediments from the subsurface eventually preceded by some coarser elements from the broken armor [Kuhnle and Southard, 1988].
2.6 Minimum slope and armor construction
In all experiments, a sediment flux is still injected upstream during bedload sheet propagation. This injected material is efficiently transported, with the coarse grains rolling over the flat bed surface, contributing (with sediments coming from the bed erosion) to the peak solid discharge measured at the outlet. However, bed erosion cannot last infinitely. The stored mixtures deplete, slope decreases and erosion stops when the flow is not able to transport the incoming flux anymore: in a few seconds the flat sandy bed starts to slightly undulate and the coarser grains rapidly restart forming immobile clusters. This is the first step for a new bed armoring cycle. This minimum slope is always the same for a given imposed feeding rates (Q, Qs), and can be considered an equilibrium slope of the transient, highly efficient transport mode over a flat bed.
2.7 Periodicity and scales of interest
An important result is that for a given run, the intensity of each peak is always the same whatever the duration (Figure 3). However, the peak duration depends on the spatial extend of armor breaking and is consequently highly variable through time.
On the vertical direction, the distance of bed disturbance directly linked to the transportation of sediments (event active layer [Church and Haschenburger, 2017]) varies between a fine layer of moving sand (after armor wash out), and a mixture depth not exceeding one (or two) coarse (armor) grain size diameter (Figure 2). The part of the bed affected on the long term through the successive episodes of erosion and deposition (dynamical active layer [Church and Haschenburger, 2017]) can be several times the coarse grains diameter and is larger on steep slopes.
On the longitudinal direction, the same slope amplitude was associated with different length of bed disturbance [Recking, 2014], producing very short (associated to local bed erosion) to very long (associated with bed collapse) bedload sheets. It is usually the bed state which conditions the capacity of a bedload sheet to propagate downstream. Most of them actually rapidly vanished as they interact with the downstream bed, changing its local slope, and progressively contributing to the downstream bed aggradation, as sketched in Figure 5. But the more the downstream bed aggrades and build a slope, the more bedload sheet extend increases. In some rare events (associated with fully aggraded bed) bedload sheet could propagate without stopping over the entire

7
Recking, Vazquez & Piton (2021), personal draft version, to be submitted to the journal Special Issue related to the Gravel-bed River 9 conference
flume length, resulting in a complete bed collapse (which could explain dramatic transport events in steep-sloped mountain streams [Piton and Recking, 2016]).
Figure 5 : Sketch of local bed level evolution during a short bedload sheet event
The important results to retain for the following is that, for a given run, whatever the scale of observation considered (local or reach scale):
- the minimum and maximum slope values Smin and Smax attained by the bed are the same, - all peaks of transport have sensibly the same intensity.
3. The equilibrium slopes hypothesis
3.1 The idea
In the above description, we defined two transport modes (low transport efficiency over an irregular coarse bed, and high transport efficiency over a flat and smooth bed), and two slopes (minimum and maximum). Considering the basic concepts of river geomorphology, a constant transport rate can be associated with an equilibrium slope. Could we expect that, for constant feeding rates, those two transport modes generate two different equilibrium slopes (maximum slope for low transport efficiency and minimum slope for high transport efficiency)?
This idea is supported by the Bagnold equation [Bagnold, 1966] which, for a given input condition in a constrained flow (Q, Qs, and W constant), can be reduced to [Recking et al., 2009b]:
𝑒 ⋅ 𝑆 = 𝐶𝑜𝑛𝑠𝑡𝑎𝑛𝑡 (2)
Where e is the transport efficiency and S is the slope. It means that the equilibrium slopes, if exist, are necessary ephemeral, because the change of efficiency is a very rapid process occurring as soon as the maximum or the minimum slopes are reached (armor breaking in one case and stop of bedload sheets in the other case).
Usually, equilibrium is considered when the bed slope stabilizes to a fixed value and the outlet Qsout equals the inlet Qsin. Unfortunately such condition is impossible to verify in our case as we are hypothesizing very ephemeral equilibrium states, where the transport conditions change abruptly as soon as the equilibrium is reached. Secondly, the sediment response always starts from upstream before propagating downstream, and in these transient states, a lag exists between the in-channel process (where Qs should actually be measured) and what is measured at the flume outlet, which makes the comparison of Qsin and Qsout very challenging.
This is why we chose another method in the next section, which consists in comparing the measurements in our runs (slope and Qs) with equations specifically derived for describing the transport of uniform sediments at equilibrium.
3.2 Test of the equilibrium hypothesis
Because both modes of transport are dominated by a size class (coarse elements for bed construction, and finer grains for bed erosion), we can test the equilibrium slope hypothesis by

8
Recking, Vazquez & Piton (2021), personal draft version, to be submitted to the journal Special Issue related to the Gravel-bed River 9 conference
comparing the measurements to equations proposed for describing equilibrium transport of uniform sediments. This is what we propose here with data from experiments E2 (the only data set well documented with all parameters required for computation; data are given in Appendix A2).
Many equations are available in the literature. Here we use the best fit equation obtained for a large flume data set (1200+ data covering a large range of slope and grain size) [Recking et al., 2016]:
Φ =14 ⋅ 𝜏∗2.5
1 + (𝜏𝑚
∗
𝜏∗ )10
(3)
Where Φ = 𝑞𝑠𝑣/√𝑔(𝑠 − 1)𝐷3 is the dimensionless solid discharge [Einstein, 1950], and
m*=0.23·S0.3 is a shields stress delimiting partial (grains are partially at rest, their movement being reduced around small bed undulations) and full-bedload mobility (grains move continuously over a flat bed). This equation fits the 1D local transport in a flume. Despite the same shape, it differs from a version derived for the field [Recking, 2013] where all parameters are averaged at the reach scale and implicitly incorporates the reach variability (exponent 4 instead of 10 and slightly different
formulation for m*).
The results of the tests are plotted in Figure 6:
- Test 1 (Figure 6a) shows that for the maximum slope Smax, the equation used with the mean bulk diameter D of the mixture fits the inlet solid discharge Qs of each run. This tends to confirm the hypothesis that the maximum slope is attained when the transport capacity matches the imposed inlet Qs.
- Test 2 (Figure 6b) indicates that just after armor breaking, the same calculation largely underestimates the peak transport measured at the flume outlet. It suggests that the equilibrium has changed.
- Test 3 (Figure 6c) indicates that the same calculation (maximum slope after armor breaking) done with the diameter of the sand fraction fits the peak outlet solid discharges. It suggests that after armor breaking, for the given steep slopes, the system rapidly adjusts the transport rate to the flow transport capacity.
- Test 4 (Figure 6d) indicates that calculation with the minimum slope attained by the erosion process and the sand diameter slightly overestimates the imposed inlet solid discharge. This support the hypothesis that when the high transport efficiency conditions prevail, the minimum slope is attained when the transport capacity reaches the imposed input Qs.
The end of erosion described in Test 4 is actually not easy to evaluate because the flow still transports few coarse grains coming from upstream and the later also contribute to the bedload dynamics. This probably explains why calculations done using the diameter of the fine fraction lead to overestimation. It seems obvious that the mobility of the coarse fraction alone does not explain the end of erosion as the flow depths is still 1.5 times higher than the critical depth computed for this size fraction in most runs. On the other end, what was clearly observed in all runs is that erosions systematically stopped when the coarse grains could no longer freely roll over a flat bed anymore, which always coincided with the reduced mobility of the finer fraction (passage from a perfectly flat sand bed to slightly undulated sand bed stopping the rolling grains).

9
Recking, Vazquez & Piton (2021), personal draft version, to be submitted to the journal Special Issue related to the Gravel-bed River 9 conference
Figure 6 : Test of the equilibrium slope hypothesis by comparison of the measurements with the bedload equation derived for transport of uniform sediments mixtures at equilibrium
To summarize, these results obtained by comparing the measured bedload flux with bedload computed with an equation that is supposed to represent equilibrium conditions of uniform sediments suggest the existence of three ephemeral equilibrium states, summarized in Table 1.
Equilibrium 1 Equilibrium 2 Equilibrium 3
S Smax Smax Smin
D Dm bulk Dsand Dsand
Qs Qsin Qsout (peak) Qsin
Table 1 : Three equilibrium slopes characterizing the fluctuation process
So, from a practical point of view, when designing an experiment, it should be easy to compute the input rates (Q, Qsin) for a given mixture and maximum expected slope Smax, considering Equilibrium 1. On the other hand, Equilibrium 3 should help to predict the associated minimum slope Smin attained during fluctuations. For that, the bedload equation must be inverted for computing Smin for the given
Q and Qsin. Because during the erosion phase the Shields stress * is computed with the diameter of
the subsurface material, the transport conditions verify * > m*, and as a first approximation Eq. 3 can be reduced to [Recking et al., 2016]:
Φ 14 ∙ 𝜏∗2.5 (4)

10
Recking, Vazquez & Piton (2021), personal draft version, to be submitted to the journal Special Issue related to the Gravel-bed River 9 conference
Considering that the transport rate in satisfies the minimum slope Smin at the end of the erosion
process (Equilibrium 3), replacing * by Eq. 1 in Eq. 4 permits to write an explicit solution for Smin:
S𝑚𝑖𝑛 (𝑠 − 1)𝐷
𝑑(
Φ𝑖𝑛
14)
12.5
(5)
Where D characterizes the transported bedload sheet mixture (mostly composed of the sand fraction). Because we have two unknown parameters Smin and d, a second equation (flow resistance equation) is needed for closure and the calculation must be iterative. We used a flow resistance equation [Recking et al., 2008b] presented in appendix 3 to compute the minimum slopes for each run of experiments E2. Results are plotted in Figure 7. The computed minimum slopes are slightly under-estimated when compared to measurements, but globally the prediction of the minimum slope with the above approximation can be considered satisfying.
Figure 7 : Computation of the minimum slope of fluctuations and comparison with measurements for each run of experiments E2
We can conclude that, using standard tools (flow resistance and bedload equations), it is possible to reproduce the different steps of the fluctuating process affecting the bed material and associated bedload, whatever the scale of observation, in flume experiments. We will now use these results for discussing their field implications.
4. Field implications
Because evidences of grain sorting are omnipresent in rivers, what was observed in the flume can thus be expected to emerge in the field. Despite slope and bedload fluctuations can occur at different scales, especially on steep slopes [Piton et al., 2016; Piton and Recking, 2016], direct evidences can be found at the scale of the bedload active layer. This is what we aim to discuss in this part.
4.1 Bed elevation fluctuation
We aim to test if the slope fluctuations measured in 1D flume experiments are consistent with the in-channel, roughly 1D local scour-fill processes associated with bedload transport that define the active-layer, as sketched in Figure 5.
We must first define a morphological referent flow depth dmorpho for the flow condition responsible for bed scouring. We propose to consider flows such that [Parker, 1979]:

11
Recking, Vazquez & Piton (2021), personal draft version, to be submitted to the journal Special Issue related to the Gravel-bed River 9 conference
𝜏𝑚𝑜𝑟𝑝ℎ𝑜∗ = 𝛼 ⋅ 𝜏𝑐
∗ (6)
with 1-1.2. This assumption makes sense in unconfined gravel bed rivers, where sections are self-formed, and where we can consider that an excess in discharge does not generate more water depths but rather expand laterally, flooding the surrounding floodplain after rapid bed deformation, and keeping the maximum local Shields stresses close to its critical value. But even in case of larger flow conditions, flume observations also suggest that bed deformations would be maximum at relatively low shear stress, which means in the recessing part of an hydrograph [Recking et al., 2009a]. With this hypothesis, inverting the Shield parameter equation (Eq. 1) gives, for a known mean river bed slope Smean, a referent flow depth dmorpho associated with the morphological processes:
𝑑𝑚𝑜𝑟𝑝ℎ𝑜 = 𝛼(𝑠 − 1)𝐷𝑟𝑒𝑓
𝑆𝑚𝑒𝑎𝑛𝜏𝑐𝑅𝑒𝑓
∗ (7)
Where *cRef is the critical Shields stress associated with a referent quartile of the bed grain diameter Dref used as a reference. Here we propose to use D84 and the following formulation [Recking, 2009]:
𝜏𝑐𝑅𝑒𝑓∗ = 𝜏𝑐84
∗ = 0.56 ⋅ 𝑆𝑚𝑒𝑎𝑛 + 0.021 (8)
Because Eq.6 implies that the flow is maintained close to incipient motion conditions, the equilibrium slope Smax imposed by the upstream bedload flux (as was the case in the flume), will be a near-threshold equilibrium slope. Secondly, because the armor is supposed well sorted and mainly composed of the coarser fraction, we assume that this local slope for armoring Smax can be approximated by the slope computed such that the coarse fraction (let say D84) is close to the incipient motion conditions of this size fraction considered as a uniform sediment. It reads:
𝑆𝑚𝑎𝑥 =(𝑠 − 1)𝐷84
𝑑𝑚𝑜𝑟𝑝ℎ𝑜𝜏𝑐_𝑈𝑛𝑖𝑓
∗ (9)
where *c_Unif is a critical Shields stress defined for uniform sediment mixtures. By replacing dmorpho from Eq. 10, we obtain:
𝑆𝑚𝑎𝑥 = 𝑆𝑚𝑒𝑎𝑛
𝜏𝑐_𝑈𝑛𝑖𝑓∗
𝛼 ⋅ 𝜏𝑐84∗
(10)
Written this way, the maximum local slope due to armoring is the mean bed slope affected by a proportionality coefficient expressing the difference of mobility between the coarse fraction considered alone, or in a mixture. Let consider for the uniform mixture [Recking et al., 2008b]:
𝜏𝑐_𝑈𝑛𝑖𝑓∗ = 0.15 ⋅ 𝑆𝑚𝑎𝑥
0.275 (11)
Introducing Eq. 14 in Eq. 13 reads:
𝑆𝑚𝑎𝑥 = [0.15 ⋅ 𝑆𝑚𝑒𝑎𝑛
𝛼 ⋅ (0.56 ⋅ 𝑆𝑚𝑒𝑎𝑛 + 0.021)]
11−0.275
(12)
This relation is valid for Smean 0.2% (for milder slopes Eq.11 should be replaced by a constant value 𝜏𝑐_𝑈𝑛𝑖𝑓
∗ 0.02) which includes most gravel bed rivers with self-formed channels.
The second hypothesis is that the minimum slope Smin can be computed with Eq. 5, where the
incoming flux in is the mean transport rate of the reach morpho computed for * = *morpho (Eq.6)

12
Recking, Vazquez & Piton (2021), personal draft version, to be submitted to the journal Special Issue related to the Gravel-bed River 9 conference
using the field version of Eq. 3, with a power exponent of 4 instead of 10 and 𝜏𝑚∗ = (5𝑆𝑚𝑒𝑎𝑛 +
0.06)(𝐷84
𝐷50)4.4√𝑆𝑚𝑒𝑎𝑛−1.5 for riffle pools morphology [Recking, 2013]:
S𝑚𝑖𝑛 =(𝑠 − 1)𝐷𝑠𝑢𝑏
𝑑𝑚𝑜𝑟𝑝ℎ𝑜(
Φ𝑚𝑜𝑟𝑝ℎ𝑜
14)
12.5
(13)
where Dsub is a characteristic diameter representative of the subsurface sediment (let say D84 of the subsurface for consistency with the percentile used for the bed surface); replacing dmorpho by Eq. 10 we obtain:
S𝑚𝑖𝑛 = 𝑆𝑚𝑒𝑎𝑛
1
𝛼 ∙ 𝜏𝑐𝑅𝑒𝑓∗
𝐷84𝑠𝑢𝑏
𝐷84𝑠𝑢𝑟𝑓(
Φ𝑚𝑜𝑟𝑝ℎ𝑜
14)
0.4
(14)
Naming the armor ratio Ar=D84surf/D84sub, it becomes:
S𝑚𝑖𝑛 = 𝑆𝑚𝑒𝑎𝑛
1
𝐴𝑟
1
𝜏𝑚𝑜𝑟𝑝ℎ𝑜∗ (
Φ𝑚𝑜𝑟𝑝ℎ𝑜
14)
0.4
(15)
Written this way, the minimum local slope after local bed erosion is the mean bed slope affected by a coefficient which depends on the armor ratio Ar and the mean transport rate of the reach associated
with the morphodynamically active Shields stress *morpho =⋅*c (with 1-1.2)
Finally, for computing a scouring depth, we must define a distance over which the local slope variation emerges. Whereas in the lab this distance was a few meters and constrained by the flume length, in the field it will likely be constrained by the dimensions of morphological units, such that the river width or length of bar units. This is why we propose to consider a characteristic length
L = ⋅W where W is the river (main channel) width and is a constant. Then, the maximum scour
depth (m) becomes:
= 𝜀 ⋅ 𝑊 ⋅ (𝑆𝑚𝑎𝑥 − 𝑆𝑚𝑖𝑛) (16)
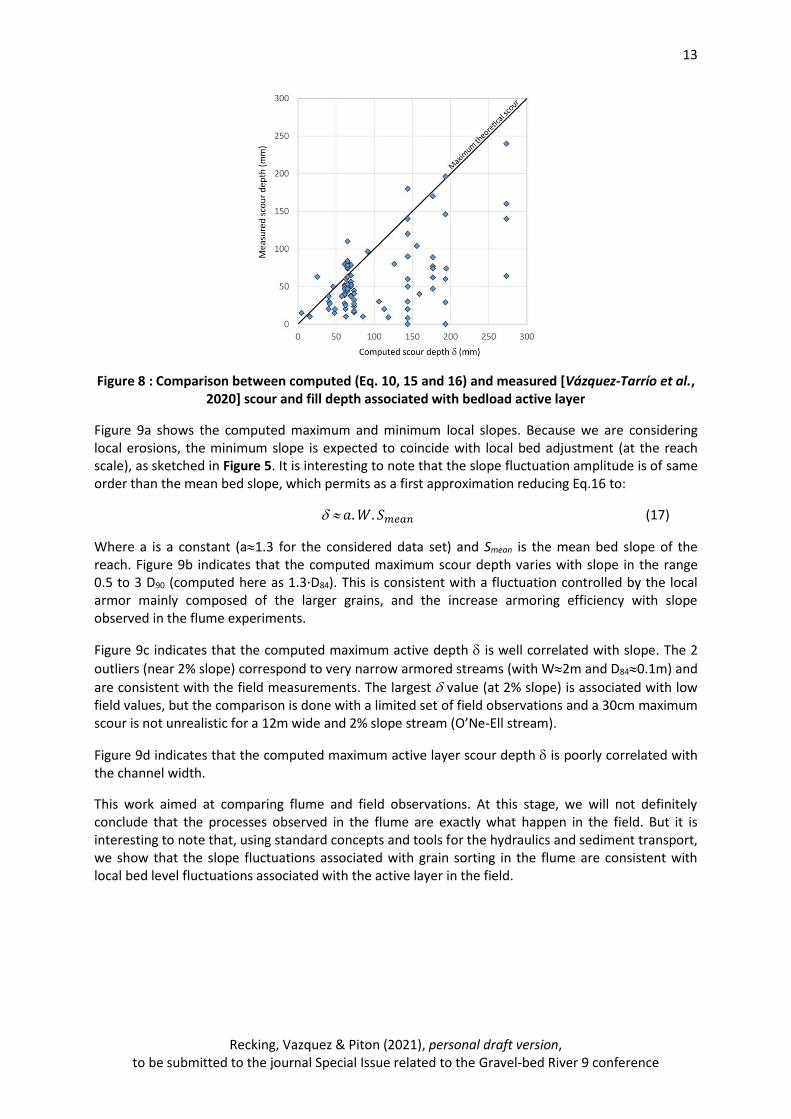
For testing these hypothesis, the set of formulations (Eq. 10, 15 and 16) is compared with a selection of active layer thickness data compiled in Vázquez‐Tarrío et al. [2020]. We used riffle-pool
morphologies and excluded from the analysis step-pool morphologies, where the hypothesis =1.2 does not hold, and where other controlling factors such as the interactions with the channel walls exist [Church and Zimmerman, 2007]. We also excluded braiding rivers data, where the distinction between in-channel scour-fill depth associated with the bedload active layer (what interests this study) and large scour-fill depth (>1m depth) due to channel avulsion and lateral migration is not always clear. We also excluded a few data for which the width was not defined for the main channel (active width) but for the wetted extent of channel (active band). The data set is available in supplementary material. For each run the armoring ratio Ar was computed with D50surf/D50sub (note that the value was approximately Ar=2, which could be used as a first approximation when this
information is missing). The results obtained with =1.2 and =1 (i.e, the characteristic length for scour and fill in the active layer is the river width W) are plotted in Figure 8. It shows that the maximum scour-fill depth measured very seldom exceeds the theoretical maximum scour-fill depth.
13
Recking, Vazquez & Piton (2021), personal draft version, to be submitted to the journal Special Issue related to the Gravel-bed River 9 conference
Figure 8 : Comparison between computed (Eq. 10, 15 and 16) and measured [Vázquez‐Tarrío et al., 2020] scour and fill depth associated with bedload active layer
Figure 9a shows the computed maximum and minimum local slopes. Because we are considering local erosions, the minimum slope is expected to coincide with local bed adjustment (at the reach scale), as sketched in Figure 5. It is interesting to note that the slope fluctuation amplitude is of same order than the mean bed slope, which permits as a first approximation reducing Eq.16 to:
𝑎. 𝑊. 𝑆𝑚𝑒𝑎𝑛 (17)
Where a is a constant (a1.3 for the considered data set) and Smean is the mean bed slope of the reach. Figure 9b indicates that the computed maximum scour depth varies with slope in the range 0.5 to 3 D90 (computed here as 1.3·D84). This is consistent with a fluctuation controlled by the local armor mainly composed of the larger grains, and the increase armoring efficiency with slope observed in the flume experiments.
Figure 9c indicates that the computed maximum active depth is well correlated with slope. The 2
outliers (near 2% slope) correspond to very narrow armored streams (with W2m and D840.1m) and
are consistent with the field measurements. The largest value (at 2% slope) is associated with low field values, but the comparison is done with a limited set of field observations and a 30cm maximum scour is not unrealistic for a 12m wide and 2% slope stream (O’Ne-Ell stream).
Figure 9d indicates that the computed maximum active layer scour depth is poorly correlated with the channel width.
This work aimed at comparing flume and field observations. At this stage, we will not definitely conclude that the processes observed in the flume are exactly what happen in the field. But it is interesting to note that, using standard concepts and tools for the hydraulics and sediment transport, we show that the slope fluctuations associated with grain sorting in the flume are consistent with local bed level fluctuations associated with the active layer in the field.

14
Recking, Vazquez & Piton (2021), personal draft version, to be submitted to the journal Special Issue related to the Gravel-bed River 9 conference
Figure 9: a) Computed maximum and minimum slopes, b) evolution of with grain size, c)
evolution of with slope and d) evolution of with channel width
4.2 A square slope formula for peak solid discharge
Can we predict the peak solid discharge associated with the bed elevation fluctuation, as proposed in the active layer concept? In our flume experiments the peaks of transport associated with armor breaking were 2 to 3 times the mean bedload value. It concerns short and long bed erosions, but because the scale of observation does not affect the intensity of transport (as discussed in a previous paragraph), we could consider as a first estimation this flume results as representative for the short time peak solid discharge naturally associated with fluctuations of the bed elevation in the active layer.
More precisely, can we derive an equation for these peak values? The flume results indicate that the maximum transport occurs after armor breaking, when the flow transiently adjusts its transport rate to the new condition of efficient transport over a flat bed, and until it depletes the available highly mobile stocks. In the flume, this transport is well represented by Eq. 4. For computing bedload transport, it must be combined with a flow resistance equation. Because the triggering conditions for
armor breaking are not necessarily high (e.g., */ c* 1 in E2, E3 and E7), we propose to consider the following flow resistance equation valid for 1<q*<100 [Rickenmann and Recking, 2011]:

15
Recking, Vazquez & Piton (2021), personal draft version, to be submitted to the journal Special Issue related to the Gravel-bed River 9 conference
𝑈/√𝑔𝑆𝐷 = 1.6 ⋅ 𝑞∗0.545 (18)
Where 𝑞∗ = 𝑞/√𝑔𝑆𝐷3. When Eq. 18 is rewritten for d=q/U and combined with Eq. 1, we obtain a
formulation for the Shields * that can be replaced in Eq. 4, giving the following expression:
q𝑣[𝑚3 𝑠⁄ 𝑚⁄ ] = 4.32 ⋅ 𝑔−0.05(𝑠 − 1)−2𝐷−0.2𝑆1.93𝑞1.13 (19)
This equation can be approximated by an equation taking the form:
𝐶 = q𝑣/q ≈ ⋅ 𝑆2 (20)
Where C is the sediment concentration and can be approximated as a constant ( 2) considering the weak power coefficient on the diameter. The interest of this kind of formulation is that only the slope is needed, which is a real advantage as the grain size distribution is a source of large uncertainties (especially in this context of armor breaking). Figure 10 plots the concentration
measured in all experiments with Eq. 20 used with = 5. This value seems adequate for modelling the maximum transport, but underestimates transport for the end of erosions. It also underestimates
transport for the Piantini runs (for which = 8 would be more appropriate), which can be explained by the fact that in this experiment, the slope was not a self-formed alluvial slope as in the other runs, but an imposed 18% rigid slope over which bedload pulses propagate from an upstream alluvial fan, following the concept of travelling bedload, i.e., relatively fine, very mobile bedload material being transported over a rough and coarse static armor [Piton and Recking, 2017].
Figure 10 : Comparison between the measured concentration and the computations with C=5⋅S²
Because the scale of observation does not affect the intensity of transport (as discussed in a previous paragraph), the squared slope formula (Eq. 20) should a priori also be adequate for computing the values of the short time peak solid discharge naturally associated with fluctuations of the bed elevation in the active layer. It is however difficult to compare with the field data as many available data sets (available at https://www.bedloadweb.com/) concerns transport much below the formative flow condition (considered here as the flow at which the bed deformation in the active
layer is maximum and defined by *morpho =1.2·*c).

16
Recking, Vazquez & Piton (2021), personal draft version, to be submitted to the journal Special Issue related to the Gravel-bed River 9 conference
5. Discussion
Sediment bimodality
We used sand gravel mixtures that was supposed to be representative of bimodal mixtures encountered in gravel bed rivers [Sambrook Smith et al., 1997]. This bimodality has largely contributed to the stop and go mode of transport described in our experiments. But the origin of bimodality remains an open question [Parker, 2008]. Can we then imagine that this mode of transport is in turn responsible for bimodality? Indeed, we have described a mechanism by which only the mobility of the fine fraction and the coarse fraction are impacted (infiltration for the fines and resistance of the coarse in the armour layer), the intermediate diameters being excluded from this process. We also mainly focused on vertical grain sorting, but considered on the longitudinal dimension, the successive stop and go phases could be seen as a very efficient sorting machine progressively evacuating the intermediate fraction downstream. This suggests a feedback process where the more the intermediate diameters are removed, the greater the bimodality, and the more efficient the sorting.
Bedload fluctuation
While the mechanism presented in this article may contribute to bedload fluctuations, it is of course not the only one. Sediment inputs from bank collapse, channel avulsion or any other external sources can also generate sediment pulses. Once a pulse is emitted, whatever its origin, it propagates downstream over more or less long distances, depending in the local morphology: in morphodynamically active alluvial reaches the pulse will rapidly be damped by interaction with the river bedforms and by vertical sorting; on the other hand the pulse can be transported over long distance over bedrocks or stable paved beds [Piton and Recking, 2017; Misset et al., 2020]. In all cases, pulses will contribute to bed patchiness in the downstream reaches. In association with the shear stress variability, this bed surface grain size variability is responsible for bedload fluctuations.
Scale consideration
In this work we chose to focus on the small time and length scales, i.e. the scale of the event active layer. But we have demonstrated in previous works (what we have recalled in the first section) that the same processes are acting and produce same effects in amplitude (same slope fluctuation extent and bedload intensity) whatever scale considered [Recking, 2014]. More particularly, we demonstrated that at a much larger scale, it can be responsible for rare and dramatic bed collapse at the river reach scale (larger erosion duration and larger volumes transported). This is particularly true in the context of mountain streams, where fractioning the space with successive check dams or bedrock outcrops in a given reach reduces the scale of extent of the process, and consequently transforms rare and dramatic transport events (without check dams) into a succession of frequent but low transport events (with check dams or natural fixed sections) [Piton and Recking, 2016].
Square slope transport formula
The square slope formula Eq. 20 is not unknown from people working on mountain streams and where bedload is strongly pulsating and highly concentrated. Similar formulations have been proposed in the past but with different values for the constant and the exponent, e.g., respectively
5.5 and 2 [Mizuyama, 1981], 2.5 and 1.6 [Smart and Jaeggi, 1983], 2.5·/s and 1.5 [Bathurst et al., 1987], 6.3 and 2 [Meunier, 1989], C* (dimensionless Chezy coefficient) and 2 [Rickenmann and Koschni, 2010]. What is new in the results presented here is that, whereas these previous works have considered extreme flood events, we show that this formulation is also adapted to highly concentrated flows associated to the propagation of pulses under relatively low flow conditions, though such pulses can only be transient, i.e., just so long that the sub-surface material released is fully exported.

17
Recking, Vazquez & Piton (2021), personal draft version, to be submitted to the journal Special Issue related to the Gravel-bed River 9 conference
It is very difficult to validate such formulations against field data. Field events experiencing this asymptotic behavior are sudden, violent and poorly documented because unexpected, and unpredictable, in addition to be dangerous to measure. An interesting attempt was nonetheless proposed by Rickenmann and Koschni [2010] who combined Eq. 4. with the Chezy equation for computing the cumulated bedload transport associated with extreme events in Swiss torrents in 2005. They found that the computed volumes were overestimated. However, they considered the full flood event volume in their calculations. Coming back to our flume observations, it should be kept in mind that a pulse is by definition a finite volume of sediments released by the river reach experiencing armor breaking, and that consequently, Eq. 20 should a priori be applied to only a part of the hydrograph (the rest of the hydrograph being possibly supply limited). The use of the full hydrograph could explain overestimation in the study by Rickenmann and Koschni [2010].
One way to use Eq. 20 while constraining the overestimation observed in the past would be to cross check the cumulated volume computed considering its application on various fraction of the total flood hydrograph and checking whether the associated volumes make sense from a geomorphological point of view. Scenarios constraining the length of river channel possibly experiencing armor breaking and the eventual unitary erosion rate (expressed in m3/m of channel) based on field evidence and archives could for instance help bounding the eventual volume supplied by catastrophic armor breaking events. Hydrological data of such extreme events and of relevant grain sizes will likely always be partially uncertain. These uncertainties must be accepted as part of the difficult exercise that is to predict or reanalyze possible extreme geomorphic events.
6. Conclusion
This paper is an attempt to shed a new light on the interplay between the geomorphology of gravel-bed river systems and the physics of bedload transport. The objective was to clarify some links between grain size sorting (channel bed armoring, armor breaking and bedload sheet propagation), regimes of bedload transport and the dynamics of bedforms (scour and fill, bed incision and aggradation). We gathered long-lasting small-scale experiments on gravel bed systems resulting from the cumulated work of six PhD thesis and countless side tests and Master theses. During these experiments, water discharges were not extraordinary high, i.e., vary in the range that rivers experience below or slightly above channel forming discharges. Flume gradients varied between relatively gentle to very steep slopes (0.5 %– 18 %). In such conditions, and providing that sediment is not uniform, whatever be the slope, very efficient grain size sorting processes systematically emerged.
When giving time to the systems to fully rework the alluvial bed by bedload transport, a dynamic equilibrium appeared: cycles systematically emerged with alternating phases of aggrading and armoring with weak bedload transport and incising, armor breaking events with intense bursts of transport. We demonstrate in this paper that the main states of these cycles (steep armoring reach, gentler and finer eroding reach), and the range in which slope varies between these extremal and transient states, can be computed using a classical bedload transport equation and typical consideration on Shields stresses. In essence, armoring enables aggradation until the bed surface reaches an equilibrium slope allowing the full transport of the incoming flux. When armor breaks, the finer subsurface material is released, self-reinforcing feedback loops enhance transport efficiency and erosion lasts until the fine material stocks and the upstream supply is depleted.
We broaden the perspective and these lessons learnt from flume tests by showing that scour depths observed in gravel bed rivers, more precisely their maximum values, seems correctly bounded by these empirical considerations. This means that the dynamics of the active layer in natural rivers could also be controlled by self-induce, cycles of local armoring and aggradation followed by armor breaking and efficient erosion.

18
Recking, Vazquez & Piton (2021), personal draft version, to be submitted to the journal Special Issue related to the Gravel-bed River 9 conference
Our analysis of the armor breaking and pulses of bedload transport also brings an explanation to the asymptotical behavior of bedload transport intensity computed with simple equation of the shape C = Qs/Q = β·S². We show that such behaviors are consistent with theory (friction laws and asymptotical equations of bedload transport). We hope that the added clarification of a geomorphic description of one process driving the appearance of such extremal bedload transport capacity will help users of this approach to cross-check their use with the field evidences they can find about armor breaking, catastrophic reach incision and the potential volume associated with these events.
Overall, the key point in this analysis was to acknowledge that, although averaged grain size distribution can be measured at large scale, the spatial and temporal variation of bedload transport, of scour and fill processes and of armor building and breaking is strongly related to the local grain sizes, i.e., to variation around the average distribution induced by grain size sorting. We also highlight that accounting simply for this variation and using existing, tried and tested methods, enable to better understand scour and fill processes, as well as bursts of sediment transport, that are, in essence, just natural consequences of varying grain size with sorting.
Acknowledgement
This work was supported by Inrae.
Appendix

19
Recking, Vazquez & Piton (2021), personal draft version, to be submitted to the journal Special Issue related to the Gravel-bed River 9 conference
Appendix 1: summary of experiments performed by the Etna group during the last 20 years
Exp N° Period Objectives Flume set-up Main results References
E1 2000-2003
Development of new methods for bedload measurements with images analysis (backlight ramp) on steep slope experiments
4x 0.1 m | S = % Q = 1 l/s Qs = 270 g/s Duration = 2 h
Large bedload fluctuations were associated with grain sorting
[Frey et al., 2003; Ancey et al., 2006]
E2 2003-2006
A systematic analysis of grain sorting with different mixtures and flow conditions
[4-8]x[.05-0.15] m S =1 to 9 % Q = 0.2-5 l/s Qs = 4-61 g/s Duration = 0.5 - 64 h
Large bedload and slope fluctuations associated with bedload sheets (pulses). Reproducibility of the process, analysis of the mechanisms
[Recking, 2006; Recking et al., 2009b; Recking, 2014]
E3 2007-2010
Testing the optimum conditions for kinetic sorting
6 x 0. 1 m| S = 12% Q = 0.3 & 0.55 l/s Qs = 6 & 60 g/s Duration = 110 & 92 h
The grains mobility must be such that the coarse fraction is poorly mobile (not too low, not too high).
[Bacchi, 2011; Bacchi et al., 2014]
E4 2010-2013
A study of the effect of grain sorting on alternate bars and braided river morphodynamics
6 x 1 m | S = 1.4% Q = 0.23 - 1.75 l/s Qs = 0.5 -5 g/s Duration = 35 - 194 h
Horizontal and vertical sorting coexist and control the dynamics of bar emergence (in a different way than with uniform mixture)
[Leduc, 2013]
E5 2013-2016
Sediment transport in channels equipped with control structures in mountain streams
4.8 x 0. 11 m| S = 12% Q = 0.55 l/s Qs = 44 g/s Duration = 50 h
The efficiency of check dams is partly explained by grain sorting and its effect on the bed scouring at the reach scale
[Piton, 2016; Piton and Recking, 2016]
E6 2016-2019
Study of the competition between surface and vertical sorting with various lateral constrain conditions
6x[0.5-0.25] m | S = 3% Q = 0.55 l/s Qs = 8 g/s Duration = 60 h
When the main channel is constrained, vertical sorting predominates. Alternate bars may be an optimum morphology for transport.
[Carbonari, 2019; Carbonari et al., 2020]
E7 2019-2022
Study of self-generated pulses in mountain fans
6x 0.1 m | S = 18 % Q = 0.45 l/s Qs = 80 g/s Duration = 45 h
The dynamics of the pulses is fully controlled by grain sorting
[Piantini et al., 2021]

20
Recking, Vazquez & Piton (2021), personal draft version, to be submitted to the journal Special Issue related to the Gravel-bed River 9 conference
Appendix 2: Data Set
Table A2.1: Data from experiment E2 5
Sediment Mixture Flume
dimensions Duration Inlet fluxes Slope (m/m) Output peak* solid discharge (g/s)
Run %2.3mm %4.9mm %9mm D (mm) W(m) L(m) (h) Q(l/s) Qs(g/s) S mean Smin Smax
Qs (g/s) %2.3mm %4.9mm %9mm
1 50 0 50 5.65 0.15 8 22 5 14.4 0.018 0.016 0.020 32 50.6 0.0 49.4
2 50 50 0 3.60 0.1 2 2.3 0.8 5.41 0.033 0.030 0.036 10.3 57.3 42.7 0.0
3 50 50 0 3.60 0.1 2 1.8 0.6 8.17 0.046 0.041 0.050 20.4 64.2 35.8 0.0
4 50 50 0 3.60 0.1 2 1.7 0.7 13.1 0.047 0.043 0.050 25.2 58.3 41.7 0.0
5 50 50 0 3.60 0.1 8 22 0.8 18.05 0.049 0.047 0.050 32.3 54.8 45.2 0.0
6 50 50 0 3.60 0.05 8 64 0.17 10.38 0.086 0.082 0.090 17 58.8 41.2 0.0
7 50 50 0 3.60 0.05 8 46 0.2 13.53 0.087 0.083 0.090 22 53.2 46.8 0.0
8 50 50 0 3.60 0.05 8 33 0.24 19.9 0.084 0.081 0.087 26.4 47.0 53.0 0.0
11 30 70 0 4.12 0.1 2 1 0.8 12.83 0.046 0.042 0.050 24.1 44.0 56.0 0.0
12 30 70 0 4.12 0.1 2 0.5 0.9 13.91 0.046 0.043 0.049 29.9 52.2 47.8 0.0
13 30 70 0 4.12 0.1 2 0.7 1.1 24.7 0.047 0.044 0.050 35.4 44.1 55.9 0.0
14 30 70 0 4.12 0.1 2 0.7 1.3 33.91 0.049 0.048 0.050 40.2 36.3 63.7 0.0
15 0 50 50 6.95 0.1 2 0.9 1.5 39.52 0.058 0.055 0.061 72.4 0.0 62.2 37.8
16 0 50 50 6.95 0.1 2 0.5 1.8 61 0.060 0.058 0.061 64.6 0.0 46.1 53.9
17 40 20 40 5.50 0.1 2 0.8 1.2 11.97 0.041 0.033 0.049 34.2 49.1 19.9 31.0
18 33 33 33 5.35 0.1 2 0.5 0.8 19 0.060 0.052 0.068 60.8 29.9 40.3 29.8
*Bedload was sampled by hand except for run7 for which image analysis was used for a continuous survey (the peak value corresponds to a mean for values overpassing a threshold)
Table A2.2 Data from other experiments
Experiment W(m) S(m/m) Q(l/s) Qsin(g/s) Qs peak (g/s)
E3 (D16= 1.84 mm, D30= 2.13 mm, D50= 3.16 mm, D84= 9 mm, Dm= 6 mm) Runs duration = 92 and 110h
0.1 0.11 0.55 60 80
0.1 0.113 0.55 60 92
0.1 0.112 0.55 60 84
0.1 0.113 0.55 60 100
0.1 0.114 0.55 60 94
0.1 0.113 0.55 60 81
0.1 0.111 0.55 60 110
0.1 0.111 0.55 60 100
E5 (Dmin= 0.8 mm, D50= 3 mm, D84= 8.2 mm, Dmax= 20 mm, Dm= 5.6 mm) Run duration = 50h, Selection peaks values in Run 0
0.107 0.124 0.55 44 108
0.107 0.12 0.55 44 95
0.107 0.13 0.55 44 98.4
0.107 0.116 0.55 44 93.2
0.107 0.123 0.55 44 105
0.107 0.14 0.55 44 126.67
0.107 0.137 0.55 44 125
0.107 0.12 0.55 44 100.5
E7 (mixture of sand 40% and gravel 60%, D50= 5.16 mm, D84= 9 mm) Runs duration = runs of 0.5-1 h
0.1 0.18 0.45 80 350
0.1 0.185 0.45 80 350
0.1 0.189 0.45 80 350

21
Recking, Vazquez & Piton (2021), personal draft version, to be submitted to the journal Special Issue related to the Gravel-bed River 9 conference
Appendix 3: Flow resistance equation [Recking et al., 2008b] 10
The following flow resistance equation (deduced from the analyses of 2282 flume and field values) was specifically derived in Recking et al. [2008] for accounting for the effect of bedload on flow resistance:
D
R
gRS
U
BRRLlog75.525.6
Where
43.0
4
D
RRL with 1 RL 3.5
D
RSBR
85.07 with 1 < BR 2.6
where U is the vertically averaged flow velocity, R is the hydraulic radius, RL is a roughness layer coefficient taking into account deviation from the logarithmic profile on small relative depth flows 15
(with an increasing influence of the roughness layer), and BR is a bedload roughness coefficient taking into account additional flow resistance caused by bedload.
Supplementary material
Available upon request to the first author.
SM1: The field data set used in the paper 20
SM2: video_1 (Sediment pulses)
SM3: video_2 (amour breaking)
References
Ancey, C., T. Bohm, M. Jodeau, and P. Frey (2006), Statistical description of sediment transport experiments, Physical Review E, 74(011302 Part 1). 25
Andreotti, B., Y. Forterre, and O. Pouliquen (2011), Les milieux granulaires : entre fluide et solide. Andrews, E. D. (1983), Entrainment of gravel from naturally sorted riverbed material, Geological
Society of America Bulletin, 94(10), 1225-1231. Bacchi, V. (2011), Etude experimentale de la dynamique sedimentaire d’un systeme a forte pente
soumis a des conditions hydrauliques faibles, 209 pp, Université Joseph fourier, Grenoble. 30 Bacchi, V., A. Recking, N. Eckert, P. Frey, G. Piton, and M. Naaim (2014), The effects of kinematic
sorting on sediment mobility on steep slope, Earth Surface Processes and Landforms, DOI: 10.1002/esp.3564.
Bacchi, V., A. Recking, N. Eckert, M. Naaim, and P. Frey (2012), The effects of kinematic sorting on sediment mobility on steep slope (poster), paper presented at EGU, Vienna. 35
Bagnold, R. A. (1966), An approach to the sediment transport problem from general physics, Report paper 422-I, 37 pp, United state department of interior, Washington.
Bathurst, J. C., W. H. Graf, and H. H. Cao (1987), Bed load discharge equations for steep mountain rivers, in Sediment Transport in Gravel Bed Rivers, edited by C.R.Thorne, J.C.Bathurst and R.D.Hey, pp. 453-491, John Wiley & Sons Ltd. 40
Blom, A., J. S. Ribberink, and G. Parker (2008), Vertical sorting and the morphodynamics of bed forms-dominated rivers: A sorting evolution model, Journal of Geolophysical Research, 113(F01019, doi:10.1019/2006JF000618), 1-19.

22
Recking, Vazquez & Piton (2021), personal draft version, to be submitted to the journal Special Issue related to the Gravel-bed River 9 conference
Carbonari, C. (2019), Processus de tri granulométrique dans le transport par charriage : une étude théorique et expérimentale pour les rivières à gravier, 160 pp, University of Grenoble Alps, 45 University of Florence.
Carbonari, C., A. Recking, and L. Solari (2020), Morphology, Bedload, and Sorting Process Variability in Response to Lateral Confinement: Results From Physical Models of Gravel-bed Rivers, Journal of Geophysical Research: Earth Surface, 125(12), e2020JF005773, doi:https://doi.org/10.1029/2020JF005773. 50
Church, M., and J. K. Haschenburger (2017), What is the ‘‘active layer’’?,, Water Resour. Res., 53, 5-10, doi:doi:10.1002/2016WR019675.
Church, M., M. A. Hassan, and J. F. Wolcott (1998), Stabilizing self-organized structures in gravel-bed stream channels: field and experimental observations, Water Resources Research, 34(11), 3169-3179. 55
Church, M., and A. Zimmerman (2007), Form and stability of step-pool channels: Research progress, Water Resources Research, 43(W03415), 1-21.
Clayton, A., and J. Pitlick (2007), Persistence of the surface texture of a gravel-bed river during a large flood, Earth Surface Processes and Landforms, 33, 661-673.
Cudden, J. R., and T. B. Hoey (2003), The causes of bedload pulses in a gravel channel: the 60 implications of bedload grain-size distribution, Earth Surface Processes and Landforms, 28, 1411-1428.
Downs, P. W., P. J. Soar, and A. Taylor (2016), The anatomy of effective discharge: the dynamics of coarse sediment transport revealed using continuous bedload monitoring in a gravel-bed river during a very wet year, Earth Surface Processes and Landforms, 41(2), 147-161, 65 doi:https://doi.org/10.1002/esp.3785.
Egiazaroff, I. V. (1965), Calculation of nonuniform sediment concentrations, Journal of the Hydraulics Division (ASCE), HY4(6), 225-247.
Einstein, H. A. (1950), The bed-load function for sediment transportation in open channel flows, Report, 71 pp, United States Department of Agriculture - Soil Conservation Service, Washington. 70
Einstein, H. A., and N. Chien (1953), Transport of sediment mixtures with large ranges of grain sizes, Report, 49 pp, MRD Sediment Series No.2, U.S. Army Engineer Division, Missouri River, Corps of Engineers, Omaha, Neb.
Frey, P., and M. Church (2009), How River Beds Move, Science, 325, 1509-1510. Frey, P., C. Ducottet, and J. Jay (2003), Fluctuations of bed load solid discharge and grain size 75
distribution on steep slopes with image analysis, Experiments in fluids, 35, 589-597. Garcia, C., J. B. Laronne, and M. Sala (2000), Continuous monitoring of bedload flux in a mountain
gravel-bed river, Geomorphology, 34, 23-31. Gilbert, G. K. (1914), The Transportation of Debris by Running Water, Report, 263 pp, US Geological
Survey, Washington Government Printing Office. 80 Gomez, B. (1983), Temporal variations in bedload transport rates: the effects of progressive bed
armouring, Earth Surface Processes and Landforms, 8, 41-54. Gray, J. M. N. T. (2018), Particle Segregation in Dense Granular Flows, Annual Review of Fluid
Mechanics, Vol. 50, 407-433, doi:https://doi.org/10.1146/annurev-fluid-122316-045201. Guerit, L., L. Barrier, C. Narteau, F. Metivier, Y. Liu, E. Lajeunesse, E. Gayer, P. Meunier, L. Malverti, 85
and B. Ye (2014), The Grain-size Patchiness of Braided Gravel-Bed Streams – example of the Urumqi River (northeast Tian Shan, China), Adv. Geosci., 37, 27–39.
Heyman, J., F. Mettra, H. B. Ma, and C. Ancey (2013), Statistics of bedload transport over steep slopes: Separation of time scales and collective motion, Geophysical Research Letters, 40, 128–133, doi:DOI: 10.1029/2012GL054280. 90
Iseya, F., and H. Ikeda (1987), Pulsations in bedload transport rates induced by a longitudinal sediment sorting: a flume study using sand and gravel mixture, Geografiska Annaler, 69A(1), 15-27.

23
Recking, Vazquez & Piton (2021), personal draft version, to be submitted to the journal Special Issue related to the Gravel-bed River 9 conference
Kleinhans, M. G. (2002), Sorting out sand and gravel: sediment transport and deposition in sand-gravel bed rivers, Report Netherlands geographical studies 293, 308 pp, Faculty of geographical 95 science , Utrecht University, Utrecht.
Kreisler, A., M. Moser, J. Aigner, R. Rindler, M. Tritthart, and H. Habersack (2017), Analysis and classification of bedload transport events with variable process characteristics, Geomorphology, 291, 57-68, doi:https://doi.org/10.1016/j.geomorph.2016.06.033.
Kuhnle, R. A., and J. B. Southard (1988), Bed load transport fluctuations in a gravel bed laboratory 100 channel, Water Resources Research, 24(2), 247-260.
Leduc, P. (2013), Etude expérimentale de la dynamique des macroformes sédimentaires en territoires de montagne: cas des rivières en tresses, 255 pp, phD thesis, UJF.
Lisle, T. E., H. Ikeda, and F. Iseya (1991), Formation of a stationary alternate bars in a steep channel with mixed-size sediment : a flume experiment, Earth Surface Processes and Landforms, 16, 463-105 469.
Madej, M. A., D. G. Sutherland, T. E. Lisle, and B. Pryor (2009), Channel responses to varying sediment input: A flume experiment modeled after Redwood Creek, California, Geomorphology, 103(4), 507-519.
Mao, L., A. Dell'Agnese, C. Huincache, D. Penna, M. Engel, G. Niedrist, and F. Comiti (2014), Bedload 110 hysteresis in a glacier-fed mountain river, Earth Surface Processes and Landforms, 39(7), 964-976, doi:https://doi.org/10.1002/esp.3563.
Meunier, M. (1989), Essai de synthèse des connaissances en érosion et hydraulique torrentielle, Houille Blanche, 5.
Middleton, G. V. (1970), Experimental studies related to problems of flysch sedimentation, in Flysch 115 Sedimentology in North America, edited by J. Lajoie, pp. 253–272, Toronto: Bus. Econ. Sci. Ltd.
Misset, C., A. Recking, C. Legout, M. Bakker, N. Bodereau, L. Borgniet, M. Cassel, T. Geay, F. Gimbert, O. Navratil, H. Piégay, N. Valsangkar, M. Cazilhac, A. Poirel, and S. Zanker (2020), Combining multi-physical measurements to quantify bedload transport and morphodynamic interactions in an Alpine braiding river reach, Geomorphology, 120 doi:https://doi.org/10.1016/j.geomorph.2019.106877.
Mizuyama (1981), An intermediate phenomenon between debris flow and bedload transport, paper presented at AIHS.
Møen, K., J. Bogen, J. F. Zuta, P. K. Ade, and K. Esbensen (2010), Bedload Measurement in Rivers Using Passive Acoustic Sensors, Report, U.S. Geological Survey. 125
Nelson, P. A., J. G. Venditti, W. E. Dietrich, J. W. Kirchner, H. Ikeda, F. Iseya, and L. S. Sklar (2009), Response of bed surface patchiness to reductions in sediment supply, J. Geophys. Res., 114.
Paola, C., and R. Seal (1995), Grain size patchiness as a cause of selective deposition and downstream fining, Water Resources Research, 31(5), 1395-1408.
Parker, G. (1978), Self-formed straight rivers with equilibrium bank and mobile bed. Part 2 : the 130 gravel river, Journal of Fluid mechanics, 89(1), 127-146.
Parker, G. (1979), Hydraulic geometry of active gravel rivers, Journal of Hydraulic Engineering (ASCE), 105(9), 1185-1201.
Parker, G. (2008), Transport of gravel and sediment mixtures, in ASCE Manual 54 "Sedimentation Engineering: Processes, Measurements, Modeling, and Practice", edited by ASCE, p. xxi 1132 pp, 135 American Society of Civil Engineers, 978-0-7844-0814-8, 978-0-7844-7128-9 (PDF), 2008, Reston, VA.
Parker, G., and P. C. Klingeman (1982), On why gravel bed streams are paved, Water Resources Research, 18(5), 1409-1423.
Perret, E., C. Berni, B. Camenen, A. Herrero, and K. El Kadi Abderrezzak (2018), Transport of 140 moderately sorted gravel at low bed shear stresses: The role of fine sediment infiltration, Earth Surface Processes and Landforms, 43(7), 1416-1430, doi:10.1002/esp.4322.
Piantini, M., F. Gimbert, H. Bellot, and A. Recking (2021), An experimental study on the genesis and propagation of exogenous sediment pulses in mountain channels, Earth Suface Dynamics.

24
Recking, Vazquez & Piton (2021), personal draft version, to be submitted to the journal Special Issue related to the Gravel-bed River 9 conference
Piton, G. (2016), Sediment control by check dams and open check dams in Alpine torrents, 231 pp, 145 University of Grenoble Alps.
Piton, G., S. Carladous, A. Recking, J. M. Tacnet, F. Liébault, D. Kuss, Y. Quefféléan, and O. Marco (2016), Why do we build check dams in Alpine streams? An historical perspective from the French experience, Earth Surface Processes and Landforms, doi:DOI: 10.1002/esp.3967.
Piton, G., and A. Recking (2016), Effects of check dams on bed-load transport and steep-slope stream 150 morphodynamics, Geomorphology, 12, doi:doi.org/10.1016/j.geomorph.2016.03.001.
Piton, G., and A. Recking (2017), The concept of “travelling bedload” and its consequences for bedload computation in mountain streams, Geomorphology.
Piton, G., A. Recking, J. Le Coz, H. Bellot, A. Hauet, and M. Jodeau (2018), Reconstructing Depth-Averaged Open-Channel Flows Using Image Velocimetry and Photogrammetry, Water Resources 155 Research, 54(6), 4164-4179, doi:10.1029/2017WR021314.
Recking, A. (2006), An Experimental Study of Grain Sorting Effects on Bedload, 261 pp, PhD Thesis Cemagref (http://www.irstea.fr/recking), Lyon.
Recking, A. (2009), Theoretical development on the effects of changing flow hydraulics on incipient bedload motion, Water Resources Research, 45, W04401, 16. 160
Recking, A. (2013), A simple method for calculating reach-averaged bedload transport, Journal of Hydraulic Engineering, 139(1).
Recking, A. (2014), Relations between bed recharge and magnitude of mountain streams erosions, Journal of Hydro-Environment Research, http://dx.doi.org/10.1016/j.jher.2013.08.005.
Recking, A., V. Bacchi, M. Naaim, and P. Frey (2009a), Antidunes on steep slopes, Journal of 165 Geophysical Research, Earth Surface, F04025, doi:10.1029/2008JF001216, 1-11.
Recking, A., P. Frey, A. Paquier, and P. Belleudy (2009b), An experimental investigation of mechanisms responsible for bedload sheet production and migration, J. Geophys. Res., 114, F03010,.
Recking, A., P. Frey, A. Paquier, P. Belleudy, and J. Y. Champagne (2008a), Bedload transport flume 170 experiments on steep slopes, Journal of Hydraulic Engineering, 134(9), 1302-1310.
Recking, A., P. Frey, A. Paquier, P. Belleudy, and J. Y. Champagne (2008b), Feedback between bed load and flow resistance in gravel and cobble bed rivers, Water Resources Research, 44, 21.
Recking, A., G. Piton, D. Vazquez-Tarrio, and G. Parker (2016), Quantifying the morphological print of bedload transport, Earth Surface Processes and Landforms, doi:DOI: 10.1002/esp.3869. 175
Rickenmann, D., and A. Koschni (2010), Sediment loads due to fluvial transport and debris flows during the 2005 flood events in Switzerland, Hydrological processes, 24, 993–1007 doi:doi: 10.1002/hyp.7536.
Rickenmann, D., and A. Recking (2011), Evaluation of flow resistance in gravel-bed rivers through a large field dataset, Water Resources Research, 47, 1-22. 180
Rosato, A., K. J. Strandburg, F. Prinz, and R. H. Swendsen (1987), Why the Brazil nuts are on top: Size segregation of particulate matter by shaking, Physical Review Letters, 58(10), 1038-1040, doi:10.1103/PhysRevLett.58.1038.
Saletti, M., P. Molnar, A. Zimmermann, M. A. Hassan, and M. Church (2015), Temporal variability and memory in sediment transport in an experimental step-pool channel, Water Resour. Res., 51, 185 doi:doi:10.1002/2015WR016929.
Sambrook Smith, G. H., A. P. Nicholas, and R. I. Ferguson (1997), Measuring and defining bimodal sediments: Problems and implications, Water Resour. Res., 33(5), 1179-1185.
Savage, S., and C. Lun (1988), Particle size segregation in inclined chute flow of dry cohesionless granular solids, . Journal of Fluid Mechanics, 189, 311-335, doi:doi:10.1017/S002211208800103X. 190
Seal, R., C. Paola, G. Parker, J. B. Southard, and P. R. Wilcock (1997), Experiments on downstream fining of gravel : I. Narrow-channel runs, Journal of Hydraulic Engineering, 123(10), 874-884.
Smart, G. M., and M. N. R. Jaeggi (1983), Sediment transport on steep slopes, 89-191 pp., Mitteilungen n°64, Der Versuchsanstalt fuer Wasserbau, Hydrologie und Glaziologie, Eidg. Techn. Hochschule Zuerich, Zurich. 195

25
Recking, Vazquez & Piton (2021), personal draft version, to be submitted to the journal Special Issue related to the Gravel-bed River 9 conference
Toro-Escobar, C., C. Paola, G. Parker, P. R. Wilcock, and J. B. Southard (1997), Experiments on downstream fining of gravel : II. Wide and sandy runs, Journal of Hydraulic Engineering, 126(3), 198-208.
Vázquez‐Tarrío, D., G. Piqué, D. Vericat, and R. J. Batalla (2020), The active layer in gravel‐bed rivers: An empirical appraisal, Earth Suface Processes and Landforms, 46, 323–343, doi:DOI: 200 10.1002/esp.5027.
Vericat, D., R. J. Batalla, and C. Garcia (2006), Breakup and reestablishment of the armour layer in a large gravel-bed river below dams: The lower Ebro, Geomorphology, 76(1-2), 122-136.
Wilcock, P. R., and B. T. DeTemple (2005), Persistence of armor layers in gravel-bed streams, Geophysical Research Letter, 32(L08402), 1-4. 205
Wilcock, P. R., S. T. Kenworthy, and J. C. Crowe (2001), Experimental study of the transport of mixed sand and gravel, Water Resources Research, 37(12), 3349.
Wilcock, P. R., and B. W. Mc Ardell (1993), Surface-based fractional transport rates: Mobilization thresholds and partial transport of a sand-gravel sediment, Water Resources Research, 29(4), 1297-1312. 210