Embed Size (px)
Citation preview
1
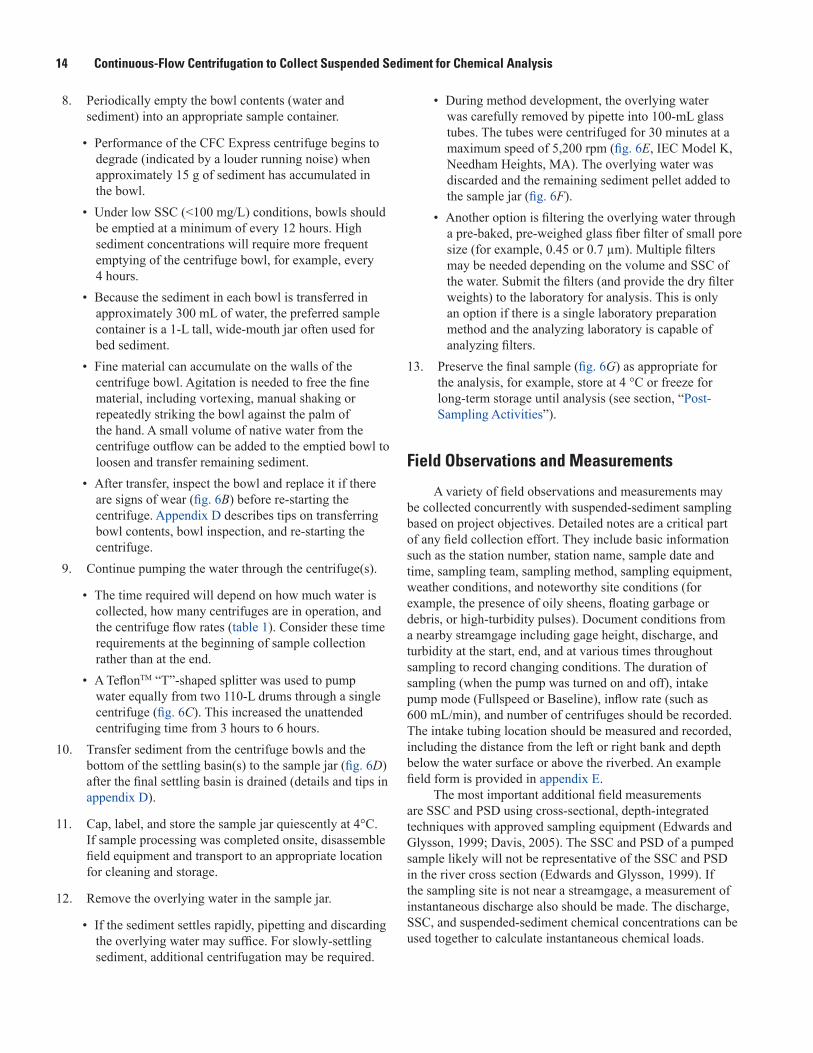
Table 7. Range and median percentage of difference of various parameters from reference sediments before and after processing through the field centrifugation equipment.
[Source data: Appendix A, table A4; Conn and others (2015, table A12). Parameter group: PAHs, polycyclic aromatic hydrocarbons; PCBs, polychlorinated biphenyls. Reference material: NIST SRM, National Institute of Standards and Technology Sediment Reference Material. Analyzing Laboratory: NWQL, U.S. Geological Survey’s National Water Quality Laboratory; WA 1, Washington State-accredited laboratory 1. Abbreviations: μg/kg, microgram per kilogram; mg/kg, milligram per kilogram; na, not applicable]
Parameter group Reference material Concentration rangePercentage difference Number of
compoundsAnalyzing laboratoryRange Median
Pesticides NIST SRM 1944 0.05–20 µg/kg -8 to 29 -4 8 NWQLPCBs NIST SRM 1944 2–7 µg/kg -23 to -9 -20 7 NWQLFlame retardants NIST SRM 1944 0.4–8 µg/kg -54 to 3 -10 4 NWQLPAHs NIST SRM 1944 100–5,200 µg/kg -62 to -15 -43 32 NWQLPAHs Duwamish River bed sediment 1–75 µg/kg 30 to 78 44 18 WA 1Other semivolatile
compoundsDuwamish River bed sediment 100–1,500 µg/kg -2 to 64 18 3 WA 1
Metals Duwamish River bed sediment 0.1–1,300 mg/kg 3 to 62 21 17 WA 1Total oganic carbon Duwamish River bed sediment 0–5 percent 99 na 1 WA 1
1
Table 6. Compounds detected in both equipment blank samples and not in corresponding source blank samples or at concentrations greater than two times the corresponding source blank sample concentration.
[Source data: Appendix A, table A1; Conn and Black (2014, table A4); and Conn and others (2015, table A11). CAS Registry Number: Chemical Abstracts Service (CAS) Registry Number® (RN) is a registered trademark of the American Chemical Society. CAS recommends the verifi cation of CASRNs through CAS Client ServicesSM. Method: EPA, U.S. Environmental Protection Agency’s SW 846; SIM, select ion monitoring. Unit: µg/kg, microgram per kilogram; ng/kg, nanogram per kilogram. Sample type: River samples were from the Puyallup River, Washington. Q, qualifi er (blank cells indicate an unqualifi ed detection). J, estimated, result between the detection level and reporting level; NJ, result did not meet all quantitation criteria (an estimated maxiumum possible concentration is reported in Result column) U, not detected above the reporting level (reported in the Result column); UJ, not detected above the detection level (reported in the Result column). Abbreviations: na, not applicable; PCBs, polychlorinated biphenyls]
Parameter nameCAS
Registry Number
Method Unit
Sample type
Riversourceblank
Riverequipment
blank
Commercial silica source
blank
Commercial silica equipment
blank
Result Q Result Q Result Q Result Q
Washington State-accredited laboratory 1
Fluoranthene 206-44-0 EPA 8270D SIM
µg/kg 0.5 U 2.93 0.5 U 0.49 J
Naphthalene 91-20-3 EPA 8270D SIM
µg/kg 0.73 U 1.47 0.6 U 0.71
Phenanthrene 85-01-8 EPA 8270D SIM
µg/kg 0.5 U 2.98 0.5 U 0.54
Pyrene 129-00-0 EPA 8270D SIM
µg/kg 0.5 U 3.07 0.5 U 0.44 J
Total organic carbon na PSEP (1986) percent 0.037 0.279 0.02 U 0.033
Washington State-accredited laboratory 2
1,2,3,4,6,7,8,9-Octachlorodibenzofuran 39001-02-0 EPA 1613B ng/kg 0.051 UJ 0.074 J 0.049 UJ 0.050 J1,2,3,4,6,7,8-Heptachlorodibenzo-p-
dioxin35822-46-9 EPA 1613B ng/kg 0.051 UJ 0.057 J 0.068 J 0.119 J
PCB-016 38444-78-9 EPA 1668C ng/kg 1.73 UJ 0.236 0.092 UJ 0.116 JPCB-042 36559-22-5 EPA 1668C ng/kg 1.59 UJ 0.131 0.288 NJ 0.093 JPCB-048 70362-47-9 EPA 1668C ng/kg 1.5 UJ 0.116 J 0.15 NJ 0.065 JPCB-092 52663-61-3 EPA 1668C ng/kg 1.83 UJ 0.115 J 0.24 NJ 0.084 J
U.S. Department of the InteriorU.S. Geological Survey
Techniques and Methods 1–D6
Continuous-Flow Centrifugation to Collect Suspended Sediment for Chemical Analysis
Prepared in cooperation with the National Water Quality Monitoring Council and Washington State Department of Ecology
Chapter 6 of Section D, Water QualityBook 1, Collection of Water Data by Direct Measurement

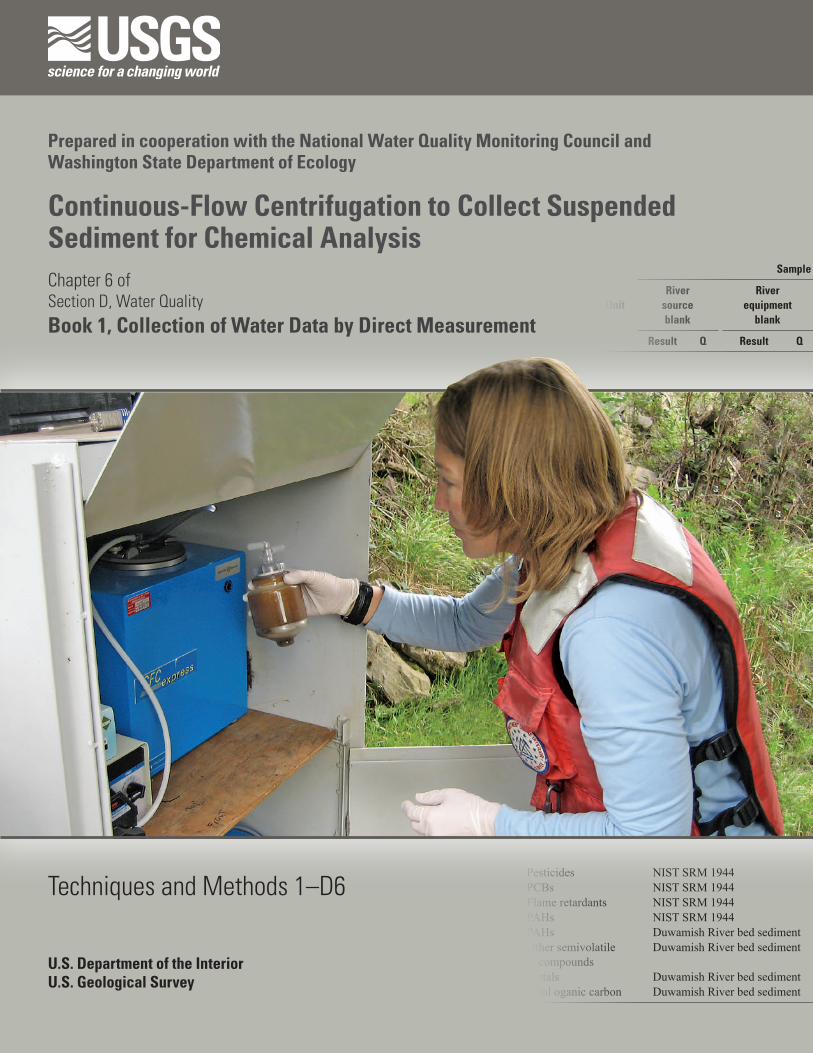
Cover: U.S. Geological Survey (USGS) hydrologist preparing sample for streamside continuous-flow centrifugation of suspended-sediment water for chemical analysis, at USGS streamgage No. 12113390, Duwamish River at Golf Course, Duwamish, Washington. Photograph by John Clemens, U.S. Geological Survey, October 8, 2014.

Continuous-Flow Centrifugation to Collect Suspended Sediment for Chemical Analysis
By Kathleen E. Conn, Richard S. Dinicola, Robert W. Black, Stephen E. Cox, Richard W. Sheibley, James R. Foreman, Craig A. Senter, and Norman T. Peterson
Chapter 6 ofSection D, Water QualityBook 1, Collection of Water Data by Direct Measurement
Prepared in cooperation with the National Water Quality Monitoring Council and Washington State Department of Ecology
Techniques and Methods 1–D6
U.S. Department of the InteriorU.S. Geological Survey

U.S. Department of the InteriorSALLY JEWELL, Secretary
U.S. Geological SurveySuzette M. Kimball, Director
U.S. Geological Survey, Reston, Virginia: 2016
For more information on the USGS—the Federal source for science about the Earth, its natural and living resources, natural hazards, and the environment—visit http://www.usgs.gov or call 1–888–ASK–USGS.
For an overview of USGS information products, including maps, imagery, and publications, visit http://www.usgs.gov/pubprod/.
Any use of trade, firm, or product names is for descriptive purposes only and does not imply endorsement by the U.S. Government.
Although this information product, for the most part, is in the public domain, it also may contain copyrighted materials as noted in the text. Permission to reproduce copyrighted items must be secured from the copyright owner.
Suggested citation:Conn, K.E., Dinicola, R.S., Black, R.W., Cox, S.E., Sheibley, R.W., Foreman, J.R., Senter, C.A., and Peterson, N.T., 2016, Continuous-flow centrifugation to collect suspended sediment for chemical analysis: U.S. Geological Survey Techniques and Methods, book 1, chap. D6, 31 p., plus appendixes, https://doi.org/10.3133/tm1D6.
ISSN 2328-7055 (online)

iii
Contents
Abstract ...........................................................................................................................................................1Introduction.....................................................................................................................................................1
Background............................................................................................................................................2Purpose and Scope ..............................................................................................................................3
Description of Continuous-Flow Centrifugation Method ........................................................................3Method Summary..................................................................................................................................3Project Scoping ....................................................................................................................................4
Site Selection and Characteristics ..........................................................................................4Analytical Mass Requirements .................................................................................................4Water Volume Requirements ....................................................................................................4Safety Considerations .................................................................................................................4
Sampling Equipment .............................................................................................................................5Equipment Selection ...................................................................................................................5
Intake Pump, Tubing, and Battery ...................................................................................5Settling Basins ...................................................................................................................6Centrifuge and Accessories ............................................................................................6
Equipment Cleaning .....................................................................................................................6Sample Collection .................................................................................................................................7
Intake Tubing Deployment Options ...........................................................................................9Intake Pump Operating Modes ................................................................................................12
Sample Processing .............................................................................................................................12Field Observations and Measurements ..........................................................................................14Post-Sampling Activities ...................................................................................................................15Data Review and Interpretation .......................................................................................................15
Quality Control Testing of Continuous-Flow Centrifugation Methods .................................................17Centrifuge Efficiency ..........................................................................................................................17Blank Samples .....................................................................................................................................18Reference Samples ............................................................................................................................21
Results from Field Testing the Continuous-Flow Centrifugation Methods ........................................24Summary........................................................................................................................................................26Acknowledgments ......................................................................................................................................27References Cited..........................................................................................................................................27Appendixes ...................................................................................................................................................31
iv
Figures
1. Schematic of steps for the collection of suspended sediment from large volumes of water using continuous-flow centrifugation .......................................................................3
2. Photographs showing CFC Express continuous-flow centrifuge in which sediment-laden water is pumped into a spinning bowl through an inflow port .................7
3. Photographs showing different field configuration options for sample collection, including bank-side hutch for streamside centrifugation, mobile trailer containing centrifuges and settling basins, and sample collection set-up and transport for offsite centrifugation ............................................................................................8
4. Photographs showing pump intake tubing bridge deployment (Option 1) ..........................9 5. Photographs showing pump intake tubing permanent ridgid tubing deployment
(Option 2) .....................................................................................................................................11 6. Photographs showing various centrifugation components, including a float
system for the settling basin tubing, common locations of bowl wear, a sample splitter, final composited sediment sample and overlying water, floor centrifuge, centrifuged sediment pellet, and final suspended-sediment sample for analysis ..........13
7. Graph showing percentage of difference of pesticides, polychlorinated biphenyls, flame retardants, and polycyclic aromatic hydrocarbons in the National Institute of Standards and Technology Sediment Reference Material 1944 before and after processing through the field centrifugation equipment ................22
8. Graph showing percentage of difference of polycyclic aromatic hydrocarbons, other semivolatile compounds, metals, and total organic carbon in bed-sediment samples before and after processing through the field centrifugation equipment in Experiments 1 and 2, Duwamish River, Washington .........................................................23
9. Graph showing arsenic concentrations measured on suspended sediment, in filtered water, and in unfiltered water during sampling events arranged in order of increasing suspended-sediment concentration, Duwamish River at Golf Course at Tukwila, Washington, 2013–15 ...............................................................................24
10. Graph showing carcinogenic polycyclic aromatic hydrocarbon concentrations measured on suspended sediment and in unfiltered water during sampling events arranged in order of increasing suspended-sediment concentration, Duwamish River at Golf Course at Tukwila, Washington, 2013–15 .....................................25
v
Tables
1. Estimated requirements for water volume, and pump and centrifuge time for collecting selected masses of sediment from water bodies with variable suspended-sediment concentrations .......................................................................................5
2. Sample collection pump intake tubing deployment options ...............................................10 3. Summary of results from centrifuge sediment capture efficiency experiments .............17 4. Particle size distribution of centrifuge outflow. ....................................................................18 5. Summary of analytical methods used during quality control testing ................................19 6. Compounds detected in both equipment blank samples at concentrations greater
than two times the corresponding source blank sample concentration ..........................20 7. Range and median percentage of difference of various parameters from
reference sediments before and after processing through the field centrifugation equipment ..........................................................................................................21
8. Comparison of median percentage of fine sediment and median concentration of select analytes on suspended sediment as compared to nearby bed sediment, Duwamish River at Golf Course at Tukwila, Washington, 2013–15. ...................................26
Conversion Factors
U.S. customary units to International System of Units
Multiply By To obtain
Length
inch (in.) 2.54 centimeter (cm)foot (ft) 0.3048 meter (m)mile (mi) 1.609 kilometer (km)
Area
acre 0.004047 square kilometer (km2)Volume
gallon (gal) 3.785 liter (L) Flow rate
cubic foot per second (ft3/s) 0.02831 cubic meter per second (m3/s)

vi
Conversion Factors—Continued
International System of Units to U.S. customary units
Multiply By To obtain
Length
centimeter (cm) 0.3937 inch (in.)micrometer (µm) 0.003937 inch (in.)millimeter (mm) 0.03937 inch (in.)meter (m) 3.281 foot (ft) kilometer (km) 0.6214 mile (mi)
Volume
milliliter (mL) 0.03382 ounce, fluid (fl. oz)liter (L) 0.2642 gallon (gal)
Flow rate
milliliter per minute (mL/min) 0.0002642 gallon per minute (gpm) liter per second (L/sec) 0.2642 gallon per minute (gpm)
Mass
gram (g) 0.03527 ounce, avoirdupois (oz)kilogram (kg) 2.205 pound avoirdupois (lb)metric ton 1,000 kilograms
Mass concentration, in water
gram per kilogram (g/kg) 1 part per thousandmilligram per kilogram (mg/kg) 1 part per million (ppm) microgram per kilogram (µg/kg) 1 part per billion (ppb, 109)nanogram per kilogram (ng/kg) 1 part per trillion (ppt, 1012)
Liquid concentration, in water
gram per liter (g/L) 1 part per thousandmilligram per liter (mg/L) 1 part per million (ppm) nanogram per liter (ng/L) 1 part per trillion (ppt, 1012)picogram per liter (pg/L) 1 part per quadrillion (ppt, 1015)
Temperature in degrees Celsius (°C) may be converted to degrees Fahrenheit (°F) as follows:
°F=(1.8×°C)+32.
Supplemental InformationConcentrations of chemical constituents in water are given either in milligrams per liter (mg/L) or micrograms per liter (µg/L).

vii
Abbreviations and Acronyms
EDI equal-discharge incrementKOC organic-carbon partition coefficientNFM U.S. Geological Survey National Field Manual for the Collection of
Water-Quality DataNWIS National Water Information SystemNWQL U.S. Geological Survey National Water Quality LaboratoryPAH polycyclic aromatic hydrocarbonPBDE polybrominated diphenyl etherPCB polychlorinated biphenylPSD particle-size distributionQC qualiy controlQWDATA Water-Quality System within the National Water Information SystemSSC suspended-sediment concentrationTSS total suspended solidsUSGS U.S. Geological Survey


Continuous-Flow Centrifugation to Collect Suspended Sediment for Chemical Analysis
By Kathleen E. Conn, Richard S. Dinicola, Robert W. Black, Stephen E. Cox, Richard W. Sheibley, James R. Foreman, Craig A. Senter, and Norman T. Peterson
AbstractRecent advances in suspended-sediment monitoring tools
and surrogate technologies have greatly improved the ability to quantify suspended-sediment concentrations and to estimate daily, seasonal, and annual suspended-sediment fluxes from rivers to coastal waters. However, little is known about the chemical composition of suspended sediment, and how it may vary spatially between water bodies and temporally within a single system owing to climate, seasonality, land use, and other natural and anthropogenic drivers. Many water-quality contaminants, such as organic and inorganic chemicals, nutrients, and pathogens, preferentially partition in sediment rather than water. Suspended sediment-bound chemical concentrations may be undetected during analysis of unfiltered water samples, owing to small water sample volumes and analytical limitations. Quantification of suspended sediment-bound chemical concentrations is needed to improve estimates of total chemical concentrations, chemical fluxes, and exposure levels of aquatic organisms and humans in receiving environments. Despite these needs, few studies or monitoring programs measure the chemical composition of suspended sediment, largely owing to the difficulty in consistently obtaining samples of sufficient quality and quantity for laboratory analysis.
A field protocol is described here utilizing continuous-flow centrifugation for the collection of suspended sediment for chemical analysis. The centrifuge used for development of this method is small, lightweight, and portable for the field applications described in this protocol. Project scoping considerations, deployment of equipment and system layout options, and results from various field and laboratory quality control experiments are described. The testing confirmed the applicability of the protocol for the determination of many inorganic and organic chemicals sorbed on suspended sediment, including metals, pesticides, polycyclic aromatic hydrocarbons, and polychlorinated biphenyls. The particle-size distribution of the captured sediment changes to a more fine-grained sample during centrifugation, and the necessity to account for this change when extrapolating chemical concentrations on the centrifuged sediment sample to the environmental water system is discussed.
The data produced using this method will help eliminate a data gap of suspended sediment-bound chemical concentrations, and will support management decisions, such as chemical source-control efforts or in-stream restoration activities. When coupled with streamflow and sediment flux data, it will improve estimates of riverine chemical fluxes, and will aid in assessing the importance and impacts of suspended sediment-bound chemicals to downstream freshwater and coastal marine ecosystems.
IntroductionAbout 10–20 billion metric tons of sediment is
transported by rivers throughout the world each year, settling in downstream depositional areas and receiving coastal waters (Milliman and Meade, 1983; Milliman and Farnsworth, 2011). Although sediment can be a benefit (for example, by nourishing beaches and providing ecosystem habitat), it also may deliver contaminants to receiving environments. Many contaminants, including organic compounds, metals, and pathogens, preferentially partition to sediment rather than occur as dissolved forms in water (Karickhoff and others, 1979). In this report, the term “sediment” encompasses all particulate matter, including the inorganic fraction such as sand, silt, and clay particles, and the organic fraction such as algae and vegetative debris. Contaminants can be bound to inorganic and organic fractions of the sediment. The sediment-bound contaminants can enter a water system through atmospheric deposition and overland runoff, and are then transported downstream suspended in the water column. Ludwig and others (1996) estimated that approximately 43 percent of organic carbon transported to coastal waters by rivers was bound to sediment. Ingestion of chemical-laden suspended sediment may be an important, but understudied, pathway for entry of toxic contaminants into the aquatic foodweb. Once in the foodweb, many contaminants bioaccumulate, causing adverse effects on aquatic organisms, and making these resources unsafe for human consumption (for example, Washington State Department of Health, 2016).
In response to a need for improved management of ocean resources (U.S. Commission on Ocean Policy, 2004), the National Water Quality Monitoring Council was charged with
2 Continuous-Flow Centrifugation to Collect Suspended Sediment for Chemical Analysis
designing a national coastal water-quality monitoring network (http://acwi.gov/monitoring/network/). The Council identified a need for better quantification of suspended sediment-bound chemical concentrations and fluxes in U.S. coastal rivers (Advisory Committee on Water Information, 2006). Puget Sound, Washington, was selected as a demonstration project in 2012 and a primary objective of the project was to develop a protocol for the collection of suspended sediment for chemical analysis.
Background
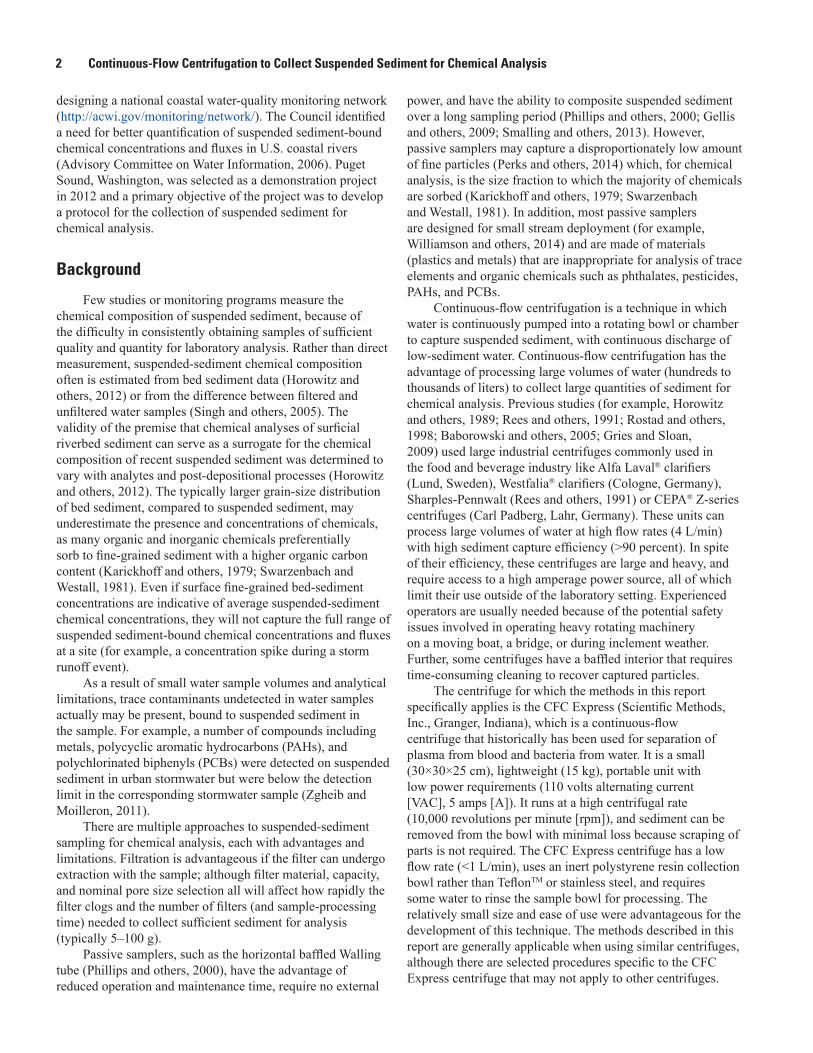
Few studies or monitoring programs measure the chemical composition of suspended sediment, because of the difficulty in consistently obtaining samples of sufficient quality and quantity for laboratory analysis. Rather than direct measurement, suspended-sediment chemical composition often is estimated from bed sediment data (Horowitz and others, 2012) or from the difference between filtered and unfiltered water samples (Singh and others, 2005). The validity of the premise that chemical analyses of surficial riverbed sediment can serve as a surrogate for the chemical composition of recent suspended sediment was determined to vary with analytes and post-depositional processes (Horowitz and others, 2012). The typically larger grain-size distribution of bed sediment, compared to suspended sediment, may underestimate the presence and concentrations of chemicals, as many organic and inorganic chemicals preferentially sorb to fine-grained sediment with a higher organic carbon content (Karickhoff and others, 1979; Swarzenbach and Westall, 1981). Even if surface fine-grained bed-sediment concentrations are indicative of average suspended-sediment chemical concentrations, they will not capture the full range of suspended sediment-bound chemical concentrations and fluxes at a site (for example, a concentration spike during a storm runoff event).
As a result of small water sample volumes and analytical limitations, trace contaminants undetected in water samples actually may be present, bound to suspended sediment in the sample. For example, a number of compounds including metals, polycyclic aromatic hydrocarbons (PAHs), and polychlorinated biphenyls (PCBs) were detected on suspended sediment in urban stormwater but were below the detection limit in the corresponding stormwater sample (Zgheib and Moilleron, 2011).
There are multiple approaches to suspended-sediment sampling for chemical analysis, each with advantages and limitations. Filtration is advantageous if the filter can undergo extraction with the sample; although filter material, capacity, and nominal pore size selection all will affect how rapidly the filter clogs and the number of filters (and sample-processing time) needed to collect sufficient sediment for analysis (typically 5–100 g).
Passive samplers, such as the horizontal baffled Walling tube (Phillips and others, 2000), have the advantage of reduced operation and maintenance time, require no external
power, and have the ability to composite suspended sediment over a long sampling period (Phillips and others, 2000; Gellis and others, 2009; Smalling and others, 2013). However, passive samplers may capture a disproportionately low amount of fine particles (Perks and others, 2014) which, for chemical analysis, is the size fraction to which the majority of chemicals are sorbed (Karickhoff and others, 1979; Swarzenbach and Westall, 1981). In addition, most passive samplers are designed for small stream deployment (for example, Williamson and others, 2014) and are made of materials (plastics and metals) that are inappropriate for analysis of trace elements and organic chemicals such as phthalates, pesticides, PAHs, and PCBs.
Continuous-flow centrifugation is a technique in which water is continuously pumped into a rotating bowl or chamber to capture suspended sediment, with continuous discharge of low-sediment water. Continuous-flow centrifugation has the advantage of processing large volumes of water (hundreds to thousands of liters) to collect large quantities of sediment for chemical analysis. Previous studies (for example, Horowitz and others, 1989; Rees and others, 1991; Rostad and others, 1998; Baborowski and others, 2005; Gries and Sloan, 2009) used large industrial centrifuges commonly used in the food and beverage industry like Alfa Laval® clarifiers (Lund, Sweden), Westfalia® clarifiers (Cologne, Germany), Sharples-Pennwalt (Rees and others, 1991) or CEPA® Z-series centrifuges (Carl Padberg, Lahr, Germany). These units can process large volumes of water at high flow rates (4 L/min) with high sediment capture efficiency (>90 percent). In spite of their efficiency, these centrifuges are large and heavy, and require access to a high amperage power source, all of which limit their use outside of the laboratory setting. Experienced operators are usually needed because of the potential safety issues involved in operating heavy rotating machinery on a moving boat, a bridge, or during inclement weather. Further, some centrifuges have a baffled interior that requires time-consuming cleaning to recover captured particles.
The centrifuge for which the methods in this report specifically applies is the CFC Express (Scientific Methods, Inc., Granger, Indiana), which is a continuous-flow centrifuge that historically has been used for separation of plasma from blood and bacteria from water. It is a small (30×30×25 cm), lightweight (15 kg), portable unit with low power requirements (110 volts alternating current [VAC], 5 amps [A]). It runs at a high centrifugal rate (10,000 revolutions per minute [rpm]), and sediment can be removed from the bowl with minimal loss because scraping of parts is not required. The CFC Express centrifuge has a low flow rate (<1 L/min), uses an inert polystyrene resin collection bowl rather than TeflonTM or stainless steel, and requires some water to rinse the sample bowl for processing. The relatively small size and ease of use were advantageous for the development of this technique. The methods described in this report are generally applicable when using similar centrifuges, although there are selected procedures specific to the CFC Express centrifuge that may not apply to other centrifuges.
Description of Continuous-Flow Centrifugation Method 3
Purpose and Scope
This document presents a field protocol for the collection of suspended sediment from large volumes of water (hundreds to thousands of liters) using continuous-flow centrifugation with a small, portable centrifuge. The collected sample is of sufficient quality and quantity for any number of laboratory analyses (grain size, organic constituents, or inorganic constituents) similar to the analysis of a bed material sample. This document focuses on the collection of riverine suspended sediment, for the purposes of understanding concentrations and fluxes of select constituents and contaminants sorbed on suspended sediment transported to downstream river reaches or receiving coastal waters. The method was tested and refined at multiple large, Puget Sound, Washington, rivers including the Puyallup River, Stillaguamish River, and Duwamish River (Conn and Black, 2014; Conn and others, 2015). The technique also is applicable to other natural or anthropogenic water bodies such as lakes, marine waters, storm water retention basins, and wastewater outfalls.
The protocol includes guidance for collecting the large-volume water sample using a pump system. The pump is used to collect sufficient mass for chemical analysis and will not provide a representative measure of the river suspended-sediment concentration (SSC) and particle-size distribution (PSD) without corresponding cross-sectional, depth-integrated samples. Data interpretation includes extrapolation of results from the pumped sample; additional sampling to quantify potential pump bias of sediment and water-quality parameters may be warranted.
The protocol was developed to target organic compounds, such as pesticides, PAHs, PCBs, and polybrominated diphenyl ethers (PBDEs), although it is applicable to other parameters such as inorganic species and bulk sediment characteristics. The protocol builds upon U.S. Geological Survey (USGS)
protocols for the collection of water-quality data as described in the USGS National Field Manual for the Collection of Water-Quality Data (NFM; U.S. Geological Survey, variously dated). The chapters pertaining to equipment selection (Wilde and others, 2014), equipment cleaning (Wilde, 2004), and sample collection techniques for organic compounds, including trace organic compounds (U.S. Geological Survey, 2006) are particularly relevant.
This document describes the method using a commercially available centrifuge and other pieces of equipment. References to non-USGS products and services are provided for information only and do not constitute endorsement or warranty by the USGS, U.S. Department of Interior, or U.S. Government, as to their suitability, content, usefulness, functioning, completeness, or accuracy.
Description of Continuous-Flow Centrifugation Method
Method Summary
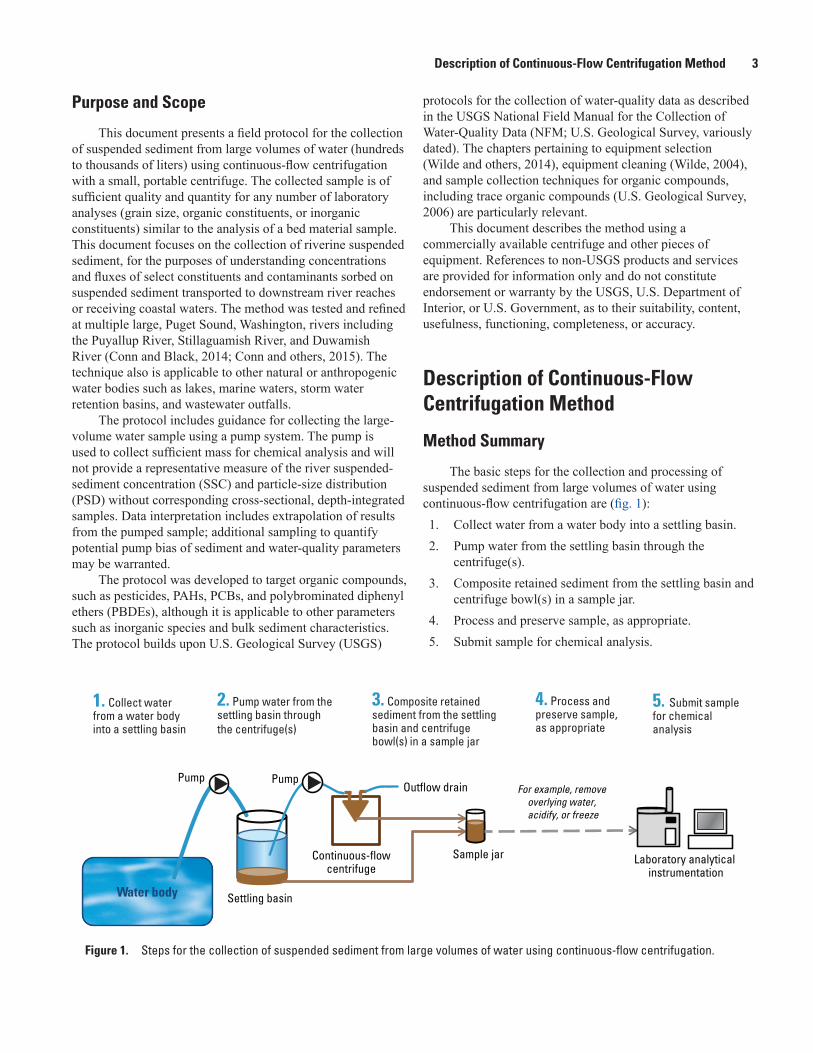
The basic steps for the collection and processing of suspended sediment from large volumes of water using continuous-flow centrifugation are (fig. 1):1. Collect water from a water body into a settling basin.2. Pump water from the settling basin through the
centrifuge(s).3. Composite retained sediment from the settling basin and
centrifuge bowl(s) in a sample jar.4. Process and preserve sample, as appropriate.5. Submit sample for chemical analysis.
Figure 1. Steps for the collection of suspended sediment from large volumes of water using continuous-flow centrifugation.
tac16-1113_fig 01
1. Collect water from a water bodyinto a settling basin
Water body Settling basin
Pump Pump
Sample jar
2. Pump water from thesettling basin through the centrifuge(s)
3. Composite retained sediment from the settling basin and centrifuge bowl(s) in a sample jar
5. Submit samplefor chemical analysis
Continuous-flowcentrifuge
Laboratory analytical instrumentation
Outflow drain For example, remove overlying water, acidify, or freeze
4. Process andpreserve sample, as appropriate

4 Continuous-Flow Centrifugation to Collect Suspended Sediment for Chemical Analysis
Project Scoping
Site Selection and Characteristics The study site and sample conditions should be selected
to yield samples representative of the aqueous body being studied as described in Chapter A1 of the USGS NFM (Wilde, 2005). Adjacent and upstream inputs, such as discharges from outfalls, should be completely mixed in the river channel prior to sample collection. Data interpretation will be more straightforward if the sampling site is far enough upstream of the river mouth to minimize tidally driven sediment resuspension and upstream transport. Cross-section mixing should be determined by depth- and width-integrated measurements of water-quality parameters and SSC over a range of conditions. A well-mixed site is especially important because the large volumes of water necessary to collect sufficient suspended sediment for chemical analysis often preclude collection by standard cross-sectional, depth-integrated methods; instead, water may be pumped from a single point in the cross section. To address the potential bias from a non-representative sample collection method, additional sampling could be done through paired-point and cross-section samples, for example, of water-quality parameters in filtered and unfiltered samples, and (or) another measure of mixing, such as a sediment surrogate (like turbidity).
The site should be safe and accessible because equipment may be left unattended and personnel may be working onsite for multiple hours, potentially during evenings or weekends and during adverse weather conditions. The ideal site for a long-term study has an enclosed building with 110 VAC power on the riverbank that can be used for housing and powering the centrifuge(s) for onsite sample processing. If samples are processed in a mobile laboratory or transported off-site for processing, accessibility to the riverbank by vehicle is important for direct pumping from the river into the trailer or vehicle. To calculate chemical fluxes, it is important to co-locate at a streamgage or, for instantaneous fluxes, measure instantaneous discharge during sampling. A bridge or wadeable cross section is ideal for collecting confirmatory cross-sectional, depth-integrated samples for SSC. Use available or estimated discharge and range of SSCs at each site to identify target sampling conditions and the estimate the approximate volume of water needed to be processed per sediment sample.
Analytical Mass RequirementsDetermine the analytes of interest and perform a
laboratory evaluation to select an analytical laboratory(ies) that will meet the project’s data quality objectives. Determine the minimum mass requirements per analytical method.
Many sediment analyses at the USGS National Water Quality Laboratory (NWQL) require a minimum of 5–20 g, dry weight, of sediment per method. Additional mass may be required if the sample is to be split into multiple containers for separate analyses, for laboratory reanalyses, or for quality control testing such as replicate analyses. If necessary, determine a prioritization order of methods in the event that insufficient sediment is collected to conduct all desired analyses.
Water Volume Requirements Based on expected SSC values and the analytical mass
required, determine about how much water is required per sediment sample (table 1). Determine if the volume of water can be collected and stored during the target sampling window. For example, the sampling window may only be a few hours if the objective is to sample only the sediment peak of a storm. Then determine how many hours are required to centrifuge the sample (given the low centrifuge flow rate) and if this is reasonable given personnel availability and sample holding time limits. These topics are elaborated upon in sections, “Sample Collection” and “Sample Processing.”
Safety ConsiderationsAs with any field sampling effort, safety is the highest
priority. All field personnel must adhere to USGS field safety guidelines (Lane and Fay, 1997) and the project safety plan, including the Traffic Control Plan. Safety plan features include the use of proper personal protective equipment (such as personal flotation devices) and appropriate water safety training for situations involving swift-water and large floating debris. Field personnel should take additional precautions when sampling during storms, taking cover or abandoning sampling when conditions become unsafe. Conditions that may require abandoning sampling include the presence of lightning, hail, extreme high flows, or large floating debris. Personnel should work in teams, if conditions warrant it, and are encouraged to notify an off-site supervisor upon arrival and departure during adverse field conditions.
When handling hazardous chemicals in the field or in the laboratory, such as acid or methanol, appropriate personal protective equipment must be worn, including chemical-resistant gloves, eyewear, close-toed shoes, and a laboratory coat. Methanol and hydrochloric acid only should be used under a fume hood or in well-ventilated areas. Hazardous chemicals should be transported in appropriate containers with a current Safety Data Sheet. Chemical waste or rinsate should be disposed of properly according to local disposal guidelines.

Description of Continuous-Flow Centrifugation Method 5
Table 1. Estimated requirements for water volume, and pump and centrifuge time for collecting selected masses of sediment from water bodies with variable suspended-sediment concentrations.
[Suspended sediment mass: Typically ranges from 1 to 20 grams per analysis. Water: Assumes an efficiency of 90 percent to account for less than 100 percent capture efficiency of the centrifuge and losses during sample transfer and laboratory analysis. Intake pumping time: Assumes a pump rate of 4 liters per minute. Spin time: Required spin time for one or two centrifuges. Assumes a centrifuge flow rate of 600 milliliters per minute. Abbreviations: g, gram; L, liter; mg/L, milligram per liter]
Number of chemical
analyses to be conducted
Suspended sediment mass (g, dry weight)
Suspended sediment
concentration of water
(mg/L)
Water (L)
Intake pumping time
(hours)
Spin time (hours)
One centrifuge
Two centrifuges
1 5 20 275 1.1 8 4100 55 0.23 1.5 0.8500 11 0.05 0.3 0.2
1 to 2 20 20 1,100 4.6 31 15100 220 0.92 6 3500 44 0.18 1.2 0.6
2 to 4 50 20 2,750 11 76 38100 550 2.3 15 8500 110 0.46 3 2
5 to 8 100 20 5,500 23 153 76100 1,100 4.6 31 15500 220 0.92 6 3
8 to 12 200 20 11,000 46 306 153100 2,200 9.2 61 31500 440 1.8 12 6
Sampling Equipment
Equipment SelectionGeneral guidance regarding equipment selection for
water-quality sampling is provided in Chapter A2 of the USGS NFM (Wilde and others, 2014). If analyzing for organic compounds, equipment made of plastic such as polypropylene should be avoided or minimized. If analyzing for inorganics, non-metallic materials are preferred such as uncolored polypropylene. If analyzing for both organic and inorganic compounds, equipment and tubing made of fluorocarbon polymers such as TeflonTM are preferred. If feasible, collect cross-sectional, depth-integrated water samples according to USGS methods using appropriate equipment (Edwards and Glysson, 1999; U.S. Geological Survey, 2006) from which the suspended sediment may be centrifuged for collection and analysis. However, collecting suspended-sediment samples for chemical analyses using traditional cross-sectional, depth-integrated sampling techniques often is not feasible because of the large volumes of water needed for processing (hundreds to thousands of liters). In these circumstances, a pump system can be used to collect a time-integrated sample from a point location under well-mixed conditions.
Intake Pump, Tubing, and Battery An unscreened, high-flow peristaltic pump is
recommended to pump water from the water body into a settling basin(s). A 6712 Portable Sampler (Teledyne Isco®, Lincoln, Nebraska), with standard Isco® silicone pump tubing, was the most successful pump used during method development for this report. It delivers water at rates of 0.5 m/s at the maximum lift of approximately 8 m through a polyethylene or TeflonTM suction line (0.9525 cm inner diameter). If needed, attach a plastic or stainless steel strainer to the suction line to protect the pump from rocks, long thin sticks, and other debris. Actual flow rates will be site specific depending on the length of tubing, the vertical lift from the water surface to the pump, temperature, and power supply. With a 30 m length of tubing, approximately 5 m of vertical lift, and a fully charged 12 volt direct current (VDC) battery, flow rates of approximately 4 L/min can be expected. For extended deployments, large, deep-cycle marine-type batteries provide consistent power when replaced every 24 hours.
For sites where the water must be pumped higher than typical peristaltic pump limitations (approximately 8 m above the water body surface), a different type of pump will be needed. Submersible pumps capable of overcoming
6 Continuous-Flow Centrifugation to Collect Suspended Sediment for Chemical Analysis
vertical lifts of about 30 m above the water surface were tested (including a groundwater submersible pump from Fultz Pumps, Inc., Lewistown, Pennsylvania; and a LISST™ Pump from Sequoia Scientific, Inc., Bellevue, Washington), but the internal TeflonTM gears of these pumps wore down to a non-functional state within a few hours of pumping even under relatively low-sediment conditions (<100 mg/L). Better performance could be expected from an industrial peristaltic pump (WT-600, Langer Instruments, Boonton, New Jersey) located on the riverbank that is capable of pushing water from the pump to vertical heights greater than 30 m. This type of pump may be ideal for pumping directly into a vehicle or settling basins located some distance (for example, hundreds of meters) from the riverbank.
Settling Basins Water collected from the river is stored in a settling
basin(s) prior to centrifugation to extend performance of the centrifuge and limit personnel time needed to process samples. Centrifugation is critical to collect the fine, colloidal material that remains suspended in the water column after larger, heavier particles settle out. The fine, colloidal material may contribute a substantial portion of chemical concentration because chemical sorption increases as particle size decreases for many organic and inorganic chemicals. As described later in section, “Sample Processing,” the settled sediment in the settling basins is combined with the sediment captured in the centrifuge bowl into a final composite sample. Depending on the site conditions, the settling basin may be located near the water body, in a mobile trailer, or in a laboratory. The settling basin(s) or portable containers can be placed inside a large container (like a trash can) filled with ice water or can be stored in a refrigerated trailer or walk-in refrigerator to maintain 4 °C sample temperatures and limit photodegradation of compounds of interest.
The storage capacity needed to hold the required volume of water (table 1) depends on the amount of sediment required for analysis and the river SSC at the time of sampling. For example, about 1,100 L is needed to collect 100 g of suspended sediment from a river with an SSC of 100 mg/L, and requires approximately 4.6 hours of continuous pumping under the method testing conditions (a pumping rate of approximately 4 L/min using a 6712 Portable Sampler with about 5 m of vertical lift). If the SSC was only 20 mg/L, about 5,500 L is needed (requiring 23 hours of pumping). This study typically used four to six 110-L drums to store water. When analyzing for organic compounds, each drum was lined with a pre-cleaned (Wilde, 2004) 100-L TeflonTM-coated bag (Welch Fluorocarbon, Inc., Dover, N.H.). If sample processing
occurred off-site, TeflonTM-coated 20-L bags (Welch Fluorocarbon, Inc., Dover, NH) inside buckets were used to collect and transport river water to the laboratory.
Centrifuge and Accessories The continuous-flow centrifuge used in the development
of this protocol was the CFC Express from Scientific Methods, Inc. (fig. 2, http://www.scientificmethods.com/). This is a small (30×30×25 cm), lightweight (15 kg), portable unit with low power requirements (110 VAC, 5 A). Previous studies have used industrial centrifuges with large space and power requirements, which limit their portability. The CFC Express centrifuge can be used in the field or laboratory, and facilitates portability from location to location.
The CFC Express centrifuge runs at a set speed of 10,000 rpm so the sediment capture efficiency is controlled by the inflow rate. A small, variable-speed peristaltic pump (for example, a Masterflex® peristaltic pump, Cole-Parmer, Vernon Hills, Illinois) pumps water from the settling basins to the centrifuge (fig. 2A). Thicker Masterflex® tubing (for example, L/S 15) is preferable over thinner tubing (for example, L/S 25) to avoid wear and damage during extended operation.
A disposable centrifuge bowl (Scientific Methods, Inc., Granger, Indiana) is seated in the centrifuge and receives river water through the inflow port, captures the sediment on the bowl walls, and discharges the low-sediment water through the outflow port (fig. 2B). Outflow tubing directs the outflowing water from the centrifuge to a disposal location, which may be the river, on the ground, or down a drain. The centrifuge bowl is designed for medical and biological purposes, and is a molded plastic form coated on the interior with “K Resin,” an inert styrene-butadiene copolymer. The entire sample collection and processing protocol has been blank-tested for a suite of organic and inorganic parameters; the results are described in section, “Quality Control Testing of Continuous-Flow Centrifugation Methods” and appendix A, tables A1–A3. If a centrifuge bowl constructed or lined with alternative materials is used, similar blank-testing of the protocol may be warranted.
Sediment captured in the centrifuge bowl(s) and settled sediment in the bottom of the settling basin(s) is combined into a final sample container, such as a 1-L tall glass jar, for analysis. An equipment checklist is available in appendix B.
Equipment CleaningThorough cleaning of equipment using proper protocols
is important to ensure that sampling and processing equipment are not sources of contamination in the sample. Guidelines

Description of Continuous-Flow Centrifugation Method 7
Figure 2. (A) CFC Express continuous-flow centrifuge in which sediment-laden water (left bucket) is pumped into (B) a spinning bowl through an inflow port. Sediment is captured against the wall of the bowl, and low-sediment water (A, right bucket) is discharged through an outflow port.
and protocols for organic and inorganic analyses described in Chapter A3 of the USGS NFM (Wilde, 2004) should be followed: soak and scrub equipment with a 0.1 percent solution of non-phosphate, laboratory-grade detergent in tap water; rinse thoroughly with tap water; soak for 30 minutes in a 5 percent (by volume) trace-element grade hydrochloric acid; rinse thoroughly with water (inorganic-free for inorganic analyses); rinse surfaces with methanol (for organic analyses); air dry (or rinse with organic-grade water for organic analyses); and store bagged or in foil until use. The hydrochloric acid soak should be omitted for any metal-containing equipment. The centrifuge bowls are pre-cleaned and do not require additional cleaning before use. Proper chemical handling and disposal procedures should be followed, which includes wearing gloves, eyeglasses, and a laboratory coat, and working in properly vented areas. Clean laboratory nitrile gloves must be worn at all times when handling cleaned equipment in the field and laboratory to avoid sample contamination.
tac16-1113_fig 02
A B
InflowOutflow
Inflow tubing
Settling basin Outflow drain
Peristalticpump
Outflow tubing
Sample Collection
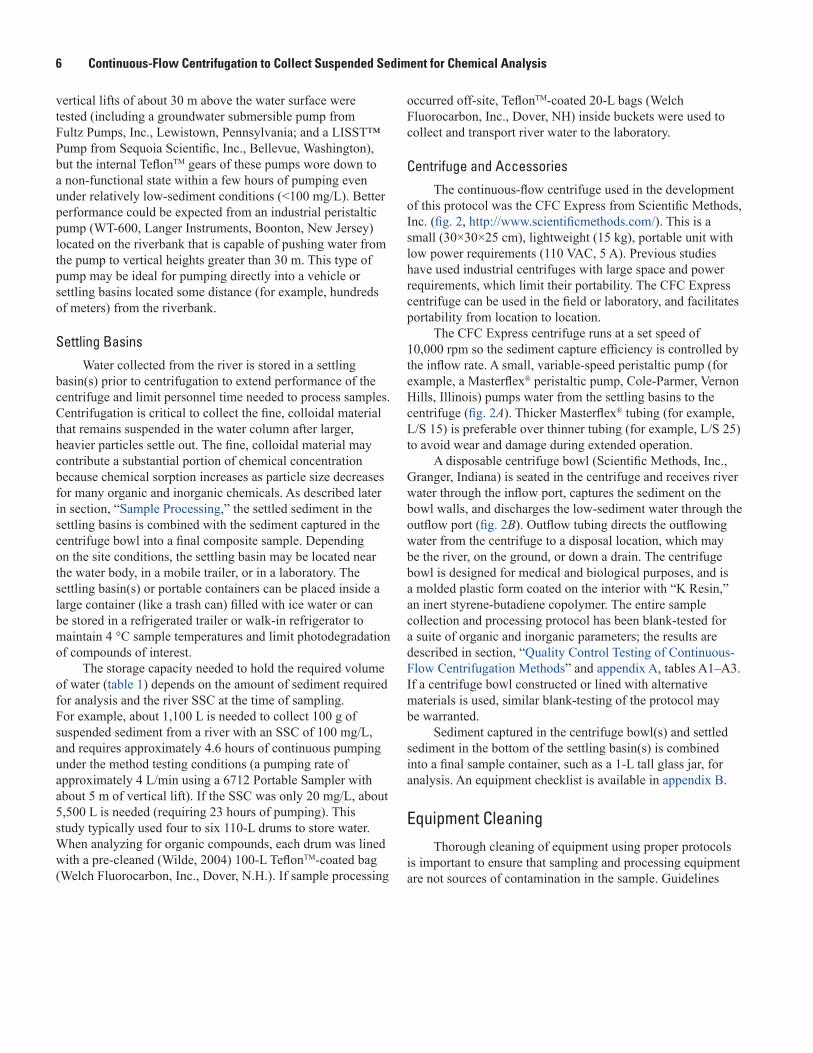
General guidance for water sample collection is described in Chapter A4 of the USGS NFM (U.S. Geological Survey, 2006). Examples of different field configuration options for storing and processing samples are presented in figure 3. These include: (1) a permanently installed hutch for housing the centrifuge for streamside collection and processing (figs. 3A and 3B), (2) a mobile trailer containing settling basins and centrifuges (figs. 3C and 3D), and (3) bucket collection and transport for off-site centrifugation (figs. 3E and 3F).
If samples can be collected using cross-sectional, depth-integrated methods (Edwards and Glysson, 1999; U.S. Geological Survey, 2006), store the collected water in a settling basin and proceed to section, “Sample Processing.” The general procedures to collect large volumes of water (hundreds to thousands of liters) using a pump system are:
8 Continuous-Flow Centrifugation to Collect Suspended Sediment for Chemical Analysis
1. Deploy the pump intake tubing in the river (see section, “Intake Tubing Deployment Options”).
2. Connect the intake tubing to a pump suitable for overcoming site elevation (vertical lift) conditions.
3. Begin pumping with native water to flush tubing and rinse sampling equipment.
4. Begin pumping into the settling basin or portable containers and note the sample start time. Program the pump accordingly (see section, “Intake Pump Operating Modes”).
5. While the water is being collected, conduct other field activities including completion of a field form and the collection of ancillary samples and measurements (see section, “Field Observations and Measurements”).
6. If processing will occur on-site, process the water as described in section, “Sample Processing.” If processing will occur off-site, continue pumping until sufficient water has been collected in portable containers.
7. Shut off the pump and note the sample stop time.
8. Disassemble field equipment configuration, store equipment, or transport equipment and samples to laboratory for processing and cleaning.
9. If processing at the laboratory:• Transfer the water from the
portable containers to large settling basins;
• Rinse the bags, especially the corners, with sufficient native water or un-reactive blank water to ensure complete sediment transfer; and
• Proceed with sample processing as described in section, “Sample Processing.”
tac16-1113_fig 03
A B
C D
E F
Figure 3. Different field configuration options for sample collection, including (A and B) bank-side hutch for streamside centrifugation, (C and D) mobile trailer containing centrifuges and settling basins, and (E and F) sample collection set-up and transport for offsite centrifugation. Photograph A by John Clemens, U.S. Geological Survey, October 8, 2014.
Description of Continuous-Flow Centrifugation Method 9
Intake Tubing Deployment Options
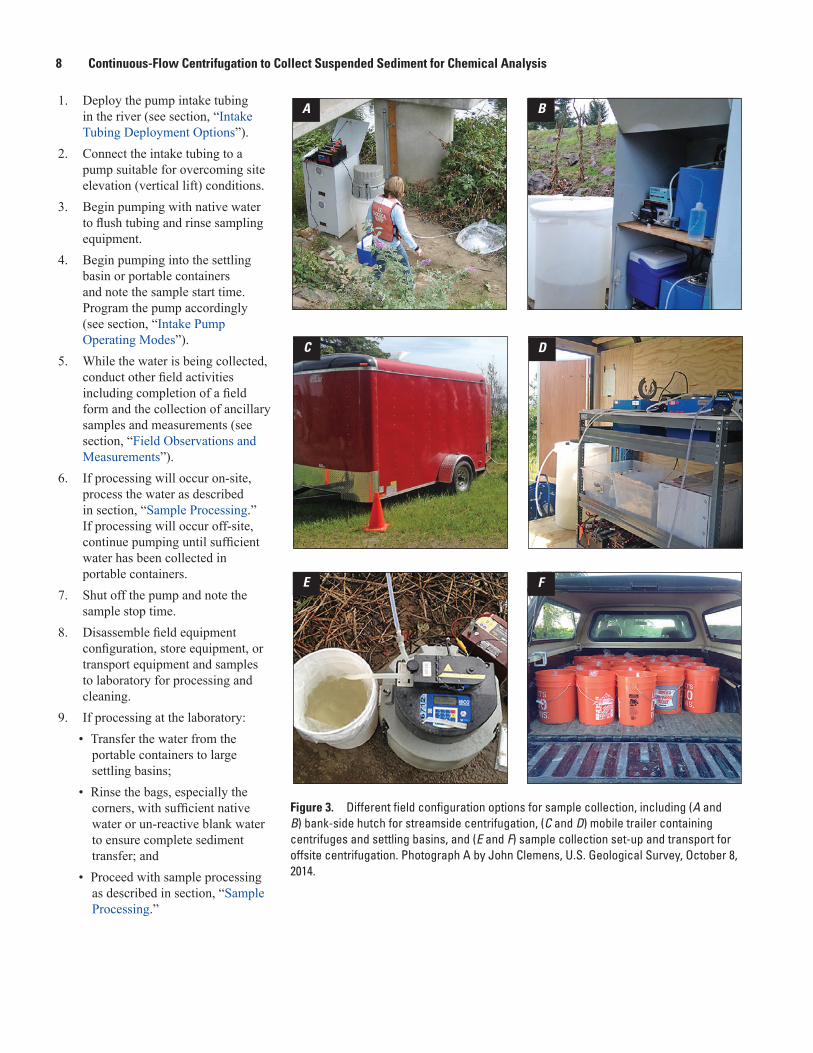
Table 2 describes three different deployment options for the pump intake tubing. Guidance and limitations on point-sampling for suspended sediment are described in Edwards and Glysson (1999). Option 1 is a bridge deployment with the sample line fixed to a weighted rope, lowered by hand or lowered using a bridgeboard and reel (fig. 4A). Although the deployment can be resource- and time-intensive during each sampling event, the exact location of the pump intake is known, and can be changed between sampling periods or even within a given sampling period. For example, the intake can be located at 0.6 times the depth in the thalweg during all sampling periods, even if the thalweg location and the depth of water changes. A multi-parameter sonde can be co-located to collect water-quality parameters near the intake location over the pumping duration (fig. 4B). Option 1 is capable of capturing a range of sample types (storms, regulated water releases, baseline periods) but is susceptible to debris snags and cannot be left unattended. Therefore, the sampling window is limited to safe conditions and personnel availability, so certain critical sampling periods may be missed (for example, an overnight rising limb of the hydrograph or when the river contains large floating debris). If the vertical distance from the water surface to the bridge exceeds the limits of a peristaltic pump (approximately 8 m), support the tubing with ropes along the bridge and attach it to a pump on the riverbank (fig. 4C).
tac16-1113_fig 04
A B
C
Rope
Tubing directed tobank-side pump
Weight
Tubing intake
Multi-parametersonde
Figure 4. Pump intake tubing bridge deployment (Option 1). Option 1 involves lowering the intake tubing from a bridge on a weighted rope, such as (A) by bridgeboard. (B) A multi-parameter sonde can be co-located. (C) The tubing can be directed to a pump on the riverbank if the bridge height is greater than the limit of the peristaltic pump (approximately 8 vertical meters).

10 Continuous-Flow Centrifugation to Collect Suspended Sediment for Chemical AnalysisTa
ble
2.
Sam
ple
colle
ctio
n pu
mp
inta
ke tu
bing
dep
loym
ent o
ptio
ns.
Opt
ion
Des
crip
tion
Sum
mar
yPu
mp
inta
ke
loca
tion
Ben
efits
Dis
adva
ntag
esA
pplic
atio
nsEx
ampl
e ap
plic
atio
ns
1Fr
om b
ridge
raili
ng
on a
wei
ghte
d ro
peVa
riabl
e in
take
lo
catio
n, n
arro
wte
mpo
ral
sam
plin
gpe
riod
In th
alw
eg, m
id-
dept
h (o
r any
de
sire
dlo
catio
n)
• Can
be
mov
ed to
any
lo
catio
n in
rive
r cro
ss
sect
ion
• Dep
loym
ent t
ime
and
team
requ
ired
each
sa
mpl
ing
perio
d
• Brid
ge re
quire
d
• Sus
cept
ible
to d
ebris
sn
ags,
cann
ot b
e le
ft un
atte
nded
, sam
plin
g w
indo
w is
lim
ited
• Sho
rt du
ratio
n sa
mpl
ing
(hou
rs)
• Sto
rms
• Reg
ulat
ed fl
ows
2Fr
om b
ank,
thre
aded
thro
ugh
perm
anen
t rig
id tu
bing
Fixe
d in
take
lo
catio
n, w
ide
tem
pora
l sa
mpl
ing
perio
d
In th
alw
eg,
abov
e be
d• R
apid
re-d
eplo
ymen
t fo
r eac
h sa
mpl
ing
perio
d
• Int
ake
loca
tion
is
exac
tly th
e sa
me
each
ev
ent
• Les
s sus
cept
ible
to
debr
is sn
ags;
ther
efor
e ca
n be
left
unat
tend
ed
• Tim
e re
quire
d fo
r ini
tial
depl
oym
ent o
f rig
id
hous
ing
• Int
ake
loca
tion
cann
ot
be c
hang
ed a
fter i
nitia
l de
ploy
men
t
• In-
wat
er e
nd o
f rig
id
tubi
ng c
anno
t be
acce
ssed
ea
sily
for c
lean
ing
• Sho
rt du
ratio
n sa
mpl
ing
(hou
rs)
• Lon
g du
ratio
n sa
mpl
ing
(mul
ti-da
y)
• Eve
nts t
hat w
ould
ot
herw
ise
be m
isse
d du
e to
per
sonn
el a
nd
safe
ty
• Sto
rms
• Mul
ti-da
y ba
selin
e sa
mpl
ing
• Ove
rnig
ht sa
mpl
ing
to c
atch
risi
ng li
mb
• Flo
od c
ondi
tions
3To
ssed
from
ban
k,w
eigh
ted
Uni
vers
al si
teap
plic
atio
n, fi
xed
inta
ke lo
catio
n,
narr
ow te
mpo
ral
sam
plin
g pe
riod
Nea
r ban
k,
near
bed
• Rap
id d
eplo
ymen
t
• No
brid
ge re
quire
d
• No
exis
ting
infr
astru
ctur
e re
quire
d
• Int
ake
loca
tion
likel
y no
t re
pres
enta
tive
of ri
ver
cros
s sec
tion
• Can
not b
e le
ft un
atte
nded
, sa
mpl
ing
win
dow
is
limite
d
• Sho
rt du
ratio
n sa
mpl
ing
at a
lmos
t any
ba
nk-a
cces
sibl
e si
te
• Rec
onna
issa
nce
sam
plin
g of
man
y si
tes a
roun
d a
regi
on
or st
ate
• Sto
rms

Description of Continuous-Flow Centrifugation Method 11
Option 2 allows for long-term, unattended deployment of the intake tubing through permanent rigid tubing installed from the bank, along the riverbed, into the middle of the river cross section (fig. 5). Although initially labor intensive, this option allows the sample line to be rapidly deployed and retrieved from the bank by a single person on each subsequent site visit. For Option 2, the intake location is fixed, which may be beneficial for sample comparison purposes, but may be a disadvantage if river conditions or project objectives change. Depending on site conditions, the orientation of the intake tubing may be specifically positioned to meet project objectives, for example, perpendicular to flow. A submerged float can be attached to the intake tubing to maintain a location a few feet above the riverbed. Although the tubing is less susceptible to debris snags than Option 1, because it is near the riverbed, it is less accessible should maintenance need to be performed. The sample tubing is deployed and retrieved from within the permanent rigid tubing for cleaning in between each sampling event. Option 2 is ideal for long-term deployments involving multi-day sampling or difficult flow regimes.
Option 3 is the simplest deployment which involves deploying weighted tubing into the river from the bank. Although the sampling location is non-ideal because of its proximity to the bank, and may not be representative of the river cross section, Option 3 can be rapidly deployed at nearly any location with no bridge or infrastructure required. This deployment is ideal for reconnaissance surveys of many sites. The benefits, disadvantages, and applications of the three deployment options are summarized in table 2.
tac16-1113_fig 05
B C
A
Rigid tubing, view from bridge
Rigid tubing
Intake tubing
Figure 5. Pump intake tubing permanent rigid tubing deployment (Option 2). Option 2 (A) involves (B) threading the intake tubing through rigid tubing running from the bank along the riverbed to a desired location mid-channel. (C) The weighted rigid tubing was permanently installed at the beginning of the project using a pulley system from the bridge to lower it to the desired mid-channel location. A submerged float was attached to the in-river end to maintain a location a few feet above the riverbed.

12 Continuous-Flow Centrifugation to Collect Suspended Sediment for Chemical Analysis
Intake Pump Operating ModesThe intake pump was operated in two different modes
(Full-speed and Baseline) during method development. In “Full-speed” mode, the pump is operating continuously at its highest suction rate. This mode is used for short-duration sampling, such as to capture the turbidity peak of a storm, when the objective is to collect the most water possible in a short period of time. Using the 6712 Portable Sampler, about 660 L (175 gal) of water was collected into six 110-L settling basins in 3 hours. About 45 TeflonTM-lined buckets, each containing 15 L of water, would be needed to transport this same volume off-site. Additional water was collected without increasing storage capacity when the centrifuges were located on-site and operating during water collection. With two CFC Express centrifuges each operating at 600 mL/min, an additional 300 L of water, for a total of 960 L of water, was collected over 4 hours (instead of 3 hours) before the six settling basins were full.
If SSC is low, it may not be possible to collect the required mass of sediment in only 4 hours. Instead, a long-duration sample collection period may be instituted by operating the pump in “Baseline” mode. In this mode, the intake suction pump is programmed to operate at the same flow rate as the centrifuge flow rate. Continuously operating two parallel centrifuges and programming the pump (6712 Portable Sampler) to run for 25 minutes of a 90-minute cycle allowed the system to run relatively unattended (one to two visits per day) for multiple days, while ensuring the accumulation of sediments were sufficient for laboratory analysis. See appendix C for “Baseline” mode programming details.
Project objectives will determine pumping duration, which may be varied to target specific conditions or may be held constant throughout the project to facilitate comparison of results. A minimum pumping time should be determined from the lowest expected SSC conditions at the sample site (table 1). Long-duration pump times may reduce temporal resolution, for example, compositing pre-storm and storm conditions into a single sample.
Sample Processing
Follow USGS guidelines describing methods to avoid sample contamination during processing (Wilde and others, 2004, with updates through 2009). In particular, clean nitrile gloves should be worn when handling any equipment that will come in contact with the sample, such as the inflow and outflow ports of the centrifuge bowl, the ends of the peristaltic pump tubing, and all (inside and outside) of the tubing inside the settling basin. The following steps should be used to process large volumes of water using continuous-flow centrifugation, following the manufacturer operating procedures, modified here for river water applications:
1. Position the centrifuge on a level and properly vented work surface. Note: The bank-side hutch used during method development was fitted with small computer fan units to cool the centrifuges during warm-weather sample collection.
2. Install bowl in the centrifuge with the inflow port facing to the left and the outflow port facing to the right (fig. 2B). Note: It is very important that the bowl is properly seated in the centrifuge rotor to avoid shearing off the top of the bowl.
3. Attach inflow tubing to the inflow port and outflow tubing to the outflow port (fig. 2A). Direct outflow tubing to the ground, a drain, or in the river (downstream).
4. Position the inflow tubing in the peristaltic pump (fig. 2A) and place the end in the settling basin.
5. Optional: Attach tubing appropriate for analyses (for example, TeflonTM tubing for organic analyses) to the inflow tubing and place it in the settling basin.
• During method development, 0.635 cm diameter TeflonTM tubing was floated with a clean, capped, 1-L TeflonTM bottle, then weighted with a small glass funnel to keep the intake just below the water surface (fig. 6A).
• The float and weight system was cleaned as described in section, “Equipment Cleaning.” This was done to extend the life of the centrifuge bowl, by processing only suspended sediment through the centrifuge and allowing settling sediment to remain in the bottom of the basin(s) until all water had been centrifuged.
• This settled sediment was later composited with the centrifuged sediment in the final sample jar.
6. Follow the manufacturer instructions to turn on and operate the centrifuge (Hsu, 2010). When the centrifuge reaches maximum speed (about 5 seconds), turn on the peristaltic pump (see appendix D for troubleshooting tips for the CFC Express centrifuge).
7. Adjust the peristaltic pump to the desired inflow rate.
• For a range of inflow water suspended-sediment concentrations, a pump rate of up to 600 mL/min resulted in a sediment capture efficiency of the centrifuge of greater than 90 percent (see section, “Quality Control Testing of Continuous-Flow Centrifugation Methods”).
• Measure the inflow rate by collecting the outflow volume in a graduated cylinder over a timed period, for example, 300 mL in 30 seconds. The centrifuge bowl retains sediment and approximately 300 mL of water within the bowl at all times, keeping the sample cool.

Description of Continuous-Flow Centrifugation Method 13
tac16-1113_fig 06
A
GF
B
C D
E
Commonlocationsof bowlwear
TeflonTM sample splitter
Floating glass funnel
Figure 6. Various centrifugation components, including (A) a float system for the settling basin tubing, (B) common locations of bowl wear, (C) a sample splitter, (D) final composited sediment sample and overlying water, (E) floor centrifuge, (F) centrifuged sediment pellet, and (G) final suspended-sediment sample for analysis.
14 Continuous-Flow Centrifugation to Collect Suspended Sediment for Chemical Analysis
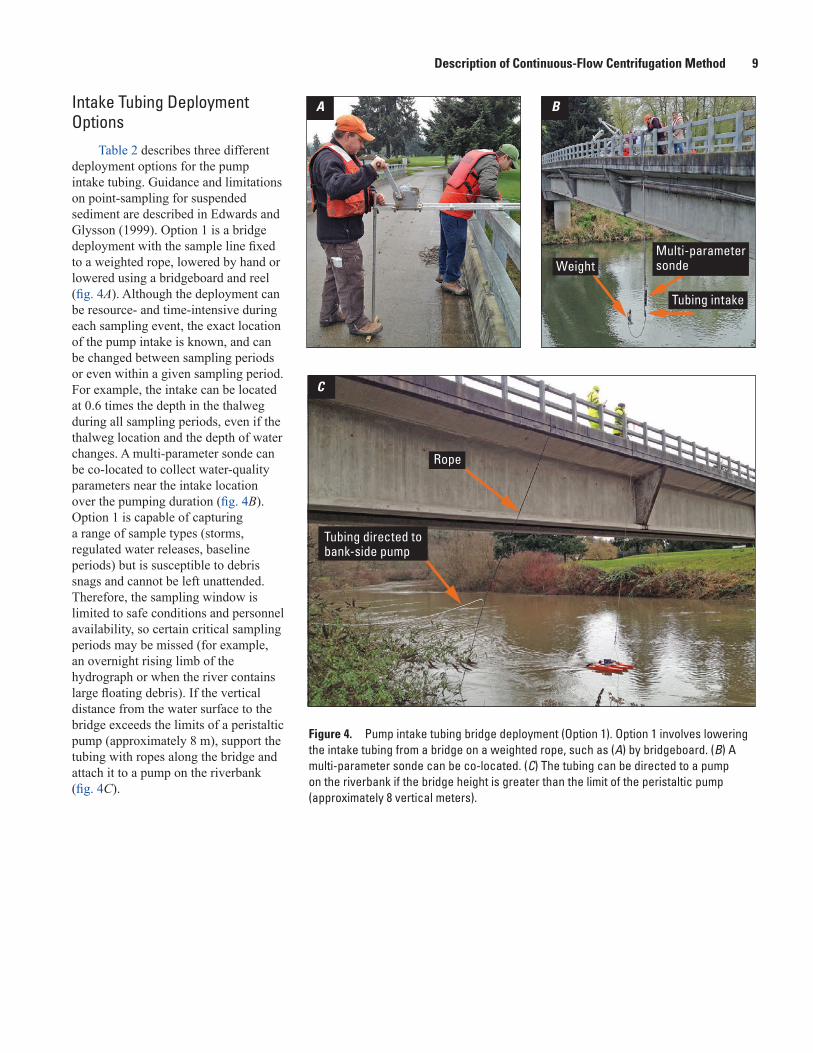
8. Periodically empty the bowl contents (water and sediment) into an appropriate sample container.
• Performance of the CFC Express centrifuge begins to degrade (indicated by a louder running noise) when approximately 15 g of sediment has accumulated in the bowl.
• Under low SSC (<100 mg/L) conditions, bowls should be emptied at a minimum of every 12 hours. High sediment concentrations will require more frequent emptying of the centrifuge bowl, for example, every 4 hours.
• Because the sediment in each bowl is transferred in approximately 300 mL of water, the preferred sample container is a 1-L tall, wide-mouth jar often used for bed sediment.
• Fine material can accumulate on the walls of the centrifuge bowl. Agitation is needed to free the fine material, including vortexing, manual shaking or repeatedly striking the bowl against the palm of the hand. A small volume of native water from the centrifuge outflow can be added to the emptied bowl to loosen and transfer remaining sediment.
• After transfer, inspect the bowl and replace it if there are signs of wear (fig. 6B) before re-starting the centrifuge. Appendix D describes tips on transferring bowl contents, bowl inspection, and re-starting the centrifuge.
9. Continue pumping the water through the centrifuge(s).
• The time required will depend on how much water is collected, how many centrifuges are in operation, and the centrifuge flow rates (table 1). Consider these time requirements at the beginning of sample collection rather than at the end.
• A TeflonTM “T”-shaped splitter was used to pump water equally from two 110-L drums through a single centrifuge (fig. 6C). This increased the unattended centrifuging time from 3 hours to 6 hours.
10. Transfer sediment from the centrifuge bowls and the bottom of the settling basin(s) to the sample jar (fig. 6D) after the final settling basin is drained (details and tips in appendix D).
11. Cap, label, and store the sample jar quiescently at 4°C. If sample processing was completed onsite, disassemble field equipment and transport to an appropriate location for cleaning and storage.
12. Remove the overlying water in the sample jar.
• If the sediment settles rapidly, pipetting and discarding the overlying water may suffice. For slowly-settling sediment, additional centrifugation may be required.
• During method development, the overlying water was carefully removed by pipette into 100-mL glass tubes. The tubes were centrifuged for 30 minutes at a maximum speed of 5,200 rpm (fig. 6E, IEC Model K, Needham Heights, MA). The overlying water was discarded and the remaining sediment pellet added to the sample jar (fig. 6F).
• Another option is filtering the overlying water through a pre-baked, pre-weighed glass fiber filter of small pore size (for example, 0.45 or 0.7 µm). Multiple filters may be needed depending on the volume and SSC of the water. Submit the filters (and provide the dry filter weights) to the laboratory for analysis. This is only an option if there is a single laboratory preparation method and the analyzing laboratory is capable of analyzing filters.
13. Preserve the final sample (fig. 6G) as appropriate for the analysis, for example, store at 4 °C or freeze for long-term storage until analysis (see section, “Post-Sampling Activities”).
Field Observations and Measurements
A variety of field observations and measurements may be collected concurrently with suspended-sediment sampling based on project objectives. Detailed notes are a critical part of any field collection effort. They include basic information such as the station number, station name, sample date and time, sampling team, sampling method, sampling equipment, weather conditions, and noteworthy site conditions (for example, the presence of oily sheens, floating garbage or debris, or high-turbidity pulses). Document conditions from a nearby streamgage including gage height, discharge, and turbidity at the start, end, and at various times throughout sampling to record changing conditions. The duration of sampling (when the pump was turned on and off), intake pump mode (Fullspeed or Baseline), inflow rate (such as 600 mL/min), and number of centrifuges should be recorded. The intake tubing location should be measured and recorded, including the distance from the left or right bank and depth below the water surface or above the riverbed. An example field form is provided in appendix E.
The most important additional field measurements are SSC and PSD using cross-sectional, depth-integrated techniques with approved sampling equipment (Edwards and Glysson, 1999; Davis, 2005). The SSC and PSD of a pumped sample likely will not be representative of the SSC and PSD in the river cross section (Edwards and Glysson, 1999). If the sampling site is not near a streamgage, a measurement of instantaneous discharge also should be made. The discharge, SSC, and suspended-sediment chemical concentrations can be used together to calculate instantaneous chemical loads.

Description of Continuous-Flow Centrifugation Method 15
Measurements of general water-quality parameters provide valuable site information for minimal cost and effort. See Chapter A6 of the USGS NFM (Wilde, variously dated) for general guidance on field measurements. A multi-parameter sonde can be co-located with the intake tubing (fig. 4B) and can be deployed at various locations in the water body to assess stream-mixing and changing conditions. Parameters include air temperature, barometric pressure, water temperature, pH, dissolved oxygen, specific conductance, and turbidity. Continuous turbidity or another sediment surrogate is a necessary field parameter if a continuous load will be estimated based on the relation between SSC and the surrogate. Surrogate data should be collected per USGS methods, such as Rasmussen and others (2009) for turbidity and Landers and others (2016) for acoustic surrogates. It is important to ensure the collection of high-quality data of continuous and discrete surrogates, including the use of redundant sensors because under- or over-estimations from poorly collected data can result in large inaccuracies in load calculations and subsequent interpretations of the data.
Post-Sampling Activities
Store the final, composited sediment sample in a container appropriate for the requested analysis. Homogenize the sample using a scoop or spatula appropriate for the analyses prior to splitting the sample into separate containers. During method development, even with a second centrifugation step using a laboratory floor centrifuge, the final sample contained an average of 30 percent solids owing to the small sediment mass recovered. The total sample mass can be estimated by weighing the sample jar pre- and post-sample collection, which may aid in proper subsampling and analytical method prioritization.
Label and ship the samples, with proper care and documentation, to the selected laboratory for analysis, per USGS guidance (U.S. Geological Survey, 2011). Include the sample medium code (SS, suspended sediment), sample type (H, composite), and start/end dates and times. Associated quality-control samples should be coded with the sample medium SSQ (“Quality-control [QC] sample–suspended sediment”) for environmental quality control samples such as replicates or OAQ (“QC sample–artificial”) for blank samples. The sample containing the sediment material can be analyzed for a range of analytes, similar to those available for analysis of bed material. This includes PAHs (for example, NWQL Schedule 5506); pesticides, PCBs, and flame retardants (for example, NWQL Lab Code 8093); wastewater-derived compounds (for example, NWQL Schedule 5433); hormones (for example, NWQL Schedule 6434); and metals (for example, NWQL Schedule 2275 for trace elements and Lab Code 8512 for low-level mercury).
The reporting levels vary based on the mass of sample and matrix inhibition. This collection technique is not recommended for volatile compounds because of volatilization that happens during pumping, settling in the open-atmosphere settling basins, and centrifugation (see section, “Quality Control Testing of Continuous-Flow Centrifugation Methods”). Request percent moisture analysis from the analytical laboratory so that results are reported on a dry weight, rather than a wet weight, basis. Additionally, request percent organic carbon to report results normalized to organic carbon concentrations. If percent organic carbon is not requested at the analytical laboratory, then Loss-on-Ignition should be requested at the sediment laboratory performing the SSC and PSD analysis. The amount lost during ignition is representative of the organic fraction of the sediment sample. This is important information to help interpret the chemical results, as the percent organic carbon affects chemical sorption behavior.
Include the previously described sample header information and relevant field information when logging samples into the USGS National Water Information System through the Water-Quality System (QWDATA). The Sampler Type (parameter code 84164) likely will be 4115 (Sampler, point, automatic) for pumped samples or the appropriate value for a representative sampler (for example, 3055–D-96 Bag sampler). The Sampling Method (parameter code 82398) likely will be 50 (point) for pumped samples or the appropriate value for a representative method (for example, 20–equal-discharge increment [EDI]). Include as much information as possible, such as the hydrologic condition, observations of oil or floating debris, and field parameters including streamgage station height, discharge, and water-quality field readings.
Data Review and Interpretation
A thorough review and approval of the data should occur in a timely manner according to project objectives and USGS guidelines (U.S. Geological Survey, 2012). Once the data have been reviewed and approved, the data may be analyzed to meet a variety of project objectives. As with most sediment chemistry data, the results are reported as a concentration of chemical per weight of dry sediment, such as 10 µg/kg naphthalene. The concentrations can be presented as a stand-alone dataset to fill the existing suspended-sediment chemistry data gap. The gap exists because chemicals are often below the analytical level of detection in paired unfiltered and filtered water samples collected using representative depth- and width-integrated techniques.
Relations between chemical concentration and environmental variables such as precipitation, seasonality, and land-use characteristics may support source tracking of sediment-bound chemicals and understanding conditions that contribute high concentrations of riverine sediment-bound
16 Continuous-Flow Centrifugation to Collect Suspended Sediment for Chemical Analysis
chemicals. If the SSC in the river at the time of sampling is known, then the chemical concentration associated with the suspended sediment in a volume of water (CSS) can be determined by:
CSS (µg/L) = CS (µg/kg) × SSC (mg/L) × (1 kg/106 mg) (1)
where CS is chemical concentration on centrifuged
suspended sediment (µg/kg), and SSC is concentration of suspended sediment in the
water (mg/L).
A total chemical concentration in water may be estimated by summing CSS with CDISS, the chemical concentration in the dissolved phase (noting that some small particles typically less than 2 µm in size are not captured by the centrifuge; see section, “Quality Control Testing of Continuous-Flow Centrifugation Methods”). From this equation, site-specific partition coefficients between water and sediment can be determined for individual compounds.
If the discharge and SSC at the time of sampling are known, then instantaneous chemical loads may be estimated as:
3
6
mg µg mgChemical Load hr kg 10 µg
mg kg LSSC L hr10 mg
= ×
× × ×
SC
Q
(2)
where CS is chemical concentration on centrifuged
suspended sediment (µg/kg); SSC is concentration of suspended sediment in the
water (mg/L); and Q is instantaneous discharge (L/hour).
Equations 1 and 2 assume that the measured chemical concentration on the centrifuged suspended sediment, Cs, is representative of the chemical concentration on all particle sizes included in the SSC sample. Horowitz (2008) reported that the fine fraction containing silts and clays (<62.5 µm) and sand fraction (>62.5 µm) substantially contributed to the total suspended sediment-bound chemical concentration for a number of trace elements.
For other chemical groups, it may be more appropriate to assume that the measured chemical concentration on CS is representative of the chemical concentration on the fine fraction (<62.5 µm). For example, sorption of many
contaminants increases with decreasing particle size, including nonionic organic compounds like PAHs, PCBS, PBDEs, and pesticides (Karickhoff and others, 1979; Swarzenbach and Westall, 1981). Karickhoff and others (1979) reported the organic-carbon partition coefficient (KOC) of a number of organic compounds for sand was 50–90 percent lower than the KOC for smaller particle sizes, such that it was assumed that KOC (sand) = 0.2 KOC (silt). The centrifuging process results in a more homogenous and finer grain-size distribution as compared to the grain-size distribution in the river, which generally has a wider range of particle sizes, namely larger particles (see section, “Quality Control Testing of Continuous-Flow Centrifugation Methods”). In this case, the concentration of fine sediment (SSCFINES) should be used in place of the total river SSC in equations 1 and 2.
If continuous discharge is determined from a stage-area rating curve, and continuous SSC (or SSCFINES) is determined from a relation with a continuously measured surrogate such as turbidity, then estimates of continuous SSC (or SSCFINES) and annual sediment loads can be determined per USGS methods (Rasmussen and others, 2009). From this, annual estimates of suspended sediment-associated chemical loads may be determined. USGS models like LOADEST (Runkel and others, 2004) are appropriate for dissolved constituents, but may underestimate loads when the sediment-bound load is important, for example, for hydrophobic compounds (Karickhoff and others, 1979; Swarzenbach and Westall, 1981), or when hysteresis in sediment transport is evident. Simply multiplying measured chemical amounts on suspended sediments collected in the field by modeled sediment loads will result in large uncertainty because of the wide range of measured chemical concentrations and extrapolation between discrete measurements. In some systems, a simple linear regression from SSC or SSCFINES and streamflow may be sufficient to estimate sediment-bound chemical concentrations. In more complex systems, such as those with regulated flows, tidal influence, or varying sediment and chemical inputs, alternate approaches may need to be considered, such as Boosted-Regression Tree techniques, in which the chemical load is a function of the interaction of multiple environmental factors and does not assume any specific functional form (Elith and others, 2008). Regardless of approach, there will be large uncertainties in chemical-flux estimates owing to already large uncertainties on the estimates of SSC and sediment fluxes added to uncertainties in chemical concentration. The estimates of suspended sediment-bound chemical concentrations and fluxes can be used to assess impacts on downstream ecosystems and to support restoration activities and remediation goals.

Quality Control Testing of Continuous-Flow Centrifugation Methods 17
Quality Control Testing of Continuous-Flow Centrifugation Methods
Quality control tests executed during method development included: (1) evaluation of centrifuge sediment capture efficiency, (2) blank samples, and (3) reference samples.
Centrifuge Efficiency
Centrifugation captures most particles in a water sample. Sediment capture efficiency was tested at the USGS Washington Water Science Center laboratory under variable flow rates and inflow sediment concentrations (table 3). In Experiments 1a and 1b, a river sample with a measured total suspended solids (TSS) concentration of 80 mg/L was continuously mixed into suspension and pumped into the continuous-flow centrifuge initially at a flow rate of 600 mL/min and then at a flow rate of 300 mL/min. At 600 mL/min, an average efficiency of 90 percent was calculated from the difference between the average inflow TSS and average outflow TSS. At 300 mL/min, an average efficiency of 98 percent was calculated. The TSS concentration in this experiment was determined at the USGS Washington Water Science Center laboratory by measuring, on a four-place analytical balance (GA 200, OHAUS Corp., Parsippany, New Jersey), the dry weight of particles in a homogenized aliquot of water captured on a 0.1 µm cellulose nitrate membrane filter (Advantec MFS, Inc., Dublin, California). Even though SSC is a more representative measure of fluvial sediment (Gray and others, 2000), TSS was used for the analysis for several reasons: (1) the efficiency of performing the analysis at the Washington Water Science Center laboratory; (2) SSC is a measure of the entire sample, which would leave no inflow
sample available to pump through the centrifuge; and (3) the sediment concentration in the centrifuge outflow was too low to be determined by traditional SSC methods such as wet sieving and fall diameter (discussed in more detail later in this section). In Experiment 2, a high sediment-concentration sample (theoretical sediment concentration of 500 mg/L) was centrifuged under “worst-case” conditions, which included “vacuuming” settled sediment from the bottom of the 110-L drum. The centrifuge efficiency was high (96 percent), although the outflow concentration also was relatively high (19.5 mg/L).
Experiments 3 through 5 were conducted after modifications to the pumping protocol were incorporated to float the centrifuge sampling line about 10 cm below the water surface of the settling basin. It was hypothesized that the sediment capture efficiency would increase because the centrifuge would capture the fine suspended sediment while the larger particles were retained on the bottom of the basin for later compositing. The TSS concentrations were determined using standard gravimetric methods with a 0.45-µm glass fiber filter (GF75, Advantec MFS, Inc., Dublin, California) according to U.S. Environmental Protection Agency SW-846 (U.S. Environmental Protection Agency, 2015) Method 160.2. The outflow TSS concentrations were less than 1 mg/L and the centrifuge efficiency rates were greater than 96 percent for experiments conducted at 600 mL/min on inflow samples with TSS concentrations up to 38.4 mg/L (table 3). The results are applicable to inflow TSS much higher than 38.4 mg/L because the measured TSS did not incorporate the settled concentration. When the bowl was overloaded with sediment (Experiment 5b), the centrifuge efficiency dropped to 91 percent. To maximize centrifuge efficiency, the bowl should be emptied regularly (every 4–8 hours for SSC > 100 mg/L; every 12–24 hours for SSC < 100 mg/L) to avoid reaching capacity.
Table 3. Summary of results from centrifuge sediment capture efficiency experiments.
[Abbreviations: mL/min, milliliter per minute; mg/L, milligram per liter]
Experiment Experiment descriptionFlow rate(mL/min)
Average total suspended-solids concentrationCalculated centrifuge efficiency (percent)
Influent Effluent
mg/LNumber of replicates
mg/LNumber of replicates
1a Sediment in suspension during pumping 600 80.5 6 8.22 3 901b 300 1.9 2 982 Settled sediment from bottom of drum
“vacuumed” with pump600 1500 1 19.5 3 96
3 Floating drum line (normal operation) 600 5.04 3 0.11 3 984 Floating drum line (normal operation) 600 26.3 3 0.83 3 975a Floating drum line (normal operation) 600
38.4 1<0.5 1 >98
5b Overloaded bowl 3.59 1 911Theoretical, calculated from the weight of the sediment added to the volume of water.

18 Continuous-Flow Centrifugation to Collect Suspended Sediment for Chemical Analysis
Numerous efforts were made to quantify the size distribution of the particles remaining in the centrifuge outflow. There was so little sediment in the centrifuge outflow samples that a quantifiable PSD could not be determined by traditional x-ray or laser diffraction techniques. Samples were sent to three laboratories for laser diffraction analysis, and either no results were provided or the results were qualified because the samples were below the quantification limit which resulted in anomalous data.
The PSD of one large-volume centrifuge outflow sample was successfully determined by x-ray gravitational methods using a Sedigraph at the USGS Cascades Volcano Observatory Sediment Laboratory only by extending the run time from the usual 3 minutes to 105 minutes. The Sedigraph method determines PSD by comparing the settling velocity of the particles to that of reference quartz spheres with known diameters, and is used for fine sediment for which wet sieving techniques are difficult. The suspended sediment from about 150 L of centrifuge outflow settled quiescently and then was composited into a small-volume sample after decanting the overlying water. Ninety-eight percent of the mass of suspended sediment in the centrifuge outflow had a fall diameter smaller than 2 µm (table 4). The remaining 2 percent of suspended sediment mass in the centrifuge outflow had a fall diameter between 2 and 16 µm. This mass may have been comprised of single particles or flocculations of smaller particles. About 90 percent of the suspended sediment in the centrifuge inflow river sample had a fall diameter less than 62.5 µm, whereas 90 percent of the suspended-sediment mass in the centrifuge outflow sample had a fall diameter less than 1 µm.
These results validate the centrifuge method described here for capturing the majority of suspended particles in large-volume water samples. The results indicate that nearly all particles greater than 4 µm and most particles greater than 1 µm are likely to be captured. This is consistent with
the centrifuge manufacturer data reporting the recovery of microorganisms greater than 1 µm. The theoretical particle size below which is too small to be captured by the centrifuge was calculated to be approximately 0.50 µm, according to equations described by Jackson (1956) for a continuous-flow, bowl-type centrifuge and using the parameters for the CFC Express centrifuge (bowl radius = 4.05 cm; bowl area = 165 cm2; rotational velocity = 10,000 rpm; flow rate = 600 mL/min; and an assumed hydrated particle density = 1.8 g/cm3). This is an estimated value given the limitations on measurement precision, differences in centrifuge bowl shape as compared to the centrifuge for which the equations were developed (laboratory “supercentrifuge,” Sharples Corporation, Philadelphia, Pennsylvania) and assumptions about hydrated particle density. Theoretically, particles smaller than 0.50 µm are not captured in the centrifuge and instead are discharged in the outflow. Indeed, about 75 percent of the mass of particles measured in the centrifuge outflow sample previously described had a fall diameter less than 0.5 µm. The actual amount and size of the particles not captured will vary between samples as the inflow characteristics change, including SSC, PSD, sediment organic content, ionic strength, surface charge, and other bulk chemistry characteristics. The amount and size of particles that are not captured may vary within a single sampling event if the inflow characteristics change rapidly (for example, during storm conditions) and as the performance of the sampling equipment varies (as the centrifuge bowl fills with sediment). The contribution of this small particle-size fraction to the overall chemical load is unknown and is an area in need of further investigation.
Blank Samples
Laboratory testing was conducted to determine if the field sampling and centrifuging equipment introduced contamination into suspended-sediment samples. Riverbank sediment from the Puyallup River, Washington, was burned in a muffle furnace at 450 °C for 6 hours to destroy any organic carbon. After cooling, the sediment was separated into two subsamples. The first subsample was placed directly in an amber glass jar, capped, labeled, and stored at 4 °C until analysis. This sample was called the “source blank.” The second subsample was mixed into a slurry with reverse osmosis-treated water and pumped through all sampling equipment to replicate the field protocol (that is, stream intake TeflonTM tubing, Teledyne Isco® pump tubing, TeflonTM bag, small-diameter centrifuge TeflonTM tubing, Masterflex pump tubing, and centrifuge bowl). All sediment was pumped into the centrifuge and collected in the centrifuge bowl. The bowl contents were emptied into an amber glass jar. After allowing the sample to settle, the overlying water was removed by glass pipette, and the sediment sample was submitted for chemical analysis. This sample was called the “equipment blank.”
Table 4. Particle size distribution of centrifuge outflow.
[The influent river sample was 90 percent fine sediment (<62.5 µm). Abbreviation: µm, micrometer]
Fall diameter (µm)
Percentage of suspended sediment smaller than fall diameter
62.5 10032 10016 1008 994 982 981 900.75 840.5 750.38 670.25 49

Quality Control Testing of Continuous-Flow Centrifugation Methods 19
Table 5. Summary of analytical methods used during quality control testing.
[Parameter group: PAHs, polycyclic aromatic hydrocarbons; PCBs, polychlorinated biphenyls. Analyzing laboratory: NWQL, U.S. Geological Survey National Water Quality Laboratory; WA 1, Washington State-accrediated laboratory 1; WA 2, Washington State-accredited laboratory 2; CVO, U.S. Geological Survey Cascades Volcano Observatory Sediment Laboratory. Sample type: Puyallup and Duwamish Rivers are in Washington State. NIST SRM, National Institute of Standards and Technology Sediment Reference Material; Y, the sample was analyzed for the parameter group; N, the sample was not analyzed for the parameter group. Abbreviations: EPA SW-846, U.S. Environmental Protection Agency SW-846 (U.S. Environmental Protection Agency, 2015); SIM, selected ion monitoring]
Parameter groupAnalyzing laboratory
Method Reference
Sample type
Puyallup River source
blank and equipment
blank
Silica sand source blank
and equipment blank
NIST SRM 1944
Duwamish River sediment,
experiments 1 and 2
Wastewater-derived compounds
NWQL Schedule 5433 Burkhardt and others, 2006 Y Y N N
PAHs NWQL Schedule 5506 Zaugg and others, 2006 Y Y Y N
Hormones NWQL Schedule 6434 Modified from Foreman and others, 2012
Y Y N N
Halo-organic compounds
NWQL Lab Code 8093 Research method, see method description in Wagner and others, 2014
Y Y Y N
Metals NWQL Schedule 2275 Garbarino and others, 2006 N Y N N
Mercury NWQL Lab Code 8512 Similar to EPA SW-846 Method 7474
N Y N N
Semivolatile compounds
WA 1 8270D EPA SW-846 Y Y N Y
Low-level PAHs WA 1 8270D SIM EPA SW-846 Y Y N Y
Butyl tins WA 1 8270D EPA SW-846 Y Y N Y
Pesticides WA 1 8081B EPA SW-846 Y Y N Y
Metals WA 1 6020 EPA SW-846 Y Y N Y
Mercury WA 1 7471A EPA SW-846 Y Y N Y
Hexavalent chromium WA 1 7196A EPA SW-846 Y Y N Y
Volatile organic compounds
WA 1 8260A EPA SW-846 N N N Y
Total organic carbon WA 1 Combustion Puget Sound Estuary Program (1986)
Y Y N Y
Particle-size distribution
WA 1 Settling velocity Puget Sound Estuary Program (1986)
N N N Y
209 PCBs WA 2 1668C EPA SW-846 Y Y N N
17 Dioxins and furans WA 2 1613B EPA SW-846 Y Y N N
Particle-size distribution
CVO Settling velocity Guy (1969) Y Y N N
A high-purity commercial fine silica sand (particle size ≤120 µm, Lane Mountain, Valley, Washington) was obtained to repeat the blank test using a reference sediment containing lower concentrations of inorganic compounds than the river sediment. The commercial silica sand was burned in the muffle furnace at 450 °C for 6 hours. After cooling, the sediment was separated into two subsamples (source blank and equipment blank).
Both pairs of samples were analyzed for a large suite of organic and inorganic compounds at three laboratories including the USGS NWQL and two Washington State-accredited laboratories (WA 1 and WA 2). Samples were also analyzed for PSD at the USGS Cascades Volcano Observatory Sediment Laboratory (Guy, 1969). A summary of analytical methods is presented in table 5.

20 Continuous-Flow Centrifugation to Collect Suspended Sediment for Chemical Analysis
Table 6. Compounds detected in both equipment blank samples at concentrations greater than two times the corresponding source blank sample concentration.
[Source data: Appendix A, table A1; Conn and Black (2014, table A4); and Conn and others (2015, table A11). CAS Registry Number: Chemical Abstracts Service (CAS) Registry Number® (RN) is a registered trademark of the American Chemical Society. CAS recommends the verification of CASRNs through CAS Client ServicesSM. Method: EPA, U.S. Environmental Protection Agency’s SW 846; SIM, select ion monitoring. Unit: µg/kg, microgram per kilogram; ng/kg, nanogram per kilogram. Sample type: River samples were from the Puyallup River, Washington. Q, qualifier (blank cells indicate an unqualified detection). J, estimated, result between the detection level and reporting level; NJ, result did not meet all quantitation criteria (an estimated maxiumum possible concentration is reported in Result column) U, not detected above the reporting level (reported in the Result column); UJ, not detected above the detection level (reported in the Result column). Abbreviations: na, not applicable; PCBs, polychlorinated biphenyls]
Parameter nameCAS
Registry Number
Method Unit
Sample type
River source blank
River equipment
blank
Commercial silica source
blank
Commercial silica equipment
blank
Result Q Result Q Result Q Result Q
Washington State-accredited laboratory 1
Fluoranthene 206-44-0 EPA 8270D SIM
µg/kg 0.5 U 2.93 0.5 U 0.49 J
Naphthalene 91-20-3 EPA 8270D SIM
µg/kg 0.73 U 1.47 0.6 U 0.71
Phenanthrene 85-01-8 EPA 8270D SIM
µg/kg 0.5 U 2.98 0.5 U 0.54
Pyrene 129-00-0 EPA 8270D SIM
µg/kg 0.5 U 3.07 0.5 U 0.44 J
Total organic carbon na PSEP (1986) percent 0.037 0.279 0.02 U 0.033
Washington State-accredited laboratory 2
1,2,3,4,6,7,8,9-Octachlorodibenzofuran 39001-02-0 EPA 1613B ng/kg 0.051 UJ 0.074 J 0.049 UJ 0.050 J1,2,3,4,6,7,8-Heptachlorodibenzo-p-
dioxin35822-46-9 EPA 1613B ng/kg 0.051 UJ 0.057 J 0.068 J 0.119 J
PCB-016 38444-78-9 EPA 1668C ng/kg 1.73 UJ 0.236 0.092 UJ 0.116 JPCB-042 36559-22-5 EPA 1668C ng/kg 1.59 UJ 0.131 0.288 NJ 0.093 JPCB-048 70362-47-9 EPA 1668C ng/kg 1.5 UJ 0.116 J 0.15 NJ 0.065 JPCB-092 52663-61-3 EPA 1668C ng/kg 1.83 UJ 0.115 J 0.24 NJ 0.084 J
Eleven (of more than 400) parameters were detected above the detection level in both equipment blank samples at concentrations greater than two times the corresponding source blank sample concentration (tables 6 and A1, A2, and A3). Four PAHs analyzed using a low-level method (fluoranthene, naphthalene, phenanthrene, and pyrene), and total organic carbon were detected by WA 1. Compounds not detected above the reporting level by this laboratory are U-qualified and the reporting level is shown in the Result column (tables 6 and A2). Results that are estimated because the concentration is below the reporting level and above the detection level are J-qualified.
Two dioxins/furans and four PCB congeners were detected by WA 2 (tables 6 and A3) in both equipment blank samples and were not detected (or did not meet quantification criteria, NJ-qualified) in the corresponding source blank sample: 1,2,3,4,6,7,8,9-octachlorodibenzofuran, 1,2,3,4,6,7,8-heptachlorodibenzo-p-dioxin, PCB-016, PCB-042, PCB-048, and PCB-092 —at individual
concentrations less than 0.3 ng/kg. For these high-resolution mass spectrometry methods, compounds not detected above the detection level are UJ-qualified and the detection level is shown in the Result column (tables 6 and A3). A raised PCB reporting level for the Puyallup River sediment source blank sample precluded comparison to the corresponding river sediment equipment blank sample. The PCB congener with the highest concentration in any of the four blank samples was PCB-11 at 5.87 ng/kg in the Puyallup River sediment equipment blank sample, which was more than four times higher than any other PCB congener concentration (table A3). PCB-11 is not a major component of historical Aroclor mixtures and instead is currently produced during the manufacture of various products including diarylide yellow pigments used in printed inks and paints (Rodenburg and others, 2015). These yellow pigments have been found in numerous Washington State consumer products, such as food packaging, paint, and yellow notepads (Stone, 2014).
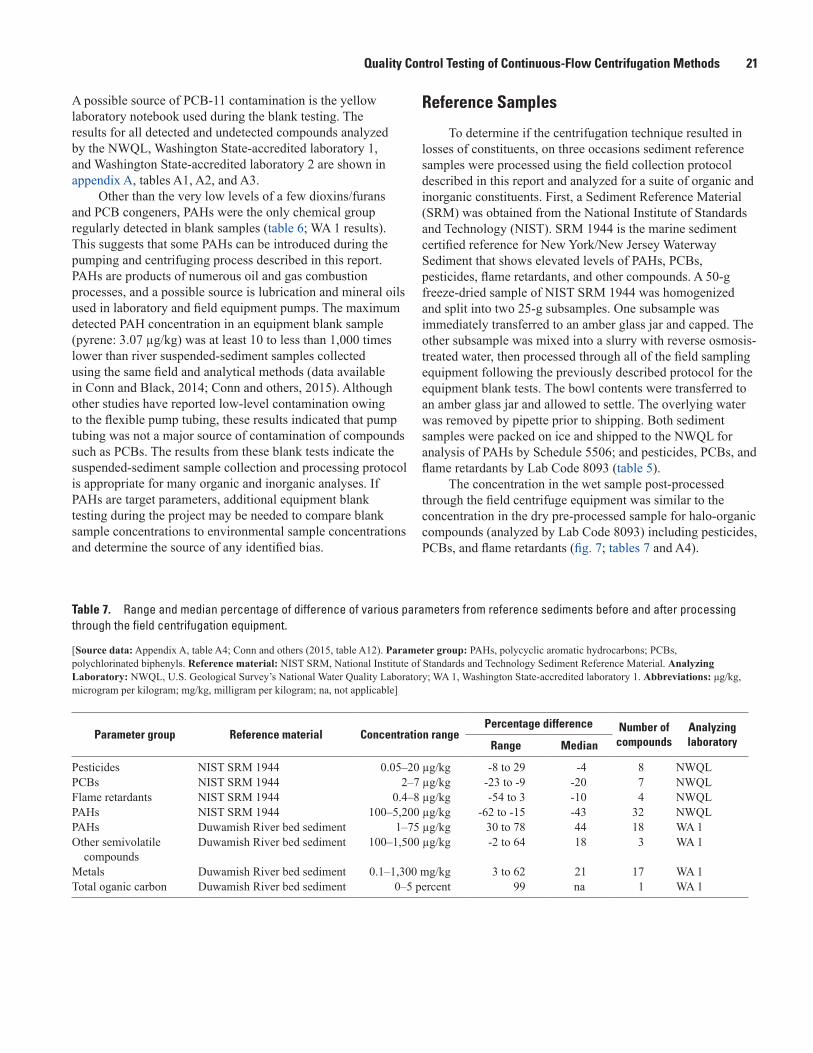
Quality Control Testing of Continuous-Flow Centrifugation Methods 21
Table 7. Range and median percentage of difference of various parameters from reference sediments before and after processing through the field centrifugation equipment.
[Source data: Appendix A, table A4; Conn and others (2015, table A12). Parameter group: PAHs, polycyclic aromatic hydrocarbons; PCBs, polychlorinated biphenyls. Reference material: NIST SRM, National Institute of Standards and Technology Sediment Reference Material. Analyzing Laboratory: NWQL, U.S. Geological Survey’s National Water Quality Laboratory; WA 1, Washington State-accredited laboratory 1. Abbreviations: μg/kg, microgram per kilogram; mg/kg, milligram per kilogram; na, not applicable]
Parameter group Reference material Concentration rangePercentage difference Number of
compoundsAnalyzing laboratoryRange Median
Pesticides NIST SRM 1944 0.05–20 µg/kg -8 to 29 -4 8 NWQLPCBs NIST SRM 1944 2–7 µg/kg -23 to -9 -20 7 NWQLFlame retardants NIST SRM 1944 0.4–8 µg/kg -54 to 3 -10 4 NWQLPAHs NIST SRM 1944 100–5,200 µg/kg -62 to -15 -43 32 NWQLPAHs Duwamish River bed sediment 1–75 µg/kg 30 to 78 44 18 WA 1Other semivolatile
compoundsDuwamish River bed sediment 100–1,500 µg/kg -2 to 64 18 3 WA 1
Metals Duwamish River bed sediment 0.1–1,300 mg/kg 3 to 62 21 17 WA 1Total oganic carbon Duwamish River bed sediment 0–5 percent 99 na 1 WA 1
A possible source of PCB-11 contamination is the yellow laboratory notebook used during the blank testing. The results for all detected and undetected compounds analyzed by the NWQL, Washington State-accredited laboratory 1, and Washington State-accredited laboratory 2 are shown in appendix A, tables A1, A2, and A3.
Other than the very low levels of a few dioxins/furans and PCB congeners, PAHs were the only chemical group regularly detected in blank samples (table 6; WA 1 results). This suggests that some PAHs can be introduced during the pumping and centrifuging process described in this report. PAHs are products of numerous oil and gas combustion processes, and a possible source is lubrication and mineral oils used in laboratory and field equipment pumps. The maximum detected PAH concentration in an equipment blank sample (pyrene: 3.07 µg/kg) was at least 10 to less than 1,000 times lower than river suspended-sediment samples collected using the same field and analytical methods (data available in Conn and Black, 2014; Conn and others, 2015). Although other studies have reported low-level contamination owing to the flexible pump tubing, these results indicated that pump tubing was not a major source of contamination of compounds such as PCBs. The results from these blank tests indicate the suspended-sediment sample collection and processing protocol is appropriate for many organic and inorganic analyses. If PAHs are target parameters, additional equipment blank testing during the project may be needed to compare blank sample concentrations to environmental sample concentrations and determine the source of any identified bias.
Reference Samples
To determine if the centrifugation technique resulted in losses of constituents, on three occasions sediment reference samples were processed using the field collection protocol described in this report and analyzed for a suite of organic and inorganic constituents. First, a Sediment Reference Material (SRM) was obtained from the National Institute of Standards and Technology (NIST). SRM 1944 is the marine sediment certified reference for New York/New Jersey Waterway Sediment that shows elevated levels of PAHs, PCBs, pesticides, flame retardants, and other compounds. A 50-g freeze-dried sample of NIST SRM 1944 was homogenized and split into two 25-g subsamples. One subsample was immediately transferred to an amber glass jar and capped. The other subsample was mixed into a slurry with reverse osmosis-treated water, then processed through all of the field sampling equipment following the previously described protocol for the equipment blank tests. The bowl contents were transferred to an amber glass jar and allowed to settle. The overlying water was removed by pipette prior to shipping. Both sediment samples were packed on ice and shipped to the NWQL for analysis of PAHs by Schedule 5506; and pesticides, PCBs, and flame retardants by Lab Code 8093 (table 5).
The concentration in the wet sample post-processed through the field centrifuge equipment was similar to the concentration in the dry pre-processed sample for halo-organic compounds (analyzed by Lab Code 8093) including pesticides, PCBs, and flame retardants (fig. 7; tables 7 and A4).

22 Continuous-Flow Centrifugation to Collect Suspended Sediment for Chemical Analysis
tac16-1113_fig 07
PesticidesFlame
retardantsPCBs PAHs
Hexa
chlo
robe
nzen
ePe
ntac
hlor
oani
sole
Dech
lora
ne P
lus
cis-
Chlo
rdan
etra
ns-C
hlor
dane
cis-
Non
achl
ortra
ns-N
onac
hlor
p,p'
-DDE
PCB
146
PCB
151
PCB
174
PCB
177
PCB
183
PCB
194
PCB
206
BTBP
EPB
DE
183
PBD
E 15
3PB
DE
154
1,2,
4-Tr
ichl
orob
enze
ne1,
2-Di
met
hyln
apht
hale
ne1,
6-Di
met
hyln
apht
hale
ne1-
Met
hyl-9
H-flu
oren
e1-
Met
hylp
hena
nthr
ene
1-M
ethy
lpyr
ene
2,3,
6-Tr
imet
hyln
apht
hale
ne2,
6-Di
met
hyln
apht
hale
ne2-
Ethy
lnap
htha
lene
2-M
ethy
lant
hrac
ene
4H-C
yclo
pent
a[de
f]phe
nant
hren
eAc
enap
hthe
neAc
enap
hthy
lene
Anth
race
neAn
thra
quin
one
Benz
o(a)
anth
race
neBe
nzo(
a)py
rene
Benz
o[b]
fluor
anth
ene
Benz
o(e)
pyre
neBe
nzo(
ghi)p
eryl
ene
Benz
o(k)
fluor
anth
ene
Bis(
2-et
hylh
exyl
)pht
hala
teCa
rbaz
ole
Chry
sene
Dibe
nzot
hiop
hene
Fluo
rant
hene
Fluo
rene
Inde
no(1
,2,3
-cd)
pyre
neN
apht
hale
nePe
ryle
nePh
enan
thre
nePy
rene
-70
-60
-50
-40
-30
-20
-10
10
20
30
40
Perc
enta
ge o
f diff
eren
ce
0 6
29
9
3 0
8 7 6
23
9
20 2217 16
23
54
3 0
2015
4540
3642
50 50
38 39 37
45 43
50
42
59
44
54
40
55
40
62
4046
34
49 4741 42
18
5448 47
- -- - -
-
-
- -- -
-
-
--
--
--
- -
- - -
- -
-
-
-
-
-
-
-
-
-
--
-
- -- -
-
-- -
Figure 7. Percentage of difference of pesticides, polychlorinated biphenyls (PCBs), flame retardants, and polycyclic aromatic hydrocarbons (PAHs) in the National Institute of Standards and Technology Sediment Reference Material 1944 before and after processing through the field centrifugation equipment. Source data: Appendix A, table A4.
Percentage differences between the pre-processed and post-processed sample concentration were calculated as: Percentage Difference = (Post – Pre) / Pre × 100, where a negative value indicates the post-processed sample concentration was less than the pre-processed sample concentration. For pesticides, PCBs, and flame retardants (analyzed by Lab Code 8093), percentage differences ranged from -23 to +29 percent, with the exception of 1,2-bis(2,4,6-tribromophenoxy)ethane (-54 percent, concentration decreased from an estimated 1.4 mg/kg to an estimated 0.65 mg/kg). In contrast, reported concentrations of PAHs (analyzed by Schedule 5506) in the wet processed sample were much lower than reported concentrations in the dry reference sample. Percent differences ranged from -62 to -15 percent, with a median of -43 percent difference (fig. 7; tables 7 and A4). PAHs are semivolatile compounds with Henry’s law constants ranging from 10-4 to 10-8 atmosphere cubic meters per mole. Some losses of the more volatile of the semivolatile compounds may occur during the turbulent pumping and centrifuging process. In addition, there were no replicate samples and the low PAH recoveries may have been an analytical artifact, such as extraction inefficiency caused by the differences between a wet and dry sample. The low PAH recoveries also may be a function of increased analytical variability for heterogeneous sediment samples.
The recovery tests were repeated on two occasions using sediment collected from the Duwamish River, Washington, that is known to contain various organic and inorganic constituents at lower, more regionally-relevant levels than the NIST SRM (which had PAH concentrations generally hundreds to thousands of micrograms per kilogram). Environmentally relevant reference sites or samples should be selected to meet project objectives, especially for long-term monitoring sites. In Experiment 1, a split of 2 mm-sieved bed sediment material was mixed into a slurry with reverse osmosis-purified water and processed through the suspended-sediment sampling equipment. Compound recovery was assessed by comparing the centrifuged sample results to results from the bed sediment material sieved to less than 2 mm only and additionally sieved to less than 62.5 µm. Experiment 2 was identical to Experiment 1 except that the centrifuged sample was subsequently sieved to less than 62.5 µm to facilitate comparison to a 62.5 µm-sieved bed sediment subsample. Samples were analyzed by WA 1 for total organic carbon, hexavalent chromium, metals, pesticides, butyl tins, PAHs and other semi-volatile organic compounds, volatile organic compounds, and PSD (table 5).

Quality Control Testing of Continuous-Flow Centrifugation Methods 23
tac16-1113_fig 08
PAHs MetalsOthersemi-
volatiles
Perc
enta
ge o
f diff
eren
ce
1-M
ethy
lnap
htha
lene
2-M
ethy
lnap
htha
lene
Acen
apht
hene
Acen
apht
hyle
neAn
thra
cene
Benz
o(a)
anth
race
neBe
nzo(
a)py
rene
Benz
o(gh
i)per
ylen
eCh
ryse
neDi
benz
(ah)
anth
race
neDi
benz
ofur
anFl
uora
nthe
neFl
uore
neIn
deno
(1,2
,3-c
d)py
rene
Nap
htha
lene
Phen
anth
rene
Pyre
neTo
tal b
enzo
fluor
anth
enes
Benz
oic
Acid
Benz
yl A
lcoh
olBi
s(2-
Ethy
lhex
yl)p
htha
late
Arse
nic
Bariu
mBe
rylli
umCa
dmiu
mCh
rom
ium
Coba
ltCo
pper
Lead
Man
gane
seM
ercu
ryM
olyb
denu
mN
icke
lSe
leni
umSi
lver
Thal
lium
Vana
dium
Tota
l org
anic
car
bon
-20
0
20
40
60
80
100
120
Zinc
31.4
61.9
36.6
54.2
32.9
48.6
30.0
43.051.8
40.638.9
77.8
39.645.7
70.6
39.7
59.657.5
18.2
2.1
63.6
23.916.0
22.7
61.9
19.4
20.5
21.625.9
38.9
8.3
22.720.020.0
38.5
3.3
15.911.1
99.3
-
Figure 8. Percentage of difference of polycyclic aromatic hydrocarbons (PAHs), other semivolatile compounds, metals, and total organic carbon in bed-sediment samples before and after processing through the field centrifugation equipment in Experiments 1 and 2, Duwamish River, Washington. Source data: Appendix A, table A4; Conn and others (2015, table A12).
Concentrations in samples processed through the centrifugation equipment were similar to or greater than concentrations in pre-processed samples during Duwamish sediment experiments 1 and 2 for PAHs and other semivolatile compounds, metals, and total organic carbon (fig. 8; tables 7 and A5). Compounds that were not detected, and therefore, for which recovery could not be assessed, included butyl tins, pesticides, and many volatile organic compounds and semivolatile organic compounds. The three detected volatile organic compounds in the bed sediment (methylene chloride, acetone, and 2-butanone) appear to have been lost, as expected for volatile compounds during the centrifugation process. Some semivolatile compounds such as benzoic acid and benzyl alcohol appear to have been lost during Experiment 1, although it may have been an artifact of elevated reporting levels for the centrifuged sample, as the median percentage difference was 18 percent for these semivolatile compounds during Experiment 2. Concentrations in the centrifuged sample were greater than concentrations in the bulk (< 2 mm) bed sediment sample in Experiment 1. This is attributed to the change in PSD from 17 percent fines in the bed sediment
sample to 75 percent fines in the centrifuged sample. Organic compounds preferentially sorb to fine-grained sediments with high organic carbon content as compared to bulk bed sediment. Centrifuged results compared more closely with the <62.5 µm bed sediment sample than with the < 2 mm sample. For example, there was -36–25 percent difference of metals from the fine bed sediment sample as compared to 36–150 percent difference from the bulk bed sediment sample in Experiment 1. When the fine fraction of both samples was compared (Experiment 2), percent difference of individual compounds ranged from -2 to 78 percent, which is on the high end of, though within, the range of expected differences for laboratory-control sediment samples. As compared to water samples, there is a wider range of acceptable criteria for sediment matrix spike-type recovery samples because of the difficulty in getting repeatable sediment results. This is attributed to the heterogeneous sample matrix (American Society for Testing and Materials International, 2015) and matrix effects during extraction and analysis (for example, Hawthorne and others, 2000). Subsamples may vary in moisture content, grain size, and chemical composition.
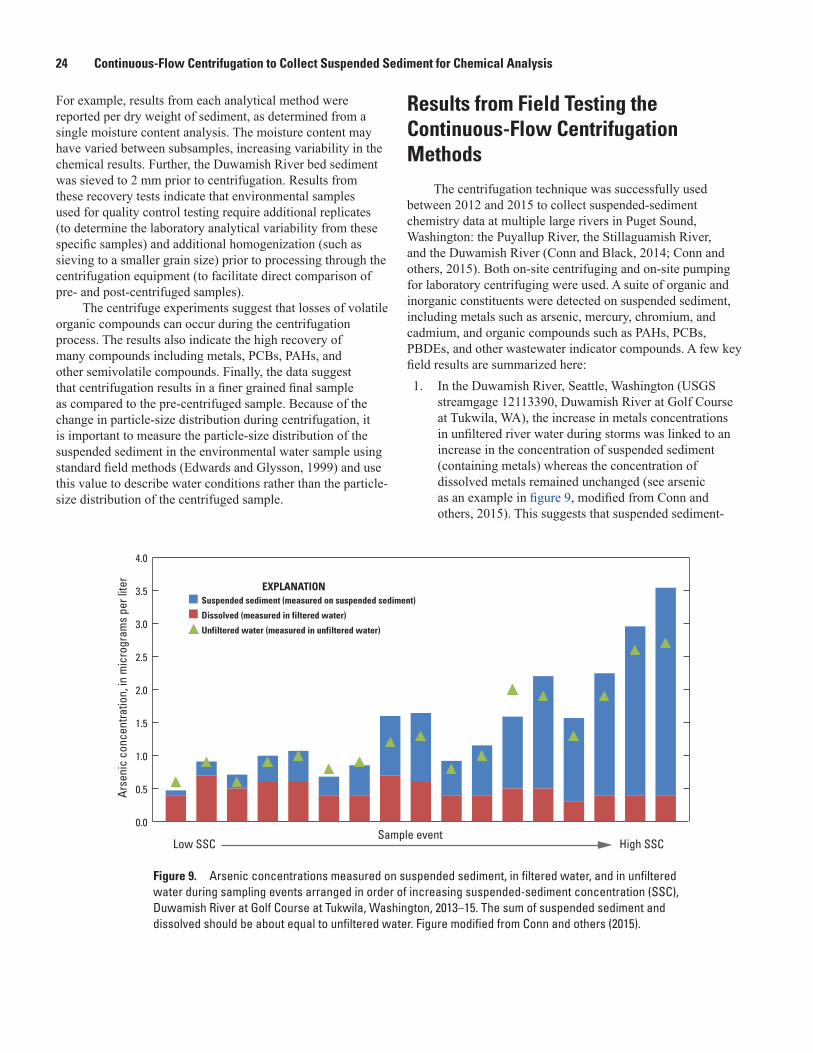
24 Continuous-Flow Centrifugation to Collect Suspended Sediment for Chemical Analysis
For example, results from each analytical method were reported per dry weight of sediment, as determined from a single moisture content analysis. The moisture content may have varied between subsamples, increasing variability in the chemical results. Further, the Duwamish River bed sediment was sieved to 2 mm prior to centrifugation. Results from these recovery tests indicate that environmental samples used for quality control testing require additional replicates (to determine the laboratory analytical variability from these specific samples) and additional homogenization (such as sieving to a smaller grain size) prior to processing through the centrifugation equipment (to facilitate direct comparison of pre- and post-centrifuged samples).
The centrifuge experiments suggest that losses of volatile organic compounds can occur during the centrifugation process. The results also indicate the high recovery of many compounds including metals, PCBs, PAHs, and other semivolatile compounds. Finally, the data suggest that centrifugation results in a finer grained final sample as compared to the pre-centrifuged sample. Because of the change in particle-size distribution during centrifugation, it is important to measure the particle-size distribution of the suspended sediment in the environmental water sample using standard field methods (Edwards and Glysson, 1999) and use this value to describe water conditions rather than the particle-size distribution of the centrifuged sample.
Results from Field Testing the Continuous-Flow Centrifugation Methods
The centrifugation technique was successfully used between 2012 and 2015 to collect suspended-sediment chemistry data at multiple large rivers in Puget Sound, Washington: the Puyallup River, the Stillaguamish River, and the Duwamish River (Conn and Black, 2014; Conn and others, 2015). Both on-site centrifuging and on-site pumping for laboratory centrifuging were used. A suite of organic and inorganic constituents were detected on suspended sediment, including metals such as arsenic, mercury, chromium, and cadmium, and organic compounds such as PAHs, PCBs, PBDEs, and other wastewater indicator compounds. A few key field results are summarized here: 1. In the Duwamish River, Seattle, Washington (USGS
streamgage 12113390, Duwamish River at Golf Course at Tukwila, WA), the increase in metals concentrations in unfiltered river water during storms was linked to an increase in the concentration of suspended sediment (containing metals) whereas the concentration of dissolved metals remained unchanged (see arsenic as an example in figure 9, modified from Conn and others, 2015). This suggests that suspended sediment-
tac16-1113_fig 09
0.0
0.5
1.0
1.5
2.0
2.5
3.0
3.5
4.0
Arse
nic
conc
entra
tion,
in m
icro
gram
s pe
r lite
r
Sample eventHigh SSCLow SSC
Suspended sediment (measured on suspended sediment)
Dissolved (measured in filtered water)
Unfiltered water (measured in unfiltered water)
EXPLANATION
Figure 9. Arsenic concentrations measured on suspended sediment, in filtered water, and in unfiltered water during sampling events arranged in order of increasing suspended-sediment concentration (SSC), Duwamish River at Golf Course at Tukwila, Washington, 2013–15. The sum of suspended sediment and dissolved should be about equal to unfiltered water. Figure modified from Conn and others (2015).

Results from Field Testing the Continuous-Flow Centrifugation Methods 25
tac16-1113_fig 10
cPAH
con
cent
ratio
n, in
nan
ogra
ms
per l
iter
Sample eventHigh SSCLow SSC
EXPLANATION
0
20
40
60
80
100
120
140
160
Suspended sediment
Unfiltered water
Unfiltered water (not detected)
Figure 10. Carcinogenic polycyclic aromatic hydrocarbon (cPAH) concentrations measured on suspended sediment and in unfiltered water during sampling events arranged in order of increasing suspended-sediment concentration (SSC), Duwamish River at Golf Course at Tukwila, Washington, 2013–15. Data from Conn and Black (2014) and Conn and others (2015).
bound chemicals are an important fraction to be considered when assessing downstream chemical loading and exposure. In this case, the same conclusion could have been made from comparing the filtered and unfiltered water results, but for other chemicals or other sites, there may not be enough sediment in a typical unfiltered water sample to positively detect and quantify concentrations of chemicals of concern, as described in the following result.
2. Compounds were more frequently detected in centrifuged suspended-sediment samples than in corresponding unfiltered water samples. For example, in the Duwamish River, Seattle, Washington (Conn and Black, 2014; Conn and others, 2015), carcinogenic PAHs were infrequently detected in unfiltered water samples (4 of 19 samples) but were detected in all 19 corresponding suspended-sediment samples (fig. 10). This suggests that chemical load estimates based on unfiltered water concentrations may underestimate actual chemical loads for certain chemicals. Previous studies have reported similar results for trace elements (Horowitz, 2009), PCBs, and PAHs (Zgheib and Moilleron, 2011).
3. The sediment-bound chemical concentrations varied over orders of magnitude between sampling events, as affected by multiple interacting environmental variables such as sediment source, seasonality, and antecedent conditions. The suspended sediment-bound chemical concentrations often were not related to streamflow or SSC. For example, PCB concentrations ranged from less than 1 µg/kg to greater than 80 µg/kg dry weight on suspended sediment, with the highest concentrations during low-flow summer and early autumn storm runoff events (Conn and others, 2015).
4. When compared with nearby surface (top 5 cm) bed sediment chemical concentrations (table 8), the percentage of median suspended sediment-bound chemical concentrations of select parameters were greater than median bed sediment concentrations. Concentrations on the suspended sediment, which was 80 percent fine sediment (<62.5 µm), compared more closely with the fine bed sediment (<62.5 µm) fraction than with bulk bed sediment (<2 mm). Surface fine-grained bed sediment chemical concentrations may serve as a better surrogate for average suspended sediment chemical concentrations than bulk bed sediment chemical concentrations. However, bed-surface

26 Continuous-Flow Centrifugation to Collect Suspended Sediment for Chemical Analysis
fine-grained sediment will not capture the full range of suspended sediment-bound chemical concentrations and fluxes at a site, for example, a concentration spike during a storm runoff event (Horowitz, 2009).
5. Even when chemical concentrations on suspended sediment are low, chemical fluxes to downstream receiving waters can be very high during high SSC or high discharge conditions. For example, median PCB concentrations on Duwamish River suspended sediment were low (0.869 µg/kg dry weight) during periods when large volumes of water and suspended sediment were being released from behind a dam in the upper watershed as compared to storm events (median storm PCB concentration = 15.8 µg/kg dry weight). However, estimated PCB fluxes were two times higher during dam release periods, attributed to high SSC and high discharge, than during the storm periods (Conn and others, 2015).
SummarySuspended sediment-bound chemical concentration
data are scarce, and more data are needed to fully understand chemical fluxes to receiving waters and contaminant exposure risk. As a result of small water sample volumes and analytical limitations, water samples that meet regulatory standards have the potential to cause adverse effects on exposed organisms because of undetected concentrations of chemicals bound to suspended sediment. The fine, colloidal material that remains suspended in the water column may contribute a substantial portion of chemical concentration, because chemical sorption
Table 8. Comparison of median percentage of fine sediment and median concentration of select analytes on suspended sediment as compared to nearby bed sediment, Duwamish River at Golf Course at Tukwila, Washington, 2013–15.
[Data from Conn and Black (2014) and Conn and others (2015). Concentrations reported on a dry weight basis. Analyte: Total PCBs, sum of 209 polychlorinated biphenyl congeners; cPAHs, summed concentration of benzo(a)anthracene, chrysene, benzo(a)pyrene, indeno(1,2,3-c,d)pyrene, dibenz(a,h)anthracene, and total benzofluoranthenes (sum of b-, j-, and k- isomers); Dioxins/furans, sum of 17 toxic dioxins and furans. Unit: µg/kg, microgram per kilogram; µg TEQ/kg, microgram toxic equivalent per kilogram; ng TEQ/kg, nanogram toxic equivalent per kilogram. Abbreviations: mm, millimeter; n, number of samples; µm, micrometer; <, less than]
Analyte Unit
Median percent or concentration
Suspended sediment (n=20–22)
Fine bed sediment, <62.5 µm
(n=7)
Bulk bed sediment,
<2 mm (n=10)
Fine sediment (<62.5 µm) percent of total 80.0 98.6 20.2Total PCBs µg/kg 7.93 6.27 2.01Arsenic µg/kg 12.7 10.2 5.2cPAHs µg TEQ/kg 39.9 18.3 12.3Dioxins/furans ng TEQ/kg 3.25 2.62 0.568
increases as particle size decreases for many organic and inorganic chemicals. A protocol was developed to collect fluvial suspended sediment of sufficient quality and quantity for analysis of a variety of organic and inorganic constituents. A large volume of water (hundreds to thousands of liters) is pumped through a continuous-flow centrifuge to capture the suspended sediment. The final composite sediment sample is submitted for chemical analysis, similar to a bed-material sample.
The centrifuge used during method development has the advantages of being lightweight, portable, and powered by a 110 volt alternating current inverter, and therefore, can be used in many water-quality applications that include: (1) a laboratory, (2) a stream-side hutch, and (3) a mobile trailer to supplement traditional water-quality sampling. The centrifuge used for this study had a small capacity and a high efficiency capture
rate; that is, a flow rate of 600 mL/min resulted in greater than 90 percent sediment capture by weight, and a single centrifuge bowl could accumulate about 15 g at a time. This could result in long processing time requirements, depending on river conditions and analytical needs, which must be considered against sample holding times, personnel availability, and project budget.
Quality-control testing confirmed the applicability of the method protocol for collecting samples for many metals and organic constituents including pesticides, PCBs, and PBDEs. Low levels of PAHs may be introduced during sample collection, and equipment blank testing should be conducted prior to new sampling. Volatile compounds and some semi-volatile compounds may be lost during the turbulent pumping, open-air settling, and centrifuging processes. The particle-size distribution inherently transitions to a more fine-grained sample during centrifugation, and this must be considered when extrapolating chemical concentrations on the centrifuged sediment sample to the environmental system.
Suspended sediment-bound chemical concentrations can provide important new data to understand spatial and temporal variations in chemical concentrations attributed to climate, seasonality, land use, and other environmental drivers. The data may be used to support management decisions, targeting certain conditions that introduce chemical-laden sediment to a system. When coupled with streamflow and sediment flux data, they will improve the accuracy of estimates of chemical fluxes to downstream receiving environments, which historically has been estimated from water or surface bed-material samples. The improved chemical flux estimates will aid in assessing the importance and impacts of suspended sediment-bound chemicals as a pathway for toxic chemicals into downstream freshwater and coastal marine ecosystems.

References Cited 27
Acknowledgments This work was funded through the Puget Sound
demonstration project of the National Water Quality Monitoring Network of U.S. Coastal Waters and their Tributaries, under direction to the National Water Quality Monitoring Council from the Advisory Committee on Water Information. This work also was funded through two cooperative agreements between the USGS and the Washington State Department of Ecology (Interagency Agreements 13WNWA30005 and 14WNWA30005). We are very grateful to Curt Chandler and staff at the Foster Golf Course in Tukwila, Washington, for access and use of the bridge and facilities throughout the project. The following USGS employees and volunteers provided invaluable field and laboratory help: Andrew Gendaszek, Raegan Huffman, Greg Justin, Cameron Marshall, Karen Payne, Amber Powell, Stephen Sissel, Andrew Spanjer, David Steele, Alison Tecca, and Ann Vanderpool-Kimura.
References Cited
Advisory Committee on Water Information (ACWI), 2006, A national water quality monitoring network for U.S. coastal waters and their tributaries: Prepared by The Advisory Committee on Water Information, and the National Water Quality Monitoring Council, 50 p., accessed August 8, 2015, at: http://acwi.gov/monitoring/network/design/.
American Society for Testing and Materials International, 2015, Standard practice for preparation of sediment samples for chemical analysis: ASTM D3976-92(2015).
Baborowski, M., Claus, E., Friese, K., von der Kammer, F., Kasimir, P., Pelzer, J., and Heininger, P., 2005, Comparison of different monitoring programs of the 2002 summer flood in the River Elbe, Acta Hyrochimica et Hydrobiologia, v. 33, p. 404–417.
Bunte, Kristin; Swingle, K.W., and Abt, S.R., 2007, Guidelines for using bedload traps in coarse-bedded mountain streams—Construction, installation, operation, and sample processing:Fort Collins, Colorado, U.S. Department of Agriculture, Forest Service, Rocky Mountain Research Station, General Technical Report RMRS-GTR-191, 91 p., accessed November 10, 2016, at http://www.fs.fed.us/rm/pubs/rmrs_gtr191.pdf.
Burkhardt, M.R., Zaugg, S.D., Smith, S.G., and ReVello, R.C., 2006, Determination of wastewater compounds in sediment and soil by pressurized solvent extraction, solid-phase extraction, and capillary-column gas chromatography/mass spectrometry: U.S. Geological Survey Techniques and Methods, book 5, chap. B2, 40 p., accessed November 10, 2016, at http://pubs.usgs.gov/tm/2006/tm5b2/.
Conn, K.E., and Black, R.W., 2014, Data compilation for assessing sediment and toxic chemical loads from the Green River to the lower Duwamish Waterway, Washington: U.S. Geological Survey Data Series 880, 46 p., accessed November 10, 2016, at http://dx.doi.org/10.3133/ds880.
Conn, K.E., Black, R.W., Vanderpool-Kimura, A.M., Foreman, J.R., Peterson, N.T., Senter, C.A., and Sissel, S.K., 2015, Chemical concentrations and instantaneous loads, Green River to the Lower Duwamish Waterway near Seattle, Washington, 2013–15: U.S. Geological Survey Data Series 973, 46 p., accessed November 10, 2016, at http://dx.doi.org/10.3133/ds973.
Davis, B.E., 2005, A guide to the proper selection and use of federally approved sediment and water-quality samplers: U.S. Geological Survey Open-File Report 2005–1087, 20 p., accessed November 10, 2016, at http://pubs.usgs.gov/of/2005/1087/.
Edwards, T.K., and Glysson, G.D., 1999, Field methods for measurement of fluvial sediment: U.S. Geological Survey Techniques of Water-Resources Investigations, book 3, chap. C2, accessed June 13, 2016, at https://pubs.er.usgs.gov/publication/twri03C2.
Elith, J., Leathwick, J.R., and Hastie, T., 2008, A working guide to boosted regression trees: Journal of Animal Ecology, v. 77, p. 802–813.
Foreman, W.T., Gray, J.L., ReVello, R.C., Lindley, C.E., Losche, S.A., and Barber, L.B., 2012, Determination of steroid hormones and related compounds in filtered and unfiltered water by solid-phase extraction, derivatization, and gas chromatography with tandem mass spectrometry: U.S. Geological Survey Techniques and Methods, book 5, chap. B9, 118 p., accessed November 10, 2016, at http://pubs.usgs.gov/tm/5b9/.
Garbarino, J.R., Kanagy, L.K., and Cree, M.E., 2006, Determination of elements in natural-water, biota, sediment and soil samples using collision/reaction cell inductively coupled plasma-mass spectrometry: U.S. Geological Survey Techniques and Methods, book 5, chap. B1, 88 p., accessed November 10, 2016, at https://pubs.er.usgs.gov/publication/tm5B1.

28 Continuous-Flow Centrifugation to Collect Suspended Sediment for Chemical Analysis
Gellis, A.C., Hupp, C.R., Pavich, M.J., Landwehr, J.M., Banks, W.S.L., Hubbard, B.E., Langland, J., Ritchie, J.C., and Reuter, J.M., 2009, Sources, transport, and storage of sediment at selected sites in the Chesapeake Bay Watershed: U.S. Geological Survey Scientific Investigations Report 2008–5186, 95 p., accessed November 10, 2016, at http://pubs.usgs.gov/sir/2008/5186/.
Gray, J.R., Glysson, G.D., Turcios, L.M., and Schwarz, G.E., 2000, Comparability of suspended-sediment concentration and total suspended solids data: U.S. Geological Survey Water Resources Investigations Report 00-4191, 20 p., accessed June 16, 2016, at thttps://pubs.er.usgs.gov/publication/wri004191.
Gries, T., and Sloan, J., 2009, Contaminant loading to the Lower Duwamish Waterway from suspended sediment in the Green River: Washington State Department of Ecology Publication 09-03-028, 118 p., accessed November 10, 2016, at https://fortress.wa.gov/ecy/publications/documents/0903028.pdf.
Guy, H.P., 1969, Laboratory theory and methods for sediment analysis: U.S. Geological Survey Techniques of Water-Resources Investigations, book 5, chap. C1, accessed September 10, 2013, at https://pubs.usgs.gov/twri/twri5c1/.
Hawthorne, S.B., Grabanski, C.B., Martin, E., and Miller, D.J., 2000, Comparisons of Soxhlet extraction, pressurized liquid extraction, supercritical fluid extraction and subcritical water extraction for environmental solids—Recovery, selectivity and effects on sample matrix: Journal of Chromatography A, v. 892, p. 421–433.
Horowitz, A.J., 2008, Determining annual suspended sediment and sediment-associated trace element and nutrient fluxes: Science of the Total Environment, v. 400, p. 315–343.
Horowitz, A.J., 2009, Monitoring suspended sediments and associated chemical constituents in urban environments—Lessons from the City of Atlanta, Georgia, USAWater Quality Monitoring Program: Journal of Soils and Sediments, v. 9. p. 342–363.
Horowitz, A.J., Elrick, K.A., and Hooper, R.C., 1989, A comparison of instrumental dewatering methods for the separation and concentration of suspended sediment for subsequent trace element analysis: Hydrological Processes, v. 2, p. 163–184.
Horowitz, A.J., Stephens, V.C., Elricki, K.A., and Smith, J.J., 2012, Concentrations and annual fluxes of sediment-associated chemical constituents from conterminous US coastal rivers using bed sediment data: Hydrological Processes, v. 26, 1,090–1,114.
Hsu, Fu-Chih, 2010, CFC Express—Portable continuous flow centrifuge: Science and Technology video, 7:03 minutes, posted August 27, 2010, accessed accessed November 9, 2016, at https://www.youtube.com/watch?v=t-w1xwb9fNQ.
Jackson, M.L., 1956, Soil chemical analysis—Advanced course: Madison, Wisconsin, published by the author, Department of Soil Science, University of Wisconsin-Madison, 991 p.
Karickhoff, S.W., Brown, D.S., and Scott, T.A., 1979, Sorption of hydrophobic pollutants on natural sediments: Water Research, v. 13, p. 241–248.
Landers, M.N., Straub, T.D., Wood, M.S., and Domanski, M.M., 2016, Sediment acoustic index method for computing continuous suspended-sediment concentrations: U.S. Geological Survey Techniques and Methods, book 3, chap. C5, 63 p., accessed September 20, 2016, at http://dx.doi.org/10.3133/tm3C5.
Lane, S.L., and Fay, R.G., 1997, Safety in field activities: U.S. Geological Survey Techniques of Water-Resources Investigations, book 9, chap. A9, accessed June 15, 2015, at http://pubs.water.usgs.gov/twri9A9/.
Ludwig, W., Probst, J.L., and Kempe, S., 1996, Predicting the oceanic input of organic carbon by continental erosion: Global Biogeochemical Cycles, v. 10, p. 23–41.
Milliman, J.D., and Farnsworth, K.L., 2011, River discharge to the coastal ocean: Cambridge, United Kingdom, Cambridge University Press, 384 p.
Milliman, J.D., and Meade, R.H., 1983, World-wide delivery of river sediment to the oceans: Journal of Geology, v. 91, p. 11–21.
Perks, M.T., Warburton, J., and Bracken, L., 2014, Critical assessment and validation of a time-integrating fluvial suspended sediment sampler: Hydrological Processes, v. 28, p. 4,795–4,807, DOI: 10.1002/hyp.9985.
Phillips, J.M., Russell, M.A., and Walling, D.E., 2000, Time-integrated sampling of fluvial suspended sediment—A simple methodology for small catchments: Hydrological Processes, v. 14, p. 2,489–2,602.
Puget Sound Estuary Program, 1986, Recommended protocols for measuring conventional sediment variables in Puget Sound: Bellevue, Wash., Tetra Tech, Inc., Prepared for U.S. Environmental Protection Agency and Puget Sound Water Quality Authority, 44 p.
References Cited 29
Rasmussen, P.P., Gray, J.R., Glysson, G.D., and Ziegler, A.C., 2009, Guidelines and procedures for computing time-series suspended-sediment concentrations and loads from in-stream turbidity-sensor and streamflow data: U.S. Geological Survey Techniques and Methods, book 3, chap. C4, 53 p., accessed November 10, 2016, at http://pubs.usgs.gov/tm/tm3c4/.
Rees, T.F., Lennheer, J.A., and Ranville, J.F., 1991, Use of a single-bowl continuous-flow centrifuge for dewatering suspended sediments—Effect on sediment physical and chemical characteristics: Hydrological Processes, v. 5, p. 201–214.
Rodenburg, L., Guo, J., and Christie, R., 2015, Polychlorinated biphenyls in pigments—Inadvertent production and environmental significance: Coloration Technology, v. 131, p. 353–369.
Rostad, C.E., Bishop, L.M., Ellis, G.S., Leiker, T.J., Monsterleet, S.G., and Pereira, W.E., 1998, Organic contaminants associated with suspended sediment collected during five cruises of the Mississippi River and its principal tributaries, May 1988 to June 1990: U.S. Geological Survey Open-File Report 93–360, 62 p., accessed January 6, 2016, at http://pubs.er.usgs.gov/publication/ofr93360.
Runkel, R.L., Crawford, C.G., and Cohn, T.A., 2004, Load estimator (LOADEST)—A FORTRAN program for estimating constituent loads in streams and rivers: U.S. Geological Survey Techniques and Methods, book 4, chap. A5, 69 p., accessed November 10, 2016, at https://pubs.er.usgs.gov/publication/tm4A5.
Singh, K.P., Malik, A., Sinha, S., Singh, V.K., and Murthy, R.C., 2005, Estimation of source of heavy metal contamination in sediments of Gomti River (India) using principal component analysis: Water, Air, and Soil Pollution, v. 166, p. 321–341.
Smalling, K.L., Reilly, T.J., Sandstrom, M.W., and Kuivila, K.M., 2013, Occurrence and persistence of fungicides in bed sediments and suspended solids from three targeted use areas in the United States: Science of the Total Environment, v. 447, p. 179–185.
Stone, A., 2014, Polychlorinated biphenyls (PCBs) in general consumer products: Washington State Department of Ecology 14-04-035, 64 p., accessed June 16, 2016, at https://fortress.wa.gov/ecy/publications/SummaryPages/1404035.html.
Swarzenbach, R.P., and Westall, J., 1981, Transport of nonpolar organic compounds from surface water to groundwater—Lab sorption studies: Environmental Science & Technology, v. 15, p. 1,360–1,367.
U.S. Commission on Ocean Policy, 2004, An ocean blueprint for the 21st century: Washington D.C., U.S. Commission on Ocean Policy, Final Report, ISBN#0–9759462–0–X, 676 p., accessed November 10, 2016, at http://www.oceancommission.gov.
U.S. Environmental Protection Agency, 2015, Wastes—Hazardous waste—Test methods—SW-846: U.S. Environmental Protection Agency Web page, accessed July 15, 2015, at http://www.epa.gov/wastes/hazard/testmethods/sw846/online/index.htm.
U.S. Geological Survey, variously dated, National field manual for the collection of water-quality data: U.S. Geological Survey Techniques of Water-Resources Investigations, book 9, chaps. A1–A10, available online at http://pubs.water.usgs.gov/twri9A.
U.S. Geological Survey, 2006, Collection of water samples (ver. 2.0): U.S. Geological Survey Techniques of Water-Resources Investigations, book 9, chap. A4, September 2006, accessed June 15, 2015, at http://pubs.water.usgs.gov/twri9A4/.
U.S. Geological Survey, 2011, Requirements for the proper shipping of samples to the National Water Quality Laboratory: U.S. Geological Survey National Water Quality Laboratory Technical Memorandum 2011.01, accessed December 13, 2016, at https://nwql.usgs.gov/tech_memos/nwql.2011-01.pdf.
U.S. Geological Survey, 2012, Update of policy on review and publication of discrete water data: U.S. Geological Survey Office of Water Quality Technical Memorandum 2012.03, accessed December 13, 2016, at https://water.usgs.gov/admin/memo/QW/qw12.03.pdf.
Wagner, R.J., Moran, P.W., Zaugg, S.D., Sevigny, J.M., and Pope, J.M., 2014, Contaminants of emerging concern in the lower Stillaguamish River Basin, Washington, 2008–11: U.S. Geological Survey Open-File Report 2014-1028, 8 p., accessed January 29, 2016, at http://dx.doi.org/10.3133/ofr20141028.
Washington State Department of Health, 2016, Fish Consumption Advisories: Website, accessed June 29, 2016, at http://www.doh.wa.gov/CommunityandEnvironment/Food/Fish/Advisories.
Wilde, F.D., ed., variously dated, Field measurements: U.S. Geological Survey Techniques of Water-Resources Investigations, book 9, chap. A6, with sec. 6.0–6.8, accessed June 15, 2015, at http://pubs.water.usgs.gov/twri9A6/.
Wilde, F.D., ed., 2004, Cleaning of equipment for water sampling (ver. 2.0): U.S. Geological Survey Techniques of Water-Resources Investigations, book 9, chap. A3, April 2004, accessed June 15, 2015, at http://pubs.water.usgs.gov/twri9A3/.
30 Continuous-Flow Centrifugation to Collect Suspended Sediment for Chemical Analysis
Wilde, F.D., 2005, Preparations for water sampling: U.S. Geological Survey Techniques of Water-Resources Investigations, book 9, chap. A1, January 2005, accessed June 15, 2015, at http://pubs.water.usgs.gov/twri9A1/.
Wilde, F.D., Radtke, D.B., Gibs, Jacob, and Iwatsubo, R.T., eds., 2004 with updates through 2009, Processing of water samples (ver. 2.2): U.S. Geological Survey Techniques of Water-Resources Investigations, book 9, chap. A5, April 2004, accessed June 15, 2015, at http://pubs.water.usgs.gov/twri9A5/.
Wilde, F.D., Sandstrom, M.W., and Skrobialowski, S.C., 2014, Selection of equipment for water sampling (ver. 3.1): U.S. Geological Survey Techniques of Water-Resources Investigations, book 9, chap. A2, April 2014, accessed June 15, 2015, at http://pubs.water.usgs.gov/twri9A2/.
Williamson, T.N., Christensen, V.G., Richardson, W.B., Frey, J.W., Gellis, A.C., Kieta, K.A., Fitzpatrick, F.A., 2014, Stream sediment sources in midwest agricultural basins with land retirement along channel: Journal of Environmental Quality, v. 43, p. 1,624–1,634.
Zaugg, S.D., Burkhardt, M.R., Burbank, T.L., Olsen, M.C., Iverson, J.L., and Schroeder, M.P., 2006, Determination of semivolatile organic compounds and polycyclic aromatic hydrocarbons in solids by gas chromatography/mass spectrometry: U.S. Geological Survey Techniques and Methods, book 5, chap. B3, 44 p., accessed November 10, 2016, at https://pubs.er.usgs.gov/publication/tm5B3.
Zgheib, S., and Moilleron, R., 2011, Partition of pollution between dissolved and particulate phases—What about emerging substances in urban stormwater catchments?: Water Research, v, 45, p. 913–925.

Appendixes 31
AppendixesAppendixes A–E are Excel or PDF files available for download at https://doi.org/10.3133/tm1D6.
Appendix A. Analytical Results from Quality-Control Testing the Continuous-Flow Centrifugation Methods
Appendix B. Equipment Checklist
Appendix C. Isco® 6712 Portable Sampler Program for “Baseline” Pump Operation
Appendix D. CFC Express Operating Steps and Helpful Hints
Appendix E. Example Field Form for Observations and Measurement Notes


Publishing support provided by the U.S. Geological SurveyScience Publishing Network, Tacoma Publishing Service Center
For more information concerning the research in this report, contact theDirector, Washington Water Science CenterU.S. Geological Survey934 Broadway, Suite 300Tacoma, Washington 98402http://wa.water.usgs.gov

Conn and others—Continuous-Flow
Centrifugation to Collect Suspended Sediment for Chem
ical Analysis—
Techniques and Methods 1–D6
ISSN 2328-7055 (online)https://doi.org/10.3133/tm1D6