Embed Size (px)
Citation preview
902 CHEMISTRY: VINOGRAD ET AL. PROC. N. A. S.
from that of Trillium. The influence of temperature is a very real possibility andis presently under investigation.
In conclusion it may be said that for diploid plants a relationship does exist be-tween the minimum mitotic cycle time, the interphase nuclear volume, and theDNA content per cell. Moreover, the relationship is such that if any one of thethree cell variables is known, an estimate can be made of the remaining two.Summary.-Experiments were performed to determine the relationship between
interphase nuclear volume and DNA content per cell and the minimum mitoticcycle time in several diploid plant species. All measurements were made onmeristem cells contained in the terminal 2 mm of the root. The results indicatedthat linear relationships exist between the interphase nuclear volume and theminimum mitotic cycle time, and between the DNA content per cell and the mini-mum cycle time. Linearity, however, does not exist if extrapolation is carried outto include the lower forms of life, such as bacteria and viruses. The relationshipsare to some extent independent of chromosome number and the amount of DNAper chromosome. The data presented enable the estimation of any two of theabove three variables, if the third variable is known.
The authors wish to thank Miss Huei-Kuen Ying and Mrs. Anne F. Rogers for their technicalassistance, and Mrs. Rhoda C. Sparrow and Mrs J. Van't Hof for aid in preparing the manuscript.
* Research carried out at Brookhaven National Laboratory under the auspices of the U.S.Atomic Energy Commission.
1 Wilson, G. B., and J. Morrison, Cytologia, 24, 43 (1958).2Prescott, D. M., Intern. Rev. Cytol., 11, 255 (1961).a Stern, H., Physiol. Rev., 42, 271 (1962).4Taylor, H. J., Ann. Rev. Plant Physiol., 12, 327 (1961).6 Van't Hof, J., G. B. Wilson, and A. Colon, Chromosoma, 11, 313 (1960).6Van't Hof, J., and G. B. Wilson, Chromosoma, 13, 39 (1962).7Davidson, J. N., S. C. Frazer, and W. D. Hutchison, Biochem. J., 49, 311 (1951).8 Burton, K., Biochem. J., 62, 315 (1956).9 Wimber, D. E., Am. J. Botany, 47, 828 (1960).10Sparrow, A. H., and J. P. Miksche, Science, 134, 282 (1961).'1 Van't Hof, J., Cytologia, in press.
BAND-CENTRIFUGATION OF MACROMOLECULES AND VIRUSESIN SELF-GENERATING DENSITY GRADIENTS*
BY JEROME VINOGRAD, ROBERT BRUNER, REBECCA KENT, AND JEAN WEIGLE
GATES AND CRELLIN LABORATORIES OF CHEMISTRYt AND THE NORMAN W. CHURCH LABORATORY OFCHEMICAL BIOLOGY, CALIFORNIA INSTITUTE OF TECHNOLOGY
Communiated by Norman Davidson, Apil 24, 1963
This communication presents a new method of carrying out sedimentation veloc-ity experiments. A thin lamella of a solution of macromolecules is layered onto adenser miscible liquid in a rotating ultracentrifuge cell. The macromolecules thensediment through the liquid in a narrow concentration distribution, or band, whichis observed photographically as a function of time. The density gradients neces-
Dow
nloa
ded
by g
uest
on
May
30,
202
0

VOL. 49, 1963 CHEMISTRY: VINOGRAD ET AL. 903
sary to stabilize the system against convection are generated during the experimentby the diffusion of small molecules between the lamella and the bulk solution, and insome cases by the sedimentation of the small molecules in the bulk solution. Theinhomogeneities in the solvent are usually small enough to have no observable effecton the motion of the macromolecules. Sedimentation coefficients of macromole-cules may be evaluated from the motion of bands. Diffusion, hydrodynamic inter-actions, and chemical reactions affect the shapes of bands.The method of band-sedimentation velocity1 differs from the conventional bound-
ary-sedimentation velocity method2 in that the macromolecules are initially distri-buted in a narrow band at the top of the liquid instead of uniformly throughout(Fig. 1). In the new method all resolved macromolecular components are physi-cally separated. Sedimentation coefficients and rel-ative concentrations measured in such mixtures are BAND BOUNDARYfree from the effects of interaction between compo-nents.'
Stability Considerations.4-The negative density Xgradients associated with the distribution of macro- r----
molecules at the leading side of the band must be LJ\ 'Icompensated by positive gradients in the binary _solvent to avoid convection. If the positive gradi-
A A -j-
ents are inadequate, limited convection causes for- FIG. 1-Diagrammatic repre-sentation of concentration dis-ward spreading. tributions for two sedimenting
In the experiments described in this communica- components in band- and bound-ary centrifugation after threetion, the lamellar solution contained macromole- equal time intervals.cules in dilute aqueous electrolyte. The denserbulk solution or solvent contained D20 or more concentrated electrolyte, such as0.5 M KCl or 1.0 M NaCl. In such solvents the sedimentation coefficient is onlyslightly affected by preferential interaction' of the macromolecules with smallmolecules. With more concentrated binary solvents, significant preferential inter-actions may occur. In very concentrated CsCl the macromolecules may sedi-ment through a solution of significantly variable density, and slow down or evenstop6 during the experiment.
Noninteracting Systems.-1. Homogeneous materials: A single macromolecularsubstance with constant sedimentation coefficient s and diffusion coefficient D formsa Gaussian band which remains Gaussian during sedimentation (Fig. 2A). Theband broadens with time and with the distance sedimented according to the rela-tion
-2= -or02+ 2D(t-t0)r00 r00 p1
where a, ro, and t are the standard deviation, the radial distance to band center, andthe time. The superscript zero refers to the properties of the band at time t0. Thesedimentation coefficient is evaluated from the motion of band center or the maxi-mum in the concentration distribution with the equation
In ro = sC02t + constant,T (2)
where co is the angular velocity. The amplitudes and standard deviations of bands
Dow
nloa
ded
by g
uest
on
May
30,
202
0
904 CHEMISTRY: VINOGRAD ET AL. PROC. N. A. S.
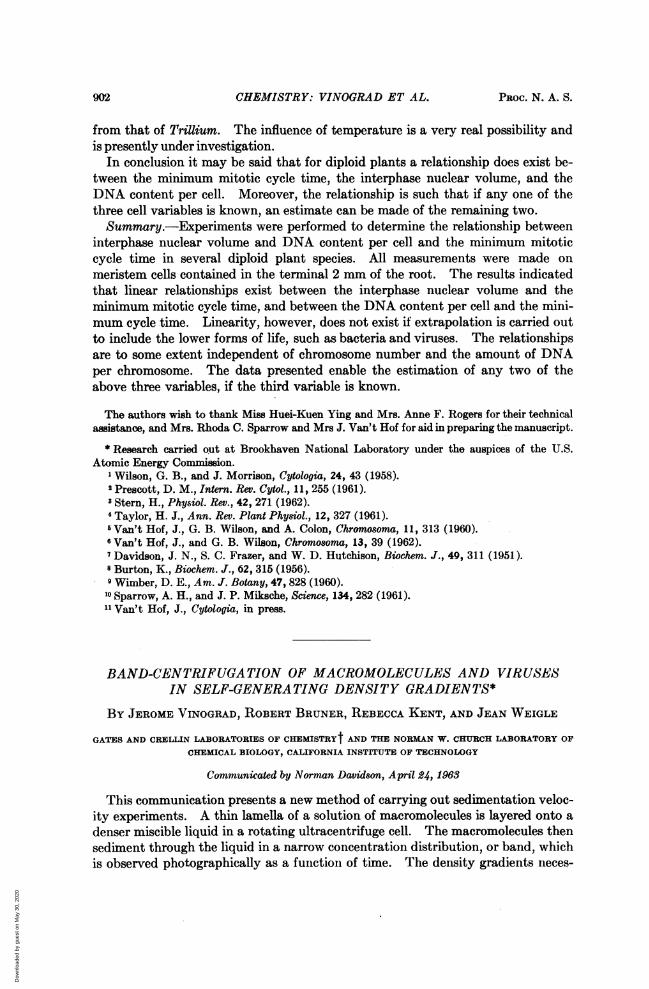
FIG. 2.-(A) Band-- ~~centrifugation
.........._ of Southern bean mo-saic virus in 1 M NaCl,0.04 M NaPO4, pH6.9, 50 pAl lamella, 1.60
J: _li;i_&<.-.L<_,gSBMV, OD20 =0.2, 1.80 ml bulk solu-
4.-t tion, 30 mm center-piece. Photographedat 16 mim intervals,12,590 rpm, 20.00.Densitometer recordsof this film show thebands to be Gaussianover 90% of the mass.(B, C) Band-centrifu-gation of a mixture of6 X 101 +b2+b5lambda virus, buoyantdensity 1.508 g cm3,and 5 X 10⁹ b2b5lambda virus, 1.484
;(A) (B) (C) g cm-, in twodifferent CsCl solutions (.01 M tris pH 7.0). Thirty mm Kel-F centerpiece, 25 pl lamella, 1.40ml bulk solution, 25.00, 4 min intervals. (B) p = 1.25, 12,590 rpm. (C) p = 1.39, 20,410 rpm.The first two exposures in (C) show the effect of excessive refractive index gradients. These wereavoided in (B) by holding the rotor speed at approximately 5,000 rpm for 10 min duringacceleration.
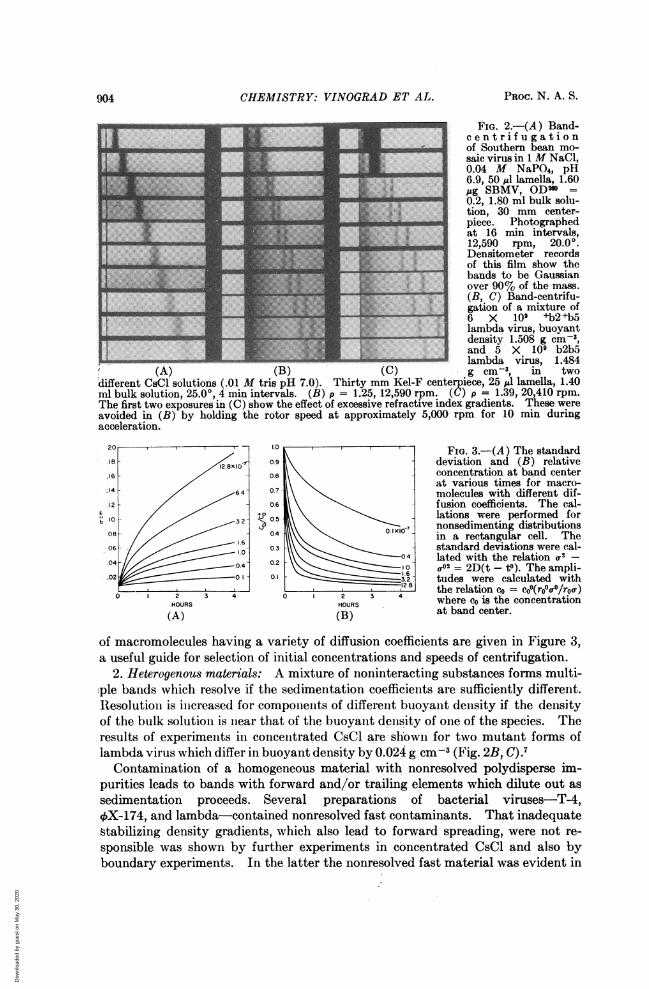
20 -r-- - 10 FIG. 3.-(A) The standard18 128X,07 09 deviation and (B) relative16 /
0
0.8 concentration at band centerat various times for macro-
:14 6. 4 0°7 molecules with different dif-.12 0.6 fusion coefficients. The cal-
E lot / / 24 2°05^ \\32 lations were performed forbI0 X 12Axe\\\-7| nonsedimenting distributions//08 040\41 in a rectangular cell. The
.06 o 03 standard deviations were cal-04 // 0.2 § \\\04 lated with the relation 2 -
0.4I/ 0 O,02 = 2D(t - to). The ampli-.02 O|1 0.lt6 3.2 tudes were calculated with
0 , 2 3 4 0 2 3 ,12.81 the relation co = cO0(ro01f0/roo)HOURS HOURS where c0 is the concentration(A) (B) at band center.
of macromolecules having a variety of diffusion coefficients are given in Figure 3,a useful guide for selection of initial concentrations and speeds of centrifugation.
2. Heterogenous materials: A mixture of noninteracting substances forms multi-ple bands which resolve if the sedimentation coefficients are sufficiently different.Resolution is increased for components of different buoyant density if the densityof the bulk solution is near that of the buoyant density of one of the species. Theresults of experiments in concentrated CsCl are shown for two mutant forms oflambda virus which differ in buoyant density by 0.024 g cm-3 (Fig. 2B, C).7
Contamination of a homogeneous material with nonresolved polydisperse im-purities leads to bands with forward and/or trailing elements which dilute out assedimentation proceeds. Several preparations of bacterial viruses-T4,4X-174, and lambda-contained nonresolved fast contaminants. That inadequatestabilizing density gradients, which also lead to forward spreading, were not re-sponsible was shown by further experiments in concentrated CsCl and also byboundary experiments. In the latter the nonresolved fast material was evident in
Dow
nloa
ded
by g
uest
on
May
30,
202
0
VOL. 49, 1963 CHEMISTRY: VINOGR.4D ET AL. 905
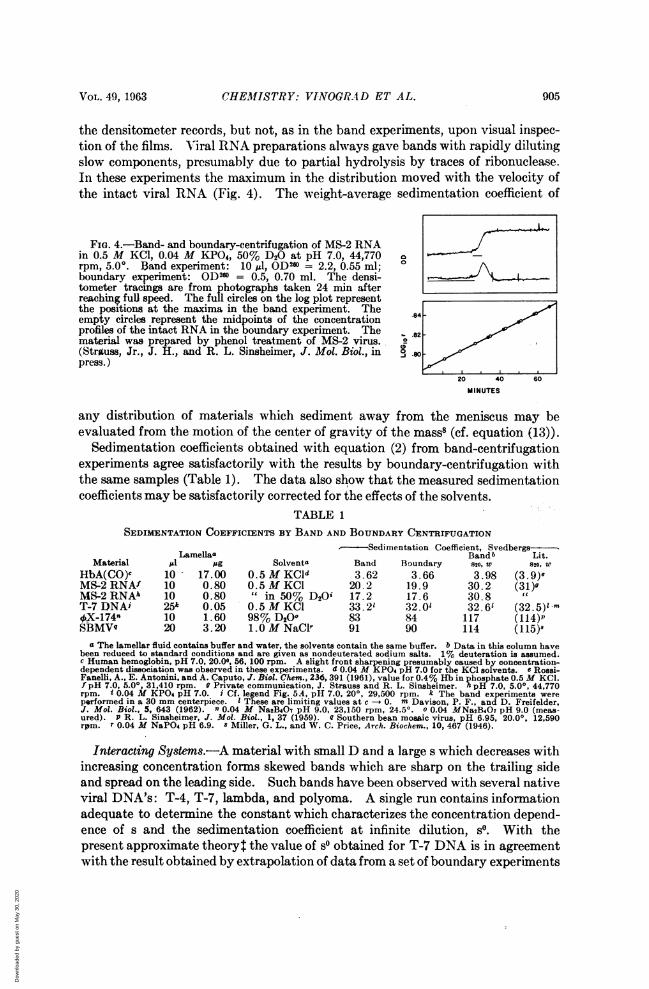
the densitometer records, but not, as in the band experiments, upon visual inspec-tion of the films. Viral RNA preparations always gave bands with rapidly dilutingslow components, presumably due to partial hydrolysis by traces of ribonuclease.In these experiments the maximum in the distribution moved with the velocity ofthe intact viral RNA (Fig. 4). The weight-average sedimentation coefficient of
FIG. 4.-Band- and boundary-centrifugation of MS-2 RNAin 0.5 M KCl, 0.04 M KPO4, 50% D20 at pH 7.0, 44,770 arpm, 5.00. Band experiment: 10 Al, OD20 = 2.2, 0.55 ml; 0
boundary experiment: ODm = 0.5, 0.70 ml. The densi- -_Itometer tracings are from photographs taken 24 min afterreaching full speed. The full circles on the log plot representthe positions at the maxima in the band experiment. Theempty circles represent the midpoints of the concentration .84profiles of the intact RNA in the boundary experiment. The 82 -material was prepared by phenol treatment of MS-2 virus.(Strauss, Jr., J. H., and R. L. Sinsheimer, J. Mol. Biol., in 0-J sopress.)
20 40 60
MINUTES
any distribution of materials which sediment away from the meniscus may beevaluated from the motion of the center of gravity of the mass8 (cf. equation (13)).
Sedimentation coefficients obtained with equation (2) from band-centrifugationexperiments agree satisfactorily with the results by boundary-centrifugation withthe same samples (Table 1). The data also show that the measured sedimentationcoefficients may be satisfactorily corrected for the effects of the solvents.
TABLE 1SEDIMENTATION COEFFICIENTS BY BAND AND BOUNDARY CENTRIFUGATION
-Sedimentation Coefficient, Svedbergs--Lamellaa Bandb Lit.
Material A1 Ag Solventa Band Boundary s20, w 820, WHbA(CO)c 10 17.00 0.5 M KCld 3.62 3.66 3.98 (3.9)-MS-2RNAf 10 0.80 0.5MKC1 20.2 19.9 30.2 (31)PMS-2RNAh 10 0.80 " in 50% D2O0 17.2 17.6 30.8 "T-7 DNAi 25k 0.05 0.5 M KC1 33.21 32.01 32.61 (32.5)lm4oX-174n 10 1.60 98% D2OO 83 84 117 (114)PSBMV9 20 3.20 1.0 M NaClr 91 90 114 (115)8
a The lamellar fluid contains buffer and water, the solvents contain the same buffer. b Data in this column havebeen reduced to standard conditions and are given as nondeuterated sodium salts. 1% deuteration is assumed.cHuman hemoglobin, pH 7.0, 20.0°, 56, 100 rpm. A slight front sharpening presumably caused by concentration-dependent dissociation was observed in these experiments. d 0.04 M KPO4 pH 7.0 for the KCl solvents. 6 Rossi-Fanelli, A., E. Antonini, and A. Caputo, J. Biol. Chem., 236, 391 (1961), value for 0.4% Hb in phosphate 0.5 M KC1.f pH 7.0, 5.00, 31,410 rpm. 9 Private communication, J. Strauss and R. L. Sinsheimer. h pH 7.0, 5.0°, 44,770rpm. i 0.04 M KPO4 pH 7.0. i Cf. legend Fig. 5A, pH 7.0, 20°, 29,500 rpm. k The band experiments wereperformed in a 30 mm centerpiece. I These are limiting values at c- 0. m Davison, P. F., and D. Freifelder,J. Mol. Biol., 5, 643 (1962). " 0.04 M Na2B407 pH 9.0, 23,150 rpm, 24.50. 0 0.04 MNa2B407 pH 9.0 (meas-ured). P R. L. Sinsheimer, J. Mol. Biol., 1, 37 (1959). e Southern bean mosaic virus, pH 6.95, 20.00, 12,590rpm. r 0.04 M NaPO4 pH 6.9. s Miller, G. L., and W. C. Price, Arch. Biochem., 10, 467 (1946).
Interacting Systems.-A material with small D and a large s which decreases withincreasing concentration forms skewed bands which are sharp on the trailing sideand spread on the leading side. Such bands have been observed with several nativeviral DNA's: T-4, T-7, lambda, and polyoma. A single run contains informationadequate to determine the constant which characterizes the concentration depend-ence of s and the sedimentation coefficient at infinite dilution, SO. With thepresent approximate theory: the value of sO obtained for T-7 DNA is in agreementwith the result obtained by extrapolation of data from a set of boundary experiments
Dow
nloa
ded
by g
uest
on
May
30,
202
0
906 CHEMISTRY: VINOGRAD ET AL. PROC. N. A. S.
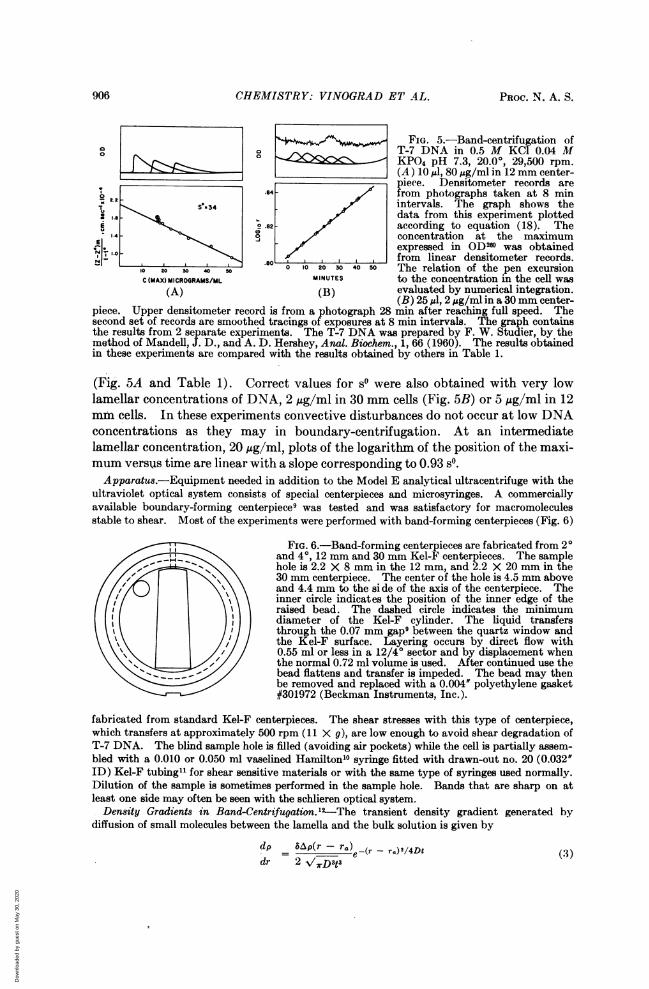
FIG. 5.-Band-centrifugation ofO 0 T-7 DNA in 0.5 M KCl 0.04 M0 0O ~ ~KPO4 pH 7.3, 20.00, 29,500 rpm.(A ) 10 ,ul, 80 /Ag/ml in 12 mm center-
piece. Densitometer records are2.2 fm.84fo photographs taken at 8 minS.34 intervals. The graph shows the
I.. data from this experiment plottedE ° .82 according to equation (18). The1-4 0 concentration at the maximum
. . _</expressed in OD260 was obtainedN @-_._____,_,_-_.80__,_,,___,from linear densitometer records.
- 20 so 40 00 0 10 20 30 40 50 The relation of the pen excursionC(MAX)MICROGRAMS/ML MINUTES to the concentration in the cell was
(A) (B) evaluated by numerical integration.(B) 251A4,2 jug/ml in a 30mm center-
piece. Upper densitometer record is from a photograph 28 min after reaching full speed. Thesecond set of records are smoothed tracings of exposures at 8 min intervals. The graph containsthe results from 2 separate experiments. The T-7 DNA was prepared by F. W. Studier, by themethod of Mandell, J. D., and A. D. Hershey, Anal. Biochem., 1, 66 (1960). The results obtainedin these experiments are compared with the results obtained by others in Table 1.
(Fig. 5A and Table 1). Correct values for s° were also obtained with very lowlamellar concentrations of DNA, 2 iug/ml in 30 mm cells (Fig. 5B) or 5 ,ug/ml in 12mm cells. In these experiments convective disturbances do not occur at low DNAconcentrations as they may in boundary-centrifugation. At an intermediatelamellar concentration, 20 ,ug/ml, plots of the logarithm of the position of the maxi-mum versus time are linear with a slope corresponding to 0.93 sO.Apparatus.-Equipment needed in addition to the Model E analytical ultracentrifuge with the
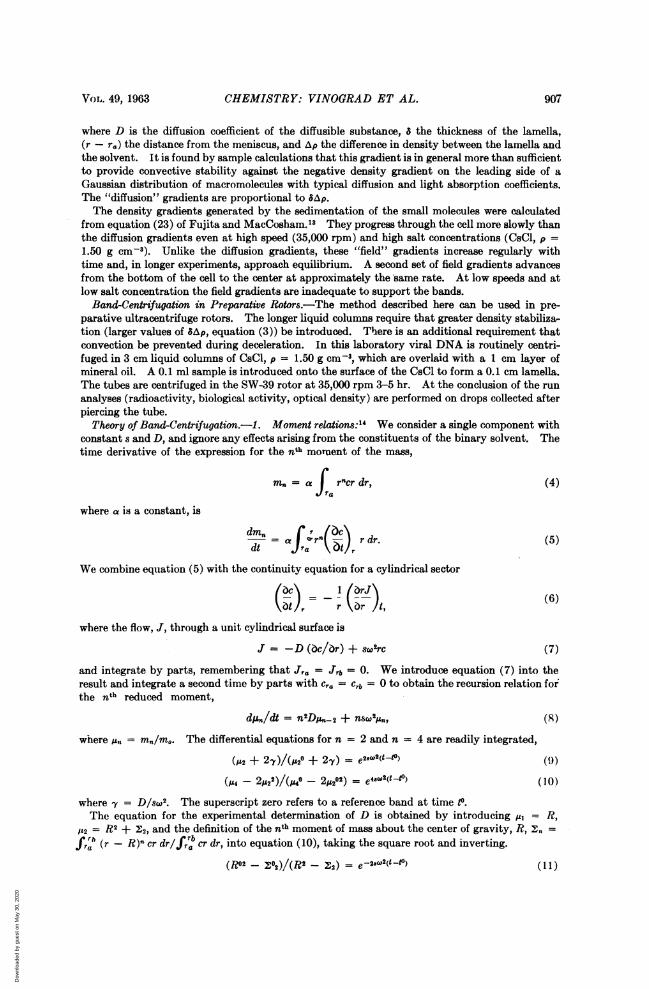
ultraviolet optical system consists of special centerpieces and microsyringes. A commerciallyavailable boundary-forming centerpieces was tested and was satisfactory for macromoleculesstable to shear. Most of the experiments were performed with band-forming centerpieces (Fig. 6)
FIG. 6.-Band-forming centerpieces are fabricated from 20and 40, 12 mm and 30 mm Kel-F centerpieces. The samplehole is 2.2 X 8 mm in the 12 mm, and 2.2 X 20 mm in the
//o> MAX\ \ 30 mm centerpiece. The center of the hole is 4.5 mm aboveand 4.4 mm to the side of the axis of the centerpiece. Theinner circle indicates the position of the inner edge of theraised bead. The dashed circle indicates the minimumdiameter of the Kel-F cylinder. The liquid transfersthrough the 0.07 mm gap9 between the quartz window andi\\ the Kel-F surface. Layering occurs by direct flow with0.55 ml or less in a 12/40 sector and by displacement when\ \ \\ /,/ /the normal 0.72 ml volume is used. After continued use thebead flattens and transfer is impeded. The bead may thenbe removed and replaced with a 0.004' polyethylene gasket#301972 (Beckman Instruments, Inc.).
fabricated from standard Kel-F centerpieces. The shear stresses with this type of centerpiece,which transfers at approximately 500 rpm (11 X g), are low enough to avoid shear degradation ofT-7 DNA. The blind sample hole is filled (avoiding air pockets) while the cell is partially assem-bled with a 0.010 or 0.050 ml vaselined Hamilton10 syringe fitted with drawn-out no. 20 (0.032'ID) Kel-F tubing"1 for shear sensitive materials or with the same type of syringes used normally.Dilution of the sample is sometimes performed in the sample hole. Bands that are sharp on atleast one side may often be seen with the schlieren optical system.
Density Gradients in Band-Centrifugation. 12--The transient density gradient generated bydiffusion of small molecules between the lamella and the bulk solution is given by
dp 5Ap(r - r0) (r - r.)2/4Dt (3)dr 2 /7rD3t3
Dow
nloa
ded
by g
uest
on
May
30,
202
0
VOL. 49, 1963 CHEMISTRY: VINOGRAD ET AL. 907
where D is the diffusion coefficient of the diffusible substance, 5 the thickness of the lamella,(r - r.) the distance from the meniscus, and Ap the difference in density between the lamella andthe solvent. It is found by sample calculations that this gradient is in general more than sufficientto provide convective stability against the negative density gradient on the leading side of aGaussian distribution of macromolecules with typical diffusion and light absorption coefficients.The "diffusion" gradients are proportional to SAp.The density gradients generated by the sedimentation of the small molecules were calculated
from equation (23) of Fujita and MacCosham.'3 They progress through the cell more slowly thanthe diffusion gradients even at high speed (35,000 rpm) and high salt concentrations (CsCl, p =1.50 g cm-3). Unlike the diffusion gradients, these "field" gradients increase regularly withtime and, in longer experiments, approach equilibrium. A second set of field gradients advancesfrom the bottom of the cell to the center at approximately the same rate. At low speeds and atlow salt concentration the field gradients are inadequate to support the bands.
Band-Centrifugation in Preparative Rotors.-The method described here can be used in pre-parative ultracentrifuge rotors. The longer liquid columns require that greater density stabiliza-tion (larger values of SAp, equation (3)) be introduced. There is an additional requirement thatconvection be prevented during deceleration. In this laboratory viral DNA is routinely centri-fuged in 3 cm liquid columns of CsCl, p = 1.50 g cm-3, which are overlaid with a 1 cm layer ofmineral oil. A 0.1 ml sample is introduced onto the surface of the CsCl to form a 0.1 cm lamella.The tubes are centrifuged in the SW-39 rotor at 35,000 rpm 3-5 hr. At the conclusion of the runanalyses (radioactivity, biological activity, optical density) are performed on drops collected afterpiercing the tube.
Theory of Band-Centrifugation.-1. Moment relations:'4 We consider a single component withconstant s and D, and ignore any effects arising from the constituents of the binary solvent. Thetime derivative of the expression for the nth moment of the mass,
=n a f rncr dr, (4)
where a is a constant, is
dmn Jr 1?8c\dnat ~r" - r dr.
We combine equation (5) with the continuity equation for a cylindrical sector
(bc\ 1 (6)r)I'= -~ V (6)
where the flow, J, through a unit cylindrical surface is
J = -D (bc/br) + sw~rc (7)
and integrate by parts, remembering that J7a = Jrb = 0. We introduce equation (7) into theresult and integrate a second time by parts with c,8 = Crb = 0 to obtain the recursion relation forthe nth reduced moment,
dj,/dt = n2DAn2 + nsw2,, (8)
where A,, = mn/m0. The differential equations for n = 2 and n = 4 are readily integrated,
(O2 + 2y)/(A20 + 2y) = e2s(2(t) (9)
(4- 2A22)/(A40 - 2;&202) = e4wc2(t4") (10)
where y = D/sw2. The superscript zero refers to a reference band at time to.The equation for the experimental determination of D is obtained by introducing Jl = R.
142 = R2 + 22, and the definition of the nth moment of mass about the center of gravity, R, zn =fr (r - R)n cr dr/frrb cr dr, into equation (10), taking the square root and inverting.
(RO2- Z02)/(R2 - 22) = e-2.82(t-P, (11)
Dow
nloa
ded
by g
uest
on
May
30,
202
0
908 CHEMISTRY: VINOGRAD ET AL. PROC. N. A. S.
Terms in 230/RO, 2202/R02 and 2 ° /R02 in the numerator and corresponding terms in the denominatorare omitted in equation (11). This approximation for equation (10) is valid for 2'y > Z2, anecessary condition for the experimental determination of the diffusion coefficient. Equations(9), (11), and p2 = RI + Z2 are combined to form a relation free of differences between largenumbers for the diffusion coefficient,
(RO\2 D22(R) - 220 = - [1 - e-2c82(tt0)] = 2D(t - t°)[1 - so2(t - t) + l (12)
22(RO/R) -220 (R/RO) = 2D(t - t). (12a)
The effect of the inhomogeneous field, seen in equations (12), is to increase the width of the bandby about 15% during the run. This broadening is normally small compared with the effect ofdiffusion (Fig. 3). With equation (1) or (12a) diffusion coefficients for homogeneous materialswith constant s and D may be calculated. It is anticipated that the effects of concentration-dependent sedimentations should be less troublesome than in boundary-sedimentation becauseof the compensatory front spreading which occurs along with the rear-aharpening.Equation (9) is simplified with an error of less than 0.1% in s for rapidly diffusing macromole-
cules, -y < 0.3 cm2 and Z2 = 0.01 cm2, to give a relation between the motion of the center ofgravity of the distribution and the sedimentation coefficient.
In (R/RO) = sw2(t - t") (13)
In most experiments the motion of band center or of the maximum in the distribution, equation(2), may be used with adequate accuracy to evaluate s.
2. The Gau8sian approximation: The differential equation for spreading of an infinitely thinband in a sector has been solved by Carslaw and Jaeger" in their consideration of the conductionof heat from an instantaneous annular source at a distance r, from the axis. In our variables thesolution in Bessel functions for the large values'7 of rr,/2D(t - tO) in the present problem becomes
Ae-(r-rj)212df2C
a_\/r/r1 (14)
The cylindrical geometry thus causes a negligible distortion of the Gaussian distribution. Weanticipate that the distorting effect of the inhomogeneous field will also be small, and examine nextthe behavior of concentration distributions which remain Gaussian during band-centrifugation.The relations for a single component in a sector
RI = ro2 + 2'2(1 + o2/2ro2); 22 = (72(1 - o2/ro2) (15)
are combined with equation (11) to give equation (2) for s. Equation (1) for D is obtained bycombining equations (12a) and (15). Higher-order terms in equation (15) are neglected in thedevelopment of equations (1) and (2). Terms in 2 are also neglected in equation (2).
3. Concentration-dependent sedimentation in a constant field and in a rectangular cell: Thecentrifuge differential equation2 for a substance with D constant and s = s6(1 - kc) becomes
Ia- = - IDb - v0(1 - kc)c (16)bt z L 6z
where the velocity at infinite dilution, v0, is 3O(W22. A solution of equation (16) for the boundaryconditions c = 0 at Za and zb has been obtained with a substitution suggested by Feynman. "S
D e-X2c(zt) = vOk\/(t - to) 2(a + erf u) (17)
(z - Z) - t(t -to) 7 tSkrwhere u= - /2 tanh2 D(t-t") =2 2D
and r= f cdz.
Dow
nloa
ded
by g
uest
on
May
30,
202
0
Voi.. 49, 1963 CHEMIISTRY: VINOGRAD ET AL. 909
We differentiate the solution with respect to distance and equate the derivative to zero to ob-serve the behavior of the position Zm and the concentration cm at the maximum in the distribution.
Zm Zm0 = V(t - tV)(1 - 2kcm) (18)
Comparison of Band- and Boundary-Centrifugation.-Band-centrifugation offersthese advantages: (1) All resolved components are examined in a physicallyseparated state. Slow contaminants and degradation products usually do not in-terfere. Fast components are detectable with high sensitivity. The effects of in-teraction between resolved components are avoided. (2) Valuable information isavailable from a comparison of the two sides of the band. (3) Differential insteadof cumulative concentration distributions are obtained. (4) Less material, 1/5 to1/40, is required. (5) Dialysis is usually not necessary. (6) Band centrifuge runsare more appropriate as pilot experiments for zone centrifugation runs in preparativerotors.
Band-centrifugation has the following disadvantages: (1) The initial distributionis less well defined. (2) Bands widen and dilute faster than boundaries. (3)The effects of concentration-dependent sedimentation and the admixture of non-resolved fast materials are more difficult to separate. (4) There is less latitudein the choice of solvents and in the upper limit of the concentration of macromole-cules. (5) Refractometric recording systems are less readily employed.Summary.-A new method for carrying out sedimentation and diffusion studies
in the ultracentrifuge is described. Examples are given of sedimentation resultsobtained with some typical RNA, DNA, protein, and virus preparations. Band-centrifugation and boundary-centrifugation are compared.
The authors thank J. H. Fessler, J. E. Hearst, R. F. Stewart, and H. Wayland for helpful dis-cussions, R. P. Feynman for valuable suggestions in connection with the development of thetheory, and P. Knust-Graichen, R. L. Sinsheimer, J. H. Strauss, Jr., and W. E. Studier forgifts of materials.
* This work was supported in part by grant HE 03394 from the U.S. Public Health Service anda grant from the National Foundation.A preliminary report of this work was presented at the National Academy of Sciences' Con-
ference on the Ultracentrifuge, New York, June 18-20, 1962, and at the Seventh Annual BiophysicalSociety Meeting, February 18, 1963, New York.
t Contribution No. 2955.T Statements marked with a double dagger are elaborated in sections on theory.1 The method is distinguished from zone-sedimentation in that the stabilizing density gradient
is generated during the experiment. Attention is called to an experiment by R. T. Hersh andH. K. Schachman, J. Phys. Chem., 62, 170 (1958) in which, incidental to other studies, a wideband of virus was observed to sediment through an H20-D2O gradient.
2 Svedberg, T., and K. 0. Pedersen, The Ultracentrifuge (Oxford: Clarendon Press, 1940).3 Johnston, J. P., and A. G. Ogston, Trans. Faraday Soc., 42, 789 (1946).4 Svensson, H., L. Hagdahl, and K. D. Lerner, Science Tools, 4, 1 (1957).6 Schachman, H. K., Ultracentrifugation in Biochemistry (New York: Academic Press, 1959),
pp. 228-236.6 It will be recommended elsewhere that equilibrium experiments in a buoyant density gradient
be set up as band-centrifugation experiments with buoyant solvents.7 Kellenberger, G., M. L. Zichichi, and J. Weigle, J. Mol. Biol., 3, 399 (1961).8 The theory for the behavior of multicomponent systems will be given elsewhere. The result
in the text is accurate to within 1% in s for most distributions.9Kegeles, G., J. Am. Chem. Soc., 74, 5532 (1952); Synthetic Boundary Cell, single sector
capillary type #305994, Beckman Instruments, Inc., Palo Alto, California.
Dow
nloa
ded
by g
uest
on
May
30,
202
0
910 PHYSICS: WIGNER AND YANASE PROC. N. A. S.
10 Hamilton Company, Inc., Whittier, California.11 R. S. Hughes Co., Los Angeles, California; Yphantis, D. A., Ann. N. Y. Acad. Sci., 88,
586 (1960).12 A more detailed analysis of this subject will be presented elsewhere.13 Fujita, H., and V. J. MacCosham, J. Chem. Phys., 30, 291 (1959).14 The method of moments was first used in sedimentation analysis by Baldwin in a study of
boundary spreading. Baldwin, R. L., J. Phys. Chem., 58, 1081 (1954). The method has alsobeen used by R. L. Baldwin and E. M. Shooter and by M. Meselson and G. Nazarian in analysesof sedimentation in buoyant density gradients. Ultracentrifugal Analysis in Theory and Experi-ment, ed. J. W. Williams (Academic Press, 1963), in press.
15 Fujita, H., J. Phys. Chem., 24, 1084 (1956).16 Carslaw, H. S., and J. C. Jaeger, Conduction of Heal in Solids (Oxford: Clarendon Press,
1959), p. 259.17 Wayland, H., Differential Equations Applied in Science and Engineering (Princeton: D.
Van Nostrand and Co., Inc., 1957), p. 199.18 Feynman, R., personal communication.
INFORMATION CONTENTS OF DISTRIBUTIONS
BY E. P. WIGNER AND MUTSUO M. YANASE*
PRINCETON UNIVERSITY AND INSTITUTE FOR ADVANCED STUDY, PRINCETON, NEW JERSEY
Communicated April 12, 1963
1. Introduction.-The entropy, as usually defined, is a measure of our ignoranceand, if multiplied by -1, can be considered as a measure of our knowledge of thestate of a system. 1 It is a measure of our total knowledge into which the knowledgeof the value of any observable enters in the same way (cf. section 3). It is this lastcircumstance which prompted the considerations leading to the present note.According to quantum mechanical theory, some observables can be measuredmuch more easily than others: the observables which commute with the additiveconserved quantities (energy, components of the linear and angular momenta,electric charge) can be measured with microscopic apparatuses; those which do notcommute with these quantities need for their measurement macroscopic systems.2Hence, the problem of defining a measure of our knowledge with respect to thelatter quantities arises. The present note will be restricted to the case in whichthere is only one conserved additive quantity; this will be denoted by k. Thename "skew information" has been proposed3 for the amount of informationwhich an ensemble described by a state vector or a statistical matrix contains withrespect to the not easily measured quantities. This information relates to thetransition probabilities into states which lie askew to the characteristic vectors ofthe additive conserved quantities.
2. Postulates on the Information Content.-The requirements which an expressionfor the information content should satisfy are the following:
(a) If two different ensembles are united, the information content of the result-ing ensemble should be smaller than the average information content of the com-ponent ensembles. By uniting two ensembles, one "forgets" from which of thesea particular sample stems. Hence, the information content should decrease. Even
Dow
nloa
ded
by g
uest
on
May
30,
202
0