Embed Size (px)
Citation preview
Irebert R. Delgado and Paula J. DempseyGlenn Research Center, Cleveland, Ohio
Lance J. AntolickRMCI, Inc., Redstone Arsenal, Alabama
Daniel R. WadeU.S. Army Aviation Engineering Directorate, Redstone Arsenal, Alabama
Continued Evaluation of Gear Condition Indicator Performance on Rotorcraft Fleet
NASA/TM—2013-217876
June 2013
NASA STI Program . . . in Profile
Since its founding, NASA has been dedicated to the advancement of aeronautics and space science. The NASA Scientific and Technical Information (STI) program plays a key part in helping NASA maintain this important role.
The NASA STI Program operates under the auspices of the Agency Chief Information Officer. It collects, organizes, provides for archiving, and disseminates NASA’s STI. The NASA STI program provides access to the NASA Aeronautics and Space Database and its public interface, the NASA Technical Reports Server, thus providing one of the largest collections of aeronautical and space science STI in the world. Results are published in both non-NASA channels and by NASA in the NASA STI Report Series, which includes the following report types: • TECHNICAL PUBLICATION. Reports of
completed research or a major significant phase of research that present the results of NASA programs and include extensive data or theoretical analysis. Includes compilations of significant scientific and technical data and information deemed to be of continuing reference value. NASA counterpart of peer-reviewed formal professional papers but has less stringent limitations on manuscript length and extent of graphic presentations.
• TECHNICAL MEMORANDUM. Scientific
and technical findings that are preliminary or of specialized interest, e.g., quick release reports, working papers, and bibliographies that contain minimal annotation. Does not contain extensive analysis.
• CONTRACTOR REPORT. Scientific and
technical findings by NASA-sponsored contractors and grantees.
• CONFERENCE PUBLICATION. Collected papers from scientific and technical conferences, symposia, seminars, or other meetings sponsored or cosponsored by NASA.
• SPECIAL PUBLICATION. Scientific,
technical, or historical information from NASA programs, projects, and missions, often concerned with subjects having substantial public interest.
• TECHNICAL TRANSLATION. English-
language translations of foreign scientific and technical material pertinent to NASA’s mission.
Specialized services also include creating custom thesauri, building customized databases, organizing and publishing research results.
For more information about the NASA STI program, see the following:
• Access the NASA STI program home page at http://www.sti.nasa.gov
• E-mail your question to [email protected] • Fax your question to the NASA STI
Information Desk at 443–757–5803 • Phone the NASA STI Information Desk at 443–757–5802 • Write to:
STI Information Desk NASA Center for AeroSpace Information 7115 Standard Drive Hanover, MD 21076–1320
Irebert R. Delgado and Paula J. DempseyGlenn Research Center, Cleveland, Ohio
Lance J. AntolickRMCI, Inc., Redstone Arsenal, Alabama
Daniel R. WadeU.S. Army Aviation Engineering Directorate, Redstone Arsenal, Alabama
Continued Evaluation of Gear Condition Indicator Performance on Rotorcraft Fleet
NASA/TM—2013-217876
June 2013
National Aeronautics andSpace Administration
Glenn Research Center Cleveland, Ohio 44135
Prepared for theAirworthiness, Condition Based Maintenance (CBM), and Health and Usage Monitoring (HUMS)sponsored by the Helicopter Association International (HAI)Huntsville, Alabama, February 11–13, 2013
Acknowledgments
The authors would like to thank the NASA Rotary Wing Project, the U.S. Army Apache PM and AMCOM G-3 CBM office located at Redstone Arsenal and Traci Stadtmueller of the FAA Technical Center for their assistance and support of this work.
Available from
NASA Center for Aerospace Information7115 Standard DriveHanover, MD 21076–1320
National Technical Information Service5301 Shawnee Road
Alexandria, VA 22312
Available electronically at http://www.sti.nasa.gov
Trade names and trademarks are used in this report for identification only. Their usage does not constitute an official endorsement, either expressed or implied, by the National Aeronautics and
Space Administration.
Level of Review: This material has been technically reviewed by technical management.
NASA/TM—2013-217876 1
Continued Evaluation of Gear Condition Indicator Performance on Rotorcraft Fleet
Irebert R. Delgado and Paula J. Dempsey
National Aeronautics and Space Administration Glenn Research Center Cleveland, Ohio 44135
Lance J. Antolick
RMCI, Inc. Redstone Arsenal, Alabama 35808
Daniel R. Wade
U.S. Army Aviation Engineering Directorate Redstone Arsenal, Alabama 35808
Abstract This paper details analyses of condition indicator performance for the helicopter nose gearbox within
the U.S. Army’s Condition-Based Maintenance Program. Ten nose gearbox data sets underwent two specific analyses. A mean condition indicator level analysis was performed where condition indicator performance was based on a ‘batting average’ measured before and after part replacement. Two specific condition indicators, Diagnostic Algorithm 1 and Sideband Index, were found to perform well for the data sets studied. A condition indicator versus gear wear analysis was also performed, where gear wear photographs and descriptions from Army tear-down analyses were categorized based on ANSI/AGMA 1010-E95 standards. Seven nose gearbox data sets were analyzed and correlated with condition indicators Diagnostic Algorithm 1 and Sideband Index. Both were found to be most responsive to gear wear cases of micropitting and spalling. Input pinion nose gear box condition indicators were found to be more responsive to part replacement during overhaul than their corresponding output gear nose gear box condition indicators.
Acronyms
AEA Army Engineering Analysis CBM Condition-Based Maintenance CI Condition Indicator DA1 Condition Indicator: Diagnostic Algorithm 1 FM0 Condition Indicator: Zero Order Figure of Merit FM4 Condition Indicator: Figure of Merit 4 NGB Nose Gearbox RMS root-mean square SI Condition Indicator: Sideband Index TSA Time-Synchronous Averaged Data TDA Tear-Down Analysis
NASA/TM—2013-217876 2
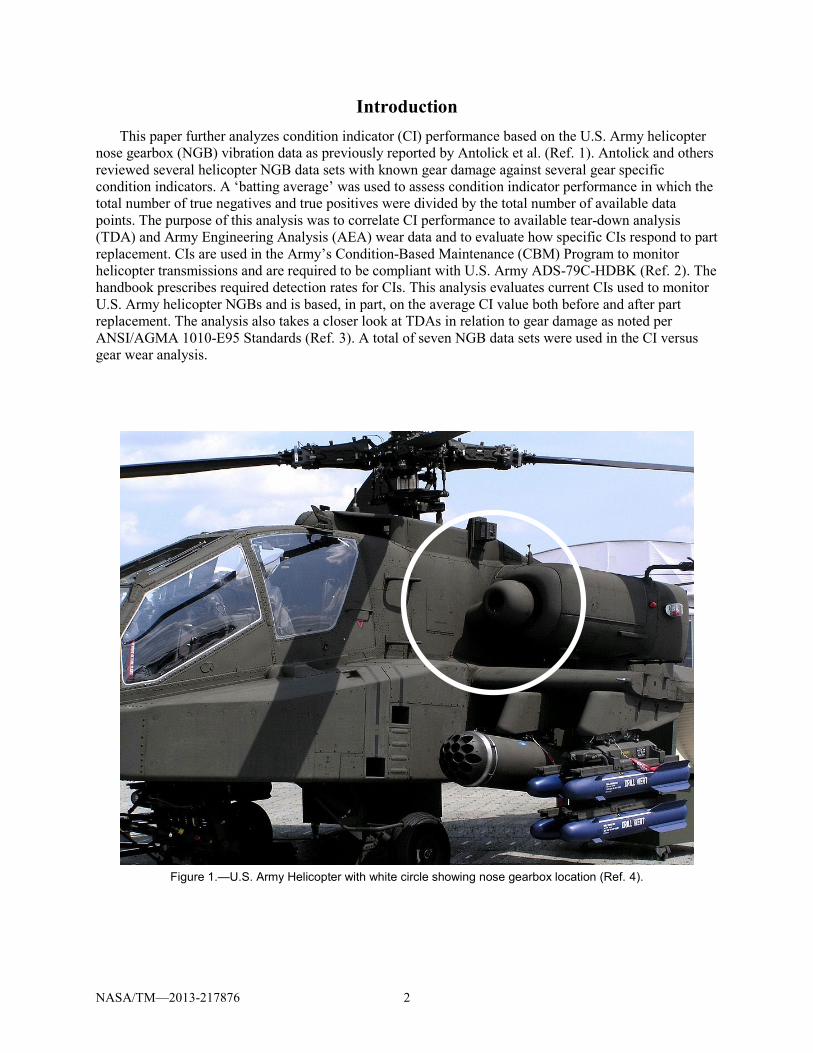
Introduction This paper further analyzes condition indicator (CI) performance based on the U.S. Army helicopter
nose gearbox (NGB) vibration data as previously reported by Antolick et al. (Ref. 1). Antolick and others reviewed several helicopter NGB data sets with known gear damage against several gear specific condition indicators. A ‘batting average’ was used to assess condition indicator performance in which the total number of true negatives and true positives were divided by the total number of available data points. The purpose of this analysis was to correlate CI performance to available tear-down analysis (TDA) and Army Engineering Analysis (AEA) wear data and to evaluate how specific CIs respond to part replacement. CIs are used in the Army’s Condition-Based Maintenance (CBM) Program to monitor helicopter transmissions and are required to be compliant with U.S. Army ADS-79C-HDBK (Ref. 2). The handbook prescribes required detection rates for CIs. This analysis evaluates current CIs used to monitor U.S. Army helicopter NGBs and is based, in part, on the average CI value both before and after part replacement. The analysis also takes a closer look at TDAs in relation to gear damage as noted per ANSI/AGMA 1010-E95 Standards (Ref. 3). A total of seven NGB data sets were used in the CI versus gear wear analysis.
Figure 1.—U.S. Army Helicopter with white circle showing nose gearbox location (Ref. 4).
NASA/TM—2013-217876 3
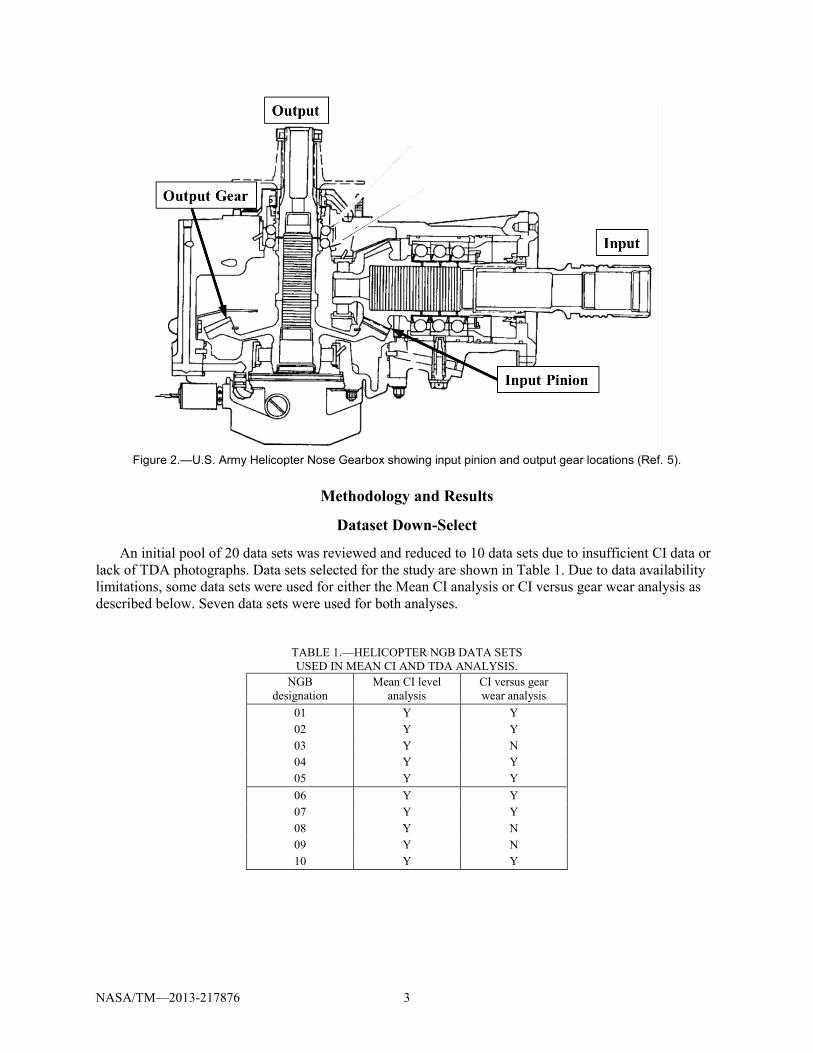
Figure 2.—U.S. Army Helicopter Nose Gearbox showing input pinion and output gear locations (Ref. 5).
Methodology and Results
Dataset Down-Select
An initial pool of 20 data sets was reviewed and reduced to 10 data sets due to insufficient CI data or lack of TDA photographs. Data sets selected for the study are shown in Table 1. Due to data availability limitations, some data sets were used for either the Mean CI analysis or CI versus gear wear analysis as described below. Seven data sets were used for both analyses.
TABLE 1.—HELICOPTER NGB DATA SETS USED IN MEAN CI AND TDA ANALYSIS.
NGB designation
Mean CI level analysis
CI versus gear wear analysis
01 Y Y 02 Y Y 03 Y N 04 Y Y 05 Y Y 06 Y Y 07 Y Y 08 Y N 09 Y N 10 Y Y
NASA/TM—2013-217876 4
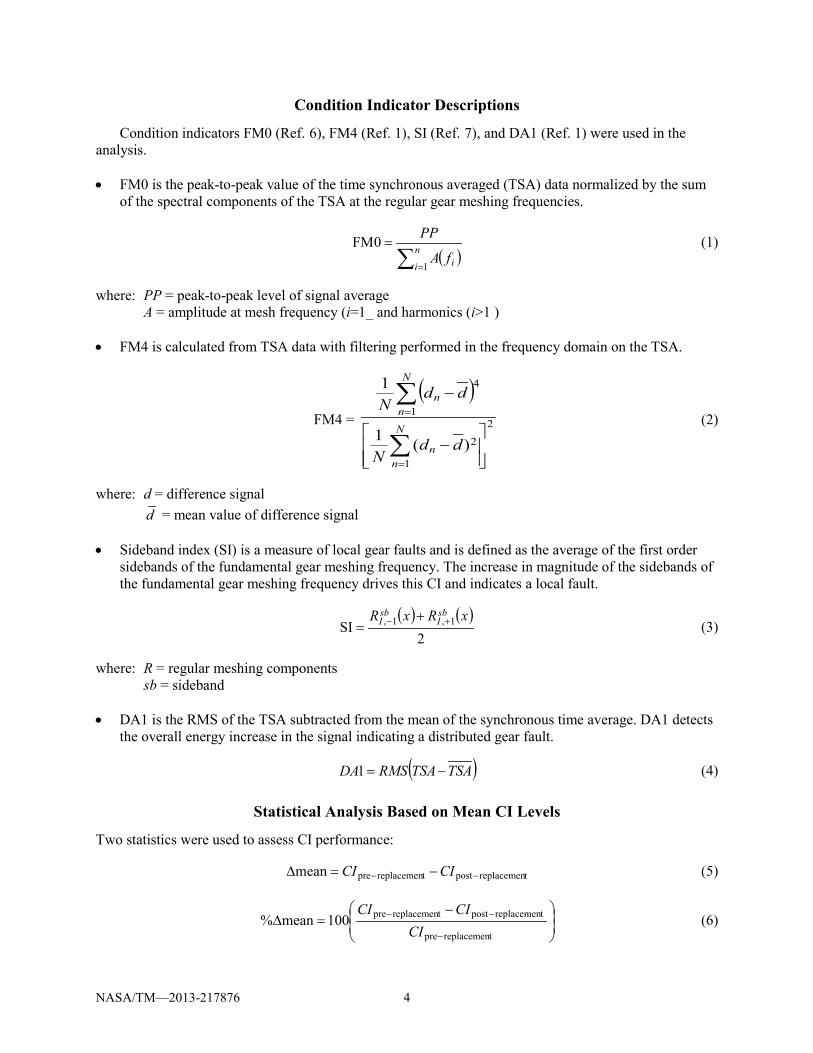
Condition Indicator Descriptions
Condition indicators FM0 (Ref. 6), FM4 (Ref. 1), SI (Ref. 7), and DA1 (Ref. 1) were used in the analysis.
• FM0 is the peak-to-peak value of the time synchronous averaged (TSA) data normalized by the sum
of the spectral components of the TSA at the regular gear meshing frequencies.
( )∑ =
= n
i ifA
PP
1
0FM (1)
where: PP = peak-to-peak level of signal average A = amplitude at mesh frequency (i=1_ and harmonics (i>1 ) • FM4 is calculated from TSA data with filtering performed in the frequency domain on the TSA.
FM4 =
( )2
1
2
1
4
)(1
1
−
−
∑
∑
=
=
N
nn
N
nn
ddN
ddN
(2)
where: d = difference signal d = mean value of difference signal • Sideband index (SI) is a measure of local gear faults and is defined as the average of the first order
sidebands of the fundamental gear meshing frequency. The increase in magnitude of the sidebands of the fundamental gear meshing frequency drives this CI and indicates a local fault.
( ) ( )
2SI 1,1, xRxR sb
IsbI +− +
= (3)
where: R = regular meshing components sb = sideband • DA1 is the RMS of the TSA subtracted from the mean of the synchronous time average. DA1 detects
the overall energy increase in the signal indicating a distributed gear fault.
( )TSATSARMSDA −=1 (4)
Statistical Analysis Based on Mean CI Levels
Two statistics were used to assess CI performance:
treplacemenposttreplacemenpremean −− −=∆ CICI (5)
−=∆
−
−−
treplacemenpre
treplacemenposttreplacemenpre100mean%CI
CICI (6)
NASA/TM—2013-217876 5
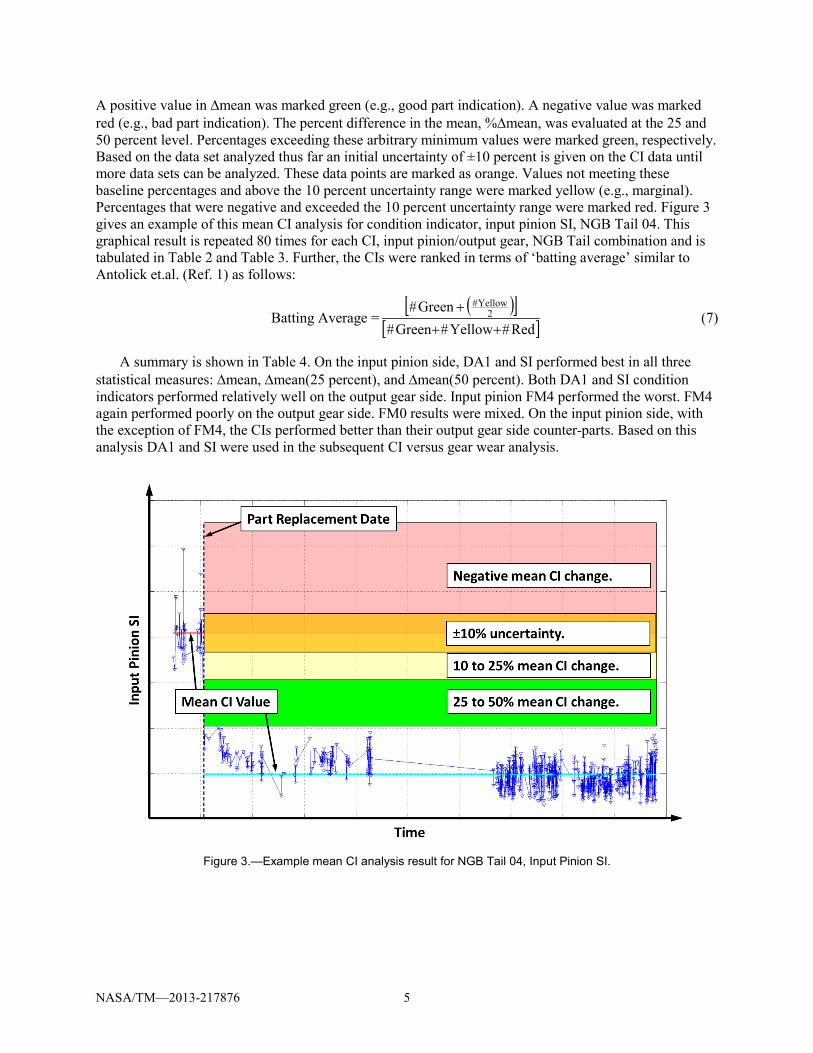
A positive value in ∆mean was marked green (e.g., good part indication). A negative value was marked red (e.g., bad part indication). The percent difference in the mean, %∆mean, was evaluated at the 25 and 50 percent level. Percentages exceeding these arbitrary minimum values were marked green, respectively. Based on the data set analyzed thus far an initial uncertainty of ±10 percent is given on the CI data until more data sets can be analyzed. These data points are marked as orange. Values not meeting these baseline percentages and above the 10 percent uncertainty range were marked yellow (e.g., marginal). Percentages that were negative and exceeded the 10 percent uncertainty range were marked red. Figure 3 gives an example of this mean CI analysis for condition indicator, input pinion SI, NGB Tail 04. This graphical result is repeated 80 times for each CI, input pinion/output gear, NGB Tail combination and is tabulated in Table 2 and Table 3. Further, the CIs were ranked in terms of ‘batting average’ similar to Antolick et.al. (Ref. 1) as follows:
Batting Average =( )[ ]
[ ]Red#Yellow#Green#Green# 2
Yellow#
++
+ (7)
A summary is shown in Table 4. On the input pinion side, DA1 and SI performed best in all three statistical measures: ∆mean, ∆mean(25 percent), and ∆mean(50 percent). Both DA1 and SI condition indicators performed relatively well on the output gear side. Input pinion FM4 performed the worst. FM4 again performed poorly on the output gear side. FM0 results were mixed. On the input pinion side, with the exception of FM4, the CIs performed better than their output gear side counter-parts. Based on this analysis DA1 and SI were used in the subsequent CI versus gear wear analysis.
Figure 3.—Example mean CI analysis result for NGB Tail 04, Input Pinion SI.
NASA/TM—2013-217876 6
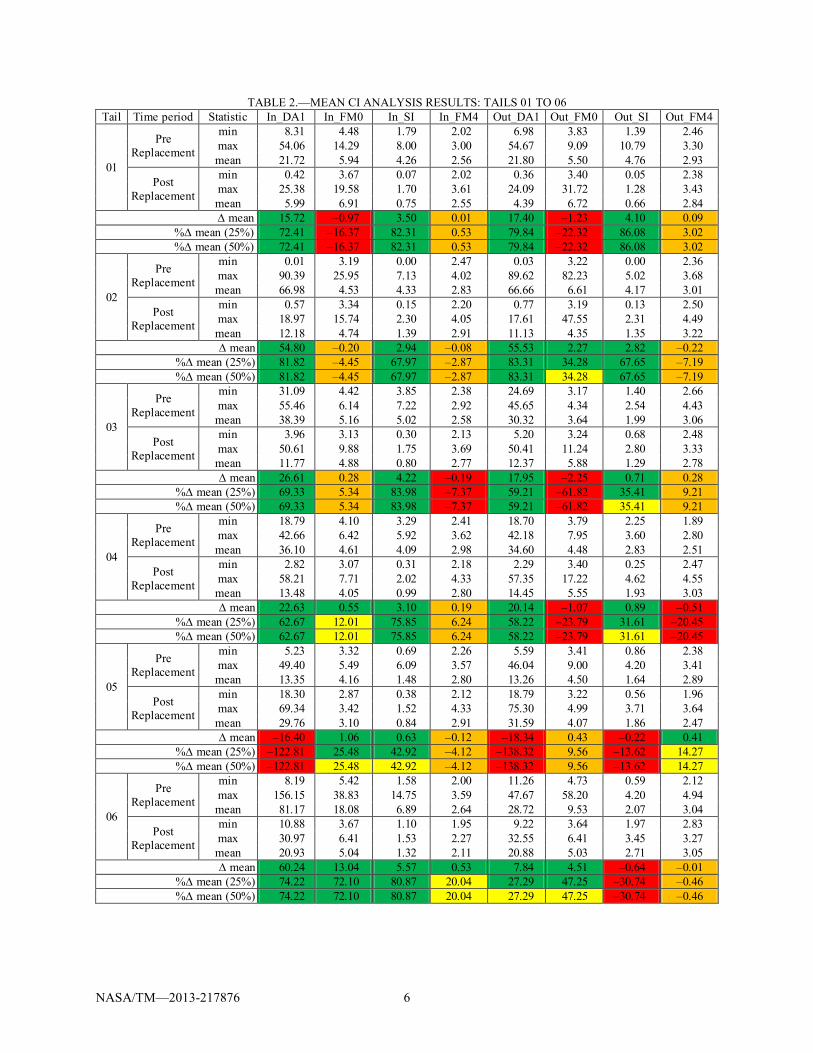
TABLE 2.—MEAN CI ANALYSIS RESULTS: TAILS 01 TO 06 Tail Time period Statistic In_DA1 In_FM0 In_SI In_FM4 Out_DA1 Out_FM0 Out_SI Out_FM4
01
Pre Replacement
min 8.31 4.48 1.79 2.02 6.98 3.83 1.39 2.46 max 54.06 14.29 8.00 3.00 54.67 9.09 10.79 3.30 mean 21.72 5.94 4.26 2.56 21.80 5.50 4.76 2.93
Post Replacement
min 0.42 3.67 0.07 2.02 0.36 3.40 0.05 2.38 max 25.38 19.58 1.70 3.61 24.09 31.72 1.28 3.43 mean 5.99 6.91 0.75 2.55 4.39 6.72 0.66 2.84 ∆ mean 15.72 –0.97 3.50 0.01 17.40 –1.23 4.10 0.09
%∆ mean (25%) 72.41 –16.37 82.31 0.53 79.84 –22.32 86.08 3.02 %∆ mean (50%) 72.41 –16.37 82.31 0.53 79.84 –22.32 86.08 3.02
02
Pre Replacement
min 0.01 3.19 0.00 2.47 0.03 3.22 0.00 2.36 max 90.39 25.95 7.13 4.02 89.62 82.23 5.02 3.68 mean 66.98 4.53 4.33 2.83 66.66 6.61 4.17 3.01
Post Replacement
min 0.57 3.34 0.15 2.20 0.77 3.19 0.13 2.50 max 18.97 15.74 2.30 4.05 17.61 47.55 2.31 4.49 mean 12.18 4.74 1.39 2.91 11.13 4.35 1.35 3.22 ∆ mean 54.80 –0.20 2.94 –0.08 55.53 2.27 2.82 –0.22
%∆ mean (25%) 81.82 –4.45 67.97 –2.87 83.31 34.28 67.65 –7.19 %∆ mean (50%) 81.82 –4.45 67.97 –2.87 83.31 34.28 67.65 –7.19
03
Pre Replacement
min 31.09 4.42 3.85 2.38 24.69 3.17 1.40 2.66 max 55.46 6.14 7.22 2.92 45.65 4.34 2.54 4.43 mean 38.39 5.16 5.02 2.58 30.32 3.64 1.99 3.06
Post Replacement
min 3.96 3.13 0.30 2.13 5.20 3.24 0.68 2.48 max 50.61 9.88 1.75 3.69 50.41 11.24 2.80 3.33 mean 11.77 4.88 0.80 2.77 12.37 5.88 1.29 2.78 ∆ mean 26.61 0.28 4.22 –0.19 17.95 –2.25 0.71 0.28
%∆ mean (25%) 69.33 5.34 83.98 –7.37 59.21 –61.82 35.41 9.21 %∆ mean (50%) 69.33 5.34 83.98 –7.37 59.21 –61.82 35.41 9.21
04
Pre Replacement
min 18.79 4.10 3.29 2.41 18.70 3.79 2.25 1.89 max 42.66 6.42 5.92 3.62 42.18 7.95 3.60 2.80 mean 36.10 4.61 4.09 2.98 34.60 4.48 2.83 2.51
Post Replacement
min 2.82 3.07 0.31 2.18 2.29 3.40 0.25 2.47 max 58.21 7.71 2.02 4.33 57.35 17.22 4.62 4.55 mean 13.48 4.05 0.99 2.80 14.45 5.55 1.93 3.03 ∆ mean 22.63 0.55 3.10 0.19 20.14 –1.07 0.89 –0.51
%∆ mean (25%) 62.67 12.01 75.85 6.24 58.22 –23.79 31.61 –20.45 %∆ mean (50%) 62.67 12.01 75.85 6.24 58.22 –23.79 31.61 –20.45
05
Pre Replacement
min 5.23 3.32 0.69 2.26 5.59 3.41 0.86 2.38 max 49.40 5.49 6.09 3.57 46.04 9.00 4.20 3.41 mean 13.35 4.16 1.48 2.80 13.26 4.50 1.64 2.89
Post Replacement
min 18.30 2.87 0.38 2.12 18.79 3.22 0.56 1.96 max 69.34 3.42 1.52 4.33 75.30 4.99 3.71 3.64 mean 29.76 3.10 0.84 2.91 31.59 4.07 1.86 2.47 ∆ mean –16.40 1.06 0.63 –0.12 –18.34 0.43 –0.22 0.41
%∆ mean (25%) –122.81 25.48 42.92 –4.12 –138.32 9.56 –13.62 14.27 %∆ mean (50%) –122.81 25.48 42.92 –4.12 –138.32 9.56 –13.62 14.27
06
Pre Replacement
min 8.19 5.42 1.58 2.00 11.26 4.73 0.59 2.12 max 156.15 38.83 14.75 3.59 47.67 58.20 4.20 4.94 mean 81.17 18.08 6.89 2.64 28.72 9.53 2.07 3.04
Post Replacement
min 10.88 3.67 1.10 1.95 9.22 3.64 1.97 2.83 max 30.97 6.41 1.53 2.27 32.55 6.41 3.45 3.27 mean 20.93 5.04 1.32 2.11 20.88 5.03 2.71 3.05 ∆ mean 60.24 13.04 5.57 0.53 7.84 4.51 –0.64 –0.01
%∆ mean (25%) 74.22 72.10 80.87 20.04 27.29 47.25 –30.74 –0.46 %∆ mean (50%) 74.22 72.10 80.87 20.04 27.29 47.25 –30.74 –0.46
NASA/TM—2013-217876 7
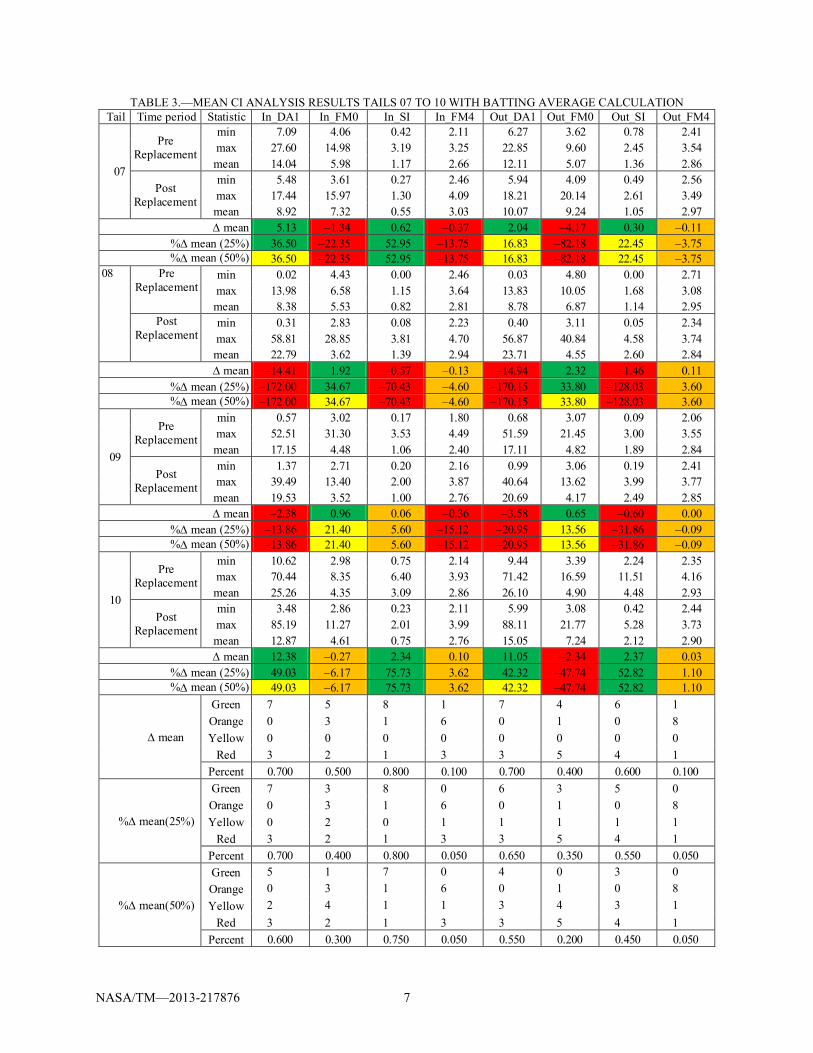
TABLE 3.—MEAN CI ANALYSIS RESULTS TAILS 07 TO 10 WITH BATTING AVERAGE CALCULATION Tail Time period Statistic In_DA1 In_FM0 In_SI In_FM4 Out_DA1 Out_FM0 Out_SI Out_FM4
07
Pre Replacement
min 7.09 4.06 0.42 2.11 6.27 3.62 0.78 2.41 max 27.60 14.98 3.19 3.25 22.85 9.60 2.45 3.54 mean 14.04 5.98 1.17 2.66 12.11 5.07 1.36 2.86
Post Replacement
min 5.48 3.61 0.27 2.46 5.94 4.09 0.49 2.56 max 17.44 15.97 1.30 4.09 18.21 20.14 2.61 3.49 mean 8.92 7.32 0.55 3.03 10.07 9.24 1.05 2.97 ∆ mean 5.13 –1.34 0.62 –0.37 2.04 –4.17 0.30 –0.11
%∆ mean (25%) 36.50 –22.35 52.95 –13.75 16.83 –82.18 22.45 –3.75 %∆ mean (50%) 36.50 –22.35 52.95 –13.75 16.83 –82.18 22.45 –3.75
08 Pre Replacement
min 0.02 4.43 0.00 2.46 0.03 4.80 0.00 2.71 max 13.98 6.58 1.15 3.64 13.83 10.05 1.68 3.08 mean 8.38 5.53 0.82 2.81 8.78 6.87 1.14 2.95
Post Replacement
min 0.31 2.83 0.08 2.23 0.40 3.11 0.05 2.34 max 58.81 28.85 3.81 4.70 56.87 40.84 4.58 3.74 mean 22.79 3.62 1.39 2.94 23.71 4.55 2.60 2.84 ∆ mean –14.41 1.92 –0.57 –0.13 –14.94 2.32 –1.46 0.11
%∆ mean (25%) –172.00 34.67 –70.43 –4.60 –170.15 33.80 –128.03 3.60 %∆ mean (50%) –172.00 34.67 –70.43 –4.60 –170.15 33.80 –128.03 3.60
09
Pre Replacement
min 0.57 3.02 0.17 1.80 0.68 3.07 0.09 2.06 max 52.51 31.30 3.53 4.49 51.59 21.45 3.00 3.55 mean 17.15 4.48 1.06 2.40 17.11 4.82 1.89 2.84
Post Replacement
min 1.37 2.71 0.20 2.16 0.99 3.06 0.19 2.41 max 39.49 13.40 2.00 3.87 40.64 13.62 3.99 3.77 mean 19.53 3.52 1.00 2.76 20.69 4.17 2.49 2.85 ∆ mean –2.38 0.96 0.06 –0.36 –3.58 0.65 –0.60 0.00
%∆ mean (25%) –13.86 21.40 5.60 –15.12 –20.95 13.56 –31.86 –0.09 %∆ mean (50%) –13.86 21.40 5.60 –15.12 –20.95 13.56 –31.86 –0.09
10
Pre Replacement
min 10.62 2.98 0.75 2.14 9.44 3.39 2.24 2.35 max 70.44 8.35 6.40 3.93 71.42 16.59 11.51 4.16 mean 25.26 4.35 3.09 2.86 26.10 4.90 4.48 2.93
Post Replacement
min 3.48 2.86 0.23 2.11 5.99 3.08 0.42 2.44 max 85.19 11.27 2.01 3.99 88.11 21.77 5.28 3.73 mean 12.87 4.61 0.75 2.76 15.05 7.24 2.12 2.90 ∆ mean 12.38 –0.27 2.34 0.10 11.05 –2.34 2.37 0.03
%∆ mean (25%) 49.03 –6.17 75.73 3.62 42.32 –47.74 52.82 1.10 %∆ mean (50%) 49.03 –6.17 75.73 3.62 42.32 –47.74 52.82 1.10
∆ mean
Green 7 5 8 1 7 4 6 1 Orange 0 3 1 6 0 1 0 8 Yellow 0 0 0 0 0 0 0 0
Red 3 2 1 3 3 5 4 1 Percent 0.700 0.500 0.800 0.100 0.700 0.400 0.600 0.100
%∆ mean(25%)
Green 7 3 8 0 6 3 5 0 Orange 0 3 1 6 0 1 0 8 Yellow 0 2 0 1 1 1 1 1
Red 3 2 1 3 3 5 4 1 Percent 0.700 0.400 0.800 0.050 0.650 0.350 0.550 0.050
%∆ mean(50%)
Green 5 1 7 0 4 0 3 0 Orange 0 3 1 6 0 1 0 8 Yellow 2 4 1 1 3 4 3 1
Red 3 2 1 3 3 5 4 1 Percent 0.600 0.300 0.750 0.050 0.550 0.200 0.450 0.050
NASA/TM—2013-217876 8
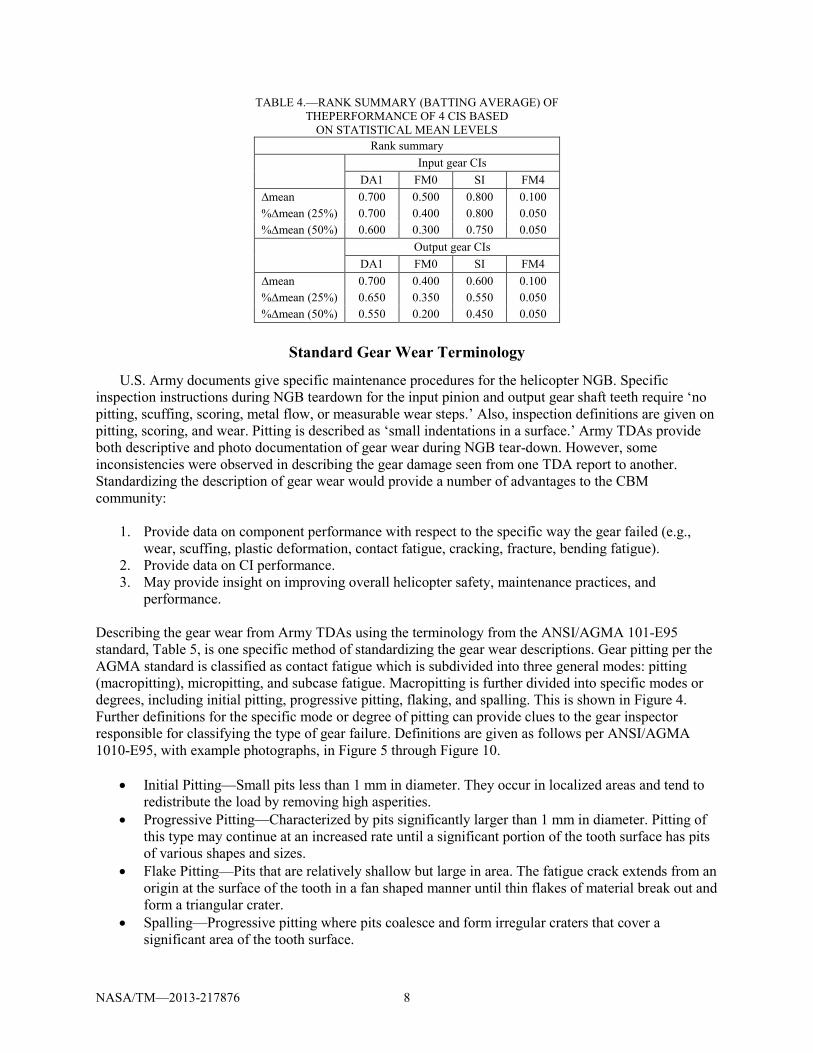
TABLE 4.—RANK SUMMARY (BATTING AVERAGE) OF THEPERFORMANCE OF 4 CIS BASED
ON STATISTICAL MEAN LEVELS Rank summary
Input gear CIs
DA1 FM0 SI FM4 ∆mean 0.700 0.500 0.800 0.100 %∆mean (25%) 0.700 0.400 0.800 0.050 %∆mean (50%) 0.600 0.300 0.750 0.050
Output gear CIs
DA1 FM0 SI FM4 ∆mean 0.700 0.400 0.600 0.100 %∆mean (25%) 0.650 0.350 0.550 0.050 %∆mean (50%) 0.550 0.200 0.450 0.050
Standard Gear Wear Terminology
U.S. Army documents give specific maintenance procedures for the helicopter NGB. Specific inspection instructions during NGB teardown for the input pinion and output gear shaft teeth require ‘no pitting, scuffing, scoring, metal flow, or measurable wear steps.’ Also, inspection definitions are given on pitting, scoring, and wear. Pitting is described as ‘small indentations in a surface.’ Army TDAs provide both descriptive and photo documentation of gear wear during NGB tear-down. However, some inconsistencies were observed in describing the gear damage seen from one TDA report to another. Standardizing the description of gear wear would provide a number of advantages to the CBM community:
1. Provide data on component performance with respect to the specific way the gear failed (e.g., wear, scuffing, plastic deformation, contact fatigue, cracking, fracture, bending fatigue).
2. Provide data on CI performance. 3. May provide insight on improving overall helicopter safety, maintenance practices, and
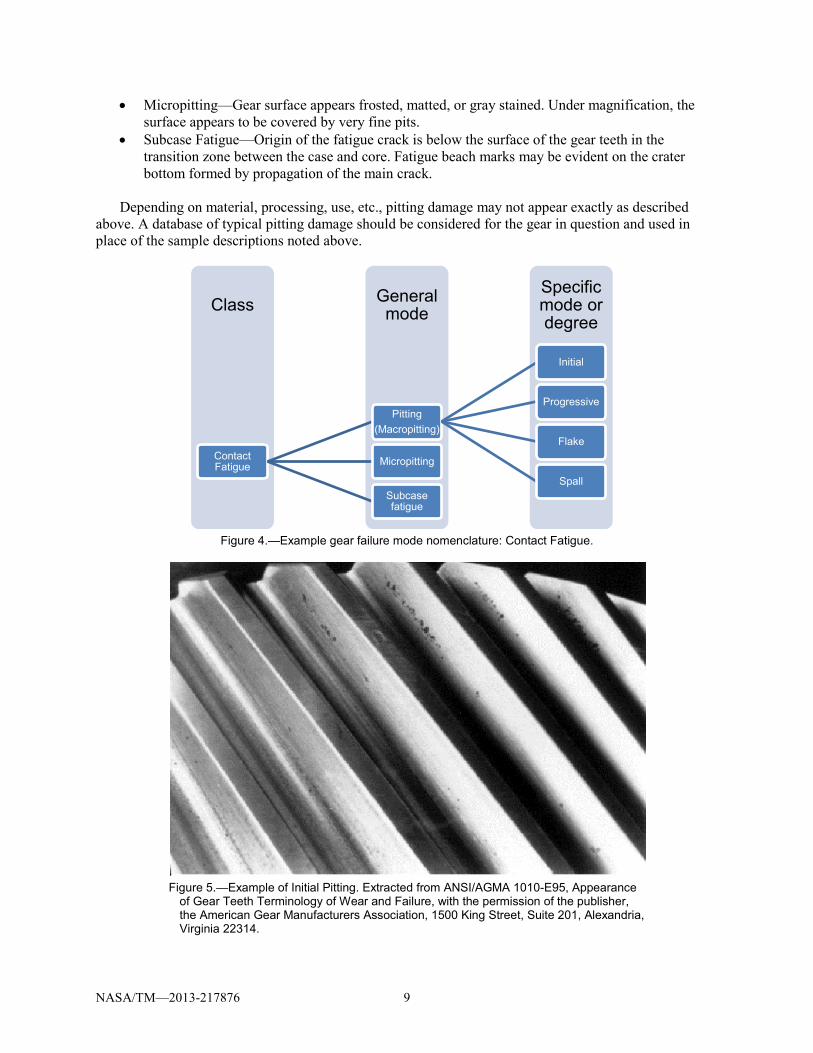
performance. Describing the gear wear from Army TDAs using the terminology from the ANSI/AGMA 101-E95 standard, Table 5, is one specific method of standardizing the gear wear descriptions. Gear pitting per the AGMA standard is classified as contact fatigue which is subdivided into three general modes: pitting (macropitting), micropitting, and subcase fatigue. Macropitting is further divided into specific modes or degrees, including initial pitting, progressive pitting, flaking, and spalling. This is shown in Figure 4. Further definitions for the specific mode or degree of pitting can provide clues to the gear inspector responsible for classifying the type of gear failure. Definitions are given as follows per ANSI/AGMA 1010-E95, with example photographs, in Figure 5 through Figure 10.
• Initial Pitting—Small pits less than 1 mm in diameter. They occur in localized areas and tend to redistribute the load by removing high asperities.
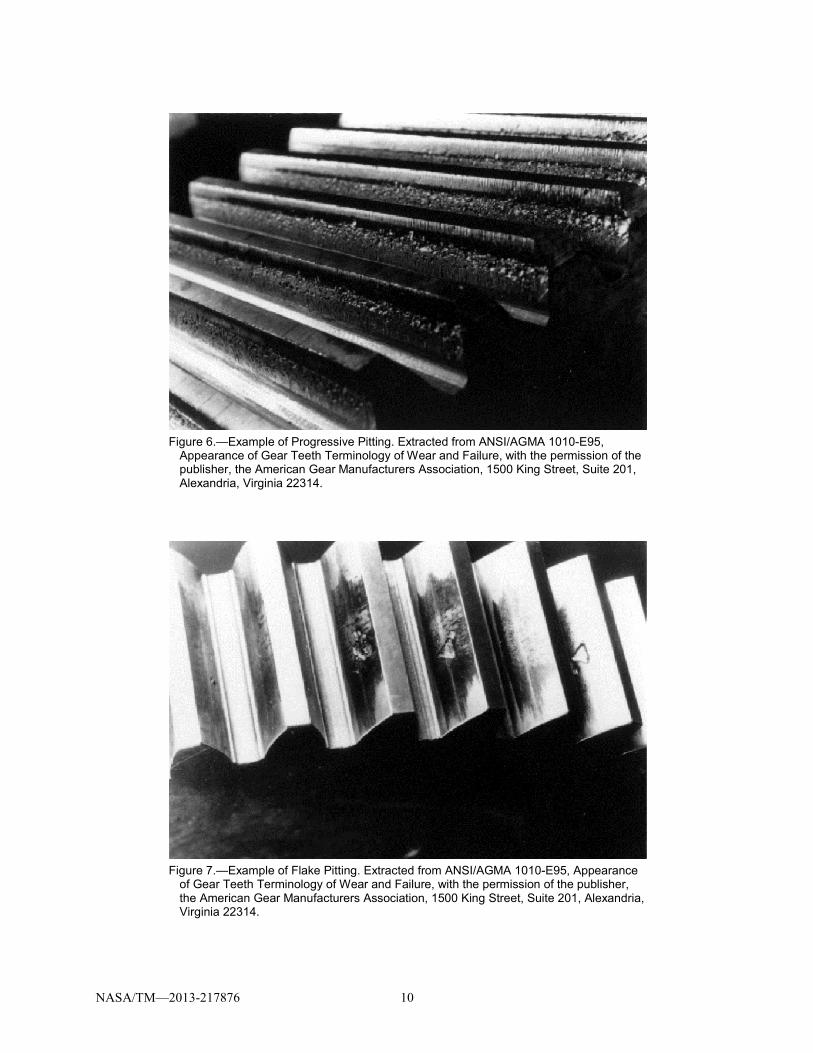
• Progressive Pitting—Characterized by pits significantly larger than 1 mm in diameter. Pitting of this type may continue at an increased rate until a significant portion of the tooth surface has pits of various shapes and sizes.
• Flake Pitting—Pits that are relatively shallow but large in area. The fatigue crack extends from an origin at the surface of the tooth in a fan shaped manner until thin flakes of material break out and form a triangular crater.
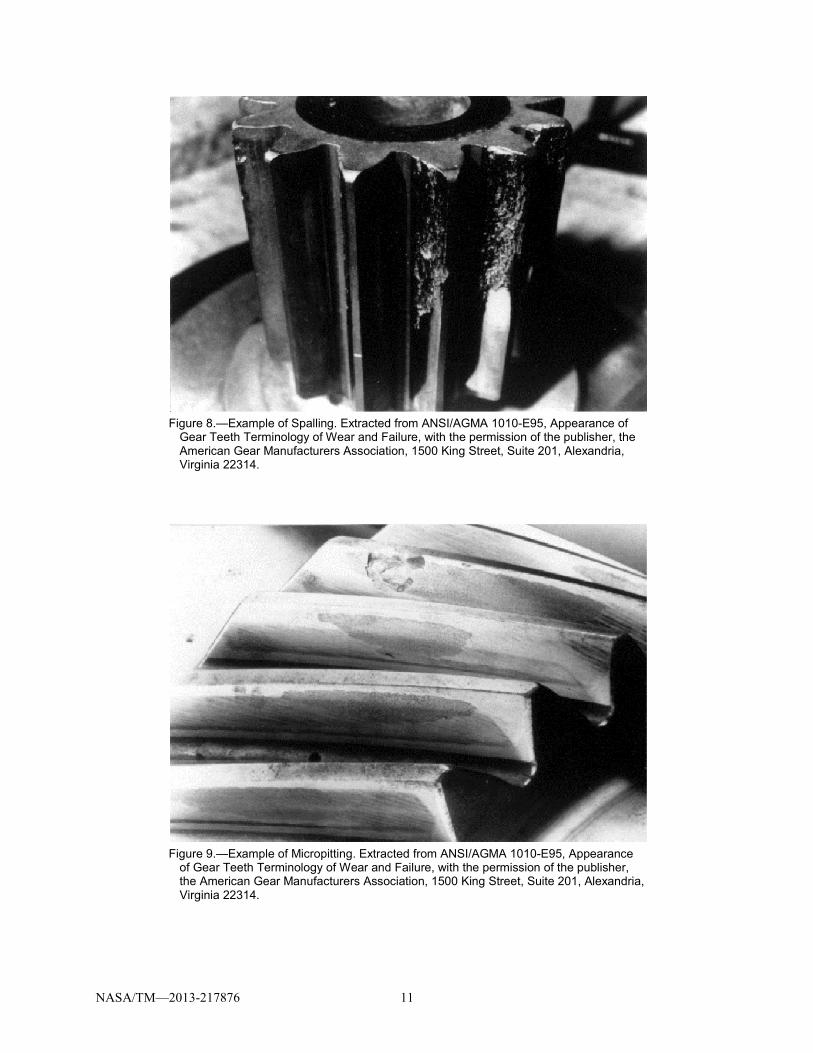
• Spalling—Progressive pitting where pits coalesce and form irregular craters that cover a significant area of the tooth surface.
NASA/TM—2013-217876 9
• Micropitting—Gear surface appears frosted, matted, or gray stained. Under magnification, the surface appears to be covered by very fine pits.
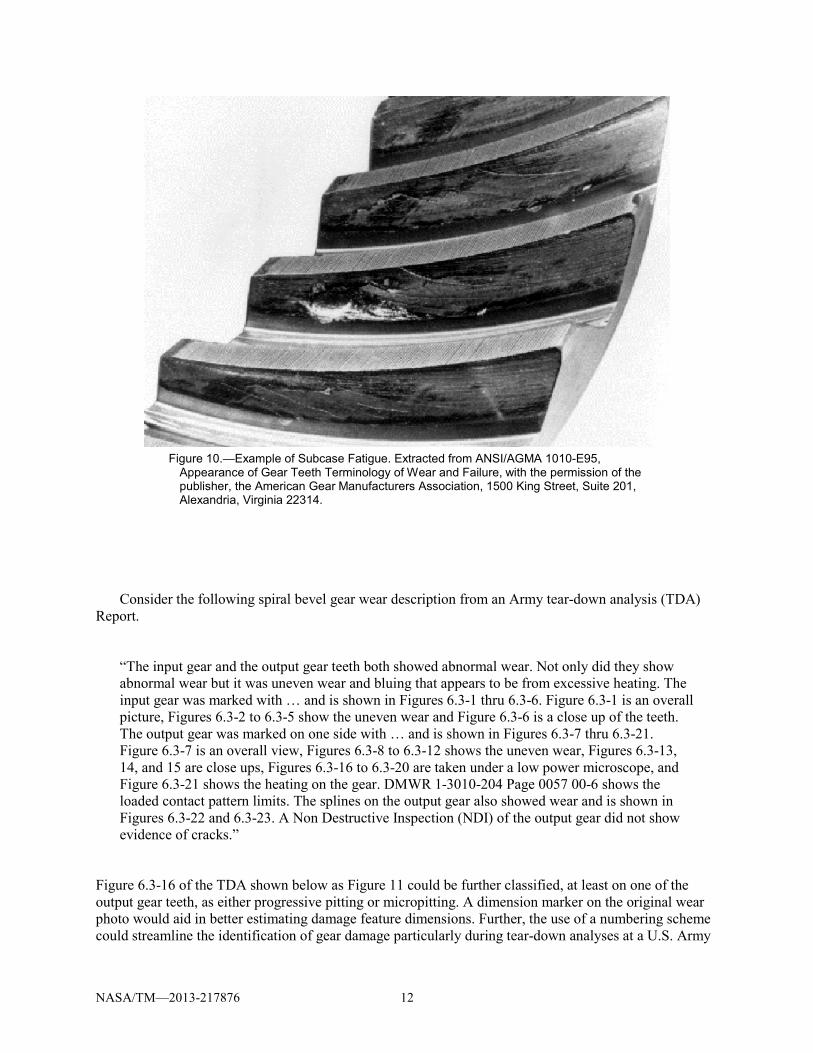
• Subcase Fatigue—Origin of the fatigue crack is below the surface of the gear teeth in the transition zone between the case and core. Fatigue beach marks may be evident on the crater bottom formed by propagation of the main crack.
Depending on material, processing, use, etc., pitting damage may not appear exactly as described
above. A database of typical pitting damage should be considered for the gear in question and used in place of the sample descriptions noted above.
Figure 4.—Example gear failure mode nomenclature: Contact Fatigue.
Figure 5.—Example of Initial Pitting. Extracted from ANSI/AGMA 1010-E95, Appearance
of Gear Teeth Terminology of Wear and Failure, with the permission of the publisher, the American Gear Manufacturers Association, 1500 King Street, Suite 201, Alexandria, Virginia 22314.
Specific mode or degree
General mode Class
Contact Fatigue
Pitting (Macropitting)
Initial
Progressive
Flake
Spall
Micropitting
Subcase fatigue
NASA/TM—2013-217876 10
Figure 6.—Example of Progressive Pitting. Extracted from ANSI/AGMA 1010-E95,
Appearance of Gear Teeth Terminology of Wear and Failure, with the permission of the publisher, the American Gear Manufacturers Association, 1500 King Street, Suite 201, Alexandria, Virginia 22314.
Figure 7.—Example of Flake Pitting. Extracted from ANSI/AGMA 1010-E95, Appearance
of Gear Teeth Terminology of Wear and Failure, with the permission of the publisher, the American Gear Manufacturers Association, 1500 King Street, Suite 201, Alexandria, Virginia 22314.
NASA/TM—2013-217876 11
Figure 8.—Example of Spalling. Extracted from ANSI/AGMA 1010-E95, Appearance of
Gear Teeth Terminology of Wear and Failure, with the permission of the publisher, the American Gear Manufacturers Association, 1500 King Street, Suite 201, Alexandria, Virginia 22314.
Figure 9.—Example of Micropitting. Extracted from ANSI/AGMA 1010-E95, Appearance
of Gear Teeth Terminology of Wear and Failure, with the permission of the publisher, the American Gear Manufacturers Association, 1500 King Street, Suite 201, Alexandria, Virginia 22314.
NASA/TM—2013-217876 12
Figure 10.—Example of Subcase Fatigue. Extracted from ANSI/AGMA 1010-E95,
Appearance of Gear Teeth Terminology of Wear and Failure, with the permission of the publisher, the American Gear Manufacturers Association, 1500 King Street, Suite 201, Alexandria, Virginia 22314.
Consider the following spiral bevel gear wear description from an Army tear-down analysis (TDA) Report.
“The input gear and the output gear teeth both showed abnormal wear. Not only did they show abnormal wear but it was uneven wear and bluing that appears to be from excessive heating. The input gear was marked with … and is shown in Figures 6.3-1 thru 6.3-6. Figure 6.3-1 is an overall picture, Figures 6.3-2 to 6.3-5 show the uneven wear and Figure 6.3-6 is a close up of the teeth. The output gear was marked on one side with … and is shown in Figures 6.3-7 thru 6.3-21. Figure 6.3-7 is an overall view, Figures 6.3-8 to 6.3-12 shows the uneven wear, Figures 6.3-13, 14, and 15 are close ups, Figures 6.3-16 to 6.3-20 are taken under a low power microscope, and Figure 6.3-21 shows the heating on the gear. DMWR 1-3010-204 Page 0057 00-6 shows the loaded contact pattern limits. The splines on the output gear also showed wear and is shown in Figures 6.3-22 and 6.3-23. A Non Destructive Inspection (NDI) of the output gear did not show evidence of cracks.”
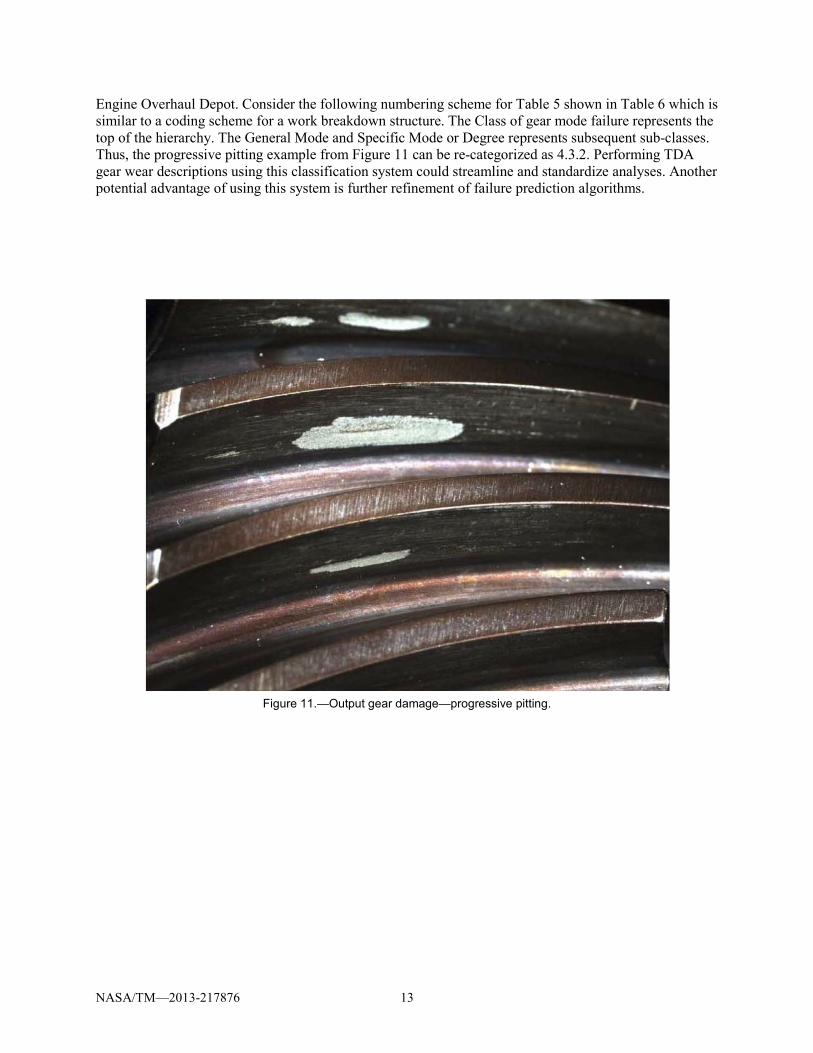
Figure 6.3-16 of the TDA shown below as Figure 11 could be further classified, at least on one of the output gear teeth, as either progressive pitting or micropitting. A dimension marker on the original wear photo would aid in better estimating damage feature dimensions. Further, the use of a numbering scheme could streamline the identification of gear damage particularly during tear-down analyses at a U.S. Army
NASA/TM—2013-217876 13
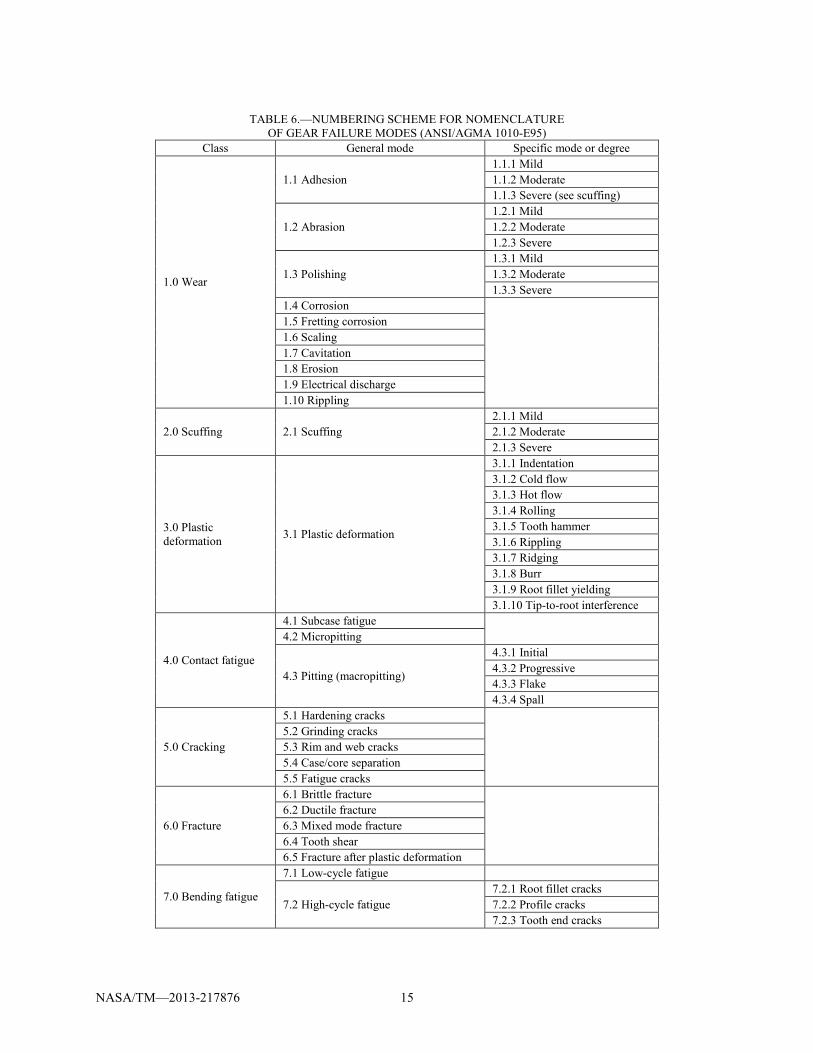
Engine Overhaul Depot. Consider the following numbering scheme for Table 5 shown in Table 6 which is similar to a coding scheme for a work breakdown structure. The Class of gear mode failure represents the top of the hierarchy. The General Mode and Specific Mode or Degree represents subsequent sub-classes. Thus, the progressive pitting example from Figure 11 can be re-categorized as 4.3.2. Performing TDA gear wear descriptions using this classification system could streamline and standardize analyses. Another potential advantage of using this system is further refinement of failure prediction algorithms.
Figure 11.—Output gear damage—progressive pitting.
NASA/TM—2013-217876 14
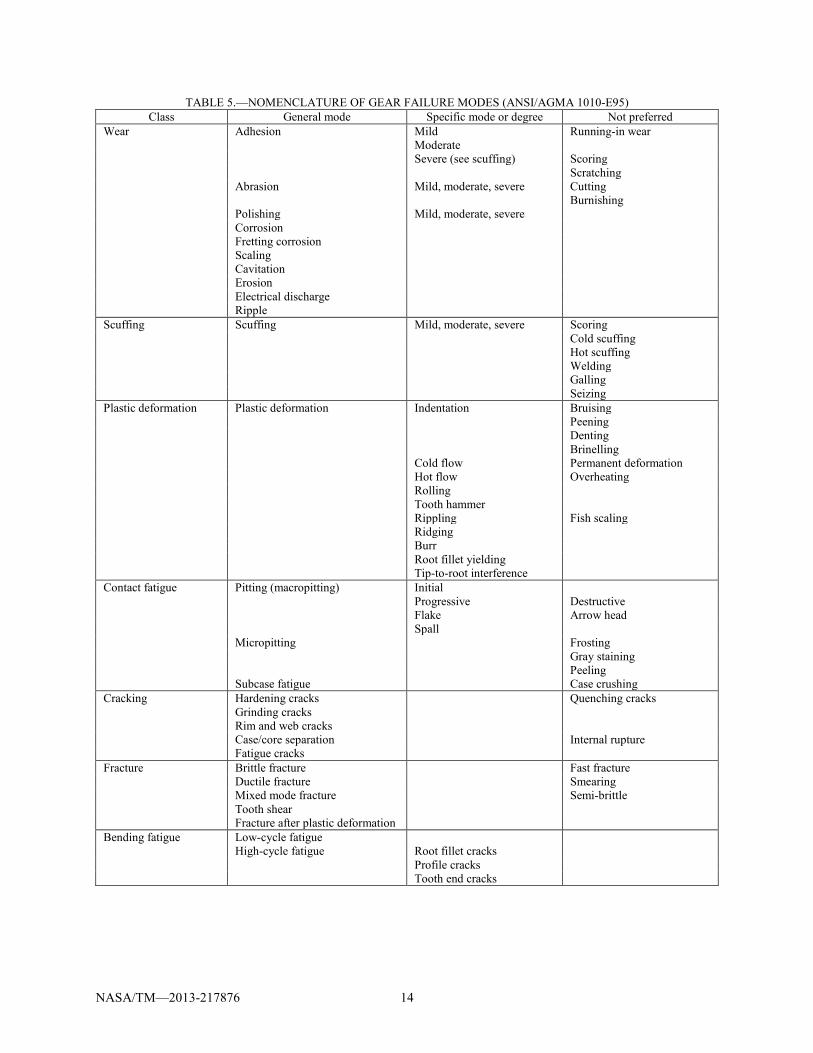
TABLE 5.—NOMENCLATURE OF GEAR FAILURE MODES (ANSI/AGMA 1010-E95) Class General mode Specific mode or degree Not preferred
Wear Adhesion Mild Running-in wear Moderate Severe (see scuffing) Scoring Scratching Abrasion Mild, moderate, severe Cutting Burnishing Polishing Mild, moderate, severe Corrosion Fretting corrosion Scaling Cavitation Erosion Electrical discharge Ripple Scuffing Scuffing Mild, moderate, severe Scoring Cold scuffing Hot scuffing Welding Galling Seizing Plastic deformation Plastic deformation Indentation Bruising Peening Denting Brinelling Cold flow Permanent deformation Hot flow Overheating Rolling Tooth hammer Rippling Fish scaling Ridging Burr Root fillet yielding Tip-to-root interference Contact fatigue Pitting (macropitting) Initial Progressive Destructive Flake Arrow head Spall Micropitting Frosting Gray staining Peeling Subcase fatigue Case crushing Cracking Hardening cracks Quenching cracks Grinding cracks Rim and web cracks Case/core separation Internal rupture Fatigue cracks Fracture Brittle fracture Fast fracture Ductile fracture Smearing Mixed mode fracture Semi-brittle Tooth shear Fracture after plastic deformation Bending fatigue Low-cycle fatigue High-cycle fatigue Root fillet cracks Profile cracks Tooth end cracks
NASA/TM—2013-217876 15
TABLE 6.—NUMBERING SCHEME FOR NOMENCLATURE
OF GEAR FAILURE MODES (ANSI/AGMA 1010-E95) Class General mode Specific mode or degree
1.0 Wear
1.1 Adhesion 1.1.1 Mild 1.1.2 Moderate 1.1.3 Severe (see scuffing)
1.2 Abrasion 1.2.1 Mild 1.2.2 Moderate 1.2.3 Severe
1.3 Polishing 1.3.1 Mild 1.3.2 Moderate 1.3.3 Severe
1.4 Corrosion 1.5 Fretting corrosion 1.6 Scaling 1.7 Cavitation 1.8 Erosion 1.9 Electrical discharge 1.10 Rippling
2.0 Scuffing 2.1 Scuffing 2.1.1 Mild 2.1.2 Moderate 2.1.3 Severe
3.0 Plastic deformation 3.1 Plastic deformation
3.1.1 Indentation 3.1.2 Cold flow 3.1.3 Hot flow 3.1.4 Rolling 3.1.5 Tooth hammer 3.1.6 Rippling 3.1.7 Ridging 3.1.8 Burr 3.1.9 Root fillet yielding 3.1.10 Tip-to-root interference
4.0 Contact fatigue
4.1 Subcase fatigue 4.2 Micropitting
4.3 Pitting (macropitting)
4.3.1 Initial 4.3.2 Progressive 4.3.3 Flake 4.3.4 Spall
5.0 Cracking
5.1 Hardening cracks 5.2 Grinding cracks 5.3 Rim and web cracks 5.4 Case/core separation 5.5 Fatigue cracks
6.0 Fracture
6.1 Brittle fracture 6.2 Ductile fracture 6.3 Mixed mode fracture 6.4 Tooth shear 6.5 Fracture after plastic deformation
7.0 Bending fatigue
7.1 Low-cycle fatigue
7.2 High-cycle fatigue 7.2.1 Root fillet cracks 7.2.2 Profile cracks 7.2.3 Tooth end cracks
NASA/TM—2013-217876 16
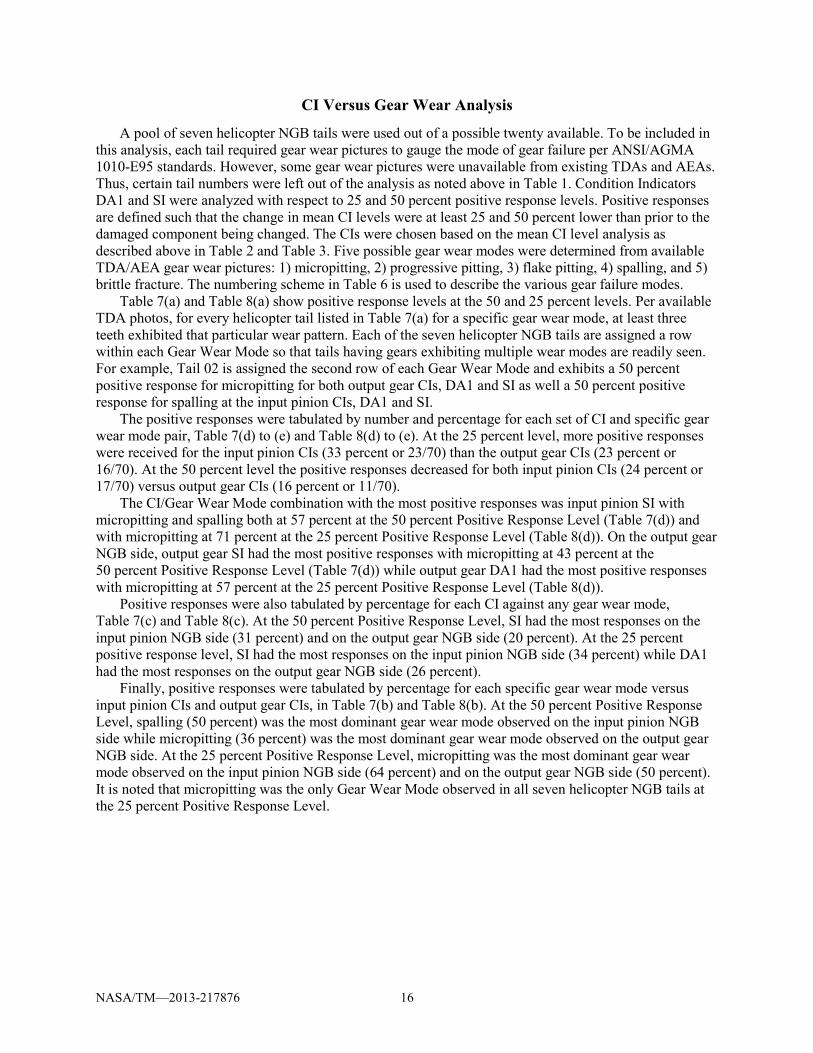
CI Versus Gear Wear Analysis
A pool of seven helicopter NGB tails were used out of a possible twenty available. To be included in this analysis, each tail required gear wear pictures to gauge the mode of gear failure per ANSI/AGMA 1010-E95 standards. However, some gear wear pictures were unavailable from existing TDAs and AEAs. Thus, certain tail numbers were left out of the analysis as noted above in Table 1. Condition Indicators DA1 and SI were analyzed with respect to 25 and 50 percent positive response levels. Positive responses are defined such that the change in mean CI levels were at least 25 and 50 percent lower than prior to the damaged component being changed. The CIs were chosen based on the mean CI level analysis as described above in Table 2 and Table 3. Five possible gear wear modes were determined from available TDA/AEA gear wear pictures: 1) micropitting, 2) progressive pitting, 3) flake pitting, 4) spalling, and 5) brittle fracture. The numbering scheme in Table 6 is used to describe the various gear failure modes.
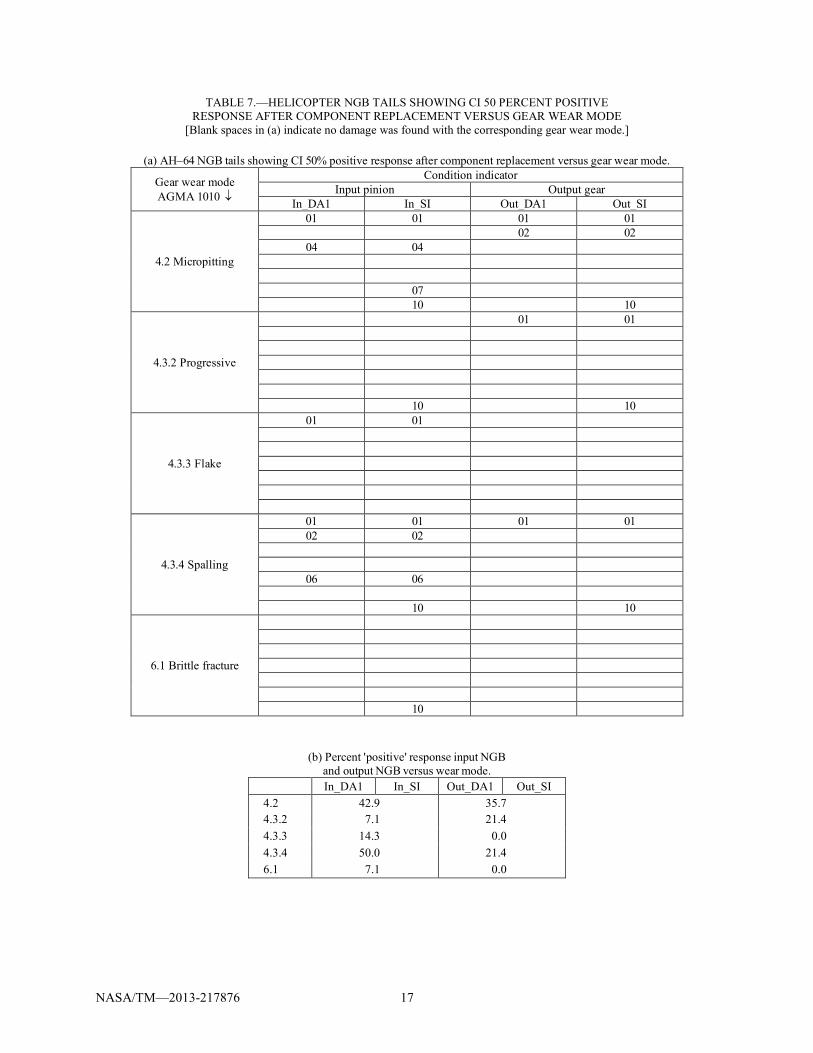
Table 7(a) and Table 8(a) show positive response levels at the 50 and 25 percent levels. Per available TDA photos, for every helicopter tail listed in Table 7(a) for a specific gear wear mode, at least three teeth exhibited that particular wear pattern. Each of the seven helicopter NGB tails are assigned a row within each Gear Wear Mode so that tails having gears exhibiting multiple wear modes are readily seen. For example, Tail 02 is assigned the second row of each Gear Wear Mode and exhibits a 50 percent positive response for micropitting for both output gear CIs, DA1 and SI as well a 50 percent positive response for spalling at the input pinion CIs, DA1 and SI.
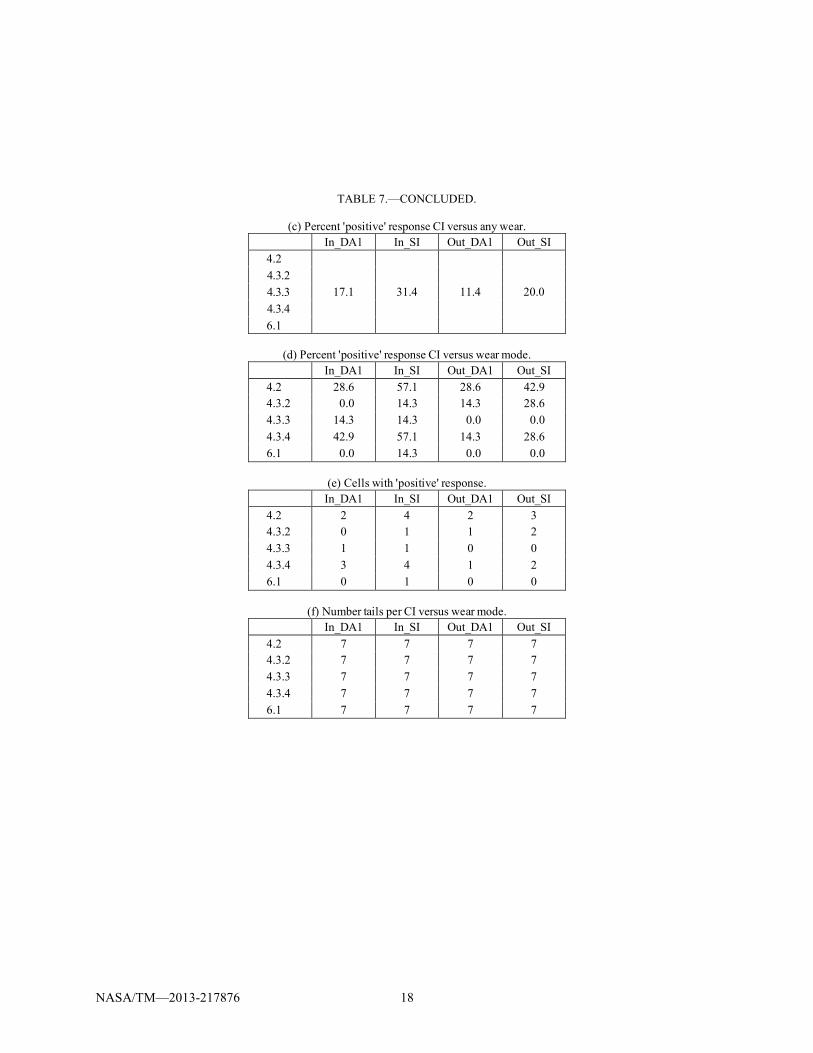
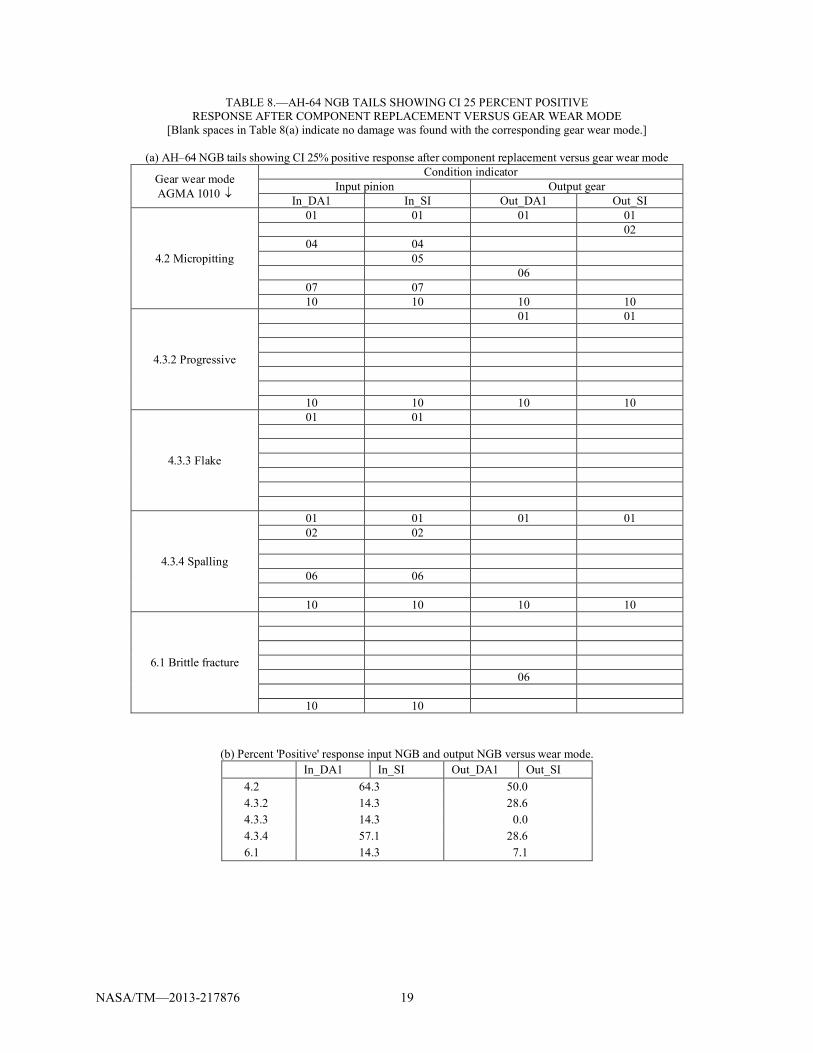
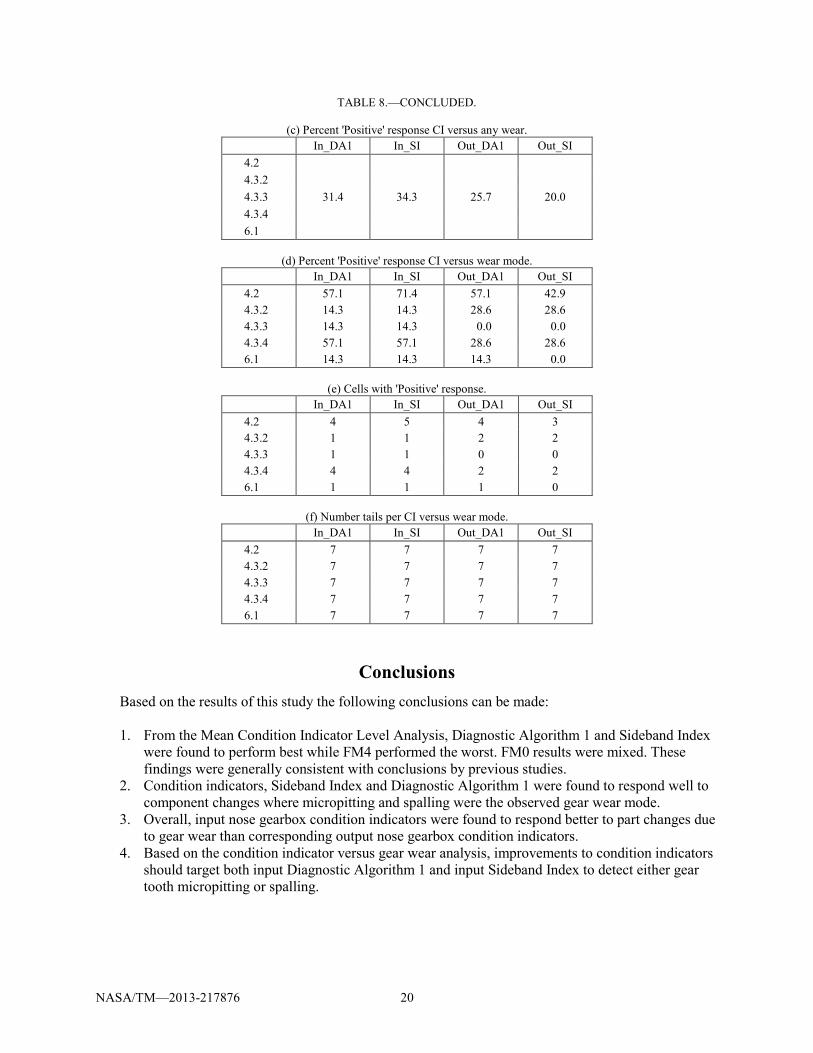
The positive responses were tabulated by number and percentage for each set of CI and specific gear wear mode pair, Table 7(d) to (e) and Table 8(d) to (e). At the 25 percent level, more positive responses were received for the input pinion CIs (33 percent or 23/70) than the output gear CIs (23 percent or 16/70). At the 50 percent level the positive responses decreased for both input pinion CIs (24 percent or 17/70) versus output gear CIs (16 percent or 11/70).
The CI/Gear Wear Mode combination with the most positive responses was input pinion SI with micropitting and spalling both at 57 percent at the 50 percent Positive Response Level (Table 7(d)) and with micropitting at 71 percent at the 25 percent Positive Response Level (Table 8(d)). On the output gear NGB side, output gear SI had the most positive responses with micropitting at 43 percent at the 50 percent Positive Response Level (Table 7(d)) while output gear DA1 had the most positive responses with micropitting at 57 percent at the 25 percent Positive Response Level (Table 8(d)).
Positive responses were also tabulated by percentage for each CI against any gear wear mode, Table 7(c) and Table 8(c). At the 50 percent Positive Response Level, SI had the most responses on the input pinion NGB side (31 percent) and on the output gear NGB side (20 percent). At the 25 percent positive response level, SI had the most responses on the input pinion NGB side (34 percent) while DA1 had the most responses on the output gear NGB side (26 percent).
Finally, positive responses were tabulated by percentage for each specific gear wear mode versus input pinion CIs and output gear CIs, in Table 7(b) and Table 8(b). At the 50 percent Positive Response Level, spalling (50 percent) was the most dominant gear wear mode observed on the input pinion NGB side while micropitting (36 percent) was the most dominant gear wear mode observed on the output gear NGB side. At the 25 percent Positive Response Level, micropitting was the most dominant gear wear mode observed on the input pinion NGB side (64 percent) and on the output gear NGB side (50 percent). It is noted that micropitting was the only Gear Wear Mode observed in all seven helicopter NGB tails at the 25 percent Positive Response Level.
NASA/TM—2013-217876 17
TABLE 7.—HELICOPTER NGB TAILS SHOWING CI 50 PERCENT POSITIVE RESPONSE AFTER COMPONENT REPLACEMENT VERSUS GEAR WEAR MODE
[Blank spaces in (a) indicate no damage was found with the corresponding gear wear mode.]
(a) AH–64 NGB tails showing CI 50% positive response after component replacement versus gear wear mode.
Gear wear mode AGMA 1010 ↓
Condition indicator Input pinion Output gear
In_DA1 In_SI Out_DA1 Out_SI
4.2 Micropitting
01 01 01 01 02 02
04 04 07 10 10
4.3.2 Progressive
01 01 10 10
4.3.3 Flake
01 01
4.3.4 Spalling
01 01 01 01 02 02
06 06 10 10
6.1 Brittle fracture
10
(b) Percent 'positive' response input NGB and output NGB versus wear mode.
In_DA1 In_SI Out_DA1 Out_SI 4.2 42.9 35.7 4.3.2 7.1 21.4 4.3.3 14.3 0.0 4.3.4 50.0 21.4 6.1 7.1 0.0
NASA/TM—2013-217876 18
TABLE 7.—CONCLUDED.
(c) Percent 'positive' response CI versus any wear. In_DA1 In_SI Out_DA1 Out_SI
4.2
17.1 31.4 11.4 20.0 4.3.2 4.3.3 4.3.4 6.1
(d) Percent 'positive' response CI versus wear mode. In_DA1 In_SI Out_DA1 Out_SI
4.2 28.6 57.1 28.6 42.9 4.3.2 0.0 14.3 14.3 28.6 4.3.3 14.3 14.3 0.0 0.0 4.3.4 42.9 57.1 14.3 28.6 6.1 0.0 14.3 0.0 0.0
(e) Cells with 'positive' response.
In_DA1 In_SI Out_DA1 Out_SI 4.2 2 4 2 3 4.3.2 0 1 1 2 4.3.3 1 1 0 0 4.3.4 3 4 1 2 6.1 0 1 0 0
(f) Number tails per CI versus wear mode.
In_DA1 In_SI Out_DA1 Out_SI 4.2 7 7 7 7 4.3.2 7 7 7 7 4.3.3 7 7 7 7 4.3.4 7 7 7 7 6.1 7 7 7 7
NASA/TM—2013-217876 19
TABLE 8.—AH-64 NGB TAILS SHOWING CI 25 PERCENT POSITIVE RESPONSE AFTER COMPONENT REPLACEMENT VERSUS GEAR WEAR MODE
[Blank spaces in Table 8(a) indicate no damage was found with the corresponding gear wear mode.]
(a) AH–64 NGB tails showing CI 25% positive response after component replacement versus gear wear mode
Gear wear mode AGMA 1010 ↓
Condition indicator Input pinion Output gear
In_DA1 In_SI Out_DA1 Out_SI
4.2 Micropitting
01 01 01 01 02
04 04 05 06
07 07 10 10 10 10
4.3.2 Progressive
01 01
10 10 10 10
4.3.3 Flake
01 01
4.3.4 Spalling
01 01 01 01 02 02
06 06
10 10 10 10
6.1 Brittle fracture
06
10 10
(b) Percent 'Positive' response input NGB and output NGB versus wear mode.
In_DA1 In_SI Out_DA1 Out_SI 4.2 64.3 50.0 4.3.2 14.3 28.6 4.3.3 14.3 0.0 4.3.4 57.1 28.6 6.1 14.3 7.1
NASA/TM—2013-217876 20
TABLE 8.—CONCLUDED.
(c) Percent 'Positive' response CI versus any wear. In_DA1 In_SI Out_DA1 Out_SI
4.2
31.4 34.3 25.7 20.0 4.3.2 4.3.3 4.3.4 6.1
(d) Percent 'Positive' response CI versus wear mode.
In_DA1 In_SI Out_DA1 Out_SI 4.2 57.1 71.4 57.1 42.9 4.3.2 14.3 14.3 28.6 28.6 4.3.3 14.3 14.3 0.0 0.0 4.3.4 57.1 57.1 28.6 28.6 6.1 14.3 14.3 14.3 0.0
(e) Cells with 'Positive' response.
In_DA1 In_SI Out_DA1 Out_SI 4.2 4 5 4 3 4.3.2 1 1 2 2 4.3.3 1 1 0 0 4.3.4 4 4 2 2 6.1 1 1 1 0
(f) Number tails per CI versus wear mode.
In_DA1 In_SI Out_DA1 Out_SI 4.2 7 7 7 7 4.3.2 7 7 7 7 4.3.3 7 7 7 7 4.3.4 7 7 7 7 6.1 7 7 7 7
Conclusions Based on the results of this study the following conclusions can be made: 1. From the Mean Condition Indicator Level Analysis, Diagnostic Algorithm 1 and Sideband Index
were found to perform best while FM4 performed the worst. FM0 results were mixed. These findings were generally consistent with conclusions by previous studies.
2. Condition indicators, Sideband Index and Diagnostic Algorithm 1 were found to respond well to component changes where micropitting and spalling were the observed gear wear mode.
3. Overall, input nose gearbox condition indicators were found to respond better to part changes due to gear wear than corresponding output nose gearbox condition indicators.
4. Based on the condition indicator versus gear wear analysis, improvements to condition indicators should target both input Diagnostic Algorithm 1 and input Sideband Index to detect either gear tooth micropitting or spalling.
NASA/TM—2013-217876 21
Recommendations for Improved Analysis Capabilities: 1. It is possible that not all gear teeth were photographed in the tear-down analysis reports. Thus
actual damage levels may differ than from what was reported. It is suggested that all gear teeth on damaged nose gear box be photographed in a consistent manner such that the type of damaged can be documented per ANSI/AGMA 1010-E95 standards.
2. If not already implemented, any damaged gears should be stored for further analysis.
References
1. “Evaluation of Gear Condition Indicator Performance on Rotorcraft Fleet,” Antolick, Lance; Branning, Jeremy; Dempsey, Paula; Wade, Daniel. 66th American Helicopter Society International Annual Forum 2010, Phoenix, AZ. 11-13 May 2010.
2. ADS-79C-HDBK, Aeronautical Design Standard Handbook for Condition Based Maintenance Systems for U.S. Army Aircraft. 12 Jan. 2012.
3. ANSI/AGMA 1010-E95. Appearance of Gear Teeth – Terminology of Wear and Failure. 4. http://aircraft-photographs.s3-website-eu-west-1.amazonaws.com/Airshow-h2.jpg 5. “A Perspective on condition Monitoring in U.S. Army Aviation,” Keller, Jonathan, Ph.D. Wind
Turbine Condition Monitoring Workshop, 20 Sep. 2011. 6. “An Investigation of Gear Mesh Failure Prediction Techniques,” Zakrajsek, James J. NASA TM–
102340, Nov. 1989. 7. Szczeptanik, J., “Time Synchronous Averaging of Ball Mill Vibration,” Mechanical Systems and
Signal Processing, Vol. 3, No. 1, p. 99, Jan. 1989.
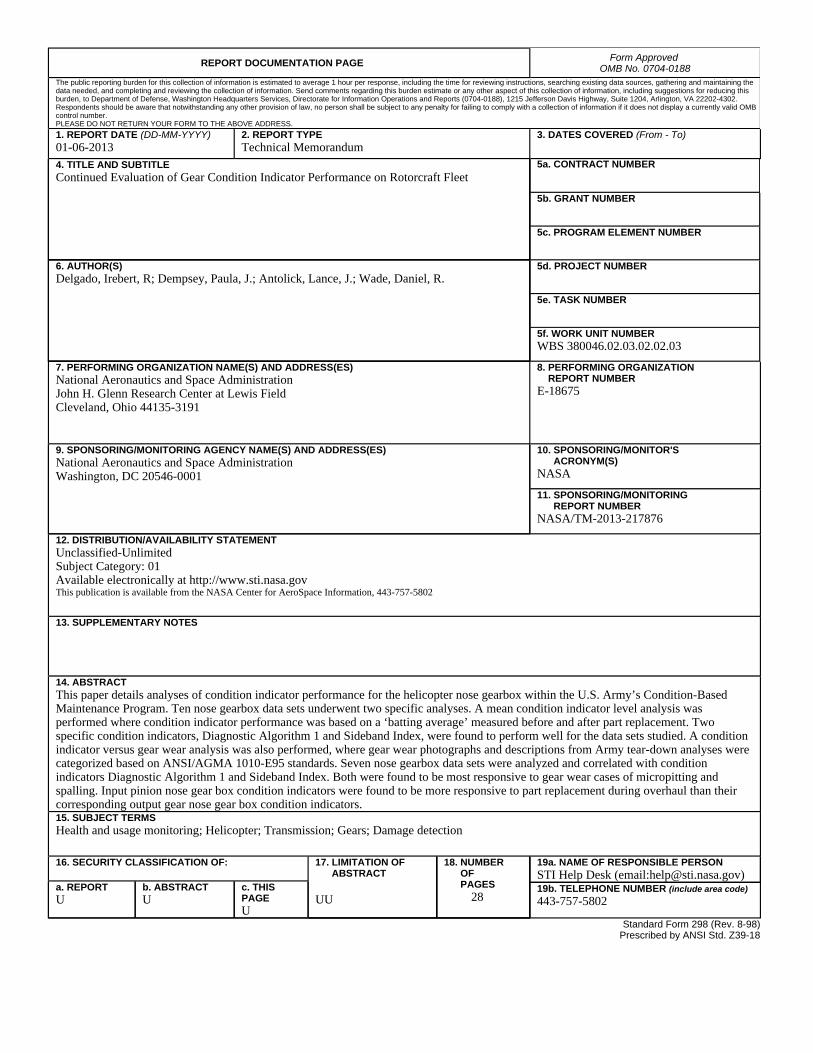
REPORT DOCUMENTATION PAGE Form Approved OMB No. 0704-0188
The public reporting burden for this collection of information is estimated to average 1 hour per response, including the time for reviewing instructions, searching existing data sources, gathering and maintaining the data needed, and completing and reviewing the collection of information. Send comments regarding this burden estimate or any other aspect of this collection of information, including suggestions for reducing this burden, to Department of Defense, Washington Headquarters Services, Directorate for Information Operations and Reports (0704-0188), 1215 Jefferson Davis Highway, Suite 1204, Arlington, VA 22202-4302. Respondents should be aware that notwithstanding any other provision of law, no person shall be subject to any penalty for failing to comply with a collection of information if it does not display a currently valid OMB control number. PLEASE DO NOT RETURN YOUR FORM TO THE ABOVE ADDRESS.
1. REPORT DATE (DD-MM-YYYY) 01-06-2013
2. REPORT TYPE Technical Memorandum
3. DATES COVERED (From - To)
4. TITLE AND SUBTITLE Continued Evaluation of Gear Condition Indicator Performance on Rotorcraft Fleet
5a. CONTRACT NUMBER
5b. GRANT NUMBER
5c. PROGRAM ELEMENT NUMBER
6. AUTHOR(S) Delgado, Irebert, R; Dempsey, Paula, J.; Antolick, Lance, J.; Wade, Daniel, R.
5d. PROJECT NUMBER
5e. TASK NUMBER
5f. WORK UNIT NUMBER WBS 380046.02.03.02.02.03
7. PERFORMING ORGANIZATION NAME(S) AND ADDRESS(ES) National Aeronautics and Space Administration John H. Glenn Research Center at Lewis Field Cleveland, Ohio 44135-3191
8. PERFORMING ORGANIZATION REPORT NUMBER E-18675
9. SPONSORING/MONITORING AGENCY NAME(S) AND ADDRESS(ES) National Aeronautics and Space Administration Washington, DC 20546-0001
10. SPONSORING/MONITOR'S ACRONYM(S) NASA
11. SPONSORING/MONITORING REPORT NUMBER NASA/TM-2013-217876
12. DISTRIBUTION/AVAILABILITY STATEMENT Unclassified-Unlimited Subject Category: 01 Available electronically at http://www.sti.nasa.gov This publication is available from the NASA Center for AeroSpace Information, 443-757-5802
13. SUPPLEMENTARY NOTES
14. ABSTRACT This paper details analyses of condition indicator performance for the helicopter nose gearbox within the U.S. Army’s Condition-Based Maintenance Program. Ten nose gearbox data sets underwent two specific analyses. A mean condition indicator level analysis was performed where condition indicator performance was based on a ‘batting average’ measured before and after part replacement. Two specific condition indicators, Diagnostic Algorithm 1 and Sideband Index, were found to perform well for the data sets studied. A condition indicator versus gear wear analysis was also performed, where gear wear photographs and descriptions from Army tear-down analyses were categorized based on ANSI/AGMA 1010-E95 standards. Seven nose gearbox data sets were analyzed and correlated with condition indicators Diagnostic Algorithm 1 and Sideband Index. Both were found to be most responsive to gear wear cases of micropitting and spalling. Input pinion nose gear box condition indicators were found to be more responsive to part replacement during overhaul than their corresponding output gear nose gear box condition indicators. 15. SUBJECT TERMS Health and usage monitoring; Helicopter; Transmission; Gears; Damage detection
16. SECURITY CLASSIFICATION OF: 17. LIMITATION OF ABSTRACT UU
18. NUMBER OF PAGES
28
19a. NAME OF RESPONSIBLE PERSON STI Help Desk (email:[email protected])
a. REPORT U
b. ABSTRACT U
c. THIS PAGE U
19b. TELEPHONE NUMBER (include area code) 443-757-5802
Standard Form 298 (Rev. 8-98)Prescribed by ANSI Std. Z39-18