Embed Size (px)
Citation preview
Developing a Financial Condition Indicator System (FCIS) for New York State School Districts
Condition Reports Public ForumJune 6, 2003
William Duncombe, Bernard Jump, Syracuse UniversitySalwa Ammar, Ronald Wright, Le Moyne [email protected] at: http://www-cpr.maxwell.syr.edu/faculty/duncombe/

School Districts Are Facing Unprecedented Fiscal Stress Many states are facing large budget deficits:
$30 billion in FY 2003 $80 billion in FY 2004
At least 18 states have budget gap of 10% or more. State education budgets will not be spared:
Predicted that half of the states will cut state education budgets in FY2004
At same time that state and federal accountability standards are being imposed.

Need for Greater Visibility on School District Financial Condition General public usually has little awareness of
school financial condition until a crisis emerges. By then the choices are often limited and can
require painful expenditure cuts or tax increases. The best prevention against financial
emergencies is regular monitoring of district fiscal health, and appropriate budget adjustments.

Objectives of Project To develop a FCIS that captured the multiple
dimensions of financial condition. To develop a modular system, where the different
components of financial condition can be used separately.
To develop a system that can effectively use the judgment of financial experts.
To develop a system that is flexible, and can adapt to changing circumstances.
Outline of Presentation Framework for Financial Condition
Indicator System (FCIS) Development process and methodology FCIS example Overall results Potential uses of FCIS

Definition of Overall Financial Condition Used in building FCIS Financial condition of school districts is
defined as the ability to finance adequate student performance over the long-run with reasonable tax burdens and without temporary disruptions of service.
Adequate student performance implies students reaching the academic standards set by the New York State Board of Regents.

Financial Condition Framework
Overall FinancialCondition
LR Financial Condition
Student Performance
SR Financial Condition
Economic Condition
Note: Composite measures (rule bases) are shaded.

Short-Run Financial Condition Ability to pay bills over the course of the year,
balance the budget, and maintain adequate fund balance without extraordinary measures. Categories of indicators include: Liquidity: Ability to pay bills. Fund balance: Does district have adequate reserves
to cover financial emergencies? Tax capacity: Can district raise significant revenue
without heavy tax burden or political opposition?

Long-Run Financial Condition Ability to finance adequate services over the long-run
without onerous tax burdens and debt burdens. Consider similar factors as credit rating agencies: Debt burdens/Capital spending: Can district support
adequate capital spending without undue debt burdens? Fund balances: Can the district maintain adequate reserves
to protect itself against financial emergencies? Revenue indicators: Does the district have a diversified and
stable revenue base that can support adequate spending without high tax burdens?
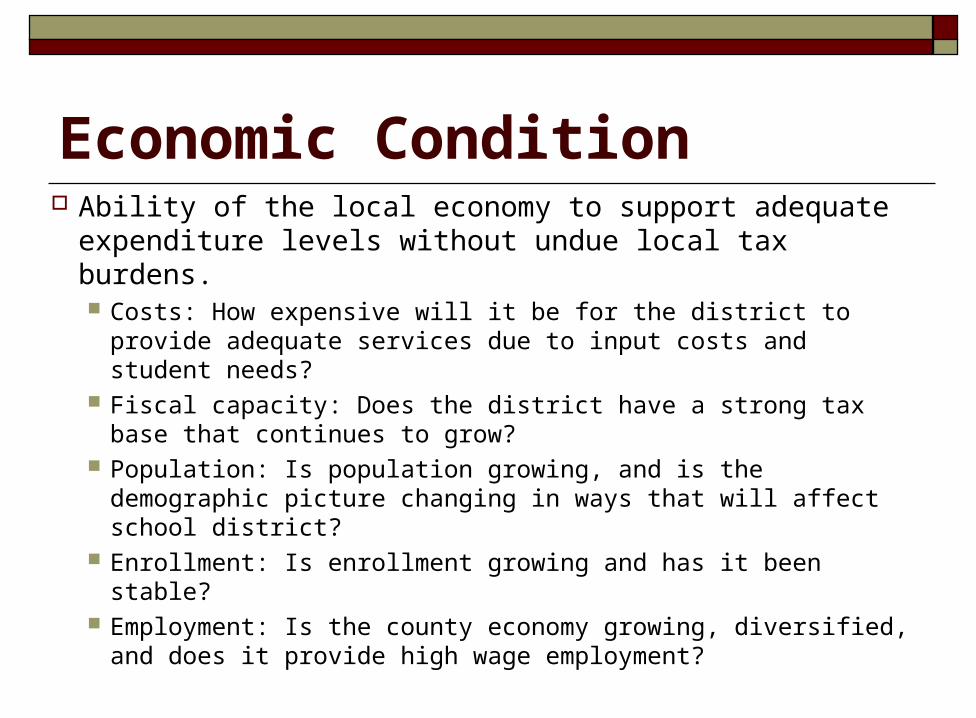
Economic Condition Ability of the local economy to support adequate
expenditure levels without undue local tax burdens. Costs: How expensive will it be for the district to provide
adequate services due to input costs and student needs? Fiscal capacity: Does the district have a strong tax base that
continues to grow? Population: Is population growing, and is the demographic
picture changing in ways that will affect school district? Enrollment: Is enrollment growing and has it been stable? Employment: Is the county economy growing, diversified,
and does it provide high wage employment?

Student Performance Measure Based on published data in school report cards, and
measures used in System for Accountability for Student Success (SASS) developed by SED. 4th and 8th Math and ELA Exams: Percent of students
reaching levels 2, 3, and 4. Regents Math and English: Percent of students (who
entered high school 3-years before) that received a 55 to 64 (level 2), 65 to 84 (level 3), and 85 and above (level 4).

Outline of Presentation Framework for Financial Condition Indicator
System (FCIS) Development process and methodology FCIS example Overall results Potential uses of FCIS
Our Approach to Developing FCIS
SED appointed an advisory board to serve as panel of experts.
Developed a comprehensive framework for evaluating financial condition.
Advisory board played a key role in selecting and refining the measures used in the system.
Used state-of-the-art technology to capture the judgment of the advisory board on how to combine measures into an overall evaluation.

Advisory BoardSteven Hancox, Assistant Deputy Comptroller for Municipal AffairsJack Dougherty, Chief Examiner (Performance Services and Risk Assessment)John Clarkson, Assistant ComptrollerOffice of the State Comptroller
George Perry, Executive DirectorSteven VanHoesen, Deputy DirectorNYS Association of School Business Officials
Robert Loretan, Emeritus Director Tom Rogers, Executive DirectorBob Lowry, Associate Director for Governmental RelationsNew York State Council of School Superintendents
Tim Kremer, Executive DirectorDavid LittleNew York State School Boards Association

Advisory BoardMartin D. Handler, District SuperintendentSullivan County BOCES
Marianne VanDuyneR.S. Abrams and Company
Terry Schruers, Assistant Superintendent for BusinessNew Hartford Central School District
Shane Higuera, Associate Superintendent of Management Services Eastern Suffolk BOCES
Charles Szuberla, Coordinator, Office of School Operations and Management ServicesDeborah Cunningham, State Aid Work Group Coordination and Cost-EffectivenessDan Tworek, Director, Audit ServicesMichael Abbott, Audit Manager, Office of Audit ServicesNYSED
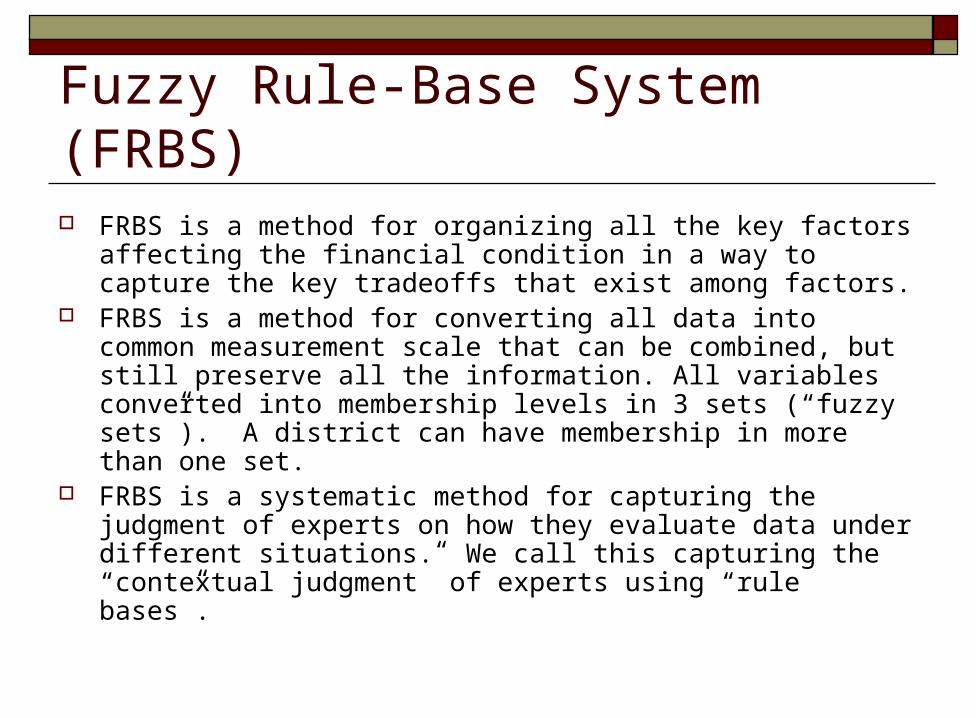
Methodology Used for FCIS: Fuzzy Rule-Base System (FRBS) FRBS is a method for organizing all the key factors affecting
the financial condition in a way to capture the key tradeoffs that exist among factors.
FRBS is a method for converting all data into common measurement scale that can be combined, but still preserve all the information. All variables converted into membership levels in 3 sets (“fuzzy sets”). A district can have membership in more than one set.
FRBS is a systematic method for capturing the judgment of experts on how they evaluate data under different situations. We call this capturing the “contextual judgment” of experts using “rule bases”.

Outline of Presentation Framework for Financial Condition Indicator
System (FCIS) Development process and methodology FCIS example Overall results Potential uses of FCIS

District AOverall
Poor Fair Good0.63 0.37 0.25
Short RunPoor Fair Good0.01 0.70 0.30
PerformanceLow Mod High1.00 0.00 0.00
EconomyPoor Fair Good0.63 0.37 0.00
Long RunPoor Fair Good0.01 0.75 0.25
114.3
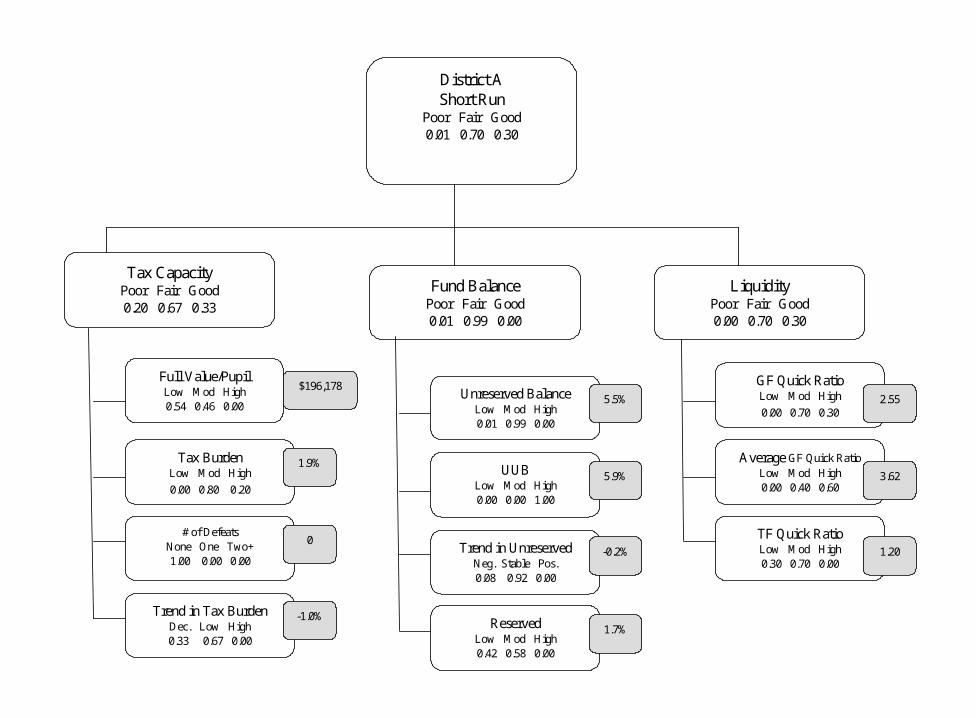
District AShort Run
Poor Fair Good0.01 0.70 0.30
Tax CapacityPoor Fair Good0.20 0.67 0.33
Fund BalancePoor Fair Good0.01 0.99 0.00
LiquidityPoor Fair Good0.00 0.70 0.30
Full Value/PupilLow Mod High0.54 0.46 0.00
Trend in Tax BurdenDec. Low High0.33 0.67 0.00
Tax BurdenLow Mod High
0.00 0.80 0.20
# of DefeatsNone One Two+1.00 0.00 0.00
Unreserved BalanceLow Mod High0.01 0.99 0.00
ReservedLow Mod High0.42 0.58 0.00
UUBLow Mod High0.00 0.00 1.00
Trend in UnreservedNeg. Stable Pos.0.08 0.92 0.00
GF Quick RatioLow Mod High
0.00 0.70 0.30
Average GF Quick RatioLow Mod High0.00 0.40 0.60
TF Quick RatioLow Mod High0.30 0.70 0.00
$196,178
1.9%
0
-1.0%
5.5%
5.9%
-0.2%
1.7%
2.55
3.62
1.20

Fund BalanceSee Short Run
District A
Long Run Poor Fair Good0.01 0.75 0.25
DebtPoor Fair Good0.00 0.74 0.26
RevenuePoor Fair Good0.20 0.75 0.25
BurdenHigh Mod Low0.00 0.06 0.94
Capital SpendingLow Mod High0.74 0.26 0.00
LimitLow Mod High1.00 0.00 0.00
Adj. Debt Vs FVLow Mod High0.94 0.06 0.00
Debt Vs FVLow Mod High0.89 0.11 0.00
Debt ServiceLow Mod High0.66 0.34 0.00
Payoff RateLow Mod High0.00 0.00 1.00
11-year averageLow Mod High0.74 0.26 0.00
3-year averageLow Mod High0.82 0.18 0.00
Property TaxPoor Fair Good0.20 0.75 0.25
% of FVLow Mod High0.00 0.80 0.20
% of incomeLow Mod High0.25 0.75 0.00
FV/ EnrollmentLow Mod High0.54 0.46 0.00
Income/EnrollmentLow Mod High0.00 1.00 0.00
Tax BurdenPoor Fair Good0.20 0.75 0.25
TrendNeg. Low High0.00 0.60 0.40
DefeatsNone One Two+
1.00 0.00 0.00
AV/FVLow Mod High0.72 0.28 0.00
Total AidLow Mod High0.00 0.31 0.69
DiversityHigh Mod Low0.00 0.83 0.17
StabilityHigh Mod Low0.47 0.53 0.00
3.5%
67.8%%2.8%90%
0.04%
0.2%
1.3%
23.2%
$322
$2461.9%
3.8%
$196,178
3.5%
0
25.7%
$97,771

DebtPoor Fair Good0.00 0.74 0.26
Debt BurdenHigh Mod Low0.00 0.06 0.94
Capital SpendingLow Mod High0.74 0.26 0.00
Debt LimitLow Mod High1.00 0.00 0.00
Adj. Debt Vs FVLow Mod High0.94 0.06 0.00
Debt Vs FVLow Mod High0.89 0.11 0.00
Debt ServiceLow Mod High0.66 0.34 0.00
Payoff RateLow Mod High0.00 0.00 1.00
11-year averageLow Mod High0.74 0.26 0.00
3-year averageLow Mod High0.82 0.18 0.00
3.5%
0.04%
0.2%
1.3%
23.2%
$322
$246

RevenuePoor Fair Good0.20 0.75 0.25
Property TaxPoor Fair Good0.20 0.75 0.25
% of FVLow Mod High0.00 0.80 0.20
% of incomeLow Mod High0.25 0.75 0.00
FV/ EnrollmentLow Mod High0.54 0.46 0.00
Income/EnrollmentLow Mod High0.00 1.00 0.00
Tax Burden
Poor Fair Good0.20 0.75 0.25
TrendNeg. Low High0.00 0.60 0.40
DefeatsNone One Two+
1.00 0.00 0.00
AV/FVLow Mod High0.72 0.28 0.00
Aid DependenceLow Mod High0.00 0.31 0.69
DiversityHigh Mod Low0.00 0.83 0.17
StabilityHigh Mod Low0.47 0.53 0.00
67.8%
2.8%
90%
1.9%
3.8%
$196,178
3.5%
0
25.7%
$97,771

District A
EconomyPoor Fair Good0.63 0.37 0.10
CostPoor Fair Good1.00 0.00 0.00
Student NeedsPoor Fair Good1.00 0.00 0.00
SparsityPoor Fair Good0.00 0.00 1.00
Regional CostLow Mod High0.00 0.19 0.81
Free LunchLow Mod High0.00 0.00 1.00
LEPNone Mod High0.00 0.55 0.45
High CostLow Mod High0.00 0.00 1.00
EnrollmentLow Mod High0.00 0.20 0.80
Pupil DensityLow Mod High0.00 0.20 0.80
EmploymentPoor Fair Good0.00 0.19 0.81
GrowthLow Mod High0.00 0.99 0.01
Enr. per CapitaLow Mod High0.41 0.59 0.00
Trend in Enr per CapitaNeg. Stable Pos.0.52 0.48 0.00
Pop/EnrPoor Fair Good0.00 0.59 0.41
116.17
72%
4.0%
2.5%
3000-5000
700
0.35%
14.4%
-1.3%
FV/EnrollmentLow Mod High0.54 0.46 0.00
Income/EnrollmentLow Mod High0.00 1.00 0.00
FV GrowthLow Mod High1.00 0.00 0.00
Income GrowthLow Mod High
0.63 0.37 0.00
$196,178
$97,771
-3.4%
3.7%
FiscalPoor Fair Good0.63 0.37 0.00
PopulationPoor Fair Good0.00 0.59 0.41
EnrollmentPoor Fair Good0.00 0.56 0.44
High WageLow Mod High0.03 0.97 0.00
UnemploymentLow Mod High0.84 0.16 0.00
Growth ’00-‘02Neg. None Pos.0.00 0.19 0.81
Growth ’96-‘00Neg. None Pos.0.00 0.29 0.71
3.5%
35%
0.9%
0.9%
Growth ’91-‘01Low Mod High0.00 0.57 0.43
Growth ’96-‘01Low Mod High0.00 0.39 0.61
Stability ’91-‘01High Mod Low0.00 0.44 0.56
Stability ’96-‘01High Mod Low0.21 0.89 0.00
1.7%
2.1%
5.6%
1.3%
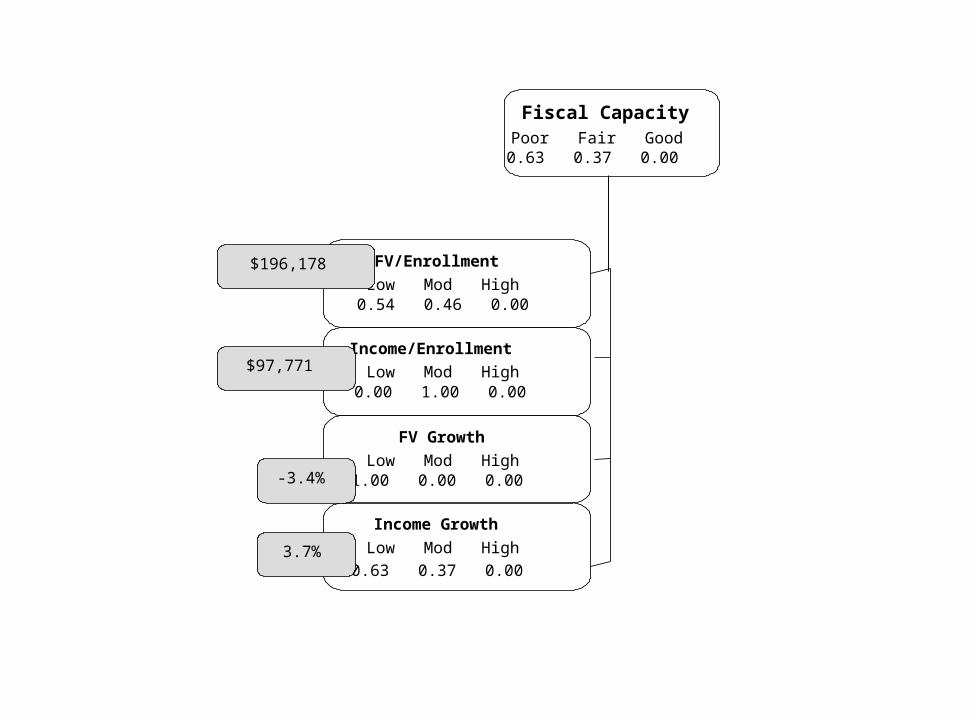
FV/Enrollment
Low Mod High0.54 0.46 0.00
Income/Enrollment
Low Mod High0.00 1.00 0.00
FV Growth
Low Mod High1.00 0.00 0.00
Income Growth
Low Mod High
0.63 0.37 0.00
$196,178
$97,771
-3.4%
3.7%
Fiscal CapacityPoor Fair Good0.63 0.37 0.00

CostPoor Fair Good1.00 0.00 0.00
Student NeedsPoor Fair Good1.00 0.00 0.00
SparsityPoor Fair Good0.00 0.00 1.00
Regional CostLow Mod High0.00 0.19 0.81
Free LunchLow Mod High0.00 0.00 1.00
LEPNone Mod High0.00 0.55 0.45
High CostLow Mod High0.00 0.00 1.00
EnrollmentLow Mod High0.00 0.20 0.80
Pupil DensityLow Mod High0.00 0.20 0.80
116.17
72%
4.0%
2.5%
3000-5000
700
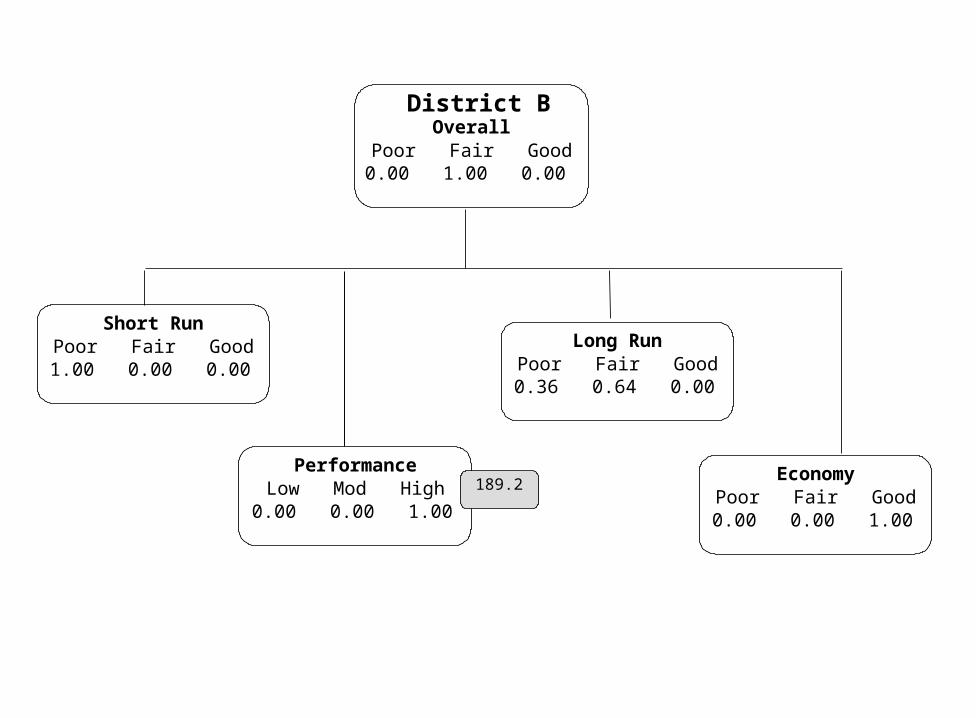
District BOverall
Poor Fair Good0.00 1.00 0.00
Short RunPoor Fair Good1.00 0.00 0.00
PerformanceLow Mod High0.00 0.00 1.00
EconomyPoor Fair Good0.00 0.00 1.00
Long RunPoor Fair Good0.36 0.64 0.00
189.2

Outline of Presentation Framework for Financial Condition Indicator
System (FCIS) Development process and methodology FCIS example Overall results Potential uses of FCIS

Relationship between Measures SR condition and LR condition are highly
related (0.76), but they are not correlated strongly with economic condition.
SR condition is not strongly related to property values or income.
Revenue, economic condition, and student performance are strongly related to property values and income.
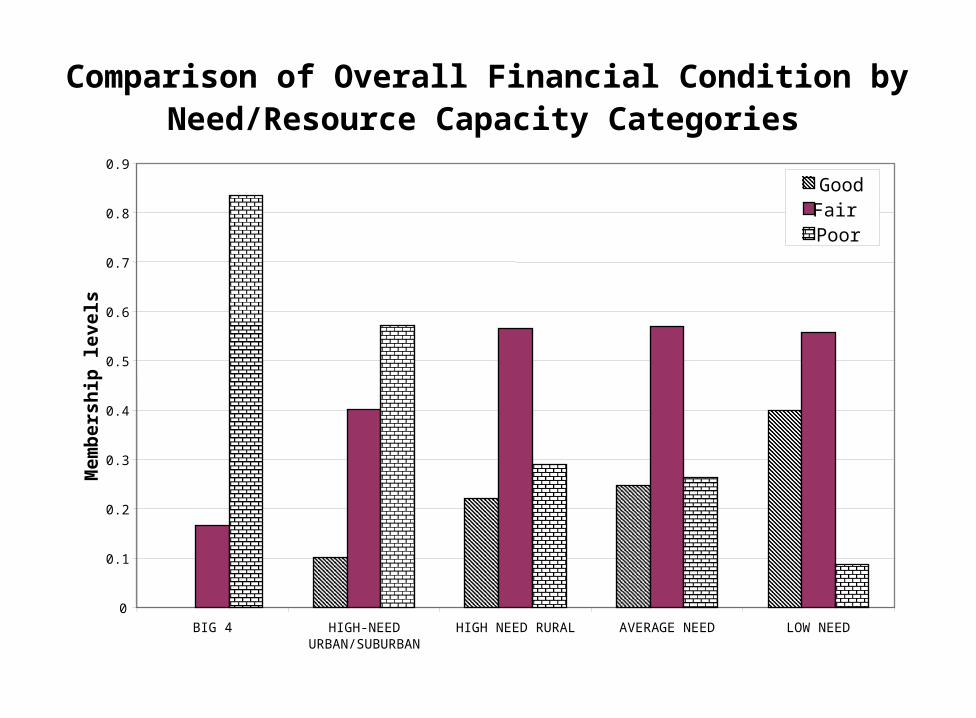
Comparison of Overall Financial Condition by Need/Resource Capacity Categories
0
0.1
0.2
0.3
0.4
0.5
0.6
0.7
0.8
0.9
BIG 4 HIGH-NEEDURBAN/SUBURBAN
HIGH NEED RURAL AVERAGE NEED LOW NEED
Mem
ber
ship
lev
els
GoodFairPoor
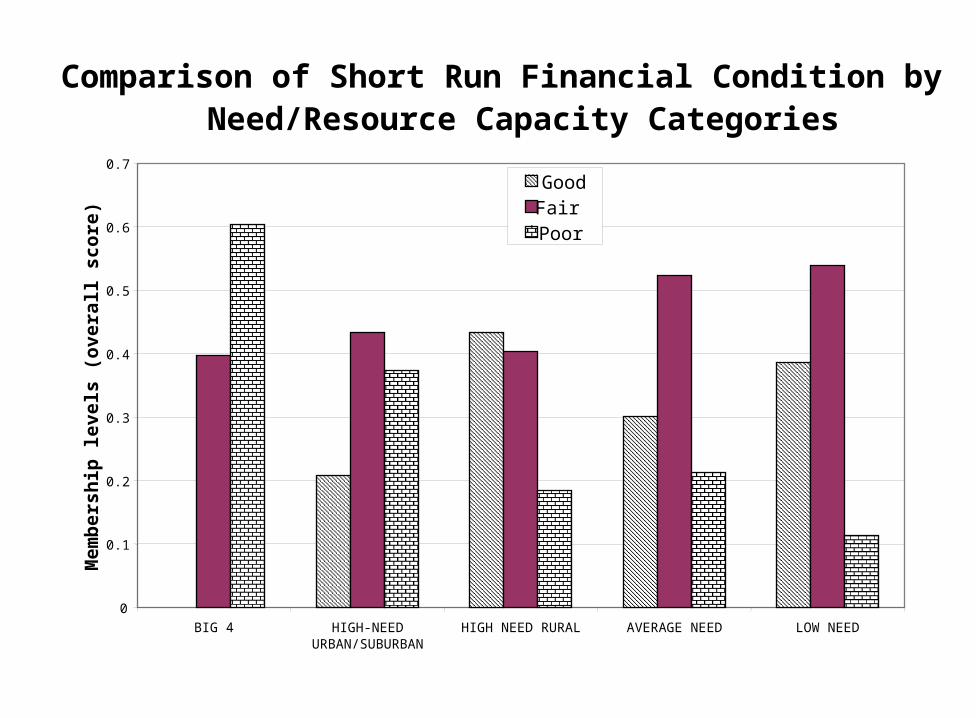
Comparison of Short Run Financial Condition by Need/Resource Capacity Categories
0
0.1
0.2
0.3
0.4
0.5
0.6
0.7
BIG 4 HIGH-NEEDURBAN/SUBURBAN
HIGH NEED RURAL AVERAGE NEED LOW NEED
Mem
ber
ship
lev
els
(ove
rall
sco
re)
GoodFairPoor
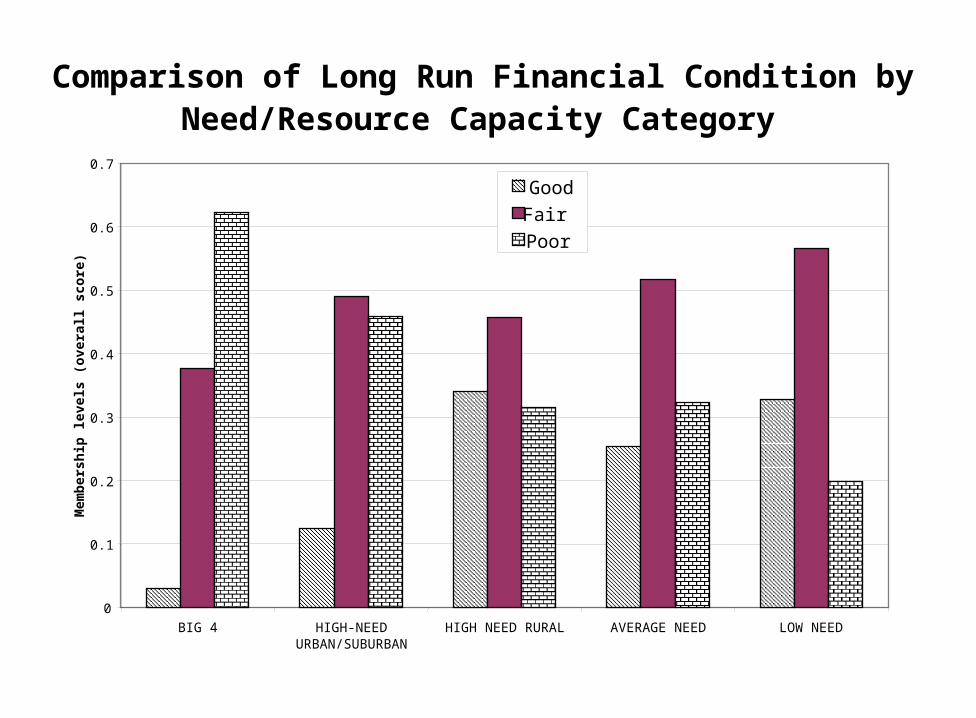
Comparison of Long Run Financial Condition by Need/Resource Capacity Category
0
0.1
0.2
0.3
0.4
0.5
0.6
0.7
BIG 4 HIGH-NEEDURBAN/SUBURBAN
HIGH NEED RURAL AVERAGE NEED LOW NEED
Mem
ber
ship
leve
ls (
ove
rall
sco
re)
Good
Fair
Poor

Comparison of Economic Condition by Need/Resource Capacity Categories
0
0.1
0.2
0.3
0.4
0.5
0.6
0.7
0.8
0.9
BIG 4 HIGH-NEEDURBAN/SUBURBAN
HIGH NEED RURAL AVERAGE NEED LOW NEED
Mem
ber
ship
lev
els
(ove
rall
sco
re)
GoodFairPoor

Share of Districts with Poor Financial Condition by Component and Need/ Resource Capacity Category
0
0.1
0.2
0.3
0.4
0.5
0.6
0.7
0.8
0.9
1
BIG 4 HIGH-NEEDURBAN/SUBURBAN
HIGH NEED RURAL AVERAGE NEED LOW NEED
Lo
w s
core
dis
tric
ts a
s sh
are
of
tota
l
Total
Short Run
Long Run
Economic
Student Performance
Note: Districts with membership levels in the poor set of at least 0.50.

Share of Districts with Good Financial Condition by Component and Need/ Resource Capacity Category
0
0.1
0.2
0.3
0.4
0.5
0.6
0.7
0.8
0.9
1
BIG 4 HIGH-NEEDURBAN/SUBURBAN
HIGH NEED RURAL AVERAGE NEED LOW NEED
Hig
h s
core
dis
tric
ts a
s sh
are
of
tota
l
Total
Short Run
Long Run
Economic
Student Performance
Note: Districts with membership levels in the good set of at least 0.50.
Outline of Presentation Framework for Financial Condition Indicator
System (FCIS) Development process and methodology FCIS example Overall results Potential uses of FCIS

Potential Uses of FCIS Early warning system to help SED identify districts at risk
of financial problems. Training tool for SED and other education organizations on
key components of strong financial condition. Benchmarking tool for district administrators to compare
their financial condition to similar districts. Can peel back layers of system to see where condition is good and where it needs improvement.
Oversight tool for school boards to monitor district finances.
Information system for the general public—could be used to develop interactive school district financial report card.


![Database Practices - Oracle FCIS 12.1.0 Database 12c ... … · Database Practices - Oracle FCIS 12.1.0 Database 12c Oracle FLEXCUBE Investor Servicing Release 12.3.0.2.1 [August]](https://img.pdfslide.us/doc/110x75/600639786ec1ac3e8a5ccb5c/database-practices-oracle-fcis-1210-database-12c-database-practices-.jpg)