Embed Size (px)
Citation preview

Contingency TablesContingency Tables
10-310-3

DefinitionDefinition
Contingency Table Contingency Table (or two-way frequency (or two-way frequency table)table)
a table in which frequencies a table in which frequencies correspond to two variables. correspond to two variables.
(One variable is used to categorize rows, (One variable is used to categorize rows, and a second variable is used to and a second variable is used to categorize columns.)categorize columns.)

DefinitionDefinition Contingency Table Contingency Table (or two-way frequency table)(or two-way frequency table)
a table in which frequencies a table in which frequencies correspond to two variables. correspond to two variables.
(One variable is used to categorize rows, (One variable is used to categorize rows, and a second variable is used to categorize and a second variable is used to categorize columns.)columns.)
Contingency tables have Contingency tables have at least at least two rows two rows and at least two columns.and at least two columns.

Contingency TableContingency Table
Stranger
Acquaintanceor Relative
12
39
379
106
727
642
Homicide Robbery Assault

Test of IndependenceTest of Independence
tests the null hypothesis that there tests the null hypothesis that there is is no association between the row no association between the row variable and the column variable.variable and the column variable.
(The null hypothesis is the statement (The null hypothesis is the statement that the row and column variables are that the row and column variables are independentindependent.).)
DefinitionDefinition
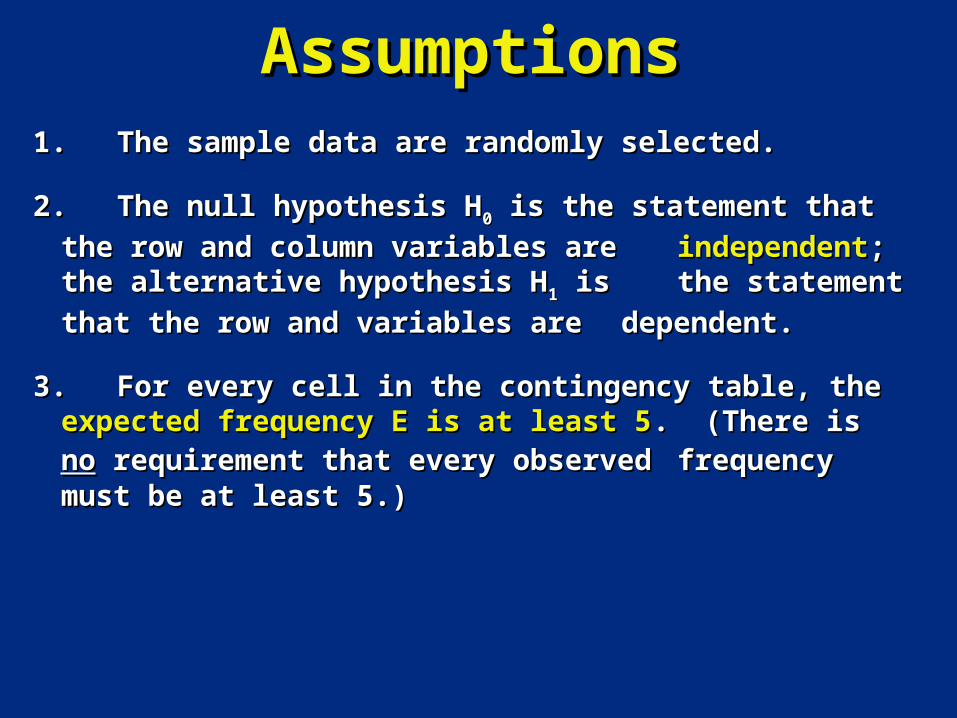
AssumptionsAssumptions1. 1. The sample data are randomly selected. The sample data are randomly selected.
2.2. The null hypothesis HThe null hypothesis H00 is the statement that is the statement that the the
row and column variables are row and column variables are independentindependent; the ; the alternative hypothesis Halternative hypothesis H11 is is the statement that the row the statement that the row
and variables are and variables are dependent.dependent.
3. 3. For every cell in the contingency table, the For every cell in the contingency table, the expected frequency E is at least 5expected frequency E is at least 5. (There is . (There is nono requirement that every observed requirement that every observed frequency must be frequency must be at least 5.)at least 5.)

Tests of IndependenceTests of Independence
HH00: The row variable is independent of the : The row variable is independent of the column variablecolumn variable
HH11: The row variable is dependent (related to) : The row variable is dependent (related to) the column variable the column variable
This procedure cannot be used to establish a direct This procedure cannot be used to establish a direct cause-and-effect link between variables in question.cause-and-effect link between variables in question.
Dependence means only there is a Dependence means only there is a relationshiprelationship between the two variables.between the two variables.

Test of IndependenceTest of IndependenceTest Statistic Test Statistic
Critical ValuesCritical Values
1. 1. Found in Table A-4 usingFound in Table A-4 using
degrees of freedom = (r - 1)(c - 1)degrees of freedom = (r - 1)(c - 1)
r is the number of rows and c is the number of columnsr is the number of rows and c is the number of columns
2. Tests of Independence are always right-tailed.2. Tests of Independence are always right-tailed.
X2 = (O - E)2
E

(row total) (column total)
(grand total)E =
Total number of all observed frequencies
in the table

Contingency TableContingency Table
Stranger
Acquaintanceor Relative
12
39
379
106
727
642
Homicide Robbery Assault

E = • •row total column total
grand total
Expected Frequency for Expected Frequency for Contingency TablesContingency Tables
grand totalgrand total

n • p
E = • •row total column total
grand total
Expected Frequency for Expected Frequency for Contingency TablesContingency Tables
grand totalgrand total
(probability of a cell)

n • p
E = • •row total column total
grand total
Expected Frequency for Expected Frequency for Contingency TablesContingency Tables
grand totalgrand total
(probability of a cell)
E = (row total) (column total)(grand total)

Stranger
Acquaintanceor Relative
Homicide Robbery Assault
Is the type of crime independent of whether the criminal is a stranger? Is the type of crime independent of whether the criminal is a stranger?
12
39
379
106
727
642

Stranger
Acquaintanceor Relative
Homicide Robbery Assault
Is the type of crime independent of whether the criminal is a stranger? Is the type of crime independent of whether the criminal is a stranger?
12
39
379
106
727
642
HH00: Type of crime is independent of knowing the criminal: Type of crime is independent of knowing the criminal
HH11: Type of crime is dependent with knowing the criminal: Type of crime is dependent with knowing the criminal

Row Total
Column Total
Stranger
Acquaintanceor Relative
Homicide Robbery Assault
Is the type of crime independent of whether the criminal is a stranger? Is the type of crime independent of whether the criminal is a stranger?
1118
787
12
39
51
379
106
485
727
642
1369
HH00: Type of crime is independent of knowing the criminal: Type of crime is independent of knowing the criminal
HH11: Type of crime is dependent with knowing the criminal: Type of crime is dependent with knowing the criminal

Row Total
Column Total
Stranger
Acquaintanceor Relative
Homicide Robbery Assault
Is the type of crime independent of whether the criminal is a stranger? Is the type of crime independent of whether the criminal is a stranger?
1118
787
1905
12
39
51
379
106
485
727
642
1369
HH00: Type of crime is independent of knowing the criminal: Type of crime is independent of knowing the criminal
HH11: Type of crime is dependent with knowing the criminal: Type of crime is dependent with knowing the criminal

Row Total
Column Total
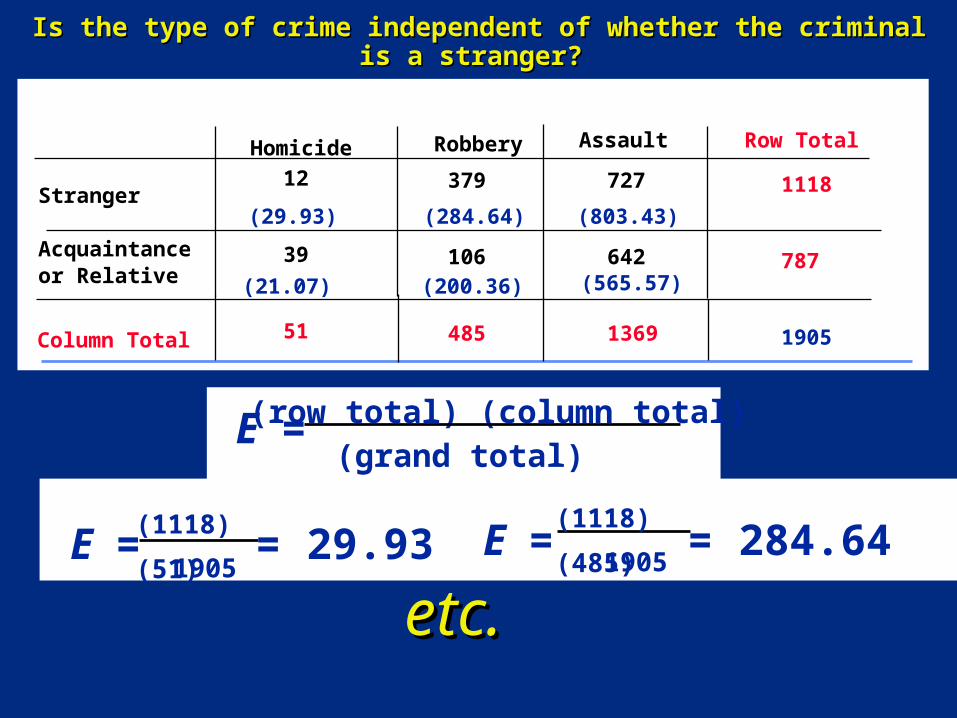
E = (row total) (column total)(grand total)
Stranger
Acquaintanceor Relative
Homicide Robbery Assault
Is the type of crime independent of whether the criminal is a stranger? Is the type of crime independent of whether the criminal is a stranger?
1118
787
1905
12
39
51
379
106
485
727
642
1369

Row Total
(29.93)
Column Total
E = (row total) (column total)(grand total)
E = (1118)(51)
1905= 29.93
Stranger
Acquaintanceor Relative
Homicide Robbery Assault
Is the type of crime independent of whether the criminal is a stranger? Is the type of crime independent of whether the criminal is a stranger?
1118
787
1905
12
39
51
379
106
485
727
642
1369
Row Total
(29.93)
(21.07)
(284.64)
(200.36)
(803.43)
(565.57)
Column Total
E = (row total) (column total)(grand total)
E = (1118)(51)
1905= 29.93 E =
(1118)(485)
1905= 284.64
etc.etc.
Stranger
Acquaintanceor Relative
Homicide Robbery Assault
Is the type of crime independent of whether the criminal is a stranger? Is the type of crime independent of whether the criminal is a stranger?
1118
787
1905
12
39
51
379
106
485
727
642
1369

12
39
379
106
727
642
Homicide Robbery Forgery
(29.93)
(21.07)
(284.64)
(200.36)
(803.43)
(565.57)
[10.741]Stranger
Acquaintance
or Relative
X2 = (O - E )2
E
(O -E )2
EUpper left cell: = = 10.741
(12 -29.93)2
29.93
(E)
(O - E )2
E
Is the type of crime independent of whether the Is the type of crime independent of whether the criminal is a stranger? criminal is a stranger?

12
39
379
106
727
642
Homicide Robbery Forgery
(29.93)
(21.07)[15.258]
(284.64)[31.281]
(200.36)[44.439]
(803.43)[7.271]
(565.57)[10.329]
[10.741]Stranger
Acquaintance
or Relative
X2 = (O - E )2
E
(E)
(O - E )2
E
Is the type of crime independent of whether the Is the type of crime independent of whether the criminal is a stranger? criminal is a stranger?
Test Statistic Test Statistic XX22 = 10.741 + 31.281 + ... + 10.329 = = 10.741 + 31.281 + ... + 10.329 =
119.319119.319

Test Statistic: Test Statistic: XX22 == 119.319119.319with with = 0.05 and = 0.05 and ( (r r -1) (-1) (cc -1) = (2 -1) (3 -1) = 2 -1) = (2 -1) (3 -1) = 2 degrees of freedomdegrees of freedom
Critical Value:Critical Value: XX22 == 5.991 (from Table A-4)5.991 (from Table A-4)

0
= 0.05
X2 = 5.991
RejectIndependence
Reject independence
Sample data: X2 =119.319
Fail to RejectIndependence
HHoo : The type of crime and knowing the criminal are independent : The type of crime and knowing the criminal are independent HH11 : The type of crime and knowing the criminal are dependent : The type of crime and knowing the criminal are dependent
Test Statistic: Test Statistic: XX22 == 119.319119.319with with = 0.05 and = 0.05 and ( (r r -1) (-1) (cc -1) = (2 -1) (3 -1) = 2 -1) = (2 -1) (3 -1) = 2 degrees of freedomdegrees of freedom
Critical Value:Critical Value: XX22 == 5.991 (from Table A-4)5.991 (from Table A-4)

It appears that the type of crime and It appears that the type of crime and knowing the criminal are related. knowing the criminal are related.
0
= 0.05
X2 = 5.991
RejectIndependence
Test Statistic: Test Statistic: XX22 == 119.319119.319with with = 0.05 and = 0.05 and ( (r r -1) (-1) (cc -1) = (2 -1) (3 -1) = 2 -1) = (2 -1) (3 -1) = 2 degrees of freedomdegrees of freedom
Critical Value:Critical Value: XX22 == 5.991 (from Table A-4)5.991 (from Table A-4)
Reject independence
Sample data: X2 =119.319
Fail to RejectIndependence

Figure 10-8
Relationships Among Components in Relationships Among Components in XX22 Test Test of Independenceof Independence

DefinitionDefinition
Test of HomogeneityTest of Homogeneity
tests the claim that tests the claim that different different populations populations have the same proportions have the same proportions of some of some characteristicscharacteristics

Example - Test of HomogeneityExample - Test of Homogeneity
3
74
Taxi has
usable
seat belt?
New York Chicago Pittsburgh
Yes
No
42
87
2
70
Seat Belt Use in Taxi Cabs
Claim: The 3 cities have the same proportion of taxis with usable seat beltsClaim: The 3 cities have the same proportion of taxis with usable seat belts HH00: The 3 cities have the same proportion of taxis with usable seat belts: The 3 cities have the same proportion of taxis with usable seat belts HH11: The proportion of taxis with usable seat belts is not the same in all 3 cities: The proportion of taxis with usable seat belts is not the same in all 3 cities
0
Sample data: X2 = 42.004
= 0.05
X2 = 5.991
Fail to Rejecthomogeneity
Rejecthomogeneity

Example - Test of HomogeneityExample - Test of Homogeneity
3
74
Taxi has
usable
seat belt?
New York Chicago Pittsburgh
Yes
No
42
87
2
70
Seat Belt Use in Taxi Cabs
Claim: The 3 cities have the same proportion of taxis with usable seat beltsClaim: The 3 cities have the same proportion of taxis with usable seat belts HH00: The 3 cities have the same proportion of taxis with usable seat belts: The 3 cities have the same proportion of taxis with usable seat belts HH11: The proportion of taxis with usable seat belts is not the same in all 3 cities: The proportion of taxis with usable seat belts is not the same in all 3 cities
0
Sample data: X2 = 42.004
= 0.05
X2 = 5.991
Fail to Rejecthomogeneity
Rejecthomogeneity There is sufficient evidence to There is sufficient evidence to
warrant rejection of the claim warrant rejection of the claim
that the 3 cities have the that the 3 cities have the
same proportion of usable same proportion of usable
seat belts in taxis; appears seat belts in taxis; appears
from Table Chicago has a from Table Chicago has a
much higher proportion. much higher proportion.