Embed Size (px)
Citation preview
1
CONTENTS
The Journey Begins 2
The Vision for the Future 4
Construction 6
All Systems Go 8
Getting You Connected 10
Getting You There – The Transfer Point 13
Adding Value to Gauteng – Powering the Future 16
Platform to a Better Tomorrow 19
2
Network diagram: Journey to a better Gauteng
3
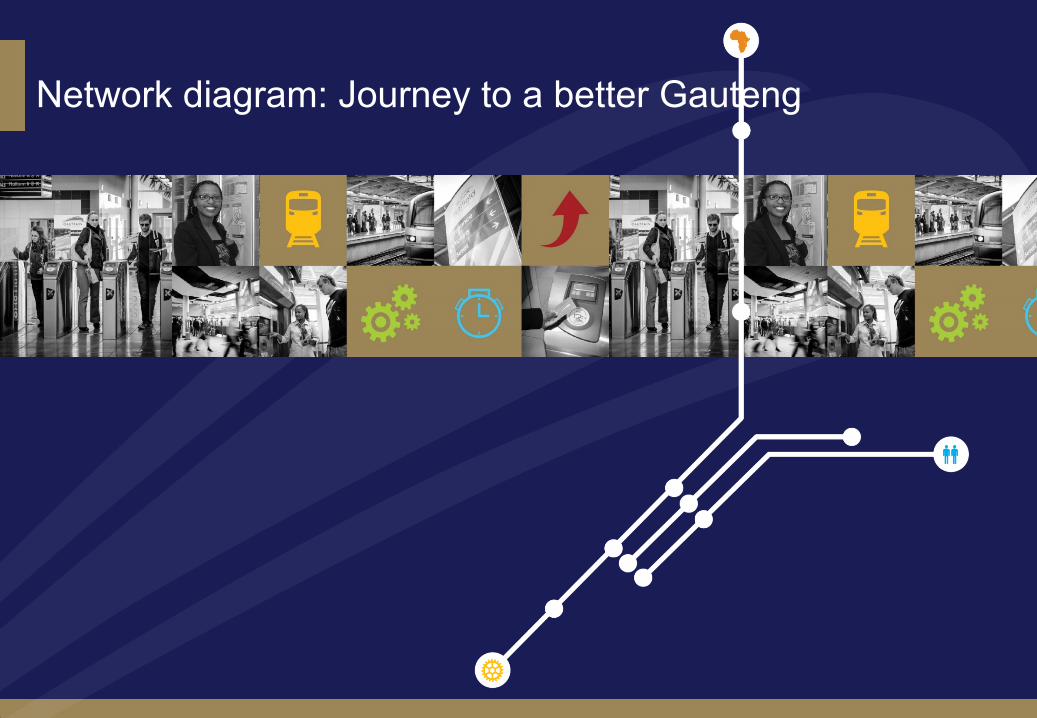
THE JOURNEY BEGINS
GMA commissioned KPMG to determine the impact that the Gautrain system has had on the Gauteng Province – including:
Economy
Job creation
Perception of users and non-users
Lifestyle changes
Transport patterns
Property values
Links to government policy
In addition, this study would support GMA’s plans to extend the services of the Gautrain.
4
Approach to our journey Pre-Gautrain – Vision for the Future
5
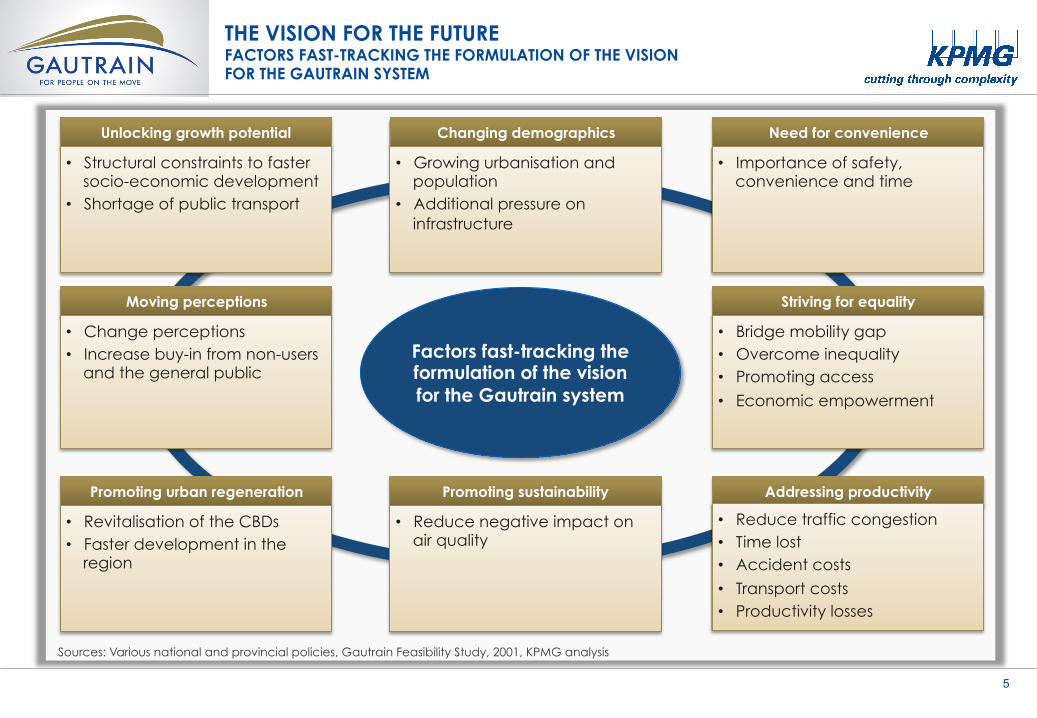
THE VISION FOR THE FUTURE FACTORS FAST-TRACKING THE FORMULATION OF THE VISION FOR THE GAUTRAIN SYSTEM
Unlocking growth potential • Structural constraints to faster
socio-economic development • Shortage of public transport
Moving perceptions • Change perceptions • Increase buy-in from non-users
and the general public
Promoting urban regeneration • Revitalisation of the CBDs • Faster development in the
region
Need for convenience • Importance of safety,
convenience and time
Addressing productivity • Reduce traffic congestion • Time lost • Accident costs
• Transport costs • Productivity losses
Promoting sustainability • Reduce negative impact on
air quality
Changing demographics • Growing urbanisation and
population • Additional pressure on
infrastructure
Factors fast-tracking the formulation of the vision for the Gautrain system
Striving for equality • Bridge mobility gap • Overcome inequality • Promoting access
• Economic empowerment
Sources: Various national and provincial policies, Gautrain Feasibility Study, 2001, KPMG analysis
6
Pre-Gautrain – Vision for the future Construction – Laying the tracks
7
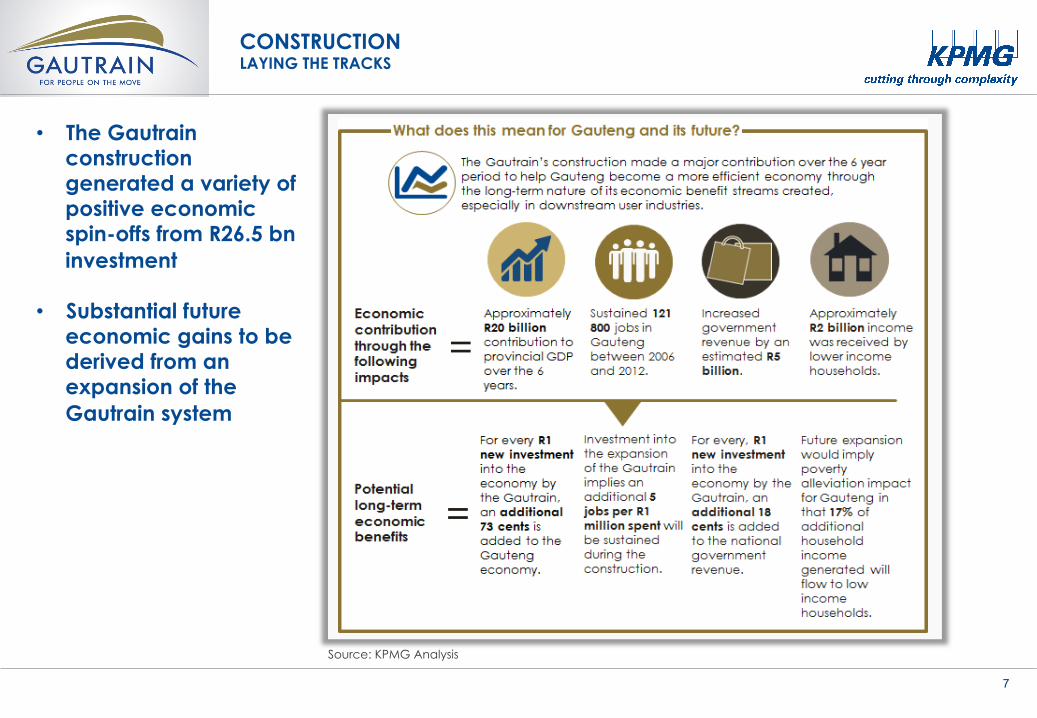
CONSTRUCTION LAYING THE TRACKS
Source: KPMG Analysis
• The Gautrain construction generated a variety of positive economic spin-offs from R26.5 bn investment
• Substantial future economic gains to be derived from an expansion of the Gautrain system
8
Construction – Laying the tracks All systems go – Gathering traction
9
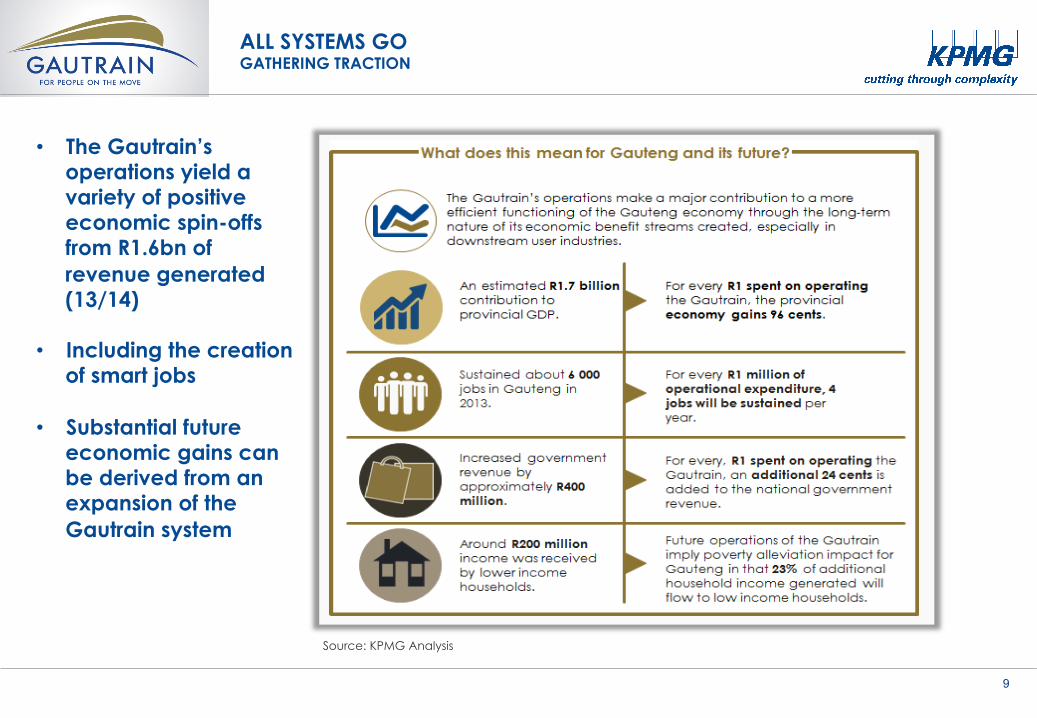
ALL SYSTEMS GO GATHERING TRACTION
Source: KPMG Analysis
• The Gautrain’s operations yield a variety of positive economic spin-offs from R1.6bn of revenue generated (13/14)
• Including the creation
of smart jobs
• Substantial future economic gains can be derived from an expansion of the Gautrain system
10
All systems go - Gathering traction Getting you connected – Signalling the future
11
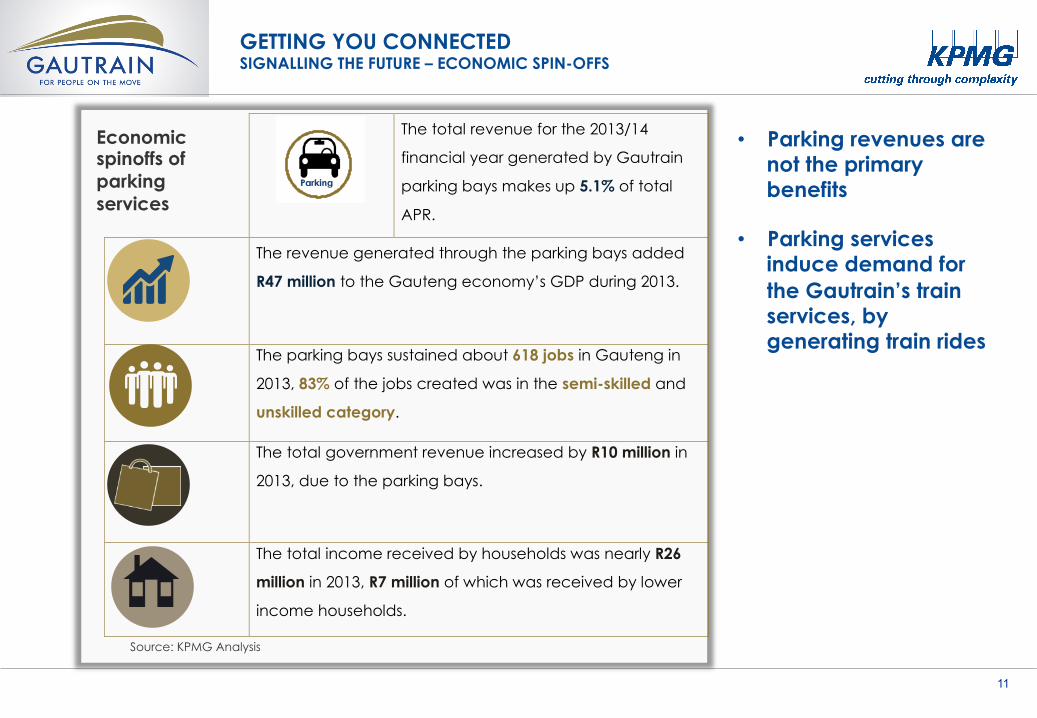
GETTING YOU CONNECTED SIGNALLING THE FUTURE – ECONOMIC SPIN-OFFS
• Parking revenues are not the primary benefits
• Parking services induce demand for the Gautrain’s train services, by generating train rides
The total revenue for the 2013/14
financial year generated by Gautrain
parking bays makes up 5.1% of total
APR.
The revenue generated through the parking bays added
R47 million to the Gauteng economy’s GDP during 2013.
The parking bays sustained about 618 jobs in Gauteng in
2013, 83% of the jobs created was in the semi-skilled and
unskilled category.
The total government revenue increased by R10 million in
2013, due to the parking bays.
The total income received by households was nearly R26
million in 2013, R7 million of which was received by lower
income households.
Source: KPMG Analysis
Economic spinoffs of parking services
12
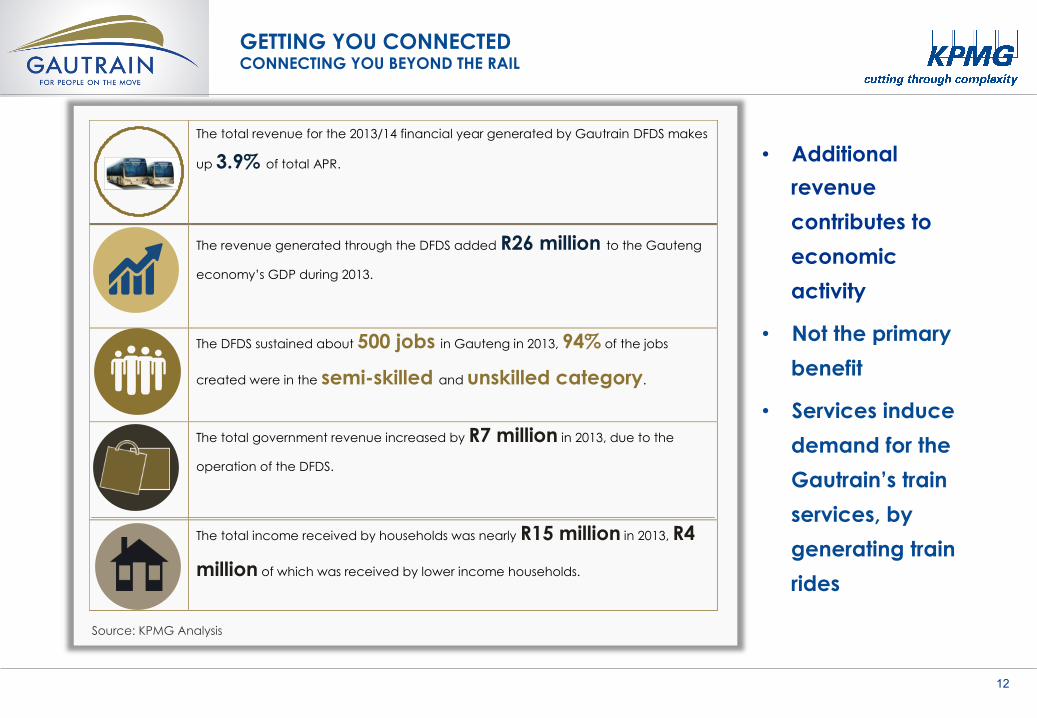
GETTING YOU CONNECTED CONNECTING YOU BEYOND THE RAIL
• Additional
revenue
contributes to
economic
activity
• Not the primary
benefit
• Services induce
demand for the
Gautrain’s train
services, by
generating train
rides
The total revenue for the 2013/14 financial year generated by Gautrain DFDS makes
up 3.9% of total APR.
The revenue generated through the DFDS added R26 million to the Gauteng
economy’s GDP during 2013.
The DFDS sustained about 500 jobs in Gauteng in 2013, 94% of the jobs
created were in the semi-skilled and unskilled category.
The total government revenue increased by R7 million in 2013, due to the
operation of the DFDS.
The total income received by households was nearly R15 million in 2013, R4
million of which was received by lower income households.
Source: KPMG Analysis
13
Network diagram: Journey to a better Gauteng Getting you there – The transfer point
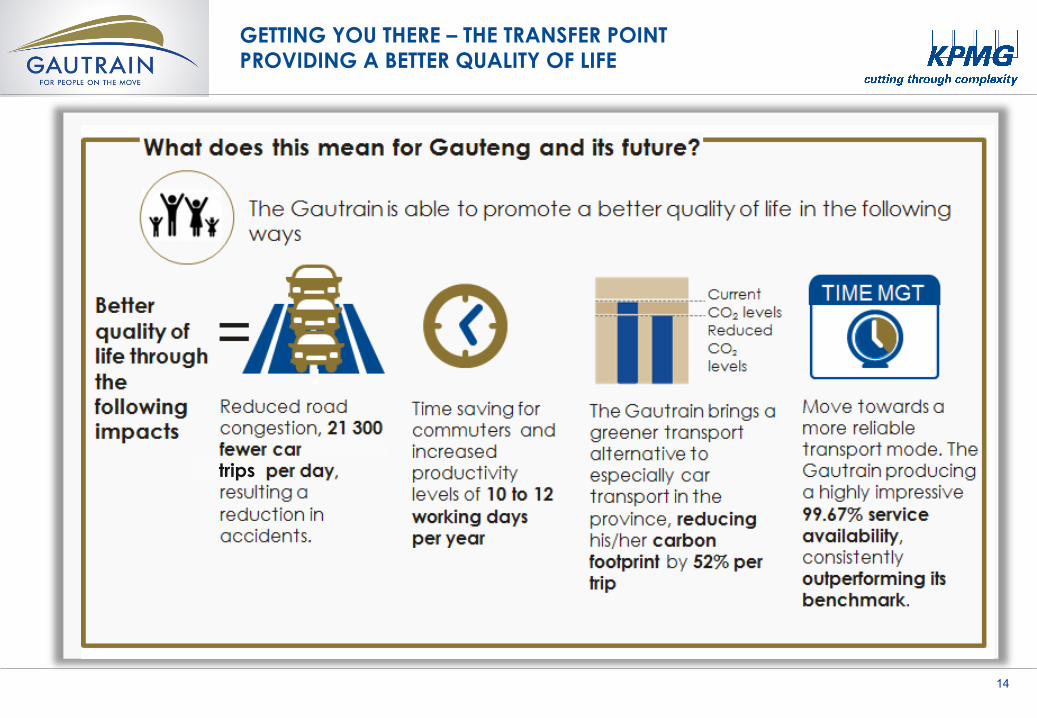
14
GETTING YOU THERE – THE TRANSFER POINT PROVIDING A BETTER QUALITY OF LIFE
trips
15
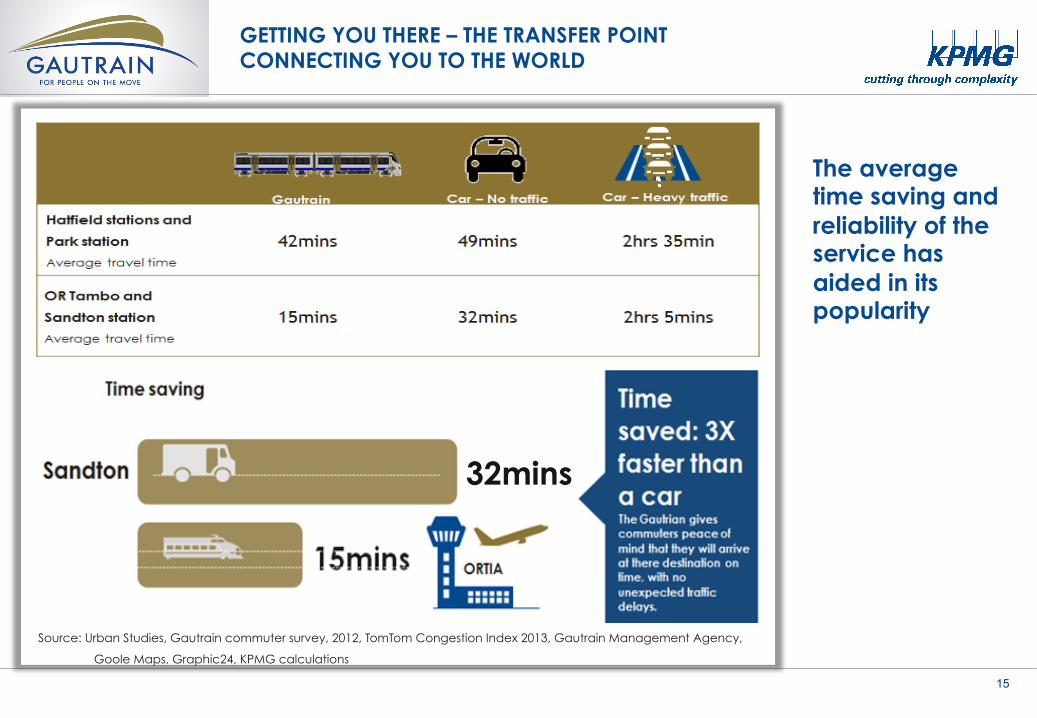
GETTING YOU THERE – THE TRANSFER POINT CONNECTING YOU TO THE WORLD
The average time saving and reliability of the service has aided in its popularity
32mins
Source: Urban Studies, Gautrain commuter survey, 2012, TomTom Congestion Index 2013, Gautrain Management Agency,
Goole Maps, Graphic24, KPMG calculations
16
Getting you there – The transfer point Adding value to Gauteng – Powering the future
17
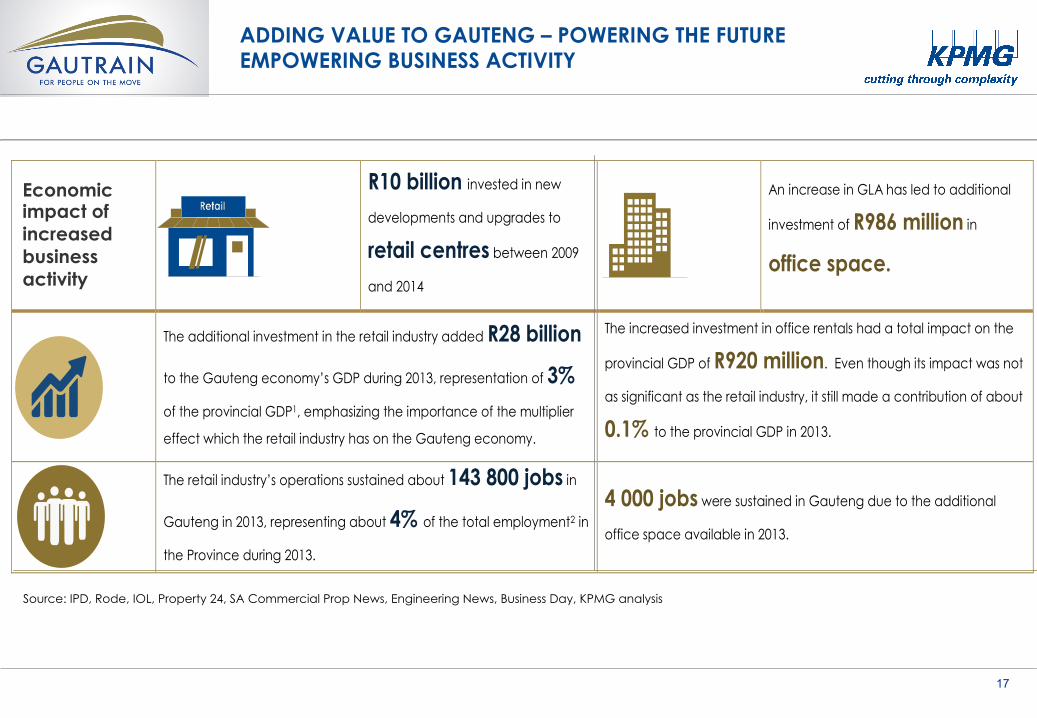
New developments and upgrades to retail centres started in order to utilise the improved connectivity that the Gautrain brought to consumers. Therefore it is clear that the Gautrain’s arrival led to increased investment and development translating to improved connectivity and production, which in turn led to positive economic spin-offs.
R10 billion invested in new
developments and upgrades to
retail centres between 2009
and 2014
An increase in GLA has led to additional
investment of R986 million in
office space.
The additional investment in the retail industry added R28 billion
to the Gauteng economy’s GDP during 2013, representation of 3%
of the provincial GDP1, emphasizing the importance of the multiplier
effect which the retail industry has on the Gauteng economy.
The increased investment in office rentals had a total impact on the
provincial GDP of R920 million. Even though its impact was not
as significant as the retail industry, it still made a contribution of about
0.1% to the provincial GDP in 2013.
The retail industry’s operations sustained about 143 800 jobs in
Gauteng in 2013, representing about 4% of the total employment2 in
the Province during 2013.
4 000 jobs were sustained in Gauteng due to the additional
office space available in 2013.
1 Total GDP of Gauteng for 2013 = R1 174 723 million (Source: StatsSA Statistical release P0441, Gross Domestic Product, Quarter 3, 2013) 2 Total number of jobs in Gauteng for 2013 was 4 823 000 (Source: StatsSA Statistical release P0211, Quarterly Labour Force Survey (QLFS), Quarter 4, 2013)
Source: IPD, Rode, IOL, Property 24, SA Commercial Prop News, Engineering News, Business Day, KPMG analysis
ADDING VALUE TO GAUTENG – POWERING THE FUTURE EMPOWERING BUSINESS ACTIVITY
Economic impact of increased business activity
18
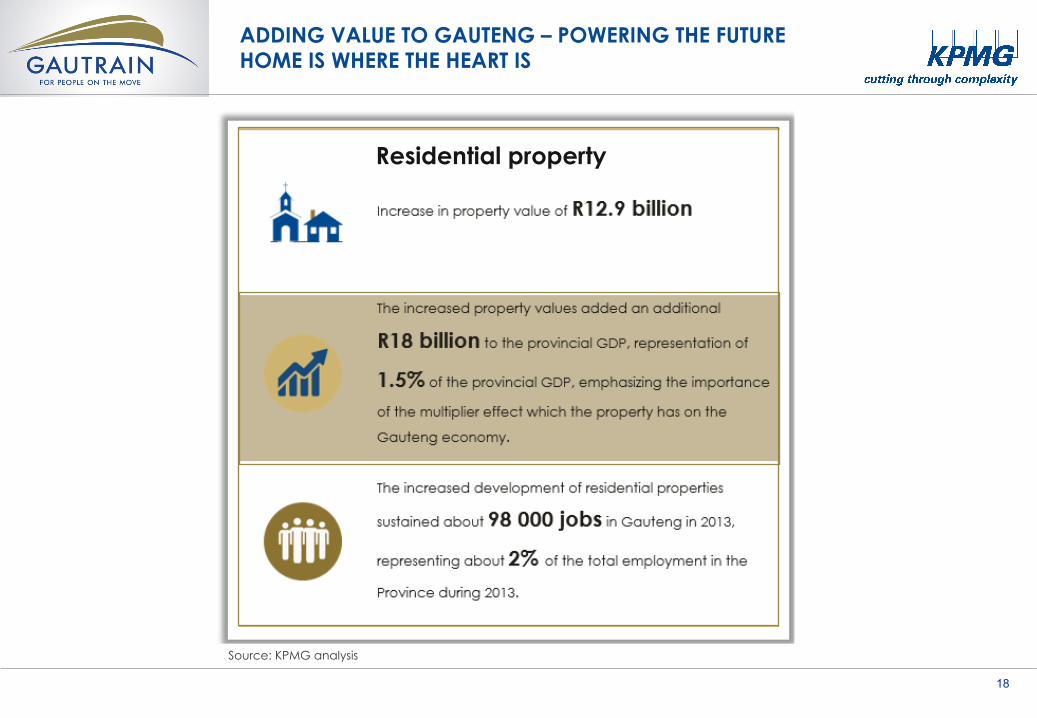
ADDING VALUE TO GAUTENG – POWERING THE FUTURE HOME IS WHERE THE HEART IS
Source: KPMG analysis
Residential property
19
Adding value to Gauteng – Powering the future Platform to a better tomorrow
20
• Comments • Suggestions • Questions • Way forward


![The Journey Begins[1]](https://img.pdfslide.us/doc/110x75/577dab2e1a28ab223f8c1285/the-journey-begins1.jpg)