Embed Size (px)
Citation preview

Dear Shareholder,
The Board of Directors of The Mauritius Chemical and Fertilizer Industry Limited (MCFI) is pleased to present the Annual Report for the year ended 31 December 2017, the contents of which are listed below.
This report was approved by the Board of Directors at its meeting held on 9 May 2018.
Antoine L. HarelChairman
Shemboosingh CheekhooreeManaging Director
02 visionmissionguiding principles
03company profilemarket segmentscorporate information
04 key figures for 2017
05 chairman’s statement
06 managing director’s report
29 statements of profitor loss and othercomprehensive income
10 senior managementteam
08 board of directors
12 corporate governance report
19 corporate governance report /statutory disclosures
22 statement of directors’responsibilitiesstatement of compliance
30 statements in changesin equity
32 statements of cash flows
33 notes to the financialstatements
28 statements offinancial position
23 secretary’s certificate
24 value added statement
25 independent auditor’sreport
cont
ents

THE MAURITIUS CHEMICAL AND FERTILIZER INDUSTRY LIMITED 2
vis o
n
guiding principles • Agility and Determination in achieving• Care and Engagement in what we do• Trust and Responsibility in our relationships
To be the leader in the fertilisers and chemicals business in the region
mission To be the preferred provider of fertilisers and associated chemicals of the Mauritian and regional agricultural communities
ANNUAL REPORT 2017 3
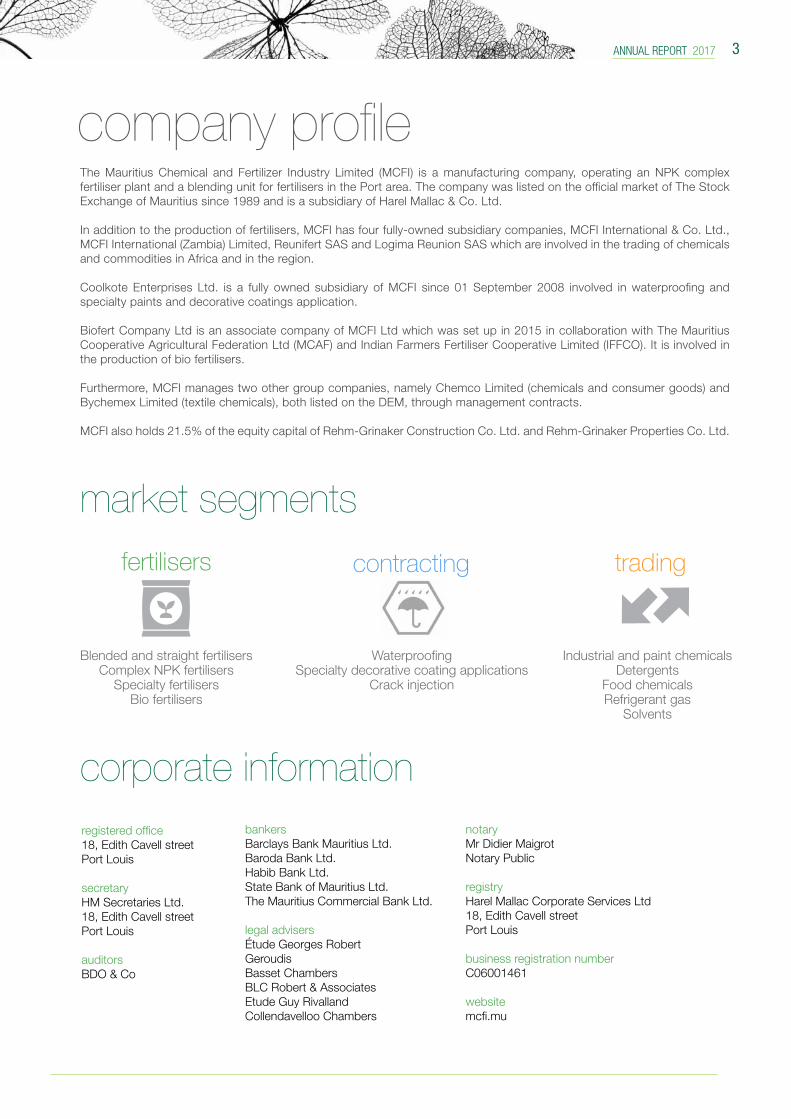
company profile
market segments
trading
WaterproofingSpecialty decorative coating applications
Crack injection
contracting
Blended and straight fertilisersComplex NPK fertilisers
Specialty fertilisersBio fertilisers
fertilisers
Industrial and paint chemicalsDetergents
Food chemicalsRefrigerant gas
Solvents
corporate informationbankersBarclays Bank Mauritius Ltd.Baroda Bank Ltd.Habib Bank Ltd.State Bank of Mauritius Ltd.The Mauritius Commercial Bank Ltd.
legal advisersÉtude Georges RobertGeroudisBasset ChambersBLC Robert & AssociatesEtude Guy RivallandCollendavelloo Chambers
notaryMr Didier MaigrotNotary Public
registryHarel Mallac Corporate Services Ltd18, Edith Cavell streetPort Louis
business registration numberC06001461
websitemcfi.mu
registered office18, Edith Cavell streetPort Louis
secretaryHM Secretaries Ltd.18, Edith Cavell streetPort Louis
auditorsBDO & Co
The Mauritius Chemical and Fertilizer Industry Limited (MCFI) is a manufacturing company, operating an NPK complex fertiliser plant and a blending unit for fertilisers in the Port area. The company was listed on the official market of The Stock Exchange of Mauritius since 1989 and is a subsidiary of Harel Mallac & Co. Ltd. In addition to the production of fertilisers, MCFI has four fully-owned subsidiary companies, MCFI International & Co. Ltd., MCFI International (Zambia) Limited, Reunifert SAS and Logima Reunion SAS which are involved in the trading of chemicals and commodities in Africa and in the region. Coolkote Enterprises Ltd. is a fully owned subsidiary of MCFI since 01 September 2008 involved in waterproofing and specialty paints and decorative coatings application. Biofert Company Ltd is an associate company of MCFI Ltd which was set up in 2015 in collaboration with The Mauritius Cooperative Agricultural Federation Ltd (MCAF) and Indian Farmers Fertiliser Cooperative Limited (IFFCO). It is involved in the production of bio fertilisers. Furthermore, MCFI manages two other group companies, namely Chemco Limited (chemicals and consumer goods) and Bychemex Limited (textile chemicals), both listed on the DEM, through management contracts. MCFI also holds 21.5% of the equity capital of Rehm-Grinaker Construction Co. Ltd. and Rehm-Grinaker Properties Co. Ltd.
THE MAURITIUS CHEMICAL AND FERTILIZER INDUSTRY LIMITED 4
figur
eske
y
for 2
017
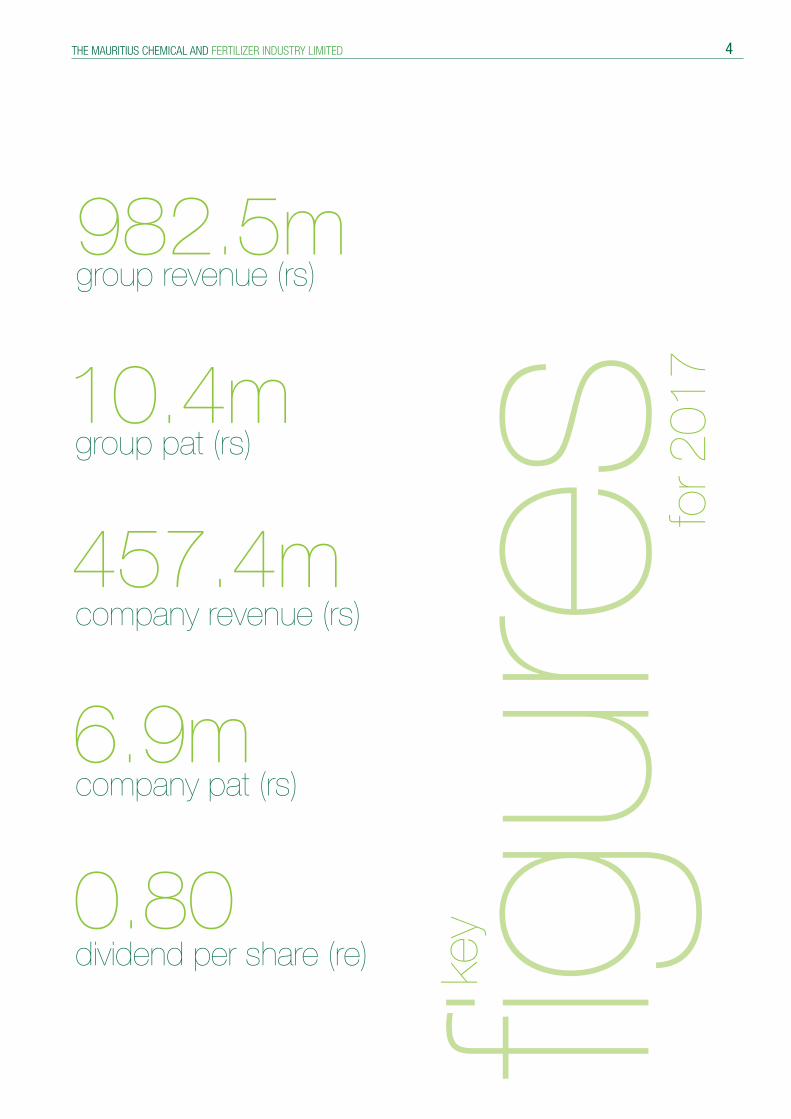
982.5mgroup revenue (rs)
457.4mcompany revenue (rs)
10.4mgroup pat (rs)
6.9mcompany pat (rs)
0.80dividend per share (re)
ANNUAL REPORT 2017 5
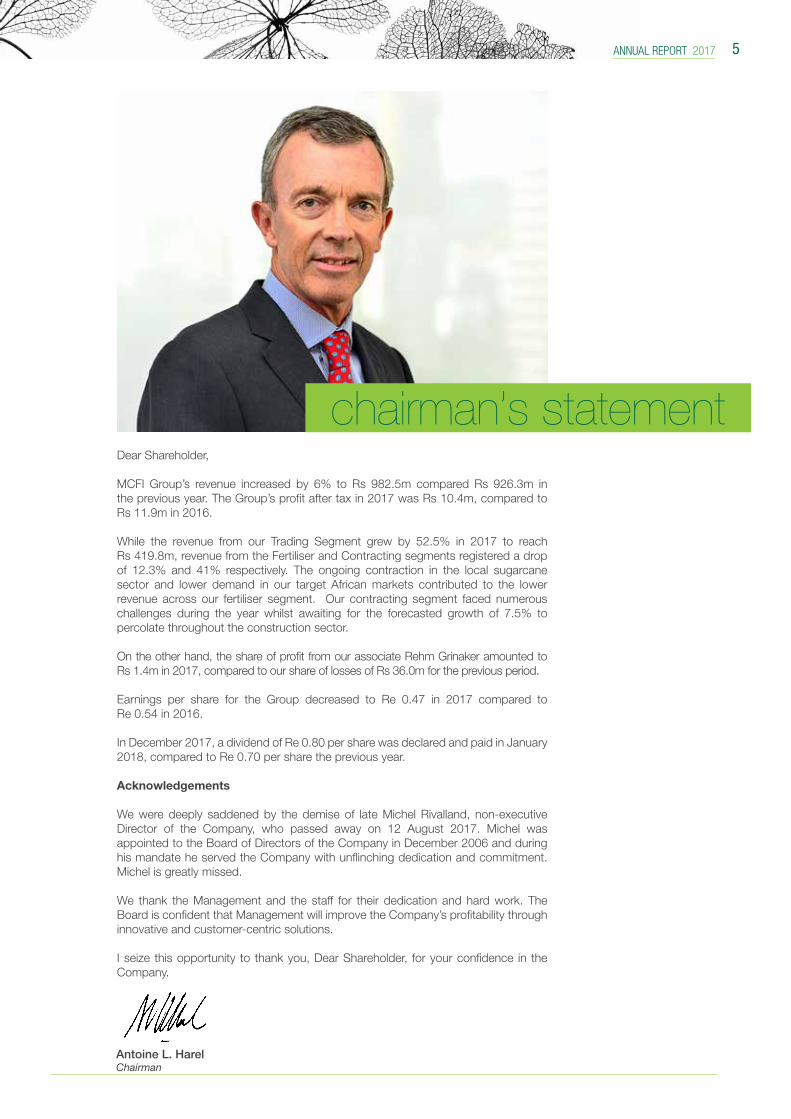
Antoine L. HarelChairman
chairman’s statementDear Shareholder,
MCFI Group’s revenue increased by 6% to Rs 982.5m compared Rs 926.3m in the previous year. The Group’s profit after tax in 2017 was Rs 10.4m, compared to Rs 11.9m in 2016.
While the revenue from our Trading Segment grew by 52.5% in 2017 to reach Rs 419.8m, revenue from the Fertiliser and Contracting segments registered a drop of 12.3% and 41% respectively. The ongoing contraction in the local sugarcane sector and lower demand in our target African markets contributed to the lower revenue across our fertiliser segment. Our contracting segment faced numerous challenges during the year whilst awaiting for the forecasted growth of 7.5% to percolate throughout the construction sector.
On the other hand, the share of profit from our associate Rehm Grinaker amounted to Rs 1.4m in 2017, compared to our share of losses of Rs 36.0m for the previous period.
Earnings per share for the Group decreased to Re 0.47 in 2017 compared to Re 0.54 in 2016.
In December 2017, a dividend of Re 0.80 per share was declared and paid in January 2018, compared to Re 0.70 per share the previous year.
Acknowledgements
We were deeply saddened by the demise of late Michel Rivalland, non-executive Director of the Company, who passed away on 12 August 2017. Michel was appointed to the Board of Directors of the Company in December 2006 and during his mandate he served the Company with unflinching dedication and commitment. Michel is greatly missed.
We thank the Management and the staff for their dedication and hard work. The Board is confident that Management will improve the Company’s profitability through innovative and customer-centric solutions.
I seize this opportunity to thank you, Dear Shareholder, for your confidence in the Company.
THE MAURITIUS CHEMICAL AND FERTILIZER INDUSTRY LIMITED 6
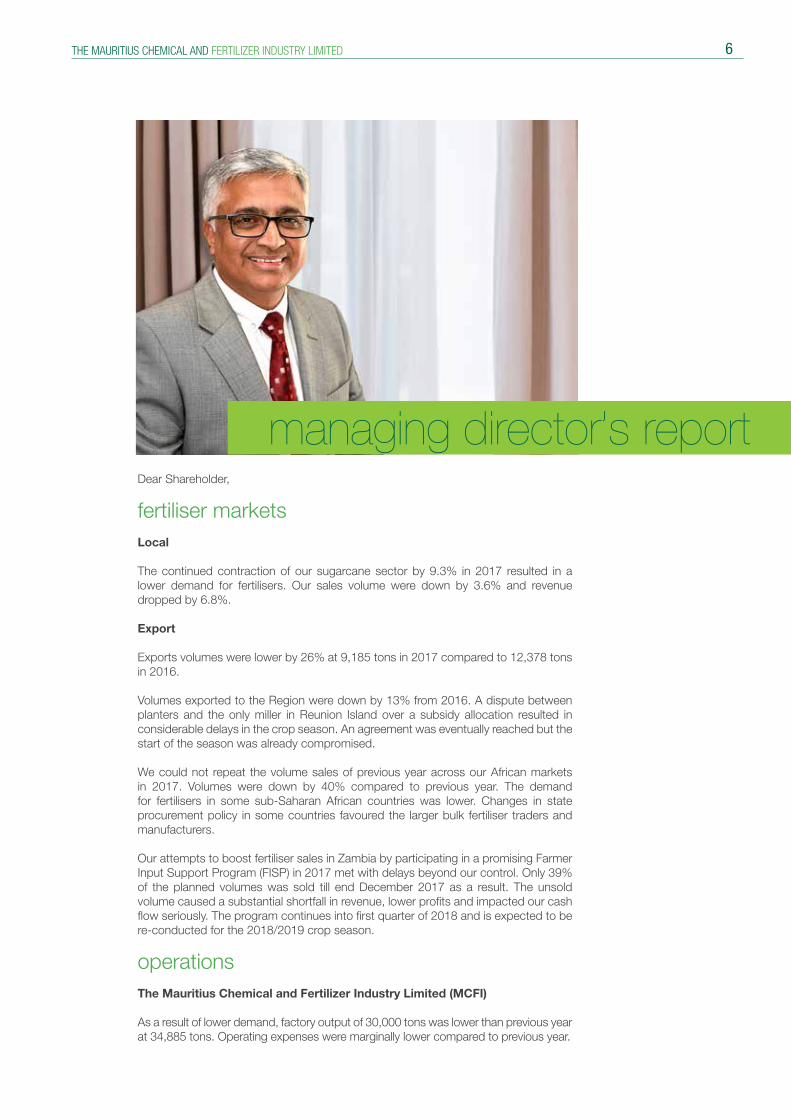
Dear Shareholder,
fertiliser marketsLocal
The continued contraction of our sugarcane sector by 9.3% in 2017 resulted in a lower demand for fertilisers. Our sales volume were down by 3.6% and revenue dropped by 6.8%.
Export
Exports volumes were lower by 26% at 9,185 tons in 2017 compared to 12,378 tons in 2016. Volumes exported to the Region were down by 13% from 2016. A dispute between planters and the only miller in Reunion Island over a subsidy allocation resulted in considerable delays in the crop season. An agreement was eventually reached but the start of the season was already compromised. We could not repeat the volume sales of previous year across our African markets in 2017. Volumes were down by 40% compared to previous year. The demand for fertilisers in some sub-Saharan African countries was lower. Changes in state procurement policy in some countries favoured the larger bulk fertiliser traders and manufacturers. Our attempts to boost fertiliser sales in Zambia by participating in a promising Farmer Input Support Program (FISP) in 2017 met with delays beyond our control. Only 39% of the planned volumes was sold till end December 2017 as a result. The unsold volume caused a substantial shortfall in revenue, lower profits and impacted our cash flow seriously. The program continues into first quarter of 2018 and is expected to be re-conducted for the 2018/2019 crop season.
operationsThe Mauritius Chemical and Fertilizer Industry Limited (MCFI)
As a result of lower demand, factory output of 30,000 tons was lower than previous year at 34,885 tons. Operating expenses were marginally lower compared to previous year.
managing director’s report
ANNUAL REPORT 2017 7
Shemboosingh CheekhooreeManaging Director
MCFI International (Zambia) Ltd
Zambia’s economy continued to improve, +4.6% growth in GDP in 2017, with higher exports of copper and more stable power supply. MCFI International (Zambia) saw a 32% increase in turnover boosted by fertiliser sales. However, profits after tax were substantially lower at Rs 3.3m compared to Rs 14.4m during the previous period. Our performance was impacted by Rs 8.7m attributable to loss on exchange from re-evaluation of a prior loan.
Logima Reunion SAS
Logima Reunion SAS is our retail arm on the island. It is involved in trading of fertilisers and other related agrochemicals in Reunion Island. The Company registered a loss of Rs 12.6m in 2017 compared to a loss of Rs 2.7m the previous year mainly because of lower sales volumes. A conflict involving subsidy allocation between miller and sugar cane growers delayed the harvest season and reduced fertilisation window.
Biofert Company Ltd
The Company, currently managed by MCAF, is still going through its learning curve and volume sales have increased significantly from the previous year. MCFI will take over management of the Company by mid-2018.
Coolkote Enterprises LtdThe construction sector was expected to grow an estimated 7.5% in 2017 after a spell of contraction in previous 5 years. The upswing took time to impact the construction sector. The Company was not able to improve its performance. Revenue dropped significantly in 2017(-41%) compared to previous year. This resulted in a net loss of Rs 15.5m in 2017. A new management team has taken over the operations to turn the Company around. A review of the current business model is being carried out and a turnaround plan is being finalised.
Rehm-Grinaker Construction Co. Ltd and Rehm-Grinaker Properties Co. LtdThe consolidated share of result from Rehm-Grinaker Construction Co. Ltd and Rehm-Grinaker Properties Co. Ltd was Rs 1.35m compared to our share of losses of Rs 36.0m in 2016.
management contracts - Chemco Limited and Bychemex LimitedMCFI has a management contract with Chemco Limited. The Company is a supplier of chemicals to various industries (mainly textile and sugar), a range of consumer goods such as air conditioners and water treatment equipment. It achieved a turnover similar to previous year. However, profits were down (-55%) as a result of pressure on margins from increasing competition and volatile commodity prices. MCFI also manages Bychemex Limited, involved in the formulation and supply of auxiliary chemicals to the textile industry. The Company registered an increase in turnover (+14%) compared to previous year. A positive profit after tax of Rs 1.1m was recorded compared to Rs 0.1m in 2016.
10.4m
6%
profit after tax (rs)
growth in revenuein 2017
THE MAURITIUS CHEMICAL AND FERTILIZER INDUSTRY LIMITED 8
boar
dShemboosingh Cheekhooree (56)Executive Director
Shemboosingh Cheekhooree holds a bachelor’s degree in Chemical Engineering from the North East London Polytechnic, United Kingdom. He has over 25 years’ experience in the textile and apparel sector and has served in various senior management positions during the last 15 years in the textile industry, in Mauritius and in India. He joined the Harel Mallac Group in 2012 as Managing Director of Harel Mallac Export Ltd. In October 2013, he became General Manager of the Chemicals and Fertilisers Sub-Division of the Harel Mallac Group, of which he is now Managing Director. Since October 2014, he is the Managing Director of Harel Mallac (Tanzania) Limited. He was appointed to the Board of Directors of The Mauritius Chemical and Fertilizer Industry Limited on 13 October 2014.
Other Directorships (listed Companies):Bychemex Limited and Chemco Limited.
Antoine L. Harel (60)Chairman (Non-Executive)
Antoine L. Harel is a Fellow Member of the Institute of Chartered Accountants in England and Wales and holds a BA (Hons) degree in Accounting and Computing.
He joined Harel Mallac & Co. Ltd in 1987. In 1997, he was appointed Group CEO and has been Chairman of its Board since April 2005. He was President of the Mauritius Chamber of Commerce & Industry in 1992/1993. Antoine L. Harel has been sitting on the Board of Directors of The Mauritius Chemical and Fertilizer Industry Limited since 2001 and is the Chairman since 1 September 2007.
Other Directorships (listed Companies):Harel Mallac & Co. Ltd (Chairman), Chemco Limited (Chairman), Bychemex Limited (Chairman) and Les Gaz Industriels Ltd (Chairman).
Allain Doger de Spéville (65)Independent Director
Allain Doger de Spéville is a Notary Public and was first appointed to the Board of Directors of The Mauritius Chemical and Fertilizer Industry Limited on 12 July 2006.
Other Directorship (listed Companies):The Mauritius Oil Refineries Ltd (Chairman).
Suie Sen Hock Meen Ah Kine (56)Executive Director
Suie Sen Hock Meen Ah Kine is an Associate Member of the Institute of Chartered Accountants in England and Wales and holder of a BSc (Hons) Management Science from the University of Ottawa. He joined Harel Mallac in 2005 as Financial Controller of Harel Mallac Bureautique Ltd and was appointed Group Financial Controller in February 2007. Since 15 November 2015, he holds the position of Finance Director of the Chemicals and Fertilisers Sub-Division of the Harel Mallac Group.
Other Directorships (listed Companies):Bychemex Limited and Chemco Limited.
ANNUAL REPORT 2017 9
boar
dof
dire
ctor
sat
31
Dec
embe
r 201
7
Charles Harel (50)Non-Executive Director
Charles Harel holds an MBA from the University of Birmingham and a National Diploma in Management and Finance from Cape Technikon, South Africa. He joined the Harel Mallac Group in 1993. He has held various positions within the Group and was appointed Chief Executive Officer of Harel Mallac in January 2014. He has been sitting on the Board of Directors of The Mauritius Chemical and Fertilizer Industry Limited since 17 March 2009.
Other Directorships (listed Companies):Harel Mallac & Co. Ltd, Bychemex Limited and Chemco Limited
Harold Ng Kwing King (68)Independent Director
Harold Ng Kwing King holds a BSc (Hons) degree in Chemical Engineering from the University of Leeds. He joined The Mauritius Chemical and Fertilizer Industry Limited in 1974 and has held various positions as Shift Engineer, Production Manager, Plant Manager, Deputy General Manager and Managing Director before retiring in 2012. He was also Managing Director of the following Harel Mallac Group subsidiaries: Chemco Limited, Bychemex Limited, Coolkote Enterprises Ltd, Harel Mallac Export Ltd, MCFI International (Zambia) Ltd and Harel Mallac (Tanzania) Ltd. He is presently a management and trade consultant in Hariseng Ltd. He was appointed to the Board of The Mauritius Chemical and Fertilizer Industry Limited on 17 December 2003.
Other Directorships (listed companies): None.
Guy Harel (69)Independent Director
Guy Harel joined the Harel Mallac Group in 1981 as Managing Director of Fapcom Ltd. In 1983, he created Henkel Chemicals (Mauritius) Limited and took over as Managing Director in 1996. Following the acquisition of the company in 2007 by the Harel Mallac Group, he became the Managing Director of Archemics Ltd and held that position until 31 December 2012. He was appointed to the Board of The Mauritius Chemical and Fertilizer Industry Limited on 29 May 2013.
Other Directorships (listed companies):Bychemex Limited and Chemco Limited.
Vincent Labat (55)Independent Director
Vincent Labat graduated as a Chemical Engineer. From 1996 to 2009, he was the Managing Director of Les Gaz Industriels Ltd., a listed company. In 2010, he joined Medine Ltd as Project Development Executive. In July the following year, he was appointed Managing Director of the Agriculture Cluster. He has been a Director of The Mauritius Chemical and Fertilizer Industry Limited since 26 October 2006.
Other Directorships (listed Companies):Bychemex Limited and Chemco Limited.
Michel Rivalland, G.O.S.K. (64)Non-Executive DirectorDeceased on 12 August 2017
Late Michel Rivalland G.O.S.K. was a Fellow Member of the Chartered Association of Certified Accountants. He joined the Board of Directors of The Mauritius Chemical and Fertilizer Industry Limited on 1 June 2006 and served as Managing Director from October 2006 to 30 June 2009. He was an Executive Director of Harel Mallac & Co. Ltd. up to 12 August 2017.
Other directorships (listed Companies) on 12 August 2017:Compagnie des Magasins Populaires Limitée, Harel Mallac & Co. Ltd, Bychemex Limited and Chemco Limited.
THE MAURITIUS CHEMICAL AND FERTILIZER INDUSTRY LIMITED 10
team
Suie Sen Hock Meen Ah KineFinance Director
Suie Sen Hock Meen Ah Kine is an Associate Member of the Institute of Chartered Accountants in England and Wales and holder of a BSc (Hons) in Management Science from the University of Ottawa. He joined Harel Mallac in 2005 as Financial Controller of Harel Mallac Bureautique Ltd and was appointed Group Financial Controller in February 2007. Since 15 November 2015, he holds the position of Finance Director of the Chemicals and Fertilisers Sub-Division of the Harel Mallac Group.
Ranjit JatooaOperations Manager
Ranjit Jatooa is a qualified agronomist and holds a degree in Agriculture and a Master’s degree in Crop Science. He took employment with Chemco Limited in 2005 as Sales Executive in the Agribusiness Department and was promoted Product Manager in 2007. He joined MCFI in 2009 as Sales Manager, a role that he fulfilled until his appointment as Operations Manager in April 2014.
Harold Lai Chuck ChooInternational Sales and Project Manager
Harold Lai Chuck Choo holds a degree in Chemical Engineering from Teesside University and is a Senior Member of the American Institute of Chemical Engineers. He was the Operations Manager of the MCFI Group since October 2006, after serving as Technical Manager from May 1988. He was also the Acting Plant Manager at Grays Refinery Ltd from 1981 to 1988. Harold is presently the International Sales and Project Manager of the Company.
Christna HosaneeGroup Accountant
Christna Hosanee started his career at MCFI in 1978. He was involved in the setting up of the IT Department in the mid-1980s and has held various positions across the organisation, amongst which as IT Supervisor and later as the Accountant of the sister companies, Chemco Limited and Bychemex Limited. He is a Fellow Member of the Association of Chartered Certified Accountants.
Shemboosingh CheekhooreeManaging Director
Shemboosingh Cheekhooree holds a bachelor’s degree in Chemical Engineering from the North East London Polytechnic, United Kingdom. After spending 25 years at senior positions within the textile industry, he joined Harel Mallac in 2012 as Managing Director of Harel Mallac Export Ltd. In October 2013, he became General Manager of the Chemicals and Fertilisers Sub-Division of the Harel Mallac Group, of which he is now Managing Director. Since October 2014, he also is the Managing Director of Harel Mallac (Tanzania) Limited.

ANNUAL REPORT 2017 11
team
senior management
THE MAURITIUS CHEMICAL AND FERTILIZER INDUSTRY LIMITED 12
The Mauritius Chemical and Fertilizer Industry Limited is committed to the highest standards of business integrity, transparency and professionalism in all its activities to ensure that the Company and the Group are managed ethically and responsibly to enhance business value for all stakeholders.
the board of directors The Board endeavours to exercise leadership, entrepreneurship, integrity and judgement in directing the Company, so as to achieve continuing prosperity for the organisation while embracing both performance and compliance.
The Board also ensures that the activities of the Company comply with all legal and regulatory requirements as well as with its constitution, from which the Board derives its authority to act.
The Board inter alia oversees the development and implementation of the Company’s corporate strategy and reviews performance objectives. It provides for succession plans for key individuals and ensures effective communication with the Company’s stakeholders, promotes the Company’s Code of Ethics and supervises financial and capital management. As such, it reviews and approves quarterly and annual financial reports, monitors financial results and approves major capital expenditure, acquisitions, divestitures and material commitments. The Board also oversees compliance and risk management.
At 31 December 2017, the Board of Directors consisted of eight members, of whom two were Executive Directors and four were Independent Directors. Non-Executive Directors have free access to members of the senior management team. All Directors have access to the Company Secretary. With a view to enhancing the Board’s effectiveness, a Board’s performance review is carried out yearly to assess the Directors’ appreciation of the Board’s performance, its procedures and practices. The results of the assessment are discussed at the Corporate Governance Committee level. This Committee makes recommendations to the Board on any remedial action that may be required.
The elected Directors hold office for one year but are eligible for reappointment. Directors are elected or re-elected by separate resolutions. The Board has three committees (as described below), which meet regularly under the terms of reference set by the Board. The Board entrusts the day-to-day management of the Company to its Managing Director who ensures the smooth running of the organisation. The composition of the Board of Directors and other directorships held by the Directors in listed companies are given on pages 8 and 9.
board meetings The Board meets regularly during the year. For the period under review the Board met eight times. Board meetings are conducted in accordance with the Company’s constitution and the Companies Act.
Board meetings are organised in such a way that Directors receive all the information important to their understanding of the business to be conducted at the Board meeting, so that they can participate fully in the decision-making process.
At these Board meetings, the Company’s and Group’s budget, performance and forecast are reviewed and approved, reports from the Managing Director and Committees’ Chairpersons are received, strategic issues discussed and statutory matters approved. The Board may invite management or external consultants to attend Board meetings whenever required.
board committees
Corporate Governance Committee
The Corporate Governance Committee consists of Messrs Antoine L. Harel (Chairman), Allain Doger de Spéville and Vincent Labat.
The terms of reference of the Committee include the key areas that are the remit of a nomination and remuneration committee as contained in the formal terms of reference approved by the Board of Directors. Its main responsibilities include establishing a formal and transparent procedure for developing policy on executive and senior management remuneration, as well as determining specific remuneration packages for the Executive Directors of the Company. The Committee makes recommendations to the Board with regard to the fees of the Company’s Non-Executive and Independent Non-Executive Directors. It oversees the process regarding recommendation of potential candidates, ensures that proposed Directors meet the required criteria and standards, and are not disqualified from holding that position. The Committee further monitors the balance and effectiveness of the Board. It makes recommendations to the Board on the nomination and remuneration of the Company’s representatives on the Board of subsidiary companies. The Corporate Governance Committee makes recommendations for the election of Directors at the next Annual Meeting. During the year under review, the Committee met four times.
corporate governance report
ANNUAL REPORT 2017 13
Audit and Risk Committee
The Audit and Risk Committee consists of Mr Allain Doger de Spéville and Mr Vincent Labat and the latter chairs the Committee. Late Mr Michel Rivalland, G.O.S.K. sat on the Committee up to 12 August 2017. The Committee fulfilled its responsibilities for the year under review, in compliance with its formal terms of reference approved by the Board of Directors. The roles and responsibilities of the Audit Committee are to assist the Board in discharging its duties relating to the safeguarding of assets, the operation of adequate systems and control processes, and the preparation of accurate financial reports and statements, in compliance with all applicable legal requirements and accounting standards. The Committee also caters for issues relating to risk management and provides a forum for discussing business risks and control issues, and formulates relevant recommendations for consideration by the Board. The Board is satisfied that the Audit Committee has the required skills, knowledge and financial experience to discharge its duties effectively. During the period under review, the Committee met six times and fulfilled its responsibilities in compliance with its terms of reference that were formally approved by the Board.
Strategic Committee
The Strategic Committee is chaired by Mr Antoine L. Harel and its other member is Mr Charles Harel. Late Mr Michel Rivalland, G.O.S.K. sat on the Committee up to 12 August 2017. The Committee examines investment prospects and other strategic issues and makes its recommendations to the Board. During the period under review, the Committee met six times and performed its duties as per its terms of reference.
risk managementThe Board regularly addresses and evaluates physical, human resources, information technology, business, financial, reputational as well as regulatory and compliance risks. In the course of 2017, the internal audit function examined and evaluated the adequacy and effectiveness of control systems in place. Reports were subsequently produced and submitted to the Audit Committee, which, when applicable, made relevant recommendations to the Board.
Since 2010, a Risk Management Framework for the Company was adopted followed by the implementation of a continuous and dynamic system of risk assessment through compliance checks and discussions with the management for enhanced risk mitigation strategies. Some of the major risk areas entail:
Physical risks
Among the physical risks identified are unavoidable events such as riots, cyclones and other natural calamities. Mitigating actions such as the adoption of cyclone and fire procedures, the subscription to a relevant insurance cover, and the identification of a business continuity plan and disaster recovery plan have been taken.
Health and safety as well as security procedures have been implemented to limit the occurrence of on-site accidents. As measures against stock losses, fraud and theft, stock control, supervision and control procedures were set up. Preventive actions against off-site accidents by lorries carrying liquid chemicals or fertilisers included constant maintenance of drivers’ awareness about road safety measures, regular inspection of vehicles, and subscription to public liability insurance cover.
The Company also draws upon the expertise of both an occupational physician consultant and a full-time health and safety officer.
corporate governance report
attendance of members at board and committee meetings held in 2017
Board of Directors
Corporate Governance Committee
Audit Committee
Strategic Committee
Antoine L. Harel 8/8 4/4 - 5/5Suie Sen Hock Meen Ah Kine 8/8 - - -Shemboosingh Cheekhooree 8/8 - - -Allain Doger de Spéville 5/8 3/4 5/6 -Charles Harel 7/8 - - 5/5Guy Harel 8/8 - - -Vincent Labat 6/8 3/4 6/6 -Harold Ng Kwing King 8/8 - - -Michel Rivalland, G.O.S.K. 4/4 - 4/4 3/3
THE MAURITIUS CHEMICAL AND FERTILIZER INDUSTRY LIMITED 14
risk management (cont’d)Human Resources risks
With regard to loss of key personnel, retention policies have been adopted and a formal performance assessment and reward system has been implemented. In terms of reputation, image and business conduct, a Code of Ethics has been implemented and adequate reporting procedures have been set up. For high-risk jobs, regular health surveillance is performed on employees in such jobs and adequate medical insurance cover subscribed to.
Technology risks
Back up procedures as well as adequate restriction procedures have been established as safeguard measures against IT crash or breakdowns. Users’ policies and control procedures have been introduced for protection against information theft.
Business (market) risks
As a result of little growth in the agricultural sector in 2017 and the continued contraction in fertiliser demand, the business environment of MCFI has become more competitive and difficult.
Internal control
Internal control is a process designed to provide reasonable assurance regarding the achievement of organisational objectives with respect to:
• effectiveness and efficiency of operations;• safeguarding of assets and data of the organisation;• reliability of financial and other reporting;• prevention of fraud and irregularities;• acceptance and management of risk;• conformity with the codes of practice and ethics adopted by the organisation;• compliance with applicable laws and regulations; and• supporting business sustainability under normal as well as adverse operating conditions.
The Board has set appropriate policies to ensure that the above-mentioned control objectives are achieved.
Two reviews were performed by the Internal Audit during the year, covering all significant areas of the Company’s internal control.
Internal Audit
Internal Audit covers all significant areas of the Company’s internal control and is an objective assurance function reporting to the Board of Directors and Management. It provides assurance as to the adequacy and effectiveness of the risk management and internal control framework of an organisation. Internal Audit assists the Board and Management to maintain and improve the process by which risks are identified and managed and helps the Board discharge its responsibilities to maintain and strengthen the internal control framework.
The internal audit function was performed by the Group Internal Auditor before being outsourced to KPMG, in July 2017. The Internal Audit has examined the current control systems to check their suitability and effectiveness, and to ensure that they are being adhered to. The internal auditor has unrestricted access to the Company’s records, Management and employees. The Internal Auditor conducts its assignments based on a yearly plan, which is validated by the Audit Committee. Systems reviewed in 2017 at Company and subsidiaries level include stock, sales and debtors cycles, treasury and fixed assets management control, work-in-progress, sales and marketing, inventory and general processes and cover all significant areas of the Company’s internal control.
During the year under review, the Group Internal Auditor has regularly submitted to the Audit Committee audit reports relating to the Company and its subsidiaries for discussion and follow-up of the implementation of recommended actions.
composition of subsidiary companies’ boards The composition of the Boards of subsidiary companies is given on page 19.
corporate governance report
ANNUAL REPORT 2017 15
group structure The Directors recognise that the parent entity is Harel Mallac & Co. Ltd and that the ultimate parent entity is Société Pronema. The Directors common to the aforesaid entities are Mr Antoine L. Harel who is gérant of Société Pronema and Director of Harel Mallac & Co. Ltd and Mr Charles Harel who sits on the Board of Directors of Harel Mallac & Co. Ltd.
shareholders holding more than 5 percent of the companyShareholders directly or indirectly interested in 5 percent or more of the ordinary share capital of the Company are detailed on page 21.
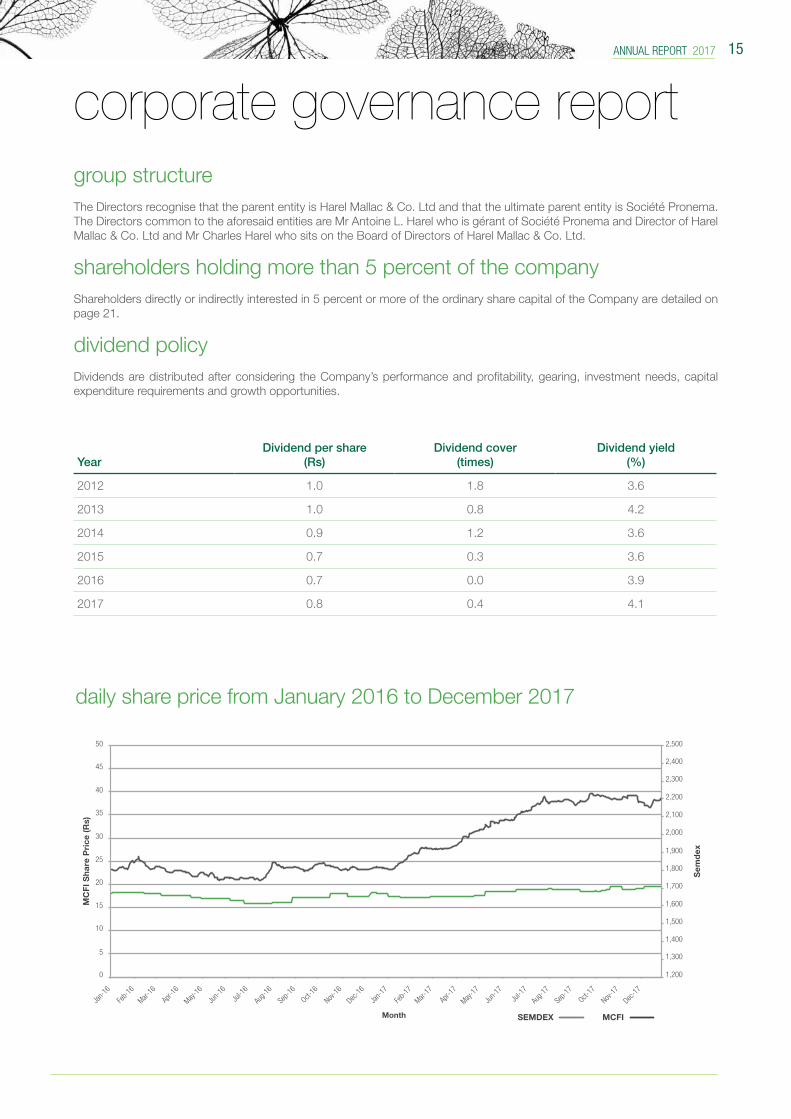
dividend policy Dividends are distributed after considering the Company’s performance and profitability, gearing, investment needs, capital expenditure requirements and growth opportunities.
daily share price from January 2016 to December 2017
corporate governance report
YearDividend per share
(Rs)Dividend cover
(times)Dividend yield
(%)
2012 1.0 1.8 3.6
2013 1.0 0.8 4.2
2014 0.9 1.2 3.6
2015 0.7 0.3 3.6
2016 0.7 0.0 3.9
2017 0.8 0.4 4.1
MCFI Share Price v/s Semdex from January 2016 to December 2017
SEMDEX MCFIMonth
Jan-1
6
Feb-1
6
Mar-16
Apr-1
6
May-1
6
Jun-1
6Ju
l-16
Aug-1
6
Sep-1
6
Oct-16
Nov-1
6
Dec-1
6
Jan-1
7
Feb-1
7
Mar-17
Apr-1
7
May-1
7
Jun-1
7Ju
l-17
Aug-1
7
Sep-1
7
Oct-17
Nov-1
7
Dec-1
7
Sem
dex
1,200
1,300
1,400
1,500
1,600
1,700
1,800
1,900
2,000
2,100
2,200
2,300
2,400
2,500
MC
FI S
har
e P
rice
(Rs)
0
5
10
15
20
25
30
35
40
45
50
THE MAURITIUS CHEMICAL AND FERTILIZER INDUSTRY LIMITED 16
directors’ interests in shares The direct and indirect interests of Directors in the ordinary shares of the Company and its subsidiaries are reported on page 20.
directors’ dealings in shares of the company With regard to Directors’ dealings in the shares of the Company, the Directors confirm that they have followed the principles of the Model Code on Securities Transactions by Directors as detailed in Appendix 6 of the Mauritius Stock Exchange Listing Rules. During the year under review, none of the Directors has bought or sold any of the Company’s shares.
related party transactions Related party transactions are detailed on pages 79 to 81.
senior management profile The profile of the senior management team is given on page 10.
company’s constitution The constitution of the Company does not provide any ownership restrictions or pre-emption rights. It is in agreement with the Companies Act 2001 and the listing rules of the Stock Exchange of Mauritius and does not contain any material clause that needs to be disclosed.
shareholders’ agreement affecting the governance of the company by the board The Company is not aware of any such agreement during the period under review.
third party management agreement The Company has a management contract with Harel Mallac & Co. Ltd for management support services, including but not limited to the financial accounting, legal, internal audit and human resources fields. The agreement is renewable on a yearly basis.
directors’ fees The Directors, to the exception of the Executive Directors and one of the Non-Executive Directors, are paid Directors’ fees and fees in relation to the Audit, Corporate Governance and Strategic Committees.
directors’ remuneration Directors’ remuneration is given on page 20. It has not been disclosed on an individual basis due to the commercial sensitivity of the information.
remuneration policy The Company’s remuneration policy recommends that the Company provides competitive rewards for its senior executives and other senior management staff, taking into account the Company’s performance and external market data from independent sources and, in particular, where available, salary levels for similar positions in comparable companies.
The remuneration package consists of base salary, fringe benefits and an annual individual performance bonus. The remuneration package is determined by the Board of Directors upon recommendations by the Corporate Governance Committee.
Directors and members of Board Committees may receive additional fees for their roles on such committees.
corporate governance report
ANNUAL REPORT 2017 17
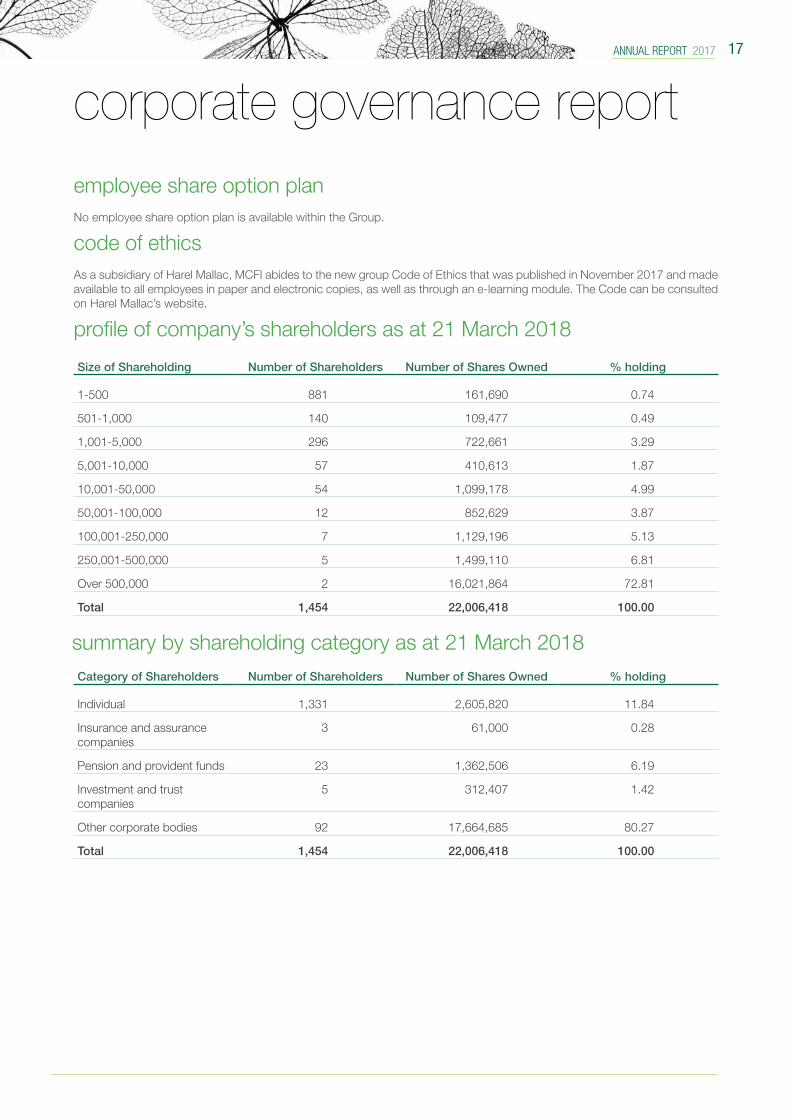
employee share option plan No employee share option plan is available within the Group.
code of ethics As a subsidiary of Harel Mallac, MCFI abides to the new group Code of Ethics that was published in November 2017 and made available to all employees in paper and electronic copies, as well as through an e-learning module. The Code can be consulted on Harel Mallac’s website.
profile of company’s shareholders as at 21 March 2018
summary by shareholding category as at 21 March 2018
corporate governance report
Size of Shareholding Number of Shareholders Number of Shares Owned % holding
1-500 881 161,690 0.74
501-1,000 140 109,477 0.49
1,001-5,000 296 722,661 3.29
5,001-10,000 57 410,613 1.87
10,001-50,000 54 1,099,178 4.99
50,001-100,000 12 852,629 3.87
100,001-250,000 7 1,129,196 5.13
250,001-500,000 5 1,499,110 6.81
Over 500,000 2 16,021,864 72.81
Total 1,454 22,006,418 100.00
Category of Shareholders Number of Shareholders Number of Shares Owned % holding
Individual 1,331 2,605,820 11.84
Insurance and assurance companies
3 61,000 0.28
Pension and provident funds 23 1,362,506 6.19
Investment and trust companies
5 312,407 1.42
Other corporate bodies 92 17,664,685 80.27
Total 1,454 22,006,418 100.00
THE MAURITIUS CHEMICAL AND FERTILIZER INDUSTRY LIMITED 18
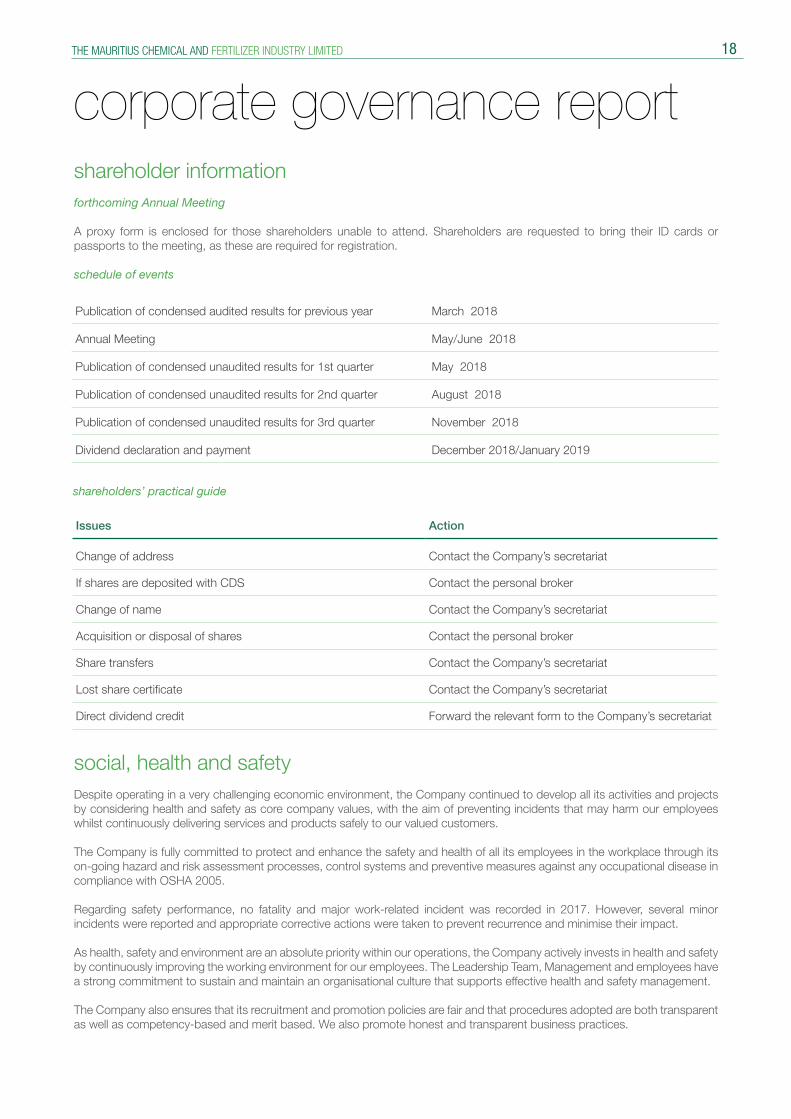
shareholder information forthcoming Annual Meeting
A proxy form is enclosed for those shareholders unable to attend. Shareholders are requested to bring their ID cards or passports to the meeting, as these are required for registration.
schedule of events
social, health and safety Despite operating in a very challenging economic environment, the Company continued to develop all its activities and projects by considering health and safety as core company values, with the aim of preventing incidents that may harm our employees whilst continuously delivering services and products safely to our valued customers.
The Company is fully committed to protect and enhance the safety and health of all its employees in the workplace through its on-going hazard and risk assessment processes, control systems and preventive measures against any occupational disease in compliance with OSHA 2005.
Regarding safety performance, no fatality and major work-related incident was recorded in 2017. However, several minor incidents were reported and appropriate corrective actions were taken to prevent recurrence and minimise their impact.
As health, safety and environment are an absolute priority within our operations, the Company actively invests in health and safety by continuously improving the working environment for our employees. The Leadership Team, Management and employees have a strong commitment to sustain and maintain an organisational culture that supports effective health and safety management.
The Company also ensures that its recruitment and promotion policies are fair and that procedures adopted are both transparent as well as competency-based and merit based. We also promote honest and transparent business practices.
shareholders’ practical guide
corporate governance report
Publication of condensed audited results for previous year March 2018
Annual Meeting May/June 2018
Publication of condensed unaudited results for 1st quarter May 2018
Publication of condensed unaudited results for 2nd quarter August 2018
Publication of condensed unaudited results for 3rd quarter November 2018
Dividend declaration and payment December 2018/January 2019
Issues Action
Change of address Contact the Company’s secretariat
If shares are deposited with CDS Contact the personal broker
Change of name Contact the Company’s secretariat
Acquisition or disposal of shares Contact the personal broker
Share transfers Contact the Company’s secretariat
Lost share certificate Contact the Company’s secretariat
Direct dividend credit Forward the relevant form to the Company’s secretariat
ANNUAL REPORT 2017 19
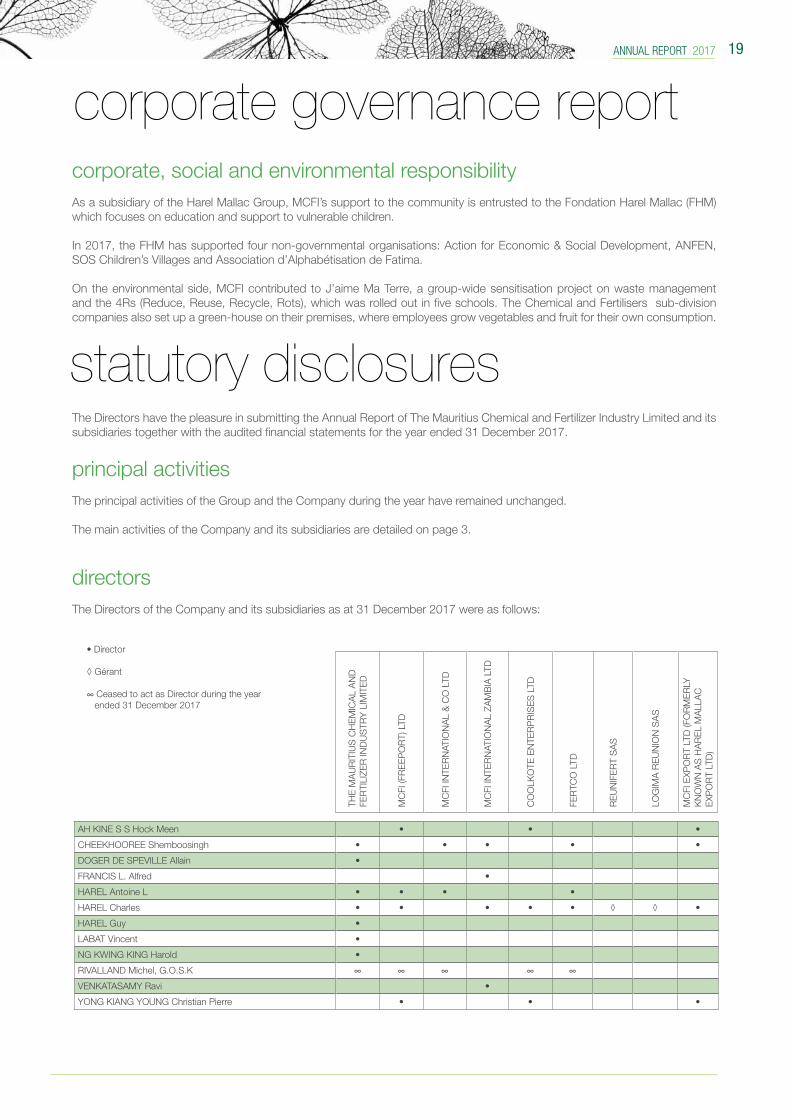
corporate, social and environmental responsibilityAs a subsidiary of the Harel Mallac Group, MCFI’s support to the community is entrusted to the Fondation Harel Mallac (FHM) which focuses on education and support to vulnerable children.
In 2017, the FHM has supported four non-governmental organisations: Action for Economic & Social Development, ANFEN, SOS Children’s Villages and Association d’Alphabétisation de Fatima.
On the environmental side, MCFI contributed to J’aime Ma Terre, a group-wide sensitisation project on waste management and the 4Rs (Reduce, Reuse, Recycle, Rots), which was rolled out in five schools. The Chemical and Fertilisers sub-division companies also set up a green-house on their premises, where employees grow vegetables and fruit for their own consumption.
The Directors have the pleasure in submitting the Annual Report of The Mauritius Chemical and Fertilizer Industry Limited and its subsidiaries together with the audited financial statements for the year ended 31 December 2017.
principal activities The principal activities of the Group and the Company during the year have remained unchanged. The main activities of the Company and its subsidiaries are detailed on page 3.
directors The Directors of the Company and its subsidiaries as at 31 December 2017 were as follows:
corporate governance report
statutory disclosures
AH KINE S S Hock Meen • • •
CHEEKHOOREE Shemboosingh • • • • •
DOGER DE SPEVILLE Allain •
FRANCIS L. Alfred •
HAREL Antoine L • • • •
HAREL Charles • • • • • ◊ ◊ •
HAREL Guy •
LABAT Vincent •
NG KWING KING Harold •
RIVALLAND Michel, G.O.S.K ∞ ∞ ∞ ∞ ∞
VENKATASAMY Ravi •
YONG KIANG YOUNG Christian Pierre • • •
THE
MA
UR
ITIU
S C
HE
MIC
AL
AN
D
FER
TILI
ZER
IND
US
TRY
LIM
ITE
D
MC
FI (F
RE
EP
OR
T) L
TD
MC
FI IN
TER
NAT
ION
AL
& C
O L
TD
MC
FI IN
TER
NAT
ION
AL
ZAM
BIA
LTD
CO
OLK
OTE
EN
TER
PR
ISE
S L
TD
FER
TCO
LTD
RE
UN
IFE
RT
SA
S
LOG
IMA
RE
UN
ION
SA
S
MC
FI E
XPO
RT
LTD
(FO
RM
ER
LY
KN
OW
N A
S H
AR
EL
MA
LLA
C
EXP
OR
T LT
D)
• Director ◊ Gérant ∞ Ceased to act as Director during the year ended 31 December 2017
THE MAURITIUS CHEMICAL AND FERTILIZER INDUSTRY LIMITED 20
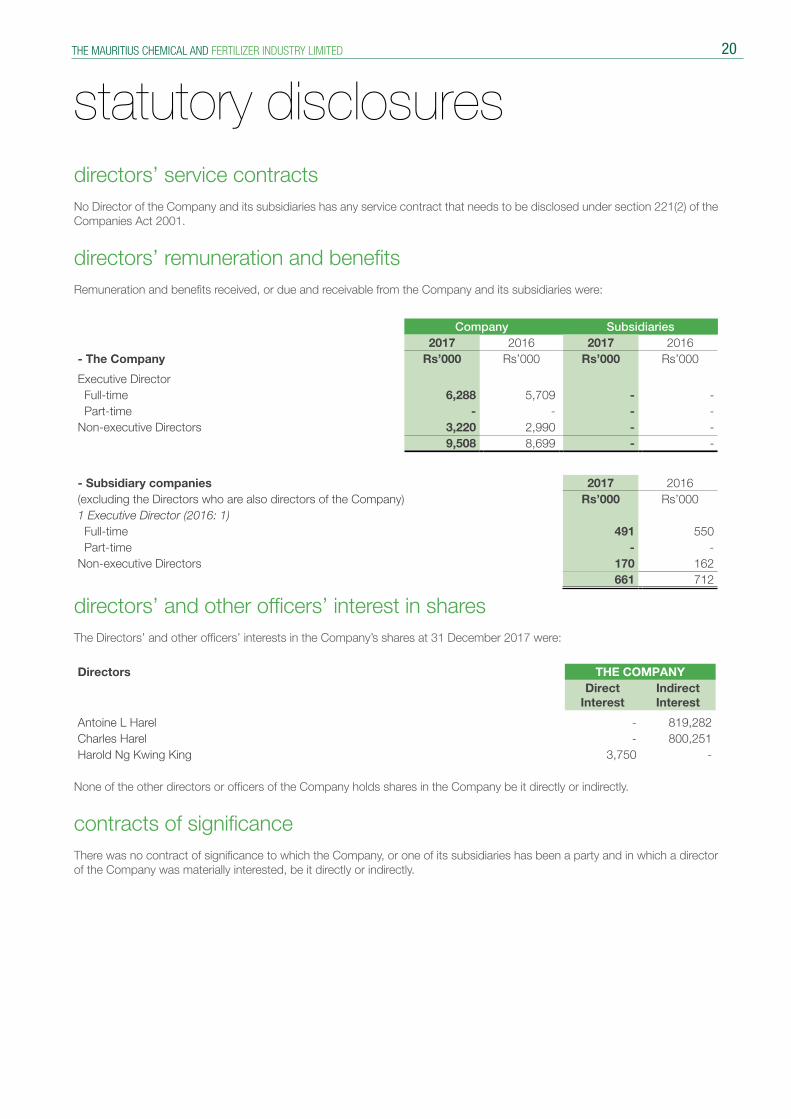
directors’ service contracts No Director of the Company and its subsidiaries has any service contract that needs to be disclosed under section 221(2) of the Companies Act 2001.
directors’ remuneration and benefits Remuneration and benefits received, or due and receivable from the Company and its subsidiaries were:
directors’ and other officers’ interest in shares The Directors’ and other officers’ interests in the Company’s shares at 31 December 2017 were:
None of the other directors or officers of the Company holds shares in the Company be it directly or indirectly.
contracts of significance There was no contract of significance to which the Company, or one of its subsidiaries has been a party and in which a director of the Company was materially interested, be it directly or indirectly.
statutory disclosures
Company Subsidiaries2017 2016 2017 2016
- The Company Rs’000 Rs’000 Rs’000 Rs’000
Executive Director Full-time 6,288 5,709 - - Part-time - - - - Non-executive Directors 3,220 2,990 - -
9,508 8,699 - -
- Subsidiary companies 2017 2016(excluding the Directors who are also directors of the Company) Rs’000 Rs’0001 Executive Director (2016: 1) Full-time 491 550 Part-time - - Non-executive Directors 170 162
661 712
Directors THE COMPANYDirect
InterestIndirect Interest
Antoine L Harel - 819,282Charles Harel - 800,251Harold Ng Kwing King 3,750 -
ANNUAL REPORT 2017 21
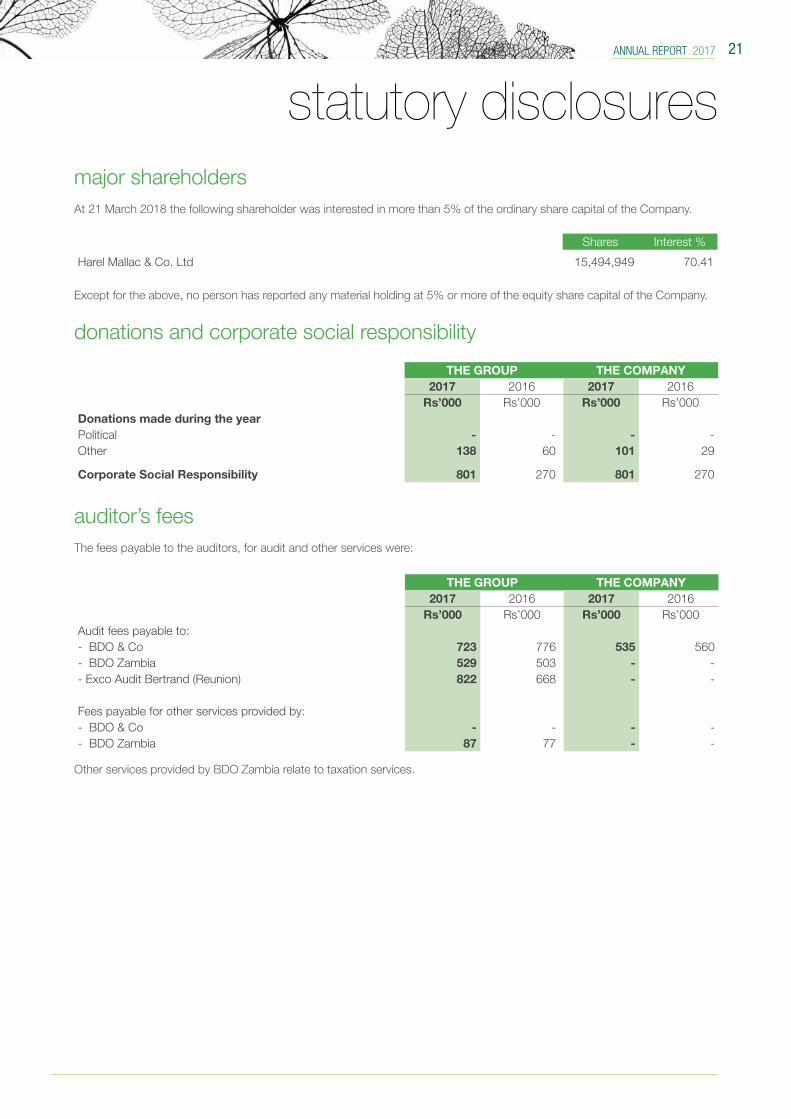
auditor’s fees The fees payable to the auditors, for audit and other services were:
Other services provided by BDO Zambia relate to taxation services.
Except for the above, no person has reported any material holding at 5% or more of the equity share capital of the Company.
donations and corporate social responsibility
major shareholders At 21 March 2018 the following shareholder was interested in more than 5% of the ordinary share capital of the Company.
statutory disclosures
Shares Interest %
Harel Mallac & Co. Ltd 15,494,949 70.41
THE GROUP THE COMPANY2017 2016 2017 2016
Rs’000 Rs’000 Rs’000 Rs’000Donations made during the yearPolitical - - - -Other 138 60 101 29
Corporate Social Responsibility 801 270 801 270
THE GROUP THE COMPANY2017 2016 2017 2016
Rs’000 Rs’000 Rs’000 Rs’000Audit fees payable to:- BDO & Co 723 776 535 560- BDO Zambia 529 503 - -- Exco Audit Bertrand (Reunion) 822 668 - -
Fees payable for other services provided by:- BDO & Co - - - -- BDO Zambia 87 77 - -
THE MAURITIUS CHEMICAL AND FERTILIZER INDUSTRY LIMITED 22
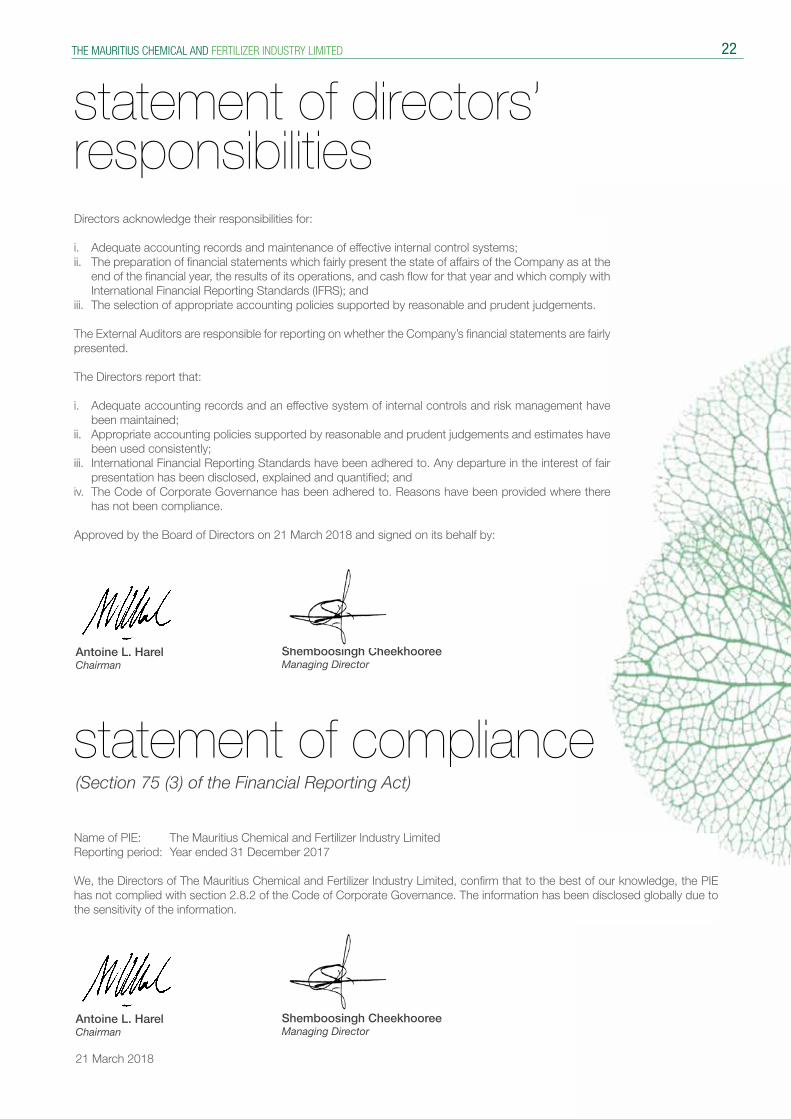
statement of directors’ responsibilities
statement of compliance
Directors acknowledge their responsibilities for:
i. Adequate accounting records and maintenance of effective internal control systems;ii. The preparation of financial statements which fairly present the state of affairs of the Company as at the
end of the financial year, the results of its operations, and cash flow for that year and which comply with International Financial Reporting Standards (IFRS); and
iii. The selection of appropriate accounting policies supported by reasonable and prudent judgements.
The External Auditors are responsible for reporting on whether the Company’s financial statements are fairly presented.
The Directors report that:
i. Adequate accounting records and an effective system of internal controls and risk management have been maintained;
ii. Appropriate accounting policies supported by reasonable and prudent judgements and estimates have been used consistently;
iii. International Financial Reporting Standards have been adhered to. Any departure in the interest of fair presentation has been disclosed, explained and quantified; and
iv. The Code of Corporate Governance has been adhered to. Reasons have been provided where there has not been compliance.
Approved by the Board of Directors on 21 March 2018 and signed on its behalf by:
Name of PIE: The Mauritius Chemical and Fertilizer Industry LimitedReporting period: Year ended 31 December 2017
We, the Directors of The Mauritius Chemical and Fertilizer Industry Limited, confirm that to the best of our knowledge, the PIE has not complied with section 2.8.2 of the Code of Corporate Governance. The information has been disclosed globally due to the sensitivity of the information.
Antoine L. HarelChairman
Antoine L. HarelChairman
21 March 2018
Shemboosingh CheekhooreeManaging Director
Shemboosingh CheekhooreeManaging Director
(Section 75 (3) of the Financial Reporting Act)
ANNUAL REPORT 2017 23
We certify that, to the best of our knowledge and belief, the Company has filed with the Registrar of Companies all such returns as are required of the Company under the Companies Act 2001.
HM Secretaries Ltd.Secretary21 March 2018
secretary’s certificate
THE MAURITIUS CHEMICAL AND FERTILIZER INDUSTRY LIMITED 24
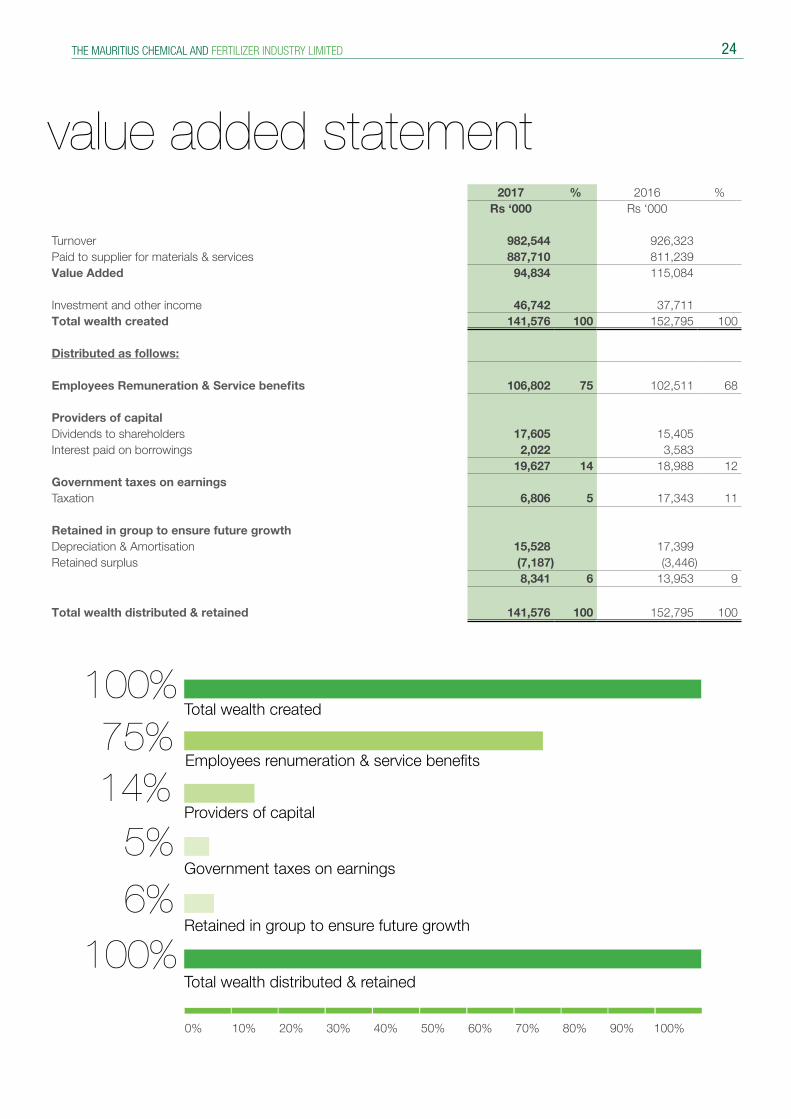
value added statement
Government taxes on earnings
Retained in group to ensure future growth
Total wealth created
Total wealth distributed & retained
100%
100%
75%14%
5%6%
Providers of capital
Employees renumeration & service benefits
0% 10% 20% 30% 40% 50% 60% 70% 80% 90% 100%
2017 % 2016 %Rs ‘000 Rs ‘000
Turnover 982,544 926,323Paid to supplier for materials & services 887,710 811,239Value Added 94,834 115,084
Investment and other income 46,742 37,711Total wealth created 141,576 100 152,795 100
Distributed as follows:
Employees Remuneration & Service benefits 106,802 75 102,511 68
Providers of capitalDividends to shareholders 17,605 15,405 Interest paid on borrowings 2,022 3,583
19,627 14 18,988 12Government taxes on earningsTaxation 6,806 5 17,343 11
Retained in group to ensure future growthDepreciation & Amortisation 15,528 17,399 Retained surplus (7,187) (3,446)
8,341 6 13,953 9
Total wealth distributed & retained 141,576 100 152,795 100
ANNUAL REPORT 2017 25
independent auditor’s reportTo the Shareholders of The Mauritius Chemical and Fertilizer Industry Limited
This report is made solely to the members of The Mauritius Chemical and Fertilizer Industry Limited (the “Company”), as a body, in accordance with Section 205 of the Companies Act 2001. Our audit work has been undertaken so that we might state to the Company’s members those matters we are required to state to them in an auditor’s report and for no other purpose. To the fullest extent permitted by law, we do not accept or assume responsibility to anyone other than the Company and the Company’s members as a body, for our audit work, for this report, or for the opinions we have formed. Report on the audit of the Financial Statements Opinion We have audited the consolidated financial statements of The Mauritius Chemical and Fertilizer Industry Limited and its subsidiaries (the “Group”), and the Company’s separate financial statements on pages 28 to 82 which comprise the statements of financial position as at 31 December 2017, and the statements of profit or loss and other comprehensive income, statements of changes in equity and statements of cash flows for the year then ended, and notes to the financial statements, including a summary of significant accounting policies. In our opinion, the financial statements on pages 28 to 82 give a true and fair view of the financial position of the Group and of the Company as at 31 December 2017, and of their financial performance and their cash flows for the year then ended in accordance with International Financial Reporting Standards and comply with the Companies Act 2001. Basis for Opinion We conducted our audit in accordance with International Standards on Auditing (ISAs). Our responsibilities under those standards are further described in the Auditor’s Responsibilities for the Audit of the Financial Statements section of our report. We are independent of the Group and of the Company in accordance with the International Ethics Standards Board for Accountants’ Code of Ethics for Professional Accountants (IESBA Code) together with the ethical requirements that are relevant to our audit of the financial statements in Mauritius, and we have fulfilled our other ethical responsibilities in accordance with these requirements and the IESBA Code. We believe that the audit evidence we have obtained is sufficient and appropriate to provide a basis for our opinion. Key Audit Matters Key audit matters are those matters that, in our professional judgment, were of most significance in our audit of the financial statements of the current period. These matters were addressed in the context of our audit of the financial statements as a whole, and in forming our opinion thereon, and we do not provide a separate opinion on these matters.
Key Audit Matter for the Group and the Company is as follows:
1 Revenue recognition
Key Audit Matter
Revenue is an important measure used to evaluate the performance of the Group and the Company. There is a risk that the revenue is presented for amounts higher than what has been actually generated by the Group and the Company. Consequently, we considered revenue recognition to be a significant key audit matter. The Group’s and the Company’s revenue is recognised when the significant risks and rewards of ownership of the goods have been passed to the buyer and/or services have been rendered.
Related Disclosures
Refer to note 2.21 (accounting policy note) and note 23 (financial statement disclosures)
Audit Response
Our audit procedures to address the risk of material misstatement relating to revenue recognition include:
• Testing of design, existence and operating effectiveness of internal control procedures implemented as well as test of details to ensure accurate processing of revenue transactions.
• The accuracy and completeness of revenue was verified through Computer Assisted Audit Techniques, cut-off test and analytical reviews.
Key Audit Matter for the Group is as follows:
2 Recoverability of receivable balances from related companies
Key Audit Matter
The Group had receivable balances from related companies of Rs.442.5m as at 31 December 2017, representing 31% of the total assets of the Group. We focussed on this area as a key audit matter due to amounts involved being material and cash is tied up in these receivable balances.
Related Disclosures
Refer to note 11, 13 and 36 of the accompanying financial statements.
Audit Response
Our procedures included, amongst others:
• Assessing and challenging management’s view of recoverability and questioning management’s knowledge of future conditions that may impact expected receipts.
• Discussed, evaluated and concluded with management that the debts from related companies are being serviced in the future and that the latter has a possible cash streaming to repay these debts.
THE MAURITIUS CHEMICAL AND FERTILIZER INDUSTRY LIMITED 26
independent auditor’s reportTo the Shareholders of The Mauritius Chemical and Fertilizer Industry Limited (Cont’d)
Key Audit Matter for the Company is as follows: 1 Recoverabiliy of Group receivable balances Key Audit Matter
The Company had receivable from group companies of Rs.491.4m as at 31 December 2017, representing 45% of the total assets of the Company. We focussed on this area as a key audit matter due to amounts involved being material and cash is tied up in these group receivables.
Related Disclosures
Refer to note 11, 13 and 36 of the accompanying financial statements.
Audit Response
“Our procedures included, amongst others:
• Assessing and challenging management’s view of recoverability and questioning management’s knowledge of future conditions that may impact expected receipts.
• Discussed, evaluated and concluded with management that the debts from group companies are being serviced in the future and that the latter has a possible cash streaming to repay these debts.” Other information
Directors are responsible for the other information. The other information comprises the Corporate Governance report, Board of Directors, Senior Management profile, Statement of Directors’ Responsibilities, Statement of Compliance and Statutory disclosures (but does not include the financial statements and our auditor’s report thereon), which we obtained prior to the date of this auditor’s report, and the Vision, Mission and Values statement, Group Profile, Business Lines Corporate Information, Chairman and Managing Director’s report and Value Added statement (together referred as the ‘other statements’), which is expected to be made available to us after that date. Our opinion on the financial statements does not cover the other information and we do not and will not express any form of assurance conclusion thereon.
In connection with our audit of the financial statements, our responsibility is to read the other information identified above and, in doing so, consider whether the other information is materially inconsistent with the financial statements or our knowledge obtained in the audit, or otherwise appears to be materially misstated.
If, based on the work we have performed on the Corporate Governance report, Board of Directors, Senior Management profile, Statement of Directors’ Responsibilities, Statement of Compliance and Statutory disclosures that we obtained prior to the date of this auditor’s report, we conclude that there is a material misstatement of this other information, we are required to report that fact. We have nothing to report in this regard.
When we read the ‘other statements’ which will be made available to us after that date, if we conclude that there is a material misstatement therein, we are required to communicate the matter to those charged with governance.
Responsibilities of Directors and Those Charged with Governance for the Financial Statements The Directors are responsible for the preparation and fair presentation of the financial statements in accordance with International Financial Reporting Standards and in compliance with the requirements of the Companies Act 2001, and for such internal control as the directors determine is necessary to enable the preparation of the financial statements that are free from material misstatement, whether due to fraud or error. In preparing the financial statements, the directors are responsible for assessing the Group and the Company’s ability to continue as a going concern, disclosing, as applicable, matters related to going concern and using the going concern basis of accounting unless the directors either intend to liquidate the Group and the Company or to cease operations, or have no realistic alternative but to do so. Those charged with governance are responsible for overseeing the Group and the Company’s financial reporting process. Auditor’s Responsibilities for the Audit of the Financial Statements Our objectives are to obtain reasonable assurance about whether the financial statements as a whole are free from material misstatement, whether due to fraud or error, and to issue an auditor’s report that includes our opinion. Reasonable assurance is a high level of assurance, but is not a guarantee that an audit conducted in accordance with ISAs will always detect a material misstatement when it exists. Misstatements can arise from fraud or error and are considered material if, individually or in the aggregate, they could reasonably be expected to influence the economic decisions of users taken on the basis of these financial statements. As part of an audit in accordance with ISAs, we exercise professional judgment and maintain professional skepticism throughout the audit. We also:
• Identify and assess the risks of material misstatement of the financial statements, whether due to fraud or error, design and perform audit procedures responsive to those risks, and obtain audit evidence that is sufficient and appropriate to provide a basis for our opinion. The risk of not detecting a material misstatement resulting from fraud is higher than for one resulting from error, as fraud may involve collusion, forgery, intentional omissions, misrepresentations, or the override of internal control.
• Obtain an understanding of internal control relevant to the audit in order to design audit procedures that are appropriate in the circumstances, but not for the purpose of expressing an opinion on the effectiveness of the Group and the Company’s internal control.
• Evaluate the appropriateness of accounting policies used and the reasonableness of accounting estimates and related disclosures made by directors.
ANNUAL REPORT 2017 27
• Conclude on the appropriateness of directors’ use of the going concern basis of accounting and, based on the audit evidence obtained, whether a material uncertainty exists related to events or conditions that may cast significant doubt on the Group and the Company’s ability to continue as a going concern. If we conclude that a material uncertainty exists, we are required to draw attention in our auditor’s report to the related disclosures in the financial statements or, if such disclosures are inadequate, to modify our opinion. Our conclusions are based on the audit evidence obtained up to the date of our auditor’s report. However, future events or conditions may cause the Group and the Company to cease to continue as a going concern.
Evaluate the overall presentation, structure and content of the financial statements, including the disclosures, and whether the financial statements represent the underlying transactions and events in a manner that achieves fair presentation.Obtain sufficient appropriate audit evidence regarding the financial information of the entities or business activities within the Group to express an opinion on the consolidated financial statements. We are responsible for the direction, supervision and performance of the group audit. We remain solely responsible for our audit opinion.
We communicate with those charged with governance regarding, among other matters, the planned scope and timing of the audit and significant audit findings, including any significant deficiencies in internal control that we identify during our audit. We also provide those charged with governance with a statement that we have complied with relevant ethical requirements regarding independence, and to communicate with them all relationships and other matters that may reasonably be thought to bear on our independence, and where applicable, related safeguards. From the matters communicated with those charged with governance, we determine those matters that were of most significance in the audit of the financial statements of the current period and are therefore the key audit matters. We describe these matters in our auditor’s report unless law or regulation precludes public disclosure about the matter or when, in extremely rare circumstances, we determine that a matter should not be communicated in our report because the adverse consequences of doing so would reasonably be expected to outweigh the public interest benefits of such communication.
Report on Other Legal and Regulatory Requirements Companies Act 2001 We have no relationship with, or interests in, the Company or any of its subsidiaries, other than in our capacity as auditors and dealings in the ordinary course of business. We have obtained all information and explanations we have required. In our opinion, proper accounting records have been kept by the Company as far as it appears from our examination of those records.
Financial Reporting Act 2004 The Directors are responsible for preparing the corporate governance report. Our responsibility is to report the extent of compliance with the Code of Corporate Governance as disclosed in the annual report and on whether the disclosure is consistent with the requirements of the Code. In our opinion, the disclosure in the annual report is consistent with the requirements of the Code.
BDO & COChartered Accountants
Port Louis, Mauritius.
21 March 2018
Rookaya Ghanty, FCCALicensed by FRC
independent auditor’s reportTo the Shareholders of The Mauritius Chemical and Fertilizer Industry Limited (Cont’d)
THE MAURITIUS CHEMICAL AND FERTILIZER INDUSTRY LIMITED 28
year ended 31 December 2017THE GROUP THE COMPANY
Notes 2017 2016 2017 2016Rs’000 Rs’000 Rs’000 Rs’000
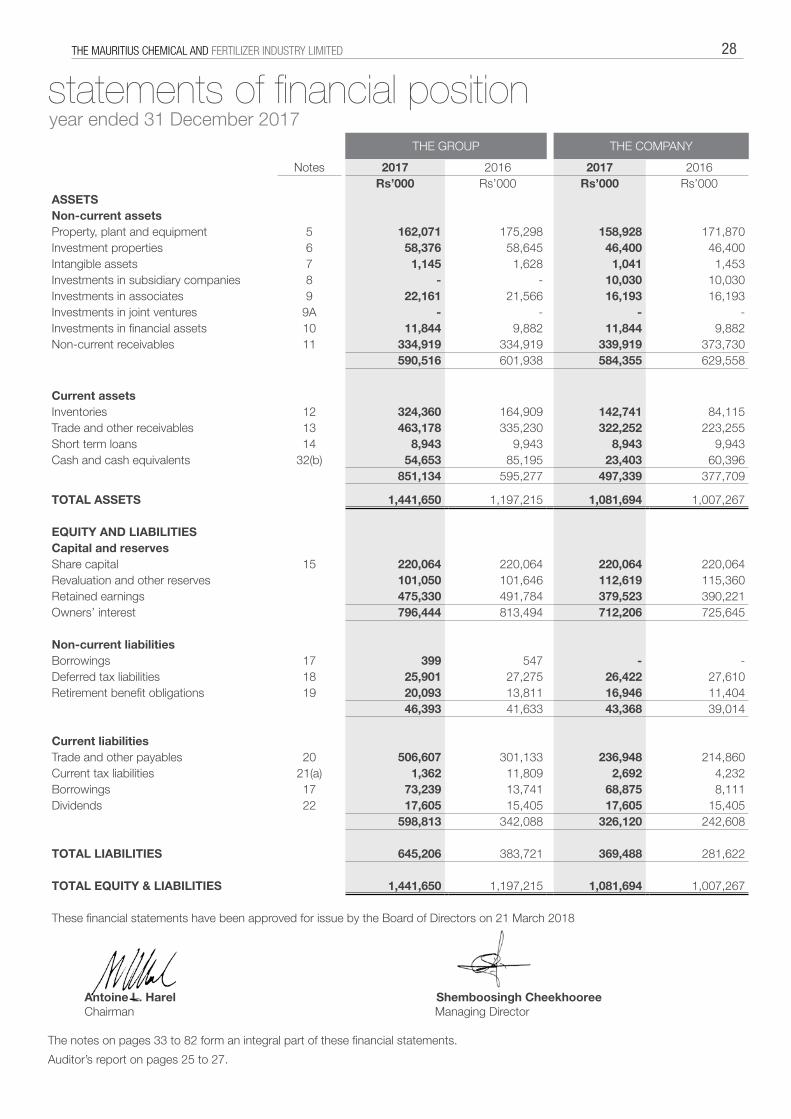
ASSETS Non-current assetsProperty, plant and equipment 5 162,071 175,298 158,928 171,870 Investment properties 6 58,376 58,645 46,400 46,400 Intangible assets 7 1,145 1,628 1,041 1,453 Investments in subsidiary companies 8 - - 10,030 10,030 Investments in associates 9 22,161 21,566 16,193 16,193 Investments in joint ventures 9A - - - - Investments in financial assets 10 11,844 9,882 11,844 9,882 Non-current receivables 11 334,919 334,919 339,919 373,730
590,516 601,938 584,355 629,558
Current assetsInventories 12 324,360 164,909 142,741 84,115 Trade and other receivables 13 463,178 335,230 322,252 223,255 Short term loans 14 8,943 9,943 8,943 9,943 Cash and cash equivalents 32(b) 54,653 85,195 23,403 60,396
851,134 595,277 497,339 377,709
TOTAL ASSETS 1,441,650 1,197,215 1,081,694 1,007,267
EQUITY AND LIABILITIESCapital and reservesShare capital 15 220,064 220,064 220,064 220,064 Revaluation and other reserves 101,050 101,646 112,619 115,360 Retained earnings 475,330 491,784 379,523 390,221 Owners’ interest 796,444 813,494 712,206 725,645
Non-current liabilitiesBorrowings 17 399 547 - - Deferred tax liabilities 18 25,901 27,275 26,422 27,610 Retirement benefit obligations 19 20,093 13,811 16,946 11,404
46,393 41,633 43,368 39,014
Current liabilitiesTrade and other payables 20 506,607 301,133 236,948 214,860 Current tax liabilities 21(a) 1,362 11,809 2,692 4,232 Borrowings 17 73,239 13,741 68,875 8,111 Dividends 22 17,605 15,405 17,605 15,405
598,813 342,088 326,120 242,608
TOTAL LIABILITIES 645,206 383,721 369,488 281,622
TOTAL EQUITY & LIABILITIES 1,441,650 1,197,215 1,081,694 1,007,267
These financial statements have been approved for issue by the Board of Directors on 21 March 2018
statements of financial position
Antoine L. Harel Shemboosingh Cheekhooree Chairman Managing Director The notes on pages 33 to 82 form an integral part of these financial statements.
Auditor’s report on pages 25 to 27.
ANNUAL REPORT 2017 29
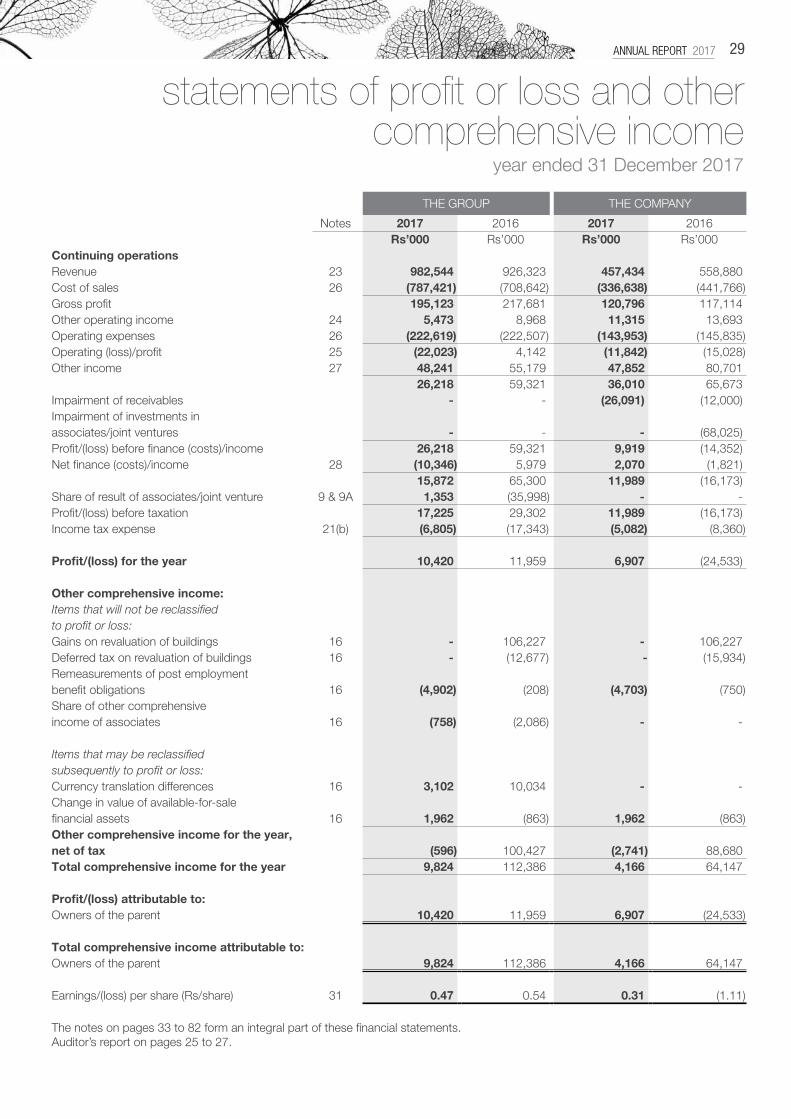
statements of profit or loss and other comprehensive income
year ended 31 December 2017
THE GROUP THE COMPANY
Notes 2017 2016 2017 2016Rs’000 Rs’000 Rs’000 Rs’000
Continuing operationsRevenue 23 982,544 926,323 457,434 558,880 Cost of sales 26 (787,421) (708,642) (336,638) (441,766)Gross profit 195,123 217,681 120,796 117,114 Other operating income 24 5,473 8,968 11,315 13,693 Operating expenses 26 (222,619) (222,507) (143,953) (145,835)Operating (loss)/profit 25 (22,023) 4,142 (11,842) (15,028)Other income 27 48,241 55,179 47,852 80,701
26,218 59,321 36,010 65,673 Impairment of receivables - - (26,091) (12,000)Impairment of investments inassociates/joint ventures - - - (68,025)Profit/(loss) before finance (costs)/income 26,218 59,321 9,919 (14,352)Net finance (costs)/income 28 (10,346) 5,979 2,070 (1,821)
15,872 65,300 11,989 (16,173)Share of result of associates/joint venture 9 & 9A 1,353 (35,998) - - Profit/(loss) before taxation 17,225 29,302 11,989 (16,173)Income tax expense 21(b) (6,805) (17,343) (5,082) (8,360)
Profit/(loss) for the year 10,420 11,959 6,907 (24,533)
Other comprehensive income:Items that will not be reclassified to profit or loss:Gains on revaluation of buildings 16 - 106,227 - 106,227 Deferred tax on revaluation of buildings 16 - (12,677) - (15,934)Remeasurements of post employment benefit obligations 16 (4,902) (208) (4,703) (750)Share of other comprehensive income of associates 16 (758) (2,086) - -
Items that may be reclassified subsequently to profit or loss:Currency translation differences 16 3,102 10,034 - - Change in value of available-for-sale financial assets 16 1,962 (863) 1,962 (863)Other comprehensive income for the year, net of tax (596) 100,427 (2,741) 88,680 Total comprehensive income for the year 9,824 112,386 4,166 64,147
Profit/(loss) attributable to:Owners of the parent 10,420 11,959 6,907 (24,533)
Total comprehensive income attributable to:Owners of the parent 9,824 112,386 4,166 64,147
Earnings/(loss) per share (Rs/share) 31 0.47 0.54 0.31 (1.11)
The notes on pages 33 to 82 form an integral part of these financial statements.Auditor’s report on pages 25 to 27.
THE GROUP THE COMPANY
Notes 2017 2016 2017 2016Rs’000 Rs’000 Rs’000 Rs’000
ASSETS Non-current assetsProperty, plant and equipment 5 162,071 175,298 158,928 171,870 Investment properties 6 58,376 58,645 46,400 46,400 Intangible assets 7 1,145 1,628 1,041 1,453 Investments in subsidiary companies 8 - - 10,030 10,030 Investments in associates 9 22,161 21,566 16,193 16,193 Investments in joint ventures 9A - - - - Investments in financial assets 10 11,844 9,882 11,844 9,882 Non-current receivables 11 334,919 334,919 339,919 373,730
590,516 601,938 584,355 629,558
Current assetsInventories 12 324,360 164,909 142,741 84,115 Trade and other receivables 13 463,178 335,230 322,252 223,255 Short term loans 14 8,943 9,943 8,943 9,943 Cash and cash equivalents 32(b) 54,653 85,195 23,403 60,396
851,134 595,277 497,339 377,709
TOTAL ASSETS 1,441,650 1,197,215 1,081,694 1,007,267
EQUITY AND LIABILITIESCapital and reservesShare capital 15 220,064 220,064 220,064 220,064 Revaluation and other reserves 101,050 101,646 112,619 115,360 Retained earnings 475,330 491,784 379,523 390,221 Owners’ interest 796,444 813,494 712,206 725,645
Non-current liabilitiesBorrowings 17 399 547 - - Deferred tax liabilities 18 25,901 27,275 26,422 27,610 Retirement benefit obligations 19 20,093 13,811 16,946 11,404
46,393 41,633 43,368 39,014
Current liabilitiesTrade and other payables 20 506,607 301,133 236,948 214,860 Current tax liabilities 21(a) 1,362 11,809 2,692 4,232 Borrowings 17 73,239 13,741 68,875 8,111 Dividends 22 17,605 15,405 17,605 15,405
598,813 342,088 326,120 242,608
TOTAL LIABILITIES 645,206 383,721 369,488 281,622
TOTAL EQUITY & LIABILITIES 1,441,650 1,197,215 1,081,694 1,007,267
These financial statements have been approved for issue by the Board of Directors on 21 March 2018
THE MAURITIUS CHEMICAL AND FERTILIZER INDUSTRY LIMITED 30
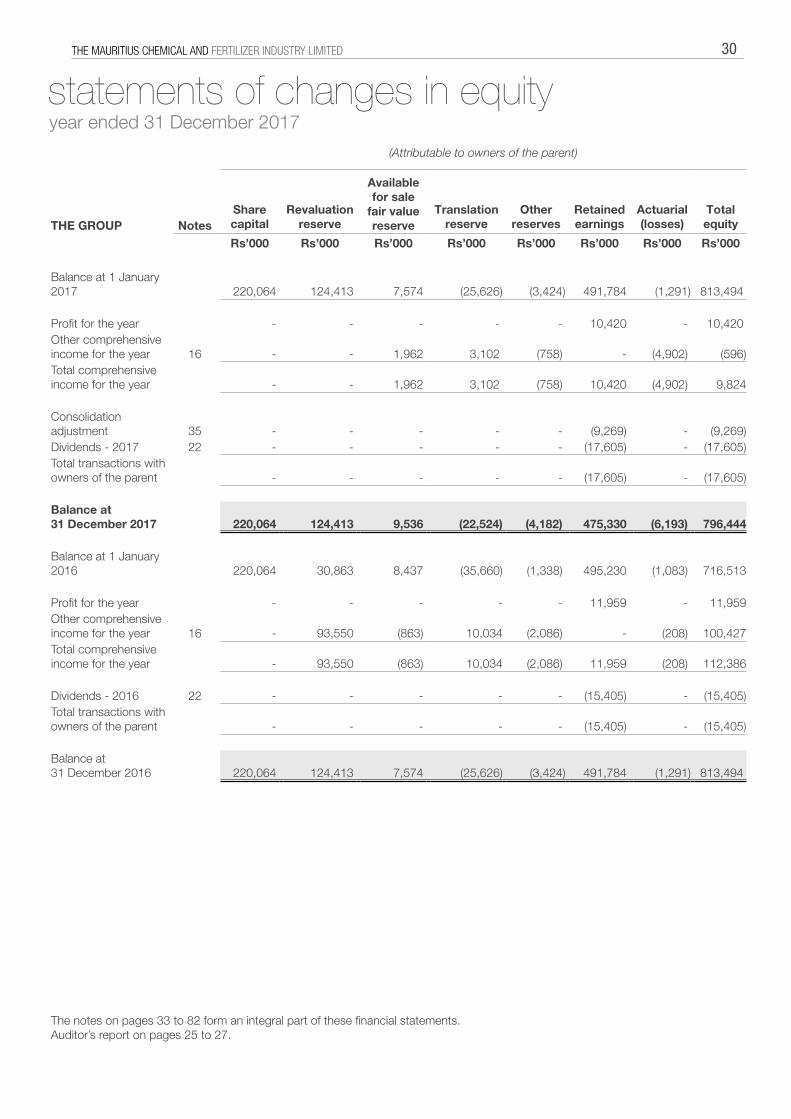
(Attributable to owners of the parent)
Availablefor sale
fair valuereserve
Share capital
Revaluationreserve
Translationreserve
Otherreserves
Retainedearnings
Actuarial(losses)
Total equityTHE GROUP Notes
Rs’000 Rs’000 Rs’000 Rs’000 Rs’000 Rs’000 Rs’000 Rs’000
Balance at 1 January 2017 220,064 124,413 7,574 (25,626) (3,424) 491,784 (1,291)
813,494
Profit for the year - - - - - 10,420 - 10,420 Other comprehensive income for the year 16 - - 1,962 3,102 (758) - (4,902) (596)Total comprehensive income for the year - - 1,962 3,102 (758) 10,420 (4,902) 9,824
Consolidation adjustment 35 - - - - - (9,269) - (9,269)Dividends - 2017 22 - - - - - (17,605) - (17,605)Total transactions with owners of the parent - - - - - (17,605) - (17,605)
Balance at 31 December 2017 220,064 124,413 9,536 (22,524) (4,182) 475,330 (6,193) 796,444
Balance at 1 January 2016 220,064 30,863 8,437 (35,660) (1,338) 495,230 (1,083) 716,513
Profit for the year - - - - - 11,959 - 11,959 Other comprehensive income for the year 16 - 93,550 (863) 10,034 (2,086) - (208) 100,427 Total comprehensive income for the year - 93,550 (863) 10,034 (2,086) 11,959 (208) 112,386
Dividends - 2016 22 - - - - - (15,405) - (15,405)Total transactions with owners of the parent - - - - - (15,405) - (15,405)
Balance at 31 December 2016 220,064 124,413 7,574 (25,626) (3,424) 491,784 (1,291)
813,494
The notes on pages 33 to 82 form an integral part of these financial statements.Auditor’s report on pages 25 to 27.
statements of changes in equityyear ended 31 December 2017
ANNUAL REPORT 2017 31
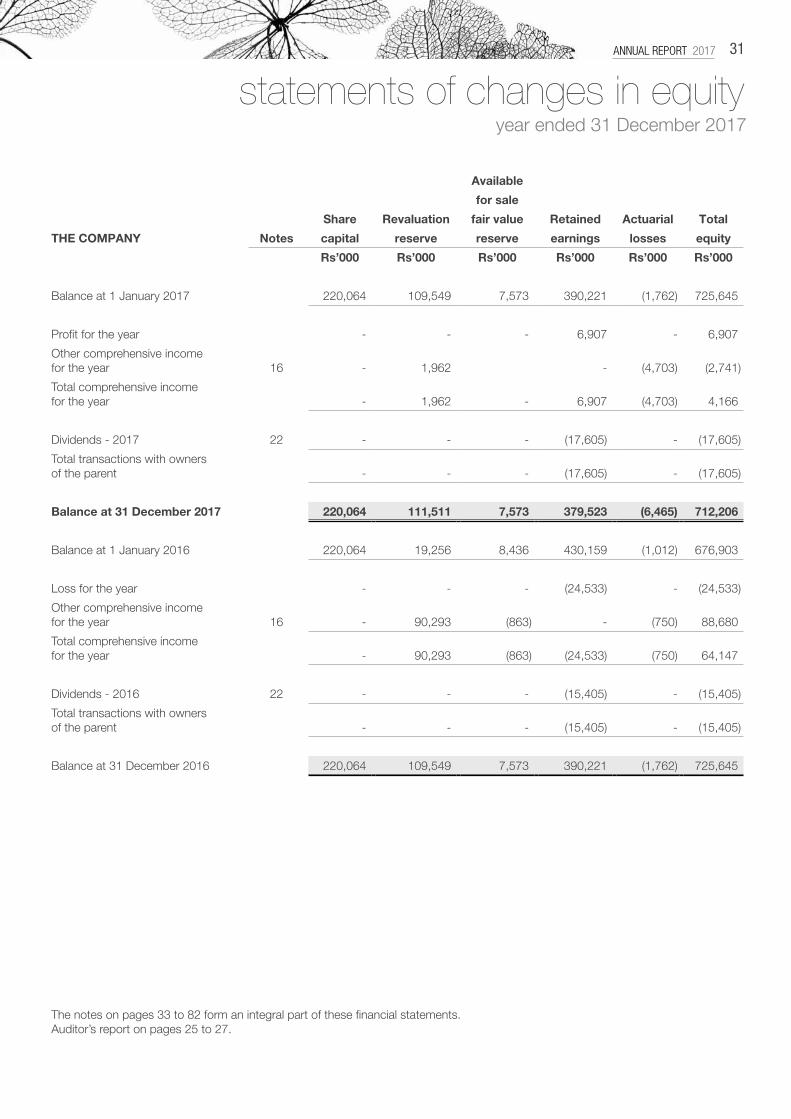
statements of changes in equityyear ended 31 December 2017
Available
for sale
Share Revaluation fair value Retained Actuarial Total
THE COMPANY Notes capital reserve reserve earnings losses equity
Rs’000 Rs’000 Rs’000 Rs’000 Rs’000 Rs’000
Balance at 1 January 2017 220,064 109,549 7,573 390,221 (1,762) 725,645
Profit for the year - - - 6,907 - 6,907
Other comprehensive income for the year 16 - 1,962 - (4,703) (2,741)
Total comprehensive income for the year - 1,962 - 6,907 (4,703) 4,166
Dividends - 2017 22 - - - (17,605) - (17,605)
Total transactions with owners of the parent - - - (17,605) - (17,605)
Balance at 31 December 2017 220,064 111,511 7,573 379,523 (6,465) 712,206
Balance at 1 January 2016 220,064 19,256 8,436 430,159 (1,012) 676,903
Loss for the year - - - (24,533) - (24,533)
Other comprehensive income for the year 16 - 90,293 (863) - (750) 88,680
Total comprehensive income for the year - 90,293 (863) (24,533) (750) 64,147
Dividends - 2016 22 - - - (15,405) - (15,405)
Total transactions with owners of the parent - - - (15,405) - (15,405)
Balance at 31 December 2016 220,064 109,549 7,573 390,221 (1,762) 725,645
The notes on pages 33 to 82 form an integral part of these financial statements.Auditor’s report on pages 25 to 27.
THE MAURITIUS CHEMICAL AND FERTILIZER INDUSTRY LIMITED 32
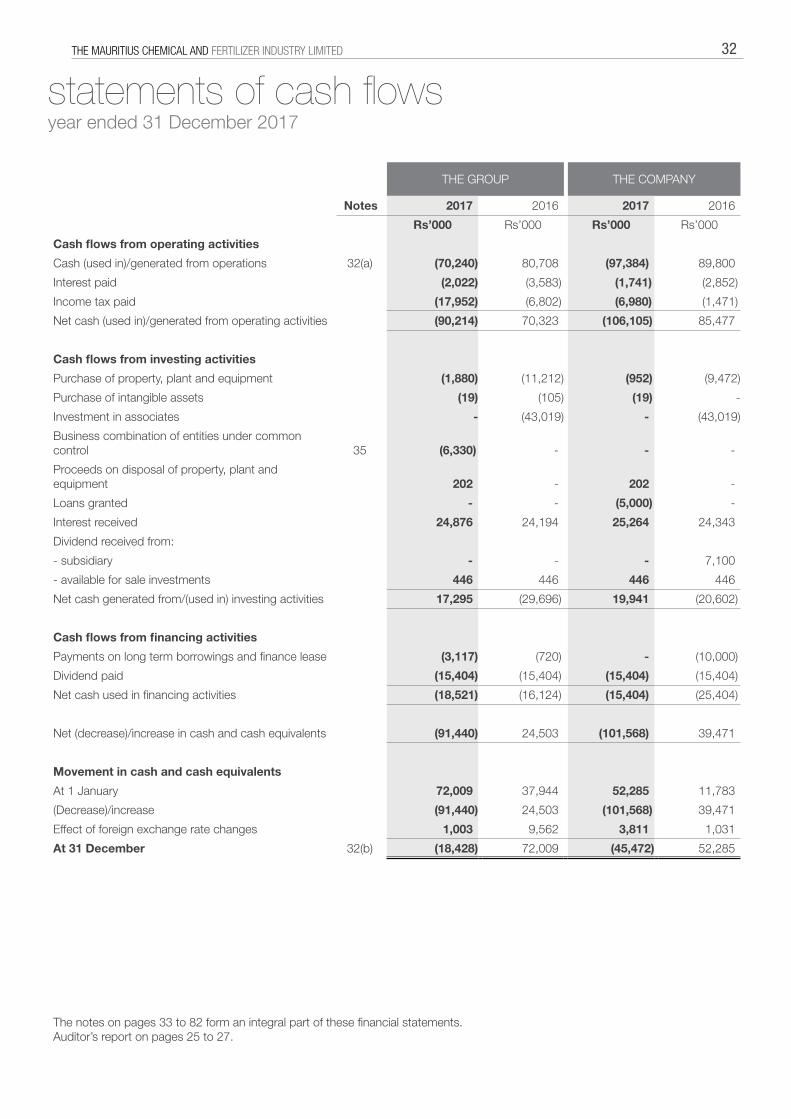
statements of cash flowsyear ended 31 December 2017
THE GROUP THE COMPANY
Notes 2017 2016 2017 2016
Rs’000 Rs’000 Rs’000 Rs’000
Cash flows from operating activities
Cash (used in)/generated from operations 32(a) (70,240) 80,708 (97,384) 89,800
Interest paid (2,022) (3,583) (1,741) (2,852)
Income tax paid (17,952) (6,802) (6,980) (1,471)
Net cash (used in)/generated from operating activities (90,214) 70,323 (106,105) 85,477
Cash flows from investing activities
Purchase of property, plant and equipment (1,880) (11,212) (952) (9,472)
Purchase of intangible assets (19) (105) (19) -
Investment in associates - (43,019) - (43,019)
Business combination of entities under common control 35 (6,330) - - -
Proceeds on disposal of property, plant and equipment 202 - 202 -
Loans granted - - (5,000) -
Interest received 24,876 24,194 25,264 24,343
Dividend received from:
- subsidiary - - - 7,100
- available for sale investments 446 446 446 446
Net cash generated from/(used in) investing activities 17,295 (29,696) 19,941 (20,602)
Cash flows from financing activities
Payments on long term borrowings and finance lease (3,117) (720) - (10,000)
Dividend paid (15,404) (15,404) (15,404) (15,404)
Net cash used in financing activities (18,521) (16,124) (15,404) (25,404)
Net (decrease)/increase in cash and cash equivalents (91,440) 24,503 (101,568) 39,471
Movement in cash and cash equivalents
At 1 January 72,009 37,944 52,285 11,783
(Decrease)/increase (91,440) 24,503 (101,568) 39,471
Effect of foreign exchange rate changes 1,003 9,562 3,811 1,031
At 31 December 32(b) (18,428) 72,009 (45,472) 52,285
The notes on pages 33 to 82 form an integral part of these financial statements.Auditor’s report on pages 25 to 27.
ANNUAL REPORT 2017 33
notes to the financial statementsyear ended 31 December 2017
1. GENERAL INFORMATION The Mauritius Chemical and Fertilizer Industry Limited is a public company incorporated in Mauritius and listed on the Stock Exchange of Mauritius. Its registered office is situated at 18, Edith Cavell Street, Port Louis, Mauritius. Its main activity consists of manufacturing of NPK complex, blending and trading of fertilizers. The Directors consider Harel Mallac & Co. Ltd, incorporated in the Republic of Mauritius as the holding company and Société Pronema, an entity registered in the Republic of Mauritius as the ultimate parent entity. These financial statements will be submitted for consideration and approval at the forthcoming Annual Meeting of Shareholders of the Company. 2. SIGNIFICANT ACCOUNTING POLICIES The principal accounting policies adopted in the preparation of these financial statements are set out below. These policies have been consistently applied to all the years presented, unless otherwise stated. 2.1 Basis of preparation The financial statements of The Mauritius Chemical and Fertilizer Industry Limited comply with the Companies Act 2001 and have been prepared in accordance with International Financial Reporting Standards (IFRS). The financial statements include the consolidated financial statements of the parent company and its subsidiaries (the “Group”) and the separate financial statements of the parent company (the “Company”). The financial statements are presented in Mauritian Rupees and all values are rounded to the nearest thousand (Rs’000), except where otherwise indicated. Where necessary, comparative figures have been amended to conform with change in presentation in the current year. The financial statements are prepared under the historical cost convention, except that: (i) Relevant financial assets and liabilities are stated at amortised cost; (ii) Investments in financial assets are stated at their fair value; (iii) Buildings are carried at revalued amounts; (iv) Investment properties are stated at fair value. Amendments to published Standards effective in the reporting period Recognition of Deferred Tax Assets for Unrealised Losses (Amendments to IAS 12). The amendments clarify the accounting for deferred tax where an asset is measured at fair value and that fair value is below the asset’s tax base. The amendment has no impact on the Group’s financial statements. Disclosure Initiative (Amendments to IAS 7). The amendments require the entity to explain changes in its liabilities arising from financing activities. This includes changes arising from cash flows (eg drawdowns and repayments of borrowings) and non-cash changes such as acquisitions, disposals, accretion of interest and unrealised exchange differences. A reconciliation of the opening and closing carrying amounts for each item for which cash flows have been or would be classified as financial activities is presented in note 32(d). Annual Improvements to IFRSs 2014-2016 Cycle IFRS 12 Disclosure of Interests in Other Entities. The amendments clarify that entities are not exempt from all of the disclosure requirements in IFRS 12 when entities have been classified as held for sale or as discontinued operations. The amendment has no impact on the Group’s financial statements. Standards, Amendments to published Standards and Interpretations issued but not yet effective Certain standards, amendments to published standards and interpretations have been issued that are mandatory for accounting periods beginning on or after January 1, 2018 or later periods, but which the Group has not early adopted. At the reporting date of these financial statements, the following were in issue but not yet effective: IFRS 9 Financial Instruments IFRS 15 Revenue from Contracts with Customers Sale or Contribution of Assets between an Investor and its Associate or Joint Venture (Amendments to IFRS 10 and IAS 28)
THE MAURITIUS CHEMICAL AND FERTILIZER INDUSTRY LIMITED 34
IFRS 16 Leases Clarifications to IFRS 15 Revenue from Contracts with Customers Classification and Measurement of Share-based Payment Transactions (Amendments to IFRS 2) Applying IFRS 9 Financial Instruments with IFRS 4 Insurance Contracts (Amendments to IFRS 4) Annual Improvements to IFRSs 2014-2016 Cycle IFRIC 22 Foreign Currency Transactions and Advance Consideration Transfers of Investment Property (Amendments to IAS 40) IFRS 17 Insurance Contracts IFRIC 23 Uncertainty over Income Tax Treatments Prepayment Features with negative compensation (Amendments to IFRS 9) Long-term Interests in Associates and Joint Ventures (Amendments to IAS 28)
Annual Improvements to IFRSs 2015-2017 Cycle Where relevant, the Group is still evaluating the effect of these Standards, Amendments to published Standards and Interpretations issued but not yet effective, on the presentation of its financial statements. The preparation of financial statements in conformity with IFRS requires the use of certain critical accounting estimates. It also requires management to exercise its judgement in the process of applying the Group’s accounting policies. The areas involving a higher degree of judgement or complexity, or areas where assumptions and estimates are significant to the financial statements, are disclosed in Note 4. 2.2 Investments in subsidiaries (a) Separate financial statements of the investor
In the separate financial statements of the investor, investments in subsidiary companies are carried at cost. The carrying amount is reduced to recognise any impairment in the value of individual investments. (b) Consolidated financial statements
Subsidiaries are all entities (including structured entities) over which the Group has control. The Group controls an entity when the Group is exposed to, or has rights to, variable returns from its involvement with the entity and has the ability to affect those returns through its power over the entity.
notes to the financial statementsyear ended 31 December 20172. SIGNIFICANT ACCOUNTING POLICIES (CONT’D)
(a) Basis of preparation (cont’d)
Standards, Amendments to published Standards and Interpretations issued but not yet effective (cont’d)
Subsidiaries are fully consolidated from the date on which control is transferred to the Group. They are de-consolidated from the date that control ceases. The acquisition method of accounting is used to account for business combinations by the Group. The consideration transferred for the acquisition of a subsidiary is the fair values of the assets transferred, the liabilities incurred and the equity interests issued by the Group. The consideration transferred includes the fair value of any assets or liability resulting from a contingent consideration arrangement. Acquisition-related costs are expensed as incurred. Identifiable assets acquired and liabilities and contingent liabilities assumed in a business combination are measured initially at their fair values at the acquisition date. On an acquisition-by-acquisition basis, the Group recognises any non-controlling interests in the acquiree at the non-controlling interest’s proportionate share of the acquiree’s net assets.
The excess of the consideration transferred, the amount of any non-controlling interests in the acquiree and the acquisition-date fair value of any previous equity interest in the acquiree (if any), over the fair value of identifiable net assets acquired is recorded as goodwill. If this is less than the fair value of the net assets of the subsidiary acquired in the case of a bargain purchase, the difference is recognised directly in profit or loss as a bargain purchase gain. Inter-company transactions, balances and unrealised gains on transactions between group companies are eliminated. Unrealised losses are also eliminated. Accounting policies of subsidiaries have been changed where necessary to ensure consistency with the policies adopted by the Group. (i) Business combination under common control
A business combination involving entities or businesses in which all of the combining entities or businesses are ultimately controlled by the same party or parties both before and after the business combination is considered as business combination under common control.
ANNUAL REPORT 2017 35
notes to the financial statementsyear ended 31 December 2017
2. SIGNIFICANT ACCOUNTING POLICIES (CONT’D)
2.2 Investments in subsidiaries (cont’d)
(b) Consolidated financial statements (cont’d)
In case of any acquisition which meet the criteria of business combination under common control the assets and liabilities are recorded at their previous carrying values and the difference between the purchase consideration and share of net assets transferred are accounted for as an adjustment to equity as common control. (ii) Transactions and non-controlling interests
The Group treats transactions with non-controlling interests as transactions with equity owners of the Group. For purchases from non-controlling interests, the difference between any consideration paid and the relevant share acquired of the carrying value of net assets of the subsidiary is recorded in equity. Gains or losses on disposals to non-controlling interests are also recorded in equity. (iii) Disposal of subsidiaries
When the Group ceases to have control or significant influence, any retained interest in the entity is remeasured to its fair value, with the change in carrying amount recognised in profit or loss. The fair value is the initial carrying amount for the purposes of subsequently accounting for the retained interest as an associate, joint venture or financial asset. In addition, any amounts previously recognised in other comprehensive income in respect of that entity are accounted for as if the Group had directly disposed of the related assets or liabilities. This may mean that amounts previously recognised in other comprehensive income are reclassified to profit or loss. 2.3 Investments in associates (a) Separate financial statements of the investor
In the separate financial statements of the investor, investments in associated companies are carried at cost. The carrying amount is reduced to recognise any impairment in the value of individual investments. (b) Consolidated financial statements
An associate is an entity over which the Group has significant influence but not control, or joint control, generally accompanying a shareholding between 20% and 50% of the voting rights. Investments in associates are accounted for using the equity method. Investments in associates are initially recognised at cost as adjusted by post acquisition changes in the Group’s share of the net assets of the associate less any impairment in the value of individual investments. Any excess of the cost of acquisition and the Group’s share of the net fair value of the associate’s identifiable assets and liabilities recognised at the date of acquisition is recognised as goodwill, which is included in the carrying amount of the investment. Any excess of the Group’s share of the net fair value of identifiable assets and liabilities over the cost of acquisition, after assessment, is included as income in the determination of the Group’s share of the associate’s profit or loss. When the Group’s share of losses exceeds its interest in an associate, the Group discontinues recognising further losses, unless it has incurred legal or constructive obligation or made payments on behalf of the associate. Unrealised profits and losses are eliminated to the extent of the Group’s interest in the associate. Unrealised losses are also eliminated unless the transaction provides evidence of an impairment of the asset transferred. Where necessary, appropriate adjustments are made to the financial statements of associates to bring the accounting policies used in line with those adopted by the Group. If the ownership interest in an associate is reduced but significant influence is retained, only a proportionate share of the amounts previously recognised in other comprehensive income are reclassified to profit or loss where appropriate. Dilution gains and losses arising in investments in associates are recognised in profit or loss. 2.4 Investments in joint ventures A joint venture is a joint arrangement whereby the parties that have joint control of the arrangement have rights to the net assets of the
THE MAURITIUS CHEMICAL AND FERTILIZER INDUSTRY LIMITED 36
joint arrangement. Joint control is the contractually agreed sharing of control of an arrangement, which exists only when decisions about the relevant activities require unanimous consent of the parties sharing control. Joint ventures are accounted for using the equity method (refer to note 2.3).
notes to the financial statementsyear ended 31 December 2017
2. SIGNIFICANT ACCOUNTING POLICIES (CONT’D)
2.4 Investments in joint ventures (cont’d)
2.5 Property, plant and equipment All property, plant and equipment are initially recorded at historical cost. Buildings are subsequently stated at fair value, based on periodic, but at least triennial valuations, by external independent valuers, less subsequent depreciation. Any accumulated depreciation at the date of revaluation is eliminated against the gross carrying amount of the asset and the net amount is restated to the revalued amount of the asset. All other property, plant and equipment are stated at historical cost less depreciation. Historical cost includes expenditure that is directly attributable to the acquisition of the items. Subsequent costs are included in the assets carrying amount or recognised as a separate asset as appropriate, only when it is probable that future economic benefits associated with the item will flow to the Group and the cost of the item can be measured reliably. Increases in the carrying amount arising on revaluation are credited to other comprehensive income and shown as revaluation reserve in shareholders’ equity. Decreases that offset previous increases of the same asset are charged against the revaluation surplus directly in equity; all other decreases are charged to profit or loss. Depreciation is calculated on a straight line method to write off the cost of each asset, to their residual values over their estimated useful lives, as follows:
The assets’ residual values and useful lives are reviewed, and adjusted if appropriate, at the end of each reporting period. Where the carrying amount of an asset is greater than its estimated recoverable amount, it is written down immediately to its recoverable amount. Gains and losses on disposal of property, plant and equipment are determined by reference to their carrying amount and are taken into account in determining operating profit. On disposal of revalued assets, amounts in revaluation and other reserves relating to those assets are transferred to retained earnings. 2.6 Investment Properties Investment properties, held to earn rentals and not occupied by the Group are measured initially at cost, including transaction costs. Subsequent to initial recognition investment properties are carried at fair value, representing open-market value determined annually by external valuers. Changes in fair values are included in profit or loss as part of other income. Property that is under construction or development to earn rentals or for capital appreciation or both is accounted as investment property. When the use of a property changes such that it is reclassified as property, plant and equipment, its fair value at the date of reclassification becomes its cost for subsequent accounting.
2.7 Inventories Inventories are stated at the lower of cost and net realisable value. Cost is determined on a weighted average basis. The cost of finished goods and work in progress comprises purchase cost of raw materials, direct labour, other direct costs and related production overheads (based on normal operating capacity). Net realisable value is the estimated selling price in the ordinary course of business, less the costs of completion and applicable variable selling expenses.
Years
Buildings 30 - 40
Plant and Machinery 5 - 25
Furniture, Fittings and Office Equipment 3 - 10
Forklifts and payloaders 5
Motor Vehicles 5
ANNUAL REPORT 2017 37
notes to the financial statementsyear ended 31 December 2017
2. SIGNIFICANT ACCOUNTING POLICIES (CONT’D)
2.8 Foreign currencies (a) Functional and presentation currency
Items included in the financial statements are measured using Mauritian rupees, the currency of the primary economic environment in which the entity operates (“functional currency”). The consolidated financial statements are presented in Mauritian rupees, which is the Company’s functional and presentation currency. (b) Transactions and balances
Foreign currency transactions are translated into the functional currency using the exchange rates prevailing on the dates of the transactions. Foreign exchange gains and losses resulting from the settlement of such transactions and from the translation at period-end exchange rates of monetary assets and liabilities denominated in foreign currencies are recognised in profit or loss. Foreign exchange gains and losses that relate to borrowings and cash and cash equivalents are presented in profit or loss within ‘Net finance income’. Foreign exchange gain and losses that relate to purchases and trade payables are presented in profit or loss within ‘Cost of sales’. All other foreign exchange gains and losses are presented in profit or loss within ‘Other income’. Non-monetary items, that are measured at historical cost in a foreign currency, are translated using the exchange rate at the date of the transaction. Non-monetary items, that are measured at fair value in a foreign currency, are translated using the exchange rates at the date the fair value was determined. Translation differences on non-monetary items, such as equities classified as available-for-sale financial assets, are included in the fair value reserve in equity.
(c) Group companies
The results and financial position of all the Group entities (none of which has the currency of a hyperinflationary economy) that have a functional currency different from the presentation currency are translated into the presentation currency as follows: (i) assets and liabilities for each statement of financial position presented are translated at the closing rate at the date of that statement of financial position; (ii) income and expenses for each statement representing profit or loss and other comprehensive income are translated at average exchange rates (unless this average is not a reasonable approximation of the cumulative effect of the rates prevailing on the transaction dates, in which case income and expenses are translated at the dates of the transactions); and
(iii) all resulting exchange differences are recognised in other comprehensive income. On consolidation, exchange differences arising from the translation of the net investment in foreign entities, and of borrowings are taken to shareholders’ equity. When a foreign operation is sold, such exchange differences are recognised in profit or loss as part of the gain or loss on sale. Goodwill and fair value adjustments arising on the acquisition of a foreign entity are treated as assets and liabilities of the foreign entity and translated at the closing rate.
2.9 Current and deferred income tax The tax expense for the period comprise of current and deferred tax. Tax is recognised in profit or loss, except to the extent that it relates to items recognised in other comprehensive income or directly in equity. (a) Current tax
The current tax charge is based on taxable income for the year calculated on the basis of tax laws enacted or substantively enacted by the end of the reporting period.
THE MAURITIUS CHEMICAL AND FERTILIZER INDUSTRY LIMITED 38
notes to the financial statementsyear ended 31 December 2017
2. SIGNIFICANT ACCOUNTING POLICIES (CONT’D)
2.9 Current and deferred income tax (cont’d)
(b) Deferred tax
Deferred income tax is provided in full, using the liability method, for all temporary differences arising between the tax bases of assets and liabilities and their carrying amounts in the financial statements. However, if the deferred income tax arises from initial recognition of an asset or liability in a transaction, other than a business combination, that at the time of the transaction affects neither accounting nor taxable profit or loss, it is not accounted for.
Deferred income tax is determined using tax rates that have been enacted or substantively enacted at the reporting date and are expected to apply in the period when the related deferred income tax asset is realised or the deferred income tax liability is settled. Deferred tax assets are recognised to the extent that it is probable that future taxable profits will be available against which deductible temporary differences can be utilised.
For the purposes of measuring deferred tax liabilities and deferred tax assets for investment properties that are measured using the fair value model, the carrying amounts of such properties are presumed to be recovered entirely through sale, unless the presumption is rebutted. The presumption is rebutted when the investment property is depreciable and is held within a business model whose objective is to consume substantially all of the economic benefits embodies in the investment property over time, rather than through sale. 2.10 Intangible assets (a) Goodwill
Goodwill arising on an acquisition of a business is carried at cost as established at the date of acquisition of the business (see note 2.2) less accumulated impairment losses, if any.
Goodwill is tested annually for impairment. Goodwill is allocated to cash-generating units for the purpose of impairment testing. On disposal of a subsidiary, the attributable amount of goodwill is included in the determination of the gains and losses on disposal. (b) Licences
Licences are shown at historical cost, have a finite useful life and are carried at cost less accumulated amortisation. Amortisation is calculated using the straight line method over their estimated useful lives (3 years). (c) Computer Software
Acquired computer software licences are capitalised on the basis of costs incurred to acquire and bring to use the specific software and are amortised using the straight line method over their extimated useful lives (3-5 years). Costs associated with developing or maintaining computer software are recognised as an expense as incurred. Costs that are directly associated with the production of identifiable and unique software controlled by the Company and that will generate economic benefits exceeding costs beyond one year, are recognised as intangible assets. Direct costs include the software development employee costs and an appropriate portion of relevant overheads. 2.11 Retirement benefit obligations (a) Defined contribution plans
A defined contribution plan is a pension plan under which the Group pays fixed contributions into a separate entity. The Group has no legal or constructive obligations to pay further contributions if the fund does not hold sufficient assets to pay all employees the benefits relating to employee service in the current and prior periods. Payments to defined contribution retirement plans are charged when employees have rendered service that entitle them to the contributions.
ANNUAL REPORT 2017 39
notes to the financial statementsyear ended 31 December 2017
(b) Defined benefit plans
A defined benefit plan is a pension plan that is not a defined contribution plan. Typically defined benefit plans define an amount of pension benefit that an employee will receive on retirement, usually dependent on one or more factors such as age, years of service and compensation. The liability recognised in the statements of financial position in respect of defined benefit pension plans is the present value of the defined benefit obligation at the end of the reporting period less the fair value of plan assets. The defined benefit obligation is calculated annually by independent actuaries using the projected unit credit method.
Remeasurement of the net defined benefit liability, which comprise actuarial gains and losses arising from experience adjustments and changes in actuarial assumptions, the return on plan assets (excluding interest) and the effect of the asset ceiling (if any, excluding interest), is recognised immediately in other comprehensive income in the period in which they occur. Remeasurements recognised in other comprehensive income shall not be reclassified to profit or loss in subsequent period. The Group determines the net interest expense/(income) on the defined benefit liability/(asset) for the period by applying the discount rate used to measure the defined benefit obligation at the beginning of the annual period to the net defined benefit liability/(assets), taking into account any changes in the net defined liability/(asset) during the period as a result of contributions and benefit payments. Net interest expense/(income) is recognised in profit or loss. Service costs comprising current service cost, past service cost, as well as gains and losses on curtailments and settlements are recognised immediately in profit or loss. (c) Gratuity on retirement
For those employees who are not covered (or who are insufficiently covered) by the above pension plans, the net present value of gratuity on retirement payable under the Employment Rights Act 2008 is calculated by a qualified actuary and provided for. The obligations arising under this item are not funded. (d) Profit sharing and bonus plans
The Group recognises a liability and an expense for bonuses and profit sharing, based on a formula that takes into consideration the profit attributable to the Group’s shareholders after certain adjustments. The Group recognises a provision where contractually obliged or where there is a past practice that has created a constructive obligation. (e) Terminations benefits
Terminations benefits are payable when employment is terminated before the normal retirement date or whenever an employee accepts voluntary redundancy in exchange for these benefits. The Group recognises termination benefits when it is demonstrably committed to either: terminating the employment of current employees according to a detailed formal plan without possibility of withdrawal; or providing termination benefits as a result of an offer made to encourage voluntary redundancy. Benefits falling due more than 12 months after the end of the reporting period are discounted to present value. 2.12 Impairment of non-financial assets Assets that have an indefinite useful life are not subject to amortisation and are tested annually for impairment. Assets that are subject to amortisation are reviewed for impairment whenever events or changes in circumstances indicate that the carrying amount may not be recoverable. Any impairment loss is recognised for the amount by which the carrying amount of the asset exceeds its recoverable amount. The recoverable amount is the higher of an asset’s fair value less costs to sell and value in use. For the purposes of assessing impairment, assets are grouped at the lowest levels for which there are separately identifiable cash flows (cash-generating units).
2.13 Leases (a) Leases are classified as finance leases where the terms of the lease transfer substantially all the risks and rewards of ownership to the lessee. All other leases are classified as operating leases. Payments made under operating leases (net of any incentives received from the lessor) are charged to profit or loss on a straight-line basis over the period of the lease.
2. SIGNIFICANT ACCOUNTING POLICIES (CONT’D)
2.11 Retirement benefit obligations (cont’d)
THE MAURITIUS CHEMICAL AND FERTILIZER INDUSTRY LIMITED 40
(b) Accounting for lease - where the Company is the lessee Finance leases are capitalised at the lease’s inception at the lower of the fair value of the leased property and the present value of the minimum lease payments. Each lease payment is allocated between the liability and finance charges so as to achieve a constant rate of interest on the remaining balance of the liability. Finance charges are charged to profit or loss. 2.14 Financial assets (a) Categories of financial assets
The Group classifies its financial assets in the following categories: available-for-sale financial assets and loans and receivables. The classification depends on the purpose for which the investments were acquired. Management determines the classification of the financial assets at initial recognition.
(i) Available-for-sale financial assets
Available-for-sale financial assets are non-derivatives that are either designated in this category or not classified in any of the other categories. They are included in non-current assets unless management intends to dispose of the investment within twelve months of the end of the reporting period. (ii) Loans and receivables
Loans and receivables are non-derivative financial assets with fixed or determinable payments that are not quoted in an active market. They are recognised initially at fair value plus any directly attributable transaction costs. Subsequent to initial recognition, loans and receivables are measured at amortised cost less any impairment. They are included in current assets when maturity is within twelve months after the end of the reporting period or non-current assets for maturities greater than twelve months. The Group’s loans and receivables comprise cash and cash equivalents, non-current receivables and trade and other receivables. (b) Recognition and measurement
Purchases and sales of financial assets are recognised on trade-date (or settlement date), the date on which the Group commits to purchase or sell the asset. Investments are initially measured at fair value plus transaction costs. Available-for-sale financial assets are subsequently carried at their fair values. Loans and receivables are carried at amortised cost using the effective interest method. Investments in equity instruments that do not have a quoted market price in an active market and whose fair value cannot be reliably measured are measured at cost. Unrealised gains and losses arising from changes in the fair value of financial assets classified as available-for-sale are recognised in other comprehensive income.
When financial assets classified as available-for-sale are sold or impaired, the accumulated fair value adjustments are included in profit or loss as gains and losses on financial assets. The fair values of quoted investments are based on current bid prices. If the market for a financial asset is not active (and for unlisted securities), the Group establishes fair value by using valuation techniques. These include the use of recent arm’s length transactions, reference to other instruments that are substantially the same and discounted cash flows analysis. (c) Impairment of financial assets
(i) Financial assets classified as available-for-sale
The Group assesses at the end of each reporting period whether there is objective evidence that a financial asset or a group of financial assets is impaired. In the case of equity investments classified as available-for-sale, a significant or prolonged decline in the fair value of the security below its cost is considered in determining whether the securities are impaired. If any such evidence exists for available-for-sale financial assets, the cumulative loss, measured as the difference between acquisition cost and the current fair value, less any impairment loss on that financial asset previously recognised in profit or loss is removed from equity and recognised in profit or loss.
notes to the financial statementsyear ended 31 December 2017
2. SIGNIFICANT ACCOUNTING POLICIES (CONT’D)
2.13 Leases (cont’d)
ANNUAL REPORT 2017 41
notes to the financial statementsyear ended 31 December 2017
2. SIGNIFICANT ACCOUNTING POLICIES (CONT’D)
2.14 Financial assets (cont’d) (c) Impairment of financial assets (cont’d)
(i) Financial assets classified as available-for-sale ( cont’d)
If the fair value of a previously impaired debt security classified as available-for-sale increases and the increase can be objectively related to an event occuring after the impairment loss was recognised, the impairment loss is reversed and the reversal recognised in profit or loss. Impairment losses recognised in profit or loss for an investment in an equity instrument classified as available-for-sale are not reversed through profit or loss. (ii) Financial assets carried at amortised cost
For loans and receivables category, the amount of the loss is measured as the difference between the asset’s carrying amount and the present value of estimated future cash flows (excluding future credit losses that have not been incurred) discounted at the financial asset’s original effective interest rate. The carrying amount of the asset is reduced and the amount of the loss is recognised in profit or loss. If a loan or receivable has a variable interest rate, the discount rate for measuring any impairment loss is the current effective interest rate determined under the contract. If in a subsequent period, the amount of the impairment loss decreases and the decrease can be related objectively to an event occurring after the impairment was recognised (such as an improvement in the debtor’s credit rating), the previously recognised impairment loss is reversed through profit or loss to the extent that the carrying amount of the financial asset at the date the impairment is reversed does not exceed what the amortised cost would have been had the impairment not been recognised. 2.15 Long term receivables Long term receivables with fixed maturity terms are measured at amortised cost using the effective interest rate method, less provision for impairment. Long term receivables without fixed maturity terms are measured at cost. The carrying amount of the asset is reduced by the difference between the asset’s carrying amount and the present value of estimated cash flows discounted using the original effective interest rate. The amount of loss is recognised in profit or loss. If there is objective evidence that an impairment loss has been incurred, the amount of impairment loss is measured as the difference between the carrying amount of the asset and the present value (PV) of estimated cash flows discounted at the current market rate of return of similar financial assets.
2.16 Trade and other receivables Trade and other receivables are recognised initially at fair value and subsequently measured at amortised cost using the effective interest method, less provision for impairment. A provision for impairment of trade receivables is established when there is objective evidence that the Group will not be able to collect all amounts due according to the original terms of receivables. The amount of the provision is the difference between the asset’s carrying amount and the present value of estimated future cash flows. The amount of provision is recognised in profit or loss. 2.17 Borrowings Borrowings are recognised initially at fair value being the issue proceeds received, net of transaction costs incurred. Borrowings are subsequently stated at amortised cost; any difference between proceeds (net of transaction costs) and the redemption value is recognised in profit or loss over the period of the borrowings using the effective interest method. Borrowings are classified as current liabilities unless the Group has an unconditional right to defer settlement of the liability for at least twelve months after the end of the reporting period. 2.18 Cash and cash equivalents Cash and cash equivalents include cash in hand, other short-term highly liquid investments with original maturities of 3 months or less, and bank overdraft. Bank overdraft is shown within borrowings in current liabilities in the statements of financial position. 2.19 Trade and other payables Trade and other payables are stated at fair value and subsequently measured at amortised cost using the effective interest method.
THE MAURITIUS CHEMICAL AND FERTILIZER INDUSTRY LIMITED 42
notes to the financial statements2. SIGNIFICANT ACCOUNTING POLICIES (CONT’D)
2.20 Share capital Ordinary shares
Ordinary shares are classified as equity. Incremental costs directly attributable to the issue of new shares are shown in equity as deduction, net of tax, from proceeds. 2.21 Revenue recognition Revenue is measured at the fair value of the consideration received or receivable, and represents amounts receivable for goods supplied, stated net of discounts, returns, value added taxes, rebates and other similar allowances and after eliminating sales within the Group.
(a) Sales of goods
Sales of goods are recognised when the goods are delivered and titles have passed, at which time all of the following conditions are satisfied: (i) the Group has transferred to the buyer the significant risk and rewards of ownership of the goods; (ii) the Group retains neither continuing managerial involvement to the degree usually associated with ownership nor effective control over the goods sold; (iii) the amount of revenue can be measured reliably; (iv) it is probable that the economic benefits associated with the transaction will flow to the Group; and (v) the costs incurred or to be incurred in respect of the transaction can be measured reliably. (b) Rendering of services
Revenue from rendering of services are recognised in the accounting year in which the services are rendered (by reference to completion of the specific transaction assessed on the basis of the actual service provided as a proportion of total services to be provided). (c) Other revenues are recognised as follows:
- Rental income - on an accruals basis in accordance with the substance of the relevant agreements; - Interest income - on a time-proportion basis using the effective interest method; - Dividend income - when the shareholder’s right to receive payment is established. 2.22 Dividend distribution Dividend distribution to the Company’s shareholders is recognised as a liability in the Group’s financial statements in the period in which the dividends are declared. 2.23 Provisions Provisions are recognised when the Company has a present or constructive obligation as a result of past events; it is probable that an outflow of resources that can be reliably estimated will be required to settle the obligation. The amount recognised as a provision is the best estimate of the consideration required to settle the present obligation at the end of the reporting period, taking into account the risks and uncertainties surrounding the obligation. When a provision is measured using the cash flows estimated to settle the present obligation, its carrying amount is the present value of those cash flows (when the effect of the time value of money is material). 2.24 Segment reporting Segment information presented relate to operating segments that engage in business activities for which revenues are earned and expenses incurred. 2.25 Alternative Minimum Tax (AMT) Alternative Minimum Tax (AMT) is provided for, where a company which has a tax liability of less than 7.5% of its book profit pays a dividend. AMT is calculated as the lower of 10% of the dividend paid and 7.5% of book profit.
year ended 31 December 2017
ANNUAL REPORT 2017 43
notes to the financial statementsyear ended 31 December 2017
2. SIGNIFICANT ACCOUNTING POLICIES (CONT’D)
2.26 Related Parties Related Parties are considered to be related if one party has the ability to control the other party or exercise significant influence over the party making financial or operational decisions.
2.27 Derivative financial instruments The Group enters into derivative financial instruments to manage their exposure to foreign exchange rate risk, including foreign exchange forward contracts and cross currency swaps.
Derivatives are initially recognised at fair value at the date a derivative contract is entered into and are subsequently remeasured at their fair value at the end of each reporting period. The resulting gain or loss is recognised in profit or loss immediately unless the derivative is designated and effective as a hedging instrument, in which event the timing of the recognition in profit or loss depends on the nature of the hedge relationship. The Group designates derivatives as hedges of the fair value of recognised assets or liabilities or firm commitments (fair value hedges).
The Group documents, at the inception of the transaction, the relationship between hedging instruments and hedged items, as well as its risk management objectives and strategy for undestaking various hedging transactions. The Group also documents its assessment, both at hedge inception and on an ongoing basis, of whether the derivatives that are used in hedging transactions are highly effective in offsetting changes in fair values or cash flows of hedged items. A derivative with a positive fair value is recognised as a financial asset whereas a derivative with a negative fair fair value is recognised as a financial liability. A derivative presented as a non-current asset or a non-current liability if the remaining maturity of the instrument is more than 12 months and it is not expected to be realised or settled within twelve months. Other derivatives are presented as current assets or current liabilities. (a) Fair value hedges
Changes in the fair value of derivatives that are designated and qualify as fair value hedges are recorded in profit or loss, together with any changes in the fair value of the hedged asset or liability that are attributable at the hedged risk. The Group applies only fair value hedge accounting for hedging foreign exchange rate risks. The gain or loss relating to the effective portion of foreign exchange forward contracts and cross currency swaps is recognised in profit or loss within finance costs.
3. FINANCIAL RISK MANAGEMENT 3.1 Financial Risk Factors The Group’s activities expose it to a variety of financial risks: market risks (including currency risk, fair value interest risk, cash flow interest risk and price risk), credit risk and liquidity risk. The Group’s overall risk management programme focuses on the unpredictability of financial markets and seeks to minimise potential adverse effects on the Group’s financial performance. The Group uses derivative financial instruments to hedge certain risk exposure. A description of the significant risk factors is given below together with the risk management policies applicable. (a) Market risk (i) Currency risk
The Group operates internationally and is exposed to foreign exchange risk arising from various currency exposures primarily with respect to US Dollar, Zambian Kwacha and Euro. Foreign exchange risk arises from future commercial transactions and recognised assets and liabilities and net investments in foreign operations. Management has set up a policy to require the Group to manage its foreign exchange risk exposure. The Group uses forward contracts to hedge its exposure to foreign currency risk, when recorded liabilities are denominated in a currency that is not the entity’s functional currency. External foreign exchange contracts are designed as hedges of foreign exchange risk on specific liabilities. The Group has investment in foreign subsidiaries, whose net assets are exposed to currency translation risk. Currency exposure arising from the net assets of the Group’s foreign operations in Zambia and in Reunion Island
THE MAURITIUS CHEMICAL AND FERTILIZER INDUSTRY LIMITED 44
notes to the financial statements3. FINANCIAL RISK MANAGEMENT (CONT’D)
3.1 Financial Risk Factors (cont’d)
(a) Market risk (cont’d)
year ended 31 December 2017
Currency profile
The currency profile of the Group’s and the Company’s financial assets and liabilities is summarised below:
2017 2016Financial assets Financial liabilities Financial assets Financial liabilities
(a) THE GROUP Rs’000 Rs’000 Rs’000 Rs’000Mauritian rupee 428,935 130,241 561,214 66,686 US Dollar 200,335 315,758 41,448 187,293 Euro 115,085 84,142 98,429 44,321 Zambian Kwacha 128,955 52,775 80,611 23,399
873,310 582,916 781,702 321,699
(b) THE COMPANY
Mauritian rupee 527,363 127,741 582,616 66,780 US Dollar 72,721 113,166 10,547 149,242 Euro 106,094 68,044 85,577 13,229
706,178 308,951 678,740 229,251
The tables above exclude prepayments and accruals.
THE GROUP ANDTHE COMPANY
2017 2016Rs’000 Rs’000
Available-for-sale investments 592 494
At 31 December 2017, if the rupee has weakened/strengthened by 5% against the following currencies with all other variables held constant, post tax profit would have been as shown in the table, mainly as a result of foreign exchange gains/losses on translation of foreign currency denominated financial assets and liabilities.
2017 2016Financial assets Financial liabilities Financial assets Financial liabilities
(a) THE GROUP Rs’000 Rs’000 Rs’000 Rs’000+/- +/- +/- +/-
US Dollar 8,514 13,420 1,762 7,960 Euro 4,891 3,576 4,183 1,884 Zambian Kwacha 5,481 2,243 3,426 994
18,886 19,239 9,371 10,838
(b) THE COMPANYUS Dollar 3,091 4,810 448 6,343 Euro 4,509 2,892 3,637 562
7,600 7,702 4,085 6,905
(ii) Price risk The market prices of the Group’s available-for-sale quoted investment securities are susceptible to future fluctuations. To manage its price risk arising from investments in equity securities, the Group diversifies its portfolio. Sensitivity analysis
The impact of increases/(decreases) in the fair value of the investments on the Group’s equity, is summarised below based on the assumption that the fair value has increased/(decreased) by 5%.
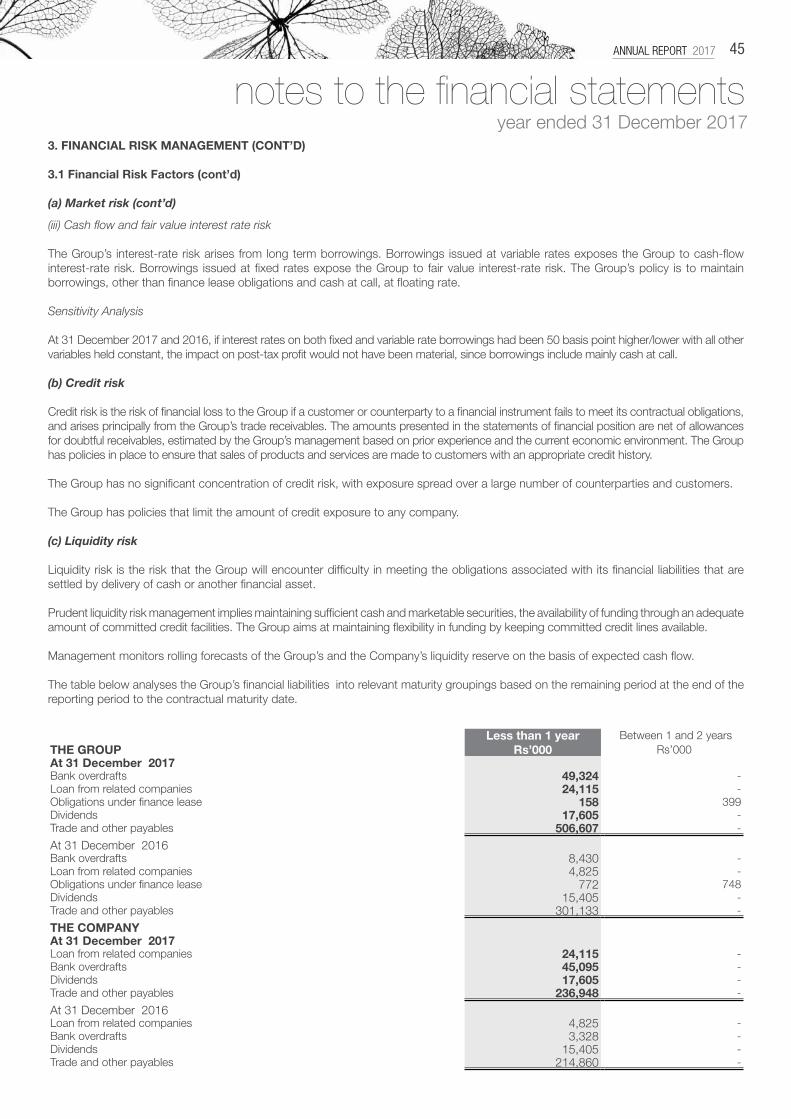
ANNUAL REPORT 2017 45
3. FINANCIAL RISK MANAGEMENT (CONT’D)
3.1 Financial Risk Factors (cont’d)
(a) Market risk (cont’d)
notes to the financial statementsyear ended 31 December 2017
(iii) Cash flow and fair value interest rate risk The Group’s interest-rate risk arises from long term borrowings. Borrowings issued at variable rates exposes the Group to cash-flow interest-rate risk. Borrowings issued at fixed rates expose the Group to fair value interest-rate risk. The Group’s policy is to maintain borrowings, other than finance lease obligations and cash at call, at floating rate. Sensitivity Analysis
At 31 December 2017 and 2016, if interest rates on both fixed and variable rate borrowings had been 50 basis point higher/lower with all other variables held constant, the impact on post-tax profit would not have been material, since borrowings include mainly cash at call.
(b) Credit risk Credit risk is the risk of financial loss to the Group if a customer or counterparty to a financial instrument fails to meet its contractual obligations, and arises principally from the Group’s trade receivables. The amounts presented in the statements of financial position are net of allowances for doubtful receivables, estimated by the Group’s management based on prior experience and the current economic environment. The Group has policies in place to ensure that sales of products and services are made to customers with an appropriate credit history. The Group has no significant concentration of credit risk, with exposure spread over a large number of counterparties and customers. The Group has policies that limit the amount of credit exposure to any company. (c) Liquidity risk Liquidity risk is the risk that the Group will encounter difficulty in meeting the obligations associated with its financial liabilities that are settled by delivery of cash or another financial asset. Prudent liquidity risk management implies maintaining sufficient cash and marketable securities, the availability of funding through an adequate amount of committed credit facilities. The Group aims at maintaining flexibility in funding by keeping committed credit lines available. Management monitors rolling forecasts of the Group’s and the Company’s liquidity reserve on the basis of expected cash flow. The table below analyses the Group’s financial liabilities into relevant maturity groupings based on the remaining period at the end of the reporting period to the contractual maturity date.
Less than 1 year Between 1 and 2 yearsTHE GROUP Rs’000 Rs’000At 31 December 2017Bank overdrafts 49,324 - Loan from related companies 24,115 - Obligations under finance lease 158 399 Dividends 17,605 - Trade and other payables 506,607 -
At 31 December 2016Bank overdrafts 8,430 - Loan from related companies 4,825 - Obligations under finance lease 772 748 Dividends 15,405 - Trade and other payables 301,133 -
THE COMPANYAt 31 December 2017Loan from related companies 24,115 - Bank overdrafts 45,095 - Dividends 17,605 - Trade and other payables 236,948 -
At 31 December 2016Loan from related companies 4,825 - Bank overdrafts 3,328 - Dividends 15,405 - Trade and other payables 214,860 -
THE MAURITIUS CHEMICAL AND FERTILIZER INDUSTRY LIMITED 46
notes to the financial statements3. FINANCIAL RISK MANAGEMENT (CONT’D)
year ended 31 December 2017
3.2 Capital Risk Management The Group’s objectives when managing capital are:
• to safeguard the Group’s ability to continue as a going concern, so that it can continue to provide returns for shareholders and benefits for other stakeholders, and • to provide an adequate return to shareholders by pricing products and services commensurately with the level of risk. The Group manages the capital structure and makes adjustments to it in the light of changes in economic conditions and the risk characteristics of the underlying assets. In order to maintain or adjust the capital structure, the Group may adjust the amount of dividends paid to shareholders, or sell assets to reduce debt. There were no changes in the Group’s approach to capital risk management during the year. 3.3 Fair value estimation The fair value of financial instruments traded in active markets is based on quoted market prices at the end of the reporting period. A market is regarded as active if quoted prices are readily and regularly available from an exchange, dealer, broker, industry group, pricing service, or regulatory agency, and those prices represent actual and regularly occurring market transactions on an arm’s length basis. The quoted market price used for financial assets held by the Group is the current bid price. These instruments are included in level 1. Instruments included in level 1 comprise primarily quoted equity investments classified as trading securities or available-for-sale. The fair value of financial instruments that are not traded in an active market is determined by using valuation techniques. These valuation techniques maximise the use of observable market data where it is available and rely as little as possible on specific estimates. If all significant inputs required to fair value an instrument are observable, the instrument is included in level 2. If one or more of the significant inputs is not based on observable market data, the instrument is included in level 3. Specific valuation techniques used to value financial instruments include: - Quoted market prices or dealer quotes for similar instruments. - The fair value of forward foreign exchange contracts is determined using forward exchange rates at the end of the reporting period, with the resulting value discounted back to present value. - Other techniques such as net asset value are used to determine fair value for the remaining financial instruments. The nominal value less estimated credit adjustments of trade receivables and payables are assumed to approximate their fair values. The fair value of financial liabilities for disclosure purposes is estimated by discounting the future contractual cashflows at the current market interest rate that is available to the group for similar instruments.
4. CRITICAL ACCOUNTING ESTIMATES AND JUDGEMENTS Estimates and judgements are continuously evaluated and are based on historical experience and other factors, including expectations of future events that are believed to be reasonable under the circumstances. 4.1 Critical accounting estimates and assumptions
The Group makes estimates and assumptions concerning the future. The resulting accounting estimates will, by definition, seldom equal the related actual results. The estimates and assumptions, that have a significant risk of causing a material adjustment to the carrying amounts of assets and liabilities within the next financial year, are discussed below.
(a) Impairment of available-for-sale financial assets
The Group follows the guidance of IAS 39 on determining when an investment is other- than-temporarily impaired. This determination requires significant judgement. In making this judgement, the Group evaluates, among other factors, the duration and extent to which
ANNUAL REPORT 2017 47
4. CRITICAL ACCOUNTING ESTIMATES AND JUDGEMENTS (CONT’D)
4.1 Critical accounting estimates and assumptions (cont’d)
(a) Impairment of available-for-sale financial assets (cont’d)
notes to the financial statementsyear ended 31 December 2017
The fair value of an investment is less than its cost, and the financial health of and near-term business outlook for the investee, including factors such as industry and sector performance and operational and financing cash flows.
(b) Pension benefits
The present value of the pension obligations depend on a number of factors that are determined on an actuarial basis using a number of assumptions. The assumptions used in determining the net cost for pensions include the discount rate. Any changes in these assumptions will impact the carrying amount of pension obligations. The Group determines the appropriate discount rate at the end of each year. This is the interest rate that should be used to determine the present value of estimated future cash outflows expected to be required to settle the pension obligations. In determining the appropriate discount rate, the Group considers the interest rates of long term government bonds that are denominated in the currency in which the benefits will be paid, and that have terms to maturity approximating the terms of the related pension obligation. Other key assumptions for pension obligations are based in part on current market conditions. Additional information is disclosed in Note 19. (c) Limitation of sensitivity analysis
Sensitivity analysis in respect of market risk demonstrates the effect of a change in a key assumption while other assumptions remain unchanged. In reality, there is a correlation between the assumptions and other factors. It should also be noted that these sensitivities are non-linear and larger or smaller impacts should not be interpolated or extrapolated from these results. Sensitivity analysis does not take into consideration that the Group’s assets and liabilities are managed. Other limitations include the use of hypothetical market movements to demonstrate potential risk that only represent the Group’s view of possible near-term market changes that cannot be predicted with any certainty.
(d) Asset lives and residual values
Property, plant and equipment are depreciated over its useful life taking into account residual values, where appropriate. The actual lives of the assets and residual values are assessed annually and may vary depending on a number of factors. In reassessing asset lives, factors such as technological innovation and maintenance programmes are taken into account. Residual value assessments consider issues such as future market conditions, the remaining life of the asset and projected disposal values. Consideration is also given to the extent of current profits and losses on the disposal of similar assets.
(e) Depreciation policies
Property, plant and equipments are depreciated to their residual values over their estimated useful lives. The residual value of an asset is the estimated net amount that the Group would currently obtain from disposal of the asset, if the asset were already of the age and in condition expected at the end of its useful life. The Directors therefore make estimates based on historical experience and use best judgement to assess the useful lives of assets at the end of their expected useful lives. (f) Revenue recognition
The surface area completion method is utilised to recognise revenue on contracts. Management exercises judgement in assessing whether significant risks and rewards have been transferred to the customer to permit revenue to be recognised. (g) Revaluation of property, plant and equipment and investment properties The Group carries its investment properties at fair value, with changes in fair value being recognised in profit or loss. In addition, it measures buildings at revalued amounts with changes in fair value being recognised in other comprehensive income. In preparing these financial statements, the Directors have obtained from independent professional valuers the estimated fair value of the Group’s buildings which is disclosed in the notes to the financial statements. The fair value estimates have been based on the market data regarding current yield on similar properties. The actual amounts of revaluation could therefore differ significantly from the estimates in the future. Investment property is valued on an open market basis by the valuer.
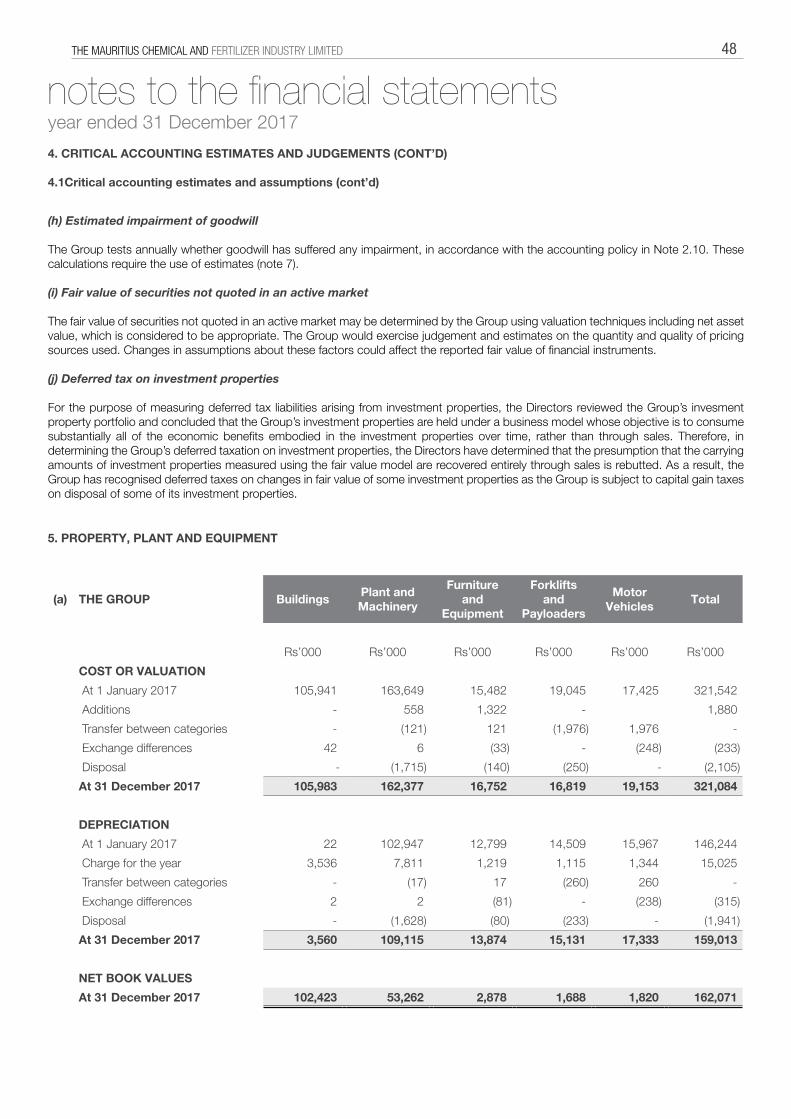
THE MAURITIUS CHEMICAL AND FERTILIZER INDUSTRY LIMITED 48
(h) Estimated impairment of goodwill
The Group tests annually whether goodwill has suffered any impairment, in accordance with the accounting policy in Note 2.10. These calculations require the use of estimates (note 7). (i) Fair value of securities not quoted in an active market
The fair value of securities not quoted in an active market may be determined by the Group using valuation techniques including net asset value, which is considered to be appropriate. The Group would exercise judgement and estimates on the quantity and quality of pricing sources used. Changes in assumptions about these factors could affect the reported fair value of financial instruments. (j) Deferred tax on investment properties
For the purpose of measuring deferred tax liabilities arising from investment properties, the Directors reviewed the Group’s invesment property portfolio and concluded that the Group’s investment properties are held under a business model whose objective is to consume substantially all of the economic benefits embodied in the investment properties over time, rather than through sales. Therefore, in determining the Group’s deferred taxation on investment properties, the Directors have determined that the presumption that the carrying amounts of investment properties measured using the fair value model are recovered entirely through sales is rebutted. As a result, the Group has recognised deferred taxes on changes in fair value of some investment properties as the Group is subject to capital gain taxes on disposal of some of its investment properties.
4. CRITICAL ACCOUNTING ESTIMATES AND JUDGEMENTS (CONT’D)
4.1Critical accounting estimates and assumptions (cont’d)
(a) THE GROUP BuildingsPlant andMachinery
Furniture and
Equipment
Forklifts and
Payloaders
Motor Vehicles
Total
Rs’000 Rs’000 Rs’000 Rs’000 Rs’000 Rs’000
COST OR VALUATION
At 1 January 2017 105,941 163,649 15,482 19,045 17,425 321,542
Additions - 558 1,322 - 1,880
Transfer between categories - (121) 121 (1,976) 1,976 -
Exchange differences 42 6 (33) - (248) (233)
Disposal - (1,715) (140) (250) - (2,105)
At 31 December 2017 105,983 162,377 16,752 16,819 19,153 321,084
DEPRECIATION
At 1 January 2017 22 102,947 12,799 14,509 15,967 146,244
Charge for the year 3,536 7,811 1,219 1,115 1,344 15,025
Transfer between categories - (17) 17 (260) 260 -
Exchange differences 2 2 (81) - (238) (315)
Disposal - (1,628) (80) (233) - (1,941)
At 31 December 2017 3,560 109,115 13,874 15,131 17,333 159,013
NET BOOK VALUES
At 31 December 2017 102,423 53,262 2,878 1,688 1,820 162,071
5. PROPERTY, PLANT AND EQUIPMENT
notes to the financial statementsyear ended 31 December 2017
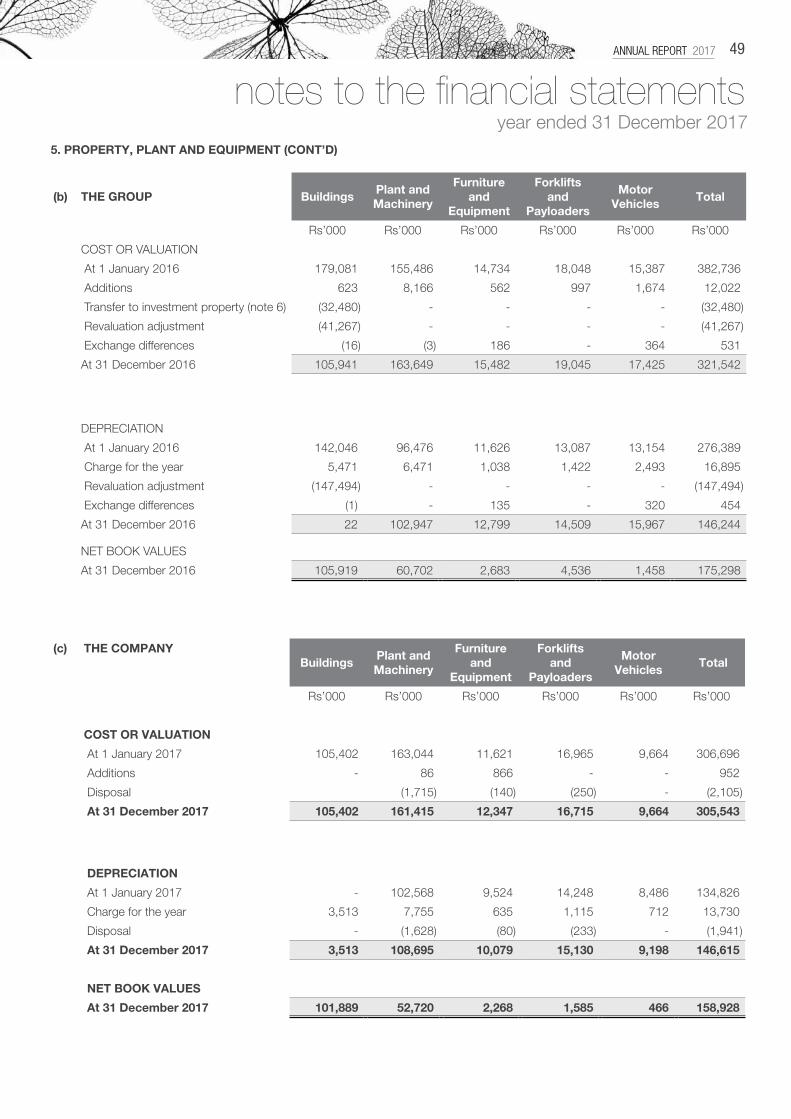
ANNUAL REPORT 2017 49
5. PROPERTY, PLANT AND EQUIPMENT (CONT’D)
(b) THE GROUP BuildingsPlant and Machinery
Furniture and
Equipment
Forklifts and
Payloaders
Motor Vehicles
Total
Rs’000 Rs’000 Rs’000 Rs’000 Rs’000 Rs’000
COST OR VALUATION
At 1 January 2016 179,081 155,486 14,734 18,048 15,387 382,736
Additions 623 8,166 562 997 1,674 12,022
Transfer to investment property (note 6) (32,480) - - - - (32,480)
Revaluation adjustment (41,267) - - - - (41,267)
Exchange differences (16) (3) 186 - 364 531
At 31 December 2016 105,941 163,649 15,482 19,045 17,425 321,542
DEPRECIATION
At 1 January 2016 142,046 96,476 11,626 13,087 13,154 276,389
Charge for the year 5,471 6,471 1,038 1,422 2,493 16,895
Revaluation adjustment (147,494) - - - - (147,494)
Exchange differences (1) - 135 - 320 454
At 31 December 2016 22 102,947 12,799 14,509 15,967 146,244
NET BOOK VALUES
At 31 December 2016 105,919 60,702 2,683 4,536 1,458 175,298
(c) THE COMPANYBuildings
Plant and Machinery
Furniture and
Equipment
Forklifts and
Payloaders
Motor Vehicles
Total
Rs’000 Rs’000 Rs’000 Rs’000 Rs’000 Rs’000
COST OR VALUATION
At 1 January 2017 105,402 163,044 11,621 16,965 9,664 306,696
Additions - 86 866 - - 952
Disposal (1,715) (140) (250) - (2,105)
At 31 December 2017 105,402 161,415 12,347 16,715 9,664 305,543
DEPRECIATION
At 1 January 2017 - 102,568 9,524 14,248 8,486 134,826
Charge for the year 3,513 7,755 635 1,115 712 13,730
Disposal - (1,628) (80) (233) - (1,941)
At 31 December 2017 3,513 108,695 10,079 15,130 9,198 146,615
NET BOOK VALUES
At 31 December 2017 101,889 52,720 2,268 1,585 466 158,928
notes to the financial statementsyear ended 31 December 2017
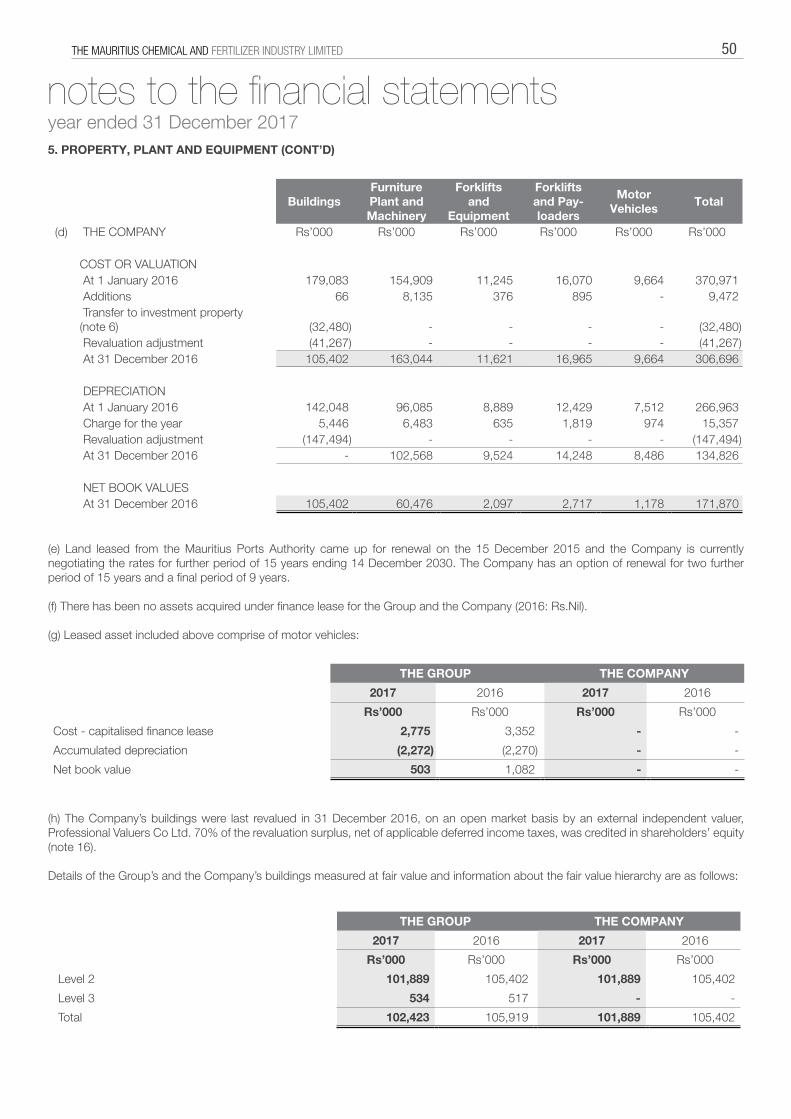
THE MAURITIUS CHEMICAL AND FERTILIZER INDUSTRY LIMITED 50
5. PROPERTY, PLANT AND EQUIPMENT (CONT’D)
BuildingsFurniture Plant and Machinery
Forklifts and
Equipment
Forklifts and Pay-loaders
Motor Vehicles
Total
(d) THE COMPANY Rs’000 Rs’000 Rs’000 Rs’000 Rs’000 Rs’000
COST OR VALUATION At 1 January 2016 179,083 154,909 11,245 16,070 9,664 370,971 Additions 66 8,135 376 895 - 9,472 Transfer to investment property (note 6) (32,480) - - - - (32,480) Revaluation adjustment (41,267) - - - - (41,267) At 31 December 2016 105,402 163,044 11,621 16,965 9,664 306,696
DEPRECIATION At 1 January 2016 142,048 96,085 8,889 12,429 7,512 266,963 Charge for the year 5,446 6,483 635 1,819 974 15,357 Revaluation adjustment (147,494) - - - - (147,494) At 31 December 2016 - 102,568 9,524 14,248 8,486 134,826
NET BOOK VALUES At 31 December 2016 105,402 60,476 2,097 2,717 1,178 171,870
(e) Land leased from the Mauritius Ports Authority came up for renewal on the 15 December 2015 and the Company is currently negotiating the rates for further period of 15 years ending 14 December 2030. The Company has an option of renewal for two further period of 15 years and a final period of 9 years. (f) There has been no assets acquired under finance lease for the Group and the Company (2016: Rs.Nil). (g) Leased asset included above comprise of motor vehicles:
(h) The Company’s buildings were last revalued in 31 December 2016, on an open market basis by an external independent valuer, Professional Valuers Co Ltd. 70% of the revaluation surplus, net of applicable deferred income taxes, was credited in shareholders’ equity (note 16). Details of the Group’s and the Company’s buildings measured at fair value and information about the fair value hierarchy are as follows:
THE GROUP THE COMPANY
2017 2016 2017 2016
Rs’000 Rs’000 Rs’000 Rs’000
Cost - capitalised finance lease 2,775 3,352 - -
Accumulated depreciation (2,272) (2,270) - -
Net book value 503 1,082 - -
THE GROUP THE COMPANY
2017 2016 2017 2016
Rs’000 Rs’000 Rs’000 Rs’000
Level 2 101,889 105,402 101,889 105,402
Level 3 534 517 - -
Total 102,423 105,919 101,889 105,402
notes to the financial statementsyear ended 31 December 2017
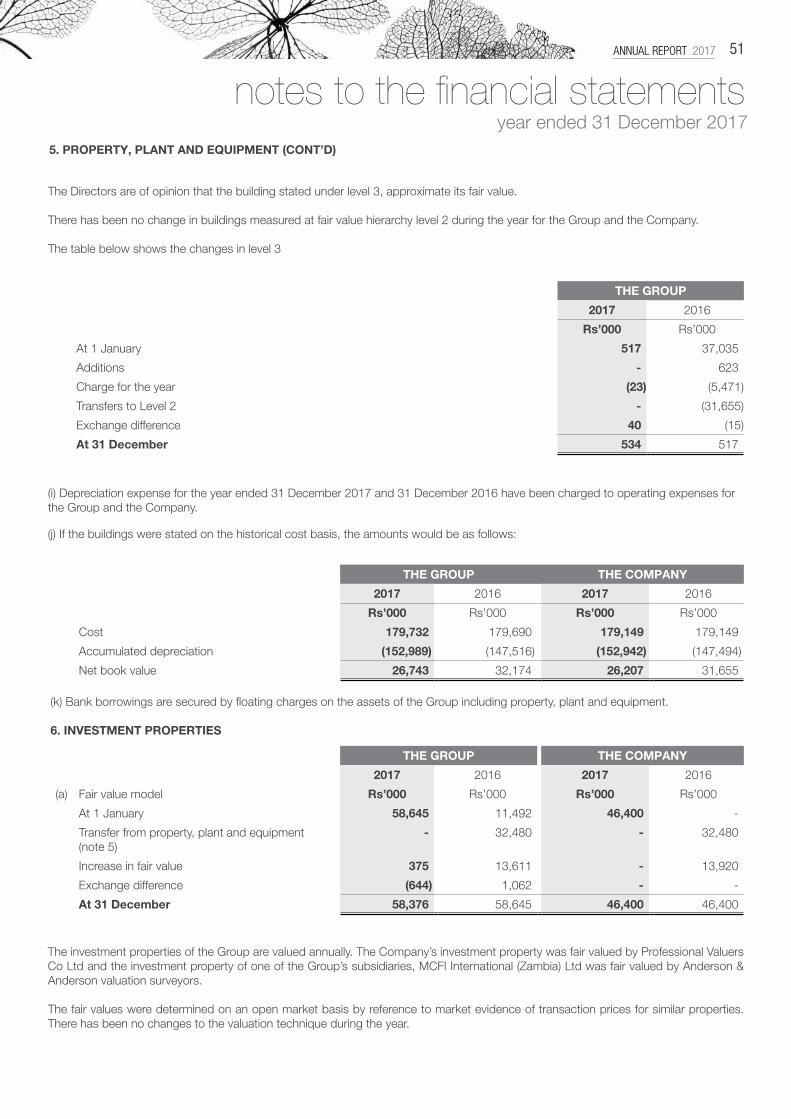
ANNUAL REPORT 2017 51
5. PROPERTY, PLANT AND EQUIPMENT (CONT’D)
The Directors are of opinion that the building stated under level 3, approximate its fair value. There has been no change in buildings measured at fair value hierarchy level 2 during the year for the Group and the Company. The table below shows the changes in level 3
THE GROUP
2017 2016
Rs’000 Rs’000
At 1 January 517 37,035
Additions - 623
Charge for the year (23) (5,471)
Transfers to Level 2 - (31,655)
Exchange difference 40 (15)
At 31 December 534 517
(i) Depreciation expense for the year ended 31 December 2017 and 31 December 2016 have been charged to operating expenses for the Group and the Company.
THE GROUP THE COMPANY
2017 2016 2017 2016
Rs’000 Rs’000 Rs’000 Rs’000
Cost 179,732 179,690 179,149 179,149
Accumulated depreciation (152,989) (147,516) (152,942) (147,494)
Net book value 26,743 32,174 26,207 31,655
THE GROUP THE COMPANY
2017 2016 2017 2016
(a) Fair value model Rs’000 Rs’000 Rs’000 Rs’000
At 1 January 58,645 11,492 46,400 -
Transfer from property, plant and equipment (note 5)
- 32,480 - 32,480
Increase in fair value 375 13,611 - 13,920
Exchange difference (644) 1,062 - -
At 31 December 58,376 58,645 46,400 46,400
(j) If the buildings were stated on the historical cost basis, the amounts would be as follows:
(k) Bank borrowings are secured by floating charges on the assets of the Group including property, plant and equipment. 6. INVESTMENT PROPERTIES
The investment properties of the Group are valued annually. The Company’s investment property was fair valued by Professional Valuers Co Ltd and the investment property of one of the Group’s subsidiaries, MCFI International (Zambia) Ltd was fair valued by Anderson & Anderson valuation surveyors. The fair values were determined on an open market basis by reference to market evidence of transaction prices for similar properties. There has been no changes to the valuation technique during the year.
notes to the financial statementsyear ended 31 December 2017
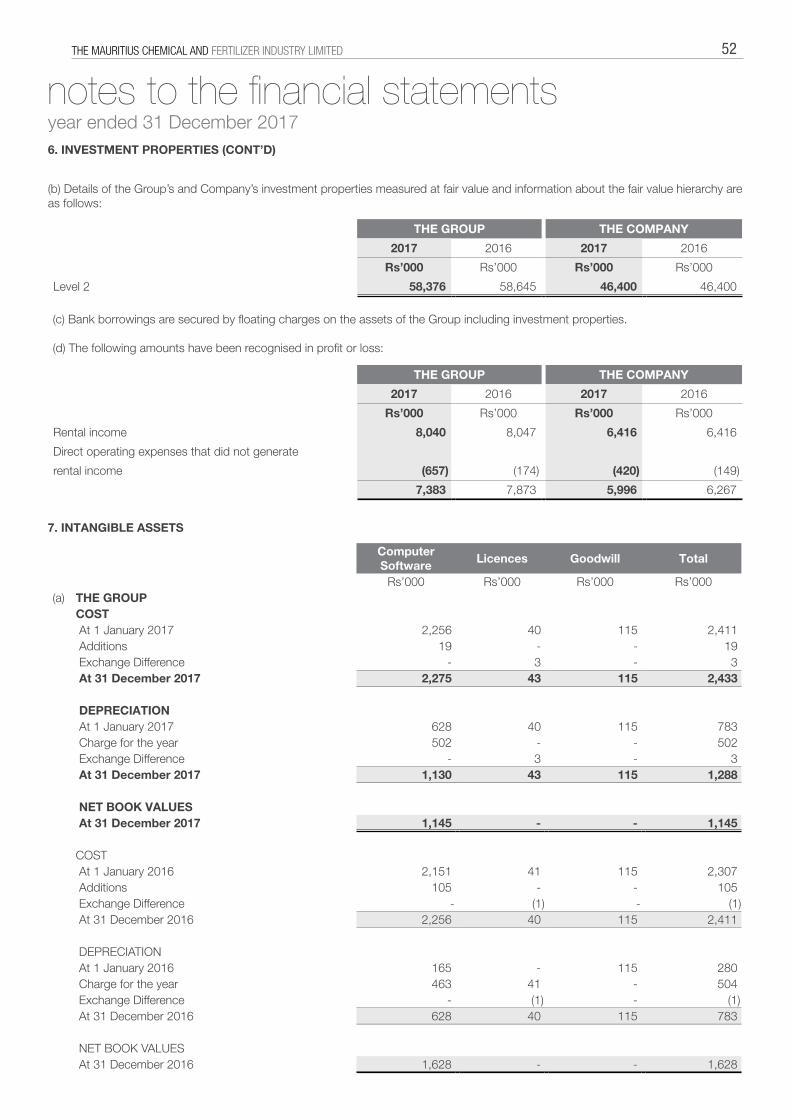
THE MAURITIUS CHEMICAL AND FERTILIZER INDUSTRY LIMITED 52
6. INVESTMENT PROPERTIES (CONT’D)
THE GROUP THE COMPANY
2017 2016 2017 2016
Rs’000 Rs’000 Rs’000 Rs’000
Level 2 58,376 58,645 46,400 46,400
THE GROUP THE COMPANY
2017 2016 2017 2016
Rs’000 Rs’000 Rs’000 Rs’000
Rental income 8,040 8,047 6,416 6,416
Direct operating expenses that did not generate
rental income (657) (174) (420) (149)
7,383 7,873 5,996 6,267
(b) Details of the Group’s and Company’s investment properties measured at fair value and information about the fair value hierarchy are as follows:
(c) Bank borrowings are secured by floating charges on the assets of the Group including investment properties. (d) The following amounts have been recognised in profit or loss:
Computer Software
Licences Goodwill Total
Rs’000 Rs’000 Rs’000 Rs’000(a) THE GROUP
COST At 1 January 2017 2,256 40 115 2,411 Additions 19 - - 19 Exchange Difference - 3 - 3 At 31 December 2017 2,275 43 115 2,433
DEPRECIATION At 1 January 2017 628 40 115 783 Charge for the year 502 - - 502 Exchange Difference - 3 - 3 At 31 December 2017 1,130 43 115 1,288
NET BOOK VALUES At 31 December 2017 1,145 - - 1,145
COST At 1 January 2016 2,151 41 115 2,307 Additions 105 - - 105 Exchange Difference - (1) - (1) At 31 December 2016 2,256 40 115 2,411
DEPRECIATION At 1 January 2016 165 - 115 280 Charge for the year 463 41 - 504 Exchange Difference - (1) - (1) At 31 December 2016 628 40 115 783
NET BOOK VALUES At 31 December 2016 1,628 - - 1,628
7. INTANGIBLE ASSETS
notes to the financial statementsyear ended 31 December 2017
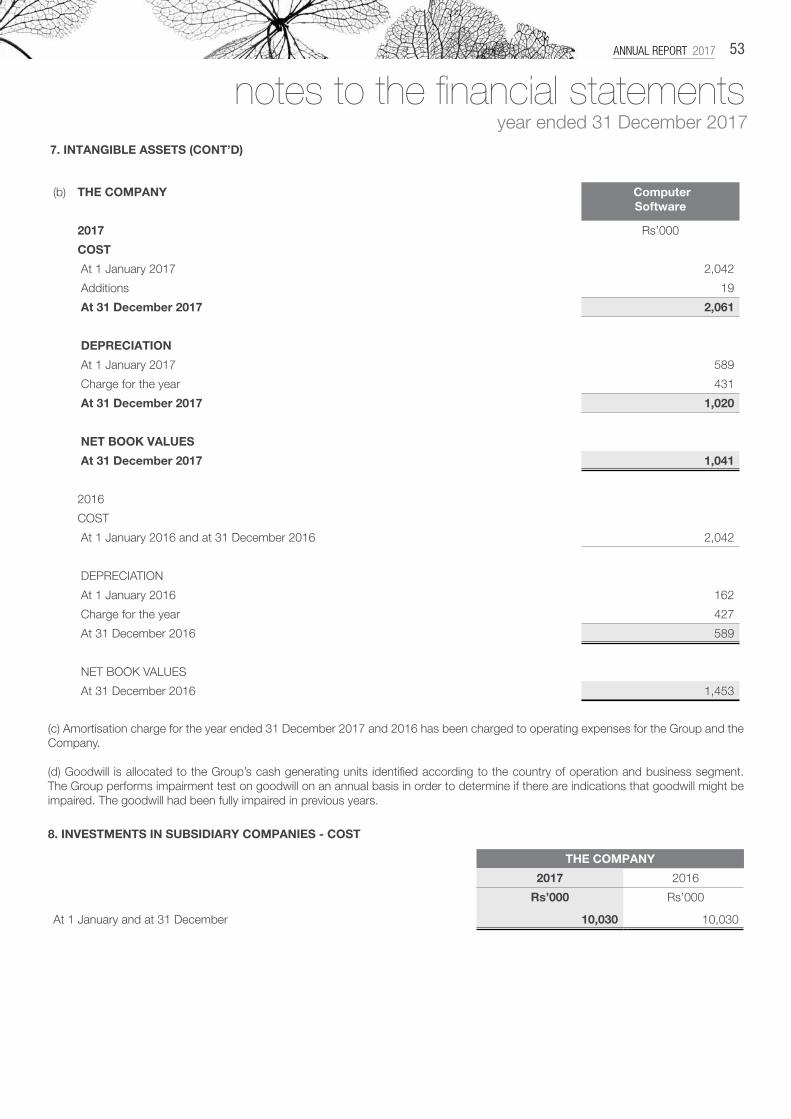
ANNUAL REPORT 2017 53
7. INTANGIBLE ASSETS (CONT’D)
(b) THE COMPANY Computer Software
2017 Rs’000
COST
At 1 January 2017 2,042
Additions 19
At 31 December 2017 2,061
DEPRECIATION
At 1 January 2017 589
Charge for the year 431
At 31 December 2017 1,020
NET BOOK VALUES
At 31 December 2017 1,041
2016
COST
At 1 January 2016 and at 31 December 2016 2,042
DEPRECIATION
At 1 January 2016 162
Charge for the year 427
At 31 December 2016 589
NET BOOK VALUES
At 31 December 2016 1,453
(c) Amortisation charge for the year ended 31 December 2017 and 2016 has been charged to operating expenses for the Group and the Company. (d) Goodwill is allocated to the Group’s cash generating units identified according to the country of operation and business segment. The Group performs impairment test on goodwill on an annual basis in order to determine if there are indications that goodwill might be impaired. The goodwill had been fully impaired in previous years.
THE COMPANY
2017 2016
Rs’000 Rs’000
At 1 January and at 31 December 10,030 10,030
8. INVESTMENTS IN SUBSIDIARY COMPANIES - COST
notes to the financial statementsyear ended 31 December 2017
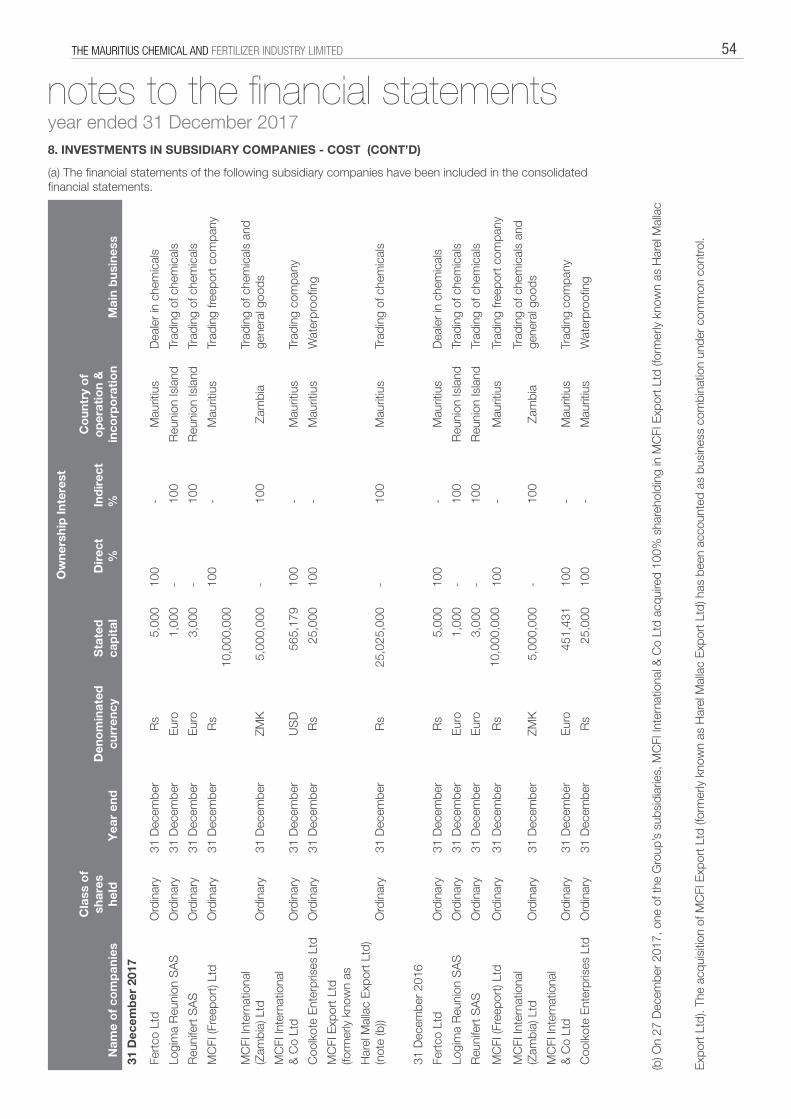
THE MAURITIUS CHEMICAL AND FERTILIZER INDUSTRY LIMITED 54
8. INVESTMENTS IN SUBSIDIARY COMPANIES - COST (CONT’D)
Ow
ners
hip
Inte
rest
Nam
e o
f co
mp
anie
s
Cla
ss o
f sh
ares
he
ldY
ear
end
Den
om
inat
ed
curr
ency
Sta
ted
ca
pit
alD
irec
t %
Ind
irec
t%
Co
untr
y o
f o
per
atio
n &
in
corp
ora
tio
nM
ain
bus
ines
s
31 D
ecem
ber
201
7
Fert
co L
td
Ord
inar
y31
Dec
embe
r R
s 5
,000
1
00
-
Mau
ritiu
sD
eale
r in
che
mic
als
Logi
ma
Reu
nion
SA
SO
rdin
ary
31 D
ecem
ber
Eur
o 1
,000
-
1
00
Reu
nion
Isla
ndTr
adin
g of
che
mic
als
Reu
nife
rt S
AS
Ord
inar
y31
Dec
embe
r E
uro
3,0
00
-
100
R
euni
on Is
land
Trad
ing
of c
hem
ical
s
MC
FI (F
reep
ort)
Ltd
Ord
inar
y31
Dec
embe
r R
s
10,0
00,0
00
100
-
M
aurit
ius
Trad
ing
freep
ort c
ompa
ny
MC
FI In
tern
atio
nal
(Zam
bia)
Ltd
Ord
inar
y31
Dec
embe
r ZM
K 5
,000
,000
-
1
00
Zam
bia
Trad
ing
of c
hem
ical
s an
d ge
nera
l goo
ds
MC
FI In
tern
atio
nal
& C
o Lt
d O
rdin
ary
31 D
ecem
ber
US
D 5
65,1
79
100
-
M
aurit
ius
Trad
ing
com
pany
Coo
lkot
e E
nter
pris
es L
tdO
rdin
ary
31 D
ecem
ber
Rs
25,
000
100
-
M
aurit
ius
Wat
erpr
oofin
g
MC
FI E
xpor
t Ltd
(fo
rmer
ly k
now
n as
Har
el M
alla
c E
xpor
t Ltd
) (n
ote
(b))
Ord
inar
y31
Dec
embe
r R
s
25,0
25,0
00
-
100
M
aurit
ius
Trad
ing
of c
hem
ical
s
31 D
ecem
ber
2016
Fert
co L
td
Ord
inar
y31
Dec
embe
r R
s 5
,000
1
00
-
Mau
ritiu
sD
eale
r in
che
mic
als
Logi
ma
Reu
nion
SA
SO
rdin
ary
31 D
ecem
ber
Eur
o 1
,000
-
1
00
Reu
nion
Isla
ndTr
adin
g of
che
mic
als
Reu
nife
rt S
AS
Ord
inar
y31
Dec
embe
r E
uro
3,0
00
-
100
R
euni
on Is
land
Trad
ing
of c
hem
ical
s
MC
FI (F
reep
ort)
Ltd
Ord
inar
y31
Dec
embe
r R
s10
,000
,000
1
00
-
Mau
ritiu
sTr
adin
g fre
epor
t com
pany
MC
FI In
tern
atio
nal
(Zam
bia)
Ltd
Ord
inar
y31
Dec
embe
r ZM
K 5
,000
,000
-
1
00
Zam
bia
Trad
ing
of c
hem
ical
s an
d ge
nera
l goo
ds
MC
FI In
tern
atio
nal
& C
o Lt
d O
rdin
ary
31 D
ecem
ber
Eur
o 4
51,4
31
100
-
M
aurit
ius
Trad
ing
com
pany
Coo
lkot
e E
nter
pris
es L
tdO
rdin
ary
31 D
ecem
ber
Rs
25,
000
100
-
M
aurit
ius
Wat
erpr
oofin
g
(a) The financial statements of the following subsidiary companies have been included in the consolidated financial statements.
(b) O
n 27
Dec
embe
r 20
17, o
ne o
f the
Gro
up’s
sub
sidi
arie
s, M
CFI
Inte
rnat
iona
l & C
o Lt
d ac
quire
d 10
0% s
hare
hold
ing
in M
CFI
Exp
ort L
td (f
orm
erly
kno
wn
as H
arel
Mal
lac
Exp
ort L
td).
The
acqu
isiti
on o
f MC
FI E
xpor
t Ltd
(for
mer
ly k
now
n as
Har
el M
alla
c E
xpor
t Ltd
) has
bee
n ac
coun
ted
as b
usin
ess
com
bina
tion
unde
r co
mm
on c
ontr
ol.
notes to the financial statementsyear ended 31 December 2017
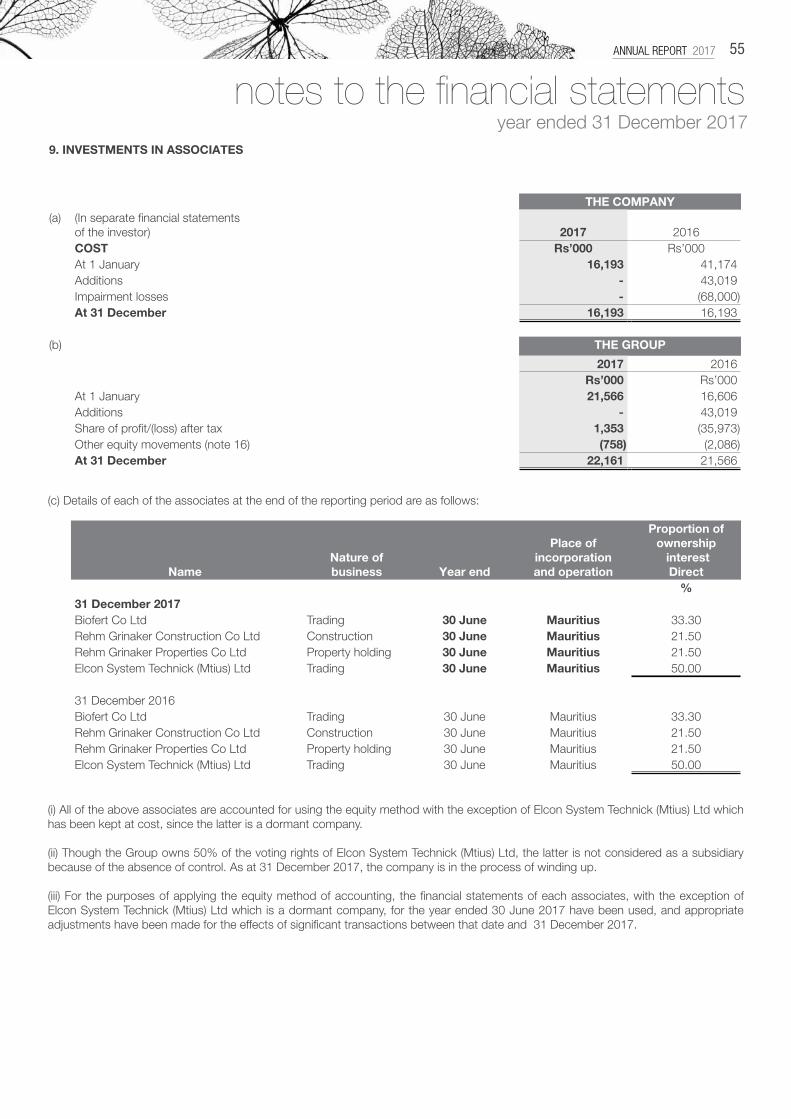
ANNUAL REPORT 2017 55
9. INVESTMENTS IN ASSOCIATES
THE COMPANY(a) (In separate financial statements
of the investor) 2017 2016COST Rs’000 Rs’000At 1 January 16,193 41,174 Additions - 43,019 Impairment losses - (68,000)At 31 December 16,193 16,193
(b) THE GROUP
2017 2016Rs’000 Rs’000
At 1 January 21,566 16,606 Additions - 43,019 Share of profit/(loss) after tax 1,353 (35,973)Other equity movements (note 16) (758) (2,086)At 31 December 22,161 21,566
NameNature of business Year end
Place of incorporationand operation
Proportion of ownership interestDirect
%31 December 2017Biofert Co Ltd Trading 30 June Mauritius 33.30Rehm Grinaker Construction Co Ltd Construction 30 June Mauritius 21.50Rehm Grinaker Properties Co Ltd Property holding 30 June Mauritius 21.50Elcon System Technick (Mtius) Ltd Trading 30 June Mauritius 50.00
31 December 2016Biofert Co Ltd Trading 30 June Mauritius 33.30Rehm Grinaker Construction Co Ltd Construction 30 June Mauritius 21.50Rehm Grinaker Properties Co Ltd Property holding 30 June Mauritius 21.50Elcon System Technick (Mtius) Ltd Trading 30 June Mauritius 50.00
(c) Details of each of the associates at the end of the reporting period are as follows:
(i) All of the above associates are accounted for using the equity method with the exception of Elcon System Technick (Mtius) Ltd which has been kept at cost, since the latter is a dormant company. (ii) Though the Group owns 50% of the voting rights of Elcon System Technick (Mtius) Ltd, the latter is not considered as a subsidiary because of the absence of control. As at 31 December 2017, the company is in the process of winding up. (iii) For the purposes of applying the equity method of accounting, the financial statements of each associates, with the exception of Elcon System Technick (Mtius) Ltd which is a dormant company, for the year ended 30 June 2017 have been used, and appropriate adjustments have been made for the effects of significant transactions between that date and 31 December 2017.
notes to the financial statementsyear ended 31 December 2017
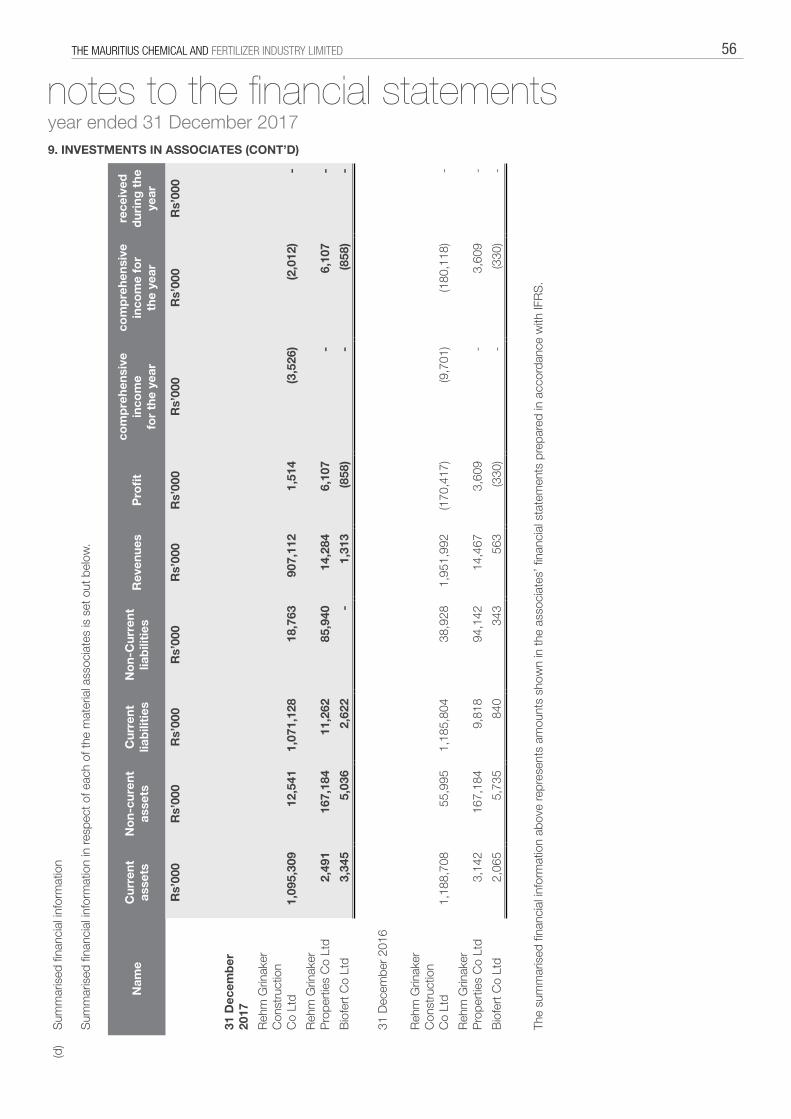
THE MAURITIUS CHEMICAL AND FERTILIZER INDUSTRY LIMITED 56
9. INVESTMENTS IN ASSOCIATES (CONT’D)
(d)
Sum
mar
ised
fina
ncia
l inf
orm
atio
n
Sum
mar
ised
fina
ncia
l inf
orm
atio
n in
resp
ect o
f eac
h of
the
mat
eria
l ass
ocia
tes
is s
et o
ut b
elow
.
Nam
eC
urre
ntas
sets
No
n-cu
rent
asse
tsC
urre
ntlia
bili
ties
No
n-C
urre
ntlia
bili
ties
Rev
enue
sP
rofi
tco
mp
rehe
nsiv
ein
com
efo
r th
e ye
ar
com
pre
hens
ive
inco
me
for
the
year
rece
ived
dur
ing
the
year
Rs’
000
Rs’
000
Rs’
000
Rs’
000
Rs’
000
Rs’
000
Rs’
000
Rs’
000
Rs’
000
31 D
ecem
ber
20
17
Reh
m G
rinak
er
Con
stru
ctio
n C
o Lt
d 1
,095
,309
1
2,54
1 1
,071
,128
1
8,76
3 9
07,1
12
1,5
14
(3,5
26)
(2,0
12)
-
Reh
m G
rinak
er
Pro
pert
ies
Co
Ltd
2,4
91
167
,184
1
1,26
2 8
5,94
0 1
4,28
4 6
,107
-
6
,107
-
Bio
fert
Co
Ltd
3,3
45
5,0
36
2,6
22
-
1,3
13
(858
) -
(8
58)
-
31 D
ecem
ber
2016
Reh
m G
rinak
er
Con
stru
ctio
n C
o Lt
d 1
,188
,708
5
5,99
5 1
,185
,804
3
8,92
8 1
,951
,992
(1
70,4
17)
(9,7
01)
(180
,118
) -
Reh
m G
rinak
er
Pro
pert
ies
Co
Ltd
3,1
42
167
,184
9
,818
9
4,14
2 1
4,46
7 3
,609
-
3
,609
-
Bio
fert
Co
Ltd
2,0
65
5,7
35
840
3
43
563
(3
30)
-
(330
) -
The
sum
mar
ised
fina
ncia
l inf
orm
atio
n ab
ove
repr
esen
ts a
mou
nts
show
n in
the
asso
ciat
es’ fi
nanc
ial s
tate
men
ts p
repa
red
in a
ccor
danc
e w
ith IF
RS
.
notes to the financial statementsyear ended 31 December 2017
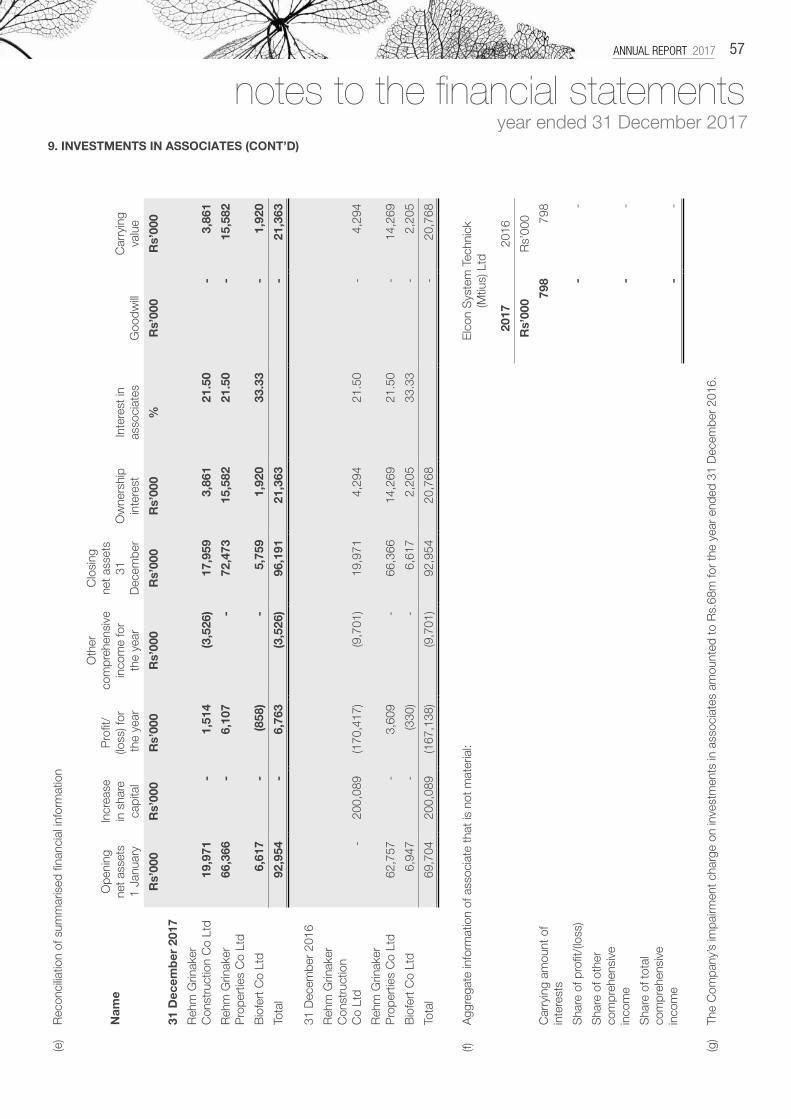
ANNUAL REPORT 2017 57
9. INVESTMENTS IN ASSOCIATES (CONT’D)
(e)
Rec
onci
liatio
n of
sum
mar
ised
fina
ncia
l inf
orm
atio
n
Ope
ning
net a
sset
s1
Janu
ary
Incr
ease
in s
hare
capi
tal
Pro
fit/
(loss
) for
the
year
Oth
erco
mpr
ehen
sive
inco
me
for
the
year
Clo
sing
net a
sset
s31
D
ecem
ber
Ow
ners
hip
inte
rest
Inte
rest
inas
soci
ates
Goo
dwill
Car
ryin
gva
lue
Nam
e
Rs’
000
Rs’
000
Rs’
000
Rs’
000
Rs’
000
Rs’
000
%R
s’00
0R
s’00
0
31 D
ecem
ber
201
7
Reh
m G
rinak
er
Con
stru
ctio
n C
o Lt
d 1
9,97
1 -
1
,514
(3
,526
) 1
7,95
9 3
,861
2
1.50
-
3
,861
Reh
m G
rinak
er
Pro
pert
ies
Co
Ltd
66,
366
-
6,1
07
-
72,
473
15,
582
21.
50
-
15,
582
Bio
fert
Co
Ltd
6,6
17
-
(858
) -
5
,759
1
,920
3
3.33
-
1
,920
Tota
l 9
2,95
4 -
6
,763
(3
,526
) 9
6,19
1 2
1,36
3 -
2
1,36
3
31 D
ecem
ber
2016
Reh
m G
rinak
er
Con
stru
ctio
n C
o Lt
d -
2
00,0
89
(170
,417
) (9
,701
) 1
9,97
1 4
,294
2
1.50
-
4
,294
Reh
m G
rinak
er
Pro
pert
ies
Co
Ltd
62,
757
-
3,6
09
-
66,
366
14,
269
21.
50
-
14,
269
Bio
fert
Co
Ltd
6,9
47
-
(330
) -
6
,617
2
,205
3
3.33
-
2
,205
Tota
l 6
9,70
4 2
00,0
89
(167
,138
) (9
,701
) 9
2,95
4 2
0,76
8 -
2
0,76
8
(f)A
ggre
gate
info
rmat
ion
of a
ssoc
iate
that
is n
ot m
ater
ial:
Elc
on S
yste
m T
echn
ick
(Mtiu
s) L
td
2017
2016
Rs’
000
Rs’
000
Car
ryin
g am
ount
of
inte
rest
s79
879
8
Sha
re o
f pro
fit/(l
oss)
-
-
Sha
re o
f oth
er
com
preh
ensi
ve
inco
me
-
-
Sha
re o
f tot
al
com
preh
ensi
ve
inco
me
-
-
(g)
The
Com
pany
’s im
pairm
ent c
harg
e on
inve
stm
ents
in a
ssoc
iate
s am
ount
ed to
Rs.
68m
for
the
year
end
ed 3
1 D
ecem
ber
2016
.
notes to the financial statementsyear ended 31 December 2017
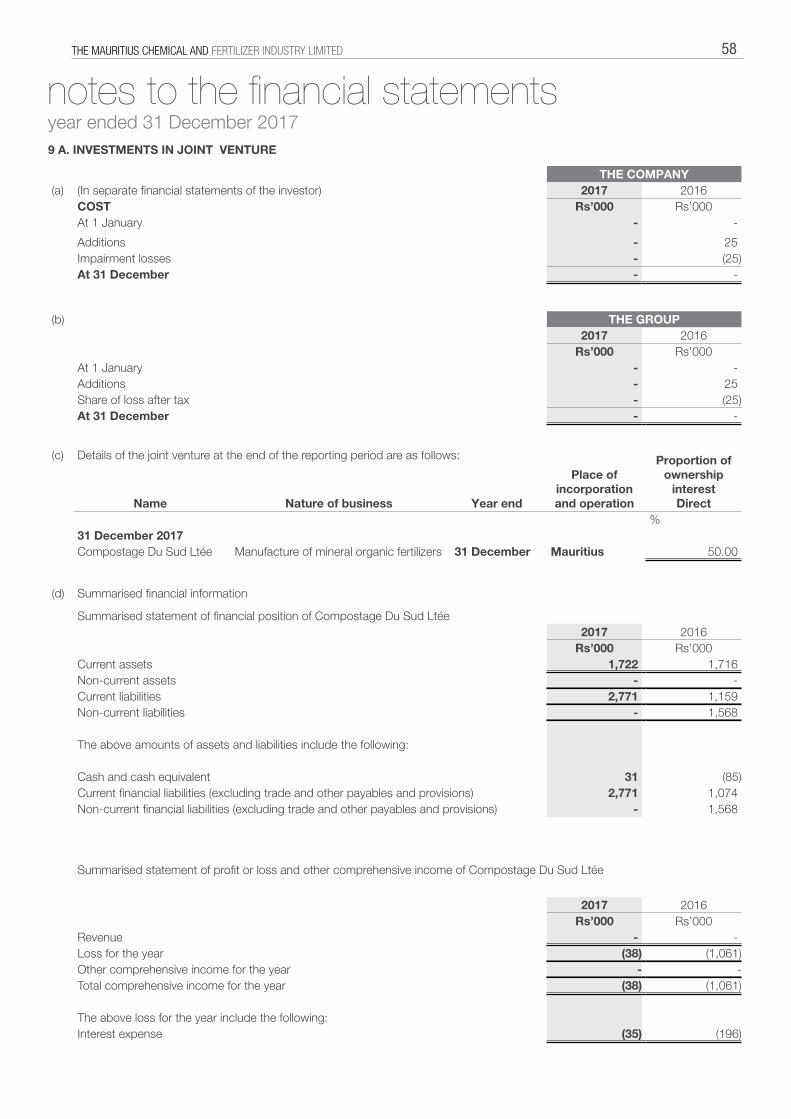
THE MAURITIUS CHEMICAL AND FERTILIZER INDUSTRY LIMITED 58
THE COMPANY(a) (In separate financial statements of the investor) 2017 2016
COST Rs’000 Rs’000At 1 January - -
Additions - 25 Impairment losses - (25)At 31 December - -
(b) THE GROUP2017 2016
Rs’000 Rs’000At 1 January - - Additions - 25 Share of loss after tax - (25)At 31 December - -
(c) Details of the joint venture at the end of the reporting period are as follows:
Place of incorporationand operation
Proportion ofownership
interestDirectName Nature of business Year end
%31 December 2017Compostage Du Sud Ltée Manufacture of mineral organic fertilizers 31 December Mauritius 50.00
(d) Summarised financial information
Summarised statement of financial position of Compostage Du Sud Ltée2017 2016
Rs’000 Rs’000Current assets 1,722 1,716 Non-current assets - - Current liabilities 2,771 1,159 Non-current liabilities - 1,568
The above amounts of assets and liabilities include the following:
Cash and cash equivalent 31 (85)Current financial liabilities (excluding trade and other payables and provisions) 2,771 1,074 Non-current financial liabilities (excluding trade and other payables and provisions) - 1,568
Summarised statement of profit or loss and other comprehensive income of Compostage Du Sud Ltée
2017 2016Rs’000 Rs’000
Revenue - - Loss for the year (38) (1,061)Other comprehensive income for the year - - Total comprehensive income for the year (38) (1,061)
The above loss for the year include the following:Interest expense (35) (196)
9 A. INVESTMENTS IN JOINT VENTURE
notes to the financial statementsyear ended 31 December 2017
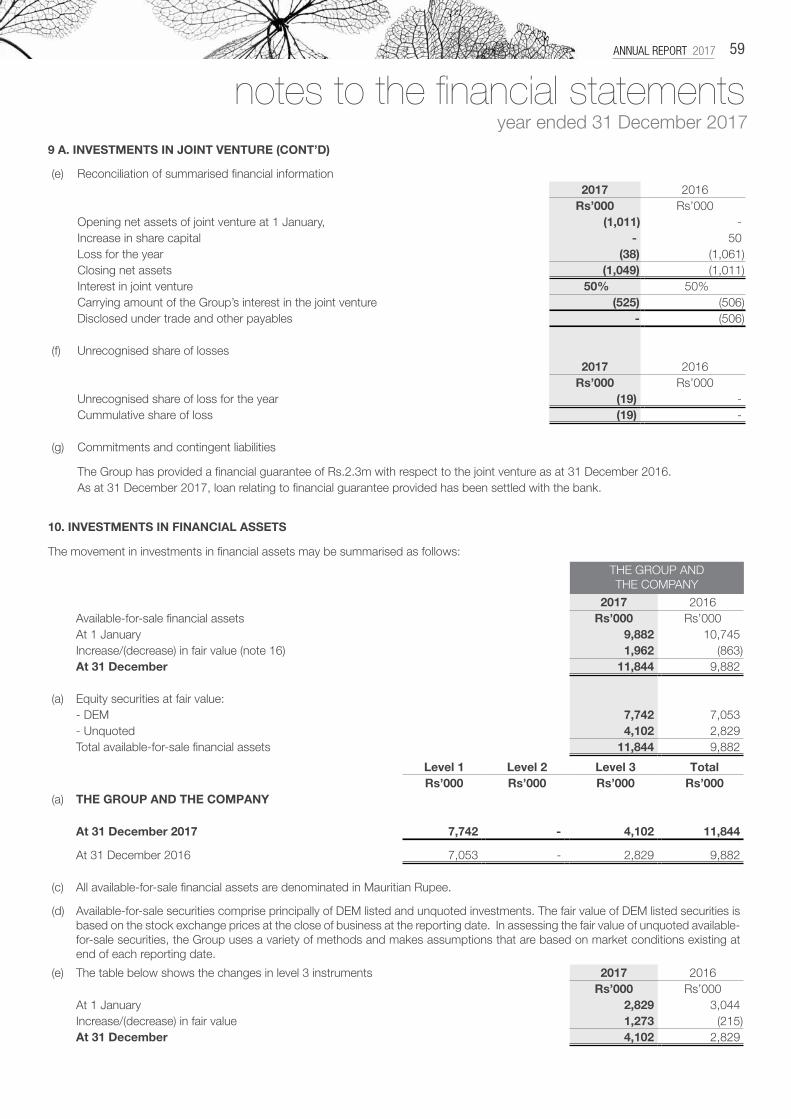
ANNUAL REPORT 2017 59
(e) Reconciliation of summarised financial information2017 2016
Rs’000 Rs’000Opening net assets of joint venture at 1 January, (1,011) - Increase in share capital - 50 Loss for the year (38) (1,061)Closing net assets (1,049) (1,011)Interest in joint venture 50% 50% Carrying amount of the Group’s interest in the joint venture (525) (506)Disclosed under trade and other payables - (506)
(f) Unrecognised share of losses2017 2016
Rs’000 Rs’000Unrecognised share of loss for the year (19) - Cummulative share of loss (19) -
(g) Commitments and contingent liabilities
The Group has provided a financial guarantee of Rs.2.3m with respect to the joint venture as at 31 December 2016.As at 31 December 2017, loan relating to financial guarantee provided has been settled with the bank.
9 A. INVESTMENTS IN JOINT VENTURE (CONT’D)
THE GROUP ANDTHE COMPANY
2017 2016Available-for-sale financial assets Rs’000 Rs’000At 1 January 9,882 10,745 Increase/(decrease) in fair value (note 16) 1,962 (863)At 31 December 11,844 9,882
(a) Equity securities at fair value:- DEM 7,742 7,053 - Unquoted 4,102 2,829 Total available-for-sale financial assets 11,844 9,882
Level 1 Level 2 Level 3 Total Rs’000 Rs’000 Rs’000 Rs’000
(a) THE GROUP AND THE COMPANY
At 31 December 2017 7,742 - 4,102 11,844
At 31 December 2016 7,053 - 2,829 9,882
(c) All available-for-sale financial assets are denominated in Mauritian Rupee.
(d) Available-for-sale securities comprise principally of DEM listed and unquoted investments. The fair value of DEM listed securities is based on the stock exchange prices at the close of business at the reporting date. In assessing the fair value of unquoted available-for-sale securities, the Group uses a variety of methods and makes assumptions that are based on market conditions existing at end of each reporting date.
(e) The table below shows the changes in level 3 instruments 2017 2016Rs’000 Rs’000
At 1 January 2,829 3,044 Increase/(decrease) in fair value 1,273 (215)At 31 December 4,102 2,829
10. INVESTMENTS IN FINANCIAL ASSETS
The movement in investments in financial assets may be summarised as follows:
notes to the financial statementsyear ended 31 December 2017
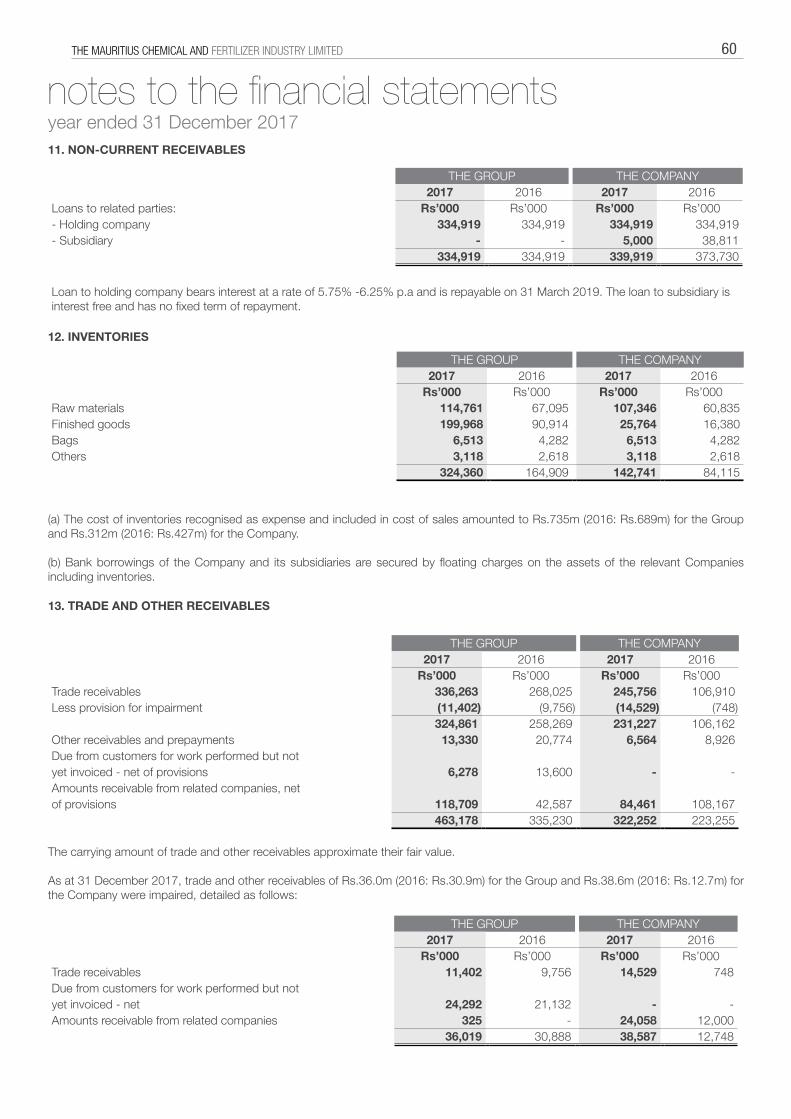
THE MAURITIUS CHEMICAL AND FERTILIZER INDUSTRY LIMITED 60
11. NON-CURRENT RECEIVABLES
THE GROUP THE COMPANY2017 2016 2017 2016
Loans to related parties: Rs’000 Rs’000 Rs’000 Rs’000- Holding company 334,919 334,919 334,919 334,919 - Subsidiary - - 5,000 38,811
334,919 334,919 339,919 373,730
Loan to holding company bears interest at a rate of 5.75% -6.25% p.a and is repayable on 31 March 2019. The loan to subsidiary is interest free and has no fixed term of repayment.
THE GROUP THE COMPANY2017 2016 2017 2016
Rs’000 Rs’000 Rs’000 Rs’000Raw materials 114,761 67,095 107,346 60,835 Finished goods 199,968 90,914 25,764 16,380 Bags 6,513 4,282 6,513 4,282 Others 3,118 2,618 3,118 2,618
324,360 164,909 142,741 84,115
12. INVENTORIES
(a) The cost of inventories recognised as expense and included in cost of sales amounted to Rs.735m (2016: Rs.689m) for the Group and Rs.312m (2016: Rs.427m) for the Company. (b) Bank borrowings of the Company and its subsidiaries are secured by floating charges on the assets of the relevant Companies including inventories.
THE GROUP THE COMPANY2017 2016 2017 2016
Rs’000 Rs’000 Rs’000 Rs’000Trade receivables 336,263 268,025 245,756 106,910 Less provision for impairment (11,402) (9,756) (14,529) (748)
324,861 258,269 231,227 106,162 Other receivables and prepayments 13,330 20,774 6,564 8,926 Due from customers for work performed but not yet invoiced - net of provisions 6,278 13,600 - - Amounts receivable from related companies, netof provisions 118,709 42,587 84,461 108,167
463,178 335,230 322,252 223,255
13. TRADE AND OTHER RECEIVABLES
The carrying amount of trade and other receivables approximate their fair value.
As at 31 December 2017, trade and other receivables of Rs.36.0m (2016: Rs.30.9m) for the Group and Rs.38.6m (2016: Rs.12.7m) for the Company were impaired, detailed as follows:
THE GROUP THE COMPANY2017 2016 2017 2016
Rs’000 Rs’000 Rs’000 Rs’000Trade receivables 11,402 9,756 14,529 748 Due from customers for work performed but not yet invoiced - net 24,292 21,132 - - Amounts receivable from related companies 325 - 24,058 12,000
36,019 30,888 38,587 12,748
notes to the financial statementsyear ended 31 December 2017
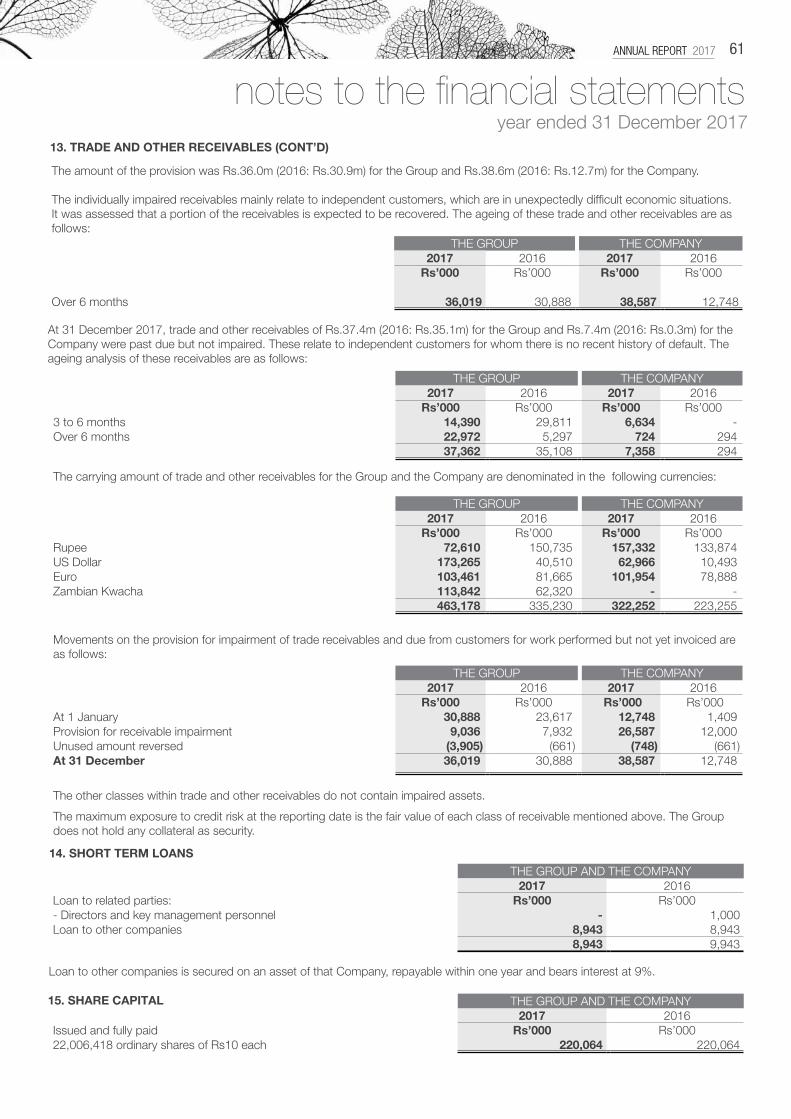
ANNUAL REPORT 2017 61
13. TRADE AND OTHER RECEIVABLES (CONT’D)
The amount of the provision was Rs.36.0m (2016: Rs.30.9m) for the Group and Rs.38.6m (2016: Rs.12.7m) for the Company.
The individually impaired receivables mainly relate to independent customers, which are in unexpectedly difficult economic situations. It was assessed that a portion of the receivables is expected to be recovered. The ageing of these trade and other receivables are as follows:
THE GROUP THE COMPANY2017 2016 2017 2016
Rs’000 Rs’000 Rs’000 Rs’000
Over 6 months 36,019 30,888 38,587 12,748
THE GROUP THE COMPANY2017 2016 2017 2016
Rs’000 Rs’000 Rs’000 Rs’0003 to 6 months 14,390 29,811 6,634 - Over 6 months 22,972 5,297 724 294
37,362 35,108 7,358 294
The carrying amount of trade and other receivables for the Group and the Company are denominated in the following currencies:
THE GROUP THE COMPANY2017 2016 2017 2016
Rs’000 Rs’000 Rs’000 Rs’000Rupee 72,610 150,735 157,332 133,874 US Dollar 173,265 40,510 62,966 10,493 Euro 103,461 81,665 101,954 78,888 Zambian Kwacha 113,842 62,320 - -
463,178 335,230 322,252 223,255
Movements on the provision for impairment of trade receivables and due from customers for work performed but not yet invoiced are as follows:
THE GROUP THE COMPANY2017 2016 2017 2016
Rs’000 Rs’000 Rs’000 Rs’000 At 1 January 30,888 23,617 12,748 1,409 Provision for receivable impairment 9,036 7,932 26,587 12,000 Unused amount reversed (3,905) (661) (748) (661)At 31 December 36,019 30,888 38,587 12,748
The other classes within trade and other receivables do not contain impaired assets.
The maximum exposure to credit risk at the reporting date is the fair value of each class of receivable mentioned above. The Group does not hold any collateral as security.
At 31 December 2017, trade and other receivables of Rs.37.4m (2016: Rs.35.1m) for the Group and Rs.7.4m (2016: Rs.0.3m) for the Company were past due but not impaired. These relate to independent customers for whom there is no recent history of default. The ageing analysis of these receivables are as follows:
14. SHORT TERM LOANS
THE GROUP AND THE COMPANY2017 2016
Loan to related parties: Rs’000 Rs’000- Directors and key management personnel - 1,000 Loan to other companies 8,943 8,943
8,943 9,943
THE GROUP AND THE COMPANY2017 2016
Issued and fully paid Rs’000 Rs’00022,006,418 ordinary shares of Rs10 each 220,064 220,064
15. SHARE CAPITAL
Loan to other companies is secured on an asset of that Company, repayable within one year and bears interest at 9%.
THE GROUP THE COMPANY2017 2016 2017 2016
Rs’000 Rs’000 Rs’000 Rs’000Trade receivables 11,402 9,756 14,529 748 Due from customers for work performed but not yet invoiced - net 24,292 21,132 - - Amounts receivable from related companies 325 - 24,058 12,000
36,019 30,888 38,587 12,748
notes to the financial statementsyear ended 31 December 2017
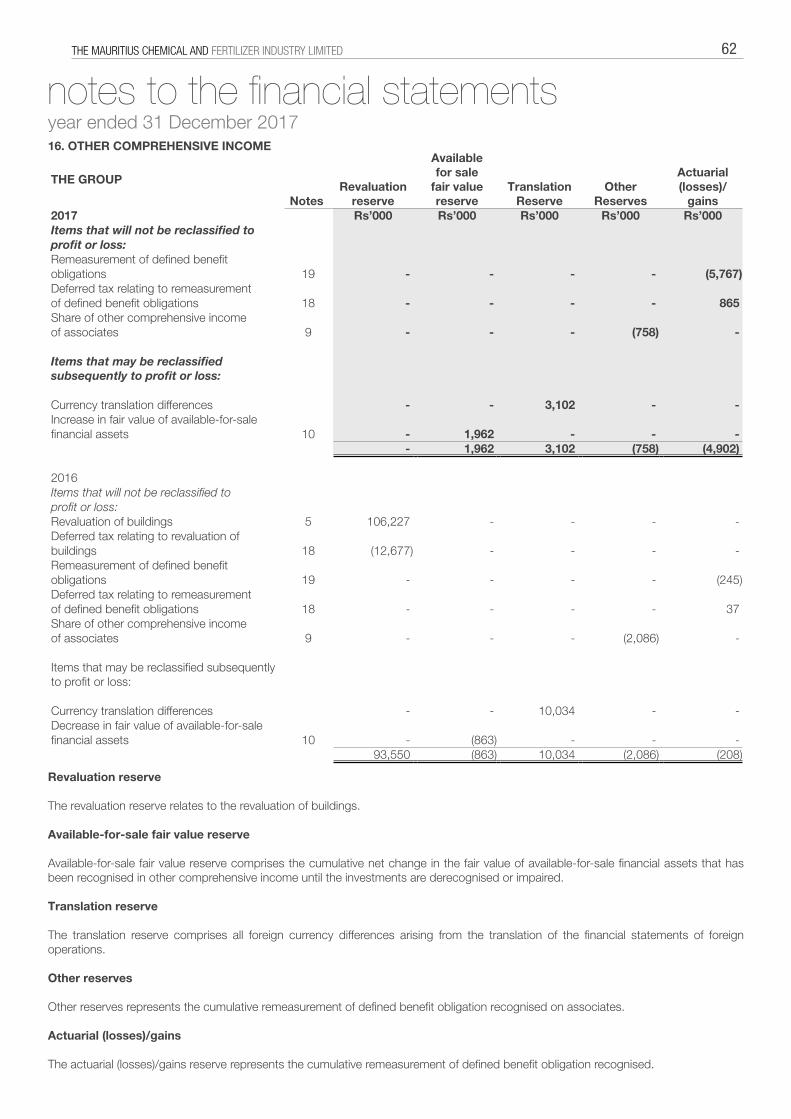
THE MAURITIUS CHEMICAL AND FERTILIZER INDUSTRY LIMITED 62
16. OTHER COMPREHENSIVE INCOME
Revaluation reserve The revaluation reserve relates to the revaluation of buildings. Available-for-sale fair value reserve Available-for-sale fair value reserve comprises the cumulative net change in the fair value of available-for-sale financial assets that has been recognised in other comprehensive income until the investments are derecognised or impaired. Translation reserve The translation reserve comprises all foreign currency differences arising from the translation of the financial statements of foreign operations. Other reserves Other reserves represents the cumulative remeasurement of defined benefit obligation recognised on associates. Actuarial (losses)/gains The actuarial (losses)/gains reserve represents the cumulative remeasurement of defined benefit obligation recognised.
THE GROUP
NotesRevaluation
reserve
Availablefor sale
fair value reserve
Translation Reserve
Other Reserves
Actuarial (losses)/
gains2017 Rs’000 Rs’000 Rs’000 Rs’000 Rs’000Items that will not be reclassified to profit or loss:Remeasurement of defined benefitobligations 19 - - - - (5,767)Deferred tax relating to remeasurementof defined benefit obligations 18 - - - - 865 Share of other comprehensive incomeof associates 9 - - - (758) -
Items that may be reclassified subsequently to profit or loss:
Currency translation differences - - 3,102 - - Increase in fair value of available-for-sale financial assets 10 - 1,962 - - -
- 1,962 3,102 (758) (4,902)
2016Items that will not be reclassified to profit or loss:Revaluation of buildings 5 106,227 - - - - Deferred tax relating to revaluation of buildings 18 (12,677) - - - - Remeasurement of defined benefitobligations 19 - - - - (245)Deferred tax relating to remeasurementof defined benefit obligations 18 - - - - 37 Share of other comprehensive incomeof associates 9 - - - (2,086) -
Items that may be reclassified subsequently to profit or loss:
Currency translation differences - - 10,034 - - Decrease in fair value of available-for-sale financial assets 10 - (863) - - -
93,550 (863) 10,034 (2,086) (208)
notes to the financial statementsyear ended 31 December 2017
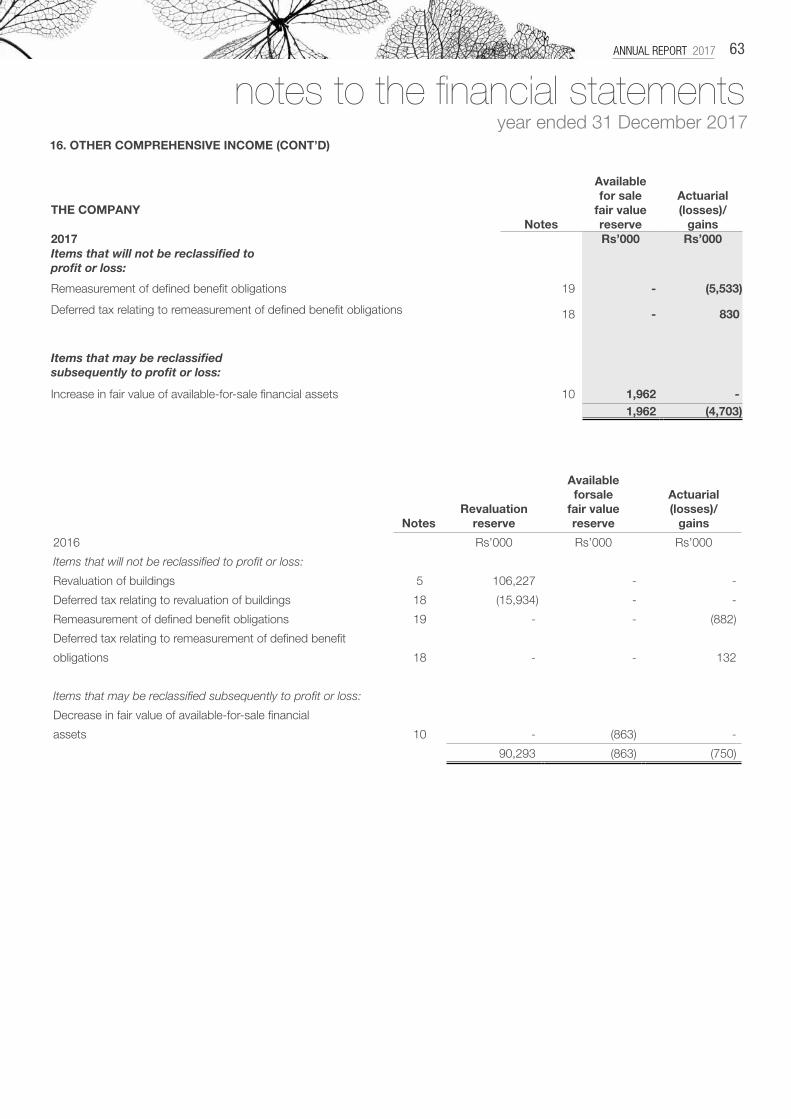
ANNUAL REPORT 2017 63
Availableforsale
fair valuereserve
Actuarial (losses)/
gainsRevaluation
reserve Notes
2016 Rs’000 Rs’000 Rs’000
Items that will not be reclassified to profit or loss:
Revaluation of buildings 5 106,227 - -
Deferred tax relating to revaluation of buildings 18 (15,934) - -
Remeasurement of defined benefit obligations 19 - - (882)
Deferred tax relating to remeasurement of defined benefit
obligations 18 - - 132
Items that may be reclassified subsequently to profit or loss:
Decrease in fair value of available-for-sale financial
assets 10 - (863) -
90,293 (863) (750)
Notes
Availablefor sale
fair valuereserve
Actuarial (losses)/
gainsTHE COMPANY
2017 Rs’000 Rs’000Items that will not be reclassified toprofit or loss:
Remeasurement of defined benefit obligations 19 - (5,533)
Deferred tax relating to remeasurement of defined benefit obligations 18 - 830
Items that may be reclassified subsequently to profit or loss:
Increase in fair value of available-for-sale financial assets 10 1,962 - 1,962 (4,703)
16. OTHER COMPREHENSIVE INCOME (CONT’D)
notes to the financial statementsyear ended 31 December 2017
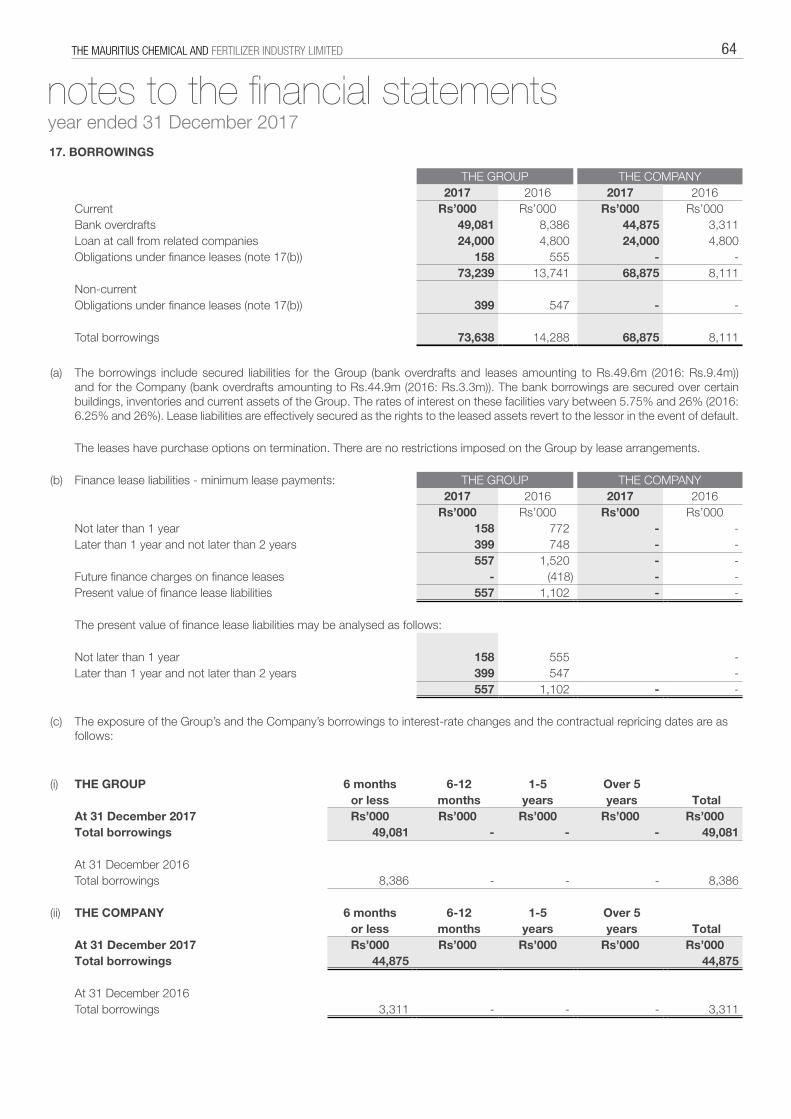
THE MAURITIUS CHEMICAL AND FERTILIZER INDUSTRY LIMITED 64
THE GROUP THE COMPANY2017 2016 2017 2016
Current Rs’000 Rs’000 Rs’000 Rs’000Bank overdrafts 49,081 8,386 44,875 3,311 Loan at call from related companies 24,000 4,800 24,000 4,800 Obligations under finance leases (note 17(b)) 158 555 - -
73,239 13,741 68,875 8,111 Non-currentObligations under finance leases (note 17(b)) 399 547 - -
Total borrowings 73,638 14,288 68,875 8,111
(a) The borrowings include secured liabilities for the Group (bank overdrafts and leases amounting to Rs.49.6m (2016: Rs.9.4m)) and for the Company (bank overdrafts amounting to Rs.44.9m (2016: Rs.3.3m)). The bank borrowings are secured over certain buildings, inventories and current assets of the Group. The rates of interest on these facilities vary between 5.75% and 26% (2016: 6.25% and 26%). Lease liabilities are effectively secured as the rights to the leased assets revert to the lessor in the event of default.
The leases have purchase options on termination. There are no restrictions imposed on the Group by lease arrangements.
(b) Finance lease liabilities - minimum lease payments: THE GROUP THE COMPANY2017 2016 2017 2016
Rs’000 Rs’000 Rs’000 Rs’000Not later than 1 year 158 772 - - Later than 1 year and not later than 2 years 399 748 - -
557 1,520 - - Future finance charges on finance leases - (418) - - Present value of finance lease liabilities 557 1,102 - -
The present value of finance lease liabilities may be analysed as follows:
Not later than 1 year 158 555 - Later than 1 year and not later than 2 years 399 547 -
557 1,102 - -
(c) The exposure of the Group’s and the Company’s borrowings to interest-rate changes and the contractual repricing dates are as follows:
(i) THE GROUP 6 months 6-12 1-5 Over 5 or less months years years Total
At 31 December 2017 Rs’000 Rs’000 Rs’000 Rs’000 Rs’000Total borrowings 49,081 - - - 49,081
At 31 December 2016Total borrowings 8,386 - - - 8,386
(ii) THE COMPANY 6 months 6-12 1-5 Over 5 or less months years years Total
At 31 December 2017 Rs’000 Rs’000 Rs’000 Rs’000 Rs’000Total borrowings 44,875 44,875
At 31 December 2016Total borrowings 3,311 - - - 3,311
17. BORROWINGS
notes to the financial statementsyear ended 31 December 2017
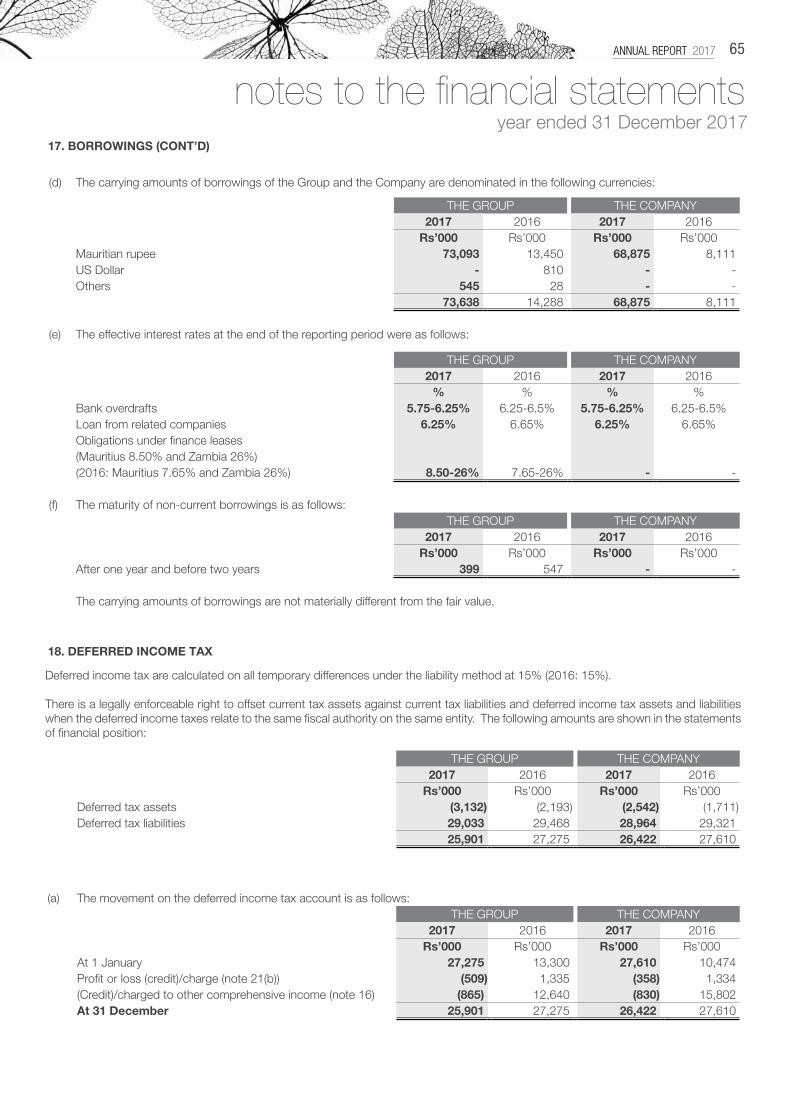
ANNUAL REPORT 2017 65
(d) The carrying amounts of borrowings of the Group and the Company are denominated in the following currencies:
THE GROUP THE COMPANY2017 2016 2017 2016
Rs’000 Rs’000 Rs’000 Rs’000Mauritian rupee 73,093 13,450 68,875 8,111 US Dollar - 810 - - Others 545 28 - -
73,638 14,288 68,875 8,111
(e) The effective interest rates at the end of the reporting period were as follows:
THE GROUP THE COMPANY2017 2016 2017 2016
% % % %Bank overdrafts 5.75-6.25% 6.25-6.5% 5.75-6.25% 6.25-6.5%Loan from related companies 6.25% 6.65% 6.25% 6.65%Obligations under finance leases (Mauritius 8.50% and Zambia 26%)(2016: Mauritius 7.65% and Zambia 26%) 8.50-26% 7.65-26% - -
(f) The maturity of non-current borrowings is as follows:THE GROUP THE COMPANY
2017 2016 2017 2016Rs’000 Rs’000 Rs’000 Rs’000
After one year and before two years 399 547 - -
The carrying amounts of borrowings are not materially different from the fair value.
17. BORROWINGS (CONT’D)
THE GROUP THE COMPANY2017 2016 2017 2016
Rs’000 Rs’000 Rs’000 Rs’000Deferred tax assets (3,132) (2,193) (2,542) (1,711)Deferred tax liabilities 29,033 29,468 28,964 29,321
25,901 27,275 26,422 27,610
(a) The movement on the deferred income tax account is as follows:THE GROUP THE COMPANY
2017 2016 2017 2016Rs’000 Rs’000 Rs’000 Rs’000
At 1 January 27,275 13,300 27,610 10,474 Profit or loss (credit)/charge (note 21(b)) (509) 1,335 (358) 1,334 (Credit)/charged to other comprehensive income (note 16) (865) 12,640 (830) 15,802 At 31 December 25,901 27,275 26,422 27,610
18. DEFERRED INCOME TAX
Deferred income tax are calculated on all temporary differences under the liability method at 15% (2016: 15%). There is a legally enforceable right to offset current tax assets against current tax liabilities and deferred income tax assets and liabilities when the deferred income taxes relate to the same fiscal authority on the same entity. The following amounts are shown in the statements of financial position:
notes to the financial statementsyear ended 31 December 2017
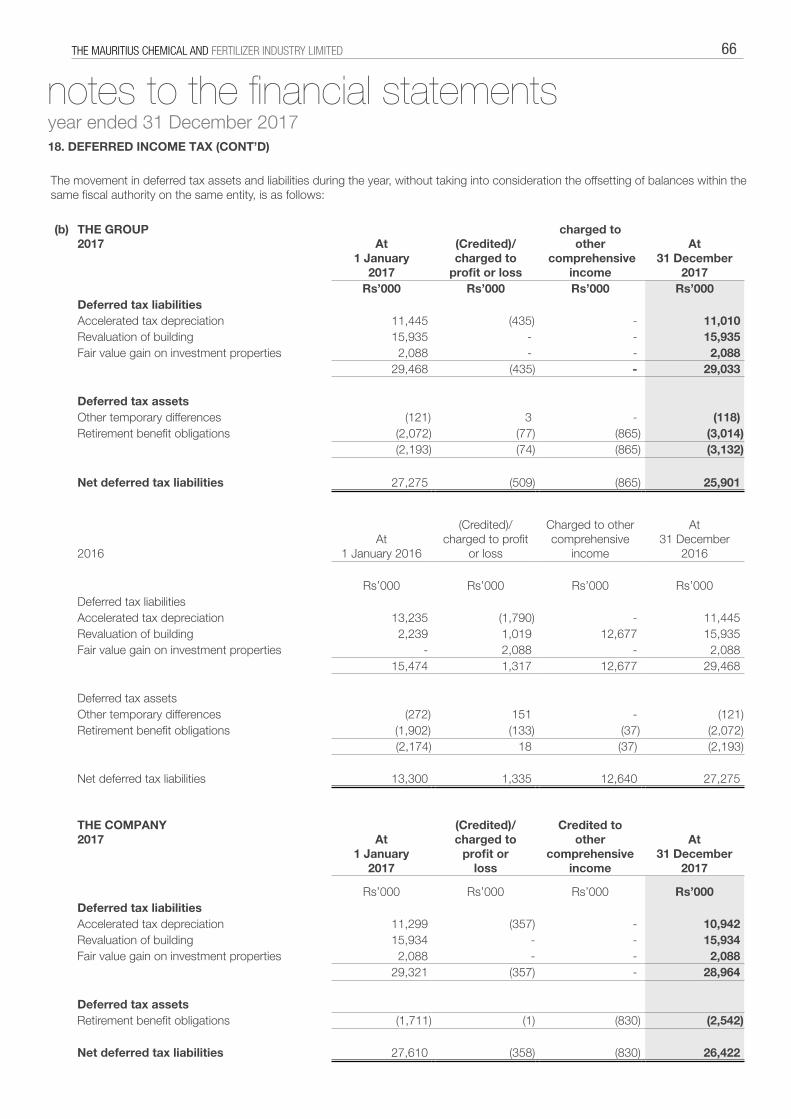
THE MAURITIUS CHEMICAL AND FERTILIZER INDUSTRY LIMITED 66
18. DEFERRED INCOME TAX (CONT’D)
The movement in deferred tax assets and liabilities during the year, without taking into consideration the offsetting of balances within the same fiscal authority on the same entity, is as follows:
(b) THE GROUP2017 At
1 January2017
(Credited)/charged to
profit or loss
charged to other
comprehensive income
At 31 December
2017Rs’000 Rs’000 Rs’000 Rs’000
Deferred tax liabilitiesAccelerated tax depreciation 11,445 (435) - 11,010 Revaluation of building 15,935 - - 15,935 Fair value gain on investment properties 2,088 - - 2,088
29,468 (435) - 29,033
Deferred tax assetsOther temporary differences (121) 3 - (118)Retirement benefit obligations (2,072) (77) (865) (3,014)
(2,193) (74) (865) (3,132)
Net deferred tax liabilities 27,275 (509) (865) 25,901
2016At
1 January 2016
(Credited)/ charged to profit
or loss
Charged to other comprehensive
income
At 31 December
2016
Rs’000 Rs’000 Rs’000 Rs’000Deferred tax liabilitiesAccelerated tax depreciation 13,235 (1,790) - 11,445 Revaluation of building 2,239 1,019 12,677 15,935 Fair value gain on investment properties - 2,088 - 2,088
15,474 1,317 12,677 29,468
Deferred tax assetsOther temporary differences (272) 151 - (121)Retirement benefit obligations (1,902) (133) (37) (2,072)
(2,174) 18 (37) (2,193)
Net deferred tax liabilities 13,300 1,335 12,640 27,275
THE COMPANY2017 At
1 January2017
(Credited)/charged to
profit orloss
Credited to other
comprehensiveincome
At 31 December
2017
Rs’000 Rs’000 Rs’000 Rs’000Deferred tax liabilitiesAccelerated tax depreciation 11,299 (357) - 10,942 Revaluation of building 15,934 - - 15,934 Fair value gain on investment properties 2,088 - - 2,088
29,321 (357) - 28,964
Deferred tax assetsRetirement benefit obligations (1,711) (1) (830) (2,542)
Net deferred tax liabilities 27,610 (358) (830) 26,422
notes to the financial statementsyear ended 31 December 2017
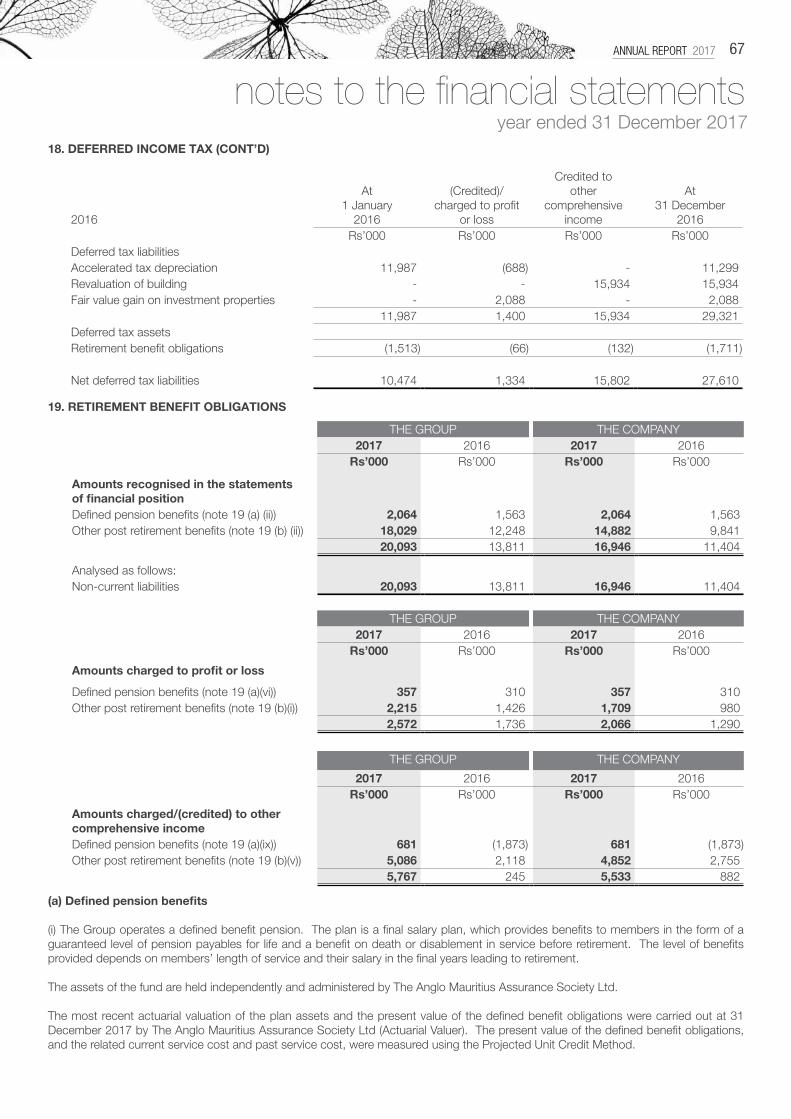
ANNUAL REPORT 2017 67
At1 January
2016
(Credited)/charged to profit
or loss
Credited toother
comprehensiveincome
At31 December
20162016Rs’000 Rs’000 Rs’000 Rs’000
Deferred tax liabilitiesAccelerated tax depreciation 11,987 (688) - 11,299 Revaluation of building - - 15,934 15,934 Fair value gain on investment properties - 2,088 - 2,088
11,987 1,400 15,934 29,321 Deferred tax assetsRetirement benefit obligations (1,513) (66) (132) (1,711)
Net deferred tax liabilities 10,474 1,334 15,802 27,610
THE GROUP THE COMPANY2017 2016 2017 2016
Rs’000 Rs’000 Rs’000 Rs’000
Amounts recognised in the statements of financial positionDefined pension benefits (note 19 (a) (ii)) 2,064 1,563 2,064 1,563 Other post retirement benefits (note 19 (b) (ii)) 18,029 12,248 14,882 9,841
20,093 13,811 16,946 11,404
Analysed as follows:Non-current liabilities 20,093 13,811 16,946 11,404
THE GROUP THE COMPANY2017 2016 2017 2016
Rs’000 Rs’000 Rs’000 Rs’000
Amounts charged to profit or loss
Defined pension benefits (note 19 (a)(vi)) 357 310 357 310 Other post retirement benefits (note 19 (b)(i)) 2,215 1,426 1,709 980
2,572 1,736 2,066 1,290
THE GROUP THE COMPANY
2017 2016 2017 2016Rs’000 Rs’000 Rs’000 Rs’000
Amounts charged/(credited) to other comprehensive incomeDefined pension benefits (note 19 (a)(ix)) 681 (1,873) 681 (1,873)Other post retirement benefits (note 19 (b)(v)) 5,086 2,118 4,852 2,755
5,767 245 5,533 882
19. RETIREMENT BENEFIT OBLIGATIONS
(a) Defined pension benefits (i) The Group operates a defined benefit pension. The plan is a final salary plan, which provides benefits to members in the form of a guaranteed level of pension payables for life and a benefit on death or disablement in service before retirement. The level of benefits provided depends on members’ length of service and their salary in the final years leading to retirement. The assets of the fund are held independently and administered by The Anglo Mauritius Assurance Society Ltd. The most recent actuarial valuation of the plan assets and the present value of the defined benefit obligations were carried out at 31 December 2017 by The Anglo Mauritius Assurance Society Ltd (Actuarial Valuer). The present value of the defined benefit obligations, and the related current service cost and past service cost, were measured using the Projected Unit Credit Method.
18. DEFERRED INCOME TAX (CONT’D)
notes to the financial statementsyear ended 31 December 2017
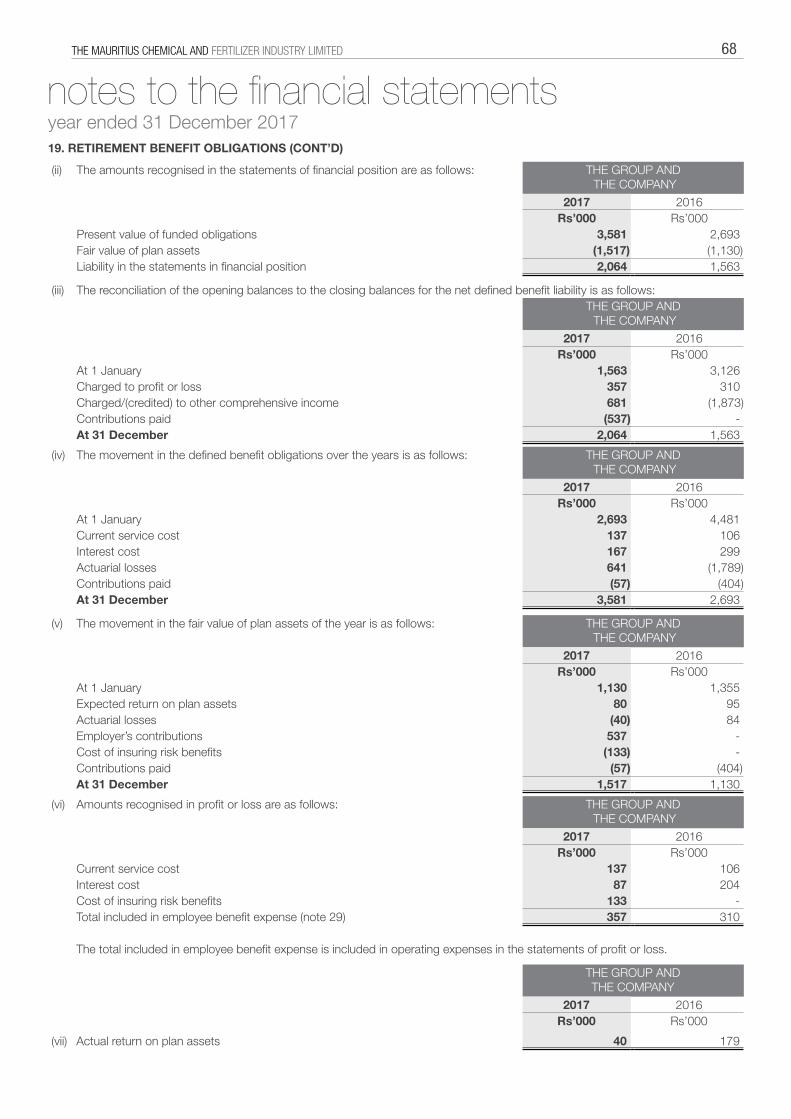
THE MAURITIUS CHEMICAL AND FERTILIZER INDUSTRY LIMITED 68
19. RETIREMENT BENEFIT OBLIGATIONS (CONT’D)
(ii) The amounts recognised in the statements of financial position are as follows: THE GROUP AND THE COMPANY
2017 2016Rs’000 Rs’000
Present value of funded obligations 3,581 2,693 Fair value of plan assets (1,517) (1,130)Liability in the statements in financial position 2,064 1,563
(iii) The reconciliation of the opening balances to the closing balances for the net defined benefit liability is as follows:THE GROUP AND THE COMPANY
2017 2016Rs’000 Rs’000
At 1 January 1,563 3,126 Charged to profit or loss 357 310 Charged/(credited) to other comprehensive income 681 (1,873)Contributions paid (537) - At 31 December 2,064 1,563
(iv) The movement in the defined benefit obligations over the years is as follows: THE GROUP AND THE COMPANY
2017 2016Rs’000 Rs’000
At 1 January 2,693 4,481 Current service cost 137 106 Interest cost 167 299 Actuarial losses 641 (1,789)Contributions paid (57) (404)At 31 December 3,581 2,693
(v) The movement in the fair value of plan assets of the year is as follows: THE GROUP AND THE COMPANY
2017 2016Rs’000 Rs’000
At 1 January 1,130 1,355 Expected return on plan assets 80 95 Actuarial losses (40) 84 Employer’s contributions 537 - Cost of insuring risk benefits (133) - Contributions paid (57) (404)At 31 December 1,517 1,130
(vi) Amounts recognised in profit or loss are as follows: THE GROUP AND THE COMPANY
2017 2016Rs’000 Rs’000
Current service cost 137 106 Interest cost 87 204 Cost of insuring risk benefits 133 - Total included in employee benefit expense (note 29) 357 310
The total included in employee benefit expense is included in operating expenses in the statements of profit or loss.
THE GROUP ANDTHE COMPANY
2017 2016Rs’000 Rs’000
(vii) Actual return on plan assets 40 179
notes to the financial statementsyear ended 31 December 2017
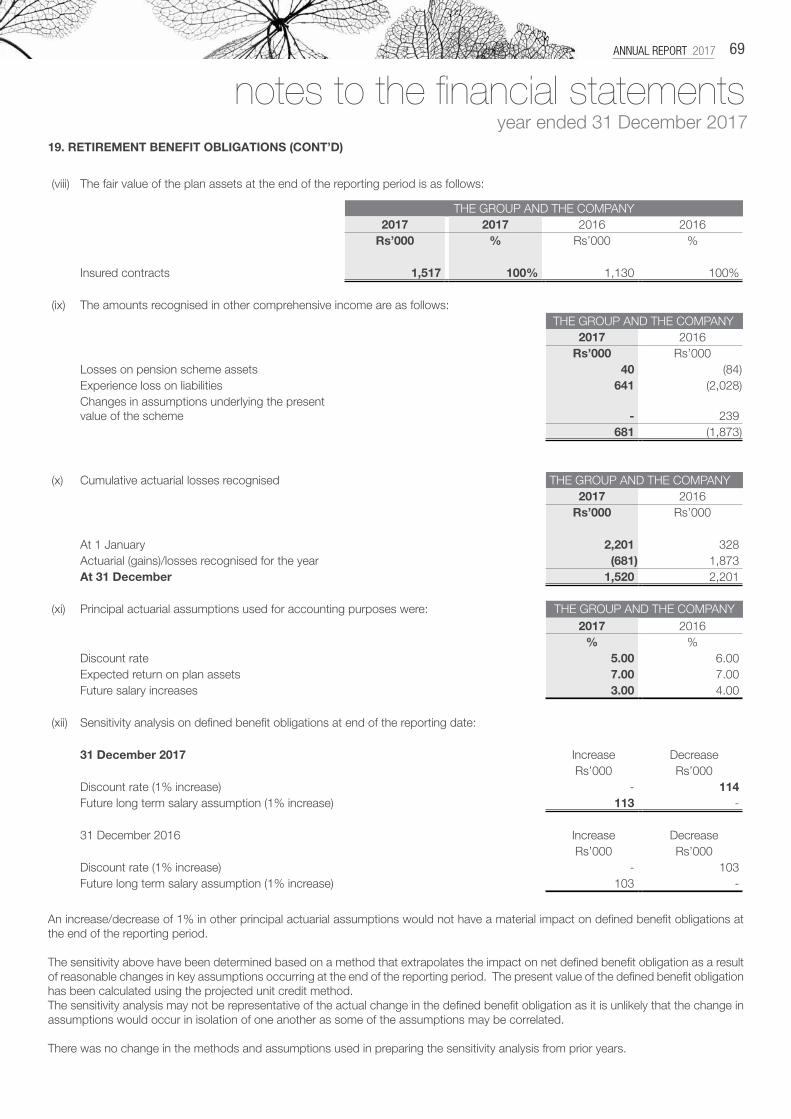
ANNUAL REPORT 2017 69
19. RETIREMENT BENEFIT OBLIGATIONS (CONT’D)
(viii) The fair value of the plan assets at the end of the reporting period is as follows:
THE GROUP AND THE COMPANY2017 2017 2016 2016
Rs’000 % Rs’000 %
Insured contracts 1,517 100% 1,130 100%
(ix) The amounts recognised in other comprehensive income are as follows: THE GROUP AND THE COMPANY
2017 2016Rs’000 Rs’000
Losses on pension scheme assets 40 (84)Experience loss on liabilities 641 (2,028)Changes in assumptions underlying the present value of the scheme - 239
681 (1,873)
(x) Cumulative actuarial losses recognised THE GROUP AND THE COMPANY2017 2016
Rs’000 Rs’000
At 1 January 2,201 328 Actuarial (gains)/losses recognised for the year (681) 1,873 At 31 December 1,520 2,201
(xi) Principal actuarial assumptions used for accounting purposes were: THE GROUP AND THE COMPANY2017 2016
% %Discount rate 5.00 6.00Expected return on plan assets 7.00 7.00Future salary increases 3.00 4.00
(xii) Sensitivity analysis on defined benefit obligations at end of the reporting date:
31 December 2017 Increase Decrease Rs’000 Rs’000
Discount rate (1% increase) - 114 Future long term salary assumption (1% increase) 113 -
31 December 2016 Increase Decrease Rs’000 Rs’000
Discount rate (1% increase) - 103 Future long term salary assumption (1% increase) 103 -
An increase/decrease of 1% in other principal actuarial assumptions would not have a material impact on defined benefit obligations at the end of the reporting period. The sensitivity above have been determined based on a method that extrapolates the impact on net defined benefit obligation as a result of reasonable changes in key assumptions occurring at the end of the reporting period. The present value of the defined benefit obligation has been calculated using the projected unit credit method. The sensitivity analysis may not be representative of the actual change in the defined benefit obligation as it is unlikely that the change in assumptions would occur in isolation of one another as some of the assumptions may be correlated. There was no change in the methods and assumptions used in preparing the sensitivity analysis from prior years.
notes to the financial statementsyear ended 31 December 2017
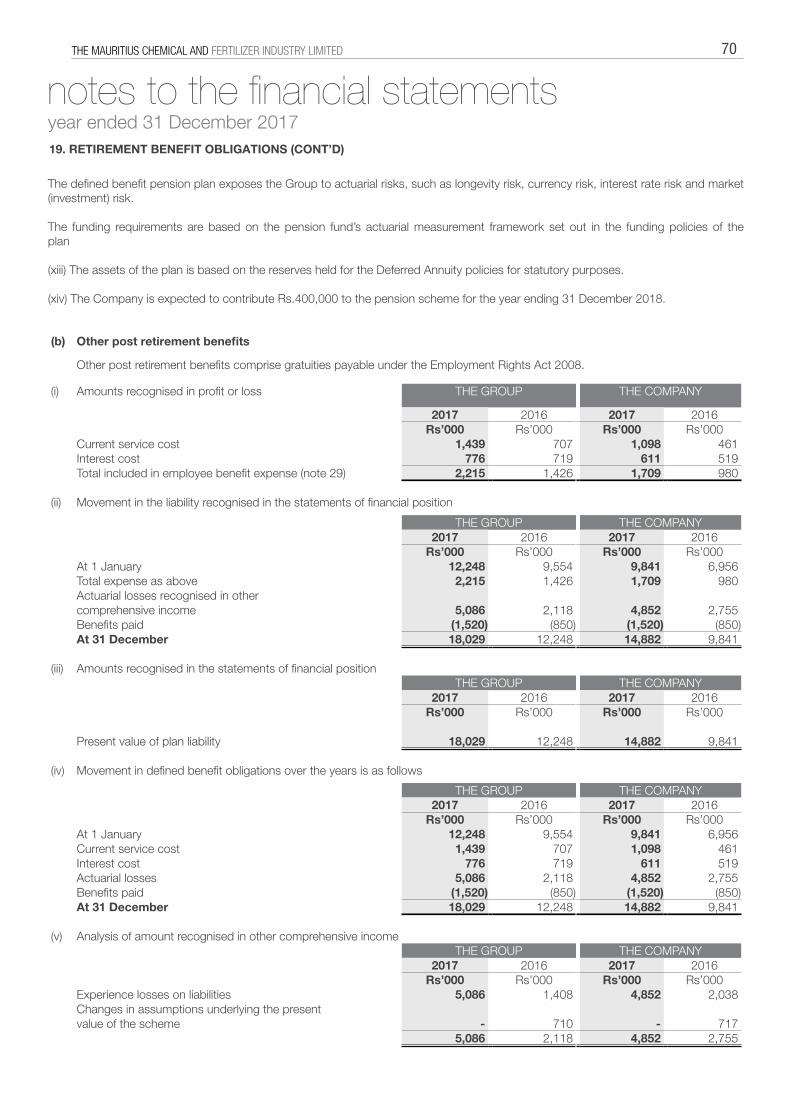
THE MAURITIUS CHEMICAL AND FERTILIZER INDUSTRY LIMITED 70
The defined benefit pension plan exposes the Group to actuarial risks, such as longevity risk, currency risk, interest rate risk and market (investment) risk. The funding requirements are based on the pension fund’s actuarial measurement framework set out in the funding policies of the plan
(xiii) The assets of the plan is based on the reserves held for the Deferred Annuity policies for statutory purposes. (xiv) The Company is expected to contribute Rs.400,000 to the pension scheme for the year ending 31 December 2018.
19. RETIREMENT BENEFIT OBLIGATIONS (CONT’D)
(b) Other post retirement benefits
Other post retirement benefits comprise gratuities payable under the Employment Rights Act 2008.
(i) Amounts recognised in profit or loss THE GROUP THE COMPANY
2017 2016 2017 2016Rs’000 Rs’000 Rs’000 Rs’000
Current service cost 1,439 707 1,098 461 Interest cost 776 719 611 519 Total included in employee benefit expense (note 29) 2,215 1,426 1,709 980
(ii) Movement in the liability recognised in the statements of financial position
THE GROUP THE COMPANY2017 2016 2017 2016
Rs’000 Rs’000 Rs’000 Rs’000At 1 January 12,248 9,554 9,841 6,956 Total expense as above 2,215 1,426 1,709 980 Actuarial losses recognised in other comprehensive income 5,086 2,118 4,852 2,755 Benefits paid (1,520) (850) (1,520) (850)At 31 December 18,029 12,248 14,882 9,841
(iii) Amounts recognised in the statements of financial position THE GROUP THE COMPANY
2017 2016 2017 2016Rs’000 Rs’000 Rs’000 Rs’000
Present value of plan liability 18,029 12,248 14,882 9,841
(iv) Movement in defined benefit obligations over the years is as follows
THE GROUP THE COMPANY2017 2016 2017 2016
Rs’000 Rs’000 Rs’000 Rs’000At 1 January 12,248 9,554 9,841 6,956 Current service cost 1,439 707 1,098 461 Interest cost 776 719 611 519 Actuarial losses 5,086 2,118 4,852 2,755 Benefits paid (1,520) (850) (1,520) (850)At 31 December 18,029 12,248 14,882 9,841
(v) Analysis of amount recognised in other comprehensive incomeTHE GROUP THE COMPANY
2017 2016 2017 2016Rs’000 Rs’000 Rs’000 Rs’000
Experience losses on liabilities 5,086 1,408 4,852 2,038 Changes in assumptions underlying the presentvalue of the scheme - 710 - 717
5,086 2,118 4,852 2,755
notes to the financial statementsyear ended 31 December 2017
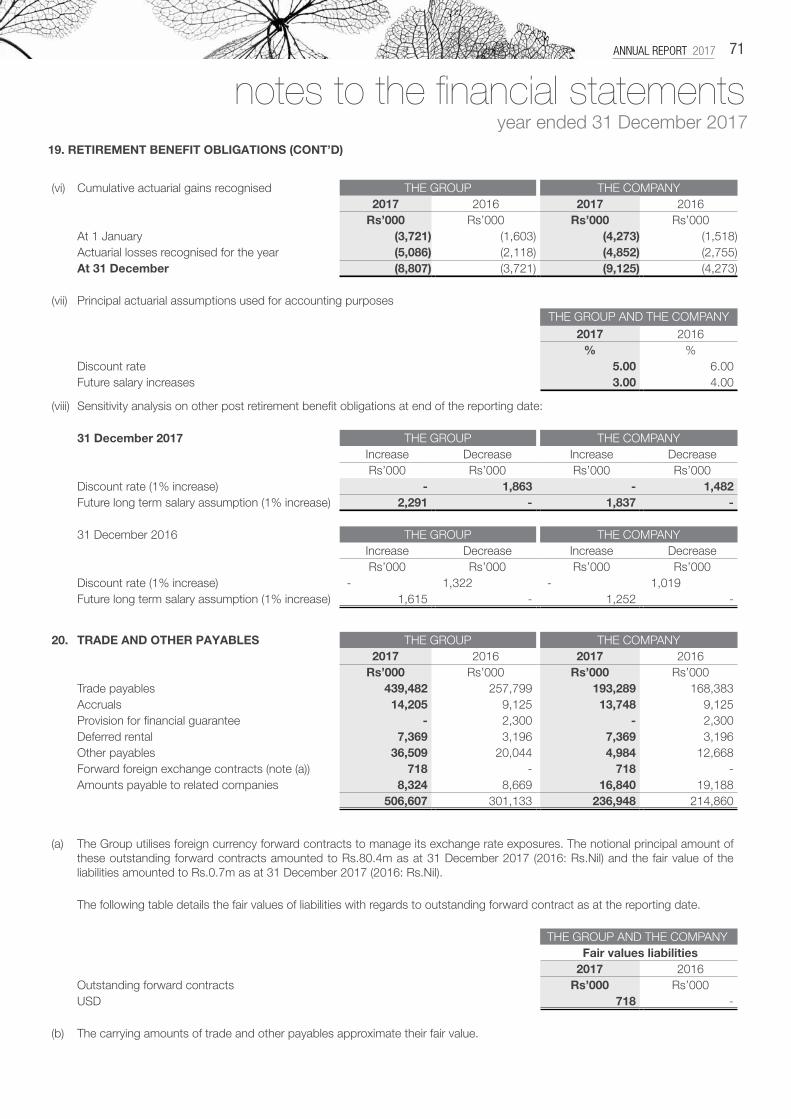
ANNUAL REPORT 2017 71
19. RETIREMENT BENEFIT OBLIGATIONS (CONT’D)
(vi) Cumulative actuarial gains recognised THE GROUP THE COMPANY2017 2016 2017 2016
Rs’000 Rs’000 Rs’000 Rs’000At 1 January (3,721) (1,603) (4,273) (1,518)Actuarial losses recognised for the year (5,086) (2,118) (4,852) (2,755)At 31 December (8,807) (3,721) (9,125) (4,273)
(vii) Principal actuarial assumptions used for accounting purposesTHE GROUP AND THE COMPANY
2017 2016% %
Discount rate 5.00 6.00Future salary increases 3.00 4.00
(viii) Sensitivity analysis on other post retirement benefit obligations at end of the reporting date:
31 December 2017 THE GROUP THE COMPANY Increase Decrease Increase Decrease Rs’000 Rs’000 Rs’000 Rs’000
Discount rate (1% increase) - 1,863 - 1,482 Future long term salary assumption (1% increase) 2,291 - 1,837 -
31 December 2016 THE GROUP THE COMPANY Increase Decrease Increase Decrease Rs’000 Rs’000 Rs’000 Rs’000
Discount rate (1% increase) - 1,322 - 1,019 Future long term salary assumption (1% increase) 1,615 - 1,252 -
20. TRADE AND OTHER PAYABLES THE GROUP THE COMPANY2017 2016 2017 2016
Rs’000 Rs’000 Rs’000 Rs’000Trade payables 439,482 257,799 193,289 168,383 Accruals 14,205 9,125 13,748 9,125 Provision for financial guarantee - 2,300 - 2,300 Deferred rental 7,369 3,196 7,369 3,196 Other payables 36,509 20,044 4,984 12,668 Forward foreign exchange contracts (note (a)) 718 - 718 - Amounts payable to related companies 8,324 8,669 16,840 19,188
506,607 301,133 236,948 214,860
(a) The Group utilises foreign currency forward contracts to manage its exchange rate exposures. The notional principal amount of these outstanding forward contracts amounted to Rs.80.4m as at 31 December 2017 (2016: Rs.Nil) and the fair value of the liabilities amounted to Rs.0.7m as at 31 December 2017 (2016: Rs.Nil).
The following table details the fair values of liabilities with regards to outstanding forward contract as at the reporting date.
THE GROUP AND THE COMPANY Fair values liabilities 2017 2016
Outstanding forward contracts Rs’000 Rs’000USD 718 -
(b) The carrying amounts of trade and other payables approximate their fair value.
notes to the financial statementsyear ended 31 December 2017
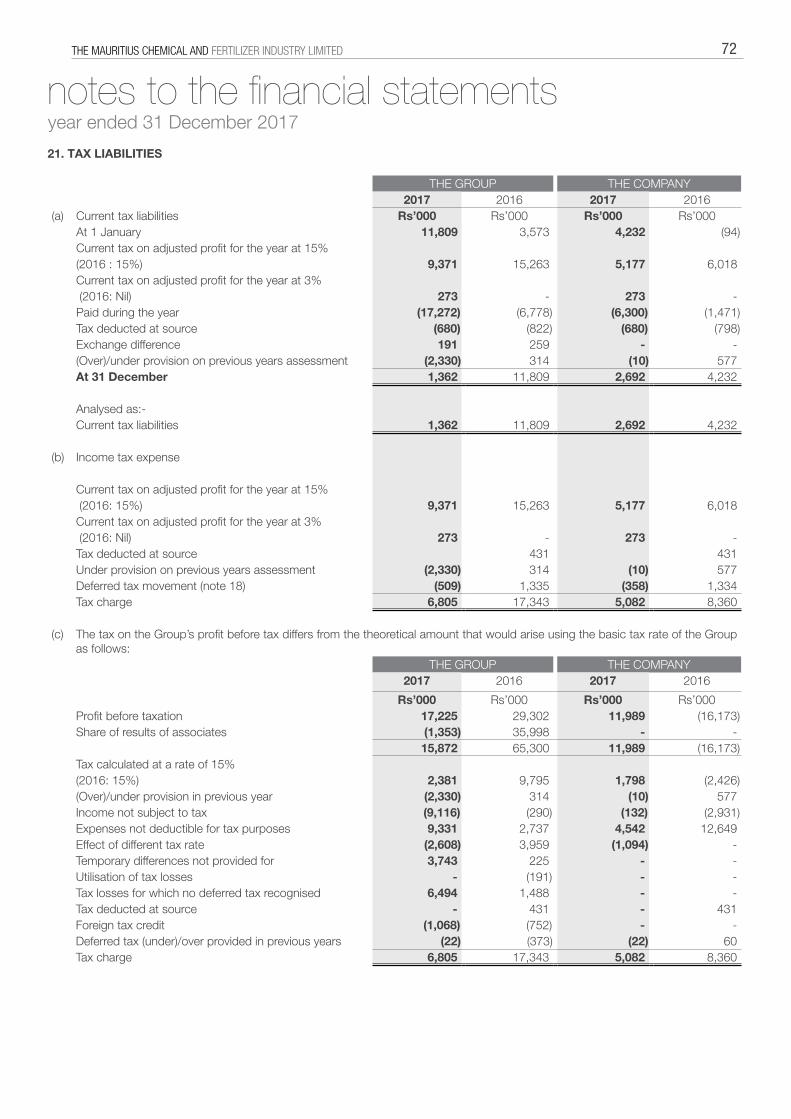
THE MAURITIUS CHEMICAL AND FERTILIZER INDUSTRY LIMITED 72
THE GROUP THE COMPANY2017 2016 2017 2016
(a) Current tax liabilities Rs’000 Rs’000 Rs’000 Rs’000At 1 January 11,809 3,573 4,232 (94)Current tax on adjusted profit for the year at 15%(2016 : 15%) 9,371 15,263 5,177 6,018 Current tax on adjusted profit for the year at 3% (2016: Nil) 273 - 273 - Paid during the year (17,272) (6,778) (6,300) (1,471)Tax deducted at source (680) (822) (680) (798)Exchange difference 191 259 - - (Over)/under provision on previous years assessment (2,330) 314 (10) 577 At 31 December 1,362 11,809 2,692 4,232
Analysed as:-Current tax liabilities 1,362 11,809 2,692 4,232
(b) Income tax expense
Current tax on adjusted profit for the year at 15% (2016: 15%) 9,371 15,263 5,177 6,018 Current tax on adjusted profit for the year at 3% (2016: Nil) 273 - 273 - Tax deducted at source 431 431 Under provision on previous years assessment (2,330) 314 (10) 577 Deferred tax movement (note 18) (509) 1,335 (358) 1,334 Tax charge 6,805 17,343 5,082 8,360
(c) The tax on the Group’s profit before tax differs from the theoretical amount that would arise using the basic tax rate of the Group as follows:
THE GROUP THE COMPANY2017 2016 2017 2016
Rs’000 Rs’000 Rs’000 Rs’000Profit before taxation 17,225 29,302 11,989 (16,173)Share of results of associates (1,353) 35,998 - -
15,872 65,300 11,989 (16,173)Tax calculated at a rate of 15%(2016: 15%) 2,381 9,795 1,798 (2,426)(Over)/under provision in previous year (2,330) 314 (10) 577 Income not subject to tax (9,116) (290) (132) (2,931)Expenses not deductible for tax purposes 9,331 2,737 4,542 12,649 Effect of different tax rate (2,608) 3,959 (1,094) - Temporary differences not provided for 3,743 225 - - Utilisation of tax losses - (191) - - Tax losses for which no deferred tax recognised 6,494 1,488 - - Tax deducted at source - 431 - 431 Foreign tax credit (1,068) (752) - - Deferred tax (under)/over provided in previous years (22) (373) (22) 60 Tax charge 6,805 17,343 5,082 8,360
21. TAX LIABILITIES
notes to the financial statementsyear ended 31 December 2017
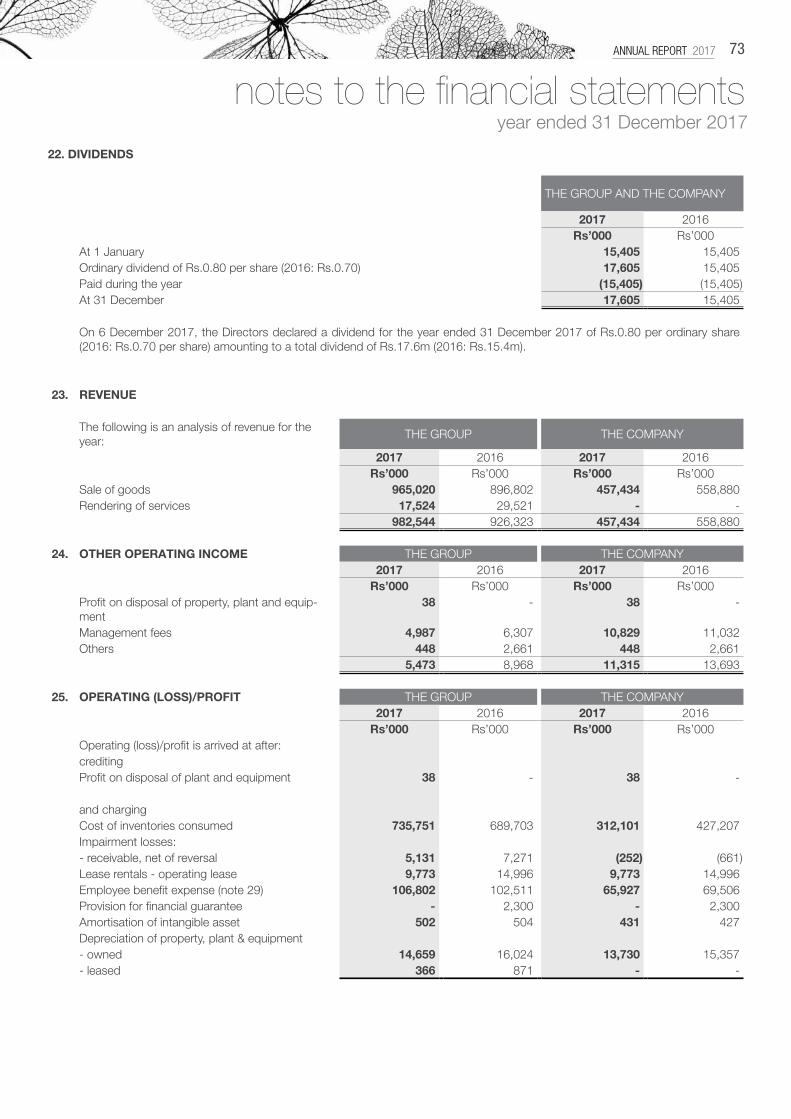
ANNUAL REPORT 2017 73
THE GROUP AND THE COMPANY
2017 2016Rs’000 Rs’000
At 1 January 15,405 15,405 Ordinary dividend of Rs.0.80 per share (2016: Rs.0.70) 17,605 15,405 Paid during the year (15,405) (15,405)At 31 December 17,605 15,405
On 6 December 2017, the Directors declared a dividend for the year ended 31 December 2017 of Rs.0.80 per ordinary share (2016: Rs.0.70 per share) amounting to a total dividend of Rs.17.6m (2016: Rs.15.4m).
23. REVENUE
The following is an analysis of revenue for the year:
THE GROUP THE COMPANY
2017 2016 2017 2016Rs’000 Rs’000 Rs’000 Rs’000
Sale of goods 965,020 896,802 457,434 558,880 Rendering of services 17,524 29,521 - -
982,544 926,323 457,434 558,880
24. OTHER OPERATING INCOME THE GROUP THE COMPANY2017 2016 2017 2016
Rs’000 Rs’000 Rs’000 Rs’000Profit on disposal of property, plant and equip-ment
38 - 38 -
Management fees 4,987 6,307 10,829 11,032 Others 448 2,661 448 2,661
5,473 8,968 11,315 13,693
25. OPERATING (LOSS)/PROFIT THE GROUP THE COMPANY2017 2016 2017 2016
Rs’000 Rs’000 Rs’000 Rs’000Operating (loss)/profit is arrived at after:creditingProfit on disposal of plant and equipment 38 - 38 -
and chargingCost of inventories consumed 735,751 689,703 312,101 427,207 Impairment losses:- receivable, net of reversal 5,131 7,271 (252) (661)Lease rentals - operating lease 9,773 14,996 9,773 14,996 Employee benefit expense (note 29) 106,802 102,511 65,927 69,506 Provision for financial guarantee - 2,300 - 2,300 Amortisation of intangible asset 502 504 431 427 Depreciation of property, plant & equipment- owned 14,659 16,024 13,730 15,357 - leased 366 871 - -
22. DIVIDENDS
notes to the financial statementsyear ended 31 December 2017
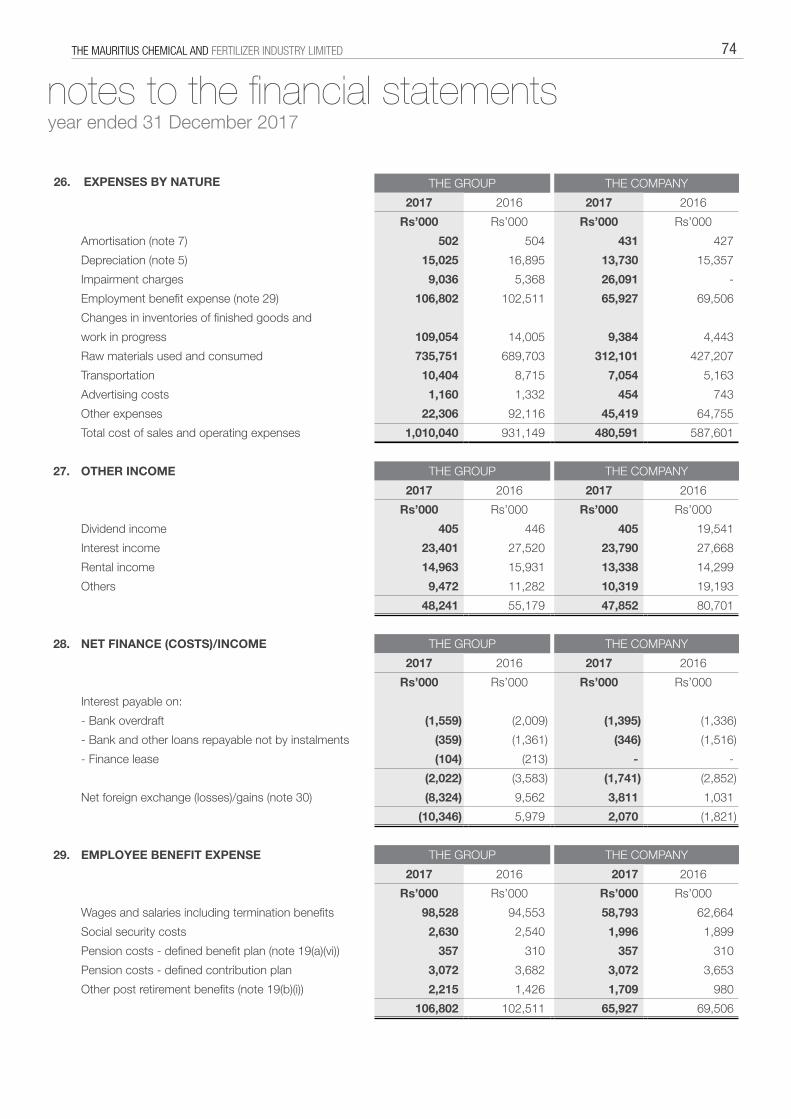
THE MAURITIUS CHEMICAL AND FERTILIZER INDUSTRY LIMITED 74
THE GROUP THE COMPANY
2017 2016 2017 2016
Rs’000 Rs’000 Rs’000 Rs’000
Amortisation (note 7) 502 504 431 427
Depreciation (note 5) 15,025 16,895 13,730 15,357
Impairment charges 9,036 5,368 26,091 -
Employment benefit expense (note 29) 106,802 102,511 65,927 69,506
Changes in inventories of finished goods and
work in progress 109,054 14,005 9,384 4,443
Raw materials used and consumed 735,751 689,703 312,101 427,207
Transportation 10,404 8,715 7,054 5,163
Advertising costs 1,160 1,332 454 743
Other expenses 22,306 92,116 45,419 64,755
Total cost of sales and operating expenses 1,010,040 931,149 480,591 587,601
27. OTHER INCOME THE GROUP THE COMPANY
2017 2016 2017 2016
Rs’000 Rs’000 Rs’000 Rs’000
Dividend income 405 446 405 19,541
Interest income 23,401 27,520 23,790 27,668
Rental income 14,963 15,931 13,338 14,299
Others 9,472 11,282 10,319 19,193
48,241 55,179 47,852 80,701
28. NET FINANCE (COSTS)/INCOME THE GROUP THE COMPANY
2017 2016 2017 2016
Rs’000 Rs’000 Rs’000 Rs’000
Interest payable on:
- Bank overdraft (1,559) (2,009) (1,395) (1,336)
- Bank and other loans repayable not by instalments (359) (1,361) (346) (1,516)
- Finance lease (104) (213) - -
(2,022) (3,583) (1,741) (2,852)
Net foreign exchange (losses)/gains (note 30) (8,324) 9,562 3,811 1,031
(10,346) 5,979 2,070 (1,821)
29. EMPLOYEE BENEFIT EXPENSE THE GROUP THE COMPANY
2017 2016 2017 2016
Rs’000 Rs’000 Rs’000 Rs’000
Wages and salaries including termination benefits 98,528 94,553 58,793 62,664
Social security costs 2,630 2,540 1,996 1,899
Pension costs - defined benefit plan (note 19(a)(vi)) 357 310 357 310
Pension costs - defined contribution plan 3,072 3,682 3,072 3,653
Other post retirement benefits (note 19(b)(i)) 2,215 1,426 1,709 980
106,802 102,511 65,927 69,506
26. EXPENSES BY NATURE
notes to the financial statementsyear ended 31 December 2017

ANNUAL REPORT 2017 75
The exchange differences credited/(charged) to profit or loss are included as follows:
THE GROUP THE COMPANY2017 2016 2017 2016
Rs’000 Rs’000 Rs’000 Rs’000Cost of sales 4,927 7,721 8,866 5,091 Other income (note 27) 5,554 (5,097) 7,336 3,294 Net finance (costs)/income (note 28) (8,324) 9,562 3,811 1,031
31. EARNINGS/(LOSS) PER SHARE THE GROUP THE COMPANY2017 2016 2017 2016
Net profit/(loss) attributable to equityholders of the Company (Rs’000) 10,420 11,959 6,907 (24,533)
Number of ordinary shares in issue (in thousands) 22,006 22,006 22,006 22,006
Earnings/(loss) per share (Rs.) 0.47 0.54 0.31 (1.11)
32. NOTES TO STATEMENTS OF CASH FLOWS THE GROUP THE COMPANY2017 2016 2017 2016
(a) Cash generated from operations Rs’000 Rs’000 Rs’000 Rs’000
Profit/(loss) before taxation 17,225 29,302 11,989 (16,173)
Depreciation 15,025 16,895 13,730 15,357
Amortisation 502 504 431 427
Exchange differences 16,760 (5,137) 3,739 1,843
Share of result of associates/joint venture (1,353) 35,998 - -
Retirement benefit obligations 515 886 9 440
Profit on disposal of property, plant and equipment (38) - (38) -
Increase in fair value of investment property (375) (13,611) - (13,920)
Provision for impairment of trade and other receivables 5,131 7,271 (252) (661)
Provision for impairment of inventories 639 1,341 600 1,161
Impairment loss on short term loan 1,000 - 1,000 -
Impairment loss on investment in joint venture - - - 25
Impairment loss on investment in associates - - - 68,000
Impairment loss on receivables - - 26,091 12,000
Impairment loss on inventories 876 - - -
Investment income (405) (446) (405) (19,541)
Interest income (23,401) (27,520) (23,790) (27,668)
Interest expense 2,022 3,583 1,741 2,852
Changes in working capital:
- inventories (160,966) 23,053 (59,226) 35,527
- trade and other receivables (144,210) (18,895) (95,743) 42,846
- trade and other payables 200,813 27,484 22,740 (12,715)
Cash (used in)/generated from operations (70,240) 80,708 (97,384) 89,800
30. NET FOREIGN EXCHANGE GAINS/(LOSSES)
notes to the financial statementsyear ended 31 December 2017
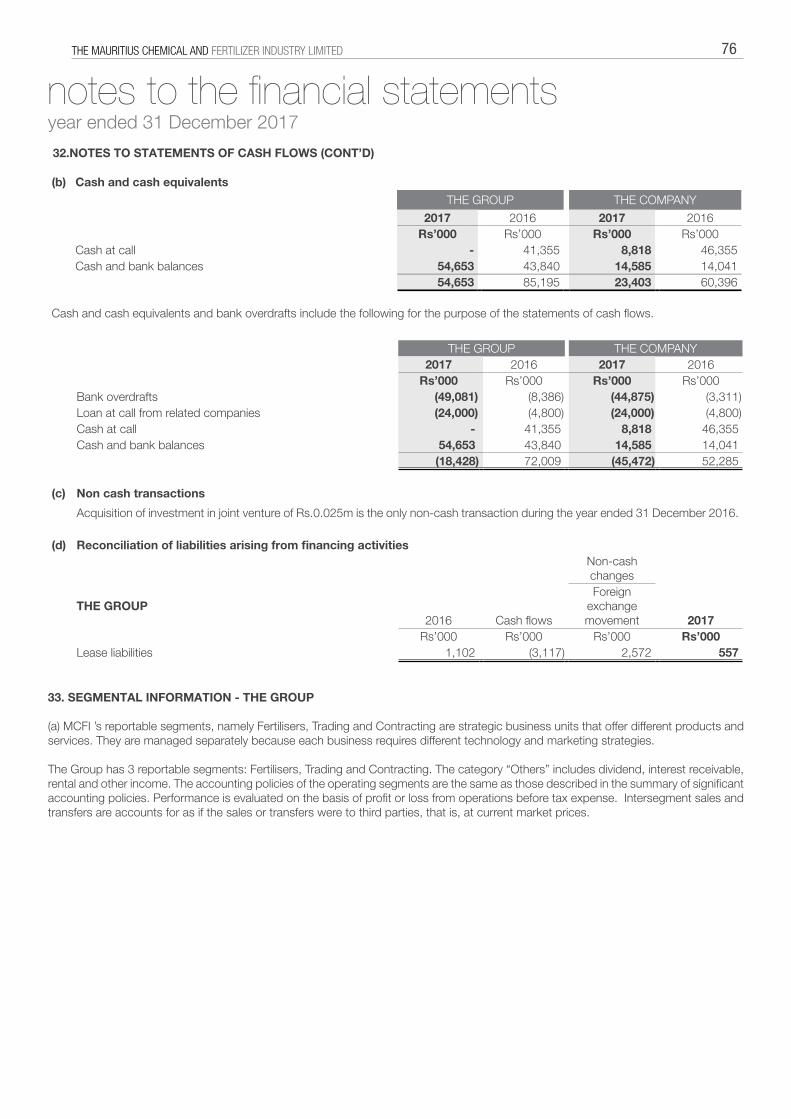
THE MAURITIUS CHEMICAL AND FERTILIZER INDUSTRY LIMITED 76
32.NOTES TO STATEMENTS OF CASH FLOWS (CONT’D)
(b) Cash and cash equivalents
THE GROUP THE COMPANY
2017 2016 2017 2016Rs’000 Rs’000 Rs’000 Rs’000
Cash at call - 41,355 8,818 46,355 Cash and bank balances 54,653 43,840 14,585 14,041
54,653 85,195 23,403 60,396
Cash and cash equivalents and bank overdrafts include the following for the purpose of the statements of cash flows.
THE GROUP THE COMPANY2017 2016 2017 2016
Rs’000 Rs’000 Rs’000 Rs’000Bank overdrafts (49,081) (8,386) (44,875) (3,311)Loan at call from related companies (24,000) (4,800) (24,000) (4,800)Cash at call - 41,355 8,818 46,355 Cash and bank balances 54,653 43,840 14,585 14,041
(18,428) 72,009 (45,472) 52,285
(c) Non cash transactions
Acquisition of investment in joint venture of Rs.0.025m is the only non-cash transaction during the year ended 31 December 2016.
(d) Reconciliation of liabilities arising from financing activitiesNon-cash changes
THE GROUP2016 Cash flows
Foreign exchange movement 2017
Rs’000 Rs’000 Rs’000 Rs’000Lease liabilities 1,102 (3,117) 2,572 557
33. SEGMENTAL INFORMATION - THE GROUP (a) MCFI ’s reportable segments, namely Fertilisers, Trading and Contracting are strategic business units that offer different products and services. They are managed separately because each business requires different technology and marketing strategies. The Group has 3 reportable segments: Fertilisers, Trading and Contracting. The category “Others” includes dividend, interest receivable, rental and other income. The accounting policies of the operating segments are the same as those described in the summary of significant accounting policies. Performance is evaluated on the basis of profit or loss from operations before tax expense. Intersegment sales and transfers are accounts for as if the sales or transfers were to third parties, that is, at current market prices.
notes to the financial statementsyear ended 31 December 2017
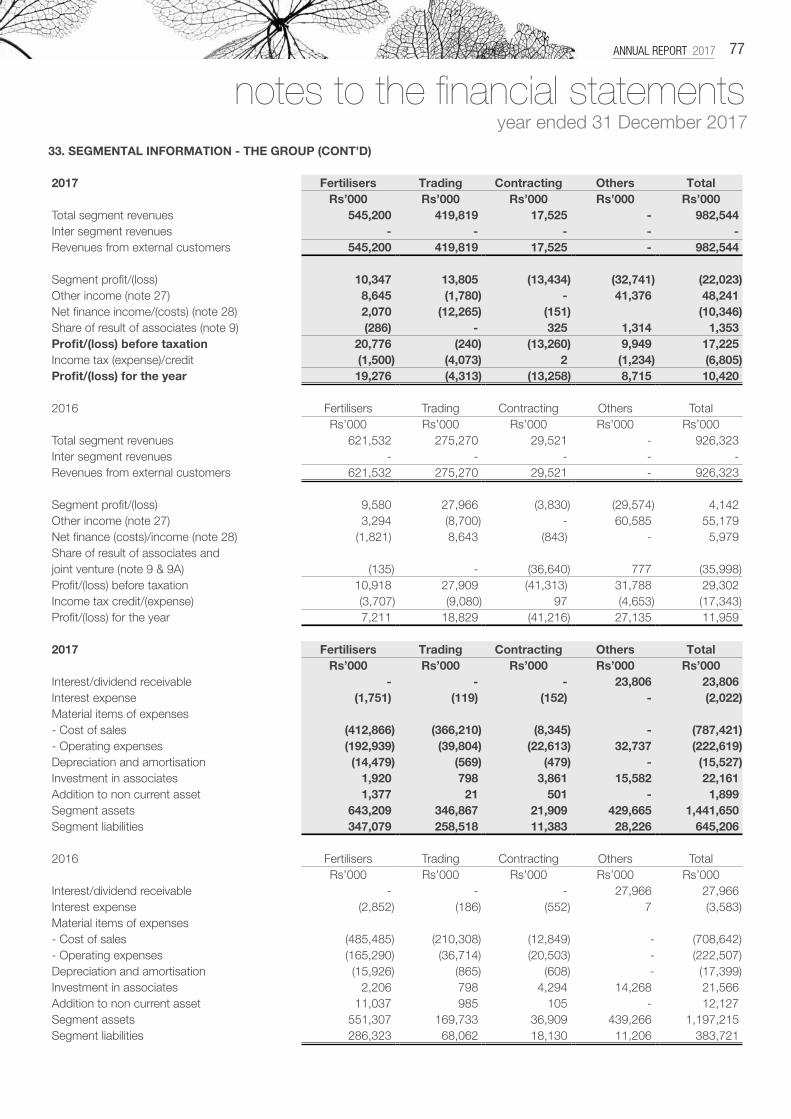
ANNUAL REPORT 2017 77
33. SEGMENTAL INFORMATION - THE GROUP (CONT’D)
2017 Fertilisers Trading Contracting Others TotalRs’000 Rs’000 Rs’000 Rs’000 Rs’000
Total segment revenues 545,200 419,819 17,525 - 982,544 Inter segment revenues - - - - - Revenues from external customers 545,200 419,819 17,525 - 982,544
Segment profit/(loss) 10,347 13,805 (13,434) (32,741) (22,023)Other income (note 27) 8,645 (1,780) - 41,376 48,241 Net finance income/(costs) (note 28) 2,070 (12,265) (151) (10,346)Share of result of associates (note 9) (286) - 325 1,314 1,353 Profit/(loss) before taxation 20,776 (240) (13,260) 9,949 17,225 Income tax (expense)/credit (1,500) (4,073) 2 (1,234) (6,805)Profit/(loss) for the year 19,276 (4,313) (13,258) 8,715 10,420
2016 Fertilisers Trading Contracting Others TotalRs’000 Rs’000 Rs’000 Rs’000 Rs’000
Total segment revenues 621,532 275,270 29,521 - 926,323 Inter segment revenues - - - - - Revenues from external customers 621,532 275,270 29,521 - 926,323
Segment profit/(loss) 9,580 27,966 (3,830) (29,574) 4,142 Other income (note 27) 3,294 (8,700) - 60,585 55,179 Net finance (costs)/income (note 28) (1,821) 8,643 (843) - 5,979 Share of result of associates and joint venture (note 9 & 9A) (135) - (36,640) 777 (35,998)Profit/(loss) before taxation 10,918 27,909 (41,313) 31,788 29,302 Income tax credit/(expense) (3,707) (9,080) 97 (4,653) (17,343)Profit/(loss) for the year 7,211 18,829 (41,216) 27,135 11,959
2017 Fertilisers Trading Contracting Others TotalRs’000 Rs’000 Rs’000 Rs’000 Rs’000
Interest/dividend receivable - - - 23,806 23,806 Interest expense (1,751) (119) (152) - (2,022)Material items of expenses- Cost of sales (412,866) (366,210) (8,345) - (787,421)- Operating expenses (192,939) (39,804) (22,613) 32,737 (222,619)Depreciation and amortisation (14,479) (569) (479) - (15,527)Investment in associates 1,920 798 3,861 15,582 22,161 Addition to non current asset 1,377 21 501 - 1,899 Segment assets 643,209 346,867 21,909 429,665 1,441,650 Segment liabilities 347,079 258,518 11,383 28,226 645,206
2016 Fertilisers Trading Contracting Others TotalRs’000 Rs’000 Rs’000 Rs’000 Rs’000
Interest/dividend receivable - - - 27,966 27,966 Interest expense (2,852) (186) (552) 7 (3,583)Material items of expenses- Cost of sales (485,485) (210,308) (12,849) - (708,642)- Operating expenses (165,290) (36,714) (20,503) - (222,507)Depreciation and amortisation (15,926) (865) (608) - (17,399)Investment in associates 2,206 798 4,294 14,268 21,566 Addition to non current asset 11,037 985 105 - 12,127 Segment assets 551,307 169,733 36,909 439,266 1,197,215 Segment liabilities 286,323 68,062 18,130 11,206 383,721
notes to the financial statementsyear ended 31 December 2017
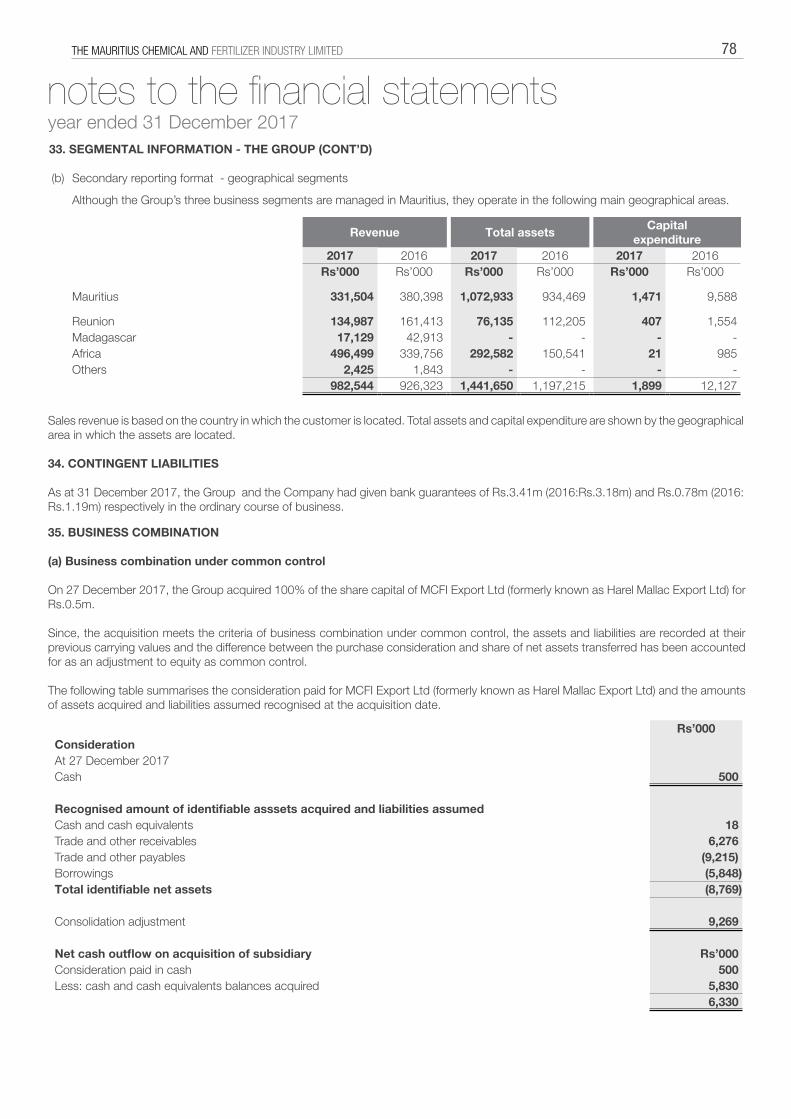
THE MAURITIUS CHEMICAL AND FERTILIZER INDUSTRY LIMITED 78
33. SEGMENTAL INFORMATION - THE GROUP (CONT’D)
(b) Secondary reporting format - geographical segments
Although the Group’s three business segments are managed in Mauritius, they operate in the following main geographical areas.
Revenue Total assetsCapital
expenditure2017 2016 2017 2016 2017 2016
Rs’000 Rs’000 Rs’000 Rs’000 Rs’000 Rs’000
Mauritius 331,504 380,398 1,072,933 934,469 1,471 9,588
Reunion 134,987 161,413 76,135 112,205 407 1,554 Madagascar 17,129 42,913 - - - - Africa 496,499 339,756 292,582 150,541 21 985 Others 2,425 1,843 - - - -
982,544 926,323 1,441,650 1,197,215 1,899 12,127
Sales revenue is based on the country in which the customer is located. Total assets and capital expenditure are shown by the geographical area in which the assets are located. 34. CONTINGENT LIABILITIES As at 31 December 2017, the Group and the Company had given bank guarantees of Rs.3.41m (2016:Rs.3.18m) and Rs.0.78m (2016: Rs.1.19m) respectively in the ordinary course of business.
35. BUSINESS COMBINATION (a) Business combination under common control On 27 December 2017, the Group acquired 100% of the share capital of MCFI Export Ltd (formerly known as Harel Mallac Export Ltd) for Rs.0.5m. Since, the acquisition meets the criteria of business combination under common control, the assets and liabilities are recorded at their previous carrying values and the difference between the purchase consideration and share of net assets transferred has been accounted for as an adjustment to equity as common control. The following table summarises the consideration paid for MCFI Export Ltd (formerly known as Harel Mallac Export Ltd) and the amounts of assets acquired and liabilities assumed recognised at the acquisition date.
Rs’000ConsiderationAt 27 December 2017Cash 500
Recognised amount of identifiable asssets acquired and liabilities assumedCash and cash equivalents 18 Trade and other receivables 6,276 Trade and other payables (9,215)Borrowings (5,848)Total identifiable net assets (8,769)
Consolidation adjustment 9,269
Net cash outflow on acquisition of subsidiary Rs’000Consideration paid in cash 500 Less: cash and cash equivalents balances acquired 5,830
6,330
notes to the financial statementsyear ended 31 December 2017
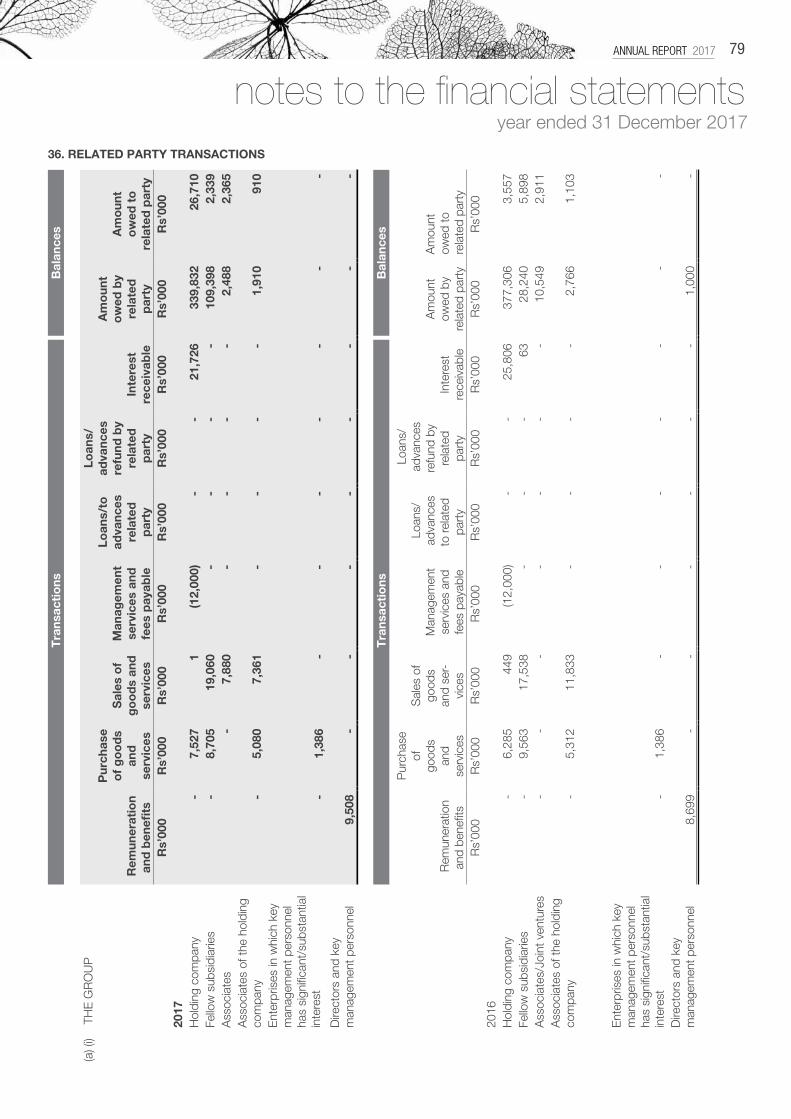
ANNUAL REPORT 2017 79 T
rans
acti
ons
B
alan
ces
(a) (
i) T
HE
GR
OU
P
Rem
uner
atio
n an
d b
enefi
ts
Pur
chas
e o
f g
oo
ds
and
se
rvic
es
Sal
es o
f g
oo
ds
and
se
rvic
es
Man
agem
ent
serv
ices
and
fe
es p
ayab
le
Loan
s/to
ad
vanc
es
rela
ted
par
ty
Loan
s/
adva
nces
re
fund
by
rela
ted
p
arty
Inte
rest
rece
ivab
le
Am
oun
t o
wed
by
rela
ted
p
arty
Am
oun
t o
wed
to
re
late
d p
arty
Rs’
000
Rs’
000
Rs’
000
Rs’
000
Rs’
000
Rs’
000
Rs’
000
Rs’
000
Rs’
000
2017
Hol
ding
com
pany
-
7,5
27
1
(12,
000)
-
-
21,
726
339
,832
2
6,71
0 Fe
llow
sub
sidi
arie
s -
8
,705
1
9,06
0 -
-
-
-
1
09,3
98
2,3
39
Ass
ocia
tes
-
7,8
80
-
-
-
-
2,4
88
2,3
65
Ass
ocia
tes
of th
e ho
ldin
g co
mpa
ny -
5
,080
7
,361
-
-
-
-
1
,910
9
10
Ent
erpr
ises
in w
hich
key
m
anag
emen
t per
sonn
el
has
sign
ifica
nt/s
ubst
antia
l in
tere
st -
1
,386
-
-
-
-
-
-
-
D
irect
ors
and
key
man
agem
ent p
erso
nnel
9,5
08
-
-
-
-
-
-
-
-
Tra
nsac
tio
ns
Bal
ance
s
Rem
uner
atio
n an
d be
nefit
s
Pur
chas
e of
go
ods
and
serv
ices
Sal
es o
f go
ods
and
ser-
vice
s
Man
agem
ent
ser
vice
s an
d fe
es p
ayab
le
Loa
ns/
adv
ance
s to
rela
ted
part
y
Loa
ns/
adv
ance
s re
fund
by
rela
ted
part
yIn
tere
stre
ceiv
able
Am
ount
owed
by
rela
ted
part
y
Am
ount
owed
tore
late
d pa
rty
Rs’
000
Rs’
000
Rs’
000
Rs’
000
Rs’
000
Rs’
000
Rs’
000
Rs’
000
Rs’
000
2016
Hol
ding
com
pany
-
6,2
85
449
(1
2,00
0) -
-
2
5,80
6 3
77,3
06
3,5
57
Fello
w s
ubsi
diar
ies
-
9,5
63
17,
538
-
-
-
63
28,
240
5,8
98
Ass
ocia
tes/
Join
t ven
ture
s -
-
-
-
-
-
-
1
0,54
9 2
,911
A
ssoc
iate
s of
the
hold
ing
com
pany
-
5,3
12
11,
833
-
-
-
-
2,7
66
1,1
03
Ent
erpr
ises
in w
hich
key
m
anag
emen
t per
sonn
el
has
sign
ifica
nt/s
ubst
antia
l in
tere
st -
1
,386
-
-
-
-
-
-
-
D
irect
ors
and
key
man
agem
ent p
erso
nnel
8,6
99
-
-
-
-
-
-
1,0
00
-
36. RELATED PARTY TRANSACTIONS
notes to the financial statementsyear ended 31 December 2017
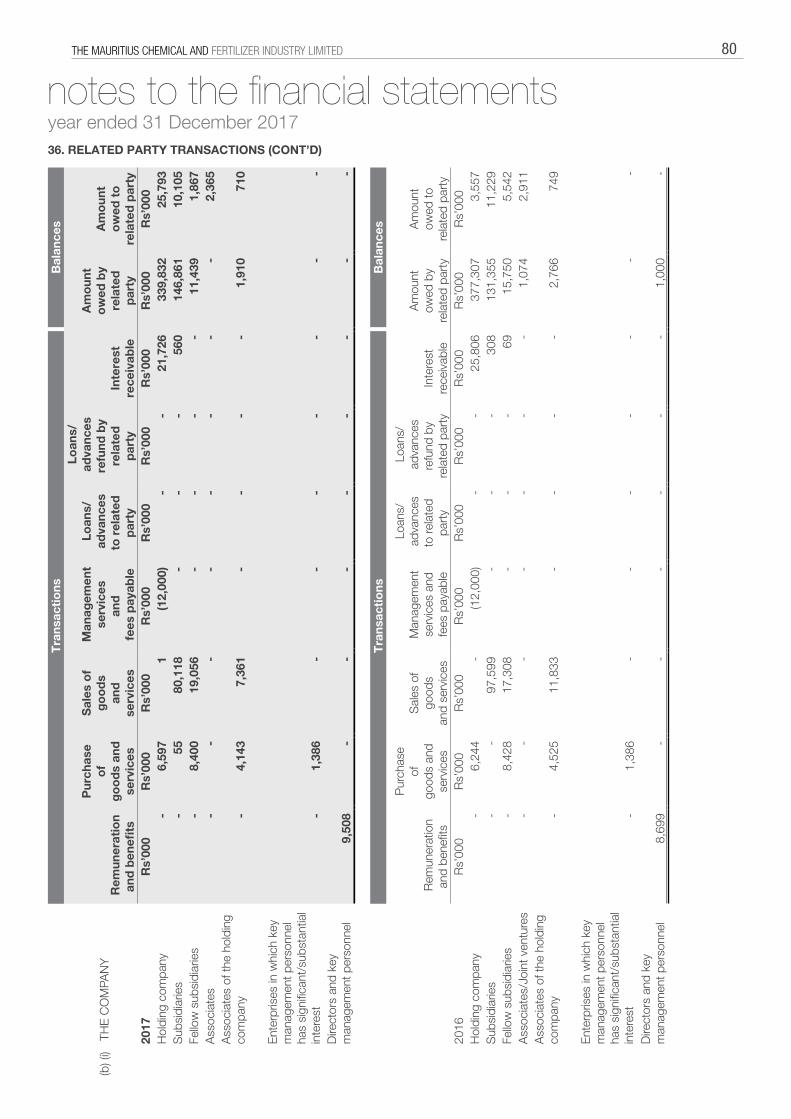
THE MAURITIUS CHEMICAL AND FERTILIZER INDUSTRY LIMITED 80 T
rans
acti
ons
B
alan
ces
Rem
uner
atio
n an
d b
enefi
ts
Pur
chas
e o
f g
oo
ds
and
serv
ices
Sal
es o
f g
oo
ds
and
se
rvic
es
Man
agem
ent
ser
vice
s an
d
fee
s p
ayab
le
Lo
ans/
a
dva
nces
to
rel
ated
par
ty
Lo
ans/
a
dva
nces
re
fund
by
rela
ted
p
arty
Inte
rest
rece
ivab
le
Am
oun
to
wed
by
rela
ted
p
arty
Am
oun
to
wed
to
rela
ted
par
ty
(b) (
i) T
HE
CO
MPA
NY
2017
Rs’
000
Rs’
000
Rs’
000
Rs’
000
Rs’
000
Rs’
000
Rs’
000
Rs’
000
Rs’
000
Hol
ding
com
pany
-
6,5
97
1
(12,
000)
-
-
21,
726
339
,832
2
5,79
3 S
ubsi
diar
ies
-
55
80,
118
-
-
-
560
1
46,8
61
10,
105
Fello
w s
ubsi
diar
ies
-
8,4
00
19,
056
-
-
-
-
11,
439
1,8
67
Ass
ocia
tes
-
-
-
-
-
-
-
-
2,3
65
Ass
ocia
tes
of th
e ho
ldin
g co
mpa
ny -
4
,143
7
,361
-
-
-
-
1
,910
7
10
Ent
erpr
ises
in w
hich
key
m
anag
emen
t per
sonn
el
has
sign
ifica
nt/s
ubst
antia
l in
tere
st -
1
,386
-
-
-
-
-
-
-
D
irect
ors
and
key
man
agem
ent p
erso
nnel
9,5
08
-
-
-
-
-
-
-
-
Tra
nsac
tio
ns
Bal
ance
s
Rem
uner
atio
n an
d be
nefit
s
Pur
chas
e of
go
ods
and
serv
ices
Sal
es o
f go
ods
and
serv
ices
Man
agem
ent
ser
vice
s an
d fe
es p
ayab
le
Loa
ns/
adv
ance
s to
rela
ted
part
y
Loa
ns/
adv
ance
s re
fund
by
rela
ted
part
yIn
tere
stre
ceiv
able
Am
ount
owed
by
rela
ted
part
y
Am
ount
owed
tore
late
d pa
rty
2016
Rs’
000
Rs’
000
Rs’
000
Rs’
000
Rs’
000
Rs’
000
Rs’
000
Rs’
000
Rs’
000
Hol
ding
com
pany
-
6,2
44
-
(12,
000)
-
-
25,
806
377
,307
3
,557
S
ubsi
diar
ies
-
-
97,
599
-
-
-
308
1
31,3
55
11,
229
Fello
w s
ubsi
diar
ies
-
8,4
28
17,
308
-
-
-
69
15,
750
5,5
42
Ass
ocia
tes/
Join
t ven
ture
s -
-
-
-
-
-
-
1
,074
2
,911
A
ssoc
iate
s of
the
hold
ing
com
pany
-
4,5
25
11,
833
-
-
-
-
2,7
66
749
Ent
erpr
ises
in w
hich
key
m
anag
emen
t per
sonn
el
has
sign
ifica
nt/s
ubst
antia
l in
tere
st -
1
,386
-
-
-
-
-
-
-
D
irect
ors
and
key
man
agem
ent p
erso
nnel
8,6
99
-
-
-
-
-
-
1,0
00
-
36. RELATED PARTY TRANSACTIONS (CONT’D)
notes to the financial statementsyear ended 31 December 2017
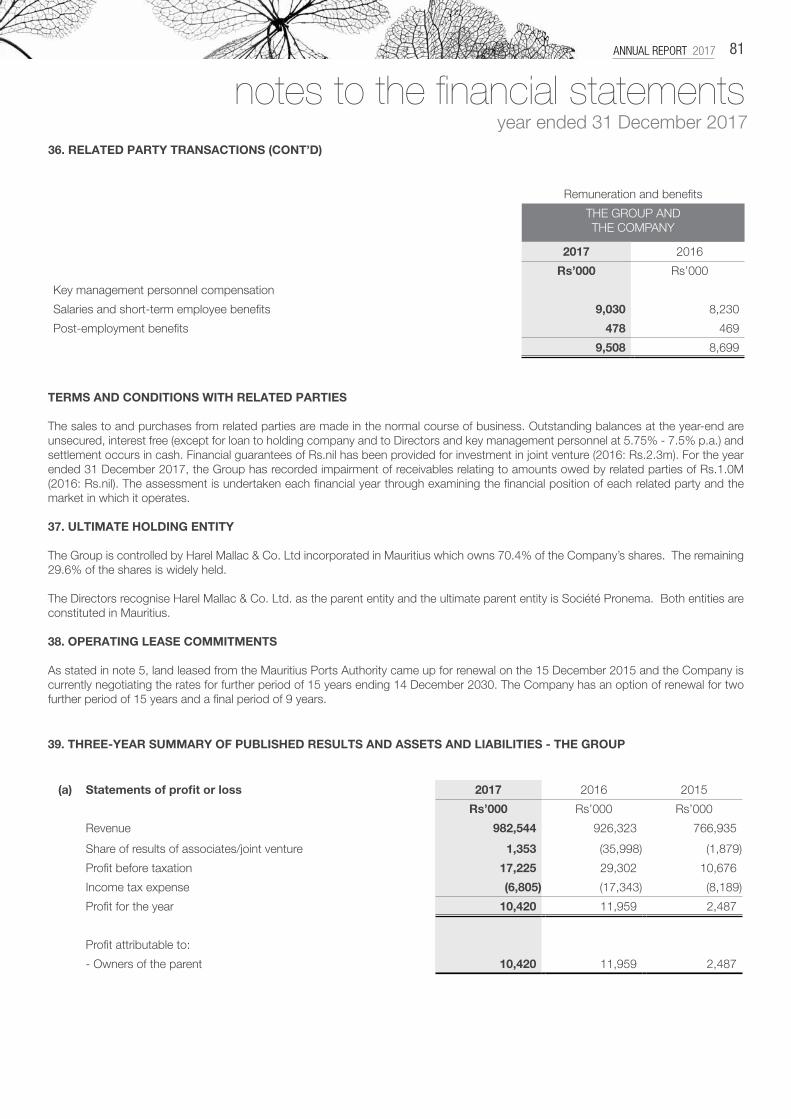
ANNUAL REPORT 2017 81
36. RELATED PARTY TRANSACTIONS (CONT’D)
Remuneration and benefits
THE GROUP ANDTHE COMPANY
2017 2016
Rs’000 Rs’000
Key management personnel compensation
Salaries and short-term employee benefits 9,030 8,230
Post-employment benefits 478 469
9,508 8,699
TERMS AND CONDITIONS WITH RELATED PARTIES The sales to and purchases from related parties are made in the normal course of business. Outstanding balances at the year-end are unsecured, interest free (except for loan to holding company and to Directors and key management personnel at 5.75% - 7.5% p.a.) and settlement occurs in cash. Financial guarantees of Rs.nil has been provided for investment in joint venture (2016: Rs.2.3m). For the year ended 31 December 2017, the Group has recorded impairment of receivables relating to amounts owed by related parties of Rs.1.0M (2016: Rs.nil). The assessment is undertaken each financial year through examining the financial position of each related party and the market in which it operates. 37. ULTIMATE HOLDING ENTITY The Group is controlled by Harel Mallac & Co. Ltd incorporated in Mauritius which owns 70.4% of the Company’s shares. The remaining 29.6% of the shares is widely held. The Directors recognise Harel Mallac & Co. Ltd. as the parent entity and the ultimate parent entity is Société Pronema. Both entities are constituted in Mauritius. 38. OPERATING LEASE COMMITMENTS As stated in note 5, land leased from the Mauritius Ports Authority came up for renewal on the 15 December 2015 and the Company is currently negotiating the rates for further period of 15 years ending 14 December 2030. The Company has an option of renewal for two further period of 15 years and a final period of 9 years.
(a) Statements of profit or loss 2017 2016 2015
Rs’000 Rs’000 Rs’000
Revenue 982,544 926,323 766,935
Share of results of associates/joint venture 1,353 (35,998) (1,879)
Profit before taxation 17,225 29,302 10,676
Income tax expense (6,805) (17,343) (8,189)
Profit for the year 10,420 11,959 2,487
Profit attributable to:
- Owners of the parent 10,420 11,959 2,487
39. THREE-YEAR SUMMARY OF PUBLISHED RESULTS AND ASSETS AND LIABILITIES - THE GROUP
notes to the financial statementsyear ended 31 December 2017
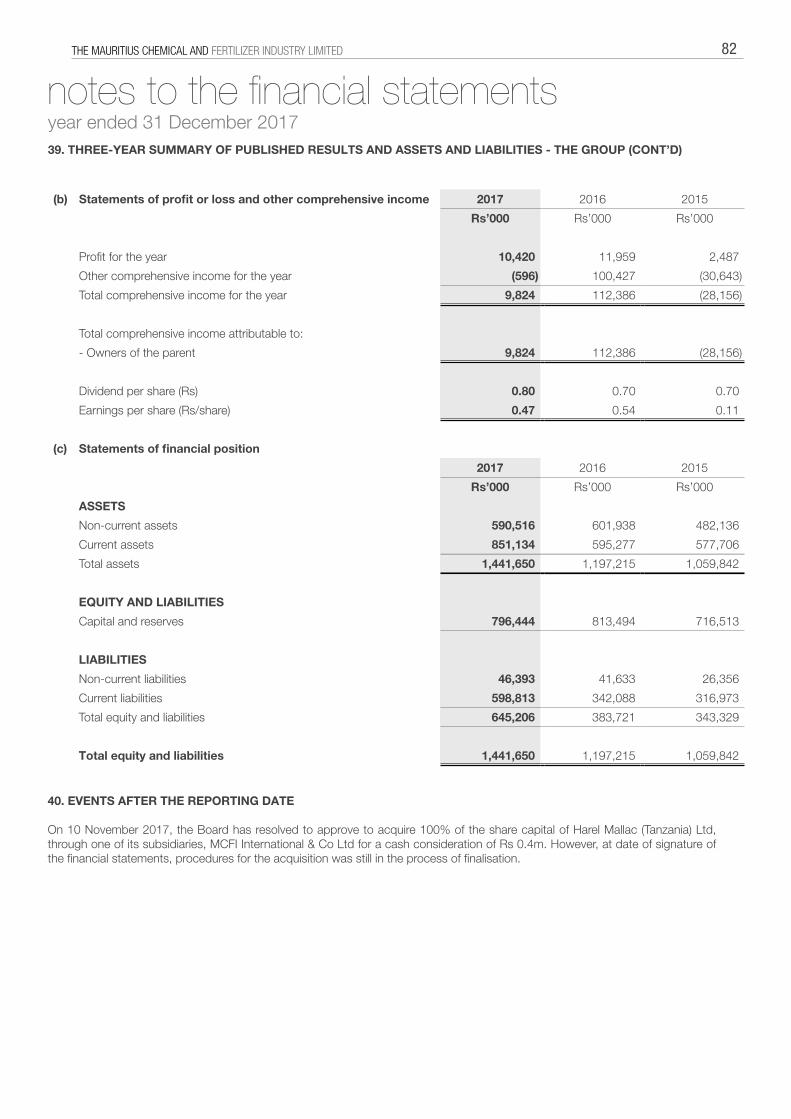
THE MAURITIUS CHEMICAL AND FERTILIZER INDUSTRY LIMITED 82
(b) Statements of profit or loss and other comprehensive income 2017 2016 2015
Rs’000 Rs’000 Rs’000
Profit for the year 10,420 11,959 2,487
Other comprehensive income for the year (596) 100,427 (30,643)
Total comprehensive income for the year 9,824 112,386 (28,156)
Total comprehensive income attributable to:
- Owners of the parent 9,824 112,386 (28,156)
Dividend per share (Rs) 0.80 0.70 0.70
Earnings per share (Rs/share) 0.47 0.54 0.11
(c) Statements of financial position
2017 2016 2015
Rs’000 Rs’000 Rs’000
ASSETS
Non-current assets 590,516 601,938 482,136
Current assets 851,134 595,277 577,706
Total assets 1,441,650 1,197,215 1,059,842
EQUITY AND LIABILITIES
Capital and reserves 796,444 813,494 716,513
LIABILITIES
Non-current liabilities 46,393 41,633 26,356
Current liabilities 598,813 342,088 316,973
Total equity and liabilities 645,206 383,721 343,329
Total equity and liabilities 1,441,650 1,197,215 1,059,842
40. EVENTS AFTER THE REPORTING DATE On 10 November 2017, the Board has resolved to approve to acquire 100% of the share capital of Harel Mallac (Tanzania) Ltd, through one of its subsidiaries, MCFI International & Co Ltd for a cash consideration of Rs 0.4m. However, at date of signature of the financial statements, procedures for the acquisition was still in the process of finalisation.
notes to the financial statementsyear ended 31 December 201739. THREE-YEAR SUMMARY OF PUBLISHED RESULTS AND ASSETS AND LIABILITIES - THE GROUP (CONT’D)