Embed Size (px)
Citation preview
CONTENTS: Physical and Thermodynamical Properties of Water Phases in Hardening Cement Paste Tommy B. Hansen ........................................................................................................... 1 Measurements of Water Vapour Adsorption Isotherms, Sorption Enthalpies and Sorption Entropies in Cement Bases Materials S. Lindmark, N. Markova, L. Wadsö ............................................................................. 17 Modelling of Moisture Isotherms Including Alkali Effects Jan-Erik Jonasson .......................................................................................................... 29 Specific Volume of Chemically Bound Water and Selfdessication in Silicafume and Portland Cement Based Mortars Bertil Persson ................................................................................................................ 51 Clinker Mineral Hydration at Reduced Relative Humidities Ole Mejlhede Jensen ...................................................................................................... 71 Effect of Temperature and Alkali Content on the Hydration of Selected Cementitious Systems Mette Geiker ................................................................................................................. 81 Measurements of the Degree of Hydration of Cement Paste by SEM, 29
Knut O. Kjellsen, Leif Fjällberg ..................................................................................... 89 Si NMR and XRD Methods
Hydration Characteristics of Mortars Anne-Marit Tønnesland, Per Fidjestöl .......................................................................... 103 Studies of Hydration and Drying in Cement Pastes by Scanning X-ray Absorptiometry Kurt Kielsgaard Hansen, Dale P. Bentz........................................................................ 111 Effect of the Sulphate Source and Content on Late Ettringite Formation Paula Raivio................................................................................................................ 119 Ninety-Month Pozzolanic Interaction Between Portland Cement and Silica Fume in Concrete Bertil Persson .............................................................................................................. 127 Texture and Chemistry of Historic Concrete Subjected to Prolonged Hydration Björn Lagerblad .......................................................................................................... 153 Influence of Water-Binding on the Ice Formation and Freeze/Thaw Damage in Cement Paste and Concrete Dirch H. Bager, Tommy B. Hansen ............................................................................. 161 Stability of Pore Size Distribution in Air-Entrained Concrete Subjected to Pumping Tommy B. Hansen ....................................................................................................... 175 CTS – A New Experimental Technique to Map Ice Formation Marianne Tange Jepsen ............................................................................................... 187 List of Participants .................................................................................................................... 191
1
PHYSICAL AND THERMODYNAMICAL PROPERTIES OF WATER PHASES IN HARDENING CEMENT PASTE
Tommy B. Hansen M.Sc., Industrial Ph.D. Student Aalborg Portland A/S Rørdalsvej 44, P.O Box 165, DK-9100 Aalborg E-mail: [email protected] ABSTRACT The article presents results linking the water phase distribution and microstructure in Hardening Cement Paste or HCP, with physical and thermodynamical properties of the dominant water phase. To at-tain this, several experimental techniques, including a newly devel-oped instrument: Differential Pressure Analysis, or DPA, are ap-plied to different cement pastes. The possibility of obtaining usable experimental estimates of thermodynamical parameters for the dominant water phase is illustrated. Experimentally estimated values of enthalpy and entropy as well as water phase distribution in ce-ment pastes at low water/powder ratio containing a significant amount of puzzolanic fillers are presented. The results indicate that curing temperature and cement type are the two most important fac-tors to the distribution and binding of evaporable water in the con-sidered type of HCP system. Key words: Water phases, Distribution, Thermodynamical proper-
ties, Curing conditions, Microstructure. 1. INTRODUCTION In concrete, the relation between physical properties such as compressive strength, elastic modulus, thermal dilations and resistance to chloride intrusion, and the content of evaporable water has long been recognised1. However, the relation between water phase distribution and microstructure of HCP is still not clear, the main problem being the complexity of the hardening cement paste system due to a large number of affecting factors. The present article deals with the effect of some of these factors on water phase distribution and microstructure. Another problem is determining the relation between water phase distribution and physical properties of the concrete experimentally. As this article will indicate, it is not sufficient to measure the amount of evaporable water and study the microstructure, and then correlate the findings to a certain physical behaviour of the concrete system. The physical structure of the hydrates and the chemical composition of the pore solution are of equal importance. There is presently insufficient understanding of the mechanisms involved, to allow investigation of the connection to concrete properties. The present article describes an experimental method that enables an acceptably accurate ex-perimental estimation of the enthalpy, HT, and entropy, ST, of the water phases as a function of
2
temperature, to give some idea of the mechanisms involved. Furthermore, results linking water phase distribution and microstructure to these estimates are presented and the implications dis-cussed. 2. CONSIDERED SYSTEM 2.1 Materials The following materials were used in the HCP mixes.
Table 1: Cement types used in the experiments. Both cements where specially ground for the analysis to a Blaine fines of 400 m2/kg.
Cement type C3S [%] C2S [%] C3A [%] C4AF [%] Total [%] White cement 61.7 24.9 4.5 0.9 92.0 Mineralised cement 63.0 10.0 8.0 11.0 92.0
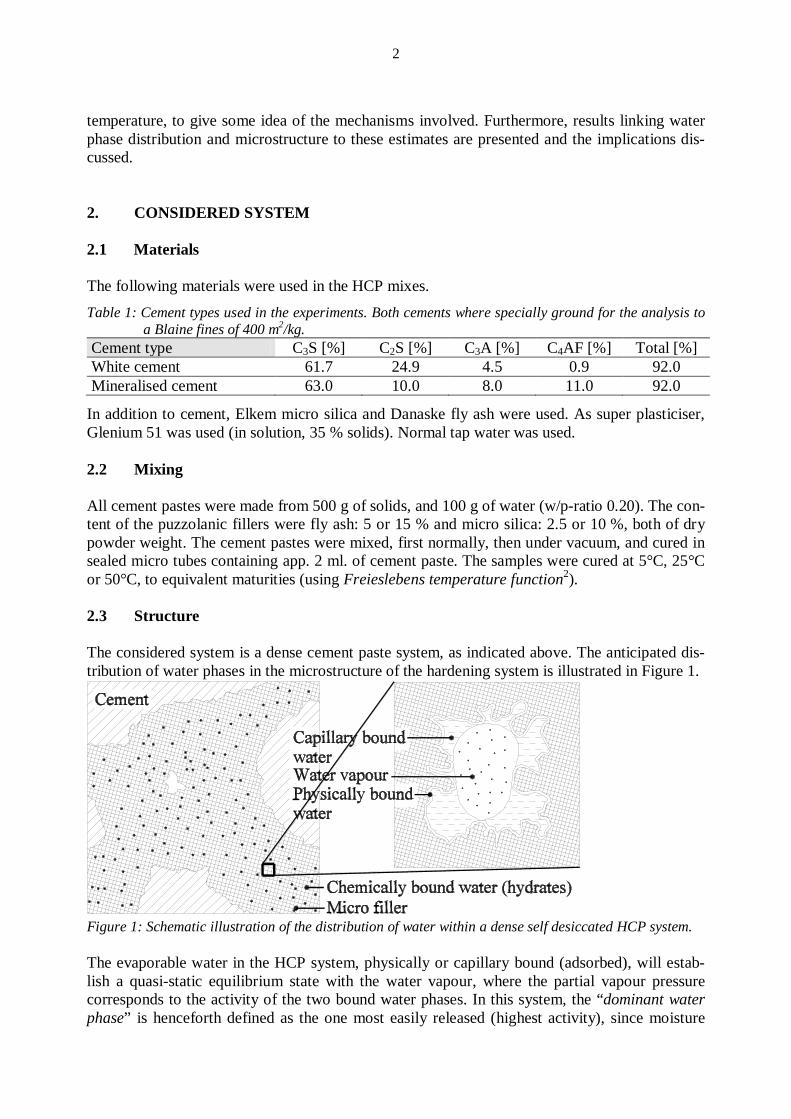
In addition to cement, Elkem micro silica and Danaske fly ash were used. As super plasticiser, Glenium 51 was used (in solution, 35 % solids). Normal tap water was used. 2.2 Mixing All cement pastes were made from 500 g of solids, and 100 g of water (w/p-ratio 0.20). The con-tent of the puzzolanic fillers were fly ash: 5 or 15 % and micro silica: 2.5 or 10 %, both of dry powder weight. The cement pastes were mixed, first normally, then under vacuum, and cured in sealed micro tubes containing app. 2 ml. of cement paste. The samples were cured at 5°C, 25°C or 50°C, to equivalent maturities (using Freieslebens temperature function2). 2.3 Structure The considered system is a dense cement paste system, as indicated above. The anticipated dis-tribution of water phases in the microstructure of the hardening system is illustrated in Figure 1.
Figure 1: Schematic illustration of the distribution of water within a dense self desiccated HCP system. The evaporable water in the HCP system, physically or capillary bound (adsorbed), will estab-lish a quasi-static equilibrium state with the water vapour, where the partial vapour pressure corresponds to the activity of the two bound water phases. In this system, the “dominant water phase” is henceforth defined as the one most easily released (highest activity), since moisture

3
transfer between bound and gaseous state will take place with this phase first. Hence in the sys-tem presented in Figure 1, the dominant water phase is primarily the capillary adsorbed water. 3. MEASURING ENTHALPY AND ENTROPY The instrument for experimental estimation of enthalpy and entropy is a so called DPA, or Dif-ferential Pressure Analysis instrument. The pressure vessel of the instrument is illustrated in Figure 2. It consists of a steel cylinder, with two chambers closed by pressure transducers (6.9 bar). In the base of the cylinder, three thermocouples are placed, to measure temperature. The steel cylinder is placed inside a copper cylinder entwined with resistance wire, providing heating in the interval 25-145°C. Thus, measurement result in combined values of vapour pres-sure over a reference and the sample as a function of temperature. The reference is de-ionised, de-aireated water, yielding a saturated water vapour curve superimposed upon the pressure of the entrapped air in the chamber. Prior to analysis of the results, the air pressure is deducted
from the signal using previ-ously measured air pressure curves, also including the deviations due to temperature dependency of the transduc-ers. To enhance precision, the two signals are used only to produce a relative humidity value. This is necessary be-cause it is very difficult to calibrate a pressure trans-ducer accurately over its en-tire pressure range. The rela-tive humidity value is then multiplied with the known saturated water vapour pres-sure at the considered tem-perature, giving a more sta-ble estimate of the partial water vapour pressure over the sample. This procedure gives an acceptable accuracy for thermodynamical estima-tions. These estimated (p,T) curves are henceforth re-ferred to as "measured curves", and an example us-ing water in both chambers is shown in Figure 3a. Meas-ured values appear identical to the standard data for water at the presented scale.
Figure 2: 3D cross section of the DPA instrument.
Pressure transducers
Sample
Reference (Water)
Thermo- couples
4
40 60 80 100 120 1400
1
2
3
4
T [°C]
p [Bar]
2.4 2.5 2.6 2.7 2.8 2.9 3 3.1 3.2 3.3 3.4
x10-3
-3
-2
-1
0
1
inv(T) [1/K]
ln(p) [Bar]
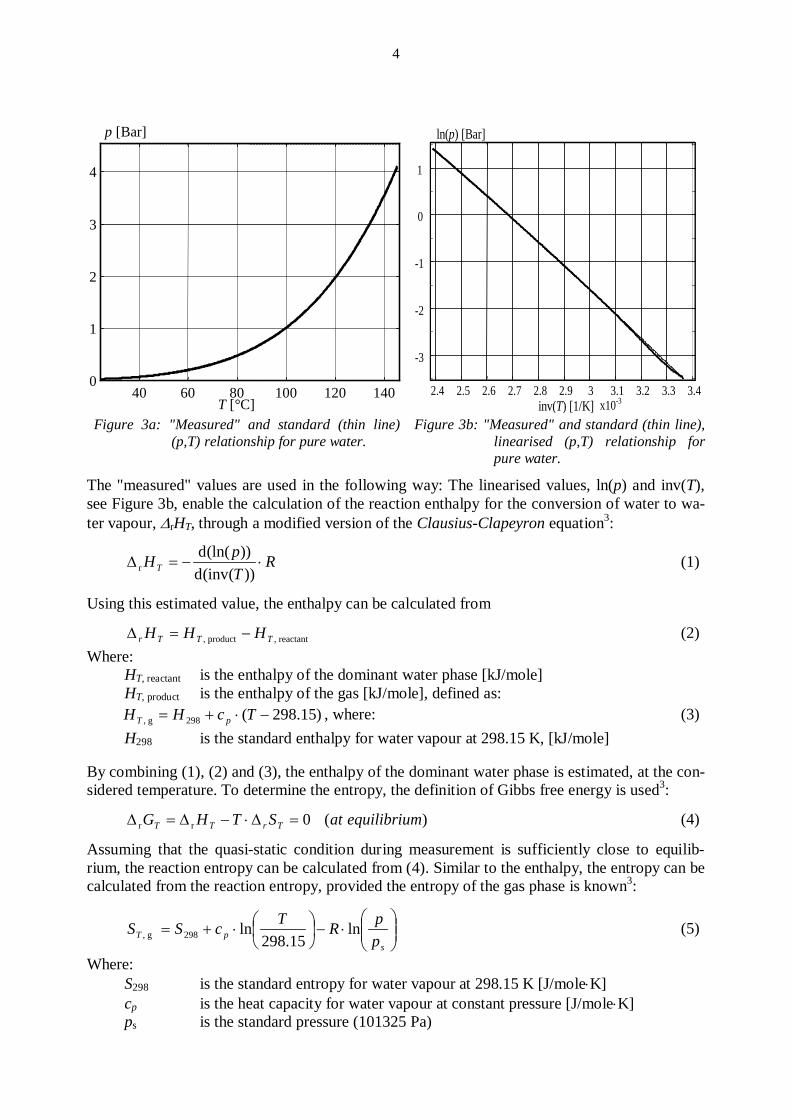
Figure 3a: "Measured" and standard (thin line)
(p,T) relationship for pure water. Figure 3b: "Measured" and standard (thin line),
linearised (p,T) relationship for pure water.
The "measured" values are used in the following way: The linearised values, ln(p) and inv(T), see Figure 3b, enable the calculation of the reaction enthalpy for the conversion of water to wa-ter vapour, ∆rHT, through a modified version of the Clausius-Clapeyron equation3:
RTpHT ⋅−=∆
))(inv(d))(ln(d
r (1)
Using this estimated value, the enthalpy can be calculated from
reactant,product, TTTr HHH −=∆ (2) Where: HT, reactant is the enthalpy of the dominant water phase [kJ/mole] HT, product is the enthalpy of the gas [kJ/mole], defined as: )15.298(298g, −⋅+= TcHH pT , where: (3) H298 is the standard enthalpy for water vapour at 298.15 K, [kJ/mole] By combining (1), (2) and (3), the enthalpy of the dominant water phase is estimated, at the con-sidered temperature. To determine the entropy, the definition of Gibbs free energy is used3:
)(0rr mequilibriuatSTHG TrTT =∆⋅−∆=∆ (4)
Assuming that the quasi-static condition during measurement is sufficiently close to equilib-rium, the reaction entropy can be calculated from (4). Similar to the enthalpy, the entropy can be calculated from the reaction entropy, provided the entropy of the gas phase is known3:
⋅−
⋅+=
spT p
pRTcSS ln15.298
ln298g, (5)
Where: S298 is the standard entropy for water vapour at 298.15 K [J/mole⋅K] cp is the heat capacity for water vapour at constant pressure [J/mole⋅K] ps is the standard pressure (101325 Pa)
5
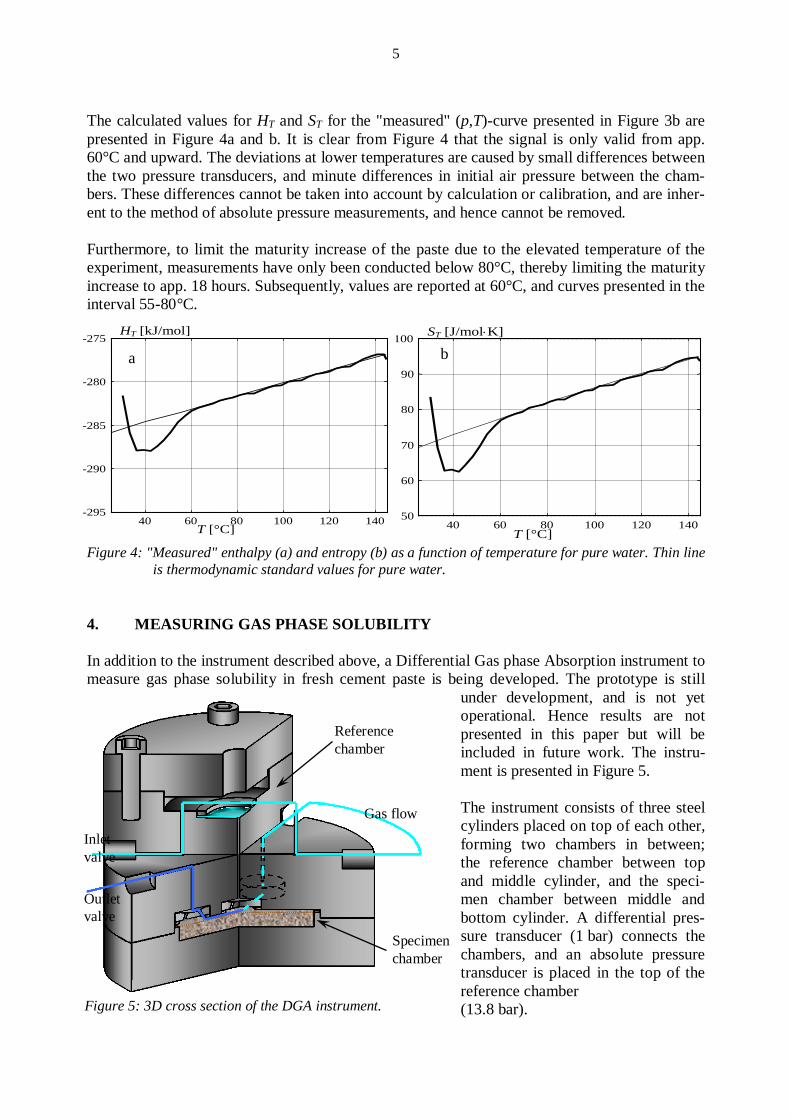
The calculated values for HT and ST for the "measured" (p,T)-curve presented in Figure 3b are presented in Figure 4a and b. It is clear from Figure 4 that the signal is only valid from app. 60°C and upward. The deviations at lower temperatures are caused by small differences between the two pressure transducers, and minute differences in initial air pressure between the cham-bers. These differences cannot be taken into account by calculation or calibration, and are inher-ent to the method of absolute pressure measurements, and hence cannot be removed. Furthermore, to limit the maturity increase of the paste due to the elevated temperature of the experiment, measurements have only been conducted below 80°C, thereby limiting the maturity increase to app. 18 hours. Subsequently, values are reported at 60°C, and curves presented in the interval 55-80°C.
40 60 80 100 120 140-295
-290
-285
-280
-275
T [°C]
HT [kJ/mol]
40 60 80 100 120 140
50
60
70
80
90
100
T [°C]
ST [J/mol⋅K]
Figure 4: "Measured" enthalpy (a) and entropy (b) as a function of temperature for pure water. Thin line is thermodynamic standard values for pure water.
4. MEASURING GAS PHASE SOLUBILITY In addition to the instrument described above, a Differential Gas phase Absorption instrument to measure gas phase solubility in fresh cement paste is being developed. The prototype is still
under development, and is not yet operational. Hence results are not presented in this paper but will be included in future work. The instru-ment is presented in Figure 5. The instrument consists of three steel cylinders placed on top of each other, forming two chambers in between; the reference chamber between top and middle cylinder, and the speci-men chamber between middle and bottom cylinder. A differential pres-sure transducer (1 bar) connects the chambers, and an absolute pressure transducer is placed in the top of the reference chamber (13.8 bar).
Figure 5: 3D cross section of the DGA instrument.
a b
Reference chamber
Inlet valve
Outlet valve
Gas flow
Specimen chamber
6
A cement paste sample is cast directly into the specimen chamber, and the instrument is closed, sealing the joints between the cylinders tight to prevent gas leakage. The instrument is flushed with pure N2 gas, until the system contains N2 only. The outlet valve is then closed, and pressure increased to app. 10 bar, and the remaining valves closed. The water in the fresh HCP absorbs some of the gas in the specimen chamber, resulting in a re-duced pressure. Since no gas is removed from the reference chamber, this is registered as a dif-ferential pressure by the differential pressure transducer. This differential pressure may then be used in the following way3:
( ) ( )RT
ppVnn
nRTpV
1212
−⋅=−
⇒= (6)
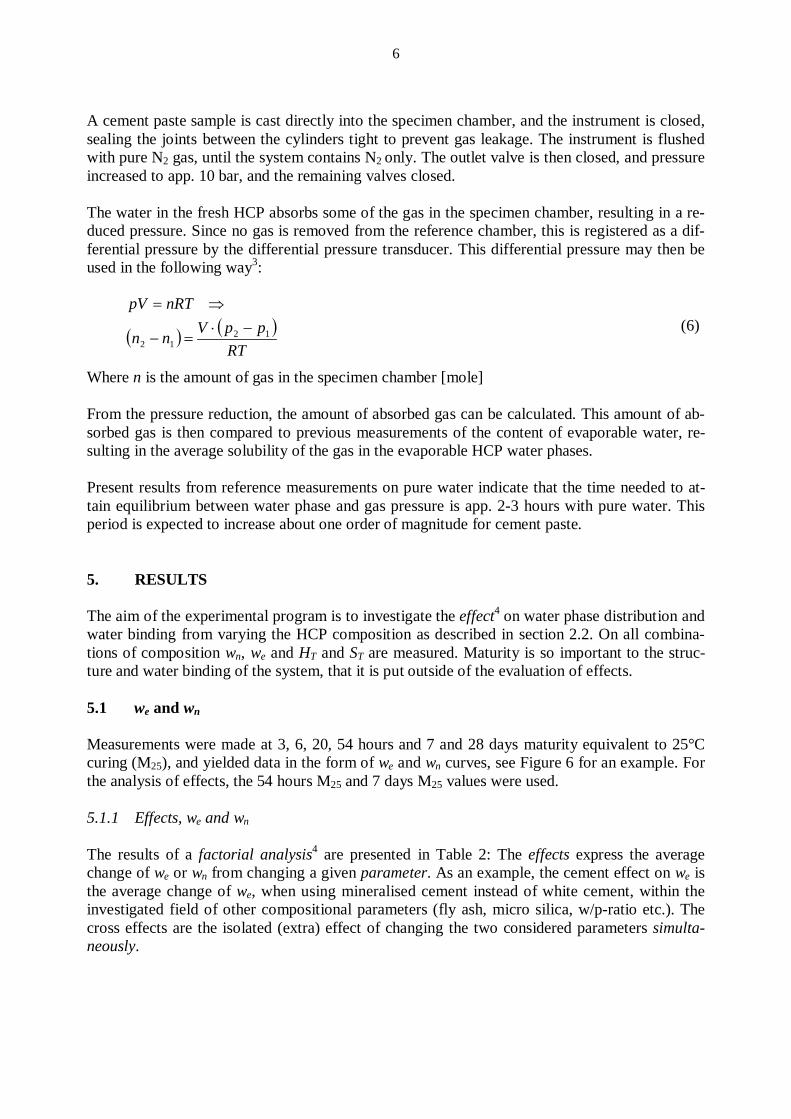
Where n is the amount of gas in the specimen chamber [mole] From the pressure reduction, the amount of absorbed gas can be calculated. This amount of ab-sorbed gas is then compared to previous measurements of the content of evaporable water, re-sulting in the average solubility of the gas in the evaporable HCP water phases. Present results from reference measurements on pure water indicate that the time needed to at-tain equilibrium between water phase and gas pressure is app. 2-3 hours with pure water. This period is expected to increase about one order of magnitude for cement paste. 5. RESULTS The aim of the experimental program is to investigate the effect4 on water phase distribution and water binding from varying the HCP composition as described in section 2.2. On all combina-tions of composition wn, we and HT and ST are measured. Maturity is so important to the struc-ture and water binding of the system, that it is put outside of the evaluation of effects. 5.1 we and wn Measurements were made at 3, 6, 20, 54 hours and 7 and 28 days maturity equivalent to 25°C curing (M25), and yielded data in the form of we and wn curves, see Figure 6 for an example. For the analysis of effects, the 54 hours M25 and 7 days M25 values were used. 5.1.1 Effects, we and wn The results of a factorial analysis4 are presented in Table 2: The effects express the average change of we or wn from changing a given parameter. As an example, the cement effect on we is the average change of we, when using mineralised cement instead of white cement, within the investigated field of other compositional parameters (fly ash, micro silica, w/p-ratio etc.). The cross effects are the isolated (extra) effect of changing the two considered parameters simulta-neously.
7
1 10 100
14
16
18
20
22
M25 [hours]
we [%/g ignited]5°C25°C50°C
1 10 100
0
2
4
6
8
10
M25 [hours]
wn [%/g ignited]
5°C25°C50°C
Figure 6: Measured contents of we (left) and wn (right) at three different temperatures. The HCP con-
tains 85 % mineralised cement, 5 % fly ash, 10 % micro silica. Table 2: Statistical main and 1. order cross effects of the investigated parameters. The significance
levels were we: ±0.21% at 54 hours and ±0.19% at 7 days, and wn: ±0.17% at 54 hours and ±0.15% at 7 days."-" Indicate that the effect is below the significance level.
Effect [%/g ign.]
C FA MS T C×FA C×MS C×T FA×MS FA×T MS×T
we 54H - 0.29 1.62 -0.64 - -0.40 -0.44 - - 0.30 7D - 0.53 1.80 -0.84 -0.29 - - -0.63 0.41 0.40
wn 54H - -0.33 - 0.27 -0.19 0.25 0.60 - - -0.33 7D - -0.56 - 0.62 0.30 - 0.26 - -0.33 -0.43
The average value of we was 15.02 % at 54 hours and 14.35 % at 7 days and of wn was 8.39 % at 54 hours and 9.39 % at 7 days, all values pr. g. ignited weight. From Table 2 it is obvious, that some parameters are more important to the water phase distribution than other. For instance, under the given compositional and curing related conditions, water phase distribution is inde-pendent of cement type. Other parameters give inconsistent effects (e.g. C×FA). The large in-crease in evaporable water due to increased micro silica content without a corresponding reduc-tion in chemically bound water cannot be explained at the moment. The consistent factors con-cerning water phase distribution within the investigated area are:
• Fly Ash, FA, reducing the amount of chemically bound water • Temperature, T, increasing the amount of chemically bound water • The combined, isolated effect of changing cement type and increasing temperature simulta-
neously, C×T, increasing the amount of chemically bound water. • The combined, isolated effect of increasing micro silica content and increasing temperature
simultaneously, MS×T, reducing the amount of chemically bound water. 5.1.2 Evaluation of we and wn effects. Fly ash reduces the amount of chemically bound water, which is hardly surprising considering the maturity of the HCP system; the powder substitutes a certain amount of cement, reducing the potential amount of hydrates formed.

8
That temperatures increase the amount of chemically bound water at early ages was ex-pected5,6,7,8. However, the amount of chemically bound water is highly dependent on the type of system and the curing conditions applied, and stating that temperature would have a certain gen-eral effect under varying conditions could be erroneous. The values for the combined effect of cement and temperature indicates that cement with a higher C3A content is more sensitive to temperature changes, which is hardly surprising9. The same may be said about the combined effect of micro silica and temperature, as micro silica is known to have an activation energy with a temperature dependency several times that of cement. Hence, at higher temperatures, the puzzolanic reaction is initiated earlier, and produces hydrates that densify the HCP. This densification reduces the accessibility of water to the cement grains, and induces a diffusion controlled hydration state much earlier than would otherwise have been the case. Since the puzzolanic reaction is – if not completely, then very near to – water neutral, this will be observed as a reduced amount of chemically bound water at a given maturity. 5.2 HT and ST Two sets of "measured" curves obtained with HCP’s are presented in Figure 7.
55 60 65 70 75 80-290-289-288-287-286-285-284-283-282-281-280
T [°C]
HT [kJ/mole]
Pure water, standard values
55 60 65 70 75 8055
60
65
70
75
80
85
T [°C]
ST [J/mole⋅K]
Figure 7: "Measured" enthalpy and entropy as a function of temperature for 54 hours maturity (thin
line) and 7 days maturity (thick line). The HCP consisted of 82.5 % mineralised cement, 15 % fly ash and 2.5 % micro silica, and was cured at 50°C.
It is evident from Figure 7, that increasing binding of the dominant water phase has two effects: • Decreasing the absolute value of HT and ST at lower temperatures. • Increasing the slope of the curves, that is, the temperature dependency of HT and ST. This is possibly explained by re-distribution of water phases in the systems1,10. See Figure 8.
9
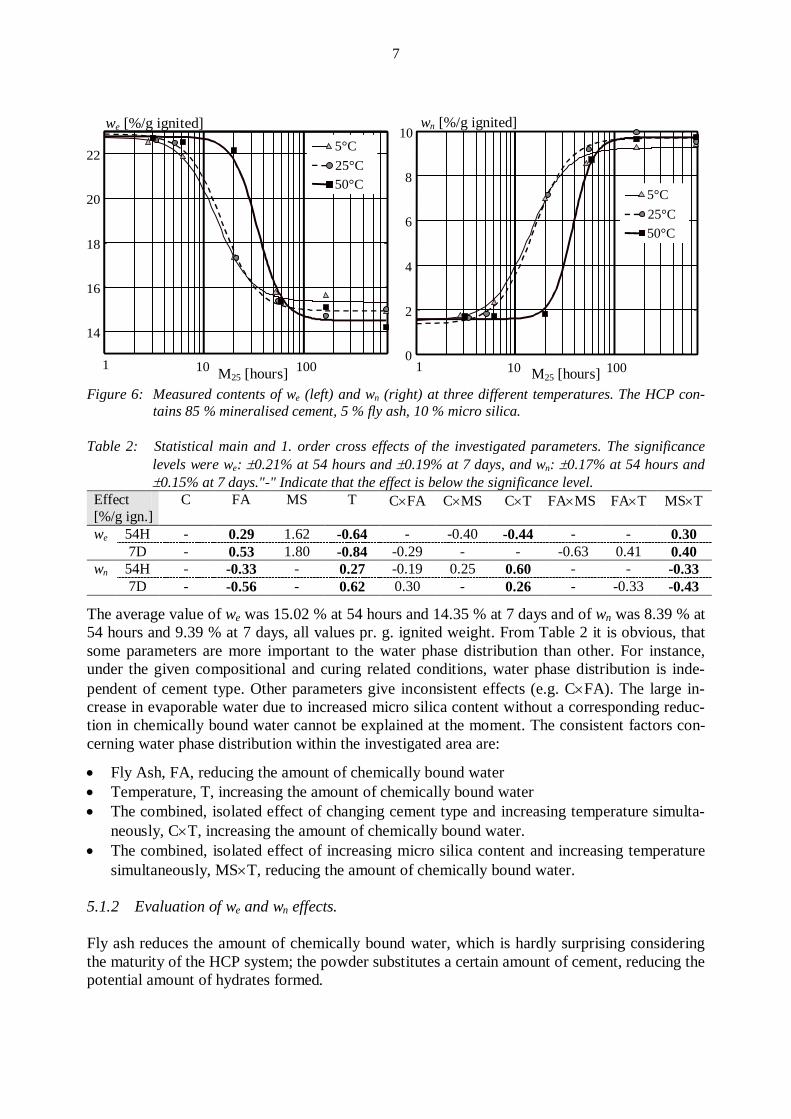
Figure 8: Proposed mechanism for the observed changes in curvature, at increasing temperatures. All the considered HCP’s are self-desiccated to some point within the capillary regime. Depend-ing on the level of selfdesiccation, the meniscus curvature will be greater (Figure 8A) or smaller (Figure 8B). As the temperature is increased, capillary bound water will expand due to the ther-mal dilation of the water and the reduction of surface tension of the meniscus. This reduces the binding of the water, and therefore shift the enthalpy curve towards that of free water. The release in binding is dependent on the original relative humidity (RH) and the divergence towards saturated water vapour pressure should become more prominent the harder the initial binding of the water, as is observed. The actual differences in binding within the HCP will therefore diminish with temperature. For the calculation of effects, the value at 60°C is used, to illustrate the differences between the factors, since this is the lowest reliable temperature. The apparent initial increased binding of the water in the very young cement paste (54 hours M25), as indicated by the level curves at -285 kJ/mole and 75 J/mole⋅K for enthalpy and entropy respectively, is caused by continued hydration of un-reacted cement. The released water is con-sumed at the same rate as it evaporates, thus maintaining a constant relative humidity. As the cement surfaces are blocked by hydrates, the capillary mechanism described above becomes dominant to the p,T relationship, and hence the calculated curves for HT and ST reverts to a course converging on the curve of free water. 5.2.1 Effects, HT and ST The results of the factorial analysis are presented in Table 3. The results are interpreted similarly to those presented in Table 2, as described in section 5.1.1. Table 3: Statistical main and 1. order cross effects of the investigated parameters. The significance
levels for HT were ±0.37kJ/mole at 54 hours and ±0.24kJ/mole at 7 days. All effects calcu-lated at 60°C. "-" Indicate that the effect is below the significance level.
Effect [kJ/mol]
C FA MS T C×FA C×MS C×T FA×MS FA×T MS×T
HT 54H -2.14 -0.68 - -1.77 - - 1.52 -0.58 - -0.85 7D -1.58 0.84 1.01 -2.89 -0.47 -0.58 - 0.46 - -0.24
Compared to free water, the mean values for HT were -0.88 kJ/mole at 54 hours and -1.79 kJ/mole at 7 days. Both values at 60°C. The entropy data are not presented since they are de-rived from the same raw-data and therefore gives the same indications. Considering the values in Table 3, the following effects may be considered statistically significant within the investi-gated area:
A B

10
• Cement type, C, inducing an increased binding of the water phases, as significant as the ma-turity increase from 54 hours to 7 days.
• Temperature, T, an equal effect. • The combined, isolated effect of increasing micro silica content and increasing temperature
simultaneously, MS×T, also increasing the binding, however only just statistically signifi-cant.
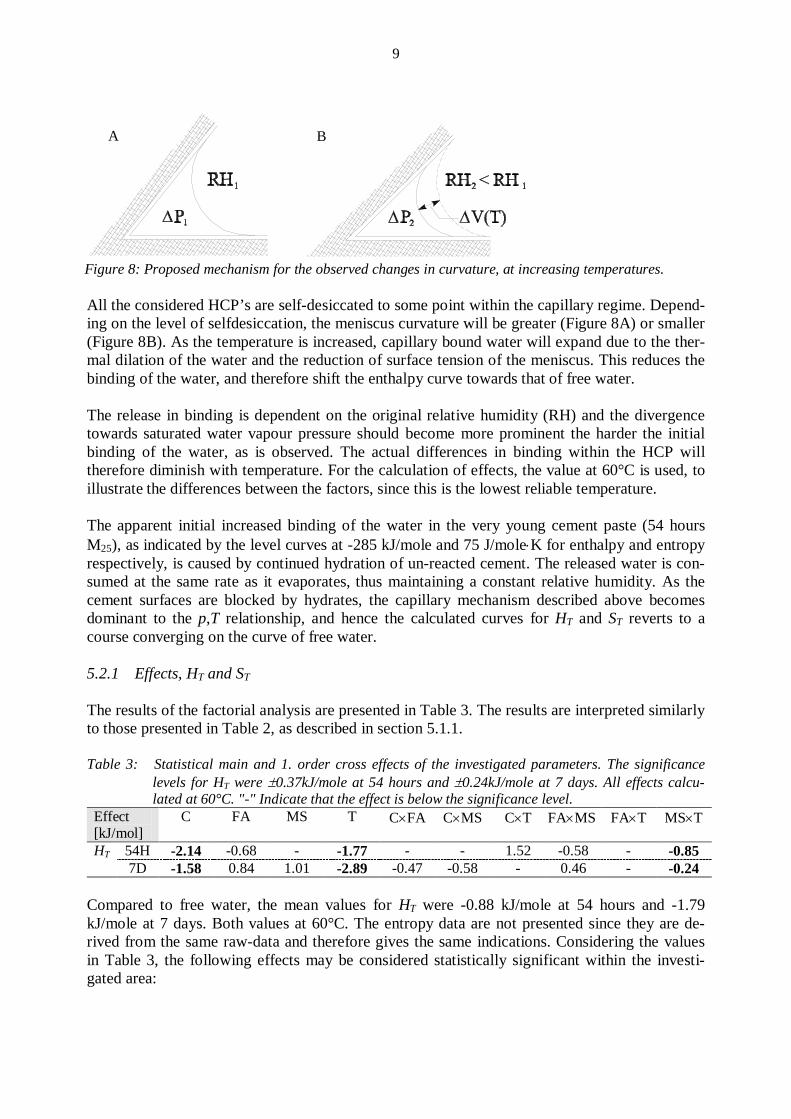
The remaining effects are not consistent, and interpretation will not be attempted until further results are available. 5.2.2 Evaluation of HT and ST effects. The effect of cement type is surprising, since the distribution between evaporable and chemi-cally bound water was independent of cement type. This indicates that the type of hydrates, pore water solution or the microstructure formed by the two cements differ significantly. This issue is further elaborated in section 5.3 of this article. The effect of temperature is intuitively understandable, since surface area may assume to have increased (because of an increased amount of chemically bound water) and a corresponding re-duction in the amount of adsorbed water. This “spreading out” of a smaller amount of water over an increased surface, should reduce in a “thinner” and therefor more securely bound “layer” of water. As will be shown in the above-mentioned section, this, however, is not the entire explanation. The combined effect of micro silica and temperature was expected, since the reduced amount of chemically bound water was assumed to be caused by an increased puzzolanic activity, and hence an increased surface area to cope with the extra available evaporable water. As above, this is not a fulfilling explanation. 5.3 Micro structural analysis In order to get a better view of the mechanisms involved in the binding of the water phases a number of reference-analysis have been performed on two different HCP’s. The compositions are presented in Table 4, and the results are presented in the Figures 9 (microscopy under crossed polars), 10 (SEM) and 11 (N2-BET analysis). Table 4: HCP powder compositions in % of total powder weight, water content, and equivalent maturity
for the samples investigated in the reference series. White cement was used for both mixes. HPCP C [%] FA [%] MS [%] w/p [-] M25 [days] BL1 92.5 5.0 2.5 0.20 7 BL2 75.0 15.0 10.0 0.20 7
11
Figure 9: Microscopy images of the two HCP mixes under crossed polars. BL1 (left) and BL2 (right).
Upper images cured at 5°C, lower at 50°C. Images are 0.635 mm wide (200× magnification). White is Ca(OH)2 crystals, the darker background is hydrates, puzollanic fillers and air-voids.
12
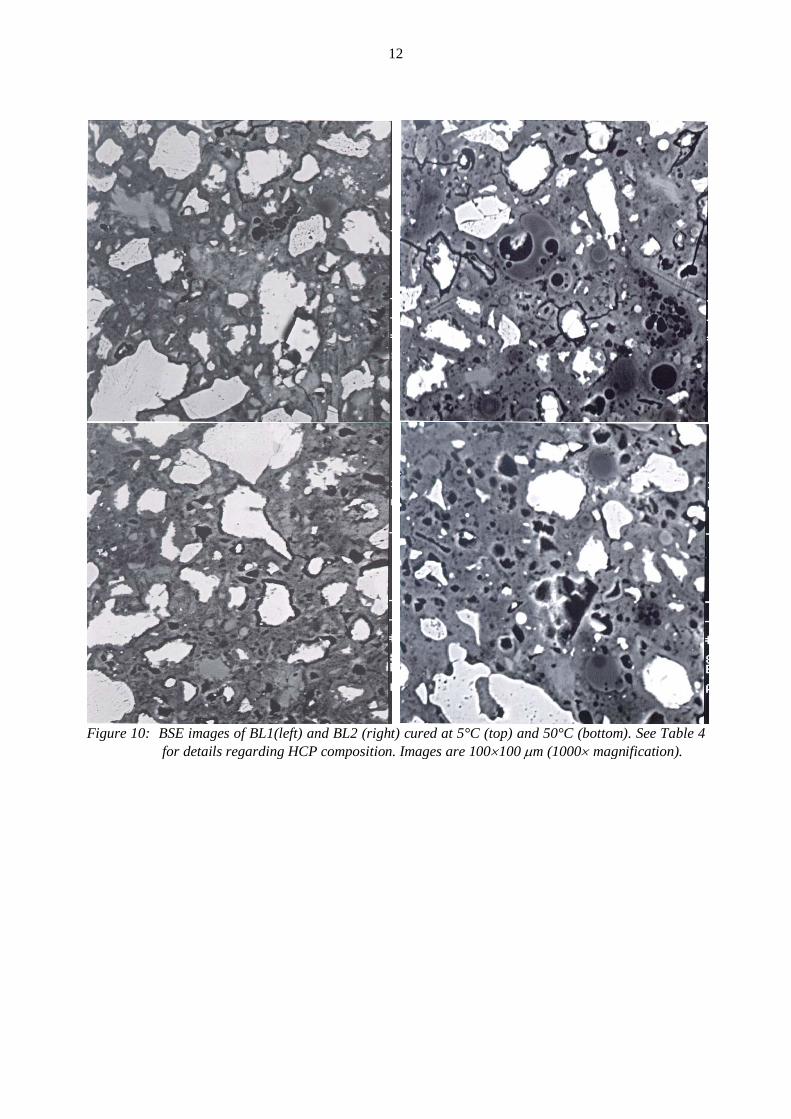
Figure 10: BSE images of BL1(left) and BL2 (right) cured at 5°C (top) and 50°C (bottom). See Table 4
for details regarding HCP composition. Images are 100×100 µm (1000× magnification).
13
0 0.1 0.2 0.3 0.4 0.5 0.6 0.7 0.8 0.9 10
5
10
15
20
25
30
35
40
45
50
p/ps [-]
V [cm3/g]
BL1, 5°C
BL2, 5°C
BL1, 50°C
BL2, 50°C
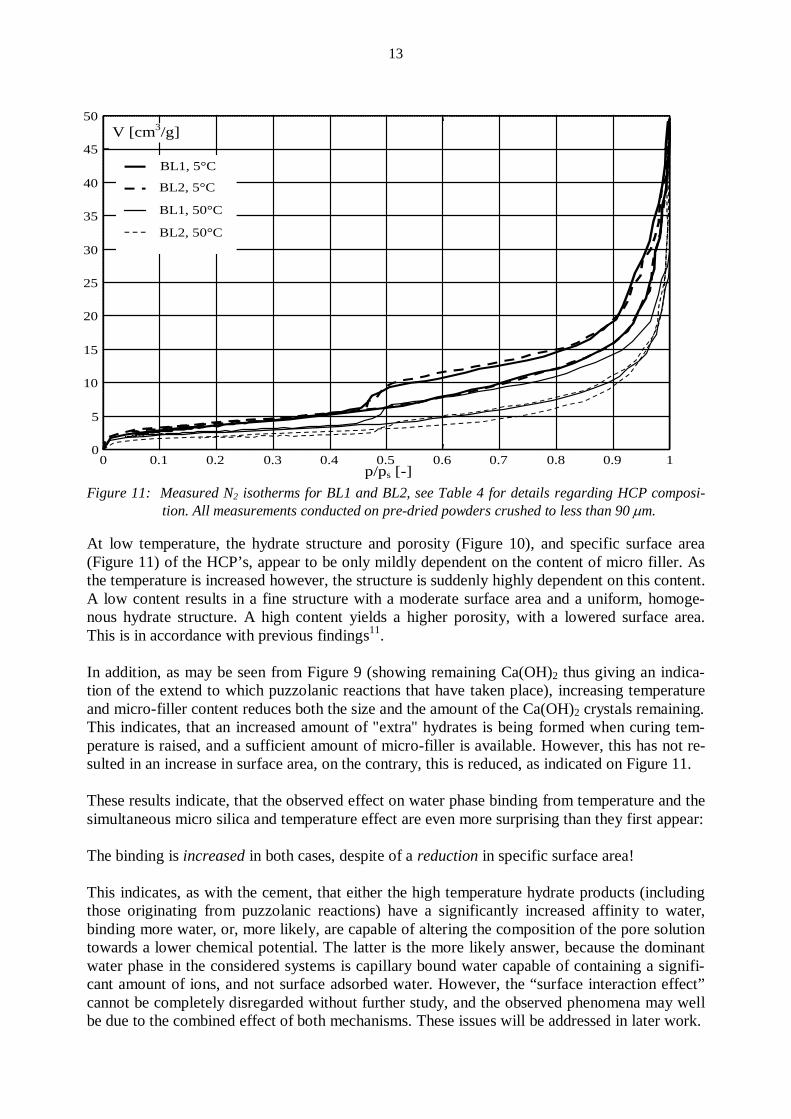
Figure 11: Measured N2 isotherms for BL1 and BL2, see Table 4 for details regarding HCP composi-
tion. All measurements conducted on pre-dried powders crushed to less than 90 µm. At low temperature, the hydrate structure and porosity (Figure 10), and specific surface area (Figure 11) of the HCP’s, appear to be only mildly dependent on the content of micro filler. As the temperature is increased however, the structure is suddenly highly dependent on this content. A low content results in a fine structure with a moderate surface area and a uniform, homoge-nous hydrate structure. A high content yields a higher porosity, with a lowered surface area. This is in accordance with previous findings11. In addition, as may be seen from Figure 9 (showing remaining Ca(OH)2 thus giving an indica-tion of the extend to which puzzolanic reactions that have taken place), increasing temperature and micro-filler content reduces both the size and the amount of the Ca(OH)2 crystals remaining. This indicates, that an increased amount of "extra" hydrates is being formed when curing tem-perature is raised, and a sufficient amount of micro-filler is available. However, this has not re-sulted in an increase in surface area, on the contrary, this is reduced, as indicated on Figure 11. These results indicate, that the observed effect on water phase binding from temperature and the simultaneous micro silica and temperature effect are even more surprising than they first appear: The binding is increased in both cases, despite of a reduction in specific surface area! This indicates, as with the cement, that either the high temperature hydrate products (including those originating from puzzolanic reactions) have a significantly increased affinity to water, binding more water, or, more likely, are capable of altering the composition of the pore solution towards a lower chemical potential. The latter is the more likely answer, because the dominant water phase in the considered systems is capillary bound water capable of containing a signifi-cant amount of ions, and not surface adsorbed water. However, the “surface interaction effect” cannot be completely disregarded without further study, and the observed phenomena may well be due to the combined effect of both mechanisms. These issues will be addressed in later work.
14
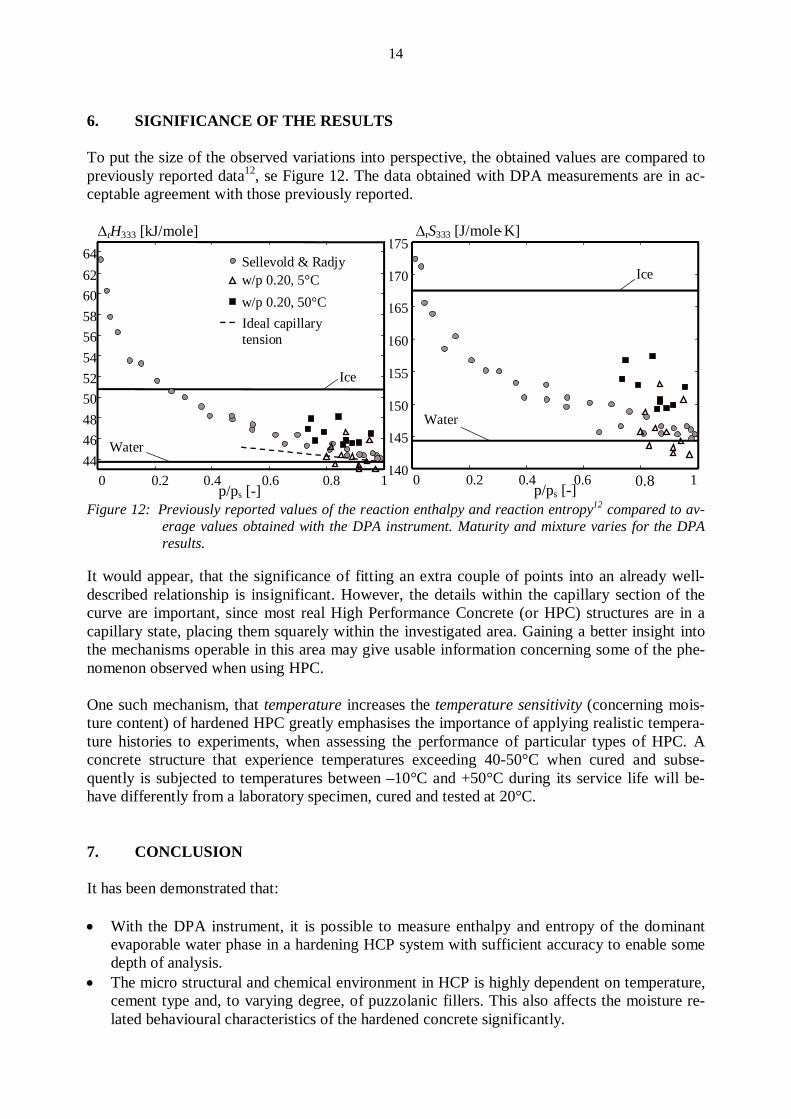
6. SIGNIFICANCE OF THE RESULTS To put the size of the observed variations into perspective, the obtained values are compared to previously reported data12, se Figure 12. The data obtained with DPA measurements are in ac-ceptable agreement with those previously reported.
0 0.2 0.4 0.6 0.8 14446485052545658606264
p/ps [-]
∆rH333 [kJ/mole]
Sellevold & Radjyw/p 0.20, 5°Cw/p 0.20, 50°C
Ice
Water
Ideal capillarytension
0 0.2 0.4 0.6 0.8 1
140
145
150
155
160
165
170
175
p/ps [-]
∆rS333 [J/mole⋅K]
Ice
Water
Figure 12: Previously reported values of the reaction enthalpy and reaction entropy12 compared to av-
erage values obtained with the DPA instrument. Maturity and mixture varies for the DPA results.
It would appear, that the significance of fitting an extra couple of points into an already well-described relationship is insignificant. However, the details within the capillary section of the curve are important, since most real High Performance Concrete (or HPC) structures are in a capillary state, placing them squarely within the investigated area. Gaining a better insight into the mechanisms operable in this area may give usable information concerning some of the phe-nomenon observed when using HPC. One such mechanism, that temperature increases the temperature sensitivity (concerning mois-ture content) of hardened HPC greatly emphasises the importance of applying realistic tempera-ture histories to experiments, when assessing the performance of particular types of HPC. A concrete structure that experience temperatures exceeding 40-50°C when cured and subse-quently is subjected to temperatures between –10°C and +50°C during its service life will be-have differently from a laboratory specimen, cured and tested at 20°C. 7. CONCLUSION It has been demonstrated that: • With the DPA instrument, it is possible to measure enthalpy and entropy of the dominant
evaporable water phase in a hardening HCP system with sufficient accuracy to enable some depth of analysis.
• The micro structural and chemical environment in HCP is highly dependent on temperature, cement type and, to varying degree, of puzzolanic fillers. This also affects the moisture re-lated behavioural characteristics of the hardened concrete significantly.

15
• The utilisation of multiple experimental techniques simultaneously may be essential to evaluate the mechanisms governing the previously mentioned behaviours of the advanced High Performance Concrete’s used today.
• More work is needed to understand the governing mechanisms in structure formation on the physical, chemical and thermodynamical level.
8. ACKNOWLEDGEMENTS The present work was conducted as part of an industrial Ph.D. program under the Academy of Technical Sciences, ATV. The author also wishes to express gratitude to the Factory owner, Engineer Valdemar Selmer Trane and wife Elisa Trane foundation for financial support in the construction of the instru-ments. Furthermore thanks are due to Technical Assistant Nicholas Flint, Dept. of Building Technol-ogy, Aalborg University and Poul Lehmann Nielsen, Cement- and Concrete Laboratory, Aal-borg Portland a/s, for patient and tolerant assistance in the production, modification and mainte-nance of the instruments. Finally, the author wishes to express his gratitude to Prof. Per Freiesleben Hansen, Dept. of Building Technology, Aalborg University, and Dr. Dirch H. Bager, Cement- and Concrete Laboratory, Aalborg Portland a/s for invaluable support and guidance during the entire period. 9. REFERENCES 1 Powers, T.C. and Brownyard, T.L.: "Studies of the Physical Properties of Hardened Port-
land Cement Paste", ACI Bulletin 22, 1948. 2 Freiesleben Hansen, P.: "Material Physics for Building Engineers" (In Danish), Federal
Building Institute, SBI-publication 183, ISBN 87-563-0864-7, 1995. 3 Atkins, P.W.: "Physical Chemistry", 5th edition, Oxford University Press, 1997. 4 Box, G.E.P., Hunter, W.G. and Hunter, J.S.:" Statistics for Experimenters – An Introduc-
tion to Design, Data Analysis and Model Building", John Wiley & Sons, 1978. 5 Escalanta-García, J.J. and Sharp, J.H.: "Effect of temperature on the hydration of the
main clinker phases in Portland cement paste: Part I, Neat cements", Cement and con-crete research, Vol. 28, No. 9, 1998.
6 Maltais, Y. and Marchand, J.: "Influence of curing temperature on cement hydration and mechanical strength development of fly ash mortars", Cement and Concrete Research, Vol. 27, No.7, 1997.
7 Mouret, M. et al.: "Study of the Degree of Hydration of Concrete by Means of Image Analysis and Chemically Bound Water", Advanced Cement Based Materials Volume 6, No's ¾, 1997.
8 Kim, J.-K., et al.: "Compressive strength development of concrete with different curing time and temperature", Cement and Concrete Research, Vol. 28, No.12, 1998.
9 Garcés, P. et al.: "Effect of curing temperature in some hydration characteristics of cal-cium aluminate cement compared with those of Portland cement", Cement and Concrete Research, Vol. 27, No.9, 1997.

16
10 Discussion of recent thermal dilation measurements made by Øyvind Bjøntegaard and Erik J. Sellevold during a two-week stay at NTNU, Trondheim, Norway.
11 Mouret, M., Bascoul, A. and Escadeillas, G.: "Microstructural features of concretes in relation to initial temperature – SEM and ESEM characterisation", Cement and Concrete Research, Vol. 29, 1999.
12 Sellevold, E.J. and Radjy, F.: "Measurement of Isoteric P-T data for pore water", unpub-lished results, Technical University of Denmark, 1976.
17
MEASUREMENTS OF WATER VAPOUR ADSORPTION ISOTHERMS, SORPTION ENTHALPIES AND SORPTION ENTROPIES IN CEMENT BASED MATERIALS
S. Lindmark (1) N. Markova (2) L. Wadsö (1) Lund University, Sweden 1) Division of Building Materials,
Lund University, Box 118, 221 00 Lund, Sweden
2) Division of Physical Chemistry 1 Lund University, Box 124, 221 00 Lund, Sweden
ABSTRACT A new technique for simultaneous determination of sorption isotherms and sorption enthalpies has been used to study the adsorption of water vapour in hardened Portland cement paste at three water-cement ratios. The obtained data are in good agreement with previously reported data, but the results obtained with the new measurement technique also show a dip in the differential sorption enthalpy occurring at approximately 60% relative humidity. Some plausible reasons for its occurrence are shortly discussed.
Key words: Cement, calorimetry, adsorption, capillary condensation
1. INTRODUCTION The moisture content and the thermodynamic state of adsorbed moisture affects many properties of porous materials, e.g. shrinkage. The thermodynamic state of the water will also determine at what temperatures ice formation may occur. By describing the state of the sorbed water by its sorption enthalpy and sorption entropy, it is possible to predict freezing phenomena without making any assumptions regarding pore shapes, pore size distribution and occurrence of dissolved matter in the pore water. It is thus of general interest to determine the thermodynamic state of water held in porous materials.
18
For cement pastes, such determinations have previously been made by indirect techniques1,2. For the present investigation we have used a recently developed microcalorimetric technique in which both the sorption isotherm and the differential sorption enthalpy are determined simultaneously on one single specimen3.
2. METHOD Because most physical, chemical and biological processes produce heat, isothermal calorimetry, the measurement of thermal power under constant temperature, is a very general measurement technique. Here we have used a sorption microcalorimeter that in 1-2 days simultaneously measures the adsorption isotherm and the differential adsorption enthalpy on samples in the order of 100 mg. The following is a short description of the technique; for a more detailed description see Wadsö and Wadsö3.
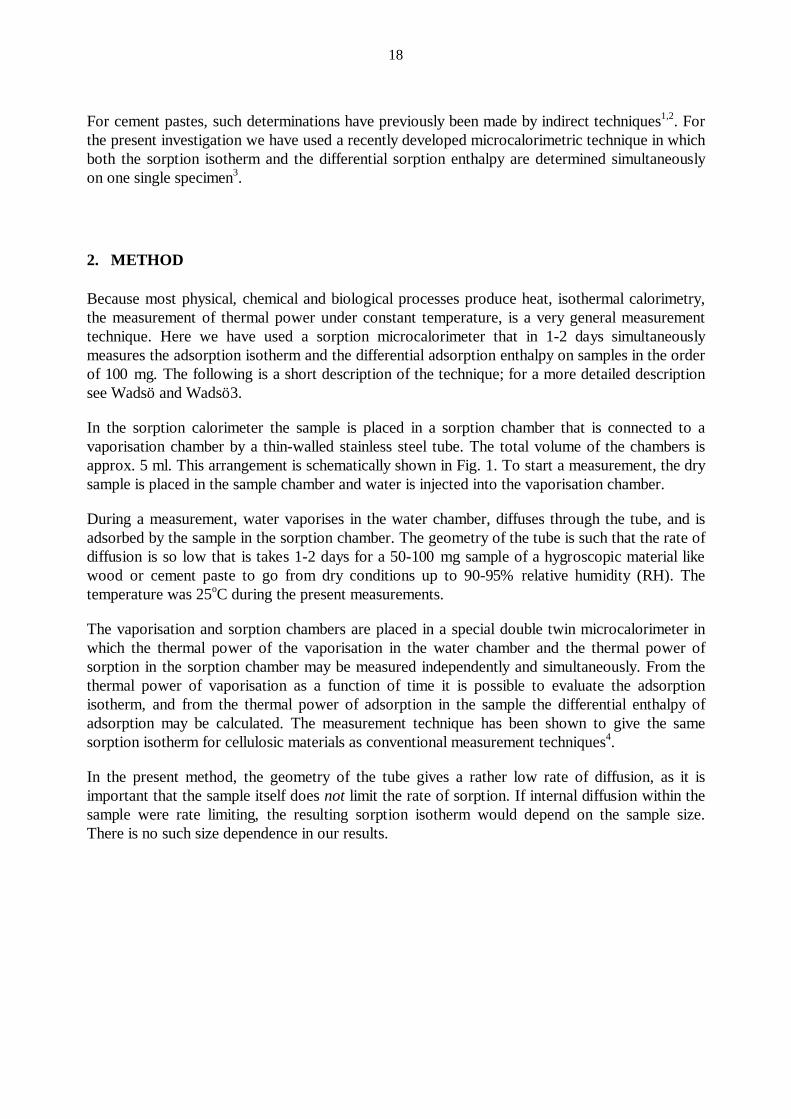
In the sorption calorimeter the sample is placed in a sorption chamber that is connected to a vaporisation chamber by a thin-walled stainless steel tube. The total volume of the chambers is approx. 5 ml. This arrangement is schematically shown in Fig. 1. To start a measurement, the dry sample is placed in the sample chamber and water is injected into the vaporisation chamber.
During a measurement, water vaporises in the water chamber, diffuses through the tube, and is adsorbed by the sample in the sorption chamber. The geometry of the tube is such that the rate of diffusion is so low that is takes 1-2 days for a 50-100 mg sample of a hygroscopic material like wood or cement paste to go from dry conditions up to 90-95% relative humidity (RH). The temperature was 25oC during the present measurements.
The vaporisation and sorption chambers are placed in a special double twin microcalorimeter in which the thermal power of the vaporisation in the water chamber and the thermal power of sorption in the sorption chamber may be measured independently and simultaneously. From the thermal power of vaporisation as a function of time it is possible to evaluate the adsorption isotherm, and from the thermal power of adsorption in the sample the differential enthalpy of adsorption may be calculated. The measurement technique has been shown to give the same sorption isotherm for cellulosic materials as conventional measurement techniques4.
In the present method, the geometry of the tube gives a rather low rate of diffusion, as it is important that the sample itself does not limit the rate of sorption. If internal diffusion within the sample were rate limiting, the resulting sorption isotherm would depend on the sample size. There is no such size dependence in our results.
19
liquid
sample
vaporization
sorption
diffusion
bottom
top
calorimeter
calorimeter
endothermic
exothermic
a b c
Figure 1: Schematic cross section of the sorption calorimeter.
3. MATERIALS Three mortars of water-cement ratios (w/c) 0.40, 0.50 and 0.65 were used. Material data are given in Table 1. The cement was a low alkali, sulphate resistant, pure Portland cement (Degerhamn Std, produced by Cementa AB, Sweden) and the water was potable tap water. The sand was a finely divided quartzite flour (97% < 50 µm, Fyleverken IMB AB, Sjöbo, Sweden). According to the producer, the sand is 99% SiO2, and the remainder is Al2O3, Fe2O3 and TiO2. Lindmark5 gives a more detailed description of the material.
The mortars were cast in steel forms (230×200×950 mm3) and were both table and poker vibrated for 5-10 minutes. The cast surface was covered with 5 mm of water and the steel form was sealed with a tight lid. The mortars were demoulded 1-3 days after casting and were then stored in water one day more.
Twenty cylindrical specimens with a diameter of 64 mm were drilled out of each block, perpendicularly to the direction of casting. Four discs of a thickness of 25 mm and one of 35 mm were cut out from the cylinders with a diamond saw. The outermost 20 mm of the cylinders were not used. All discs were stored in lime water in a closed container until testing began.
Discs of each material quality were taken up after 5 months storage. Density and porosity were determined by the Archimedes’ principle (the discs were dried at 105°C, evacuated under vacuum, impregnated with water and then weighed in air and in water). After this determination all specimens were stored under water.
The specimens were crushed and sieved under water and the grain size distributions were determined by laser diffraction by Scancem Research AB, Slite, Sweden. Grain sizes ranged up to 200 µm, the mean size being approximately 50 µm.
The degree of hydration (ratio of amount of hydrated cement to total amount of cement) was determined on parallel samples by ignition at 1050° C.
20
Table 1: Data for the cement mortars. The degrees of hydration values are mean values of two determinations, the density and porosity are mean values of ten determinations. w/c ratio: 0.40 0.50 0.65 Cement 1050 840 646.2 kg/m³ Water 420 420 420 kg/m³ Sand 654 830 993 kg/m³ Degree of hydration 0.72 0.77 0.79 % Density 1860 1800 1700 kg/m³ Porosity 28.6 31.2 34.9 %
4. RESULTS Figures 2-4 give the result of the measurements. Figure 2 shows all measured adsorption isotherms. The difference between measurements made with samples of the same w/c is small, a result indicating that the adsorption process is not hindered by slow diffusion within or between the sample grains.
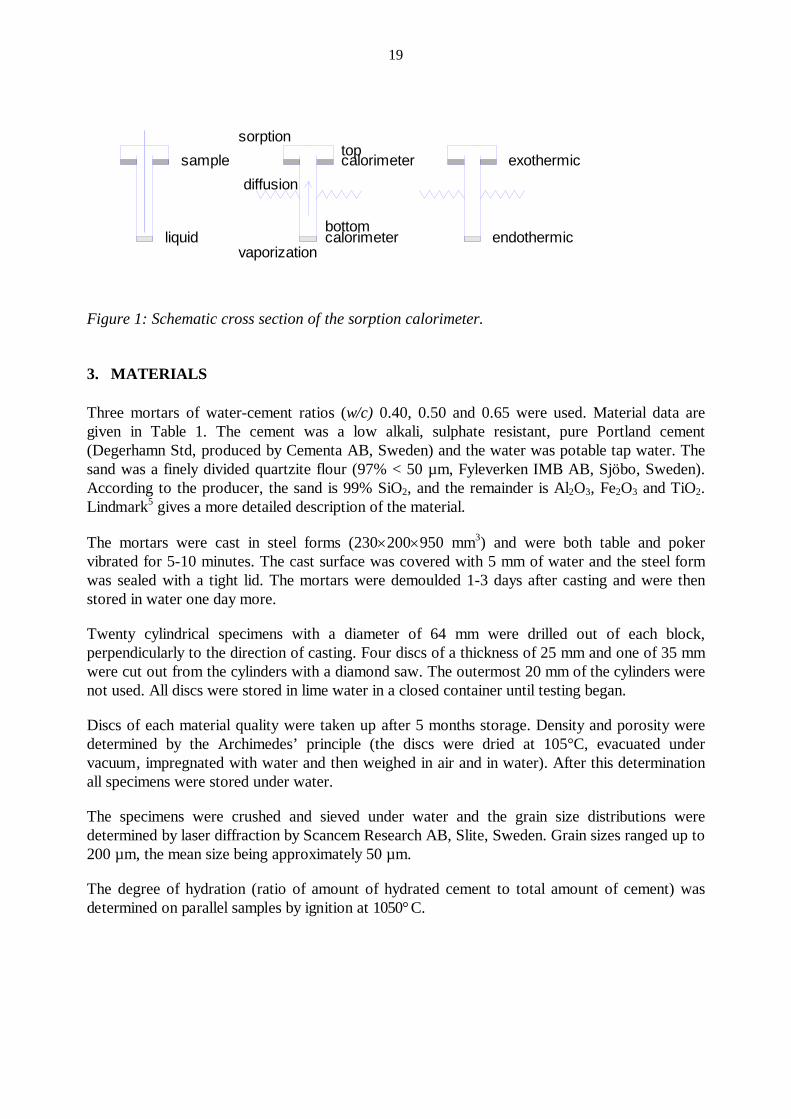
Figure 4 shows one measured differential adsorption enthalpy for each w/c. The spreading is small and there is no discernible dependence on sample size. The differential adsorption enthalpy expected to be 0 at 100% relative vapour pressure. Due to the very slow rate of adsorption at high levels of relative vapour pressure though, any measurement errors are strongly enhanced.
In the plots of adsorption enthalpy, a “dip” appears between relative vapour pressures of approximately 60 and 80 % . Materials like wood and porous glass show monotonously increasing differential enthalpies, quite unlike the present result. (A close-up of a dip in the differential adsorption enthalpy for mortars of w/c ratio 0.50 is shown in figure 8A)
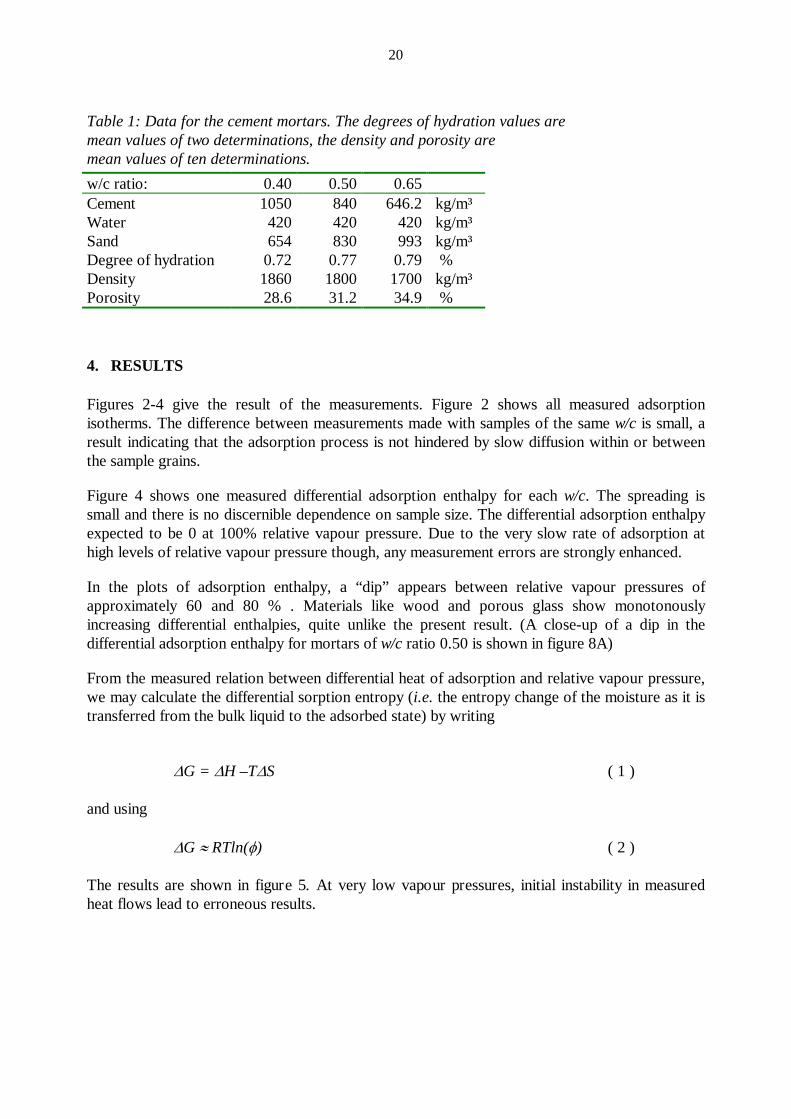
From the measured relation between differential heat of adsorption and relative vapour pressure, we may calculate the differential sorption entropy (i.e. the entropy change of the moisture as it is transferred from the bulk liquid to the adsorbed state) by writing
∆G = ∆H –T∆S ( 1 )
and using
∆G ≈ RTln(φ) ( 2 )
The results are shown in figure 5. At very low vapour pressures, initial instability in measured heat flows lead to erroneous results.

21
0 0.2 0.4 0.6 0.8 10
0.05
0.1
0.15
0.2
0.25
Moi
stur
e co
nten
t [g/
g dr
y m
trl]
Relative vapour pressure [%] Figure 2: Adsorption isotherms. Moisture content per gram of dry mortar. Uppermost: w/c 0.65, middle: w/c 0.50 (dashed), lowermost: w/c 0.40.
0 0.1 0.2 0.3 0.4 0.5 0.6 0.7 0.8 0.9 10
0.1
0.2
0.3
0.4
0.5
0.6
0.7
Moi
stur
e co
nten
t [g/
g or
ig. c
emen
t]
Relative vapour pressure [%]
w/c 0.40
w/c 0.50
w/c 0.65
Figure 3: Adsorption isotherms. Moisture content related to total content of cement in the mortars.
22
0 0.2 0.4 0.6 0.8 1-2.5
-2
-1.5
-1
-0.5
0
x 104
Relative vapour pressure [%]
Diff
. sor
ptio
n en
thal
py (l
iq->
ads.
) [J/
mol
e of
wat
er]
Figure 4: Differential sorption enthalpy. Uppermost: w/c 0.65, middle: w/c 0.50 (dashed), lowermost: w/c 0.40.
0 0.2 0.4 0.6 0.8 1-45
-40
-35
-30
-25
-20
-15
-10
-5
0
5
Relative vapour presure [%]
Diff
. sor
ptio
n en
tropy
(liq
->ad
s.) [
J/K
/mol
e]
Figure 5: Differential sorption entropy. Uppermost: w/c 0.65, middle: w/c 0.50 (dashed), lowermost: w/c 0.40.
23
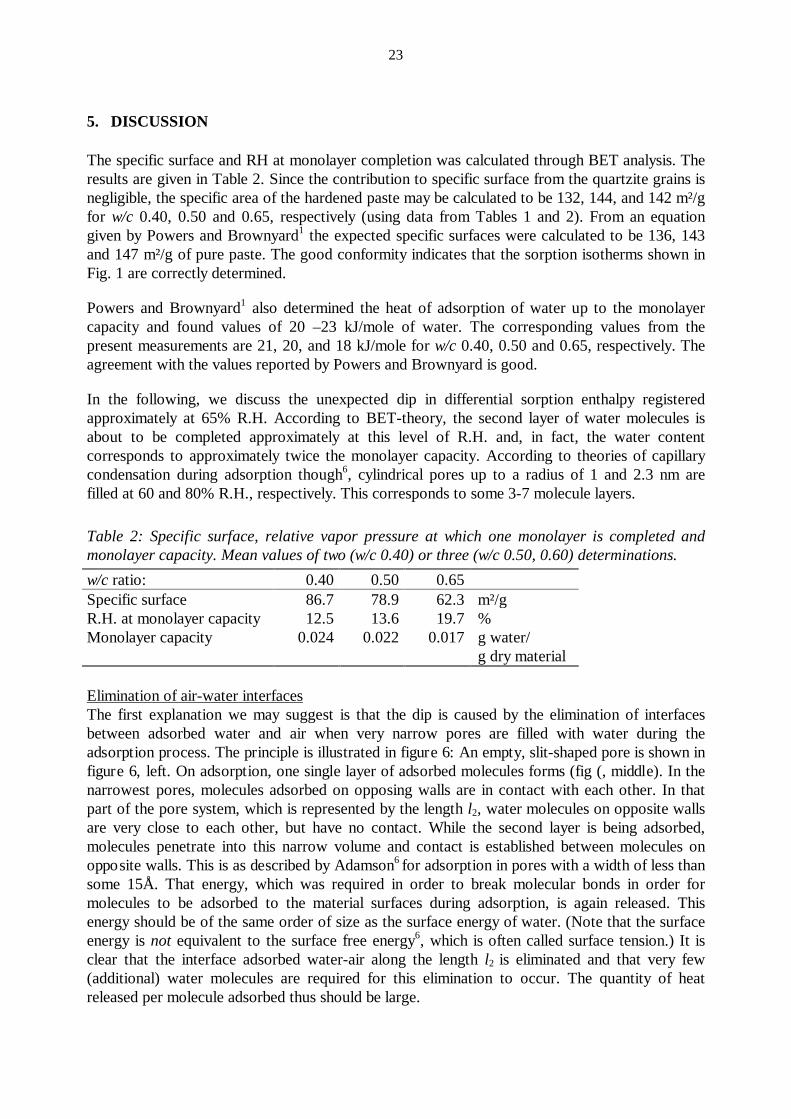
5. DISCUSSION The specific surface and RH at monolayer completion was calculated through BET analysis. The results are given in Table 2. Since the contribution to specific surface from the quartzite grains is negligible, the specific area of the hardened paste may be calculated to be 132, 144, and 142 m²/g for w/c 0.40, 0.50 and 0.65, respectively (using data from Tables 1 and 2). From an equation given by Powers and Brownyard1 the expected specific surfaces were calculated to be 136, 143 and 147 m²/g of pure paste. The good conformity indicates that the sorption isotherms shown in Fig. 1 are correctly determined.
Powers and Brownyard1 also determined the heat of adsorption of water up to the monolayer capacity and found values of 20 –23 kJ/mole of water. The corresponding values from the present measurements are 21, 20, and 18 kJ/mole for w/c 0.40, 0.50 and 0.65, respectively. The agreement with the values reported by Powers and Brownyard is good.
In the following, we discuss the unexpected dip in differential sorption enthalpy registered approximately at 65% R.H. According to BET-theory, the second layer of water molecules is about to be completed approximately at this level of R.H. and, in fact, the water content corresponds to approximately twice the monolayer capacity. According to theories of capillary condensation during adsorption though6, cylindrical pores up to a radius of 1 and 2.3 nm are filled at 60 and 80% R.H., respectively. This corresponds to some 3-7 molecule layers.
Table 2: Specific surface, relative vapor pressure at which one monolayer is completed and monolayer capacity. Mean values of two (w/c 0.40) or three (w/c 0.50, 0.60) determinations. w/c ratio: 0.40 0.50 0.65 Specific surface 86.7 78.9 62.3 m²/g R.H. at monolayer capacity 12.5 13.6 19.7 % Monolayer capacity
0.024 0.022 0.017 g water/ g dry material
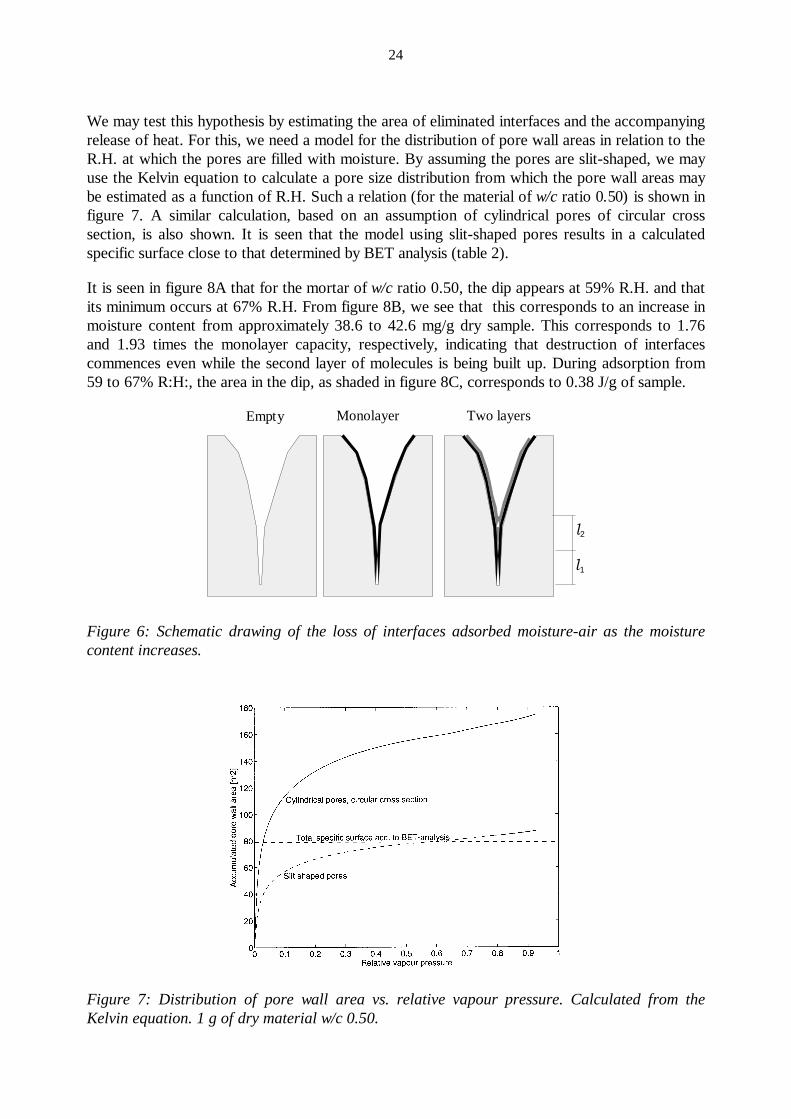
Elimination of air-water interfaces The first explanation we may suggest is that the dip is caused by the elimination of interfaces between adsorbed water and air when very narrow pores are filled with water during the adsorption process. The principle is illustrated in figure 6: An empty, slit-shaped pore is shown in figure 6, left. On adsorption, one single layer of adsorbed molecules forms (fig (, middle). In the narrowest pores, molecules adsorbed on opposing walls are in contact with each other. In that part of the pore system, which is represented by the length l2, water molecules on opposite walls are very close to each other, but have no contact. While the second layer is being adsorbed, molecules penetrate into this narrow volume and contact is established between molecules on opposite walls. This is as described by Adamson6 for adsorption in pores with a width of less than some 15Å. That energy, which was required in order to break molecular bonds in order for molecules to be adsorbed to the material surfaces during adsorption, is again released. This energy should be of the same order of size as the surface energy of water. (Note that the surface energy is not equivalent to the surface free energy6, which is often called surface tension.) It is clear that the interface adsorbed water-air along the length l2 is eliminated and that very few (additional) water molecules are required for this elimination to occur. The quantity of heat released per molecule adsorbed thus should be large.
24
We may test this hypothesis by estimating the area of eliminated interfaces and the accompanying release of heat. For this, we need a model for the distribution of pore wall areas in relation to the R.H. at which the pores are filled with moisture. By assuming the pores are slit-shaped, we may use the Kelvin equation to calculate a pore size distribution from which the pore wall areas may be estimated as a function of R.H. Such a relation (for the material of w/c ratio 0.50) is shown in figure 7. A similar calculation, based on an assumption of cylindrical pores of circular cross section, is also shown. It is seen that the model using slit-shaped pores results in a calculated specific surface close to that determined by BET analysis (table 2).
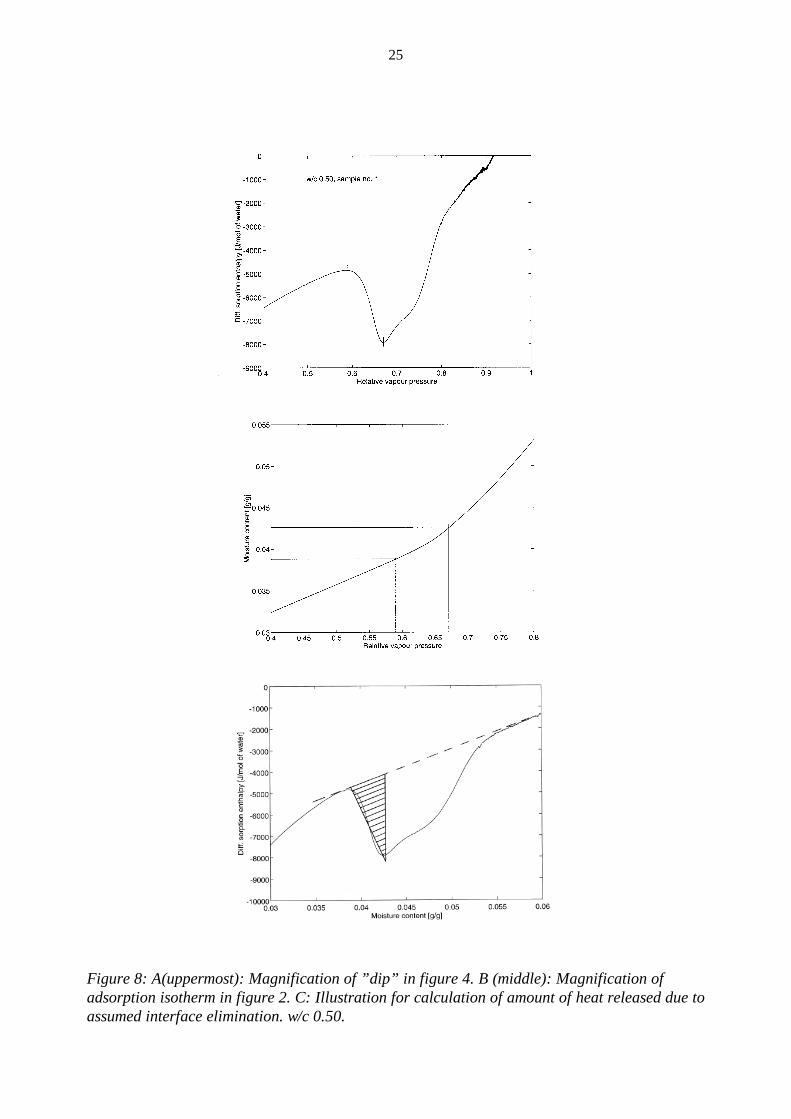
It is seen in figure 8A that for the mortar of w/c ratio 0.50, the dip appears at 59% R.H. and that its minimum occurs at 67% R.H. From figure 8B, we see that this corresponds to an increase in moisture content from approximately 38.6 to 42.6 mg/g dry sample. This corresponds to 1.76 and 1.93 times the monolayer capacity, respectively, indicating that destruction of interfaces commences even while the second layer of molecules is being built up. During adsorption from 59 to 67% R:H:, the area in the dip, as shaded in figure 8C, corresponds to 0.38 J/g of sample.
Empty Monolayer Two layers
l2
l1
Figure 6: Schematic drawing of the loss of interfaces adsorbed moisture-air as the moisture content increases.
Figure 7: Distribution of pore wall area vs. relative vapour pressure. Calculated from the Kelvin equation. 1 g of dry material w/c 0.50.
25
Figure 8: A(uppermost): Magnification of ”dip” in figure 4. B (middle): Magnification of adsorption isotherm in figure 2. C: Illustration for calculation of amount of heat released due to assumed interface elimination. w/c 0.50.
26
From the calculation of pore wall area vs. relative vapour pressure (fig. 5), we estimate the pore wall area of those pores which, according to capillary condensation theory, are filled during adsorption from 59 to 67% R.H to be some 3 m². The heat released per unit area of eliminated interface thus approximately is 0.38 /3 = 0.127 J/m², a value close to the surface energy of water (appr. 0.115 J/m²).
Although the calculation contains some questionable assumptions and prerequisites, especially concerning the area of the vanishing interfaces, the result makes the proposed explanation seem reasonable. If the above assumptions are correct, the rest of the dip might provide information about the shape of the pores or about true interface energies. The estimation of eliminated interface area though is uncertain and the good agreement must not be as evidence of the proposed phenomenon.
Changes in the state of the adsorbed water A second explanation to the unexpected “dip” is that there is reorganisation within the adsorbed water: The first molecules are adsorbed on a two-dimensional surface. As the second and third layers form though, there will be a point at which the molecules start to behave as if they were in a three dimensional liquid6. This means that some of the energy, which was needed in order to break the attractive forces between water molecules in the bulk water in order to arrange them as a two-dimensional adsorbate, is now released. At the same time, the molecules have a possibility to adopt more ways of arrangement, i.e. the disorder of the adsorbed molecules will increase and thus the entropy of the adsorbed molecules should increase. Assuming that the change in free energy (eq. 2) concerns only those molecules which are currently being adsorbed, the “dip” in adsorption enthalpy (below the dashed line of figure 8C) is due to structural changes of already present moisture and must, in order for the free energy of that moisture to remain constant, be counterbalanced by an increase in entropy of that moisture.
6. CONCLUSIONS We have measured adsorption isotherms and differential adsorption enthalpies on cement paste samples of three water cement rations. The results agree well with previously published data, but we also see an anomalous “dip” in the differential adsorption enthalpy that has not been observed earlier. It is possible that it is the result of elimination of water-air interfaces when the adsorption fills the very narrow pores of these materials.
ACKNOWLEDGEMENTS We want to thank the Swedish Building Research Council and the Swedish Technical Research Council for their financial suppo rt.
27
REFERENCES 1. Powers, T.C, Brownyard, T.L: ”Studies of the Physical Properties of Hardened Portland
Cement Paste”, Research Laboratories of the Portland Cement Association, Bull. 22, 1948. 2. Radjy, F, Sellevold, E J: “Measurement of isosteric P-T data for pore water”, non-published
results, Building Materials Laboratory, Technical University of Denmark, 1977 3. Wadsö, I, Wadsö, L:”A second generation twin double microcalorimeter. Measurements of
sorption isothermsa, heats of sorption and sorption kinetics”, J. Therm. Anal., vol. 49 (1997) pp. 1045-1052
4. Wadsö, I, Wadsö, L: “A new method for determination of vapour sorption isotherms using a twin double microcalorimeter”, Thermochimica acta (1996) 179-187
5. Lindmark, S: “Mechanisms of Salt Frost Scaling of Portland Cement-bound Materials: Studies and Hypothesis”, Lund Institute of Technology, Div. Building Materials, Report TVBM 1017, 1998
6. Adamson, A W: “Physical Chemistry of Surfaces”, John Wiley&Sons 1990, 5th Ed.

28
29
MODELLING OF MOISTURE ISOTHERMS INCLUDING ALKALI EFFECTS
Jan-Erik Jonasson Ph. D., Associate Professor Division of Structural Engineering Luleå University of Technology SE-971 87 Luleå, Sweden e-mail: [email protected] ABSTRACT A model for description of isotherms in desorption and absorption as well as the moisture capacities (derivatives with respect to relative humidity) is presented. The derivation is first fulfilled without respect to alkali effects. Subsequently, the influence of alkali is treated as a separate phenomenon to be valid at high humidities. This is very important when evaluating flow measurements irect in contact with water. In general, models of isotherms are needed in calculation of moisture states to be able to transform calculated results into different state variables and for the use of different driving potentials. Key words: Isotherms, Model for Isotherms, Alkali Effects, Desorption, Absorption
1 INTRODUCTION It is known for a long time that the presence of alkali in the pore water of cement paste, i. e. Na+ K+ ions and corresponding OH- ions solved in the water, affects pore humidity in the air bubbles in the paste, Powers and Brownyard (1948). It is believed that the influence of alkali is mostly interesting at very high humidities, and thereby decreases the humidity at water saturation to a value below 100 percent. In spite of that this was known, sorption isotherms were presented with 100 percent humidity as an estimated value at water saturation (Powers and Brownyard, 1948, and Ahlgren, 1972). In this paper a model for description of isotherms will first be derived without respect to alkali. Hereby, a well established imagination of the pore structure has been employed as a base for the derivation. Subsequently, the effects of alkali will be treated as an additionally effect to be handled separately. This will only affect the situation at high humidities. The effect of alkali was focused by Hedenblad (1993) in measurements of steady state flow with concrete in direct contact with water, where the alkali effects were important in the analyses of the tests.
30
2 PORE STRUCTURE IN CEMENT PASTE In the structural model in Powers (1960) cement paste, mortar and concrete can be divided into the following, see also Fagerlund (1976), parts: 1. Aggregate (mortar and concrete) 2. Unhydrated cement 3. Solid gel 4. Gel pores eventually filled with evaporable water 5. Contraction pores eventually filled with evaporable water 6. Capillary pores eventually filled with evaporable water 7. Air bubbles (mortar and concrete; not filled with water in the short time period, Fagerlund,
1993) The quantified volumes and masses are based on the following observations and idealised conclusions made by Powers: 1. The degree of hydration, α , is expressed by α = 0 25. /w Cn , where nw = non-evaporable
water content (kg/m3); and C = cement content (kg/m3) 2. The volume of the hydrated water is 75 per cent of the volume of free water 3. All decrease of the hydrated water creates contraction pores 4. Gel pores are formed by the hydration process, and the weight of the water in the gel pores
is 15 per cent of the mass of hydrated cement. The volume of the water in the gel pores is 90 per cent of the volume of free water
5. The mixture is homogenous in forming the pore structure, i. e. no water separation or bleeding is present.
In the imagination of this model the contraction pores are usually put together with the gel pores as they are believed to be equally spread in the gel structure. At self-desiccation these pores are used as an expansion space for the early age freezing (Fagerlund, 1983, Jonasson, 1984). On the other hand, the capillary pores may be regarded as the space been left when the gel particles do not reach each other. So, we may calculate two parts of the evaporable water at saturation as: w
Cw
Cw
Csat gel cap= + (1)
with w
Cgel = 0 2125. α (2)
w
CwC
cap o= − 0 385. α (3)
where wsat = total evaporable water content at saturation ( = w Co − 0 1725. α , kg/m3) wo = initial or mixing water content (kg/m3) wgel = evaporable water content in gel and contraction pores at saturation
(kg/m3)
31
wcap = evaporable water content in the capillary pores at saturation, kg/m3) At a certain situation with respect to maturity and relative humidity the evaporable water content, we, is expressed by wC
wC
wC
eg
gelc
cap= +γ γ (4)
where γ g = gel water filling factor (0 1≤ ≤γ g )
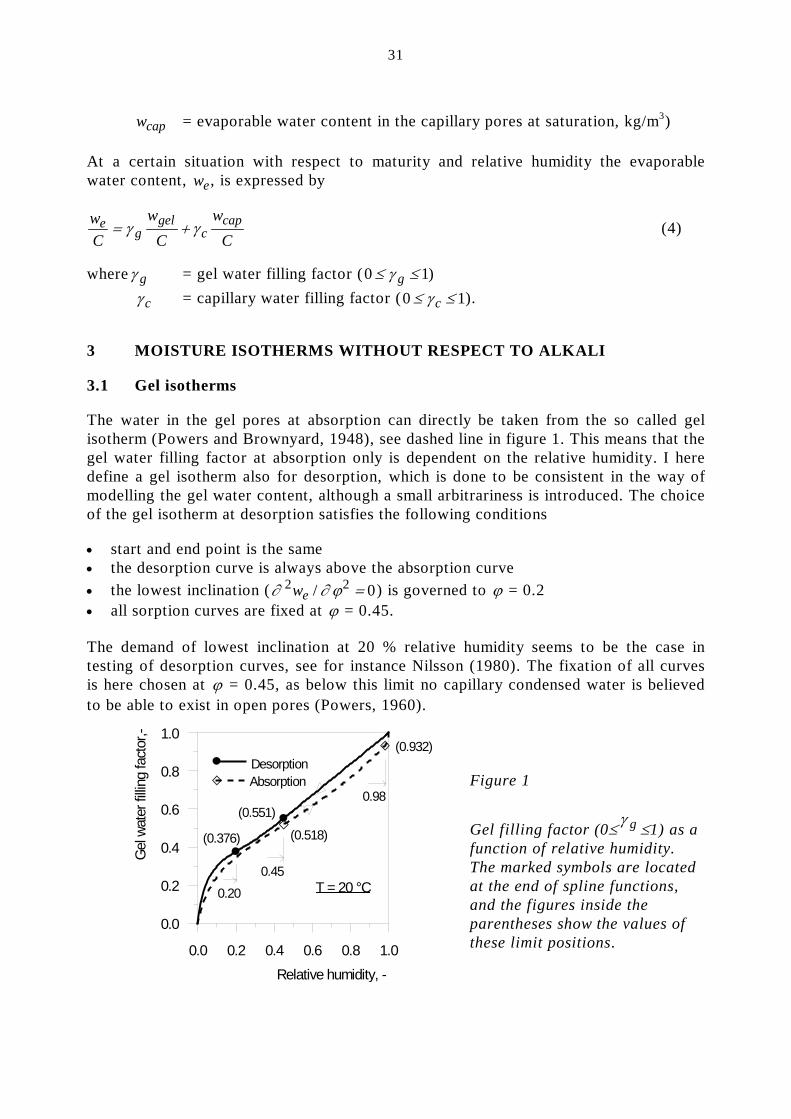
γ c = capillary water filling factor (0 1≤ ≤γ c ). 3 MOISTURE ISOTHERMS WITHOUT RESPECT TO ALKALI 3.1 Gel isotherms The water in the gel pores at absorption can directly be taken from the so called gel isotherm (Powers and Brownyard, 1948), see dashed line in figure 1. This means that the gel water filling factor at absorption only is dependent on the relative humidity. I here define a gel isotherm also for desorption, which is done to be consistent in the way of modelling the gel water content, although a small arbitrariness is introduced. The choice of the gel isotherm at desorption satisfies the following conditions • start and end point is the same • the desorption curve is always above the absorption curve • the lowest inclination (∂ ∂ ϕ 2 2 0we / = ) is governed to ϕ = 0.2 • all sorption curves are fixed at ϕ = 0.45. The demand of lowest inclination at 20 % relative humidity seems to be the case in testing of desorption curves, see for instance Nilsson (1980). The fixation of all curves is here chosen at ϕ = 0.45, as below this limit no capillary condensed water is believed to be able to exist in open pores (Powers, 1960). Figure 1
Gel filling factor (0≤ gγ≤1) as a
function of relative humidity. The marked symbols are located at the end of spline functions, and the figures inside the parentheses show the values of these limit positions.
0.0 0.2 0.4 0.6 0.8 1.0Relative humidity, -
0.0
0.2
0.4
0.6
0.8
1.0
Gel
wat
er fi
lling
fact
or,-
AbsorptionDesorption
0.200.45
0.98(0.551)
(0.518)
(0.932)
(0.376)
T = 20 °C
32
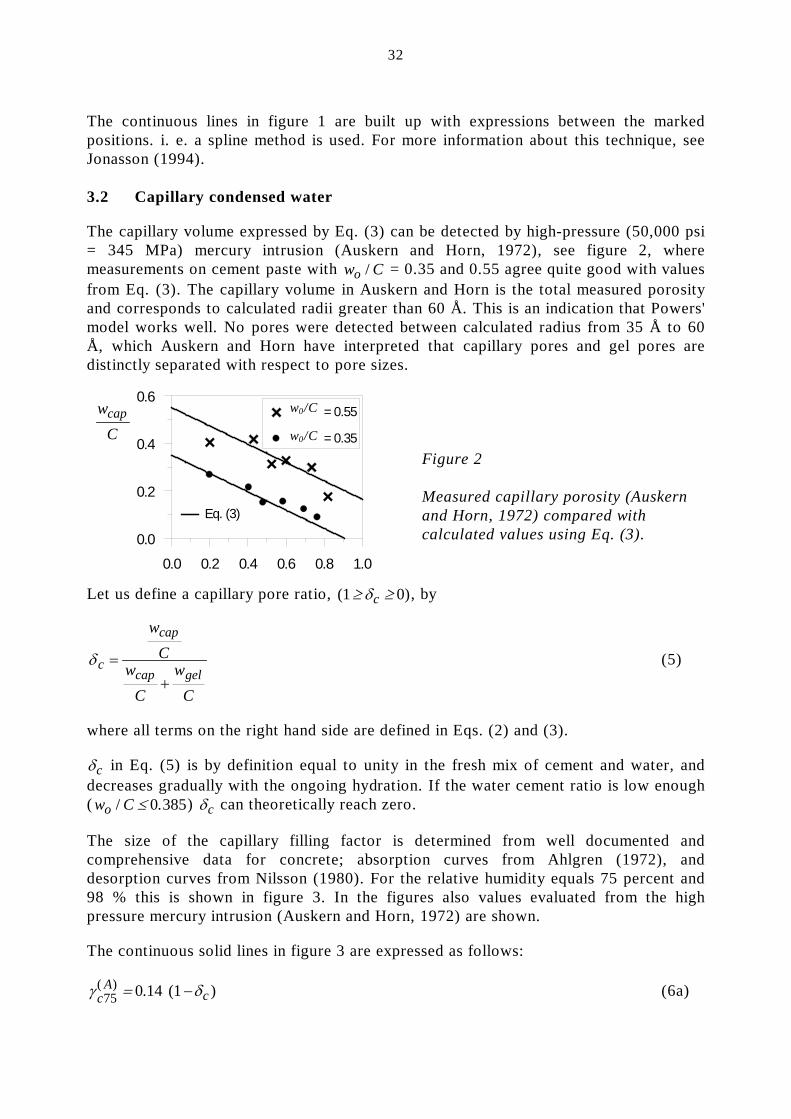
The continuous lines in figure 1 are built up with expressions between the marked positions. i. e. a spline method is used. For more information about this technique, see Jonasson (1994). 3.2 Capillary condensed water The capillary volume expressed by Eq. (3) can be detected by high-pressure (50,000 psi = 345 MPa) mercury intrusion (Auskern and Horn, 1972), see figure 2, where measurements on cement paste with w Co / = 0.35 and 0.55 agree quite good with values from Eq. (3). The capillary volume in Auskern and Horn is the total measured porosity and corresponds to calculated radii greater than 60 Å. This is an indication that Powers' model works well. No pores were detected between calculated radius from 35 Å to 60 Å, which Auskern and Horn have interpreted that capillary pores and gel pores are distinctly separated with respect to pore sizes. Figure 2 Measured capillary porosity (Auskern
and Horn, 1972) compared with calculated values using Eq. (3).
Let us define a capillary pore ratio, ( )1 0≥ ≥δc , by
Cw
Cw
Cw
gelcap
cap
c+
=δ (5)
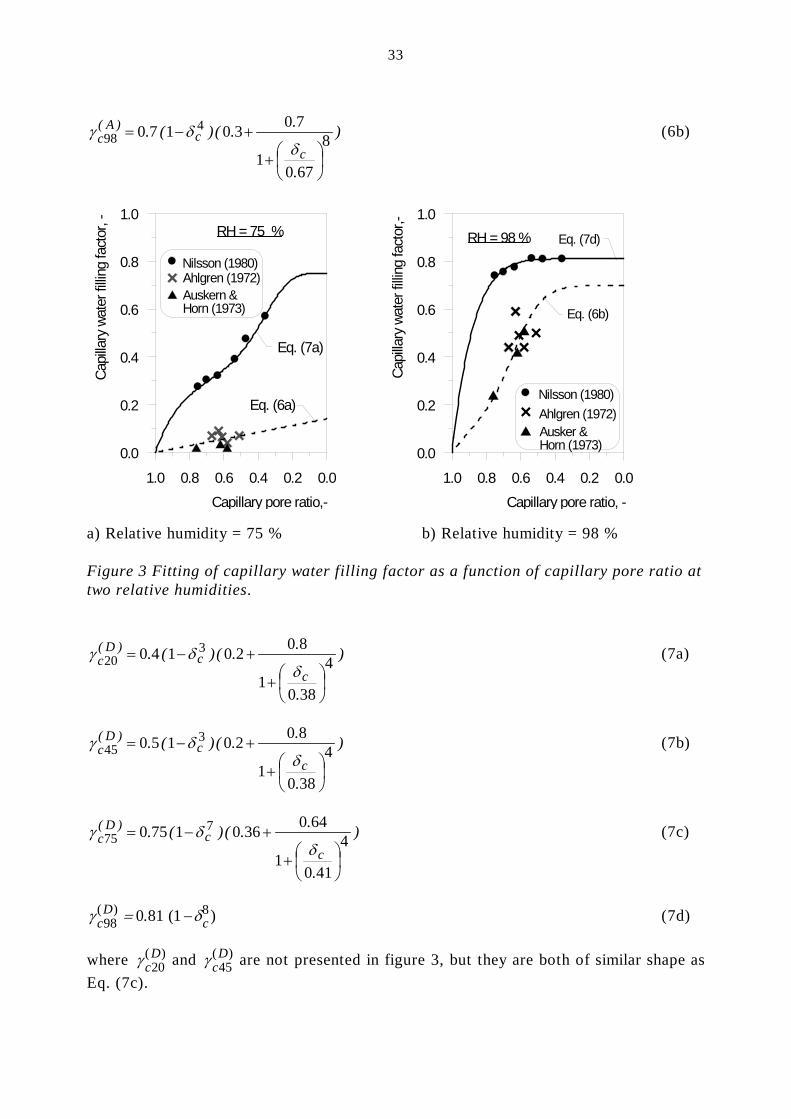
where all terms on the right hand side are defined in Eqs. (2) and (3). δc in Eq. (5) is by definition equal to unity in the fresh mix of cement and water, and decreases gradually with the ongoing hydration. If the water cement ratio is low enough ( w Co / .≤ 0 385) δc can theoretically reach zero. The size of the capillary filling factor is determined from well documented and comprehensive data for concrete; absorption curves from Ahlgren (1972), and desorption curves from Nilsson (1980). For the relative humidity equals 75 percent and 98 % this is shown in figure 3. In the figures also values evaluated from the high pressure mercury intrusion (Auskern and Horn, 1972) are shown. The continuous solid lines in figure 3 are expressed as follows:
γ δcA
c75 0 14 1( ) . ( )= − (6a)
Cwcap
w0/C w0/C
0.0 0.2 0.4 0.6 0.8 1.0
0.0
0.2
0.4
0.6= 0.55
= 0.35
Eq. (3)
33
)
.
..()(.c
c)A(
c 8
6701
7030 1 70 498
+
+−=δ
δγ (6b)
a) Relative humidity = 75 % b) Relative humidity = 98 % Figure 3 Fitting of capillary water filling factor as a function of capillary pore ratio at two relative humidities.
)
.
..()(.c
c)D(
c 4
3801
8020 1 40 320
+
+−=δ
δγ (7a)
)
.
..()(.c
c)D(
c 4
3801
8020 1 50 345
+
+−=δ
δγ (7b)
)
.
..()(.c
c)D(
c 4
4101
640360 1 750 775
+
+−=δ
δγ (7c)
γ δcD
c9880 81 1( ) . ( )= − (7d)
where γ cD20
( ) and γ cD45
( ) are not presented in figure 3, but they are both of similar shape as Eq. (7c).
0.00.20.40.60.81.0Capillary pore ratio,-
0.0
0.2
0.4
0.6
0.8
1.0
Capi
llary
wat
er fi
lling
fact
or, -
Nilsson (1980)Ahlgren (1972)Auskern &Horn (1973)
RH = 75 %
Eq. (6a)
Eq. (7a)
0.00.20.40.60.81.0Capillary pore ratio, -
0.0
0.2
0.4
0.6
0.8
1.0
Capi
llary
wat
er fi
lling
fact
or,-
Nilsson (1980)Ahlgren (1972)Ausker &Horn (1973)
Eq. (6b)
Eq. (7d)RH = 98 %
34
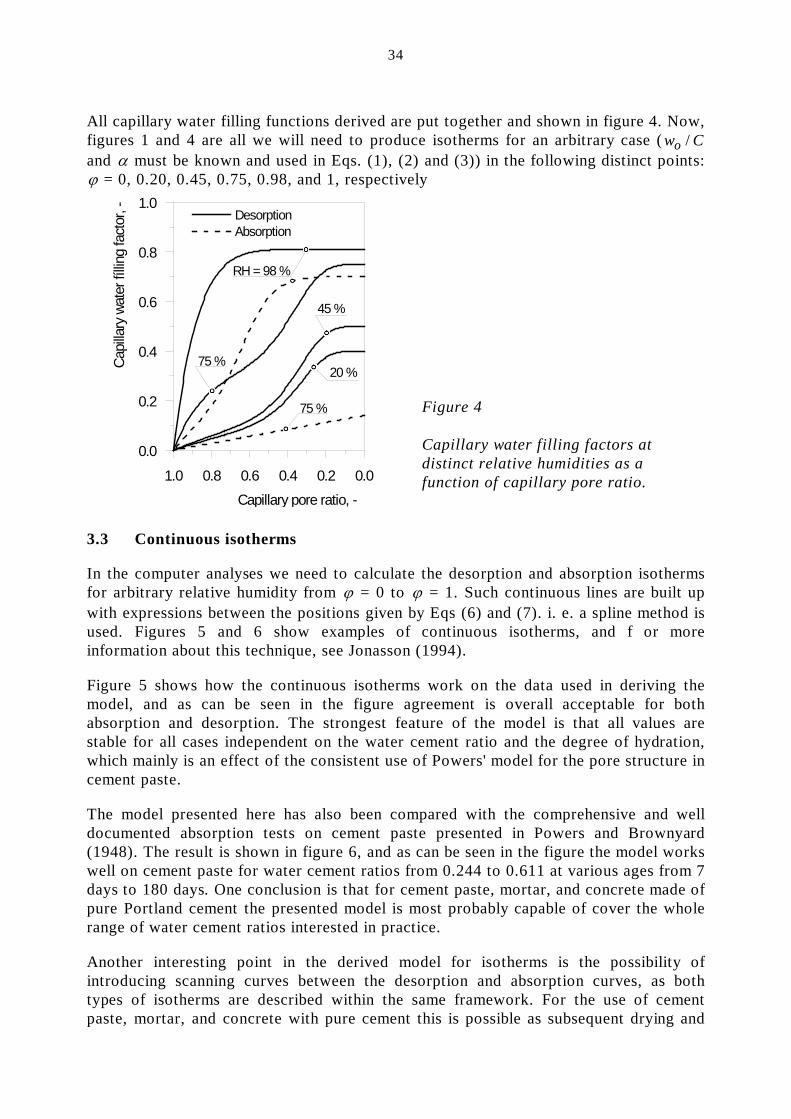
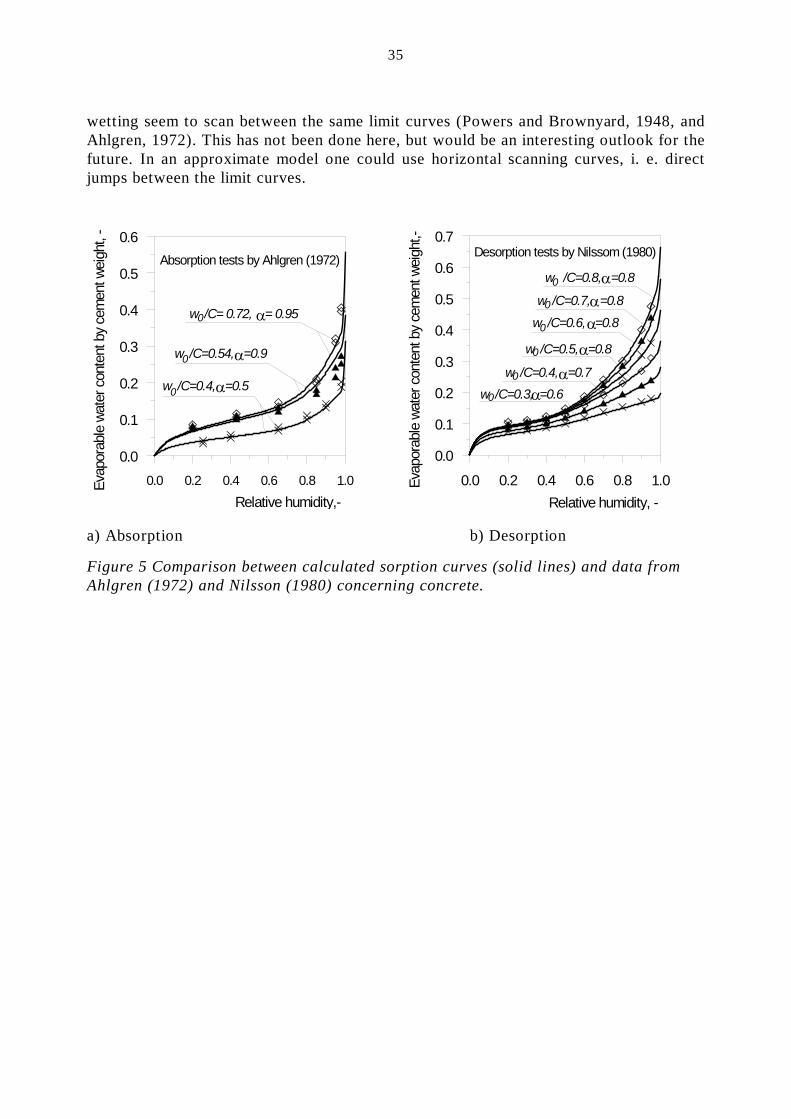
All capillary water filling functions derived are put together and shown in figure 4. Now, figures 1 and 4 are all we will need to produce isotherms for an arbitrary case ( w Co / and α must be known and used in Eqs. (1), (2) and (3)) in the following distinct points: ϕ = 0, 0.20, 0.45, 0.75, 0.98, and 1, respectively Figure 4 Capillary water filling factors at distinct relative humidities as a function of capillary pore ratio. 3.3 Continuous isotherms In the computer analyses we need to calculate the desorption and absorption isotherms for arbitrary relative humidity from ϕ = 0 to ϕ = 1. Such continuous lines are built up with expressions between the positions given by Eqs (6) and (7). i. e. a spline method is used. Figures 5 and 6 show examples of continuous isotherms, and f or more information about this technique, see Jonasson (1994). Figure 5 shows how the continuous isotherms work on the data used in deriving the model, and as can be seen in the figure agreement is overall acceptable for both absorption and desorption. The strongest feature of the model is that all values are stable for all cases independent on the water cement ratio and the degree of hydration, which mainly is an effect of the consistent use of Powers' model for the pore structure in cement paste. The model presented here has also been compared with the comprehensive and well documented absorption tests on cement paste presented in Powers and Brownyard (1948). The result is shown in figure 6, and as can be seen in the figure the model works well on cement paste for water cement ratios from 0.244 to 0.611 at various ages from 7 days to 180 days. One conclusion is that for cement paste, mortar, and concrete made of pure Portland cement the presented model is most probably capable of cover the whole range of water cement ratios interested in practice. Another interesting point in the derived model for isotherms is the possibility of introducing scanning curves between the desorption and absorption curves, as both types of isotherms are described within the same framework. For the use of cement paste, mortar, and concrete with pure cement this is possible as subsequent drying and
0.00.20.40.60.81.0Capillary pore ratio, -
0.0
0.2
0.4
0.6
0.8
1.0
Capi
llary
wat
er fí
lling
fact
or, - Desorption
Absorption
RH = 98 %
75 %
45 %
20 %
75 %
35
wetting seem to scan between the same limit curves (Powers and Brownyard, 1948, and Ahlgren, 1972). This has not been done here, but would be an interesting outlook for the future. In an approximate model one could use horizontal scanning curves, i. e. direct jumps between the limit curves. a) Absorption b) Desorption
Figure 5 Comparison between calculated sorption curves (solid lines) and data from Ahlgren (1972) and Nilsson (1980) concerning concrete.
0.0 0.2 0.4 0.6 0.8 1.0Relative humidity,-
0.0
0.1
0.2
0.3
0.4
0.5
0.6
Evap
orab
le w
ater
con
tent
by
cem
ent w
eigh
t, -
Absorption tests by Ahlgren (1972)
w /C= 0.72, = 0.950 α
w /C=0.54, =0.90 α
w /C=0.4, =0.50 α
0.0 0.2 0.4 0.6 0.8 1.0Relative humidity, -
0.0
0.1
0.2
0.3
0.4
0.5
0.6
0.7
Evap
orab
le w
ater
con
tent
by
cem
ent w
eigh
t,-
Desorption tests by Nilssom (1980)
w /C=0.8, =0.80 αw /C=0.7, =0.80 α
w /C=0.6, =0.80 α
w /C=0.5, =0.80 αw /C=0.4, =0.7α0
w /C=0.3, =0.60 α

36
Figure 6
Comparison between calculated
absorption isotherms (solid lines) and data from Powers and Brownyard
(1948) on cement pastes with three levels of water cement ratios at various curing ages.
4 EFFECTS OF ALKALI ON MOISTURE STATE 4.1 General The relative humidity in the media above the surface of saturated water solutions of potassium hydroxide, KOH, and sodium hydroxide, NaOH, is in the order of 11 % and 7 %, respectively. Different concentrations may be described by vapour pressure isotherms for aqueous solutions, see figure 7 from Powers and Brownyard (1948). From the figure it is seen that 1) the very steep curves at high humidities mean that small concentrations of alkali in water may have an influence on the equilibrium humidity near water saturation, and 2) at low humidities, say RH less than about 80 %, the water amount at equilibrium is very low and the flat curves indicate that the equilibrium state with respect to concentrations of alkali is almost independent on the relative humidity. The figure also show that KOH and NaOH have only a slight difference in their vapor pressure isotherms.
0.0 0.2 0.4 0.6 0.8 1.0Relative humidity, -
0.000.020.040.060.080.100.120.140.160.180.20
Evap
orab
le w
ater
con
tent
by
cem
ent w
eigh
t, -
Absoprtion , cement paste
Powers & Brownyard (1948):Age = 180 dAge = 28 dAge = 7 d
α = 0.56α = 0.49
α = 0.41
w /C = 0.2440
0.0 0.2 0.4 0.6 0.8 1.0Relative humidity, -
0.00
0.05
0.10
0.15
0.20
0.25
0.30
0.35
0.40
Evap
orab
le w
ater
con
tent
by
cem
ent w
eigh
t, -
Absoprtion , cement paste
Powers & Brownyard (1948):Age = 180 dAge = 28 dAge = 7 d
α = 0.89α = 0.74
α = 0.56
w /C = 0.4390
0.0 0.2 0.4 0.6 0.8 1.0Relative humidity, -
0.0
0.1
0.2
0.3
0.4
0.5
0.6
Evap
orab
le w
ater
con
tent
by
cem
ent w
eigh
t, -
Absoprtion , cement paste
Powers & Brownyard (1948):Age = 180 dAge = 28 dAge = 7 d
α = 0.87
α = 0.72α = 0.56
w /C = 0.6110
37
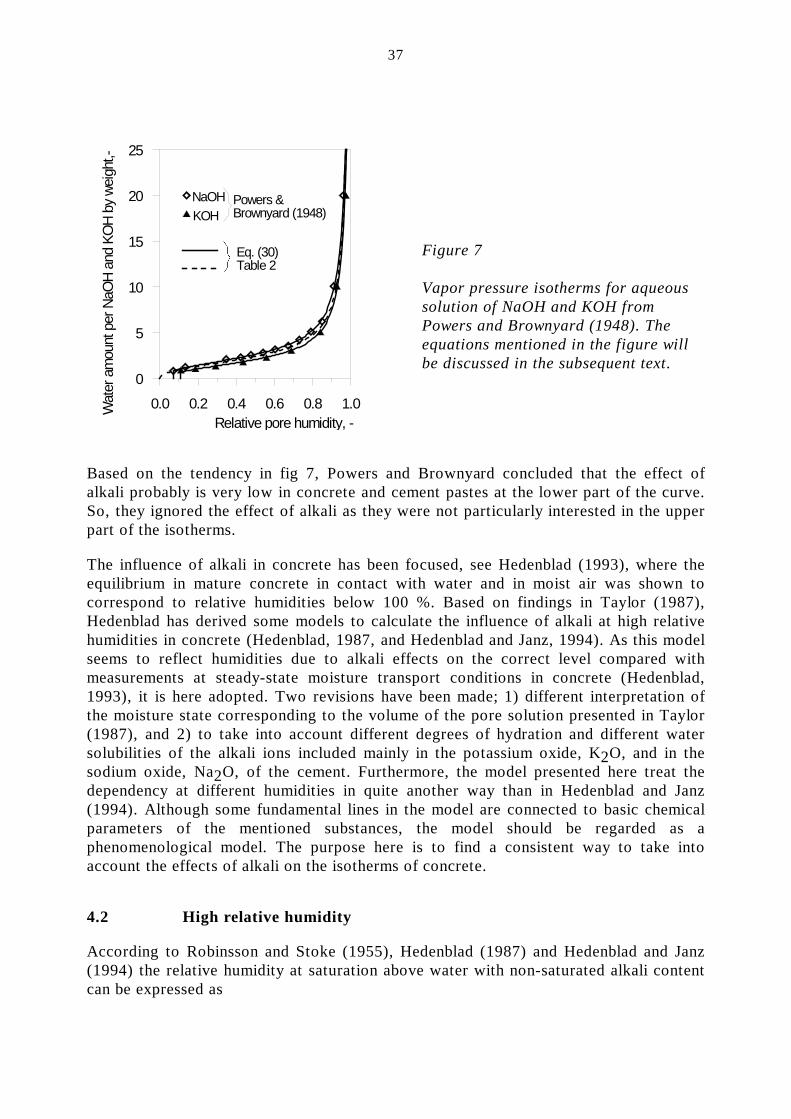
Figure 7
Vapor pressure isotherms for aqueous solution of NaOH and KOH from Powers and Brownyard (1948). The equations mentioned in the figure will be discussed in the subsequent text.
Based on the tendency in fig 7, Powers and Brownyard concluded that the effect of alkali probably is very low in concrete and cement pastes at the lower part of the curve. So, they ignored the effect of alkali as they were not particularly interested in the upper part of the isotherms. The influence of alkali in concrete has been focused, see Hedenblad (1993), where the equilibrium in mature concrete in contact with water and in moist air was shown to correspond to relative humidities below 100 %. Based on findings in Taylor (1987), Hedenblad has derived some models to calculate the influence of alkali at high relative humidities in concrete (Hedenblad, 1987, and Hedenblad and Janz, 1994). As this model seems to reflect humidities due to alkali effects on the correct level compared with measurements at steady-state moisture transport conditions in concrete (Hedenblad, 1993), it is here adopted. Two revisions have been made; 1) different interpretation of the moisture state corresponding to the volume of the pore solution presented in Taylor (1987), and 2) to take into account different degrees of hydration and different water solubilities of the alkali ions included mainly in the potassium oxide, K2O, and in the sodium oxide, Na2O, of the cement. Furthermore, the model presented here treat the dependency at different humidities in quite another way than in Hedenblad and Janz (1994). Although some fundamental lines in the model are connected to basic chemical parameters of the mentioned substances, the model should be regarded as a phenomenological model. The purpose here is to find a consistent way to take into account the effects of alkali on the isotherms of concrete. 4.2 High relative humidity According to Robinsson and Stoke (1955), Hedenblad (1987) and Hedenblad and Janz (1994) the relative humidity at saturation above water with non-saturated alkali content can be expressed as
0.0 0.2 0.4 0.6 0.8 1.0Relative pore humidity, -
0
5
10
15
20
25
Wat
er a
mou
nt p
er N
aOH
and
KOH
by w
eigh
t,-
NaOHKOH
Powers &Brownyard (1948)
Eq. (30)Table 2
38
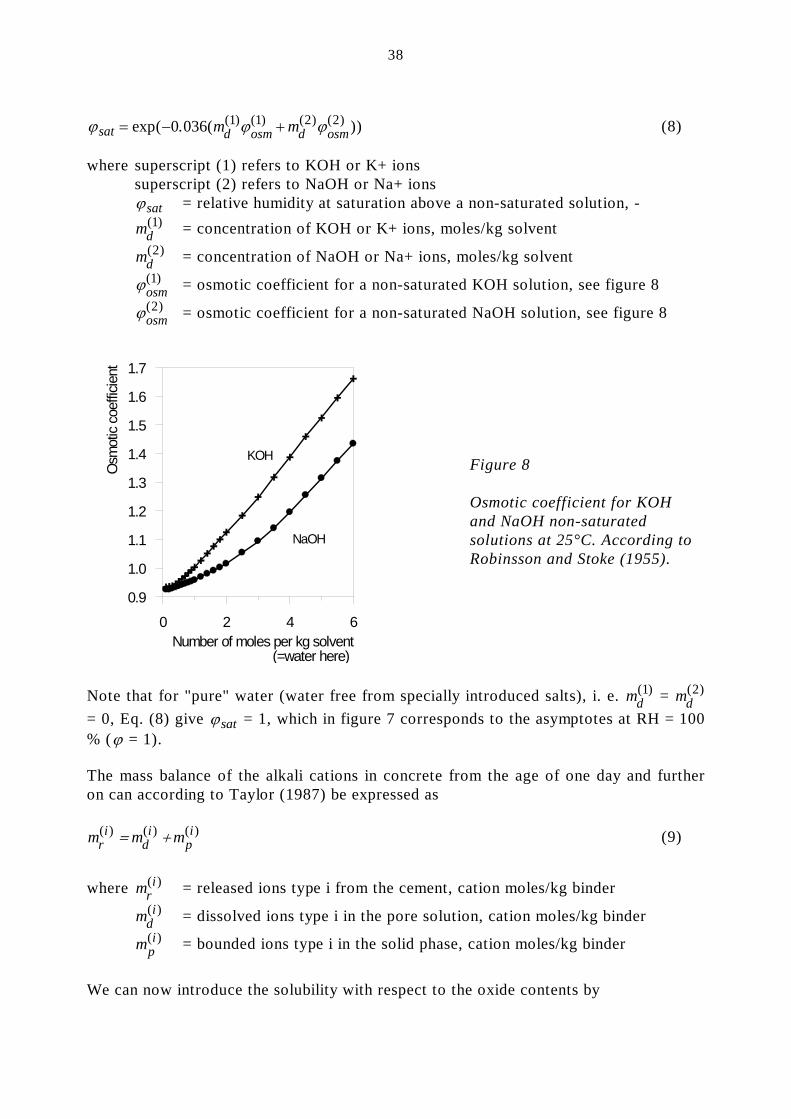
ϕ ϕ ϕsat d osm d osmm m= − +exp( . ( ))( ) ( ) ( ) ( )0 036 1 1 2 2 (8) where superscript (1) refers to KOH or K+ ions superscript (2) refers to NaOH or Na+ ions ϕsat = relative humidity at saturation above a non-saturated solution, - md
( )1 = concentration of KOH or K+ ions, moles/kg solvent
md( )2 = concentration of NaOH or Na+ ions, moles/kg solvent
ϕosm( )1 = osmotic coefficient for a non-saturated KOH solution, see figure 8
ϕosm( )2 = osmotic coefficient for a non-saturated NaOH solution, see figure 8
Figure 8
Osmotic coefficient for KOH and NaOH non-saturated solutions at 25°C. According to Robinsson and Stoke (1955).
Note that for "pure" water (water free from specially introduced salts), i. e. md
( )1 = md( )2
= 0, Eq. (8) give ϕsat = 1, which in figure 7 corresponds to the asymptotes at RH = 100 % (ϕ = 1). The mass balance of the alkali cations in concrete from the age of one day and further on can according to Taylor (1987) be expressed as m m mr
idi
pi( ) ( ) ( )= + (9)
where mr
i( ) = released ions type i from the cement, cation moles/kg binder
mdi( ) = dissolved ions type i in the pore solution, cation moles/kg binder
mpi( ) = bounded ions type i in the solid phase, cation moles/kg binder
We can now introduce the solubility with respect to the oxide contents by
0 2 4 6Number of moles per kg solvent (=water here)
0.9
1.0
1.1
1.2
1.3
1.4
1.5
1.6
1.7
Osm
otic
coef
ficie
nt
KOH
NaOH
39
m mri
ri
toti( ) ( ) ( )= δ (10)
where δr
i( ) = solubility of the cation type i from the oxide content of the cement, - mtot
i( ) = the total amount of cations type i in the cement according to the oxide content, cations/kg binder According to Öhman (1985) the solubility of cations in Portland cements produced in Sweden is in the order of 80 % to 100 %. This water solubility is believed to be independent on the degree of reaction of the cement. From discussions with Johansson (1994), we may as a typical value for all Portland cements produced in Sweden without any specific investigation use δr
i( ) .≈ 0 9 . (11) The total amount of cations in the cement can easily be calculated as
K+ : m K OC
MM M Mtot
K
K O K
( )1 2 22
1=+
(12)
Na+ : m Na OC
MM M Mtot
Na
Na O Na
( )2 2 22
1=+
(13)
where K OC2 = potassium oxide content by weight of the cement, -
Na OC
2 = sodium oxide content by weight of the cement, -
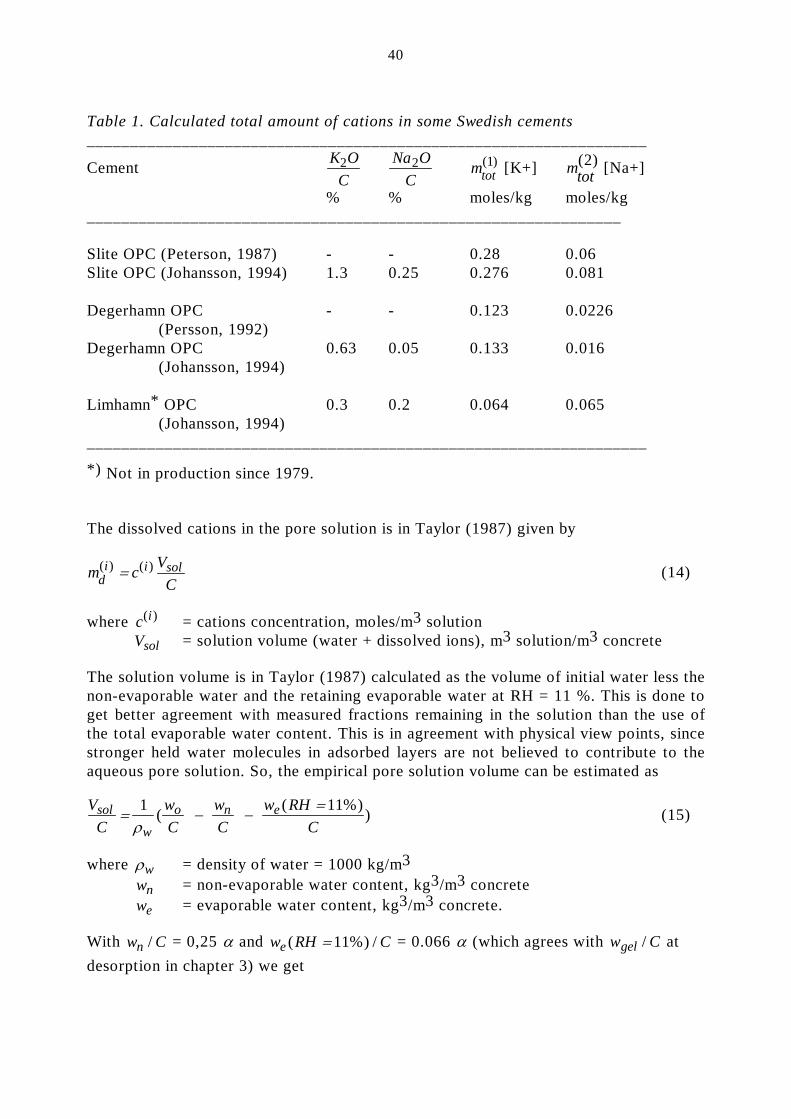
M j = molar weight of the ion denoted j, kg/mole Calculated total amounts of cations in some cements are shown in table 1.
40
Table 1. Calculated total amount of cations in some Swedish cements _________________________________________________________________
Cement K OC2 Na O
C2 mtot
( )1 [K+] mtot( )2 [Na+]
% % moles/kg moles/kg ______________________________________________________________ Slite OPC (Peterson, 1987) - - 0.28 0.06 Slite OPC (Johansson, 1994) 1.3 0.25 0.276 0.081 Degerhamn OPC - - 0.123 0.0226 (Persson, 1992) Degerhamn OPC 0.63 0.05 0.133 0.016 (Johansson, 1994) Limhamn* OPC 0.3 0.2 0.064 0.065 (Johansson, 1994) _________________________________________________________________ *) Not in production since 1979.
The dissolved cations in the pore solution is in Taylor (1987) given by
m c VCd
i i sol( ) ( )= (14)
where c i( ) = cations concentration, moles/m3 solution Vsol = solution volume (water + dissolved ions), m3 solution/m3 concrete The solution volume is in Taylor (1987) calculated as the volume of initial water less the non-evaporable water and the retaining evaporable water at RH = 11 %. This is done to get better agreement with measured fractions remaining in the solution than the use of the total evaporable water content. This is in agreement with physical view points, since stronger held water molecules in adsorbed layers are not believed to contribute to the aqueous pore solution. So, the empirical pore solution volume can be estimated as V
CwC
wC
w RHC
sol
w
o n e= − − =1 11ρ
( ( %) ) (15)
where ρw = density of water = 1000 kg/m3 wn = non-evaporable water content, kg3/m3 concrete we = evaporable water content, kg3/m3 concrete. With w Cn / = 0,25 α and w RH Ce ( %) /= 11 = 0.066 α (which agrees with w Cgel / at desorption in chapter 3) we get
41
VC
wC
sol
w
o= −1 0 316ρ
α( . ) (16)
The calculations of the pore solution volume in Eq. (16) was originally assumed to consist of initial water less the non-evaporable water, which by definition is the evaporable water content at sealed conditions. So, here I interpret Eq (16) to be valid for sealed curing conditions. The amount of ions bounded in the C-S-H gel is in Taylor empirically described on the form
m cV
Cpi sol i= ( )
*( )( ) (17)
where Vsol
* = a fictitious solution volume to get the correct binding effect in the solid phase, m3 solution/m3 concrete.
At complete hydration of CRP = "calcium in relevant products" Taylor has found that V Csol
* / approaches 0.20 ⋅ 10-3 m3 solution/kg binder for the K+ ions, and 0.31 ⋅ 10-3 m3 solution/kg binder for the Na+ ions. Taylor has shown that CRP can for pure Portland cement be approximated with the degree of hydration (α) in the ordinary way, which leads to
( )*
( ) ( )VC
vsol i iref= β α (18)
where vref = reference solution volume = 1 ⋅ 10-3 m3/kg binder
β( )1 = 0.20 for K+ ions β( )2 = 0.31 for Na+ ions Combining Eq. (18) with Eqs. (10) –(17) gives
cmi r
i( )
( )
)=
wC
- (0.316 - o (i)
103
β α (19)
The amount of bounded ions to the total amount of ions can now be expressed as
( )( . )
( )( )
( )
mm
p
r
ii
i=
− −
β α
β α
wC
o 0 316 (20)
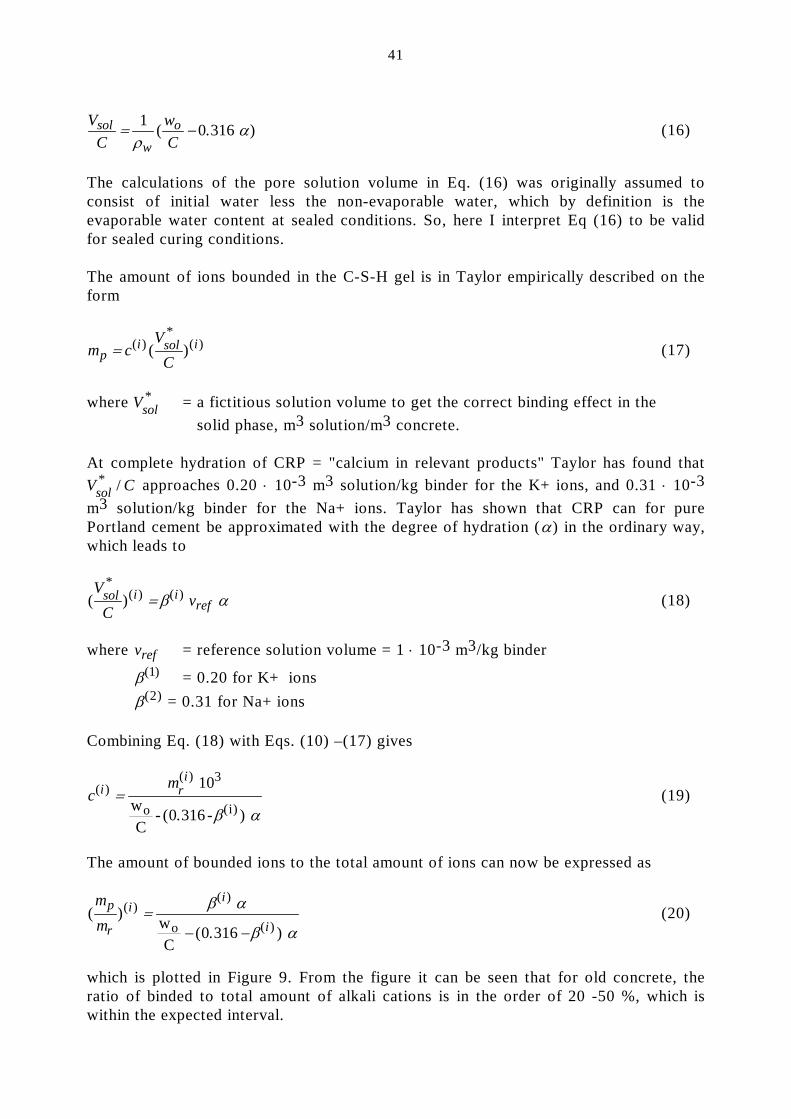
which is plotted in Figure 9. From the figure it can be seen that for old concrete, the ratio of binded to total amount of alkali cations is in the order of 20 -50 %, which is within the expected interval.
42
Figure 9. Ratios of binded to total amount of released ions according to Eq. (20). For the use of Eq. (8) the alkali concentrations must be expressed in moles per weight of the solvent, which here is pure water. The components of 1 kg of the solution can be expressed as
1 10= + ∑ω
ργ
sol
i i
ic( )( ) ( ) (21)
where ω0 = kg water/kg solution ρsol = density of the solution, kg solution/m3 solution γ ( )i = molar weight of solution i, kg/mole. γ ( )1 = 0.0561 kg/mole for KOH, and γ ( )2 = 0.040 kg/mole for NaOH. From Eq. (21) we get ω ρ ρ γ0 sol sol
i i
ic= − ∑ ( )( ) ( ) (22)
To get the alkali concentration in moles per weight of solvent, Eq. (19) is divided by Eq. (22) and by taking into account that ρsol approximately equals ρw = 1000 kg/m3 we get
m c mwC
cdi
i
sol
ri
o i i i
i
( )( ) ( )
( ) ( ) ( )( . ) ( )
= =− −
⋅− − ∑ω ρ β α γ0 3
0 316
11 10
(23)
Eq. (8) with the use of Eq. (23) is plotted in figure 10. The asterisks in figure 10 represents old concrete in practice following degrees of hydration: wCo ≥ 0 5. :α = 0 8. (24a)
0.0 0.1 0.2 0.3 0.4 0.5 0.6 0.7 0.8 0.9 1.0Degree of hydration, -
0.00.10.20.30.40.50.60.70.80.91.0
Bind
ed to
tota
l am
ount
of i
ons,
-
w /C = 0.30
w /C = 0.40
w /C = 0.50
w /C = 0.60
w /C = 0.70w /C = 0.80
K+ ionsNa+ ions
Maximum degreeof hydration
Practical degree of hydrationfor old concrete
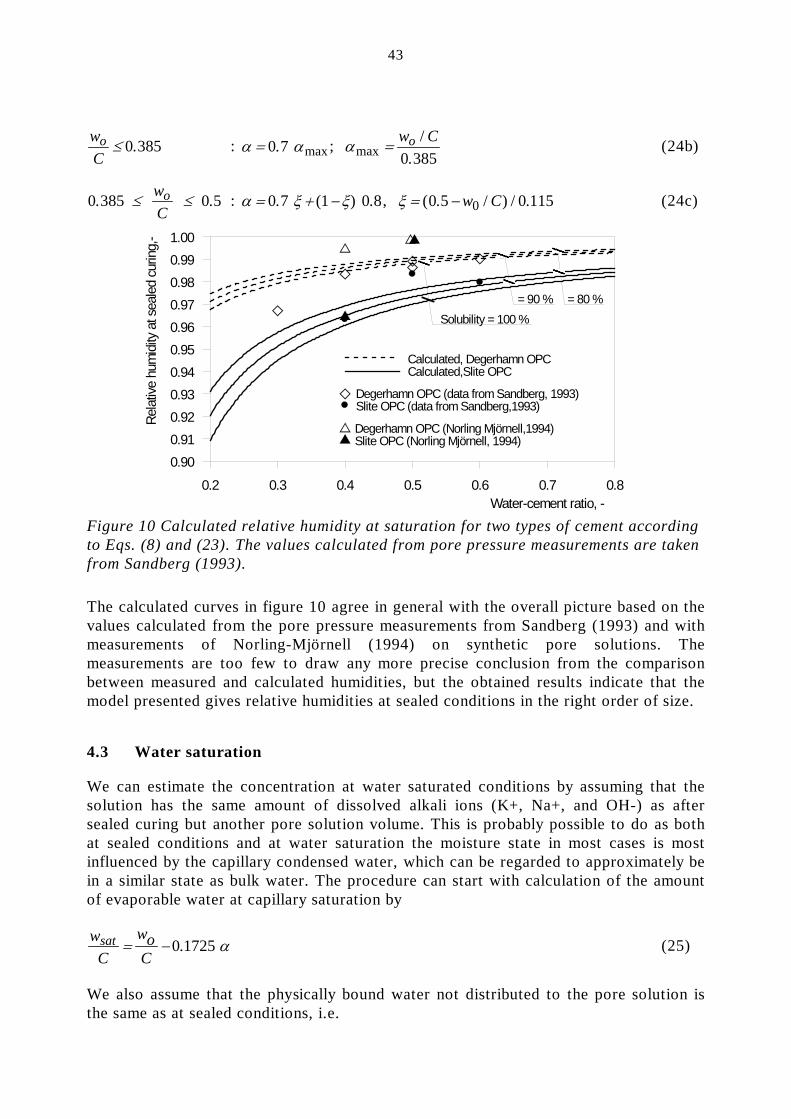
43
wC
o ≤ 0 385. : α α= 0 7. max ; αmax/
.= w Co
0 385 (24b)
0 385 0 5. . ≤ ≤wCo : α ξ ξ= + −0 7 1 0 8. ( ) . , ξ = −( . / ) / .0 5 0 1150w C (24c)
Figure 10 Calculated relative humidity at saturation for two types of cement according to Eqs. (8) and (23). The values calculated from pore pressure measurements are taken from Sandberg (1993).
The calculated curves in figure 10 agree in general with the overall picture based on the values calculated from the pore pressure measurements from Sandberg (1993) and with measurements of Norling-Mjörnell (1994) on synthetic pore solutions. The measurements are too few to draw any more precise conclusion from the comparison between measured and calculated humidities, but the obtained results indicate that the model presented gives relative humidities at sealed conditions in the right order of size. 4.3 Water saturation We can estimate the concentration at water saturated conditions by assuming that the solution has the same amount of dissolved alkali ions (K+, Na+, and OH-) as after sealed curing but another pore solution volume. This is probably possible to do as both at sealed conditions and at water saturation the moisture state in most cases is most influenced by the capillary condensed water, which can be regarded to approximately be in a similar state as bulk water. The procedure can start with calculation of the amount of evaporable water at capillary saturation by w
CwoC
sat = − 0 1725. α (25)
We also assume that the physically bound water not distributed to the pore solution is the same as at sealed conditions, i.e.
0.2 0.3 0.4 0.5 0.6 0.7 0.8Water-cement ratio, -
0.900.910.920.930.940.950.960.970.980.991.00
Rela
tive
hum
idity
at s
eale
d cu
ring,
-
Degerhamn OPC (data from Sandberg, 1993)Slite OPC (data from Sandberg,1993)
Degerhamn OPC (Norling Mjörnell,1994)Slite OPC (Norling Mjörnell, 1994)
Calculated, Degerhamn OPCCalculated,Slite OPC
Solubility = 100 %= 90 % = 80 %
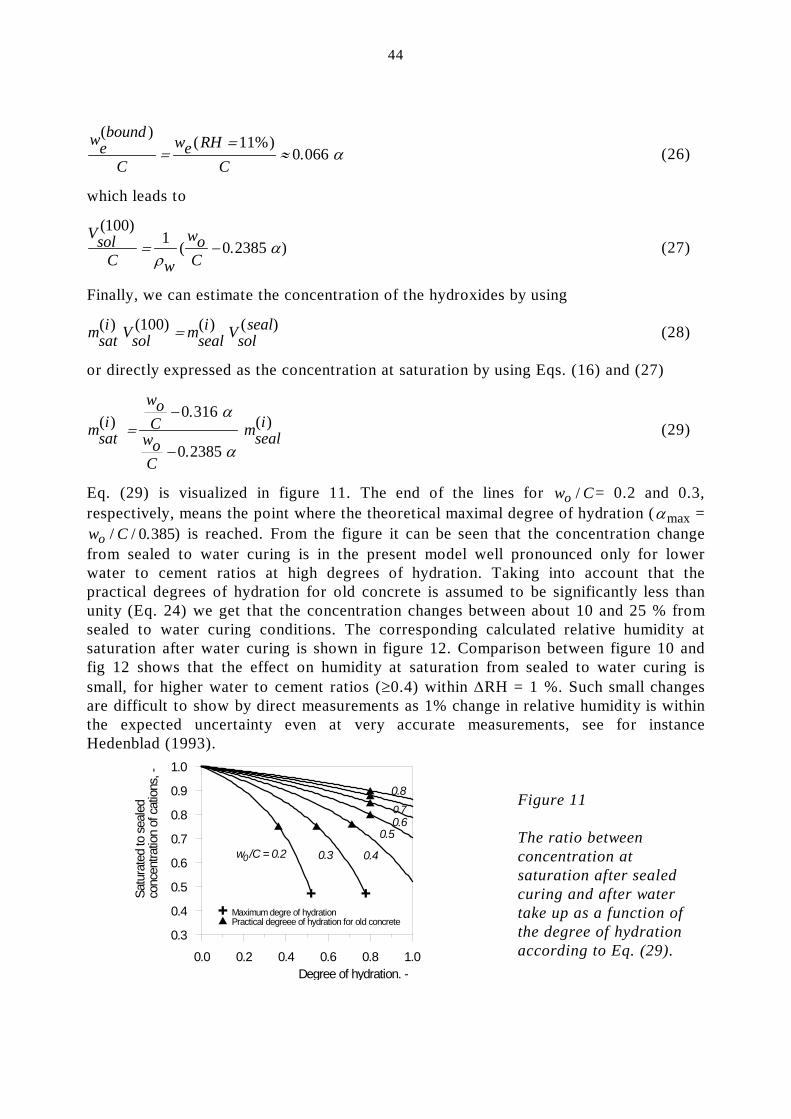
44
webound
Cwe RH
C
( ) ( %).=
=≈
110 066 α (26)
which leads to
VsolC w
woC
( )( . )
1001 0 2385= −
ρα (27)
Finally, we can estimate the concentration of the hydroxides by using
msati Vsol mseal
i Vsolseal( ) ( ) ( ) ( ) 100 = (28)
or directly expressed as the concentration at saturation by using Eqs. (16) and (27)
msati
woC
woC
mseali( ) .
.
( )
=
−
−
0 316
0 2385
α
α (29)
Eq. (29) is visualized in figure 11. The end of the lines for w Co / = 0.2 and 0.3, respectively, means the point where the theoretical maximal degree of hydration (αmax = w Co / / .0 385) is reached. From the figure it can be seen that the concentration change from sealed to water curing is in the present model well pronounced only for lower water to cement ratios at high degrees of hydration. Taking into account that the practical degrees of hydration for old concrete is assumed to be significantly less than unity (Eq. 24) we get that the concentration changes between about 10 and 25 % from sealed to water curing conditions. The corresponding calculated relative humidity at saturation after water curing is shown in figure 12. Comparison between figure 10 and fig 12 shows that the effect on humidity at saturation from sealed to water curing is small, for higher water to cement ratios (≥0.4) within ∆RH = 1 %. Such small changes are difficult to show by direct measurements as 1% change in relative humidity is within the expected uncertainty even at very accurate measurements, see for instance Hedenblad (1993).
Figure 11
The ratio between concentration at saturation after sealed curing and after water take up as a function of the degree of hydration according to Eq. (29).
0.0 0.2 0.4 0.6 0.8 1.0Degree of hydration. -
0.3
0.4
0.5
0.6
0.7
0.8
0.9
1.0
Satu
rate
d to
sea
led
co
ncen
tratio
n of
cat
ions
, -
Maximum degre of hydrationPractical degreee of hydration for old concrete
w /C = 0.20 0.3 0.4
0.50.60.7
0.8
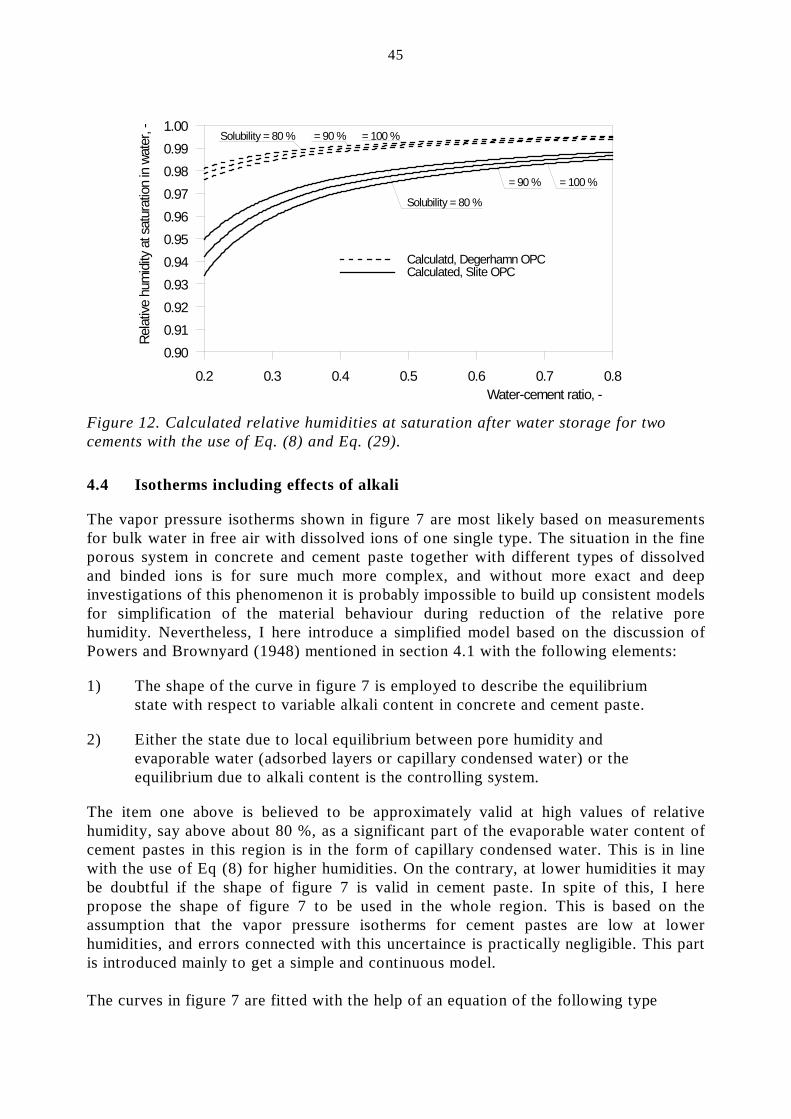
45
Figure 12. Calculated relative humidities at saturation after water storage for two cements with the use of Eq. (8) and Eq. (29).
4.4 Isotherms including effects of alkali The vapor pressure isotherms shown in figure 7 are most likely based on measurements for bulk water in free air with dissolved ions of one single type. The situation in the fine porous system in concrete and cement paste together with different types of dissolved and binded ions is for sure much more complex, and without more exact and deep investigations of this phenomenon it is probably impossible to build up consistent models for simplification of the material behaviour during reduction of the relative pore humidity. Nevertheless, I here introduce a simplified model based on the discussion of Powers and Brownyard (1948) mentioned in section 4.1 with the following elements: 1) The shape of the curve in figure 7 is employed to describe the equilibrium state with respect to variable alkali content in concrete and cement paste. 2) Either the state due to local equilibrium between pore humidity and evaporable water (adsorbed layers or capillary condensed water) or the equilibrium due to alkali content is the controlling system. The item one above is believed to be approximately valid at high values of relative humidity, say above about 80 %, as a significant part of the evaporable water content of cement pastes in this region is in the form of capillary condensed water. This is in line with the use of Eq (8) for higher humidities. On the contrary, at lower humidities it may be doubtful if the shape of figure 7 is valid in cement paste. In spite of this, I here propose the shape of figure 7 to be used in the whole region. This is based on the assumption that the vapor pressure isotherms for cement pastes are low at lower humidities, and errors connected with this uncertaince is practically negligible. This part is introduced mainly to get a simple and continuous model. The curves in figure 7 are fitted with the help of an equation of the following type
0.2 0.3 0.4 0.5 0.6 0.7 0.8Water-cement ratio, -
0.900.910.920.930.940.950.960.970.980.991.00
Rela
tive
hum
idity
at s
atur
atio
n in
wat
er, -
Calculatd, Degerhamn OPCCalculated, Slite OPC
Solubility = 80 % = 90 % = 100 %
Solubility = 80 %
= 90 % = 100 %

46
−
−−
= 21 1
KOHwor δ
ϕϕδω))ln((NaOH
wOH (30)
where wNaOH
and wKOH
represents the vertical axis in figure 7
ω δ δOH , , and 1 2 are mathematical fitting coefficients. Thereby δ1 and δ2 determine the shape of the curves, and ωOH acts as a scale factor. Note that Eq. (30) is of the same type as Eq. (8), and that the condition that the water amount approaches infinity when ϕ approaches unity is fulfilled automatically. The values of the coefficients for the curves in figure 7 are shown in table 2. Table 2. Coefficient of Eq (30) for the curves shown in figure 7. ______________________________________________________________ Type of curve (Figure 7) δ1 δ2 ωOH ______________________________________________________________ KOH, solid line 0.800 0.114 3.5 NaOH, solid line 0.797 0.102 2.95 Average curve, dashed line 0.807 0.109 3.22 ______________________________________________________________
When the alkali content in the cement is known, i. e. m mtot tot( ) ( )1 2 and in Eqs. (12) and (13)
are known, the calculations outlined above end up with a relative humidity at saturation, ϕsat , based on the concentrations at saturation estimated by Eq. (29). The new rescaled alkali influenced isotherm is expressed by wC
wC
AA
sat= γ (31)
where wA = water content in the concrete imagined as the equilibrium state with respect to the alkali concentration in the pore solution, kg/m3 γ A = fraction of the water content at saturation associated with the equilibrium state including alkali effects (0 ≤ γ A ≤ 1). With the shape of the curve determined from Eq. (30) we get
−
−= 2
1))(-ln( 1 δ
ϕϕδγγ satA (32)
and the scale factor, γ sat , is determined from the condition to catch the point (ϕsat satw C, / ), which yields

47
1 1
21
−
−
−−
= δϕϕδ
γ))ln(( sat
satsat (33)
This means that two classes of isotherms have been established; 1) without respect to alkali effects from section 3.3 and 2) the curve described by Eqs. (31) – (33). The application of the method outlined here is now simply to choose the upper curve as the one controlling the equilibrium state between relative pore humidity and water content, i. e. for a given water content the lowest possible relative humidity is chosen, see figure 13. The moisture capacity for the alkali influenced isotherm is the derivative with respect to humidity of Eq. (31), which gives dw C
ddd
wC
A A sat/ϕ
γϕ
= (34)
with
( )
−−= )ln((
)ln(dd
satA ϕδ
ϕϕγ
ϕγ 111 12 (35)
Figure 13 Shift of isotherms with respect to alkali at high relative humidity
An example of calculation of all three isotherms derived here ,i. e. at desorption, at absorption, and at alkali equilibrium, is shown in figure 14 for Cement Slite Std P with the water cement ratio 0.4 and 70 percent degree of hydration. As can be seen in the figure, in this model the alkali effect may be regarded as a reduction of the maximum possible humidity from unity to about 97 percent. The upper part of figure 14 is enlarged and shown as figure 15a, where the water saturated state in pure water is marked with a non-filled circle, and the water saturation state with respect to alkali ions in the water is marked with a filled circle. Subfigure b and c show the corresponding calculated part of the isotherms for the two cements Degerhamn Std P and Limhamn Std P, respectively. From the figure it is obvious that for these low alkali cements, see table 1, the maximum humidity is reduced only to about 99 percent. So, for cements with low
ϕ
ϕ
γ γ
γ
wC
w w
C C
wC
wC
1
+
sat sat
gel cap
e sat
g c
A
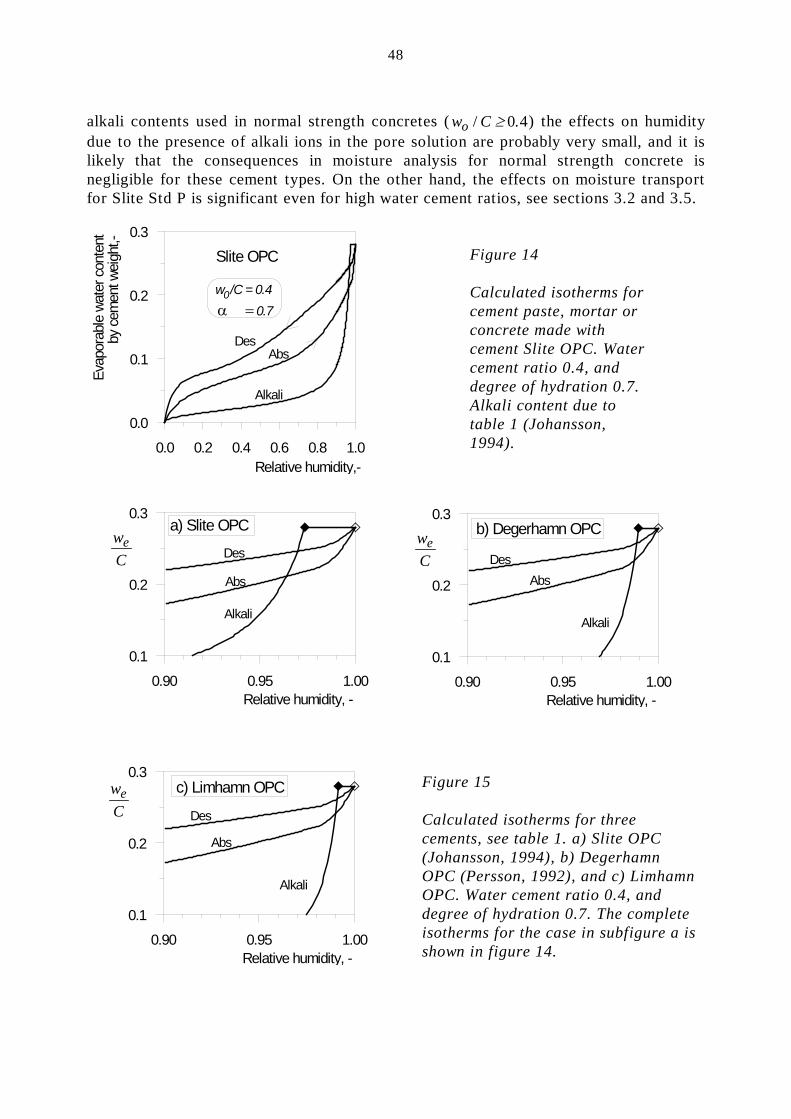
48
alkali contents used in normal strength concretes ( w Co / .≥ 0 4) the effects on humidity due to the presence of alkali ions in the pore solution are probably very small, and it is likely that the consequences in moisture analysis for normal strength concrete is negligible for these cement types. On the other hand, the effects on moisture transport for Slite Std P is significant even for high water cement ratios, see sections 3.2 and 3.5. Figure 14 Calculated isotherms for cement paste, mortar or concrete made with cement Slite OPC. Water cement ratio 0.4, and degree of hydration 0.7. Alkali content due to table 1 (Johansson, 1994). Figure 15 Calculated isotherms for three
cements, see table 1. a) Slite OPC (Johansson, 1994), b) Degerhamn
OPC (Persson, 1992), and c) Limhamn OPC. Water cement ratio 0.4, and degree of hydration 0.7. The complete isotherms for the case in subfigure a is shown in figure 14.
0.0 0.2 0.4 0.6 0.8 1.0Relative humidity,-
0.0
0.1
0.2
0.3
Evap
orab
le w
ater
con
tent
b
y ce
men
t wei
ght,-
DesAbs
Alkali
Slite OPC
w /C = 0.40α = 0.7
0.90 0.95 1.00Relative humidity, -
0.1
0.2
0.3a) Slite OPC
Des
Abs
Alkali
0.90 0.95 1.00Relative humidity, -
0.1
0.2
0.3b) Degerhamn OPC
DesAbs
Alkali
0.90 0.95 1.00Relative humidity, -
0.1
0.2
0.3c) Limhamn OPC
Des
Abs
Alkali
Cwe
Cwe
Cwe
49
REFERENCES Ahlgren L (1972): Moisture fixation in porous building materials (in Swedish), Report
36, Division of Building Technology, The Lund Institute of Technology, Lund Auskern H and Horn W (1973): Capillary porosity in hardened cement paste, Journal of
Testing and Evaluation, Vol. 1, pp 74-79. Fagerlund G (1976): Moisture in concrete (in Swedish), Swedish Cement and Concrete
Research Institute, (writers: Ahlgren L, Bergströn S G, Fagerlund G and Nilsson L-O), pp 15-58.
Fagerlund G (1983): Influence of slag cements on the frost resistance of the green concrete, Swedish Cement and Concrete Research Institute, Fo/Research 3:83, Stockholm.
Fagerlund G (1993): The long time water absorption in the air pore structure of concrete, Lund Institute of Technology, Division of Building Materials, Report TVBM-3051, Lund.
Hedenblad G (1987): Effects of salts on the equilibrium isotherm (in Swedish), Lund Institute of Technology, Division of Building Materials, Report TVBM-3031, Lund.
Hedenblad G (1993): Moisture permeability of mature concrete, cement, cement mortar and cement paste, Lund Institute of Technology, Division of Building Materials, Doctoral thesis, Lund.
Hedenblad G and Janz M (1994): Effects ofalkali on measured RH in concrete (in Swedish), Lund Institute of Technology, Division of Building Materials, Report TVBM-3057, Lund.
Johansson S-E (1994): Private communication with the chief of the chemistry department in Cementa, Lund.
Jonasson J-E (1984): Slipform construction – calculations for assessing protection against early freezing, Swedish Cement and Concrete Research Institute, Fo/Research 4:84, Stockholm.
Jonasson J-E (1994): Modelling of temperature, moisture and stresses in young concrete, Division of Structural Engineering, Luleå University of Technology, Doctoral thesis 1994:153D, Luleå.
Nilsson L-O (1980): Hygroscopic moisture in concrete – drying, measurements and related properties, Lund Institute of Technology, Division of Building Materials, Report TVBM-1003, Lund.
Norling Mjörnell K (1994): Self-desiccation in concrete, Chalmers University of Technology, Department of Building Materials, Publ. P-94:2, Göteborg.
Persson B (1992): Hydration of high performance concrete, structure and strength – data and calculations (in Swedish), Lund Institute of Technology, Division of Building Materials, Lund.
Peterson O (1987): (Cited from Hedenblad and Janz, 1994.) Powers T C (1960): Physical properties of cement paste, 4th Int. Symposium on the Chemistry
of Cement, session V, National Bureau of Standards, Monograph 43 – Volume II, pp 577- 613.
Powers T C and Brownyard T L (1948): Studies of the physical properties of hardened Portland cement paste. Research Laboratories of the Portland Cement Association, Bulletin 22, Chicago.
Robinsson and Stoke (1955): (Cited from Hedenblad and Janz, 1994.) Sandberg P (1993): Private communication. (Cited from Hedenblad and Janz, 1994) Taylor H F W (1987): A method for prediction alkali ion concentrations in cement pore
solutions, Advances in Cement Research, Vol. 1, No. 1, October, pp 5-17. Öhman M (1985): Soluble alkali in our cements (in Swedish), Cementa AB, CM Report T-
85001, Slite.

50
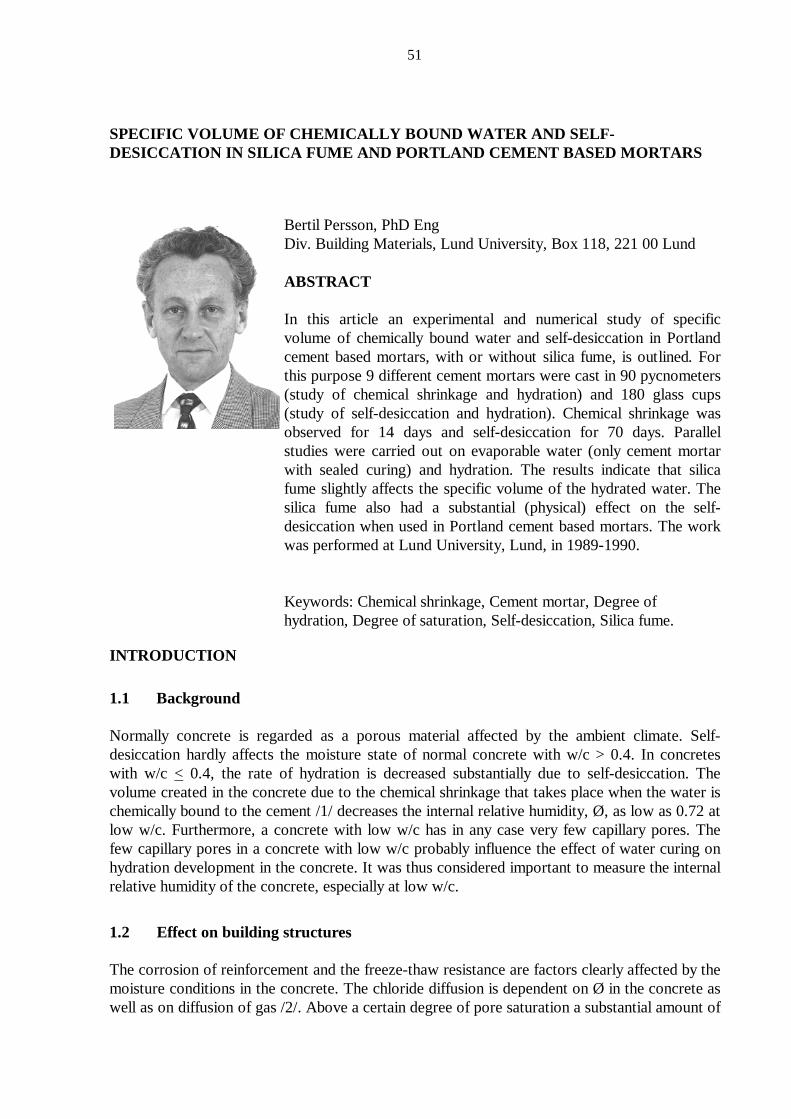
51
SPECIFIC VOLUME OF CHEMICALLY BOUND WATER AND SELF-DESICCATION IN SILICA FUME AND PORTLAND CEMENT BASED MORTARS
Bertil Persson, PhD Eng Div. Building Materials, Lund University, Box 118, 221 00 Lund ABSTRACT In this article an experimental and numerical study of specific volume of chemically bound water and self-desiccation in Portland cement based mortars, with or without silica fume, is outlined. For this purpose 9 different cement mortars were cast in 90 pycnometers (study of chemical shrinkage and hydration) and 180 glass cups (study of self-desiccation and hydration). Chemical shrinkage was observed for 14 days and self-desiccation for 70 days. Parallel studies were carried out on evaporable water (only cement mortar with sealed curing) and hydration. The results indicate that silica fume slightly affects the specific volume of the hydrated water. The silica fume also had a substantial (physical) effect on the self-desiccation when used in Portland cement based mortars. The work was performed at Lund University, Lund, in 1989-1990. Keywords: Chemical shrinkage, Cement mortar, Degree of hydration, Degree of saturation, Self-desiccation, Silica fume.
INTRODUCTION
1.1 Background Normally concrete is regarded as a porous material affected by the ambient climate. Self-desiccation hardly affects the moisture state of normal concrete with w/c > 0.4. In concretes with w/c < 0.4, the rate of hydration is decreased substantially due to self-desiccation. The volume created in the concrete due to the chemical shrinkage that takes place when the water is chemically bound to the cement /1/ decreases the internal relative humidity, Ø, as low as 0.72 at low w/c. Furthermore, a concrete with low w/c has in any case very few capillary pores. The few capillary pores in a concrete with low w/c probably influence the effect of water curing on hydration development in the concrete. It was thus considered important to measure the internal relative humidity of the concrete, especially at low w/c.
1.2 Effect on building structures The corrosion of reinforcement and the freeze-thaw resistance are factors clearly affected by the moisture conditions in the concrete. The chloride diffusion is dependent on Ø in the concrete as well as on diffusion of gas /2/. Above a certain degree of pore saturation a substantial amount of
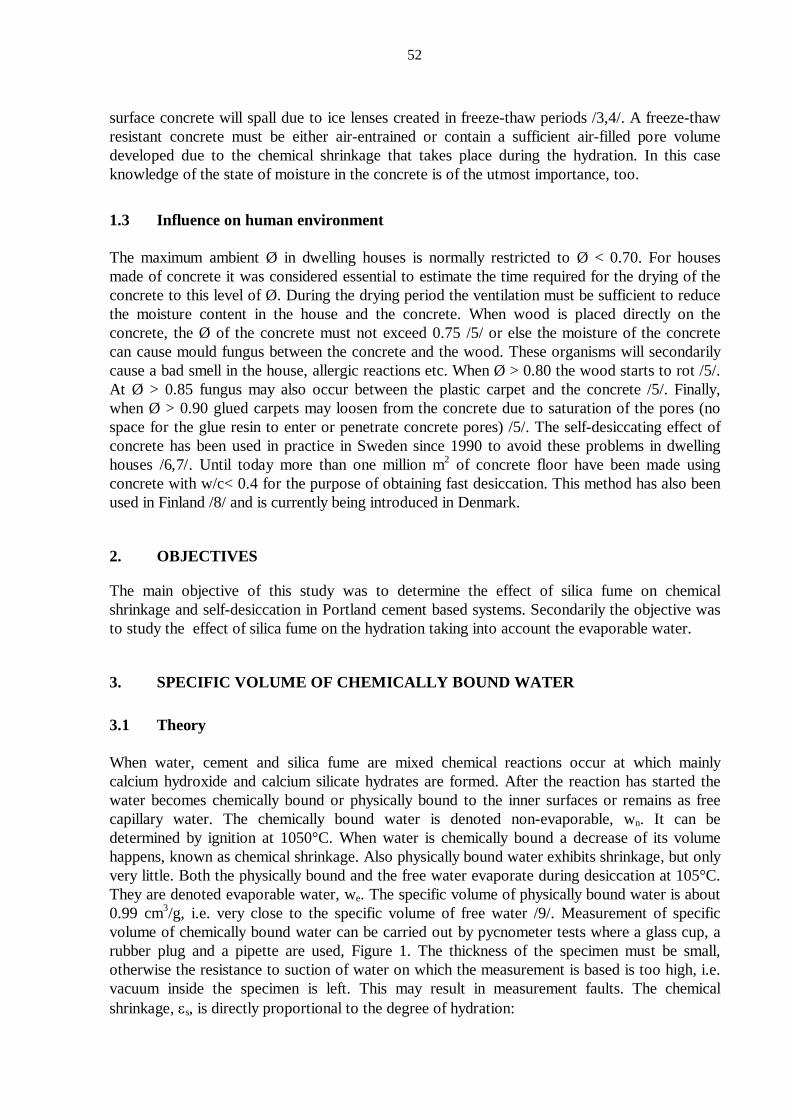
52
surface concrete will spall due to ice lenses created in freeze-thaw periods /3,4/. A freeze-thaw resistant concrete must be either air-entrained or contain a sufficient air-filled pore volume developed due to the chemical shrinkage that takes place during the hydration. In this case knowledge of the state of moisture in the concrete is of the utmost importance, too.
1.3 Influence on human environment The maximum ambient Ø in dwelling houses is normally restricted to Ø < 0.70. For houses made of concrete it was considered essential to estimate the time required for the drying of the concrete to this level of Ø. During the drying period the ventilation must be sufficient to reduce the moisture content in the house and the concrete. When wood is placed directly on the concrete, the Ø of the concrete must not exceed 0.75 /5/ or else the moisture of the concrete can cause mould fungus between the concrete and the wood. These organisms will secondarily cause a bad smell in the house, allergic reactions etc. When Ø > 0.80 the wood starts to rot /5/. At Ø > 0.85 fungus may also occur between the plastic carpet and the concrete /5/. Finally, when Ø > 0.90 glued carpets may loosen from the concrete due to saturation of the pores (no space for the glue resin to enter or penetrate concrete pores) /5/. The self-desiccating effect of concrete has been used in practice in Sweden since 1990 to avoid these problems in dwelling houses /6,7/. Until today more than one million m2 of concrete floor have been made using concrete with w/c< 0.4 for the purpose of obtaining fast desiccation. This method has also been used in Finland /8/ and is currently being introduced in Denmark.
2. OBJECTIVES
The main objective of this study was to determine the effect of silica fume on chemical shrinkage and self-desiccation in Portland cement based systems. Secondarily the objective was to study the effect of silica fume on the hydration taking into account the evaporable water.
3. SPECIFIC VOLUME OF CHEMICALLY BOUND WATER
3.1 Theory When water, cement and silica fume are mixed chemical reactions occur at which mainly calcium hydroxide and calcium silicate hydrates are formed. After the reaction has started the water becomes chemically bound or physically bound to the inner surfaces or remains as free capillary water. The chemically bound water is denoted non-evaporable, wn. It can be determined by ignition at 1050°C. When water is chemically bound a decrease of its volume happens, known as chemical shrinkage. Also physically bound water exhibits shrinkage, but only very little. Both the physically bound and the free water evaporate during desiccation at 105°C. They are denoted evaporable water, we. The specific volume of physically bound water is about 0.99 cm3/g, i.e. very close to the specific volume of free water /9/. Measurement of specific volume of chemically bound water can be carried out by pycnometer tests where a glass cup, a rubber plug and a pipette are used, Figure 1. The thickness of the specimen must be small, otherwise the resistance to suction of water on which the measurement is based is too high, i.e. vacuum inside the specimen is left. This may result in measurement faults. The chemical shrinkage, εs, is directly proportional to the degree of hydration:

53
Figure 1 Test arrangement for pycnometer tests of chemical shrinkage. εs = k1·wn (1) α = (wn/c)·(1/k2 ) (2) k1 ≈0.25 for Portland cement based mortar with “normal” w/c k2 ≈0.25 for Portland cement based mortar (when all cement is hydrated) α denotes the degree of hydration From equations (1) and (2) the following equation was obtained: εs = k1·k2·α·c≈ 0.063·α·c (3) At low w/c both k1 and k2 may change. The value of k1 is obtained by measurement of both specific volume of chemically bound water and hydration in the same specimen. The degree of hydration, α, may be calculated provided that k2 is constant and independent of w/c and silica fume is not present.
3.2 Previous Research on Specific volume of chemically bound water The average specific volume of hydrated water, k, is about 0.74 cm3/g, i.e. k1 ≈ 1-0.74= 0.26 fairly independent of the degree of hydration /9/ when water was used. Other liquids showed a slightly larger value of k1. Adopting equation (3) the hydration, α, was estimated: α ≈ (1/0.063)·(δwn/c)≈ 15·εs/c (4)

54
Extensive studies were carried out on the chemical shrinkage of Portland cement pastes /10/. Figure 2 shows that the measured chemical shrinkage depends on both the age and the thickness of the specimen /10/. The figure shows that chemical shrinkage increases with w/c and decreases with the thickness of the specimen. From Figure 2 the conclusion was drawn that the thickness should be less than 1 cm at w/c= 0.3. The chemical shrinkage was also studied versus hydration, Figure 3, for w/c= 0.4 and w/c= 0.45 respectively /10/. Calculated according to Figure 3, the specific volume of hydrated water, k= 0.79 and k= 0.76 respectively, i.e. slightly larger than observed by others /9/. In Figure 3 the thickness of the layer was 3.5 and 8 cm which may be too large, causing a residual vacuum in the specimen /10/. Figure 4 shows /11/ the chemical shrinkage during hydration of the investigated cement mortars with w/c varying between 0.35 and 0.55.
Figure 2. Chemical shrinkage of cement paste specimens of different sizes, t, versus age /10/.
Figure 3. Chemical shrinkage of cement paste versus ratio of non-evaporable water to cement, wn/c. To the left: w/c= 0.4; to the right: w/c= 0.45. t denotes layer thickness (cm) /10/.
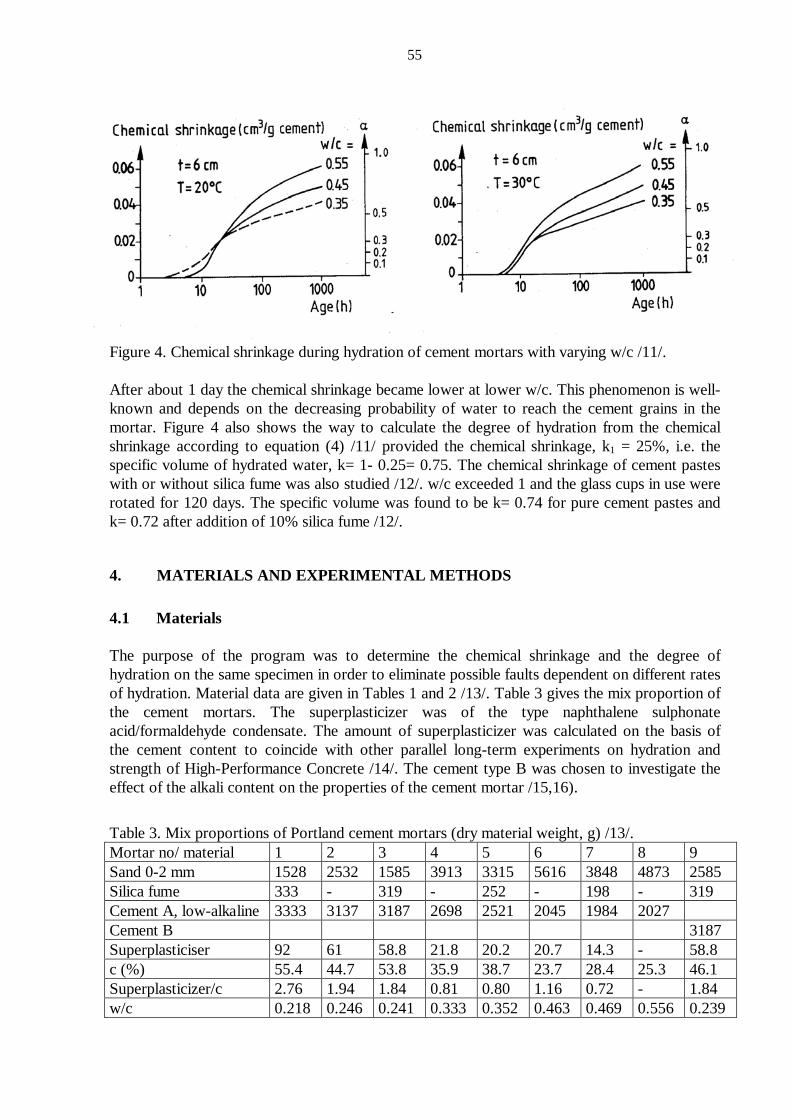
55
Figure 4. Chemical shrinkage during hydration of cement mortars with varying w/c /11/. After about 1 day the chemical shrinkage became lower at lower w/c. This phenomenon is well-known and depends on the decreasing probability of water to reach the cement grains in the mortar. Figure 4 also shows the way to calculate the degree of hydration from the chemical shrinkage according to equation (4) /11/ provided the chemical shrinkage, k1 = 25%, i.e. the specific volume of hydrated water, k= 1- 0.25= 0.75. The chemical shrinkage of cement pastes with or without silica fume was also studied /12/. w/c exceeded 1 and the glass cups in use were rotated for 120 days. The specific volume was found to be k= 0.74 for pure cement pastes and k= 0.72 after addition of 10% silica fume /12/.
4. MATERIALS AND EXPERIMENTAL METHODS
4.1 Materials The purpose of the program was to determine the chemical shrinkage and the degree of hydration on the same specimen in order to eliminate possible faults dependent on different rates of hydration. Material data are given in Tables 1 and 2 /13/. Table 3 gives the mix proportion of the cement mortars. The superplasticizer was of the type naphthalene sulphonate acid/formaldehyde condensate. The amount of superplasticizer was calculated on the basis of the cement content to coincide with other parallel long-term experiments on hydration and strength of High-Performance Concrete /14/. The cement type B was chosen to investigate the effect of the alkali content on the properties of the cement mortar /15,16).
Table 3. Mix proportions of Portland cement mortars (dry material weight, g) /13/. Mortar no/ material 1 2 3 4 5 6 7 8 9 Sand 0-2 mm 1528 2532 1585 3913 3315 5616 3848 4873 2585 Silica fume 333 - 319 - 252 - 198 - 319 Cement A, low-alkaline 3333 3137 3187 2698 2521 2045 1984 2027 Cement B 3187 Superplasticiser 92 61 58.8 21.8 20.2 20.7 14.3 - 58.8 c (%) 55.4 44.7 53.8 35.9 38.7 23.7 28.4 25.3 46.1 Superplasticizer/c 2.76 1.94 1.84 0.81 0.80 1.16 0.72 - 1.84 w/c 0.218 0.246 0.241 0.333 0.352 0.463 0.469 0.556 0.239
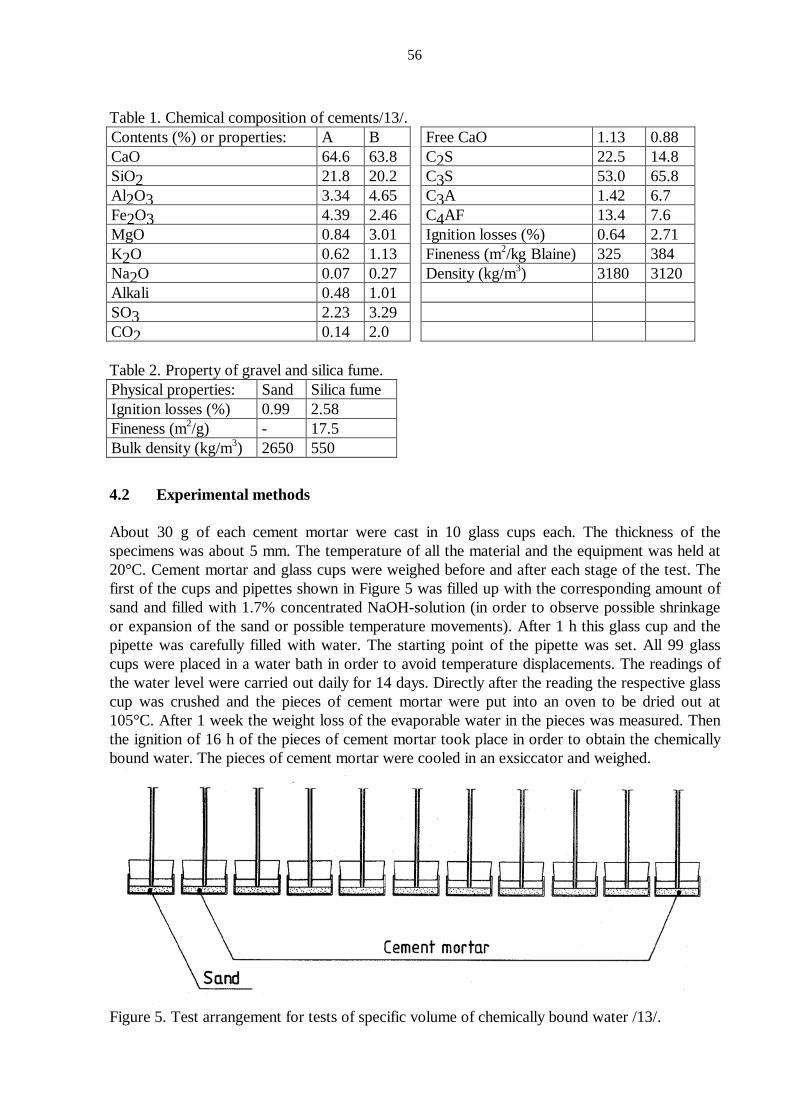
56
Table 1. Chemical composition of cements/13/. Contents (%) or properties: A B Free CaO 1.13 0.88 CaO 64.6 63.8 C2S 22.5 14.8 SiO2 21.8 20.2 C3S 53.0 65.8 Al2O3 3.34 4.65 C3A 1.42 6.7 Fe2O3 4.39 2.46 C4AF 13.4 7.6 MgO 0.84 3.01 Ignition losses (%) 0.64 2.71 K2O 0.62 1.13 Fineness (m2/kg Blaine) 325 384 Na2O 0.07 0.27 Density (kg/m3) 3180 3120 Alkali 0.48 1.01 SO3 2.23 3.29 CO2 0.14 2.0 Table 2. Property of gravel and silica fume. Physical properties: Sand Silica fume Ignition losses (%) 0.99 2.58 Fineness (m2/g) - 17.5 Bulk density (kg/m3) 2650 550
4.2 Experimental methods About 30 g of each cement mortar were cast in 10 glass cups each. The thickness of the specimens was about 5 mm. The temperature of all the material and the equipment was held at 20°C. Cement mortar and glass cups were weighed before and after each stage of the test. The first of the cups and pipettes shown in Figure 5 was filled up with the corresponding amount of sand and filled with 1.7% concentrated NaOH-solution (in order to observe possible shrinkage or expansion of the sand or possible temperature movements). After 1 h this glass cup and the pipette was carefully filled with water. The starting point of the pipette was set. All 99 glass cups were placed in a water bath in order to avoid temperature displacements. The readings of the water level were carried out daily for 14 days. Directly after the reading the respective glass cup was crushed and the pieces of cement mortar were put into an oven to be dried out at 105°C. After 1 week the weight loss of the evaporable water in the pieces was measured. Then the ignition of 16 h of the pieces of cement mortar took place in order to obtain the chemically bound water. The pieces of cement mortar were cooled in an exsiccator and weighed.
Figure 5. Test arrangement for tests of specific volume of chemically bound water /13/.
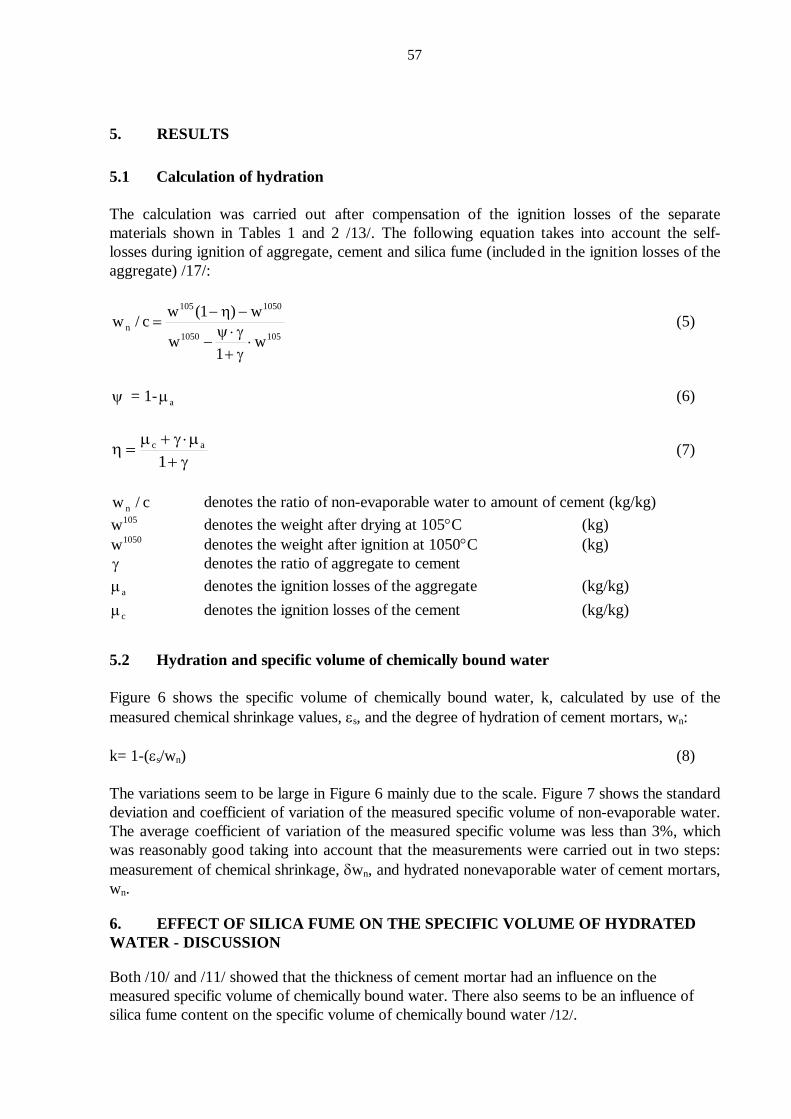
57
5. RESULTS
5.1 Calculation of hydration The calculation was carried out after compensation of the ignition losses of the separate materials shown in Tables 1 and 2 /13/. The following equation takes into account the self-losses during ignition of aggregate, cement and silica fume (included in the ignition losses of the aggregate) /17/:
w c w w
w wn / ( )
=− −
−⋅+
⋅
105 1050
1050 105
1
1
ηψ γ
γ
(5)
ψ = 1- aµ (6)
γ+µ⋅γ+µ
=η1
ac (7)
w cn / denotes the ratio of non-evaporable water to amount of cement (kg/kg) w105 denotes the weight after drying at 105°C (kg) w1050 denotes the weight after ignition at 1050°C (kg) γ denotes the ratio of aggregate to cement
aµ denotes the ignition losses of the aggregate (kg/kg)
cµ denotes the ignition losses of the cement (kg/kg)
5.2 Hydration and specific volume of chemically bound water Figure 6 shows the specific volume of chemically bound water, k, calculated by use of the measured chemical shrinkage values, εs, and the degree of hydration of cement mortars, wn: k= 1-(εs/wn) (8) The variations seem to be large in Figure 6 mainly due to the scale. Figure 7 shows the standard deviation and coefficient of variation of the measured specific volume of non-evaporable water. The average coefficient of variation of the measured specific volume was less than 3%, which was reasonably good taking into account that the measurements were carried out in two steps: measurement of chemical shrinkage, δwn, and hydrated nonevaporable water of cement mortars, wn.
6. EFFECT OF SILICA FUME ON THE SPECIFIC VOLUME OF HYDRATED WATER - DISCUSSION
Both /10/ and /11/ showed that the thickness of cement mortar had an influence on the measured specific volume of chemically bound water. There also seems to be an influence of silica fume content on the specific volume of chemically bound water /12/.

58
0.65
0.67
0.69
0.71
0.73
0.75
0.77
0.79
0.81
0.83
0.85
1 3 5 7 9 11 13 15
Age (days)
Mix 1 Mix 2 Mix 3 Mix 4 Mix 5 Mix 6 Mix 7 Mix 8 Mix 9 Figure 6. Specific volume of chemically bound water versus age.
Figure 7. Standard deviation and coefficient of variation of specific volume. Figure 8 shows the specific volume of hydrated water of cement mortar versus w/c. When w/c was held constant the specific volume was larger for cement mortars without silica fume than with silica fume, which partly was an effect of the cement content, c. The resistance to water penetration was larger at low w/c /18/ which would have given less specific volume of chemically bound water , i.e. a larger specific volume. This was not observed, which indicates that the thickness of the cement mortar was sufficiently low.
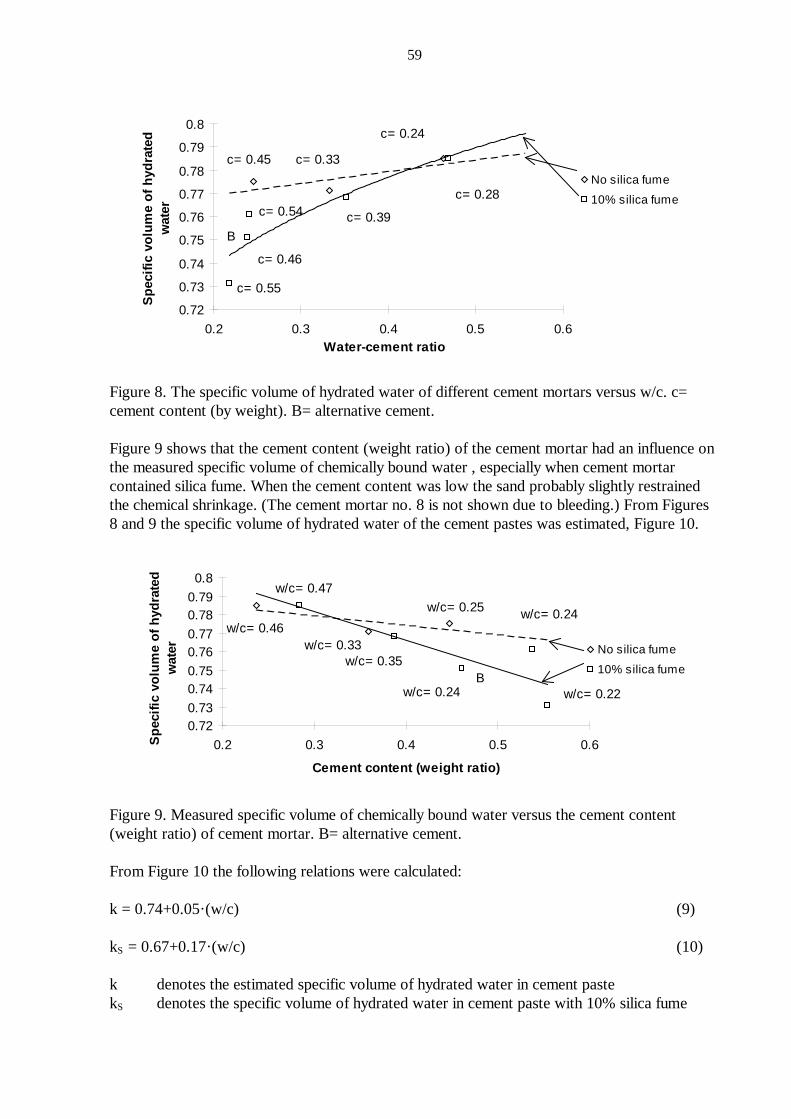
59
0.72
0.73
0.74
0.75
0.76
0.77
0.78
0.79
0.8
0.2 0.3 0.4 0.5 0.6Water-cement ratio
Spec
ific
volu
me
of h
ydra
ted
wat
erNo silica fume
10% silica fume
c= 0.55
c= 0.46
c= 0.54
c= 0.45 c= 0.33
c= 0.39
c= 0.24
c= 0.28
B
Figure 8. The specific volume of hydrated water of different cement mortars versus w/c. c= cement content (by weight). B= alternative cement. Figure 9 shows that the cement content (weight ratio) of the cement mortar had an influence on the measured specific volume of chemically bound water , especially when cement mortar contained silica fume. When the cement content was low the sand probably slightly restrained the chemical shrinkage. (The cement mortar no. 8 is not shown due to bleeding.) From Figures 8 and 9 the specific volume of hydrated water of the cement pastes was estimated, Figure 10.
0.720.730.740.750.760.770.780.790.8
0.2 0.3 0.4 0.5 0.6
Cement content (weight ratio)
Spec
ific
volu
me
of h
ydra
ted
wat
er No silica fume
10% silica fume
w/c= 0.46
w/c= 0.47
w/c= 0.33w/c= 0.35
w/c= 0.25
w/c= 0.24
w/c= 0.24
w/c= 0.22B
Figure 9. Measured specific volume of chemically bound water versus the cement content (weight ratio) of cement mortar. B= alternative cement. From Figure 10 the following relations were calculated: k = 0.74+0.05·(w/c) (9) kS = 0.67+0.17·(w/c) (10) k denotes the estimated specific volume of hydrated water in cement paste kS denotes the specific volume of hydrated water in cement paste with 10% silica fume
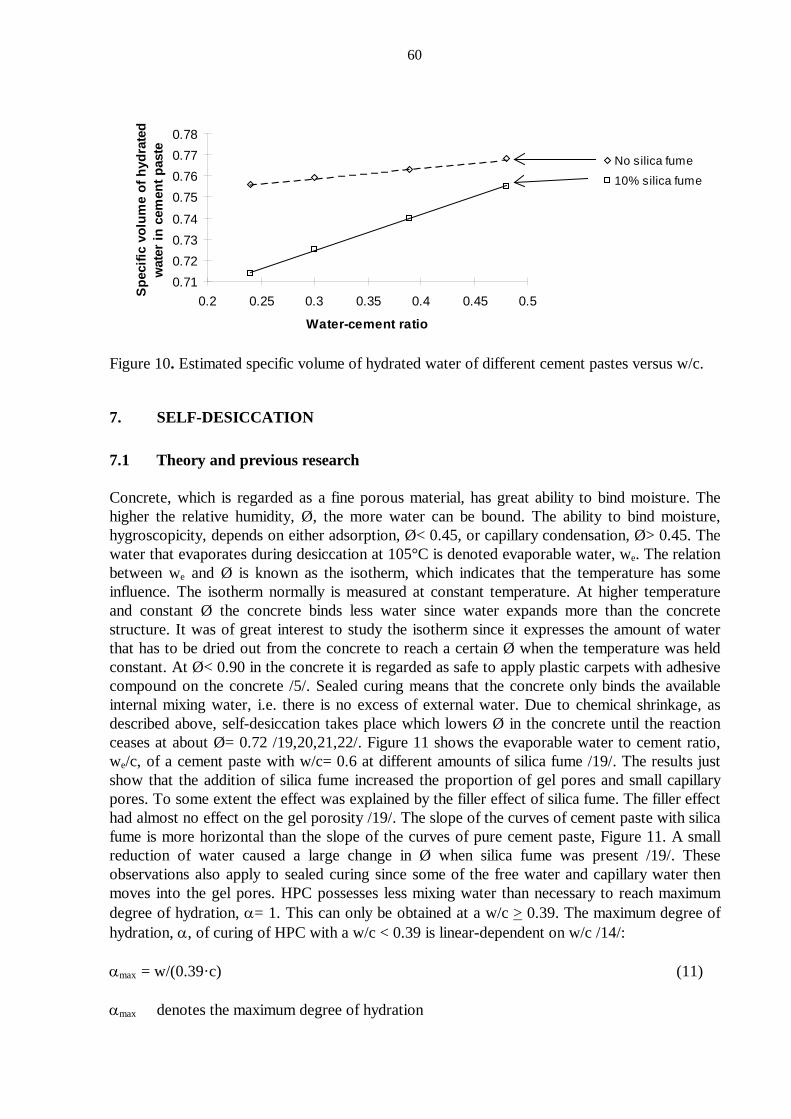
60
0.710.720.730.74
0.750.760.770.78
0.2 0.25 0.3 0.35 0.4 0.45 0.5
Water-cement ratio
Spec
ific
volu
me
of h
ydra
ted
wat
er in
cem
ent p
aste
No silica fume
10% silica fume
Figure 10. Estimated specific volume of hydrated water of different cement pastes versus w/c.
7. SELF-DESICCATION
7.1 Theory and previous research Concrete, which is regarded as a fine porous material, has great ability to bind moisture. The higher the relative humidity, Ø, the more water can be bound. The ability to bind moisture, hygroscopicity, depends on either adsorption, Ø< 0.45, or capillary condensation, Ø> 0.45. The water that evaporates during desiccation at 105°C is denoted evaporable water, we. The relation between we and Ø is known as the isotherm, which indicates that the temperature has some influence. The isotherm normally is measured at constant temperature. At higher temperature and constant Ø the concrete binds less water since water expands more than the concrete structure. It was of great interest to study the isotherm since it expresses the amount of water that has to be dried out from the concrete to reach a certain Ø when the temperature was held constant. At Ø< 0.90 in the concrete it is regarded as safe to apply plastic carpets with adhesive compound on the concrete /5/. Sealed curing means that the concrete only binds the available internal mixing water, i.e. there is no excess of external water. Due to chemical shrinkage, as described above, self-desiccation takes place which lowers Ø in the concrete until the reaction ceases at about Ø= 0.72 /19,20,21,22/. Figure 11 shows the evaporable water to cement ratio, we/c, of a cement paste with w/c= 0.6 at different amounts of silica fume /19/. The results just show that the addition of silica fume increased the proportion of gel pores and small capillary pores. To some extent the effect was explained by the filler effect of silica fume. The filler effect had almost no effect on the gel porosity /19/. The slope of the curves of cement paste with silica fume is more horizontal than the slope of the curves of pure cement paste, Figure 11. A small reduction of water caused a large change in Ø when silica fume was present /19/. These observations also apply to sealed curing since some of the free water and capillary water then moves into the gel pores. HPC possesses less mixing water than necessary to reach maximum degree of hydration, α= 1. This can only be obtained at a w/c > 0.39. The maximum degree of hydration, α, of curing of HPC with a w/c < 0.39 is linear-dependent on w/c /14/: αmax = w/(0.39·c) (11) αmax denotes the maximum degree of hydration

61
0
0.05
0.1
0.15
0.2
0.25
0.3
0.35
0.4
0.45
0.5
0.55
0.6
0 0.2 0.4 0.6 0.8 1
Internal relative humidity
Desorption s/c=0.20Desorption s/c=0.12Desorption s/c=0.04Desorption s/c=0Adsorption s/c=0.16Adsorption s/c=0.08Adsorption s/c=0
Figure 11. Relative humidity versus evaporable water to ignited cement of cement paste with w/c= 0.6 and different amounts of silica fume /19/. w denotes the mixing water of the concrete (kg/m3) c denotes the cement content of the concrete (kg/m3) The degree of hydration, α, can also be expressed as: αmax = wn/(0.25·c) (12) wn denotes the non-evaporable water content of the concrete (kg/m3) Dividing equation (11) by equation (12) gives the maximum value of the relative hydration defined as [the symbols of Eqs (13) and (14) are given above]: (wn/w)max = 0.64 {0<w/c<0.39} (13) (wn/w)max = 0.25·c/w {w/c>0.39} (14)
7.2 Materials and experimental methods Fragments of the same specimen used for the self-desiccation experiments were used in order to eliminate possible faults dependent on differences in development of self-desiccation and

62
hydration between different specimens. The objective of the study was to obtain a relationship between self-desiccation and hydration. All material data were given in Tables 1 and 2 /13/. Table 3, above, gives the mix proportion of the cement mortars. The superplasticizer was of the type naphthalene sulphonate acid/formaldehyde condensate. The amount of superplasticizer was calculated on the basis of the cement content to coincide with other parallel long-term experiments on hydration and strength of High-Performance Concrete /14/. Cement type B was chosen in order to investigate possible effects of the alkali content on the development of self-desiccation and hydration /15,16/. From each mix 20 glass tubes were filled with about 200 ml cement mortar each and tightened with rubber plugs, i.e. a total of 180 specimens. The temperature of all the material and the equipment was held at 20°C. The cement mortar and the glass tubes were weighed before and after each stage of the study. Every week 2 tubes of each mix were crushed. Ø was measured on cement mortar from one tube. The cement mortar from the other tube was put into an oven to be dried out at 105°C and then ignited at 1050°C for 16 h. Capacity sensors were used for 22 h to measure Ø. Calibrating of the sensors took place at Ø = 0.755, 0.851, 0.946 and 0.976 within 5 days of the time of measurement /23/. The accuracy of the sensors was within ± 0.02 Ø. No systematic fault was observed.
7.3 Results and discussion
Effect of silica fume on hydration and internal relative humidity, Ø: The ratio of non-evaporable water to cement, wn/c, of sealed cement mortars was calculated, equation (5), and divided by w/c, resulting in the parameter wn/w, Figure 12 /7/. Figure 12 also shows the internal relative humidity, Ø, of cement mortars with sealed curing /13/. Ø is the relative humidity, which generates if the specimen is in equilibrium which a small volume of ambient air. The maximum relative hydration was obtained at low w/c in cement mortar without silica fume, i.e. wn/w ≈ 0.5. In cement mortars with silica fume wn/w became lower since some of the calcium hydroxide reacted pozzolanically. In cement mortar with cement B (normal alkaline) the Ø decreased more than in cement mortar with low-alkaline cement /15,16/. However, in cement mortar with normal alkaline cement, the Ø increased after 6 weeks since the alkaline effect was eliminated due the pozzolanic reaction with silica fume /15,16/. From Figure 12 the following equations were calculated for the relative hydration, wn/w, and the internal relative humidity, Ø: wn/w = 0.719·[0.813-(w/c)]·t0.349·(w/c)-0.037 {0.2<w/c<0.6; 7<t<70 days} (15) (wn/w)S = 0.645·[0.877-(w/c)]·t0.184·(w/c)-0.020 {0.2<w/c<0.5; 7<t<70 days} (16) Ø = -0.564·[(w/c)2 -1.13·(w/c)-1.43)]·t0.0791·(w]c)-0.0588{0.2<w]c<0.6; 7<t<70 days}(17) ØS = -1.43·[(w/c)2 -0.838·(w/c)-0.5]·t0.208·(w/c)-0.115 {0.2<w/c<0.5; 7<t<70 days} (18) c denotes cement content (kg/m3) t denotes age (days) w denotes mixing water content (kg/m3) wn denotes non-evaporable water (kg/m3) w/c denotes water-cement ratio wn/w denotes relative hydration
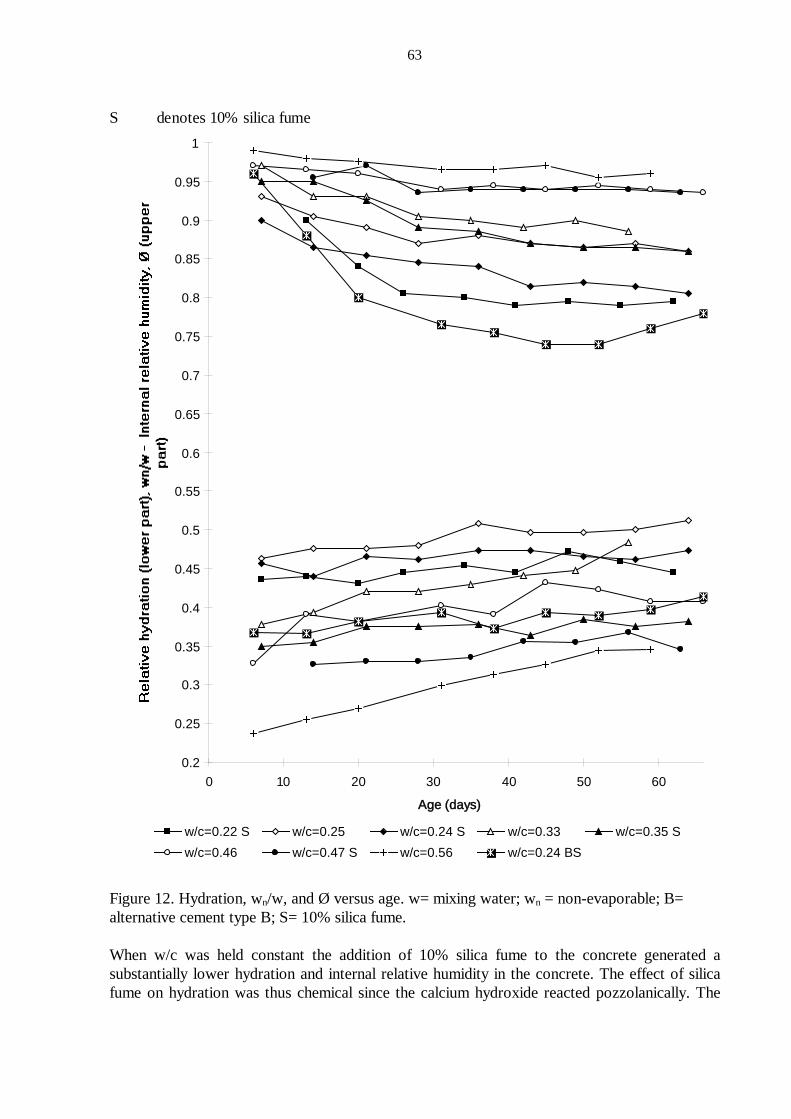
63
S denotes 10% silica fume
0.2
0.25
0.3
0.35
0.4
0.45
0.5
0.55
0.6
0.65
0.7
0.75
0.8
0.85
0.9
0.95
1
0 10 20 30 40 50 60
Age (days)
w/c=0.22 S w/c=0.25 w/c=0.24 S w/c=0.33 w/c=0.35 Sw/c=0.46 w/c=0.47 S w/c=0.56 w/c=0.24 BS
Figure 12. Hydration, wn/w, and Ø versus age. w= mixing water; wn = non-evaporable; B= alternative cement type B; S= 10% silica fume. When w/c was held constant the addition of 10% silica fume to the concrete generated a substantially lower hydration and internal relative humidity in the concrete. The effect of silica fume on hydration was thus chemical since the calcium hydroxide reacted pozzolanically. The
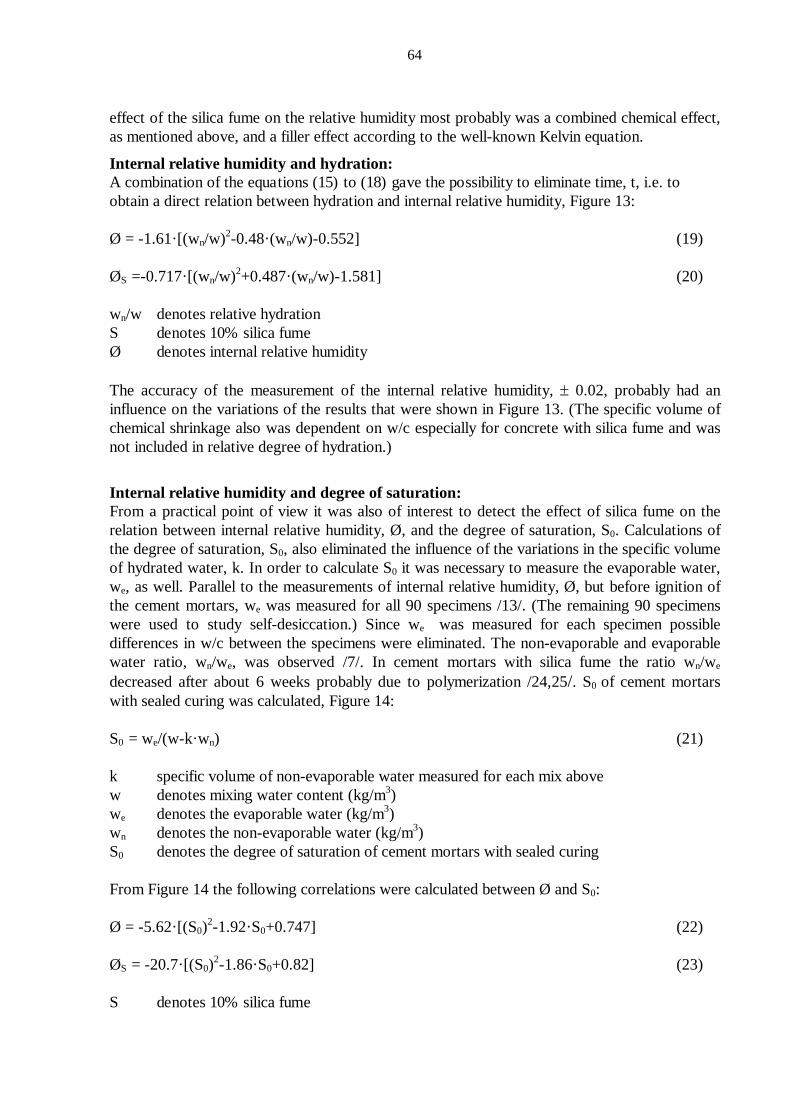
64
effect of the silica fume on the relative humidity most probably was a combined chemical effect, as mentioned above, and a filler effect according to the well-known Kelvin equation.
Internal relative humidity and hydration: A combination of the equations (15) to (18) gave the possibility to eliminate time, t, i.e. to obtain a direct relation between hydration and internal relative humidity, Figure 13: Ø = -1.61·[(wn/w)2-0.48·(wn/w)-0.552] (19) ØS =-0.717·[(wn/w)2+0.487·(wn/w)-1.581] (20) wn/w denotes relative hydration S denotes 10% silica fume Ø denotes internal relative humidity The accuracy of the measurement of the internal relative humidity, ± 0.02, probably had an influence on the variations of the results that were shown in Figure 13. (The specific volume of chemical shrinkage also was dependent on w/c especially for concrete with silica fume and was not included in relative degree of hydration.)
Internal relative humidity and degree of saturation: From a practical point of view it was also of interest to detect the effect of silica fume on the relation between internal relative humidity, Ø, and the degree of saturation, S0. Calculations of the degree of saturation, S0, also eliminated the influence of the variations in the specific volume of hydrated water, k. In order to calculate S0 it was necessary to measure the evaporable water, we, as well. Parallel to the measurements of internal relative humidity, Ø, but before ignition of the cement mortars, we was measured for all 90 specimens /13/. (The remaining 90 specimens were used to study self-desiccation.) Since we was measured for each specimen possible differences in w/c between the specimens were eliminated. The non-evaporable and evaporable water ratio, wn/we, was observed /7/. In cement mortars with silica fume the ratio wn/we decreased after about 6 weeks probably due to polymerization /24,25/. S0 of cement mortars with sealed curing was calculated, Figure 14: S0 = we/(w-k·wn) (21) k specific volume of non-evaporable water measured for each mix above w denotes mixing water content (kg/m3) we denotes the evaporable water (kg/m3) wn denotes the non-evaporable water (kg/m3) S0 denotes the degree of saturation of cement mortars with sealed curing From Figure 14 the following correlations were calculated between Ø and S0: Ø = -5.62·[(S0)2-1.92·S0+0.747] (22) ØS = -20.7·[(S0)2-1.86·S0+0.82] (23) S denotes 10% silica fume

65
S0 denotes the degree of saturation of cement mortars with sealed curing Ø denotes internal relative humidity
0.75
0.8
0.85
0.9
0.95
1
0.2 0.25 0.3 0.35 0.4 0.45 0.5 0.55
Relative hydration, wn/w
10% silica fume No silica fume
Figure 13. Internal relative humidity, Ø, of cement mortar versus relative hydration, wn/w.
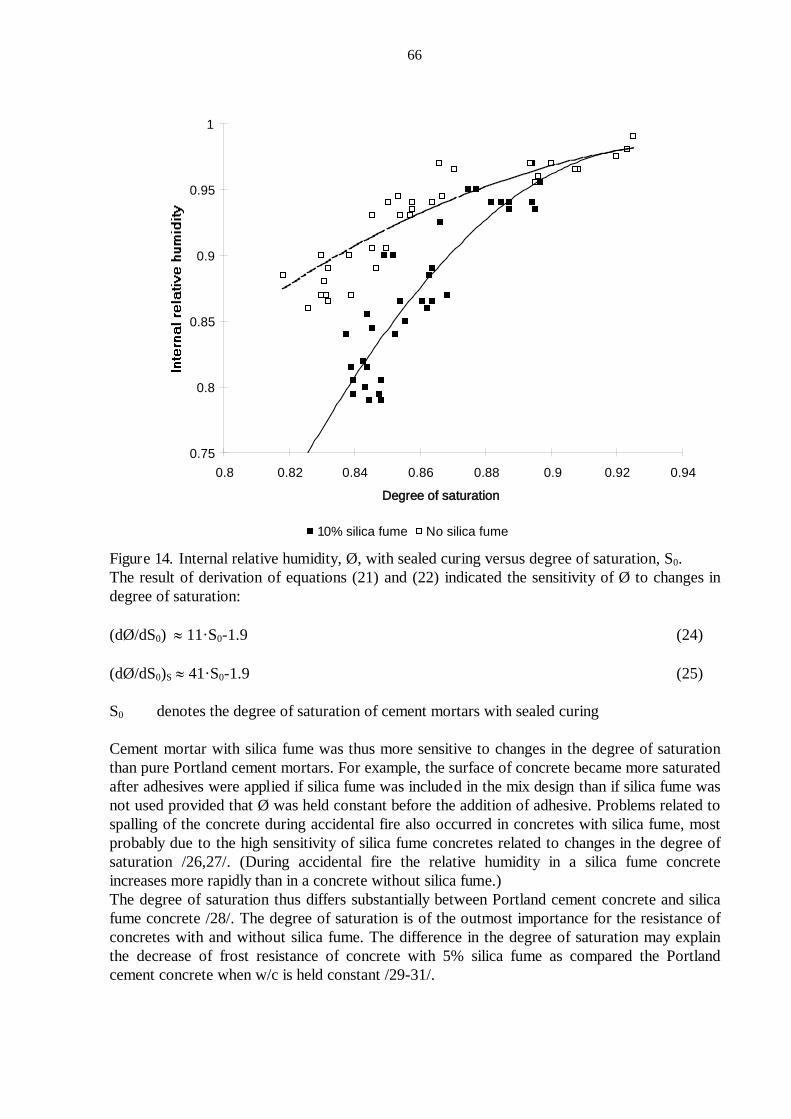
66
0.75
0.8
0.85
0.9
0.95
1
0.8 0.82 0.84 0.86 0.88 0.9 0.92 0.94
Degree of saturation
10% silica fume No silica fume
Figure 14. Internal relative humidity, Ø, with sealed curing versus degree of saturation, S0. The result of derivation of equations (21) and (22) indicated the sensitivity of Ø to changes in degree of saturation: (dØ/dS0) ≈ 11·S0-1.9 (24) (dØ/dS0)S ≈ 41·S0-1.9 (25) S0 denotes the degree of saturation of cement mortars with sealed curing Cement mortar with silica fume was thus more sensitive to changes in the degree of saturation than pure Portland cement mortars. For example, the surface of concrete became more saturated after adhesives were applied if silica fume was included in the mix design than if silica fume was not used provided that Ø was held constant before the addition of adhesive. Problems related to spalling of the concrete during accidental fire also occurred in concretes with silica fume, most probably due to the high sensitivity of silica fume concretes related to changes in the degree of saturation /26,27/. (During accidental fire the relative humidity in a silica fume concrete increases more rapidly than in a concrete without silica fume.) The degree of saturation thus differs substantially between Portland cement concrete and silica fume concrete /28/. The degree of saturation is of the outmost importance for the resistance of concretes with and without silica fume. The difference in the degree of saturation may explain the decrease of frost resistance of concrete with 5% silica fume as compared the Portland cement concrete when w/c is held constant /29-31/.
67
SUMMARY AND CONCLUSIONS
The effect of silica fume on the specific volume of hydrated water and on the internal relative humidity was studied for 9 Portland cement mortars for 14 and 70 days respectively. The following conclusions were drawn: • In pure Portland cement paste the specific volume of hydrated water was found to be around
0.75. • Portland cement paste with 10% silica fume the specific volume of hydrated water was
found to be 0.71 at low w/c and 0.75 at higher w/c. • Cement mortars with 10% silica fume exhibited about 10% lower internal relative humidity
when the degree of saturation or the relative degree of hydration was held constant. • The rate of self-desiccation related to desaturation increased substantially in cement mortars
with silica fume compared with cement mortars without silica fume. • The measured internal relative humidity decreased more rapidly in cement mortars with
normal alkaline cement than in cement mortars with low-alkaline cement. • Cement mortars with normal alkaline cement exhibited a slightly increasing of the internal
relative humidity after about 6 weeks. • The degree of saturation thus differs substantially between Portland cement concrete and
silica fume concrete. • The difference in the degree of saturation between Portland cement concrete and silica fume
concrete may explain the decrease of frost resistance of concrete with 5% silica fume as compared the Portland cement concrete when w/c is held constant.
ACKNOWLEDGEMENT
Financial support from the Swedish Council for Technical Development, NUTEK, is gratefully acknowledged. I am also most grateful to Professor Göran Fagerlund for his reviews of the experimental study.
REFERENCES
/1/ Powers, T.C.; Brownyard, T.L. Studies of Physical Properties of Hardened Portland
Cement Paste. Research Laboratories of the Portland Cement Association. Bulletin 22. Journal of the American Concrete Institute. Vol. 43, 984-987 (1947).
/2/ Tuutti, K. Corrosion of Steel in Concrete. Report Fo 4:82. The Cement and Concrete Research Institute. Stockholm, 277-286, 302-303 (1982).
/3/ Fagerlund, G. The Critical Degree of Saturation Method - A General Method of Estimating the Frost Resistance of Materials and Structures. Report Fo 12:76.The Cement and Concrete Research Institute. Stockholm (1976).
68
/4/ Fagerlund, G. Influence of Environmental Factors on the Frost Resistance of Concrete. TVBM-3059. Lund Institute of Technology. Division of Building Materials. Lund, 19-22 (1994).
/5/ Nilsson, L.-O. Moisture Problems at Concrete Floors. TVBM-3002. Lund Institute of Technology. Division of Building Materials: Lund, 36-51 (1980).
/6/ Persson, B. Self-desiccating High-Strength Concrete Slabs. Third International Symposium of High-Strength Concrete in Lillehammer. Norway. Edited by Holand and Sellevold, 882-889 (1993).
/7/ Persson, B. Hydration, Structure and Strength of High-Performance Concrete. Report TVBM-1009. Lund Institute of Technology. Division of Building Materials. Lund, 225-254, 317-335 (1992) (In Swedish with English summary and with English captions.)
/8/ Penttala, V.; Merikallio, T.; Wirtanen, L. Early Floor Covering of Concrete Slabs and Adhesion between Concrete and Floor Covers. Proceedings of the 5th Nordic Concrete Research Meeting: Helsinki. Edited by Norsk Betongforening. Oslo, 107-108 (1996).
/9/ Powers, T.C. Physical Properties of Cement Paste. Research and Development Laboratories of the Portland Cement Association. Fourth International Symposium of the Chemistry of Cement: Washington DC. Paper V-1. Bulletin 54, 577-609 (1960).
/10/ Knudsen, T. The Effect of Sample-Size on the Hydration of Water-Cured Cement Pastes. Institute of Mineral Industry. The Technical University of Denmark: Lyngby. 1-4 (1987).
/11/ Christoffersen, A.K.; Sørensen, T.B. Self-Desiccation and Chemical Shrinkage of Cement Mortar. Technical Report no 158/86. The Technical University of Denmark. Department of Civil Engineering. Building Materials Laboratory. Lyngby, 56-61 (1986).
/12/ Hooton, D. Chemical Shrinkage of Cement Pastes with or without Silica Fume. Presentation at the 93rd Annual Meeting of the American Ceramic Society. Westerville (1991).
/13/ Persson, B. Hydration, Structure and Strength of High Performance Concrete. Laboratory Data and Calculations. Report TVBM-7011. Lund Institute of Technology. Division of Building Materials. Lund, 37-58 (1992). (In Swedish.)
/14/ Persson, B. Hydration and Strength of High Performance Concrete. Advanced Cement Based Material. Elsevier Science Inc. New York. USA. Vol. 3, 107-123 (1996).
/15/ Hedenblad, G.; Janz, M. Effect of Alkali on the Measured Internal Relative Humidity in Concrete. Report TVBM-3057. Lund Institute of Technology. Division of Building Materials: Lund, 5-12 (1994).
69
/16/ Jonasson, J.E. Modelling of Temperature, Moisture and Stresses in Young Concrete. Report 153D. Division of Structural Engineering. Department of Civil and Mining Engineering. Luleå University of Technology. Luleå, 129-146 (1994).
/17/ Byfors, J. Plain Concrete at Early Ages. Report Fo 3:80. The Cement and Concrete Institute. Stockholm, 40-43 (1980).
/18/ Persson, B. Drying of Concrete subjected to Different Kinds of Curing. Materials and Structures. Vol. 30, 533-544 (1997).
/19/ Sellevold, E.; Bager, D.; Klitgaard-Jensen, E.; Knudsen, T. Silica Fume-cement Pastes: Hydration and Pore Structure. Proceedings of a Nordic Seminar on Silica Fume in Concrete. The Norwegian Institute of Technology. Trondheim (1981).
/20/ Nilsson, L.-O. Desorption Isotherms for Silica-Fume/Cement Mortars. Report IF 8431. Institute of Moisture Issues on Material & Building Technology: Trelleborg, 2-11 (1984)
21) Christoffersen, A.K.; Sørensen, T.B.; Nielsen, A. Self-Desiccation of Concrete. The Danish Concrete Magazine Beton. Vol. 4 (1988). (In Danish).
22) Norling Mjörnell, K., Self-desiccation in Concrete. Report P-94:2. Division of Building Materials. Chalmers University of Technology: Gothenburg, (1994).
/23/ ASTM E 104-85. Standard Practice for Maintaining Constant Relative Humidity by Means of Aqueous Solutions. ASTM. Philadelphia, 33-34, 637 (1985).
/24/ Kühl, H. The Building Material Cement. Verlag für Bauwesen. Berlin, 211 (1967). (In German.)
/25/ Durekovic A.; Tkalcic-Ciboci, B. Cement Pastes of Low Solid to Paste Ratio: An Investigation of the Polymerization of Silicate Anions in the Presence of a Superplasticizer and Silica Fume. Cement and Concrete Research. Vol. 21, 1015-1022 (1991).
/26/ England, G.L.; Khoylou, N. Modelling of the Moisture Behaviour in Normal and High Performance Concretes at Elevated Temperatures. Proceedings of the Fourth Weimar Workshop on High Performance Concrete. Hochschule für Architektur und Bauwesen (HAB). Weimar, 53-67 (1995).
/27/ Diederichs, U. High Temperature Properties and Spalling Behaviour of High Strength Concrete. Proceedings of the Fourth Weimar Workshop on High Performance Concrete held at Hochschule für Architektur und Bauwesen (HAB). Weimar, 219-326 (1995).
/28/ Persson, B. Chemical Shrinkage and Self-desiccation in Portland Cement Based Mortars. Concrete Science and Engineering. RILEM (Accepted for publication, 1999.)

70
/29/ Fagerlund, G. The Critical Degree of Saturation Method of Assessing the Freeze/Thaw Resistance of Concrete. RILEM tentative recommendations. Materials and Structures. Vol. 10, 217-229 (1977).
/30/ Fagerlund, G. The International Co-operative Test of the Critical Degree of Saturation Method of Assessing the Freeze/Thaw Resistance of Concrete. Materials and Structures. Vol. 10, 231-259 (1977).
/31/ Fagerlund, G. Modified Procedure for determination of Internal Frost Resistance by the Critical Degree of Saturation Method. Third Nordic Research Seminar on Frost Resistance of Building Materials. Lund Institute of Technology. Division of Building Materials. Lund (1999).
71 CLINKER MINERAL HYDRATION AT REDUCED RELATIVE HUMIDITIES
O. Mejlhede Jensen Institute of Building Technology and Structural Engineering Aalborg University Sohngaardsholmsvej 57 9000 Aalborg Denmark ABSTRACT Hydration reactions of sealed portland cement paste may lower the relative humidity within the hardening cement paste. This so-called self-desiccation is widely considered to be an important cause of crack formation in concrete at early ages. This paper presents experimental data and theoretical considerations of vapour phase hydration of pure cement clinker minerals at reduced relative humidities. This is relevant to understand self-desiccation in modern high performance concrete and also relevant to the quality of cement during storage. The results show that C3A can hydrate at lower relative humidities than C3S, which again can hydrate at lower relative humidities than C2S. Key words: Self-desiccation, humidity, clinker, hydration
1. INTRODUCTION The pastes of modern high performance concrete normally have a low water-cement ratio, 0.20-0.35, and contain mineral additions such as silica fume and admixtures such as superplasticizers. Such pastes do not contain enough water for the unrestricted hydration of the cement, and will therefore self-desiccate /1/; the internal relative humidity (RH) in the paste is lowered as loosely bound water is consumed by reaction. The cement hydration reactions are significantly hampered as the activity of the water decreases until at sufficiently low activities, as marked by low relative humidities, hydration activity ceases. A related phenomenon of practical importance is the tendency for cement to hydrate during grinding, transport and storage. During these processes cement is exposed to water vapour with which it reacts. This is known as prehydration and may affect subsequent setting and strength development the concretes /2/. In order to understand and predict cement paste and concrete properties knowledge about the mechanisms of cement hydration is central. However, current knowledge about cement hydration at reduced relative humidities is inadequate. Experiments are presented in this paper, which elucidate this subject. The paper is a synthesised progress report of ongoing research. A more detailed
72 treatment can be found elsewhere /3,4,5,6/. 2. EXPERIMENTAL DETAILS 2.1 Materials Phase pure cement clinker minerals, C3S (triclinic), ß-C2S (monoclinic) and C3A (cubic), were produced by heating mixtures of constituent oxides or carbonates. The ß-C2S was stabilised by addition of 0.4 mol-% H3BO3. After formation, the clinker minerals were ball-milled to a specific surface area of approximately 370 m2/kg (Rigdens). According to quantitative X-ray powder diffraction (QXRD), Nuclear Magnetic Resonance (NMR) and free lime determination by ethylene glycol extraction, the phase purity of the clinker minerals was approximately 99%. 2.2 Water vapour exposure The cement clinker minerals were exposed to different relative humidities for different times. Approximately 2 g dry clinker mineral, C3S, C2S or C3A, was placed in a shallow layer on a Ř43 mm dish and transferred to a humidstat with a controlled relative humidity at a constant temperature, 19.7°C (referred to as 20°C in the following). The exposure time ranged from 1 day to one year. Thereafter, physically held water was removed from the sample and the degree of hydration was calculated based on the measured weight changes. The relative humidity was maintained by saturated salt solutions placed in the base of the humidstats. Before exposure to water vapour the samples were kept dry at the exposure temperature for one day. This ensured initial thermal equilibrium and prevented condensation of water vapour on the samples due to temperature differences. After exposure to water vapour for a certain time cement clinker hydration was stopped, and physically held water was removed by vacuum drying with a rotary pump for 1 hour. During vacuum drying the final pressure was approximately 0.1 mbar (~0.5% RH). Heating for 1 hour at 105°C after vacuum drying did lead to an additional water loss. However, the calculated degree of hydration was only changed typically by 1% upon heating at 105°C. This indicates that removal of water by the vacuum drying technique used is approximately equivalent to drying at 105°C. 2.3 X-ray diffraction Selected samples of the clinker minerals hydrated in water vapour were examined by quantitative X-ray diffraction. In addition several hydrated C3S and C2S pastes (w/c=0.5) were examined. These are referred to as hydration at ~100% relative humidity. After drying at 105°C the hydrated clinker mineral was spiked with CaF2 and X-ray diffraction spectra were measured in the interval 10-60°. Distributions of the unhydrated clinker and crystalline hydration products obtained were determined based on a multiphase Rietvelt quantification.
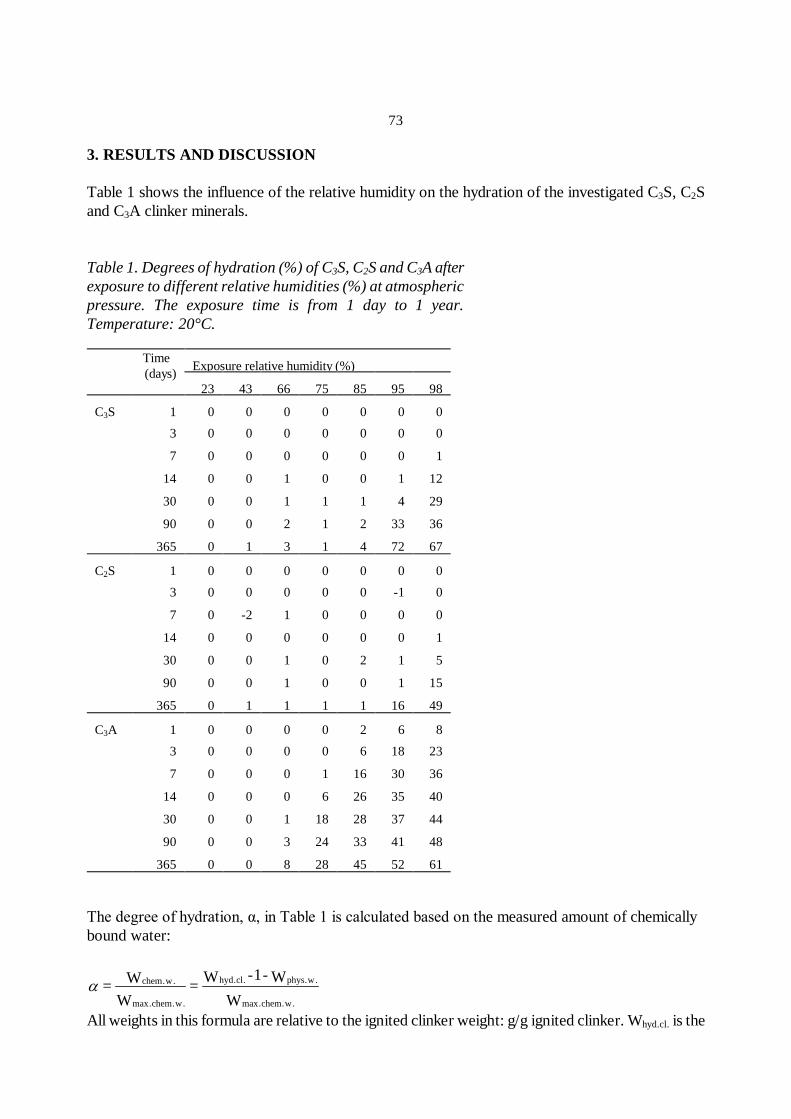
73 3. RESULTS AND DISCUSSION Table 1 shows the influence of the relative humidity on the hydration of the investigated C3S, C2S and C3A clinker minerals. Table 1. Degrees of hydration (%) of C3S, C2S and C3A after exposure to different relative humidities (%) at atmospheric pressure. The exposure time is from 1 day to 1 year. Temperature: 20°C.
Time (days)
Exposure relative humidity (%)
23
43
66
75
85
95
98 C3S
1
0
0
0
0
0
0
0
3
0
0
0
0
0
0
0
7
0
0
0
0
0
0
1
14
0
0
1
0
0
1
12
30
0
0
1
1
1
4
29
90
0
0
2
1
2
33
36
365
0
1
3
1
4
72
67 C2S
1
0
0
0
0
0
0
0
3
0
0
0
0
0
-1
0
7
0
-2
1
0
0
0
0
14
0
0
0
0
0
0
1
30
0
0
1
0
2
1
5
90
0
0
1
0
0
1
15
365
0
1
1
1
1
16
49 C3A
1
0
0
0
0
2
6
8
3
0
0
0
0
6
18
23
7
0
0
0
1
16
30
36
14
0
0
0
6
26
35
40
30
0
0
1
18
28
37
44
90
0
0
3
24
33
41
48
365
0
0
8
28
45
52
61 The degree of hydration, α, in Table 1 is calculated based on the measured amount of chemically bound water:
All weights in this formula are relative to the ignited clinker weight: g/g ignited clinker. Whyd.cl. is the W
W -1-W = W
W = .w.chem.max
.w.phys.cl.hyd
.w.chem.max
.w.chemα
74 weight of hydrated clinker mineral, Wchem.w. the weight of chemically bound water and Wphys.w the weight of physically bound water. Physically bound water is defined as water lost during drying to constant weight at 105°C, and chemically bound water as water held above this temperature. Wmax.chem.w. is the amount of chemically bound water at complete hydration, α=1 /7/:
g/g 0.40 =A Cg/g 0.22 = SCg/g 0.24 = SC
= W3
2
3
.w.chem.max
The degrees of hydration presented in Table 1 are based on the above literature values for Wmax.chem.w.. However, the literature values are determined for paste hydration. During gas phase hydration the relative humidity is lower than 100% and hydration products formed under these conditions may differ from those formed during paste hydration. Consequently, the above literature values for the maximum amount of chemically bound water may not be applicable. To examine this, 14 gas phase hydrated and three paste hydrated (w/c=0.5) clinker mineral samples were examined by quantitative X-ray diffraction, QXRD. From these measurements the amounts of Ca(OH)2 produced and of remaining clinker were determined. By comparison with measured weight loss it was possible to calculate the amount of chemically bound water, Wmax.chem.w., of the gel solid. In addition, the molar C/S- or C/A-ratio of the gel solid was determined. Crystalline C3AH6 was recognised as the major hydration product of C3A. Some minor unidentified phases were observed by XRD but none of the hydrated C3A samples contained CH. The measurements did not indicate that relative humidity influenced the hydration product of C3A. A reaction equation for the gas phase hydration of C3A is: C3A + 6H → C3AH6. In agreement with the required value for paste hydration, Wmax.chem.w., is 0.40. On the other hand the hydration products of C3S and C2S did change systematically with the exposure relative humidity. For paste hydration (w/c=0.5) or hydration close to 100% RH the measured molar C/S-ratios and Wmax.chem.w. values agreed with the literature values for normal paste hydration: approximately 1.7 and 0.23 respectively /7/. However, when the exposure relative humidity was lower the C/S ratio increased and the amount of chemically bound water decreased. For C3S exposed for 3 months at 83% RH and 40°C, the C/S-ratio was measured as 3 and Wmax.chem.w. was 0.12. This unusual stochiometry may be a natural consequence of hydration in water deficient conditions. Despite the indications from the QXRD examination the above literature values for paste hydration were used for calculation of the degrees of hydration shown in Table 1. The calculated degrees of hydration should, therefore, not be taken as exact figures, but as indicators of the progress of hydration. Some scatter is observed for the measurements in Table 1. From the experimental procedure, including weighing accuracy, it should be possible to measure the degree of hydration within ±1% but some samples seem to deviate at least 2% (c.f. C2S, 7 days and 43% RH; also C2S, 30 days and 85% RH). The reason for these deviations is not known.

75 Despite this, a number of conclusions are possible. The measurements presented in Table 1 show that the clinker minerals C3S, C2S and C3A have fundamentally different sensitivities to relative humidity. C2S hydration is hampered to a greater extent by decreased relative humidity than is C3S hydration, which again is more sensitive than C3A hydration. As shown further on, this observation agrees with thermodynamic calculations, and experimental results in the literature /2,8/. After one-year water vapour exposure at 20°C the limiting relative humidity for hydration of the C3S, C2S and C3A seems to be approximately 85%, 90% and 60% respectively. A slight hydration of both C3S and C2S is apparently observed at low relative humidities, e.g. 66% RH. However, this may be due to measuring inaccuracy or to a small amount (<1%) of free CaO in the clinker mineral preparations: CaO is able to hydrate even at a very low relative humidity. In relation to Portland cement the results presented in this report should be interpreted with caution. The clinker minerals in a typical Portland cement contain foreign oxides incorporated in their structure /9/. Such "dirty" clinker minerals may have somewhat different hydration properties than the "pure" clinker minerals examined in this project, containing ≤0.1 wt% total impurity in C3S and C3A. Even the type and amount of stabiliser used for forming ß-C2S is reported to affect the rate of hydration of the ß-C2S /10/. Furthermore, no interaction with other hydrated compounds normally present in Portland cement, e.g. gypsum, has been assessed. Despite these reservations, the data are compared with those from cement by Powers /11/, Figure 1. Powers stored portions of unhydrated cement at different relative humidities and measured the amount of chemically held water after 6 months of storage. From the Figure it can be seen, that the water take-up is significantly increased above 80% relative humidity. This may be due to hydration of the silicate clinker minerals, whereas the aluminate clinker minerals may be responsible for the hydration at lower relative humidities. In Figure 1, the limiting relative humidity for the hydration of the cement is lower than for the pure clinker minerals examined in this project. This may be a consequence of differences between pure clinker minerals and clinker phases in Portland cement as well as the presence of gypsum, alkali sulphates, etc. Hydration of C4AF, not included in the present study, may also play a role.
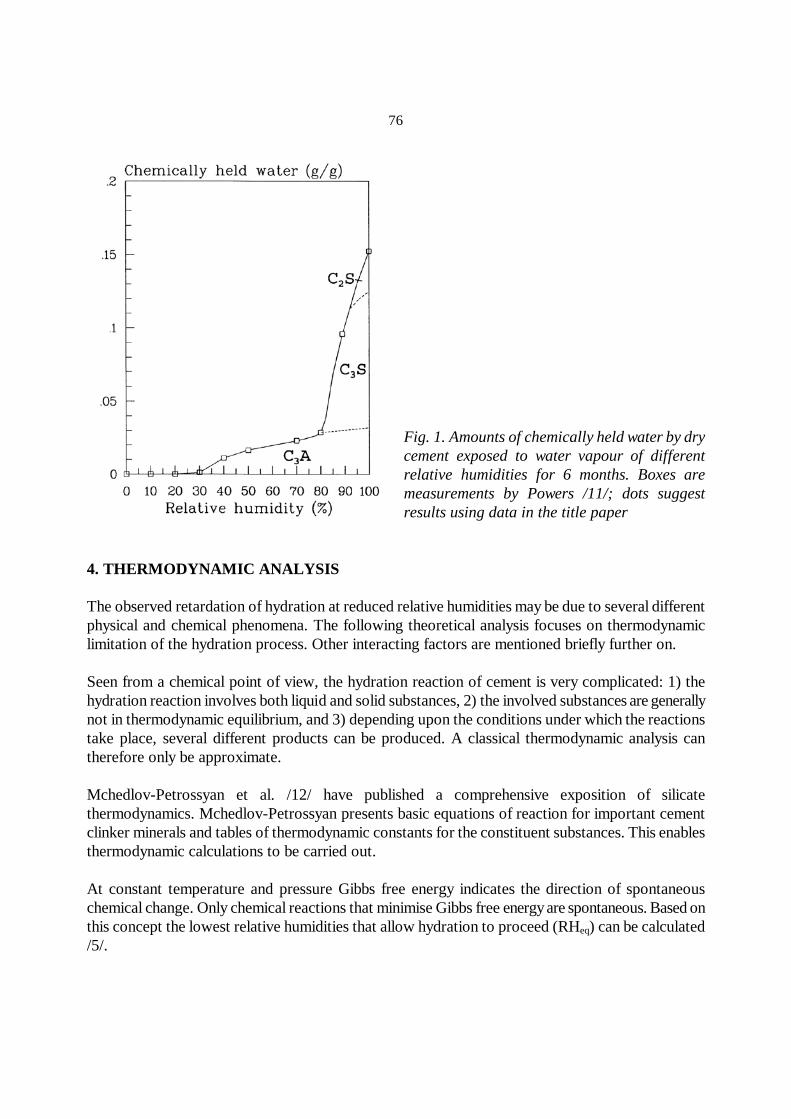
76
Fig. 1. Amounts of chemically held water by dry cement exposed to water vapour of different relative humidities for 6 months. Boxes are measurements by Powers /11/; dots suggest results using data in the title paper
4. THERMODYNAMIC ANALYSIS The observed retardation of hydration at reduced relative humidities may be due to several different physical and chemical phenomena. The following theoretical analysis focuses on thermodynamic limitation of the hydration process. Other interacting factors are mentioned briefly further on. Seen from a chemical point of view, the hydration reaction of cement is very complicated: 1) the hydration reaction involves both liquid and solid substances, 2) the involved substances are generally not in thermodynamic equilibrium, and 3) depending upon the conditions under which the reactions take place, several different products can be produced. A classical thermodynamic analysis can therefore only be approximate. Mchedlov-Petrossyan et al. /12/ have published a comprehensive exposition of silicate thermodynamics. Mchedlov-Petrossyan presents basic equations of reaction for important cement clinker minerals and tables of thermodynamic constants for the constituent substances. This enables thermodynamic calculations to be carried out. At constant temperature and pressure Gibbs free energy indicates the direction of spontaneous chemical change. Only chemical reactions that minimise Gibbs free energy are spontaneous. Based on this concept the lowest relative humidities that allow hydration to proceed (RHeq) can be calculated /5/.
77
Based on X-ray evidence the gross reaction scheme for gas phase hydration of C3A was previously suggested to be C3A (s) + 6H (g) → C3AH6 (s). For this reaction equation RHeq is calculated to be 0.00008% RH at 20°C /5/. Unfortunately, C3S and C2S hydration cannot be described by a single, simple reaction equation. However, a range of equilibrium relative humidities can be calculated for the idealised reaction equations given by Mchedlov-Petrossyan. For C3S RHeq values up to 0.1% RH are found, and for C2S even higher values are encountered: 3-60% RH. Due to uncertainty in the thermodynamic data calculated RH values only indicate approximate levels. Furthermore, the thermodynamic data used apply to the crystalline state. Calcium silicate hydrates produced in cement pastes are normally ill crystallised. Taking this into account, the "real" limiting relative humidities are higher than those calculated. The indications of this thermodynamic analysis agree with the experimental observations: C2S hydration is more sensitive to a decreased relative humidity than C3S hydration, which again is more sensitive than C3A hydration. However, apart from C2S the thermodynamically calculated equilibrium relative humidities are much lower than the experimentally observed limiting relative humidities. That means, the observed limiting relative humidities must be kinetic barriers. This is caused by a number of physical and chemical factors, which lead to a retardation of cement hydration at lower relative humidities: The lower the relative humidity the smaller will be the amount of physically held water in the cement paste. Lower relative humidities thus reduce the amount of unhydrated cement, which is exposed to water and the space available for hydration products - the cement gel can be produced only in water-filled space. In order to nucleate the hydrate and form hydration products a minimum size of the water-filled spaces is in addition probably required. Furthermore, a decrease in the relative humidity leads to a lower Gibbs free energy of water and thereby reduces the chemical motive power of the hydration. The results presented in Table 1 suggest that nucleation possible could be an important factor. Apparently there is an induction period for the hydration onset, and this is indicative for reactions requiring nucleation. A further discussion of this is given elsewhere /6/. 5. CONCLUSIONS The measurements and theoretical considerations presented in this paper show that the clinker minerals C3S, C2S and C3A have fundamentally different sensitivities to relative humidity. C2S hydration is more hampered by decreased relative humidity than C3S hydration, which again is more hampered than C3A hydration. Within one-year water vapour exposure at 20°C the limiting relative humidities for hydration of the C3S, C2S and C3A are estimated to be 85%, 90% and 60% respectively. The thermodynamically calculated limiting relative humidities are substantially lower than the
78 experimentally observed. That means, the observed limiting relative humidities are kinetic barriers. It has been suggested that nucleation of the reaction products may play a role. Measurements by quantitative X-ray diffraction indicate that the hydration products formed by the silicate clinker minerals depend on the hydration conditions. Low relative humidities favours formation of solid products having lower water contents. In addition, a low relative humidity seems to increase the CaO/SiO2 molar ratio of the C-S-H gel. ACKNOWLEDGEMENT The assistance from Dr. Jim Fletcher and Daniel Brew, both of the University of Aberdeen, in the QXRD analysis and production of clinker minerals, is gratefully acknowledged. NMR analysis of the clinker minerals has been performed by Dr. Jørgen Skibsted in the Department of Chemistry at the University of Århus. REFERENCES /1/ O.M. Jensen and P.F. Hansen, Autogeneous relative humidity change in silica fume modified
cement paste, Adv Cem Res, 7 (25), 33-38 (1995) /2/ K. Theisen and V. Johansen, Prehydration and strength development of Portland cement, Am
Cer Soc Bul, 54 (9), 787-791 (1975) /3/ O.M. Jensen, Clinker mineral hydration at reduced relative humidities, Technical Report series
R No 46, Dep. Struct. Eng. Mater., Techn. Univ. Denmark, 1998 /4/ O. Mejlhede Jensen, Autogenous Deformation and RH-change - selfdesiccation and
selfdesiccation shrinkage (in Danish), TR 284/93 ISSN 0907-7073, Build. Mat. Lab., Techn. Univ. of Denmark (1993)
/5/ O.M. Jensen, Thermodynamic limitation of self-desiccation, Cem Concr Res, 25 (1), 157-164
(1995) /6/ O. Mejlhede Jensen, P. Freiesleben Hansen, E.E. Lachowski and F.P. Glasser, Clinker mineral
hydration at reduced relative humidities, Cement and Concrete Research 29 (9), 1505-1512, 1999
/7/ P.C. Hewlett (Ed.), Lea's Chemistry of Cement and Concrete, Arnold, London, pp. 246-260
(1998) /8/ E. Breval, Gas-phase and liquid-phase hydrattion of C3A, Cem Concr Res, 7, 297-304 (1977) /9/ H.F.W. Taylor, Modification of the Bogue calculation, Adv Cem Res, 2 (6), 73-77 (1989)

79 /10/ R.W Nurse, The Dicalcium Silicate Phase, Proc. Symp. Chem. Cem., London, pp. 56-77 (1952) /11/ T.C. Powers, A discussion of Cement Hydration in Relation to the curing of concrete, Proc.
Highway Res. Board, 27, p. 178, (1947); Bull. No. 25, Portl. Cem. Assoc. (1948) /12/ V.I. Babushkin, G.M. Matveyev, and O.P. Mchedlov-Petrossyan, Thermodynamics of Silicates,
Springer-Verlag, Berlin (1985)

80
81
EFFECT OF TEMPERATURE AND ALKALI CONTENT ON THE HYDRATION OF SELECTED CEMENTITIOUS SYSTEMS
Mette Geiker, Associate Professor Dept. of Structural Engineering and Materials Technical University of Denmark Brovej, Building 118, DK-2800 Lyngby, Denmark E-mail: [email protected]
ABSTRACT To investigate the effect of the alkalinity of the pore solution and the temperature on the hydration of selected cementitious systems, measurements of the development of chemical shrinkage of Portland cement pastes (w/(c+0.5fa+2sf)=0.42) with and without fly ash (14%) and silica fume (6.5%) and with three levels of alkali content (0.4%, 0.6%, and 1.0% Na2O eqv.) have been performed at 10oC, 23oC, and 40oC. The pozzolanas (fly ash and silica fume) react even at 10oC in mixes containing 0.4% Na2O eqv., i.e. the natural content in the sulfate resistant low alkali cement normally used for Danish infrastructure projects . A positive effect of the alkali content on the development of chemical shrinkage is observed. This effect is most pronounced for mixes containing pozzolanas. Applying the linear version of the Dispersion Model apparent activation energies at approximately 45 kJ/mole were estimated for both the pure cement paste and the three-powder mix with 0.4% Na2O eqv.
Key words: Cement paste, fly ash, silica fume, alkali content, chemical shrinkage, activation energy
1 INTRODUCTION The addition of supplementary cementitious materials is increasingly being used to improve the properties of hardened concrete. However, a possible limited hydration of the cementitious materials may reduce the properties of the hardened concrete.
Factors expected to affect the rate of hydration are, among others, the alkalinity of the pore solution and the temperature. To limit the risk of alkali silica reactions low alkali cements are generally used for Danish structures exposed to aggressive environments. However, the low alkali content might be expected to limit the reactivity of the binders. Furthermore, the mean temperature in Denmark is rather low, approximately 10oC. Compared to cement hydration, pozzolanic reactions are expected to have a larger temperature dependency and thus to occur more rapid at higher temperatures and vice versa at lower temperatures.
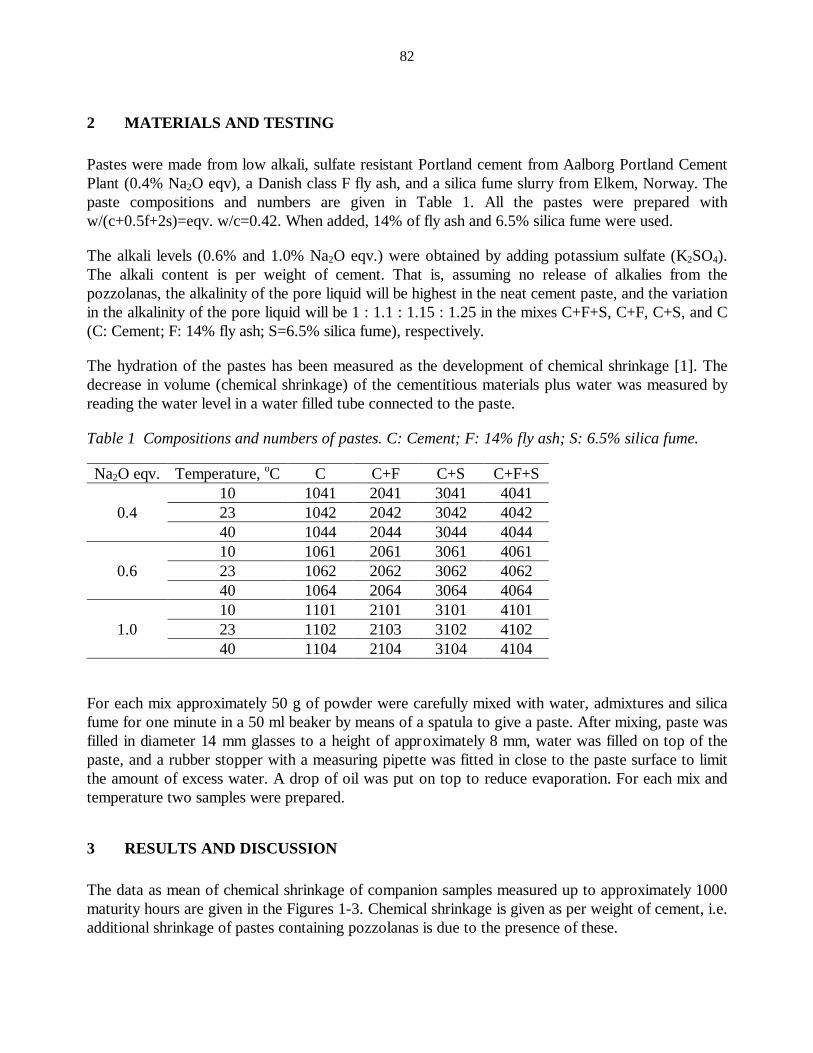
82
2 MATERIALS AND TESTING Pastes were made from low alkali, sulfate resistant Portland cement from Aalborg Portland Cement Plant (0.4% Na2O eqv), a Danish class F fly ash, and a silica fume slurry from Elkem, Norway. The paste compositions and numbers are given in Table 1. All the pastes were prepared with w/(c+0.5f+2s)=eqv. w/c=0.42. When added, 14% of fly ash and 6.5% silica fume were used.
The alkali levels (0.6% and 1.0% Na2O eqv.) were obtained by adding potassium sulfate (K2SO4). The alkali content is per weight of cement. That is, assuming no release of alkalies from the pozzolanas, the alkalinity of the pore liquid will be highest in the neat cement paste, and the variation in the alkalinity of the pore liquid will be 1 : 1.1 : 1.15 : 1.25 in the mixes C+F+S, C+F, C+S, and C (C: Cement; F: 14% fly ash; S=6.5% silica fume), respectively.
The hydration of the pastes has been measured as the development of chemical shrinkage [1]. The decrease in volume (chemical shrinkage) of the cementitious materials plus water was measured by reading the water level in a water filled tube connected to the paste.
Table 1 Compositions and numbers of pastes. C: Cement; F: 14% fly ash; S: 6.5% silica fume.
Na2O eqv. Temperature, oC C C+F C+S C+F+S
0.4 10 1041 2041 3041 4041 23 1042 2042 3042 4042 40 1044 2044 3044 4044
0.6 10 1061 2061 3061 4061 23 1062 2062 3062 4062 40 1064 2064 3064 4064
1.0 10 1101 2101 3101 4101 23 1102 2103 3102 4102 40 1104 2104 3104 4104
For each mix approximately 50 g of powder were carefully mixed with water, admixtures and silica fume for one minute in a 50 ml beaker by means of a spatula to give a paste. After mixing, paste was filled in diameter 14 mm glasses to a height of approximately 8 mm, water was filled on top of the paste, and a rubber stopper with a measuring pipette was fitted in close to the paste surface to limit the amount of excess water. A drop of oil was put on top to reduce evaporation. For each mix and temperature two samples were prepared.
3 RESULTS AND DISCUSSION The data as mean of chemical shrinkage of companion samples measured up to approximately 1000 maturity hours are given in the Figures 1-3. Chemical shrinkage is given as per weight of cement, i.e. additional shrinkage of pastes containing pozzolanas is due to the presence of these.
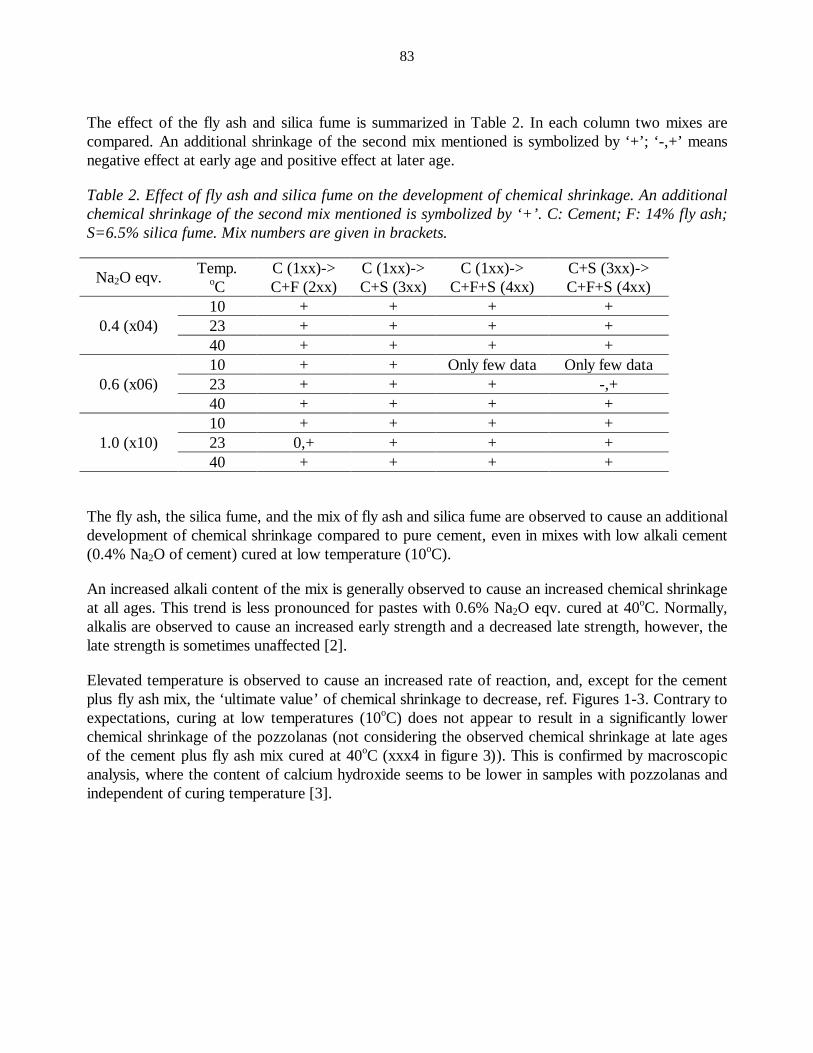
83
The effect of the fly ash and silica fume is summarized in Table 2. In each column two mixes are compared. An additional shrinkage of the second mix mentioned is symbolized by ‘+’; ‘-,+’ means negative effect at early age and positive effect at later age.
Table 2. Effect of fly ash and silica fume on the development of chemical shrinkage. An additional chemical shrinkage of the second mix mentioned is symbolized by ‘+’. C: Cement; F: 14% fly ash; S=6.5% silica fume. Mix numbers are given in brackets.
Na2O eqv. Temp. oC
C (1xx)-> C+F (2xx)
C (1xx)-> C+S (3xx)
C (1xx)-> C+F+S (4xx)
C+S (3xx)-> C+F+S (4xx)
0.4 (x04) 10 + + + + 23 + + + + 40 + + + +
0.6 (x06) 10 + + Only few data Only few data 23 + + + -,+ 40 + + + +
1.0 (x10) 10 + + + + 23 0,+ + + + 40 + + + +
The fly ash, the silica fume, and the mix of fly ash and silica fume are observed to cause an additional development of chemical shrinkage compared to pure cement, even in mixes with low alkali cement (0.4% Na2O of cement) cured at low temperature (10oC).
An increased alkali content of the mix is generally observed to cause an increased chemical shrinkage at all ages. This trend is less pronounced for pastes with 0.6% Na2O eqv. cured at 40oC. Normally, alkalis are observed to cause an increased early strength and a decreased late strength, however, the late strength is sometimes unaffected [2].
Elevated temperature is observed to cause an increased rate of reaction, and, except for the cement plus fly ash mix, the ‘ultimate value’ of chemical shrinkage to decrease, ref. Figures 1-3. Contrary to expectations, curing at low temperatures (10oC) does not appear to result in a significantly lower chemical shrinkage of the pozzolanas (not considering the observed chemical shrinkage at late ages of the cement plus fly ash mix cured at 40oC (xxx4 in figure 3)). This is confirmed by macroscopic analysis, where the content of calcium hydroxide seems to be lower in samples with pozzolanas and independent of curing temperature [3].
84
01020304050607080
1 10 100 1000 10000
Time [hours]
Che
mic
al s
hrin
kage
[m
l/kg
cem
ent]
1041204130414041
01020304050607080
1 10 100 1000 10000
Time [hours]
Che
mic
al s
hrin
kage
[m
l/kg
cem
ent]
1061206130614061
01020304050607080
1 10 100 1000 10000
Time [hours]
Che
mic
al s
hrin
kage
[l/k
g ce
men
t] 1101210131014101
Figure 1. Chemical shrinkage as mean of companion paste samples (eqv. w/c=0.42) hydrated at 10oC. (1xxx: Cement; 2xxx: Cement plus 14% fly ash; 3xxx: Cement plus 6.5% silica fume; 4xxx: Cement plus 14% fly ash and 6.5% silica fume x04x: 0.4% Na2O eqv.; x06x: 0.6% Na2O eqv.; x10x: 1.0% Na2O eqv.; xxx1: 10oC; xxx2: 23oC; xxx4: 40oC).
85
01020304050607080
1 10 100 1000 10000
Time [hours]
Che
mic
al s
hrin
kage
[m
/kg
cem
ent]
1042204230424042
01020304050607080
1 10 100 1000 10000
Time [hours]
Che
mic
al s
hrin
kage
[m
l/kg
cem
ent]
1062206230624062
01020304050607080
1 10 100 1000 10000
Time [hours]
Che
mic
al s
hrin
kage
[m
l/kg
cem
ent]
1102210231024102
Figure 2. Chemical shrinkage as mean of companion paste samples (eqv. w/c=0.42) hydrated at 23oC. (1xxx: Cement; 2xxx: Cement plus 14% fly ash; 3xxx: Cement plus 6.5% silica fume; 4xxx: Cement plus 14% fly ash and 6.5% silica fume x04x: 0.4% Na2O eqv.; x06x: 0.6% Na2O eqv. ; x10x: 1.0% Na2O eqv.; xxx1: 10oC; xxx2: 23oC; xxx4: 40oC).
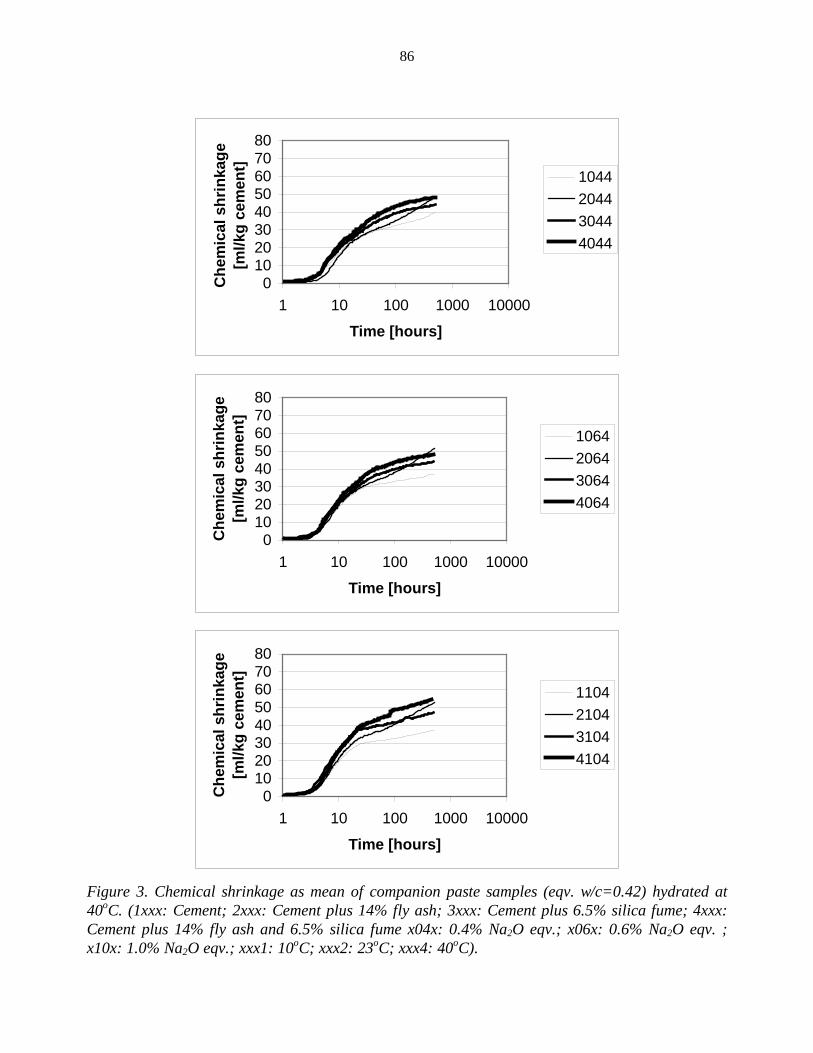
86
01020304050607080
1 10 100 1000 10000
Time [hours]
Che
mic
al s
hrin
kage
[m
l/kg
cem
ent]
1044204430444044
01020304050607080
1 10 100 1000 10000
Time [hours]
Che
mic
al s
hrin
kage
[m
l/kg
cem
ent]
1064206430644064
01020304050607080
1 10 100 1000 10000
Time [hours]
Che
mic
al s
hrin
kage
[m
l/kg
cem
ent]
1104210431044104
Figure 3. Chemical shrinkage as mean of companion paste samples (eqv. w/c=0.42) hydrated at 40oC. (1xxx: Cement; 2xxx: Cement plus 14% fly ash; 3xxx: Cement plus 6.5% silica fume; 4xxx: Cement plus 14% fly ash and 6.5% silica fume x04x: 0.4% Na2O eqv.; x06x: 0.6% Na2O eqv. ; x10x: 1.0% Na2O eqv.; xxx1: 10oC; xxx2: 23oC; xxx4: 40oC).

87
For estimation of the apparent activation energies for two selected pastes (the pure cement paste (104x) and the three powder mix (404x), both with 0.4% Na2O eqv. of cement) the data sets have been fitted to the Dispersion Model to give rate constants (1/t50, ref. below), and the obtained rate constants have been fitted to Arrhenius’ equation.
The Dispersion Model is given by [4, 5, 6]:
P/Pmax = (t-t0)n/(t1n+ (t - t0)n)
where P is the property in question at the time t, Pmax is the ultimate value of the property, t0 is the duration of the dormant period, and t1 is the reaction time (t-t0) to reach P/Pmax=0.5. The constant n is describing the kinetics: n=1 for linear kinetics and n=½ for parabolic kinetics. For both data sets the best fit was obtained by means of the linear version of the Dispersion Model (n=1). To limit the influence of a possible limited water transport on the measurements of chemical shrinkage at late ages, [5], data up to P/Pmax=0.84 to 0.88 have been fitted. P/Pmax=0.84 to 0.88 corresponds to 410, 140, 70 hours for the pure cement pastes cured at 10, 20, and 40oC, respectively, and to 330, 140, 50 hours for pastes of the three-powder mix.
Arrhenius’ equation is given by [8]:
k = A exp(-Ea/(R T)) ⇔ ln(k) = ln(A) - Ea/(R T)
where k is the rate of reaction, A is a constant, Ea is the apparent activation energy, R the gas constant, 8.31 J/K mole, and T the temperature in Kelvin). The apparent activation energy can thus be determined from linear regression of natural logarithm to the rate of reaction (ln (k) ≡ ln (t1)) versus the reciprocal temperature (1/T), ref. Figure 4.
Apparent activation energies at approximately 45 kJ/mole were obtained for both the pure cement paste and the three-powder mix with 0.4% Na2O eqv. That is, the expected larger effect of temperature on the reaction of the pozzolanas is not observed. If t1/Pmax is selected as rate constant, apparent activation energies at 38-44 kJ/mole are obtained
2
2,5
3
3,5
4
4,5
0,0031 0,0032 0,0033 0,0034 0,0035 0,0036
Reciprocal temperature [1/Kelvin]
ln (r
ate
of re
actio
n)
2
2,5
3
3,5
4
4,5
0,0031 0,0032 0,0033 0,0034 0,0035 0,0036
Reciprocal temperature [1/Kelvin]
ln (r
ate
of re
actio
n)
Figure 4. The natural logarithm to rate constants (1/t50) versus the reciprocal temperature in Kelvin for cement pastes (left) and pastes of cement, 14% fly ash, and 6.5% silica fume (right) (0.4% Na2O eqv.). The apparent activation energies are obtained by linear regression.

88
The values obtained are in the range normally observed for Portland cement and Portland clinker minerals [5, 7]. It should be noted that the method applied in this paper does not take into account the effect of temperature on the dormant period. If that had been done, lower values of activation energy would have been obtained [5].
4 CONCLUSION Addition of fly ash (14%), silica fume (6.5%), and of both fly ash and silica fume is observed to cause additional development of chemical shrinkage of paste (eqv. w/c=0.42, 10oC to 40oC). This indicates that both pozzolanas react at the given conditions. The pozzolanas react even at 10oC in mixes containing 0.4% Na2O eqv., i.e. the natural content in the sulfate resistant low alkali cement normally used for Danish infrastructure projects. A positive effect of the alkali content on the development of degree of hydration (chemical shrinkage) is observed. This effect is most pronounced for mixes containing pozzolanas.
Applying the linear version of the Dispersion Model apparent activation energies at approximately 45 kJ/mole were estimated for both the pure cement paste and the three-powder mix containing 0.4% Na2O eqv. That is, the expected larger effect of temperature on the reactivity of pozzolanas in the actual three-powder mix with low alkali content was not observed in the present investigation.
5 ACKNOWLEDGEMENTS The experimental work was financially supported by The Great Belt Link A/S and performed while working for COWI Consulting Engineers and Planners AS.
6 REFERENCES 1. Geiker, M. , Knudsen, T. (1982) Chemical shrinkage of Portland Cement Pastes. Cement and
Concrete Research, Vol. 13, pp. 603-610 2. Taylor, H.F.W (1990) Chemistry of Cement. Academic Press, pp. 236-237 3. Thaulow, N. Private communication 4. Knudsen, T. (1980) On the size distribution in cement hydration. 7th Int. Conf. on Chemistry
of Cement Vol. II, I-170, Paris 5. Geiker, M. (1983) Studies of Portland cement hydration. Measurements of chemical
shrinkage and a systematic evaluation of hydration curves by the Dispersion Model. PhD-thesis, Tech. Univ. Denmark
6. Knudsen, T (1984) The Dispersion Model for hydration of Portland cement. Cement and Concrete Research Vol.14
7. Breugel, K. van (1997) Simulation of hydration and formation of structure in hardening cement-based materials. Delft University Press, p. 140
8. Castellan, G.W. (1970) Physical chemistry. 4th edt. Addision-Wesley Publishing Company
89
MEASUREMENTS OF THE DEGREE OF HYDRATION OF CEMENT PASTE BY SEM, 29Si NMR AND XRD METHODS
Knut O. Kjellsen PhD, Project Manager Norcem A.S N-3950 Brevik, Norway [email protected]
Leif Fjällberg MSc, Research Engineer Swedish Cement and Concrete Research Institute S-100 44 Stockholm, Sweden [email protected] ABSTRACT The degree of hydration of cement paste specimens was measured from 1 day and up to 9 months by SEM-BSE image analysis, QXDA and 29Si NMR. Results on the effect of silica fume, age, and water/binder ratio are reported.
The various direct methods provided consistent measures of the degree of hydration in most cases, but not in all. Dissimilar results were obtained particularly at the early age (1 day), whereas much more consistent results were obtained at the later ages. The deviating measures indicate the experimental problems associated with determining the extent of reaction of cement phases accurately. The study indicates that the presence of silica fume has little or no influence on the degree of cement hydration.
Hydration, SEM, Image analysis, NMR, XRD
1. INTRODUCTION All direct methods for quantification of cement phases in cement pastes is at the present stage associated with some uncertainties. The complexity and large variability in the composition and structure of cement based materials may limit the outcome of the analyses. Results are often sensitive to specimen preparation and analytical procedures. The experimental errors are difficult to quantify. Obtained results must be assessed on the basis that they appear reasonable and are consistent. A strategy for assessing degree of hydration data is to compare the results from various direct methods. This has been done in the present paper. The degree of hydration was determined by three independent methods. These were scanning electron microscopy (SEM) image analysis, 29Si nuclear magnetic resonance (NMR) and quantitative X-ray diffraction analysis (QXDA). Parrott et al. /1/ and Ash et al. /2/ have recently compared hydration data obtained by some direct and indirect methods. Direct determination of the degree of hydration of cement phases has traditionally been obtained by QXDA, e.g. /1, 3-8/. Over the last two decades other powerful techniques have
90
also been applied for this purpose. The use of flat-polished specimens in the backscattered electron mode of the SEM has made it possible to obtain the degree of hydration by image analysis, e.g. /2, 9-11/. In other studies, 29Si NMR has been used to quantitatively follow the hydration of the silicon bearing phases in cement (alite and belite) /12-19/. The present paper is based on the experimental work of a by now ended research project of which various aspects of hydration, microstructure and properties of high-performance concrete and binders were investigated /20-28/. 2. EXPERIMENTAL 2.1 Materials Paste specimens were made of cement, condensed silica fume (csf), deionized water and a superplastizicer. The cement was a Swedish low-alkali sulfate-resistant portland cement (ASTM Type V). The csf was in slurry form and contained 50% solids. The characteristics of the cement and the csf is found in /23, 24/. A detailed analysis of the phase composition of the cement was performed in /24/. The plasticizer was composed of 40% sulphonated naphthalene formaldehyde, 0.3% tributyl phosphate and water. The water/binder (w/b) ratios were 0.25, 0.30 and 0.40. The binder contained 0, 5 or 10% csf by weight. The material matrix is shown in Table 1. The percentage of plasticizer of the binder weight is given in Table 1 and only the denoted combinations were made. The 0.30 w/b-ratio mix was studied by SEM only. The other mixes were studied by SEM, NMR and QXDA. Table 1: The amount of superplasticizer in the five mix combinations. The amount is given in weight-percent of the binder
Silica fume %
Water/binder ratio 0.25 0.30 0.40
0 3.0 - 0.5 5 - 2.0 - 10 4.0 - 1.5
The materials were chilled to about 15°C before mixing. The ingredients were thoroughly mixed first in a Hobart mixer and then for a short period by a high-speed dispersion blender. The fresh paste temperature was about 20°C and subsequent curing took place at 20°C. The detailed mixing procedure ensured a smooth paste with the well-dispersed csf /27/. The pastes were cast in molds having 12 mm cube compartments; the molds were completely sealed and slowly rotated under water for at least 12 hours in order to prevent segregation of the paste before the forms were opened. The specimens were then placed in tight glass bottles. This ensured sealed curing conditions with practically no moisture exchange or carbonation. Specimens were tested at 1 day, 28 days, 91 days and 9 months. Note that specimens of the 0.30 w/b-ratio paste were cured in two ways; one set of specimens was cured under sealed conditions, while the other was submerged in a small volume of water from 28 days to 9 months. Carbonation was avoided.
91
2.2 Definition of the degree of hydration The fraction of reacted cement in a hydrating cementitious system can be expressed as the degree of hydration (αh). The definition applies to single phases as well as to poly-phased materials such as Portland cement /1/. The degree of hydration of a phase (or phases) is defined as the mass of the hydrated cement phase relative to the original mass of that phase. If a single cement phase is to be determined the definition apply to measures of volume as well as to measures of mass. The quantity of reacted cement is impractical to measure directly. The converse quantity, the amount of residual unhydrated cement is rather measured and the degree of hydration (as a percentage) is calculated according to eq. (1).
αh (t=i) = (1 – AN(t=i) / AN(t=0))·100 (1)
t - age αh (t=i) - degree of hydration at age i (%) AN(t=i) - quantity of the anhydrous phase at age i AN(t=0) - quantity of the anhydrous phase at age 0
2.3 Scanning electron microscopy - image analysis Image analysis was performed in order to determine the degree of hydration of the cement, the alite plus belite, and the ferrite phase, respectively. Backscattered electron (BSE) images of flat polished sections were obtained for image analysis. The microscope was operated at 10 kV and the working distance was 15 mm. The beam current was held constant at 1.5 nA as measured in a Faraday cup. The contrast and brightness measured on the waveform monitor of the microscope was corrected manually and held as constant as possible. Calibration was performed as described in /24/. Monitor images (CRT) were obtained at a magnification of 400X and were transformed to binary images of 1024x1024 pixels. This provided a pixel size corresponding to about 0.25 microns across. The signal-to-noise ratio was improved by acquiring the binary image three times at a slow scan speed and averaging. Eight areas of each specimen were chosen randomly and analyzed, giving a total analysis area of approximately 0.5 mm2. Backscattered electron (BSE) images of flat specimens reflect the backscattering coefficient of scattered regions. The backscattering coefficients of the major cement phases alite, belite, aluminate and ferrite are ideally such that these phases can be distinguished in some cements by BSE imaging /9,11/. In the present study we were not able to clearly distinguish alite from belite, as these two phases revealed partly overlapping BSE image gray levels. The acquired images had distinct gray-level histogram peak for alite plus belite. Ferrite also showed a separate peak in the gray-level histograms. As the cement contained only some 1% of aluminate, according to the Bogue calculation /24/, this phase was not considered. The relatively large difference in backscattering coefficients between anhydrous cement and reaction products results in a good contrast between these phases. A binary segmentation process was used to determine the area fractions of anhydrous alite plus belite and ferrite, respectively. Based on the gray-level histogram, initial thresholds for the gray levels were set between the phases of ferrite, alite plus belite, and hydration products, respectively. The pixels corresponding to the gray level intervals of ferrite, and alite plus belite were given particular codes of colors and superimposed on the binary image. This was,
92
then, visually checked to see if the colored phases matched the respective anhydrous phases in the black-and-white monitor image. The threshold gray levels were corrected until the anhydrous phases were satisfactorily covered by the colored phases. Based on the final corrected gray-level thresholds, the relative fraction of ferrite and alite plus belite, respectively, was calculated from the relative number of pixels corresponding to these anhydrous phases. As a rim of artificial phases often delineates the boundary of anhydrous cement particles, the cement particles were dilated by the width of one pixel. This occurs due to averaging of gray levels between the anhydrous particles and the phases of reaction products. Half of the dilated fraction was divided in accordance with the relative amounts of the undilated ferrite and alite plus belite phases, respectively, and added to these respective anhydrous phases, accordingly. At hydration times from 28 days onwards, only 25% of the dilated fraction was accounted for in this manner on account of the fact that very bright phases of inner products often formed close to the anhydrous particles at later ages. Consequently, the anhydrous phases were to a lesser degree delineated with artificial darker rims. These corrections are of course approximate and had only minor effect on the results. The corrected area fractions of the anhydrous cement phases were taken as estimates of the volume fractions. Considering the isotropic nature of the samples (the specimens were thoroughly mixed and segregation was prevented) this conversion was considered justified. Based on the thus obtained volume percentages of the anhydrous phases the degree of hydration of the cement, the alite plus belite, and the ferrite phase, respectively, was calculated according to equation (1). The applied quantity of the anhydrous phases at age 0 (AN(t=0) of eq.1) was taken as the volume constituted by the cement phases according to the theoretical mix composition of the various pastes. The applied phase composition of the cement was based on SEM image analysis of the anhydrous cement /24/. The image analysis of the cement revealed 9.5% ferrite and 84.5% alite plus belite, by volume. The sulfate phases (i.e. mainly gypsum) were calculated to constitute 6% by volume. The relative volume of the anhydrous phases at age i (AN(t=i) of eq.1) was measured by image analysis on the assumption that the sulfate phases were dissolved. Based on the obtained degree of hydration of alite plus belite, and ferrite, respectively, the degree of hydration of the cement (i.e. alite plus belite plus ferrite) was calculated according to eq. 2.
αh(cem) = αh(alite+belite)⋅A + αh(ferrite)⋅B (2) The constant A, is the weight of alite plus belite relative to the weight of alite plus belite plus ferrite in the anhydrous cement. The constant B is the weight of ferrite relative to the weight of alite plus belite plus ferrite. The percentages by weight of the alite plus belite, and the ferrite, were obtained from the image analysis by approximating the measures of area/volume to measures of weight. Theoretical or measured densities for the ferrite, gypsum, and the cement were applied in these calculations. The thus obtained phase composition of the cement by mass was, 11.2% for ferrite and 84.4% for alite plus belite. Different methods for determination of the phase composition revealed somewhat different results. For example, the Bogue method revealed 14.6% ferrite whereas the modified Bogue method, QXDA and SEM revealed 12.3, 11.0 and 11.2% ferrite, respectively /24/. 2.4 29Si nuclear magnetic resonance The degree of hydration of the calcium silicate minerals (alite plus belite) of the cement was determined by 29Si NMR. The solid state 29Si NMR spectra were recorded on a Bruker MSL-200 spectrometer at 39.76 MHz. The experiments were carried out using a 7 mm broad band
93
double bearing CP-MAS probehead. The spinning speed was 3.3 kHz, the pulse angle was 90° after a 6 microsecond pulse, and the inter-pulse delay was set to 2 seconds. This delay period was checked prior to the experiments and found to be sufficiently long to avoid saturation effects. Approximately 2500 scans were recorded. The chemical shift scale was corrected against a standard of trimethylsilyl ester of the double four-ring silicid acid (Q8M8). The Bruker DISMSL software was used for calculation of the spectra. The integrals of the Q0-Q4 signals were calculated after the spectra were normalized. The integral of the Q0 signal is proportional to the amount of anhydrous alite plus belite. The degree of hydration of alite plus belite was then obtained according to equation 1, /16/. 2.5 Quantitative X-ray diffraction analysis The degree of hydration of alite, ferrite, and alite plus belite was measured by QXDA. The diffractometer was facilitated with a Cu Kα X-ray tube and a software program for data collection, profile fitting and peak area calculations. The operating voltage and current were 40 kV and 30 mA, respectively. The scan speed was 0.002° 2θ/sec for the ranges of selected peaks. Rutile (Ti02) was used as internal standard, the peak at 27.4° 2θ (d=3.25Å) was selected. For ferrite and alite the peaks at 12.1° 2θ (d=7.31Å) and 51.8° 2θ (d=1.76Å) were used, respectively. Presumably due to instrumental limitations, the separate peaks for belite were too small to provide meaningful results. The double peak between 31.5 and 33.2° 2θ (d=2.83-2.70 Å) were applied for calculation of the alite plus belite hydration. The peak intensity of the various anhydrous phases was measured as the integrated peak area after background corrections and relative to the peak intensity of the internal standard. The assumption was made that the peak intensity of a phase was directly proportional to the weight proportion of that phase. The degree of hydration was then calculated according to equation (1). The peak intensities were corrected for the presence of bound water (i.e. loss of water between 70 and 1000°C, cf. next section), and for the presence of silica fume and superplasticizer. Each presented result is the mean result of two X-ray runs. After the first run, the powdered sample was emptied from the holder, then re-mixed and loaded for the last run. 2.6 Specimen preparation Flat polished specimens were made for SEM. Pieces of 1 to 2 millimeters were sawn out of the paste cubes by a precision diamond saw and subsequently submerged in liquid nitrogen. They were then dried in vacuum for 2 days. Specimens of 28 days age or older were finally dried at 105°C overnight in order to ensure complete drying. After drying the specimens were vacuum-impregnated with a low-viscosity epoxy resin and very carefully ground and polished down to 0.25 microns. Alcohol was used as a lubricant during cutting and grinding while diamond paste was used as the polishing medium. The specimens were finally coated with carbon. Some topographical relief is inevitable in flat polished cementitious specimens. It results from the difference in hardness of various phases. Topographical relief may occur particularly between the anhydrous and hydrous phases. Examination of the specimens in the secondary electron mode and in the topographical backscattered electron mode of the SEM revealed that relief effects were very small in the specimens adopted for this study. They have presumably no practical effect on the result of the image analysis. The specimens showed also good epoxy saturation, very little fracturing and few ‘pull outs’. Details are found in /21/.
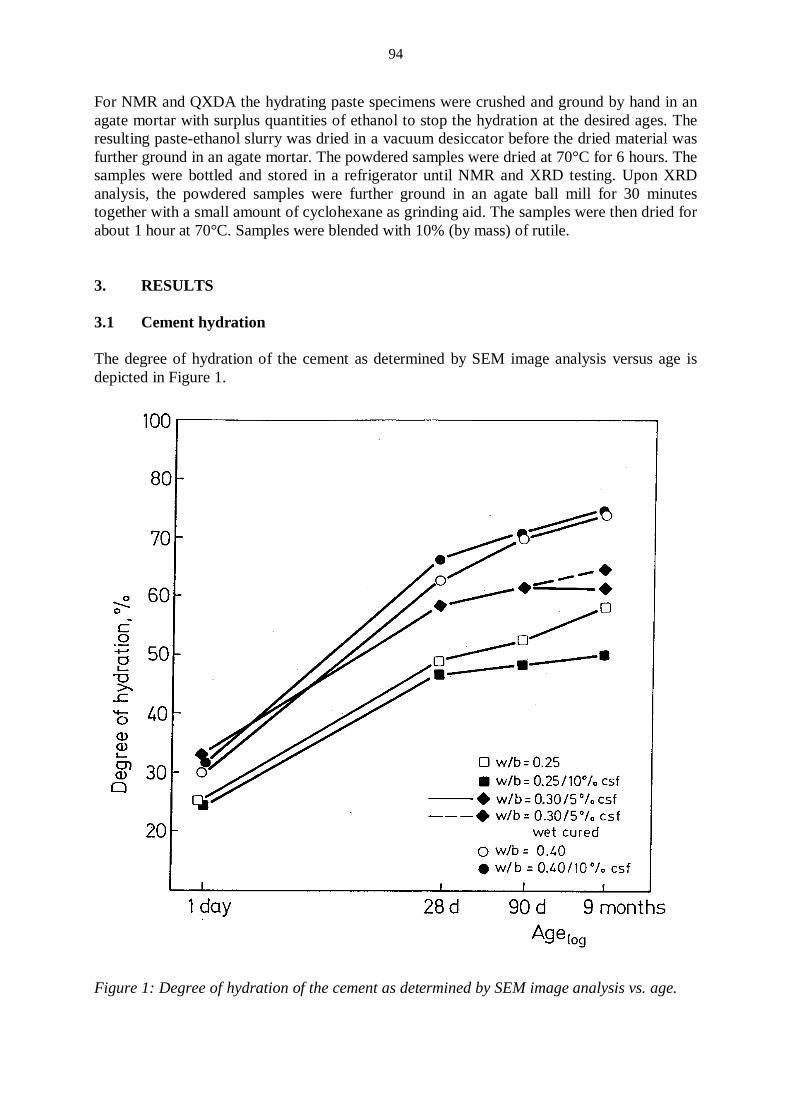
94
For NMR and QXDA the hydrating paste specimens were crushed and ground by hand in an agate mortar with surplus quantities of ethanol to stop the hydration at the desired ages. The resulting paste-ethanol slurry was dried in a vacuum desiccator before the dried material was further ground in an agate mortar. The powdered samples were dried at 70°C for 6 hours. The samples were bottled and stored in a refrigerator until NMR and XRD testing. Upon XRD analysis, the powdered samples were further ground in an agate ball mill for 30 minutes together with a small amount of cyclohexane as grinding aid. The samples were then dried for about 1 hour at 70°C. Samples were blended with 10% (by mass) of rutile. 3. RESULTS 3.1 Cement hydration The degree of hydration of the cement as determined by SEM image analysis versus age is depicted in Figure 1.
Figure 1: Degree of hydration of the cement as determined by SEM image analysis vs. age.
95
The results appear generally consistent. As expected, the degree of hydration increases with increasing age and decreases with decreasing w/b-ratio. Among the various mixes the 0.25 w/b-ratio paste without csf shows the highest rate of cement hydration from 90 days to 9 months. This is not to be expected, and the 9 months result of this mix is probably somewhat too high. Water curing between 28 days and 9 months of the 0.30 w/b-ratio paste apparently increases the cement hydration by a few percent. A large part of this increased hydration brought about by water curing is due to a considerable increase in the hydration of the ferrite phase (Figure 5). Lota /11/ measured the degree of hydration of a Class G oilwell cement by SEM image analysis. This cement had a similar composition and particle size distribution as our cement. The w/c-ratio of the paste was 0.44. His results accord well with the results of the 0.40 w/b-ratio pastes given in Figure 1. Apparently, silica fume practically does not influence the rate of cement hydration at a w/b-ratio 0.40 as revealed by SEM. It appears from Figure 1 that the presence of csf slow down the cement hydration somewhat at later ages for the 0.25 w/b-ratio paste. However, it should be remembered that the 9 months degree of hydration data of the 0.25 w/b-ratio paste without csf probably is a few percent too high. 3.2 Alite plus belite hydration Figure 2 shows the degree of hydration of the calcium silicate phases of the cement as determined by SEM image analysis and 29Si NMR. The comparison of the degree of hydration of the calcium silicate phases as determined by SEM image analysis and QXDA is depicted in Figure 3. It appears from Figures 2 and 3 that there is generally a reasonable good correlation between the degrees of hydration as determined by the various direct methods, with the exception of the results at 1 day. The results at one day are the clusters of data that are located closest to the point of origin in the Figures. Of the 16 pairs of hydration data in Figure 2, the relative difference in degree of hydration as determined by SEM and NMR is less than 5% for 7 pairs of data and less than 10% for a total of 11 pairs of data. Three pairs of data deviate by more than 20% relative. Two of these pairs of data are the day one measurements. Consider then the SEM and QXDA data. Of the 16 pairs of hydration data in Figure 3, the relative difference in degree of hydration as determined by these two methods is less than 5% for 5 pairs of data and less than 10% for a total of 11 pairs of data. Four pairs of data deviate by more than 20% relative, these are the day one measurements. Of the pairs of data with the largest deviations, SEM image analysis generally provides the most consistent results. For example, the degree of hydration at day one of the 0.25 and 0.40 w/b-ratio pastes without csf as determined by NMR is 14 and 39%, respectively. These are presumably incorrect numbers. At day one, QXDA probably overestimates the degree of alite plus belite hydration. Considering the overall results obtained by NMR, QXDA and SEM the results are somewhat contradictory when it comes to any possible effect of silica fume on the degree of cement hydration (cf. Figure 2 and 3). There is hardly any basis in the results for claiming that csf influence the development of the degree of cement hydration. One type of error that arises in the calculations of the degree of hydration of alite plus belite by SEM and NMR, is that the measurements are not based on weight proportions, as would have been strictly correct according to the definition of the degree of hydration.
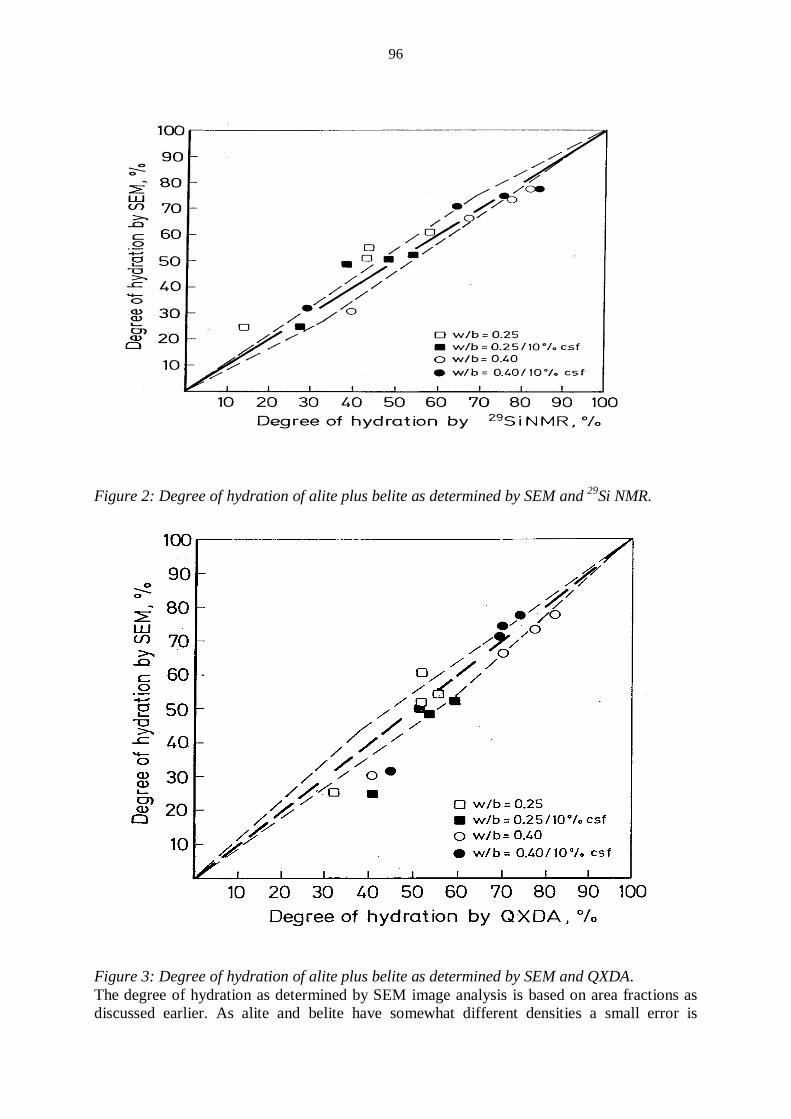
96
Figure 2: Degree of hydration of alite plus belite as determined by SEM and 29Si NMR.
Figure 3: Degree of hydration of alite plus belite as determined by SEM and QXDA. The degree of hydration as determined by SEM image analysis is based on area fractions as discussed earlier. As alite and belite have somewhat different densities a small error is
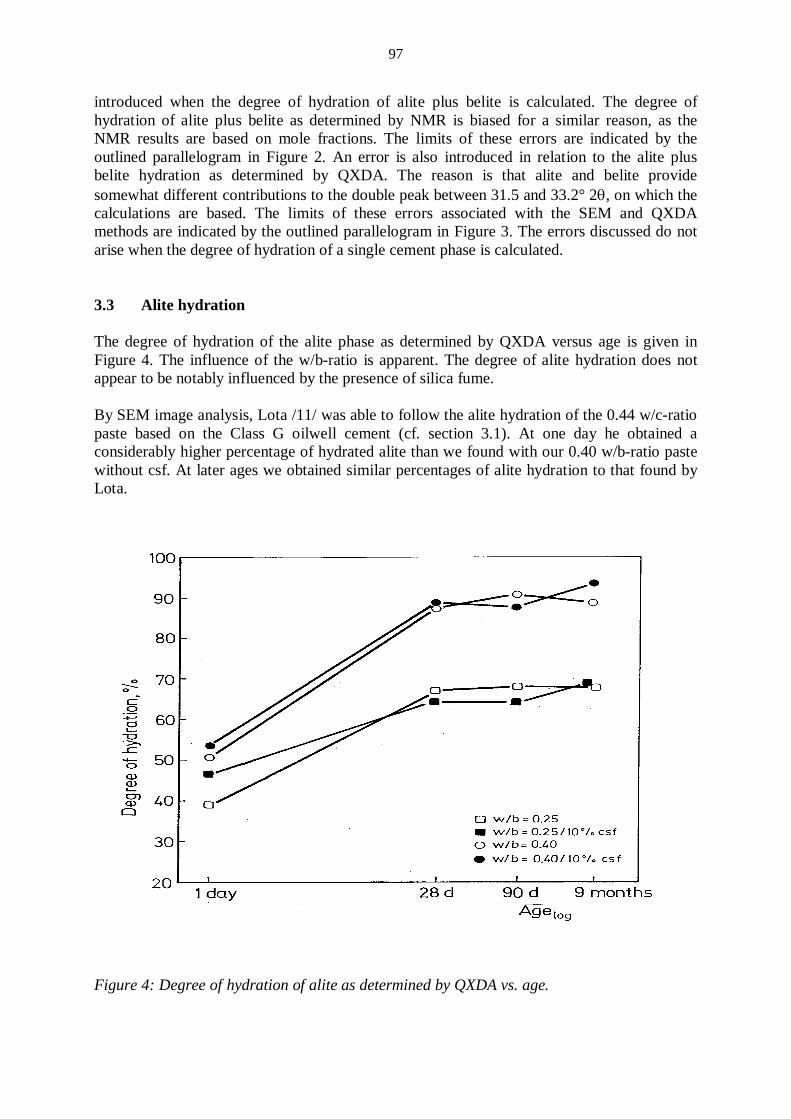
97
introduced when the degree of hydration of alite plus belite is calculated. The degree of hydration of alite plus belite as determined by NMR is biased for a similar reason, as the NMR results are based on mole fractions. The limits of these errors are indicated by the outlined parallelogram in Figure 2. An error is also introduced in relation to the alite plus belite hydration as determined by QXDA. The reason is that alite and belite provide somewhat different contributions to the double peak between 31.5 and 33.2° 2θ, on which the calculations are based. The limits of these errors associated with the SEM and QXDA methods are indicated by the outlined parallelogram in Figure 3. The errors discussed do not arise when the degree of hydration of a single cement phase is calculated. 3.3 Alite hydration The degree of hydration of the alite phase as determined by QXDA versus age is given in Figure 4. The influence of the w/b-ratio is apparent. The degree of alite hydration does not appear to be notably influenced by the presence of silica fume. By SEM image analysis, Lota /11/ was able to follow the alite hydration of the 0.44 w/c-ratio paste based on the Class G oilwell cement (cf. section 3.1). At one day he obtained a considerably higher percentage of hydrated alite than we found with our 0.40 w/b-ratio paste without csf. At later ages we obtained similar percentages of alite hydration to that found by Lota.
Figure 4: Degree of hydration of alite as determined by QXDA vs. age.
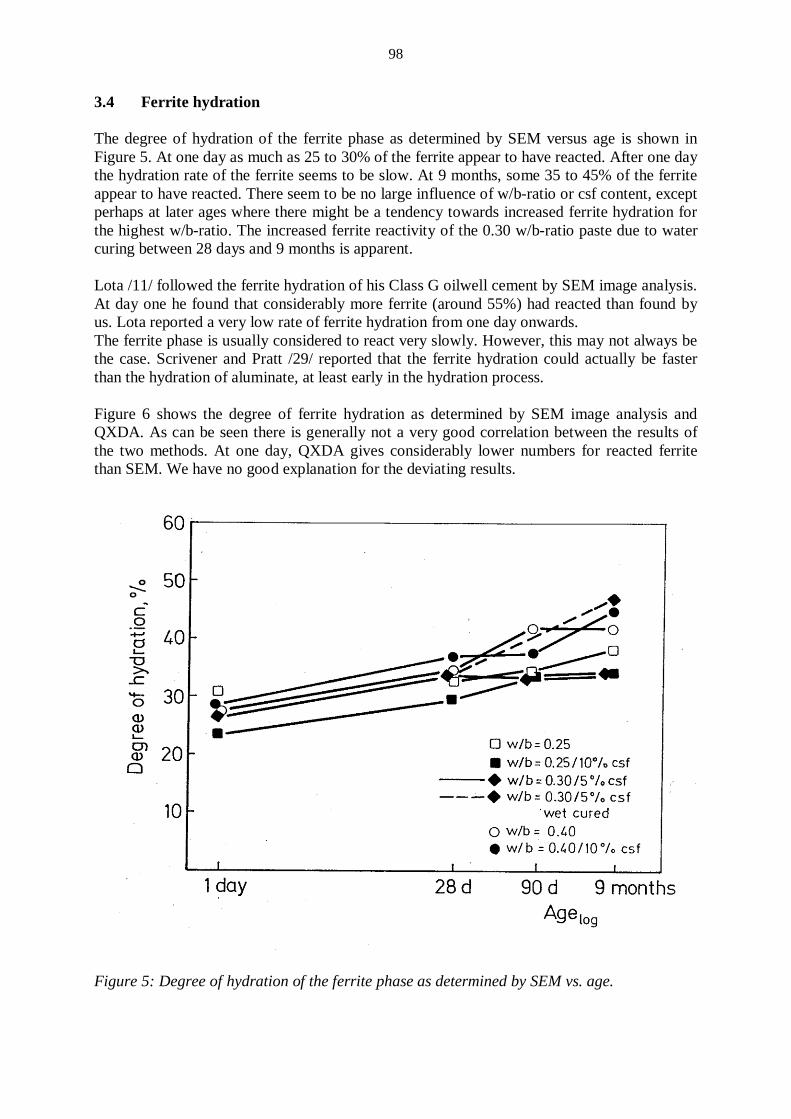
98
3.4 Ferrite hydration The degree of hydration of the ferrite phase as determined by SEM versus age is shown in Figure 5. At one day as much as 25 to 30% of the ferrite appear to have reacted. After one day the hydration rate of the ferrite seems to be slow. At 9 months, some 35 to 45% of the ferrite appear to have reacted. There seem to be no large influence of w/b-ratio or csf content, except perhaps at later ages where there might be a tendency towards increased ferrite hydration for the highest w/b-ratio. The increased ferrite reactivity of the 0.30 w/b-ratio paste due to water curing between 28 days and 9 months is apparent. Lota /11/ followed the ferrite hydration of his Class G oilwell cement by SEM image analysis. At day one he found that considerably more ferrite (around 55%) had reacted than found by us. Lota reported a very low rate of ferrite hydration from one day onwards. The ferrite phase is usually considered to react very slowly. However, this may not always be the case. Scrivener and Pratt /29/ reported that the ferrite hydration could actually be faster than the hydration of aluminate, at least early in the hydration process. Figure 6 shows the degree of ferrite hydration as determined by SEM image analysis and QXDA. As can be seen there is generally not a very good correlation between the results of the two methods. At one day, QXDA gives considerably lower numbers for reacted ferrite than SEM. We have no good explanation for the deviating results.
Figure 5: Degree of hydration of the ferrite phase as determined by SEM vs. age.
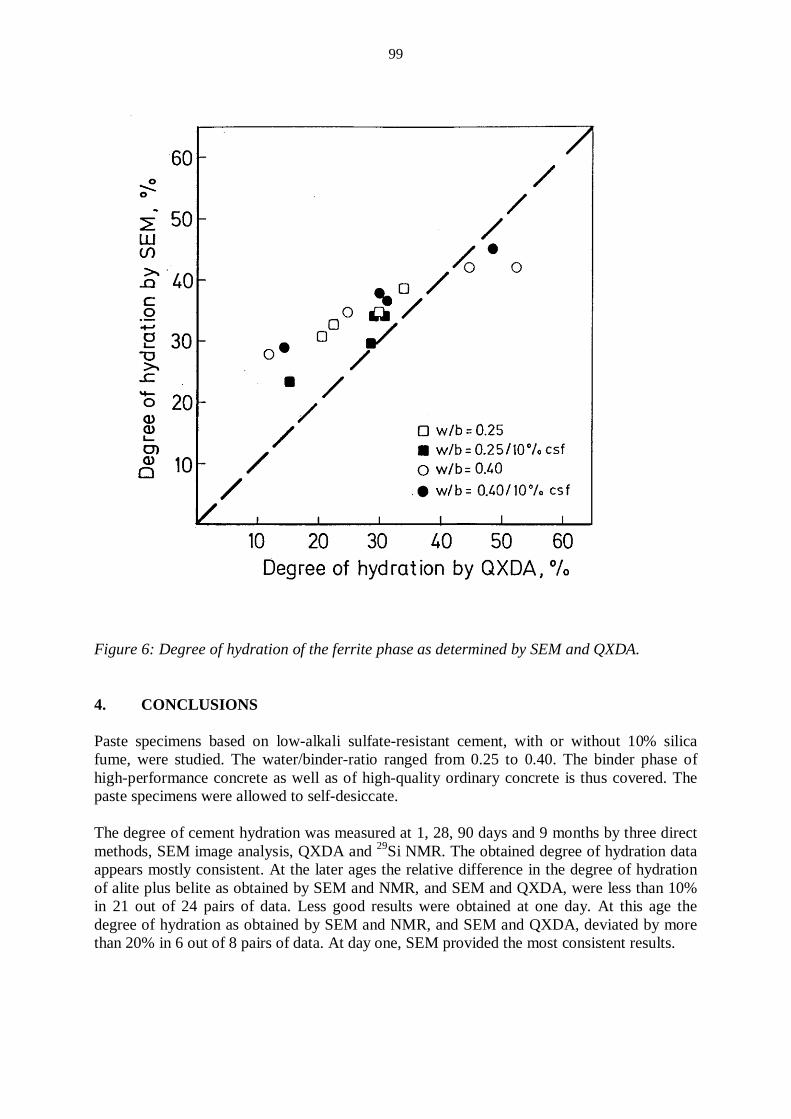
99
Figure 6: Degree of hydration of the ferrite phase as determined by SEM and QXDA. 4. CONCLUSIONS Paste specimens based on low-alkali sulfate-resistant cement, with or without 10% silica fume, were studied. The water/binder-ratio ranged from 0.25 to 0.40. The binder phase of high-performance concrete as well as of high-quality ordinary concrete is thus covered. The paste specimens were allowed to self-desiccate. The degree of cement hydration was measured at 1, 28, 90 days and 9 months by three direct methods, SEM image analysis, QXDA and 29Si NMR. The obtained degree of hydration data appears mostly consistent. At the later ages the relative difference in the degree of hydration of alite plus belite as obtained by SEM and NMR, and SEM and QXDA, were less than 10% in 21 out of 24 pairs of data. Less good results were obtained at one day. At this age the degree of hydration as obtained by SEM and NMR, and SEM and QXDA, deviated by more than 20% in 6 out of 8 pairs of data. At day one, SEM provided the most consistent results.
100
The ferrite phase appeared to hydrate relatively fast up to one day. From one day onwards the ferrite phase hydrated slowly. Some 35 to 45% of the ferrite appeared to have reacted after 9 months. It appears that around 55% of the cement have reacted after 9 months in the 0.25 w/b-ratio systems. Around 80% of the cement have reacted after 9 months in the 0.40 w/b-ratio systems. The results indicate that silica fume practically does not influence the extent of cement hydration. ACKNOWLEDGEMENTS The experimental part of this paper was conducted within the Swedish national research and development project ‘High-Performance Concrete 1991-1997’. This project was financed and directed by Cementa, Elkem Materials, Euroc Beton, NCC, Skanska, Strängbetong, and the government authorities BFR and Nutek. The NMR experiments were performed by Mr. Tore Skjetne at SINTEF-UNIMED in Trondheim. REFERENCES /1/ Parrott, L.J.; Geiker, M.; Gutteridge, W.A. and Killoh, D. ‘Monitoring Portland
Cement Hydration: Comparison of Methods’. Cement and Concrete Research, Vol.20, No.6, 1990. pp.919-926.
/2/ Ash, J.E.; Hall, M.G.; Langford, J.I. and Mellas, M. ‘Estimations of Degree of Hydration of Portland Cement Pastes’. Cement and Concrete Research, Vol.23, No.2, 1993. pp.399-406.
/3/ Copeland, L.E.; Kantro, D.L. and Verbeck, G. ‘Chemistry of Hydration of Portland Cement’. Proceedings of the 4th International Symposium on the Chemistry of Cement, Washington D.C., Vol.1, 1960. pp.429-465.
/4/ Parrot, L.J. and Killoh, D.C. ‘Prediction of Cement Hydration’. Proceedings of the British Ceramic Society, No.35, 1984. pp. 41-53.
/5/ Taylor, H.F.W.; Mohan, K. and Moir, G.K. ‘Analytical Study of Pure and Extended Portland Cement Pastes: I, Pure Portland Cement Pastes’. Journal of the American Ceramic Society, Vol.68, No.12, 1985. pp.680-685.
/6/ Tang, F.J. and Gartner, E.M. ‘Influence of Sulphate Source on Portland Cement Hydration’. Advances in Cement Research, Vol.1, No.2, 1988. pp.67-74.
/7/ Chen, Y. and Odler, I. ‘On the Kinetics of Portland Cement Hydration in the Presence of Selected Chemical Admixtures’. Advances in Cement Research, Vol.5, No.17, 1993. pp.9-13.
/8/ Schwarz, W. ‘Novel Cement Matrices by Accelerated Hydration of the Ferrite Phase in Portland Cement via Chemical Activation: Kinetics and Cementitious Properties’. Journal of Advanced Cement Based Materials, Vol.2, 1995. pp.189-200.
/9/ Scrivener, K.L. and Pratt, P.L. ‘Backscattered Electron Images of Polished Cement Sections in the Scanning Electron Microscope’. Proceedings of the 6th International Conference on Cement Microscopy, Albuquerque, 1984. pp.145-155.
/10/ Kjellsen, K.O.; Detwiler, R.J. and Gjørv, O.E. ‘Development of Microstructures in Plain Cement Pastes Hydrated at Different Temperatures’. Cement and Concrete Research, Vol.21, No.1, 1991. pp.179-189.
/11/ Lota, J.S. ‘The Hydration of Class G Oilwell Cement’. PhD Thesis, Imperial College, University of London, London, 1994. 325 pp.
101
/12/ Clayden, N.J.; Dobson, C.M.; Groves, G.W.; Hayes, C.J. and Rodger, S.A. ‘Solid State NMR Studies of Cement Hydration’. Proceedings of the British Ceramic Society, No.35, 1984. pp.55-64.
/13/ Clayden, N.J.; Dobson, C.M.; Hayes, C.J. and Rodger, S.A. ‘Hydration of Tricalcium Silicate Followed by Solid-State 29Si NMR Spectroscopy’. J. Chem. Soc. Chem. Commun., 1984. pp.1396-1397.
/14/ Barnes, J.R.; Clague, A.D.H.; Clayden, N.J.; Dobson, C.M.; Hayes, C.J.; Groves, G.W. and Rodger, S.A. ‘Hydration of Portland Cement Followed by 29Si Solid-State NMR Spectroscopy’. Journal of Materials Science Letters, Vol.4, 1985. pp.1293-1295.
/15/ Clayden, N.J.; Dobson, C.M.; Groves, G.W. and Rodger, S.A. ‘The Application of Solid State Nuclear Magnetic Resonance Spectroscopy Techniques to the Study of the Hydration of Tricalcium Silicate’. Proceedings of the 8th International Congress on the Chemistry of Cement, Rio de Janeiro, Vol.3, 1986. pp.51-56.
/16/ Justnes, H.; Meland, I; Bjørgum, J.O. and Krane, J. ‘A 29Si MAS NMR Study of the Pozzolanic Activity of Condensed Silica Fume and the Hydration of Di- and Tricalcium Silicates’. Advances in Cement Research, Vol.3, No.11, 1990. pp.111-116.
/17/ Parry-Jones, G.; Al-Tayyib, A.J. and Al-Mana, A.I. ‘Evaluation of Degree of Hydration in Concrete Using 29Si Magic Angle Spinning NMR in Solids’. Cement and Concrete Research, Vol.18, No.2, 1988. pp.229-234.
/18/ Parry-Jones, G.; Al-Tayyib, A.J.; Al-Dulaijan, S.U. and Al-Mana, A.I. ‘29Si MAS-NMR Hydration and Compressive Strength Study in Cement Paste’. Cement and Concrete Research, Vol.19, No.2, 1989. pp.228-234.
/19/ Justnes, H.; Sellevold, E. and Lundevall, G. ‘High Strength Concrete Binders Part A: Reactivity and Compositions of Cement Pastes With and Without Condensed Silica Fume’. Proceedings of the 4th International Conference on Fly Ash, Silica Fume, Slag and Natural Pozzolans in Concrete, ACI SP-132, Vol.2, Istanbul, 1992. pp.873-889.
/20/ Kjellsen, K.O. and Jennings, H.M. ‘Observations of Microcracking in Cement Pastes Upon Drying and Rewetting by Environmental Scanning Electron Microscopy’. Journal of Advanced Cement Based Materials, Vol.3, No.1, 1996. pp.14-19.
/21/ Kjellsen, K.O. and Monsøy, A. ‘Preparation of Flat-Polished Specimens of High-Performance Concrete for SEM-Backscattered Electron Imaging and Microanalysis’. Proceedings of the 18th International Conference on Cement Microscopy, Houston, 1996. pp.356-364.
/22/ Kjellsen, K.O.; Jennings, H.M and Lagerblad, B. ‘Evidence of Hollow Shells in the Microstructure of Cement Paste’. Cement and Concrete Research, Vol.26, No.4, 1996. pp. 593-599.
/23/ Kjellsen, K.O.; Jennings, H.M. and Lagerblad, B. ‘Hollow-Shell Formation - An Important Mode in the Hydration of Portland Cement’. Journal of Materials Science, Vol.32, 1997. pp. 2921-2927.
/24/ Kjellsen, K.O.; Fjällberg, L. And Skjetne, T. ‘Quantitative Analysis of the Major Phases in Sulfate-Resistant Cement Silica Fume Systems by SEM, 29Si NMR and XRD Methods’. Report No.2:97, Swedish Cement and Concrete Research Institute, Stockholm, 1997. 55 pp.
/25/ Kjellsen, K.O.; Wallevik, O.H. and Fjällberg, L. ‘Microstructure and Microchemistry of the Paste-Aggregate Interfacial Transition Zone of High-Performance Concrete’. Advances in Cement Research, Vol.10, No.1, 1998. pp. 33-40.
/26/ Kjellsen, K.O. and Helsing Atlassi, E. ‘X-ray Microanalysis of Hydrated Cement: Is the Analysis Total Related to Porosity?’. Cement and Concrete Research, Vol.28, No.2, 1998. pp. 161-165.
102
/27/ Kjellsen, K.O.; Wallevik, O.H. and Hallgren, M. ‘On the Compressive Strength Development of High-Performance Concrete and Paste – Effect of Silica Fume’. Materials and Structures, Vol.32, No.1, 1999. pp. 63-69.
/28/ Kjellsen, K.O. and Helsing Atlassi, E. ‘Pore Structure of Cement Silica Fume Systems, Presence of Hollow-Shell Pores.’ Cement and Concrete Research, Vol.29, 1999. pp.133-142.
/29/ Scrivener, K.L. and Pratt, P.L. ‘Microstructural Studies of the Hydration of C3A and C4AF Independently and in Cement Paste’. Proceedings of the British Ceramic Society, No.35, 1984. pp.207-219.

103
HYDRATION CHARACTERISTICS OF MORTARS.
Anne Marit Tønnesland Elkem ASA Materials P.O.box 8126 Vågsbygd 4675 Kristiansand [email protected] Per Fidjestøl Elkem ASA Materials P.O.box 8126 Vågsbygd 4675 Kristiansand [email protected] ABSTRACT Avoiding damage during construction can significantly reduce costs of concrete construction. As part of the IPACS (Improved Production of Advanced Concrete Structures) project, we are in the process of executing a study of the hydration process. The objective is to determine the evolution of heat, and of physical material properties in the early stages of hardening. It is also sought to establish a correlation between material properties, composition and the degree of hydration and other unique state parameters. The work includes determination of chemically bound water, heat evolution and strength development at four different curing conditions, as well as chemical and autogenous shrinkage at 20°C. Variables in the program are cement type and content, microsilica, flyash and slag, and water/cement ratio. Key words: Hydration, Compressive strength, Shrinkage, Volume changes, Heat
1. INTRODUCTION IPACS is a Brite-EuRam project with participants from Norway, Sweden, Germany, Italy and the Netherlands. The project was initiated in June 1997, and will last for approximately three years. The objective of this specific project, in which Elkem ASA Materials participates, is to determine the evolution of thermal and physical material properties in the early stage of hardening. It is also desirable to establish the correlation between material properties and the degree of hydration and other unique state parameters.
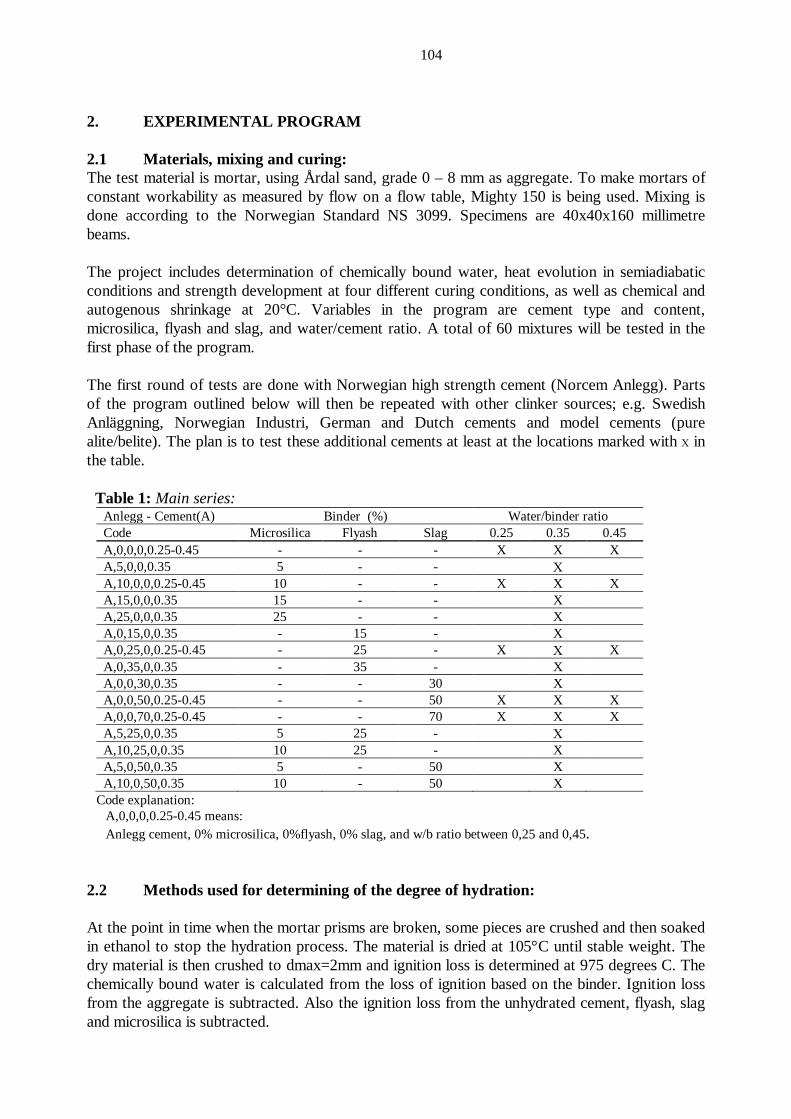
104
2. EXPERIMENTAL PROGRAM 2.1 Materials, mixing and curing: The test material is mortar, using Årdal sand, grade 0 – 8 mm as aggregate. To make mortars of constant workability as measured by flow on a flow table, Mighty 150 is being used. Mixing is done according to the Norwegian Standard NS 3099. Specimens are 40x40x160 millimetre beams. The project includes determination of chemically bound water, heat evolution in semiadiabatic conditions and strength development at four different curing conditions, as well as chemical and autogenous shrinkage at 20°C. Variables in the program are cement type and content, microsilica, flyash and slag, and water/cement ratio. A total of 60 mixtures will be tested in the first phase of the program. The first round of tests are done with Norwegian high strength cement (Norcem Anlegg). Parts of the program outlined below will then be repeated with other clinker sources; e.g. Swedish Anläggning, Norwegian Industri, German and Dutch cements and model cements (pure alite/belite). The plan is to test these additional cements at least at the locations marked with Χ in the table. Table 1: Main series:
Anlegg - Cement(A) Binder (%) Water/binder ratio Code Microsilica Flyash Slag 0.25 0.35 0.45 A,0,0,0,0.25-0.45 - - - X X X A,5,0,0,0.35 5 - - Χ A,10,0,0,0.25-0.45 10 - - X X X A,15,0,0,0.35 15 - - X A,25,0,0,0.35 25 - - X A,0,15,0,0.35 - 15 - X A,0,25,0,0.25-0.45 - 25 - X Χ X A,0,35,0,0.35 - 35 - X A,0,0,30,0.35 - - 30 X A,0,0,50,0.25-0.45 - - 50 X X X A,0,0,70,0.25-0.45 - - 70 X X X A,5,25,0,0.35 5 25 - Χ A,10,25,0,0.35 10 25 - X A,5,0,50,0.35 5 - 50 X A,10,0,50,0.35 10 - 50 X
Code explanation: A,0,0,0,0.25-0.45 means: Anlegg cement, 0% microsilica, 0%flyash, 0% slag, and w/b ratio between 0,25 and 0,45.
2.2 Methods used for determining of the degree of hydration: At the point in time when the mortar prisms are broken, some pieces are crushed and then soaked in ethanol to stop the hydration process. The material is dried at 105°C until stable weight. The dry material is then crushed to dmax=2mm and ignition loss is determined at 975 degrees C. The chemically bound water is calculated from the loss of ignition based on the binder. Ignition loss from the aggregate is subtracted. Also the ignition loss from the unhydrated cement, flyash, slag and microsilica is subtracted.
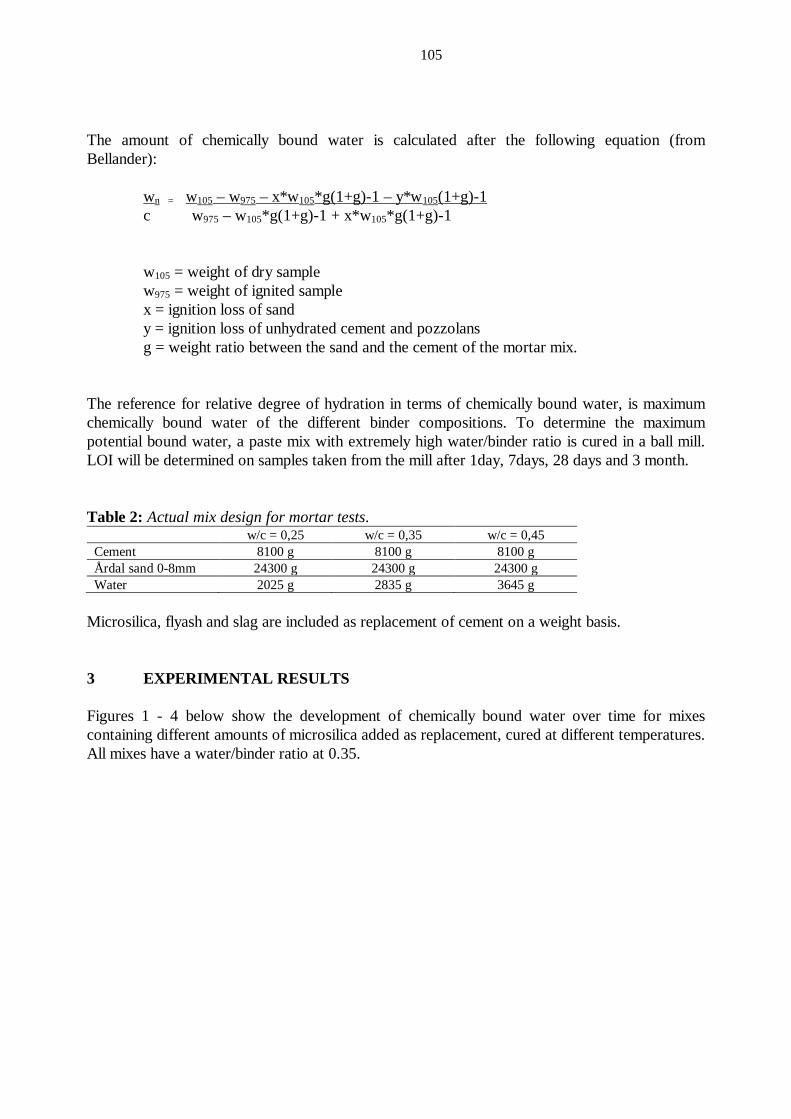
105
The amount of chemically bound water is calculated after the following equation (from Bellander):
wn = w105 – w975 – x*w105*g(1+g)-1 – y*w105(1+g)-1 c w975 – w105*g(1+g)-1 + x*w105*g(1+g)-1
w105 = weight of dry sample w975 = weight of ignited sample x = ignition loss of sand y = ignition loss of unhydrated cement and pozzolans g = weight ratio between the sand and the cement of the mortar mix.
The reference for relative degree of hydration in terms of chemically bound water, is maximum chemically bound water of the different binder compositions. To determine the maximum potential bound water, a paste mix with extremely high water/binder ratio is cured in a ball mill. LOI will be determined on samples taken from the mill after 1day, 7days, 28 days and 3 month. Table 2: Actual mix design for mortar tests.
w/c = 0,25 w/c = 0,35 w/c = 0,45 Cement 8100 g 8100 g 8100 g Årdal sand 0-8mm 24300 g 24300 g 24300 g Water 2025 g 2835 g 3645 g
Microsilica, flyash and slag are included as replacement of cement on a weight basis. 3 EXPERIMENTAL RESULTS Figures 1 - 4 below show the development of chemically bound water over time for mixes containing different amounts of microsilica added as replacement, cured at different temperatures. All mixes have a water/binder ratio at 0.35.
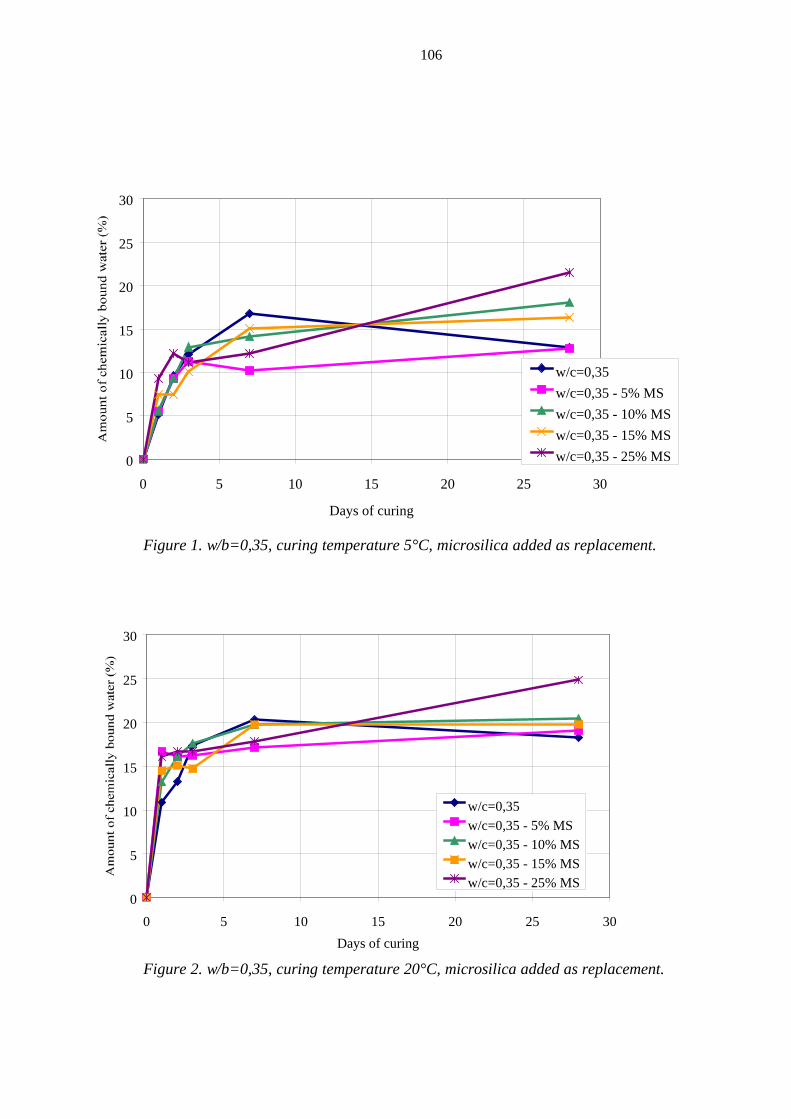
106
Figure 1. w/b=0,35, curing temperature 5°C, microsilica added as replacement.
Figure 2. w/b=0,35, curing temperature 20°C, microsilica added as replacement.
0
5
10
15
20
25
30
0 5 10 15 20 25 30
Days of curing
w/c=0,35w/c=0,35 - 5% MSw/c=0,35 - 10% MSw/c=0,35 - 15% MSw/c=0,35 - 25% MS
0
5
10
15
20
25
30
0 5 10 15 20 25 30Days of curing
w/c=0,35w/c=0,35 - 5% MSw/c=0,35 - 10% MSw/c=0,35 - 15% MSw/c=0,35 - 25% MS
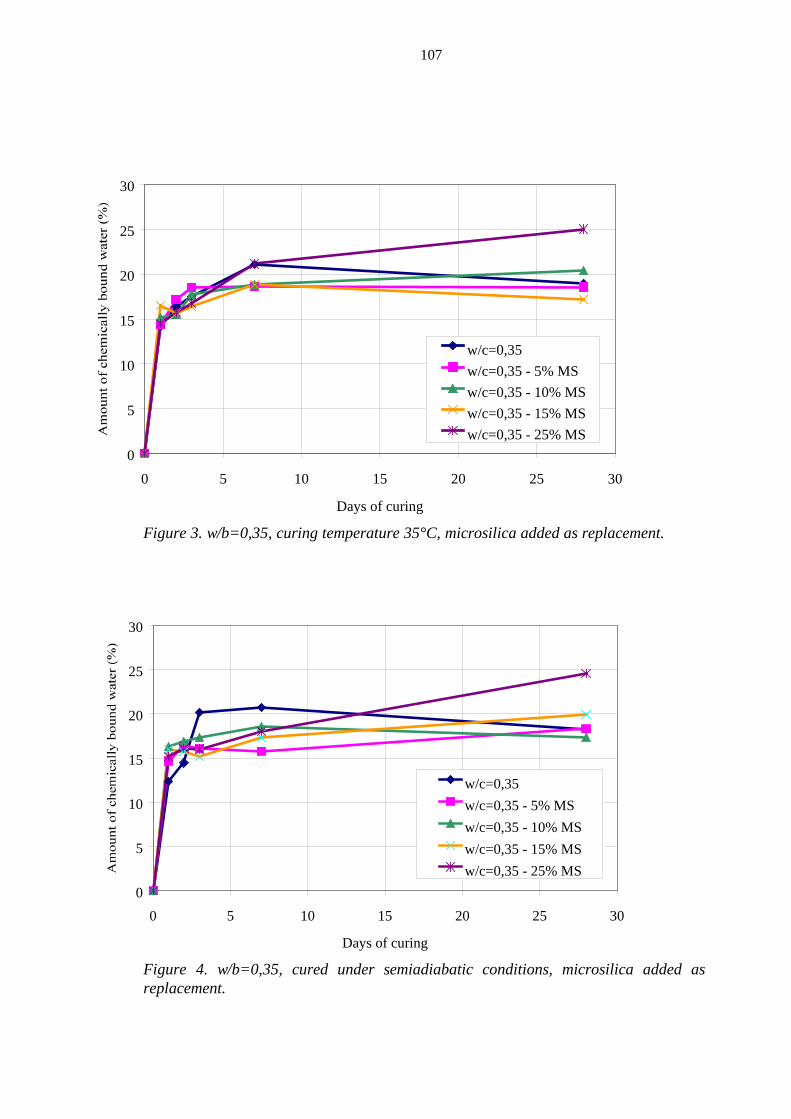
107
Figure 3. w/b=0,35, curing temperature 35°C, microsilica added as replacement.
Figure 4. w/b=0,35, cured under semiadiabatic conditions, microsilica added as replacement.
0
5
10
15
20
25
30
0 5 10 15 20 25 30
Days of curing
w/c=0,35w/c=0,35 - 5% MSw/c=0,35 - 10% MSw/c=0,35 - 15% MSw/c=0,35 - 25% MS
0
5
10
15
20
25
30
0 5 10 15 20 25 30
Days of curing
w/c=0,35w/c=0,35 - 5% MSw/c=0,35 - 10% MSw/c=0,35 - 15% MSw/c=0,35 - 25% MS
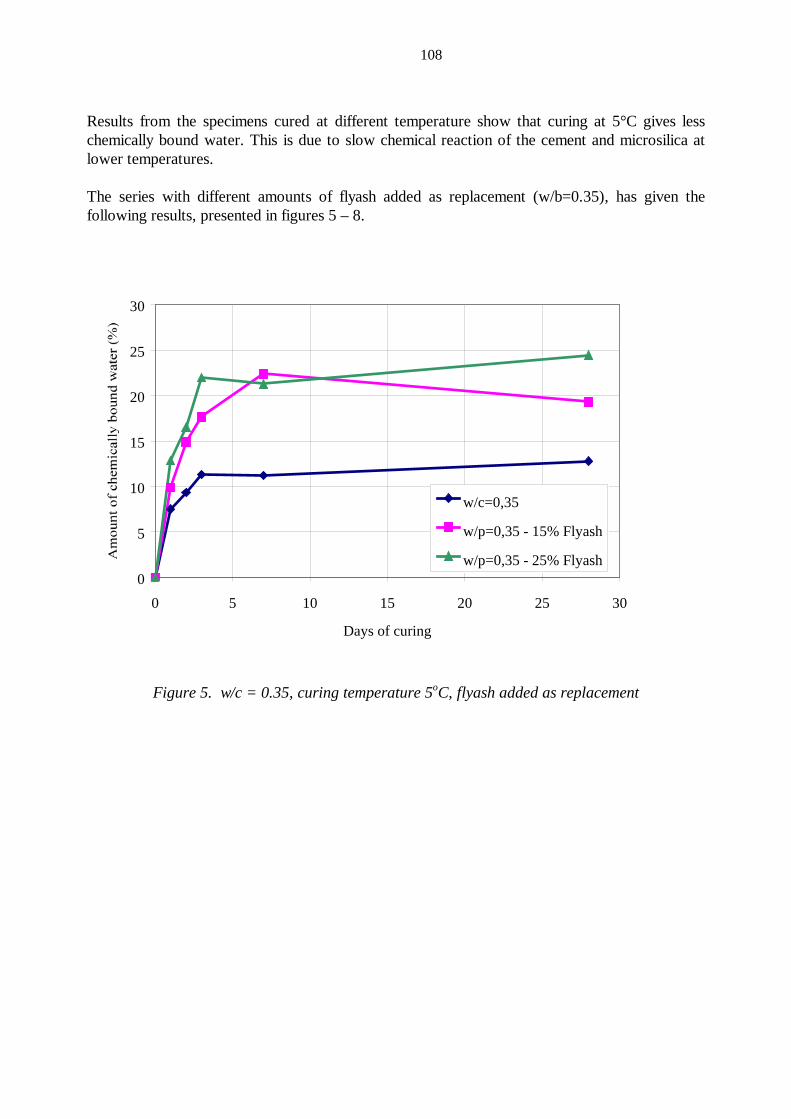
108
Results from the specimens cured at different temperature show that curing at 5°C gives less chemically bound water. This is due to slow chemical reaction of the cement and microsilica at lower temperatures. The series with different amounts of flyash added as replacement (w/b=0.35), has given the following results, presented in figures 5 – 8.
Figure 5. w/c = 0.35, curing temperature 5oC, flyash added as replacement
0
5
10
15
20
25
30
0 5 10 15 20 25 30
Days of curing
w/c=0,35
w/p=0,35 - 15% Flyash
w/p=0,35 - 25% Flyash
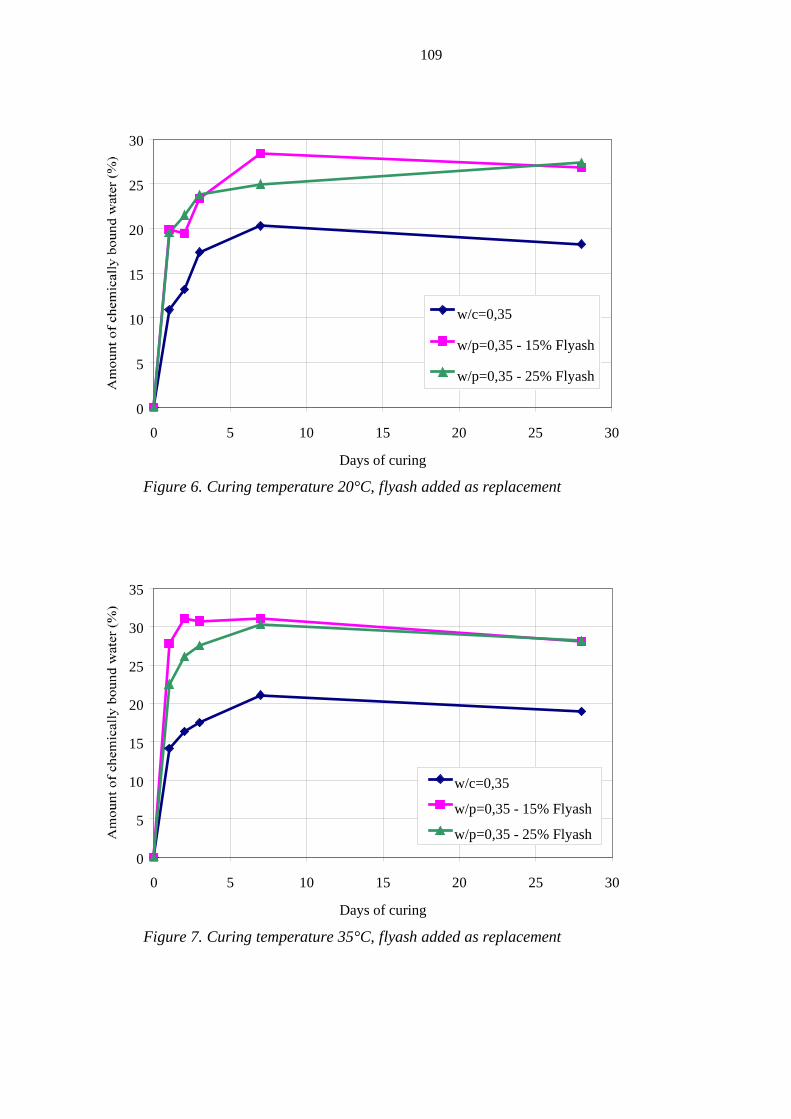
109
Figure 6. Curing temperature 20°C, flyash added as replacement
Figure 7. Curing temperature 35°C, flyash added as replacement
0
5
10
15
20
25
30
0 5 10 15 20 25 30
Days of curing
w/c=0,35
w/p=0,35 - 15% Flyash
w/p=0,35 - 25% Flyash
0
5
10
15
20
25
30
35
0 5 10 15 20 25 30
Days of curing
w/c=0,35
w/p=0,35 - 15% Flyash
w/p=0,35 - 25% Flyash

110
Figure 8. Cured under semiadiabatic condition, flyash added as replacement. The results above show that after 28 days of curing, temperature independent, the amount of chemically bound water increase with addition of flyash. In the initial time of setting, amount of chemically bound water seem to reflect the strength development, and observed results for flexural and compressive strength shows the correlation between these measurements. There has been performed more tests with different binder compositions at w/b=0,35 and also tests with water/binder ratio 0.25 and 0.45. 4 STATUS: So far, we have finished most of the wanted experiments. The project will be finished, and report written, during spring/summer 2000.
0
5
10
15
20
25
30
35
0 5 10 15 20 25 30
Days of curing
w/c=0,35
w/p=0,35 - 15% Flyash
w/p=0,35 - 25% Flyash
111
STUDIES OF HYDRATION AND DRYING IN CEMENT PASTES BY SCANNING X-RAY ABSORPTIOMETRY
Kurt Kielsgaard Hansen Associate Professor, Ph.D.
Dale P. Bentz Visiting Professor
Dept. of Structural Engineering and Materials Technical University of Denmark Brovej, Building 118 DK-2800 Kgs. Lyngby Denmark E-mail: [email protected]
ABSTRACT Hydration and drying in cement pastes are studied using the X-ray environmental chamber at DTU. By using the X-ray detector to detect changes in internal density (indicative of drying), the influence of w/c ratio on drying during hydration is quantitatively examined. Key words: X-ray absorptiometry, cement paste, drying 1. INTRODUCTION The proper curing of field concrete is critical to obtaining optimum performance. This is particularly true from a durability standpoint since it is the top layer of the concrete that provides the first protective barrier against the ingress of deleterious substances. In current standards, recommended curing practices are given that depend on the external environment but generally do not consider the differences in concrete mixture proportions. Many years ago, Powers /1/ suggested that concrete need only be cured until the capillary pore system de-percolates. The lower the w/c ratio, the sooner this de-percolation will occur in the hydration process. The capillary pore structure in a low w/c ratio high performance concrete is different from that in a conventional 0.5 w/c ratio concrete. Hydration and drying in cement pastes are studied using the X-ray environmental chamber at the Technical University of Denmark (DTU). By using the X-ray detector to detect changes in internal density (indicative of drying), the influence of the w/c ratio on drying during hydration can be quantitatively examined.
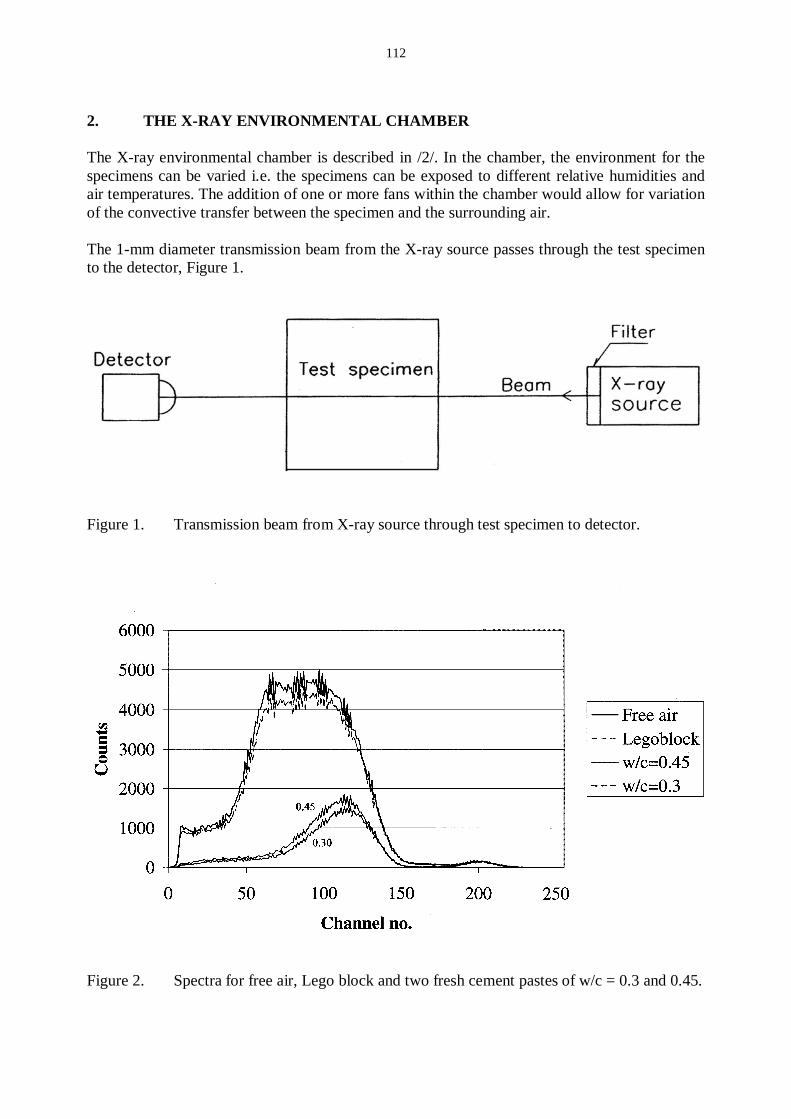
112
2. THE X-RAY ENVIRONMENTAL CHAMBER The X-ray environmental chamber is described in /2/. In the chamber, the environment for the specimens can be varied i.e. the specimens can be exposed to different relative humidities and air temperatures. The addition of one or more fans within the chamber would allow for variation of the convective transfer between the specimen and the surrounding air. The 1-mm diameter transmission beam from the X-ray source passes through the test specimen to the detector, Figure 1.
Figure 1. Transmission beam from X-ray source through test specimen to detector.
Figure 2. Spectra for free air, Lego block and two fresh cement pastes of w/c = 0.3 and 0.45.
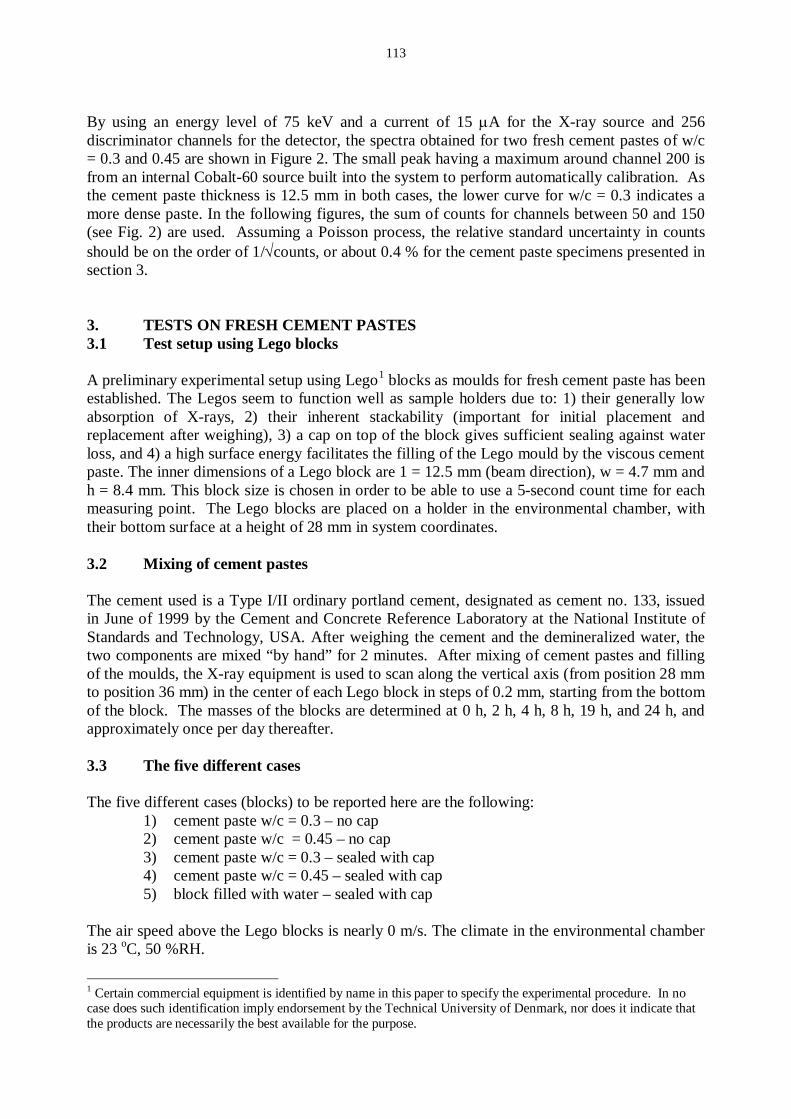
113
By using an energy level of 75 keV and a current of 15 µA for the X-ray source and 256 discriminator channels for the detector, the spectra obtained for two fresh cement pastes of w/c = 0.3 and 0.45 are shown in Figure 2. The small peak having a maximum around channel 200 is from an internal Cobalt-60 source built into the system to perform automatically calibration. As the cement paste thickness is 12.5 mm in both cases, the lower curve for w/c = 0.3 indicates a more dense paste. In the following figures, the sum of counts for channels between 50 and 150 (see Fig. 2) are used. Assuming a Poisson process, the relative standard uncertainty in counts should be on the order of 1/√counts, or about 0.4 % for the cement paste specimens presented in section 3. 3. TESTS ON FRESH CEMENT PASTES 3.1 Test setup using Lego blocks A preliminary experimental setup using Lego1
blocks as moulds for fresh cement paste has been established. The Legos seem to function well as sample holders due to: 1) their generally low absorption of X-rays, 2) their inherent stackability (important for initial placement and replacement after weighing), 3) a cap on top of the block gives sufficient sealing against water loss, and 4) a high surface energy facilitates the filling of the Lego mould by the viscous cement paste. The inner dimensions of a Lego block are 1 = 12.5 mm (beam direction), w = 4.7 mm and h = 8.4 mm. This block size is chosen in order to be able to use a 5-second count time for each measuring point. The Lego blocks are placed on a holder in the environmental chamber, with their bottom surface at a height of 28 mm in system coordinates.
3.2 Mixing of cement pastes The cement used is a Type I/II ordinary portland cement, designated as cement no. 133, issued in June of 1999 by the Cement and Concrete Reference Laboratory at the National Institute of Standards and Technology, USA. After weighing the cement and the demineralized water, the two components are mixed “by hand” for 2 minutes. After mixing of cement pastes and filling of the moulds, the X-ray equipment is used to scan along the vertical axis (from position 28 mm to position 36 mm) in the center of each Lego block in steps of 0.2 mm, starting from the bottom of the block. The masses of the blocks are determined at 0 h, 2 h, 4 h, 8 h, 19 h, and 24 h, and approximately once per day thereafter. 3.3 The five different cases The five different cases (blocks) to be reported here are the following: 1) cement paste w/c = 0.3 – no cap 2) cement paste w/c = 0.45 – no cap 3) cement paste w/c = 0.3 – sealed with cap 4) cement paste w/c = 0.45 – sealed with cap 5) block filled with water – sealed with cap The air speed above the Lego blocks is nearly 0 m/s. The climate in the environmental chamber is 23 oC, 50 %RH.
1 Certain commercial equipment is identified by name in this paper to specify the experimental procedure. In no case does such identification imply endorsement by the Technical University of Denmark, nor does it indicate that the products are necessarily the best available for the purpose.
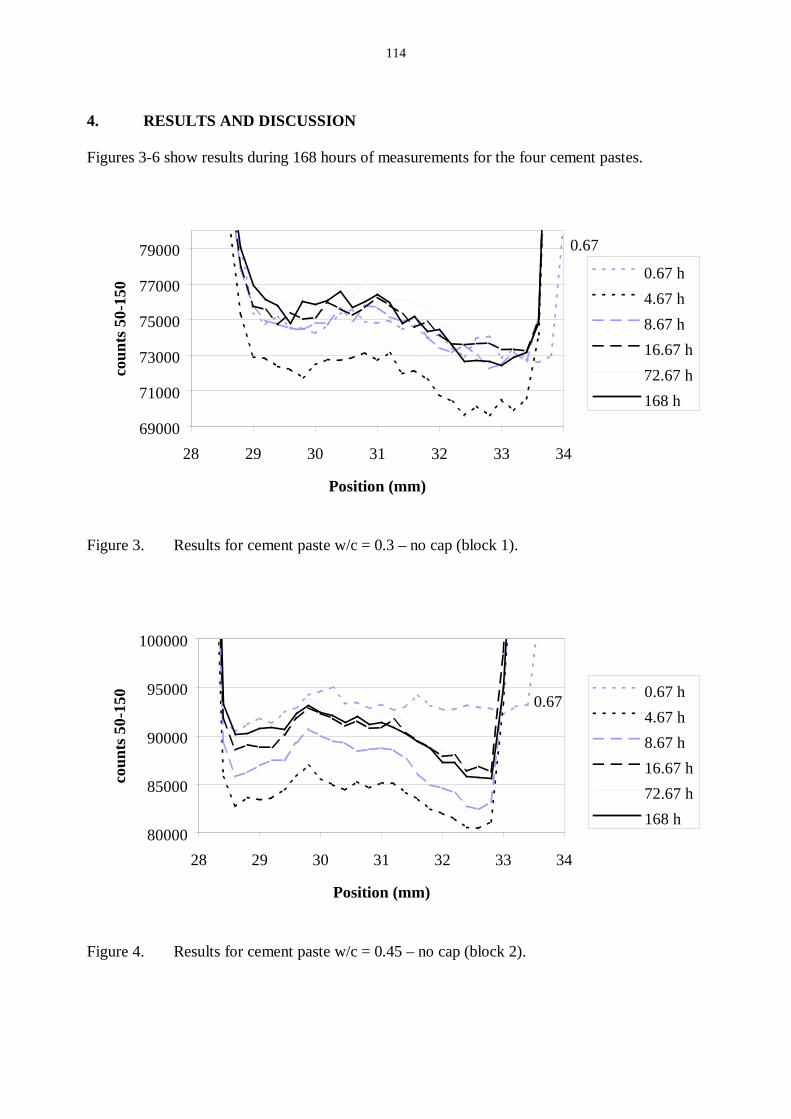
114
4. RESULTS AND DISCUSSION Figures 3-6 show results during 168 hours of measurements for the four cement pastes.
0.67
69000
71000
73000
75000
77000
79000
28 29 30 31 32 33 34
Position (mm)
coun
ts 5
0-15
0
0.67 h4.67 h8.67 h16.67 h72.67 h168 h
Figure 3. Results for cement paste w/c = 0.3 – no cap (block 1).
0.67
80000
85000
90000
95000
100000
28 29 30 31 32 33 34
Position (mm)
coun
ts 5
0-15
0 0.67 h4.67 h8.67 h16.67 h72.67 h168 h
Figure 4. Results for cement paste w/c = 0.45 – no cap (block 2).
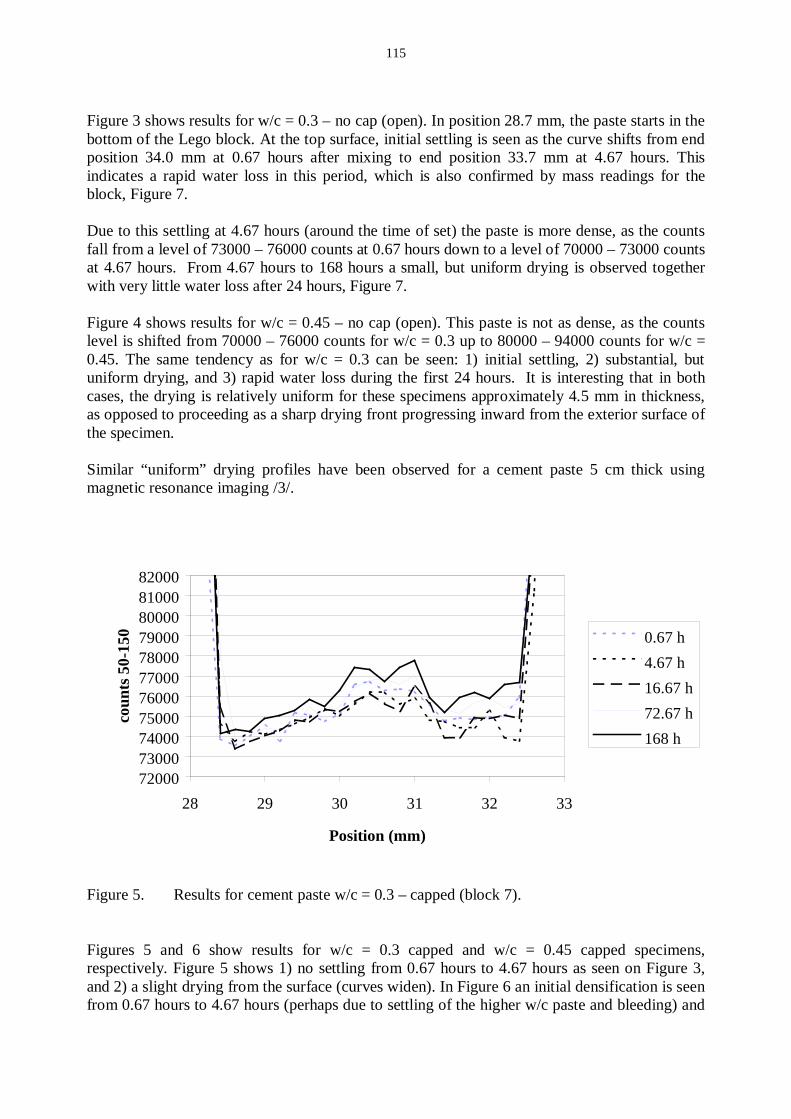
115
Figure 3 shows results for w/c = 0.3 – no cap (open). In position 28.7 mm, the paste starts in the bottom of the Lego block. At the top surface, initial settling is seen as the curve shifts from end position 34.0 mm at 0.67 hours after mixing to end position 33.7 mm at 4.67 hours. This indicates a rapid water loss in this period, which is also confirmed by mass readings for the block, Figure 7. Due to this settling at 4.67 hours (around the time of set) the paste is more dense, as the counts fall from a level of 73000 – 76000 counts at 0.67 hours down to a level of 70000 – 73000 counts at 4.67 hours. From 4.67 hours to 168 hours a small, but uniform drying is observed together with very little water loss after 24 hours, Figure 7. Figure 4 shows results for w/c = 0.45 – no cap (open). This paste is not as dense, as the counts level is shifted from 70000 – 76000 counts for w/c = 0.3 up to 80000 – 94000 counts for w/c = 0.45. The same tendency as for w/c = 0.3 can be seen: 1) initial settling, 2) substantial, but uniform drying, and 3) rapid water loss during the first 24 hours. It is interesting that in both cases, the drying is relatively uniform for these specimens approximately 4.5 mm in thickness, as opposed to proceeding as a sharp drying front progressing inward from the exterior surface of the specimen. Similar “uniform” drying profiles have been observed for a cement paste 5 cm thick using magnetic resonance imaging /3/.
7200073000740007500076000770007800079000800008100082000
28 29 30 31 32 33
Position (mm)
coun
ts 5
0-15
0 0.67 h4.67 h16.67 h72.67 h168 h
Figure 5. Results for cement paste w/c = 0.3 – capped (block 7). Figures 5 and 6 show results for w/c = 0.3 capped and w/c = 0.45 capped specimens, respectively. Figure 5 shows 1) no settling from 0.67 hours to 4.67 hours as seen on Figure 3, and 2) a slight drying from the surface (curves widen). In Figure 6 an initial densification is seen from 0.67 hours to 4.67 hours (perhaps due to settling of the higher w/c paste and bleeding) and
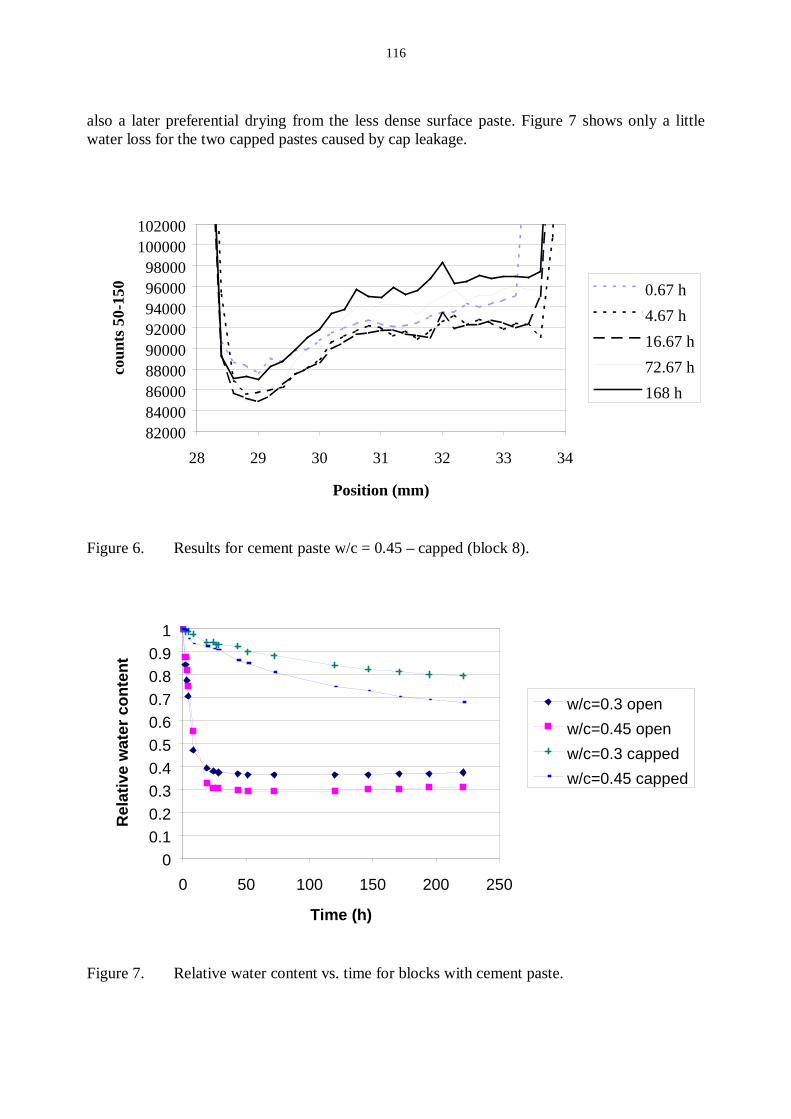
116
also a later preferential drying from the less dense surface paste. Figure 7 shows only a little water loss for the two capped pastes caused by cap leakage.
820008400086000880009000092000940009600098000
100000102000
28 29 30 31 32 33 34
Position (mm)
coun
ts 5
0-15
0 0.67 h4.67 h16.67 h72.67 h168 h
Figure 6. Results for cement paste w/c = 0.45 – capped (block 8).
00.10.20.30.40.50.60.70.80.9
1
0 50 100 150 200 250
Time (h)
Rel
ativ
e w
ater
con
tent
w/c=0.3 openw/c=0.45 openw/c=0.3 cappedw/c=0.45 capped
Figure 7. Relative water content vs. time for blocks with cement paste.
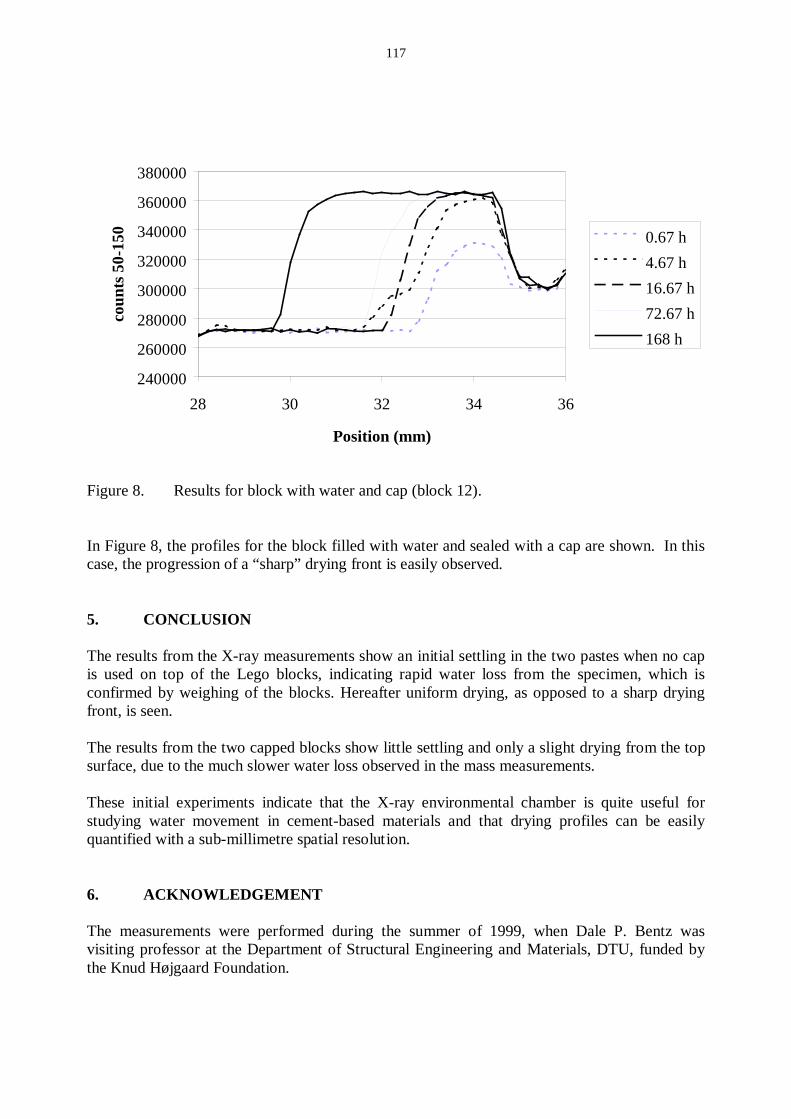
117
240000
260000
280000
300000
320000
340000
360000
380000
28 30 32 34 36
Position (mm)
coun
ts 5
0-15
0 0.67 h4.67 h16.67 h72.67 h168 h
Figure 8. Results for block with water and cap (block 12). In Figure 8, the profiles for the block filled with water and sealed with a cap are shown. In this case, the progression of a “sharp” drying front is easily observed. 5. CONCLUSION The results from the X-ray measurements show an initial settling in the two pastes when no cap is used on top of the Lego blocks, indicating rapid water loss from the specimen, which is confirmed by weighing of the blocks. Hereafter uniform drying, as opposed to a sharp drying front, is seen. The results from the two capped blocks show little settling and only a slight drying from the top surface, due to the much slower water loss observed in the mass measurements. These initial experiments indicate that the X-ray environmental chamber is quite useful for studying water movement in cement-based materials and that drying profiles can be easily quantified with a sub-millimetre spatial resolution. 6. ACKNOWLEDGEMENT The measurements were performed during the summer of 1999, when Dale P. Bentz was visiting professor at the Department of Structural Engineering and Materials, DTU, funded by the Knud Højgaard Foundation.
118
7. LITERATURE /1/ Powers, T.C.: A Discussion of Cement Hydration in Relation to the Curing of
Concrete. Proceedings of the Highway Research Board, Vol. 27, 1947. /2/ Hansen, Kurt Kielsgaard et al.: Dual-energy X-ray absorptiometry for the simultaneous
determination of Density and Moisture Content in Porous Structural Materials. Proceedings from 5th Symposium on Building Physics in the Nordic Countries, Gothenburg, Sweden, 1999.
/3/ Coussot, Philippe, unpublished results, 1999.
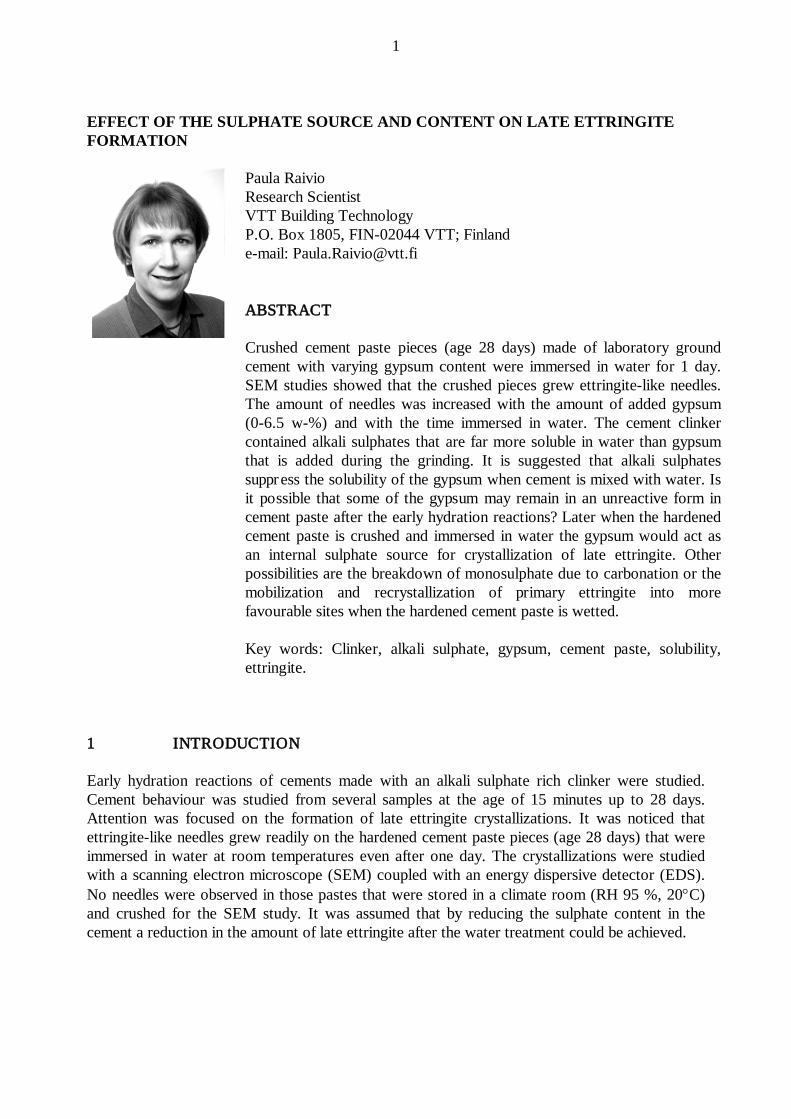
1
EFFECT OF THE SULPHATE SOURCE AND CONTENT ON LATE ETTRINGITE FORMATION
Paula Raivio Research Scientist VTT Building Technology P.O. Box 1805, FIN-02044 VTT; Finland e-mail: [email protected] ABSTRACT Crushed cement paste pieces (age 28 days) made of laboratory ground cement with varying gypsum content were immersed in water for 1 day. SEM studies showed that the crushed pieces grew ettringite-like needles. The amount of needles was increased with the amount of added gypsum (0-6.5 w-%) and with the time immersed in water. The cement clinker contained alkali sulphates that are far more soluble in water than gypsum that is added during the grinding. It is suggested that alkali sulphates suppress the solubility of the gypsum when cement is mixed with water. Is it possible that some of the gypsum may remain in an unreactive form in cement paste after the early hydration reactions? Later when the hardened cement paste is crushed and immersed in water the gypsum would act as an internal sulphate source for crystallization of late ettringite. Other possibilities are the breakdown of monosulphate due to carbonation or the mobilization and recrystallization of primary ettringite into more favourable sites when the hardened cement paste is wetted. Key words: Clinker, alkali sulphate, gypsum, cement paste, solubility, ettringite.
1 INTRODUCTION Early hydration reactions of cements made with an alkali sulphate rich clinker were studied. Cement behaviour was studied from several samples at the age of 15 minutes up to 28 days. Attention was focused on the formation of late ettringite crystallizations. It was noticed that ettringite-like needles grew readily on the hardened cement paste pieces (age 28 days) that were immersed in water at room temperatures even after one day. The crystallizations were studied with a scanning electron microscope (SEM) coupled with an energy dispersive detector (EDS). No needles were observed in those pastes that were stored in a climate room (RH 95 %, 20°C) and crushed for the SEM study. It was assumed that by reducing the sulphate content in the cement a reduction in the amount of late ettringite after the water treatment could be achieved.

2
2 EXPERIMENTAL 2.1 Materials Cements for the tests were ground separately in the laboratory from cement clinker, FeSO4, gypsum and limestone. The amounts of clinker (90.7 w-%) and FeSO4 (0.6 w-%) were kept constant and equal to the factory ground cement that was used as a reference. The amount of gypsum was varied (0-6.5 w-%) and the amount of limestone was varied accordingly. SO3-content of the clinker was 1.4 w-%, K2O 1.1 w-% and Na2O 0.9 w-%. According to EDS analyses alkali sulphates were abundantly present in the clinker as aphtitalite K3Na(SO4)2. Total sulphate content of the cements varied between 1.5-4.5 w-%. Specific surface of the ground clinker was 401 m2/kg, gypsum 406 m2/kg and limestone 498 m2
/kg.
2.2 Setting time and compressive strength Setting time of the laboratory and the factory ground (reference) cements was determined according to SFS-EN 196-3 /4/ and compressive strength according to SFS-EN 196-1 /5/. The setting time was acceptable (>100 minutes) in cements with total sulphate content ≥ 2.2 w-%. The compressive strengths of the laboratory ground cements increased as the sulphate content incresed, although the factory ground cement showed generally slightly better results than any of the laboratory ground cements. 2.3 Sulphate content and pH of pore solution Pore solution samples were taken from cement pastes (w/c=0.4) at the ages of 1, 15 and 60 minutes. The samples were vacuum filtered under 1 minute through a polycarbonate filter (pore size 0.2 µm). Meanwhile the pastes were exposed to nitrogen gas. 4 or 5 ml of the filtrate was diluted up to 100 ml with 0.1 M hydrogen chloride acid. The samples were then analyzed with ion chromatography. The results indicated that pore solutions of the reference, D, A and C pastes (total SO3 of cement 2.2-4.5 %) were saturated with sulphate ions at the age of 1 minute. The sulphate content decreased a little with time. The pore solution of the gypsum free paste B (total SO3
of cement 1.4 %) was not saturated with sulphate ions at the age of 1 minute (Fig. 1). The pH value of the reference sample was about 12.8 at the age of 1-2 minutes and rose to about 13.2 at the age of 10 minutes.
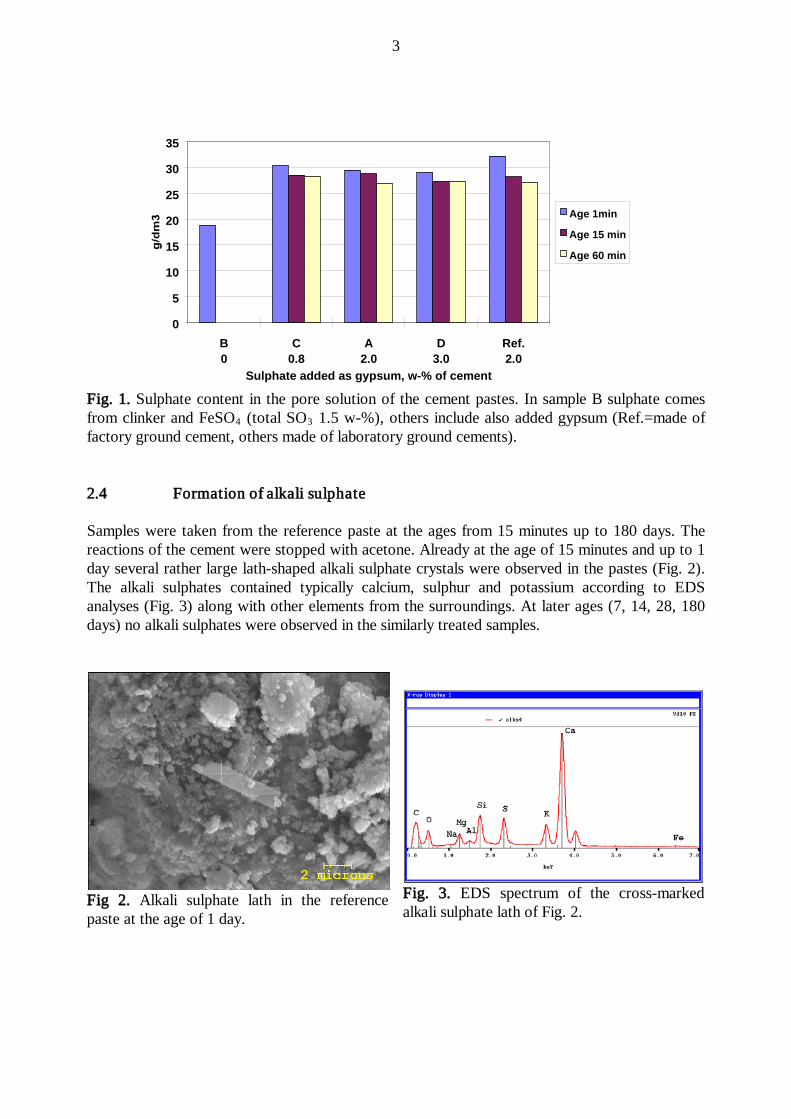
3
Fig. 1. Sulphate content in the pore solution of the cement pastes. In sample B sulphate comes from clinker and FeSO4 (total SO3
1.5 w-%), others include also added gypsum (Ref.=made of factory ground cement, others made of laboratory ground cements).
2.4 Formation of alkali sulphate Samples were taken from the reference paste at the ages from 15 minutes up to 180 days. The reactions of the cement were stopped with acetone. Already at the age of 15 minutes and up to 1 day several rather large lath-shaped alkali sulphate crystals were observed in the pastes (Fig. 2). The alkali sulphates contained typically calcium, sulphur and potassium according to EDS analyses (Fig. 3) along with other elements from the surroundings. At later ages (7, 14, 28, 180 days) no alkali sulphates were observed in the similarly treated samples.
Fig 2. Alkali sulphate lath in the reference paste at the age of 1 day.
Fig. 3. EDS spectrum of the cross-marked alkali sulphate lath of Fig. 2.
0
5
10
15
20
25
30
35
B0
C0.8
A2.0
D3.0
Ref.2.0
Sulphate added as gypsum, w-% of cement
Age 1min
Age 15 min
Age 60 min
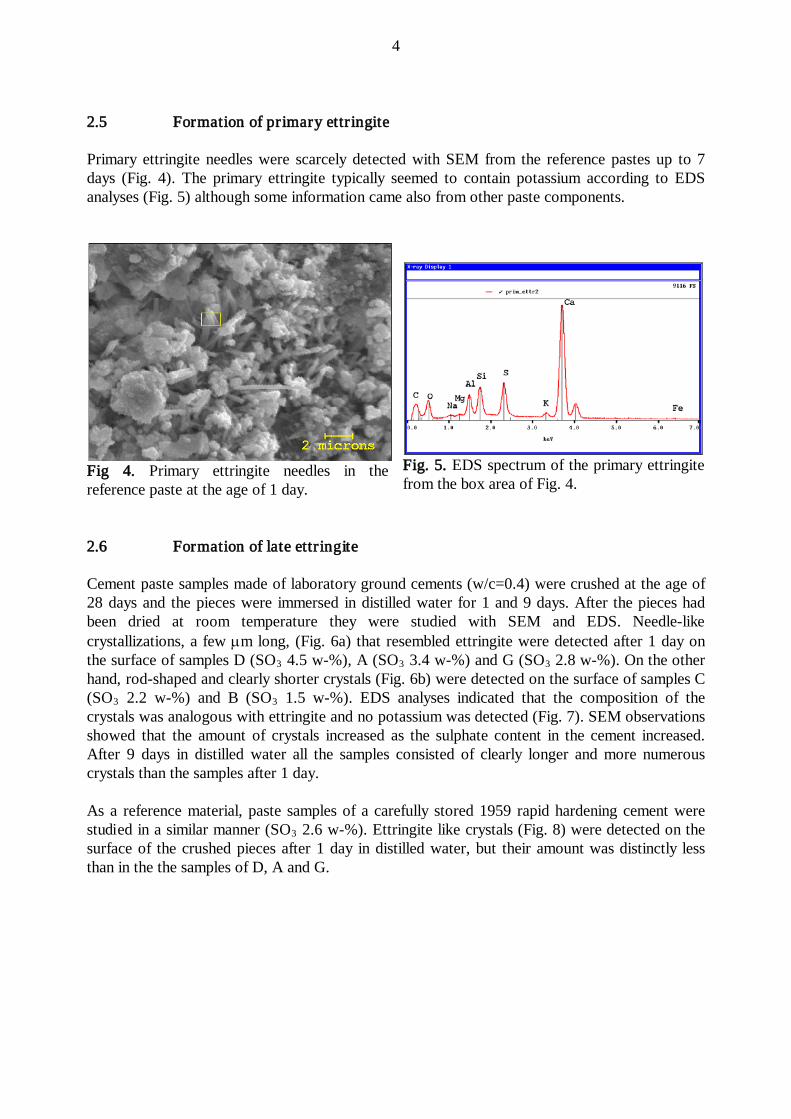
4
2.5 Formation of primary ettringite Primary ettringite needles were scarcely detected with SEM from the reference pastes up to 7 days (Fig. 4). The primary ettringite typically seemed to contain potassium according to EDS analyses (Fig. 5) although some information came also from other paste components.
Fig 4. Primary ettringite needles in the reference paste at the age of 1 day.
Fig. 5. EDS spectrum of the primary ettringite from the box area of Fig. 4.
2.6 Formation of late ettringite Cement paste samples made of laboratory ground cements (w/c=0.4) were crushed at the age of 28 days and the pieces were immersed in distilled water for 1 and 9 days. After the pieces had been dried at room temperature they were studied with SEM and EDS. Needle-like crystallizations, a few µm long, (Fig. 6a) that resembled ettringite were detected after 1 day on the surface of samples D (SO3 4.5 w-%), A (SO3 3.4 w-%) and G (SO3 2.8 w-%). On the other hand, rod-shaped and clearly shorter crystals (Fig. 6b) were detected on the surface of samples C (SO3 2.2 w-%) and B (SO3
1.5 w-%). EDS analyses indicated that the composition of the crystals was analogous with ettringite and no potassium was detected (Fig. 7). SEM observations showed that the amount of crystals increased as the sulphate content in the cement increased. After 9 days in distilled water all the samples consisted of clearly longer and more numerous crystals than the samples after 1 day.
As a reference material, paste samples of a carefully stored 1959 rapid hardening cement were studied in a similar manner (SO3
2.6 w-%). Ettringite like crystals (Fig. 8) were detected on the surface of the crushed pieces after 1 day in distilled water, but their amount was distinctly less than in the the samples of D, A and G.
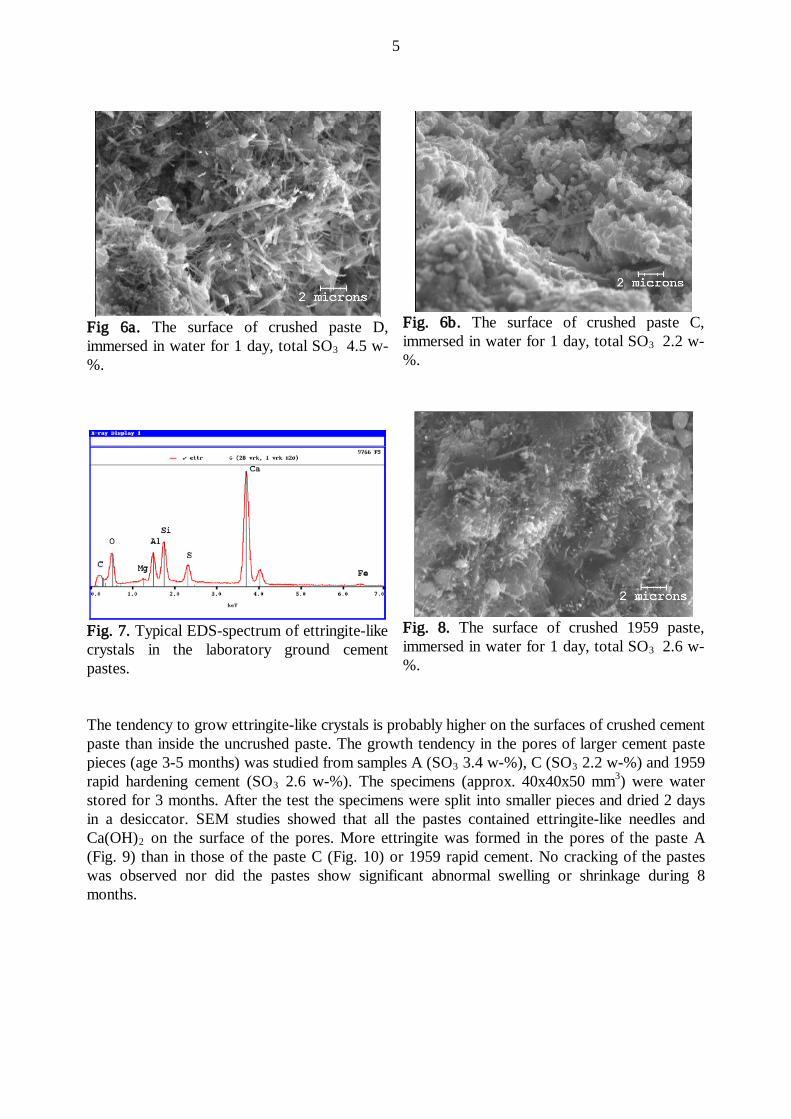
5
Fig 6a. The surface of crushed paste D, immersed in water for 1 day, total SO3 4.5 w-%.
Fig. 6b. The surface of crushed paste C, immersed in water for 1 day, total SO3
2.2 w-%.
Fig. 7. Typical EDS-spectrum of ettringite-like crystals in the laboratory ground cement pastes.
Fig. 8. The surface of crushed 1959 paste, immersed in water for 1 day, total SO3
2.6 w-%.
The tendency to grow ettringite-like crystals is probably higher on the surfaces of crushed cement paste than inside the uncrushed paste. The growth tendency in the pores of larger cement paste pieces (age 3-5 months) was studied from samples A (SO3 3.4 w-%), C (SO3 2.2 w-%) and 1959 rapid hardening cement (SO3 2.6 w-%). The specimens (approx. 40x40x50 mm3) were water stored for 3 months. After the test the specimens were split into smaller pieces and dried 2 days in a desiccator. SEM studies showed that all the pastes contained ettringite-like needles and Ca(OH)2
on the surface of the pores. More ettringite was formed in the pores of the paste A (Fig. 9) than in those of the paste C (Fig. 10) or 1959 rapid cement. No cracking of the pastes was observed nor did the pastes show significant abnormal swelling or shrinkage during 8 months.
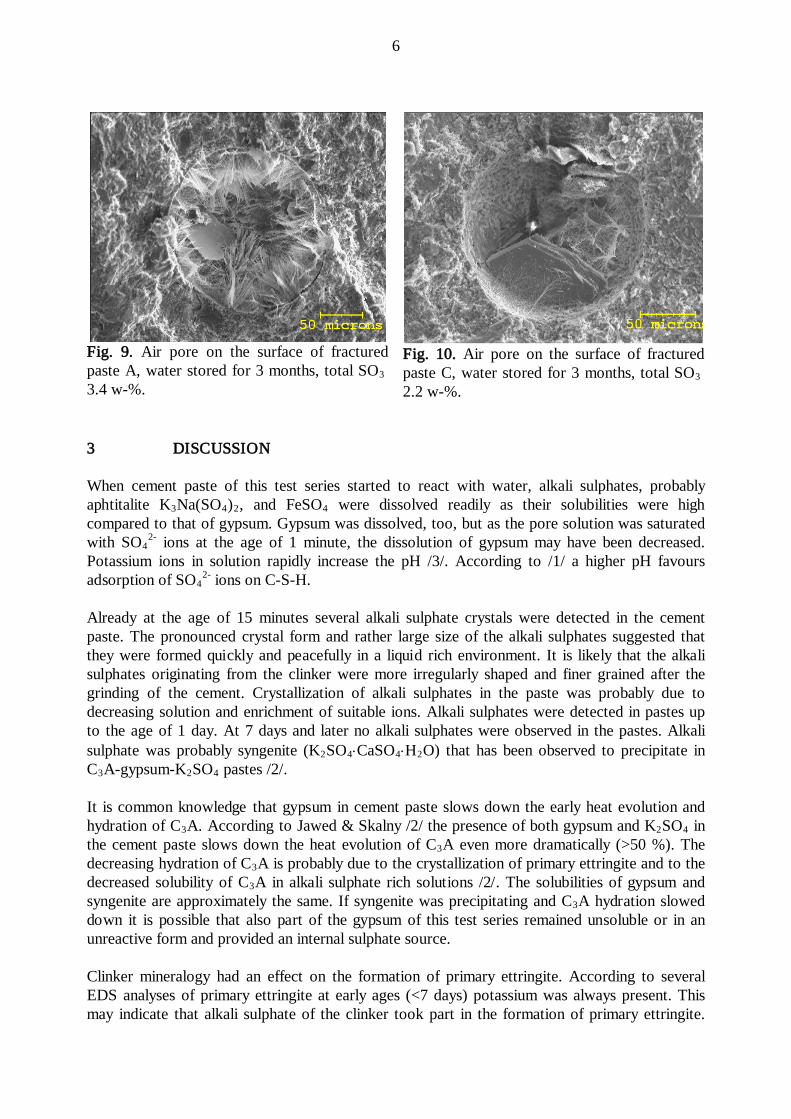
6
Fig. 9. Air pore on the surface of fractured paste A, water stored for 3 months, total SO3 3.4 w-%.
Fig. 10. Air pore on the surface of fractured paste C, water stored for 3 months, total SO3
2.2 w-%.
3 DISCUSSION When cement paste of this test series started to react with water, alkali sulphates, probably aphtitalite K3Na(SO4)2, and FeSO4 were dissolved readily as their solubilities were high compared to that of gypsum. Gypsum was dissolved, too, but as the pore solution was saturated with SO4
2- ions at the age of 1 minute, the dissolution of gypsum may have been decreased. Potassium ions in solution rapidly increase the pH /3/. According to /1/ a higher pH favours adsorption of SO4
2-
ions on C-S-H.
Already at the age of 15 minutes several alkali sulphate crystals were detected in the cement paste. The pronounced crystal form and rather large size of the alkali sulphates suggested that they were formed quickly and peacefully in a liquid rich environment. It is likely that the alkali sulphates originating from the clinker were more irregularly shaped and finer grained after the grinding of the cement. Crystallization of alkali sulphates in the paste was probably due to decreasing solution and enrichment of suitable ions. Alkali sulphates were detected in pastes up to the age of 1 day. At 7 days and later no alkali sulphates were observed in the pastes. Alkali sulphate was probably syngenite (K2SO4⋅CaSO4⋅H2O) that has been observed to precipitate in C3A-gypsum-K2SO4
pastes /2/.
It is common knowledge that gypsum in cement paste slows down the early heat evolution and hydration of C3A. According to Jawed & Skalny /2/ the presence of both gypsum and K2SO4 in the cement paste slows down the heat evolution of C3A even more dramatically (>50 %). The decreasing hydration of C3A is probably due to the crystallization of primary ettringite and to the decreased solubility of C3A in alkali sulphate rich solutions /2/. The solubilities of gypsum and syngenite are approximately the same. If syngenite was precipitating and C3
A hydration slowed down it is possible that also part of the gypsum of this test series remained unsoluble or in an unreactive form and provided an internal sulphate source.
Clinker mineralogy had an effect on the formation of primary ettringite. According to several EDS analyses of primary ettringite at early ages (<7 days) potassium was always present. This may indicate that alkali sulphate of the clinker took part in the formation of primary ettringite.
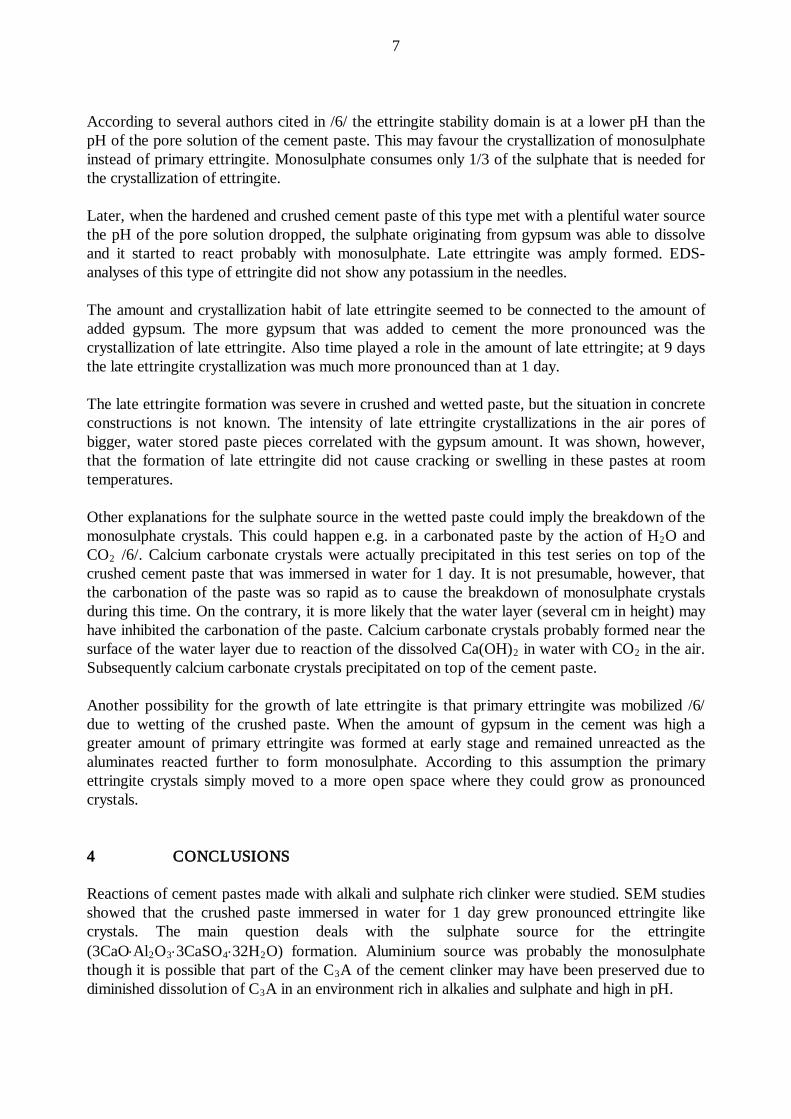
7
According to several authors cited in /6/ the ettringite stability domain is at a lower pH than the pH of the pore solution of the cement paste. This may favour the crystallization of monosulphate instead of primary ettringite. Monosulphate consumes only 1/3 of the sulphate that is needed for the crystallization of ettringite. Later, when the hardened and crushed cement paste of this type met with a plentiful water source the pH of the pore solution dropped, the sulphate originating from gypsum was able to dissolve and it started to react probably with monosulphate. Late ettringite was amply formed. EDS-analyses of this type of ettringite did not show any potassium in the needles. The amount and crystallization habit of late ettringite seemed to be connected to the amount of added gypsum. The more gypsum that was added to cement the more pronounced was the crystallization of late ettringite. Also time played a role in the amount of late ettringite; at 9 days the late ettringite crystallization was much more pronounced than at 1 day. The late ettringite formation was severe in crushed and wetted paste, but the situation in concrete constructions is not known. The intensity of late ettringite crystallizations in the air pores of bigger, water stored paste pieces correlated with the gypsum amount. It was shown, however, that the formation of late ettringite did not cause cracking or swelling in these pastes at room temperatures. Other explanations for the sulphate source in the wetted paste could imply the breakdown of the monosulphate crystals. This could happen e.g. in a carbonated paste by the action of H2O and CO2 /6/. Calcium carbonate crystals were actually precipitated in this test series on top of the crushed cement paste that was immersed in water for 1 day. It is not presumable, however, that the carbonation of the paste was so rapid as to cause the breakdown of monosulphate crystals during this time. On the contrary, it is more likely that the water layer (several cm in height) may have inhibited the carbonation of the paste. Calcium carbonate crystals probably formed near the surface of the water layer due to reaction of the dissolved Ca(OH)2 in water with CO2
in the air. Subsequently calcium carbonate crystals precipitated on top of the cement paste.
Another possibility for the growth of late ettringite is that primary ettringite was mobilized /6/ due to wetting of the crushed paste. When the amount of gypsum in the cement was high a greater amount of primary ettringite was formed at early stage and remained unreacted as the aluminates reacted further to form monosulphate. According to this assumption the primary ettringite crystals simply moved to a more open space where they could grow as pronounced crystals. 4 CONCLUSIONS Reactions of cement pastes made with alkali and sulphate rich clinker were studied. SEM studies showed that the crushed paste immersed in water for 1 day grew pronounced ettringite like crystals. The main question deals with the sulphate source for the ettringite (3CaO⋅Al2O3⋅3CaSO4⋅32H2O) formation. Aluminium source was probably the monosulphate though it is possible that part of the C3A of the cement clinker may have been preserved due to diminished dissolution of C3
A in an environment rich in alkalies and sulphate and high in pH.
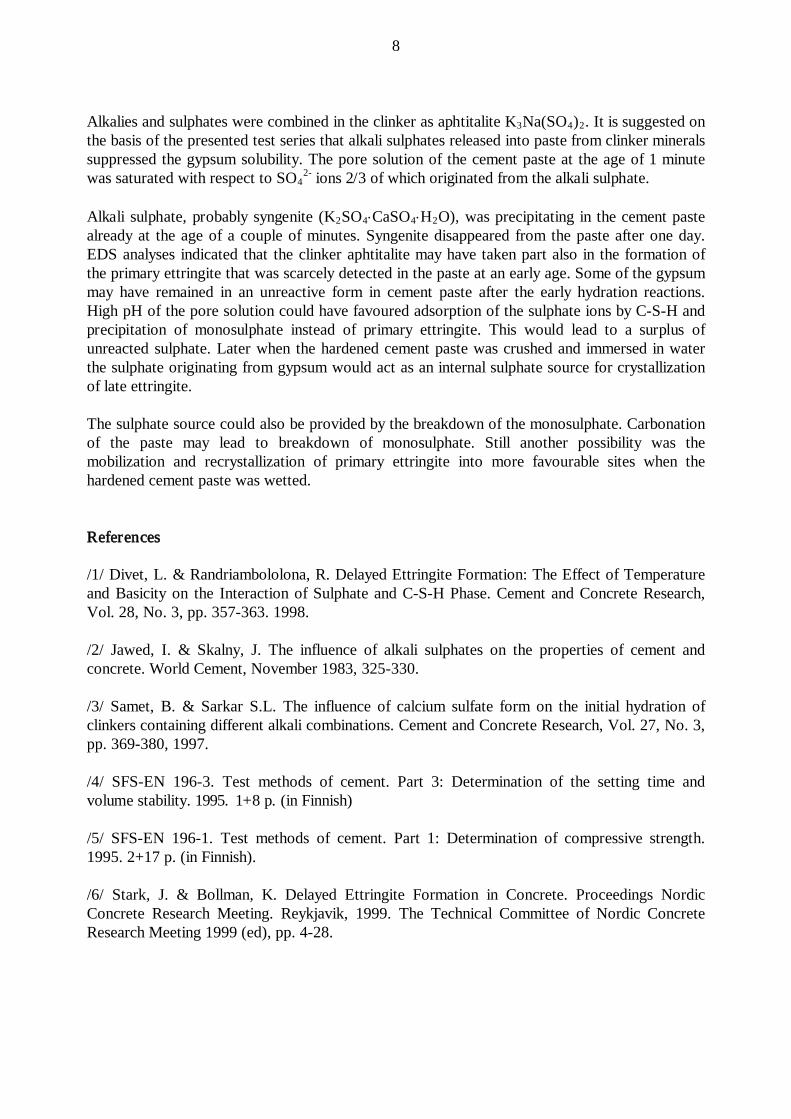
8
Alkalies and sulphates were combined in the clinker as aphtitalite K3Na(SO4)2. It is suggested on the basis of the presented test series that alkali sulphates released into paste from clinker minerals suppressed the gypsum solubility. The pore solution of the cement paste at the age of 1 minute was saturated with respect to SO4
2-
ions 2/3 of which originated from the alkali sulphate.
Alkali sulphate, probably syngenite (K2SO4⋅CaSO4⋅H2
O), was precipitating in the cement paste already at the age of a couple of minutes. Syngenite disappeared from the paste after one day. EDS analyses indicated that the clinker aphtitalite may have taken part also in the formation of the primary ettringite that was scarcely detected in the paste at an early age. Some of the gypsum may have remained in an unreactive form in cement paste after the early hydration reactions. High pH of the pore solution could have favoured adsorption of the sulphate ions by C-S-H and precipitation of monosulphate instead of primary ettringite. This would lead to a surplus of unreacted sulphate. Later when the hardened cement paste was crushed and immersed in water the sulphate originating from gypsum would act as an internal sulphate source for crystallization of late ettringite.
The sulphate source could also be provided by the breakdown of the monosulphate. Carbonation of the paste may lead to breakdown of monosulphate. Still another possibility was the mobilization and recrystallization of primary ettringite into more favourable sites when the hardened cement paste was wetted. References /1/ Divet, L. & Randriambololona, R. Delayed Ettringite Formation: The Effect of Temperature and Basicity on the Interaction of Sulphate and C-S-H Phase. Cement and Concrete Research, Vol. 28, No. 3, pp. 357-363. 1998. /2/ Jawed, I. & Skalny, J. The influence of alkali sulphates on the properties of cement and concrete. World Cement, November 1983, 325-330. /3/ Samet, B. & Sarkar S.L. The influence of calcium sulfate form on the initial hydration of clinkers containing different alkali combinations. Cement and Concrete Research, Vol. 27, No. 3, pp. 369-380, 1997. /4/ SFS-EN 196-3. Test methods of cement. Part 3: Determination of the setting time and volume stability. 1995. 1+8 p. (in Finnish) /5/ SFS-EN 196-1. Test methods of cement. Part 1: Determination of compressive strength. 1995. 2+17 p. (in Finnish). /6/ Stark, J. & Bollman, K. Delayed Ettringite Formation in Concrete. Proceedings Nordic Concrete Research Meeting. Reykjavik, 1999. The Technical Committee of Nordic Concrete Research Meeting 1999 (ed), pp. 4-28.
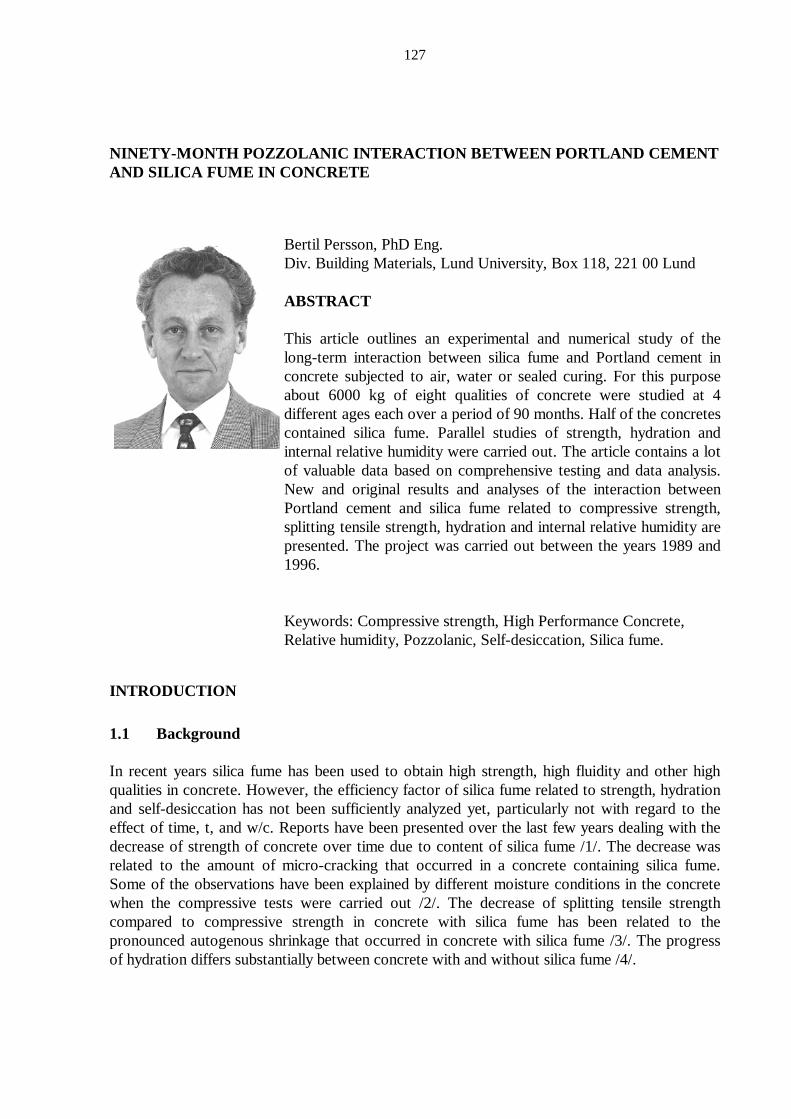
127
NINETY-MONTH POZZOLANIC INTERACTION BETWEEN PORTLAND CEMENT AND SILICA FUME IN CONCRETE
Bertil Persson, PhD Eng. Div. Building Materials, Lund University, Box 118, 221 00 Lund ABSTRACT This article outlines an experimental and numerical study of the long-term interaction between silica fume and Portland cement in concrete subjected to air, water or sealed curing. For this purpose about 6000 kg of eight qualities of concrete were studied at 4 different ages each over a period of 90 months. Half of the concretes contained silica fume. Parallel studies of strength, hydration and internal relative humidity were carried out. The article contains a lot of valuable data based on comprehensive testing and data analysis. New and original results and analyses of the interaction between Portland cement and silica fume related to compressive strength, splitting tensile strength, hydration and internal relative humidity are presented. The project was carried out between the years 1989 and 1996. Keywords: Compressive strength, High Performance Concrete, Relative humidity, Pozzolanic, Self-desiccation, Silica fume.
INTRODUCTION
1.1 Background In recent years silica fume has been used to obtain high strength, high fluidity and other high qualities in concrete. However, the efficiency factor of silica fume related to strength, hydration and self-desiccation has not been sufficiently analyzed yet, particularly not with regard to the effect of time, t, and w/c. Reports have been presented over the last few years dealing with the decrease of strength of concrete over time due to content of silica fume /1/. The decrease was related to the amount of micro-cracking that occurred in a concrete containing silica fume. Some of the observations have been explained by different moisture conditions in the concrete when the compressive tests were carried out /2/. The decrease of splitting tensile strength compared to compressive strength in concrete with silica fume has been related to the pronounced autogenous shrinkage that occurred in concrete with silica fume /3/. The progress of hydration differs substantially between concrete with and without silica fume /4/.

128
1.2 Pozzolanic interaction During the pozzolanic interaction between silica fume and Portland cement some calcium hydroxide was transformed into silicate-hydrates which decreased the degree of hydration but increased the strength. To complete the pozzolanic reaction between silica fume and Portland cement about 16% silica fume is required calculated on the basis of the cement content /5/: 3 Ca(OH)2 + 2 SiO2 = 3 CaO.2 SiO2.3 H2O. (1) Since no water was consumed during the pozzolanic reaction, no additional chemical shrinkage occurred /4/. The additional autogenous shrinkage was instead explained by the extended depression in the pore water when silica fume was used in the concrete /6/.
1.3 Objective It was the main objective of this work to compare, over at least 6 years, the compressive strength and splitting tensile strength of mass concrete with 10% silica fume with the same properties of concrete without silica fume. w/c varied between 0.2 and 0.6. Three different curing conditions were to be studied: sealed, air and water curing. The concrete was poured in a way that avoided influences of the pouring conditions on the specimens. Internal relative humidity and hydration of the concrete was studied parallel to the mechanical properties.
2. EXPERIMENTAL
2.1 Specimen Compressive strength, fc, splitting tensile strength, fsp and hydration were studied on cores, 80 mm long and 40 mm in diameter, drilled out of large concrete specimens (250 kg each). Half of the specimens contained silica fume. All other material parameters were held constant. The concrete was poured in the shape of a disc, 1 m in diameter and 0.1 m thick. To simulate a long column, the flat sides of the disc were sealed by thick layers of epoxy resin; at least 2 mm. Also the circular surface of one third of the specimens was sealed by a minimum of 2 mm epoxy resin. The diffusion of moisture through the epoxy resin was negligible compared to the diffusion through the porous concrete. One third of the specimens were subjected to a climate with a temperature varying between 18°C and 24°C and an ambient relative humidity between 23% and 48% /7/. The remaining third of the specimens were submerged and cured in water. A total of 1854 measurements were carried out, as shown in Table 1.
2.2 Testing methods A total of 936 cylindrical cores were taken in equal numbers at a distance of 50, 150 or 350 mm from the exposed surface in order to study strength and hydration. During the testing of strength interlayers of hardboard were used. A total of 642 ignition tests were carried out to obtain the hydration of the specimens /4,8/. Compensation was made for the ignition loss of cement and aggregate /4,8/. Cast-in plastic tubes were placed at different distances, 50, 150 and 350 mm, from the exposed circular surface of the column. Parallel to the cast-in items, thermocouples
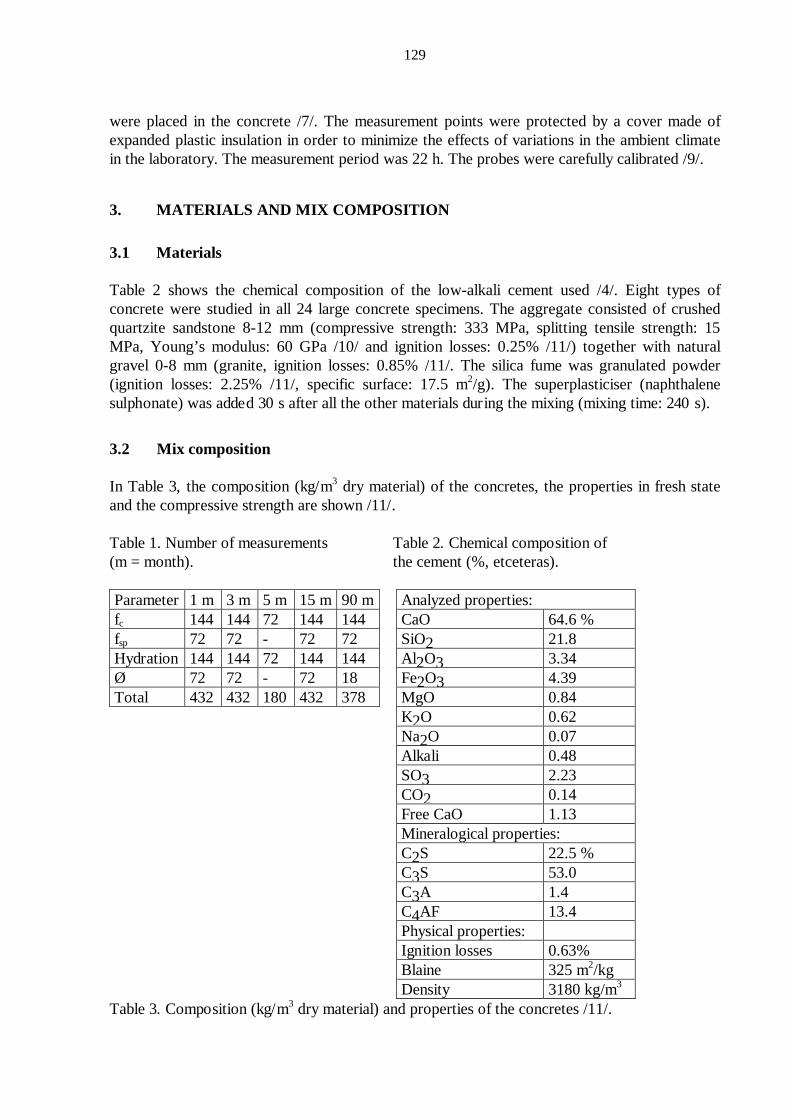
129
were placed in the concrete /7/. The measurement points were protected by a cover made of expanded plastic insulation in order to minimize the effects of variations in the ambient climate in the laboratory. The measurement period was 22 h. The probes were carefully calibrated /9/.
3. MATERIALS AND MIX COMPOSITION
3.1 Materials Table 2 shows the chemical composition of the low-alkali cement used /4/. Eight types of concrete were studied in all 24 large concrete specimens. The aggregate consisted of crushed quartzite sandstone 8-12 mm (compressive strength: 333 MPa, splitting tensile strength: 15 MPa, Young’s modulus: 60 GPa /10/ and ignition losses: 0.25% /11/) together with natural gravel 0-8 mm (granite, ignition losses: 0.85% /11/. The silica fume was granulated powder (ignition losses: 2.25% /11/, specific surface: 17.5 m2/g). The superplasticiser (naphthalene sulphonate) was added 30 s after all the other materials during the mixing (mixing time: 240 s).
3.2 Mix composition In Table 3, the composition (kg/m3 dry material) of the concretes, the properties in fresh state and the compressive strength are shown /11/. Table 1. Number of measurements Table 2. Chemical composition of (m = month). the cement (%, etceteras). Parameter 1 m 3 m 5 m 15 m 90 m Analyzed properties: fc 144 144 72 144 144 CaO 64.6 % fsp 72 72 - 72 72 SiO2 21.8 Hydration 144 144 72 144 144 Al2O3 3.34 Ø 72 72 - 72 18 Fe2O3 4.39 Total 432 432 180 432 378 MgO 0.84 K2O 0.62 Na2O 0.07 Alkali 0.48 SO3 2.23 CO2 0.14 Free CaO 1.13 Mineralogical properties: C2S 22.5 % C3S 53.0 C3A 1.4 C4AF 13.4 Physical properties: Ignition losses 0.63% Blaine 325 m2/kg Density 3180 kg/m3
Table 3. Composition (kg/m3 dry material) and properties of the concretes /11/.
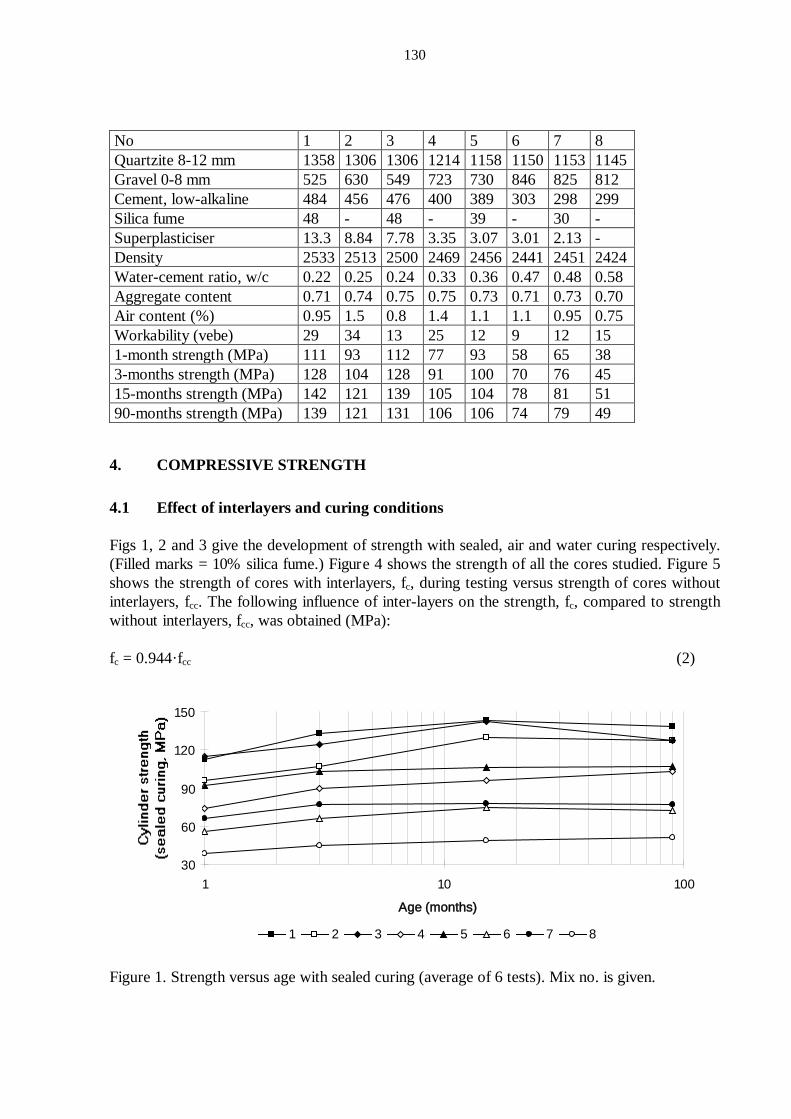
130
No 1 2 3 4 5 6 7 8 Quartzite 8-12 mm 1358 1306 1306 1214 1158 1150 1153 1145 Gravel 0-8 mm 525 630 549 723 730 846 825 812 Cement, low-alkaline 484 456 476 400 389 303 298 299 Silica fume 48 - 48 - 39 - 30 - Superplasticiser 13.3 8.84 7.78 3.35 3.07 3.01 2.13 - Density 2533 2513 2500 2469 2456 2441 2451 2424 Water-cement ratio, w/c 0.22 0.25 0.24 0.33 0.36 0.47 0.48 0.58 Aggregate content 0.71 0.74 0.75 0.75 0.73 0.71 0.73 0.70 Air content (%) 0.95 1.5 0.8 1.4 1.1 1.1 0.95 0.75 Workability (vebe) 29 34 13 25 12 9 12 15 1-month strength (MPa) 111 93 112 77 93 58 65 38 3-months strength (MPa) 128 104 128 91 100 70 76 45 15-months strength (MPa) 142 121 139 105 104 78 81 51 90-months strength (MPa) 139 121 131 106 106 74 79 49
4. COMPRESSIVE STRENGTH
4.1 Effect of interlayers and curing conditions Figs 1, 2 and 3 give the development of strength with sealed, air and water curing respectively. (Filled marks = 10% silica fume.) Figure 4 shows the strength of all the cores studied. Figure 5 shows the strength of cores with interlayers, fc, during testing versus strength of cores without interlayers, fcc. The following influence of inter-layers on the strength, fc, compared to strength without interlayers, fcc, was obtained (MPa): fc = 0.944·fcc (2)
30
60
90
120
150
1 10 100
Age (months)
1 2 3 4 5 6 7 8 Figure 1. Strength versus age with sealed curing (average of 6 tests). Mix no. is given.
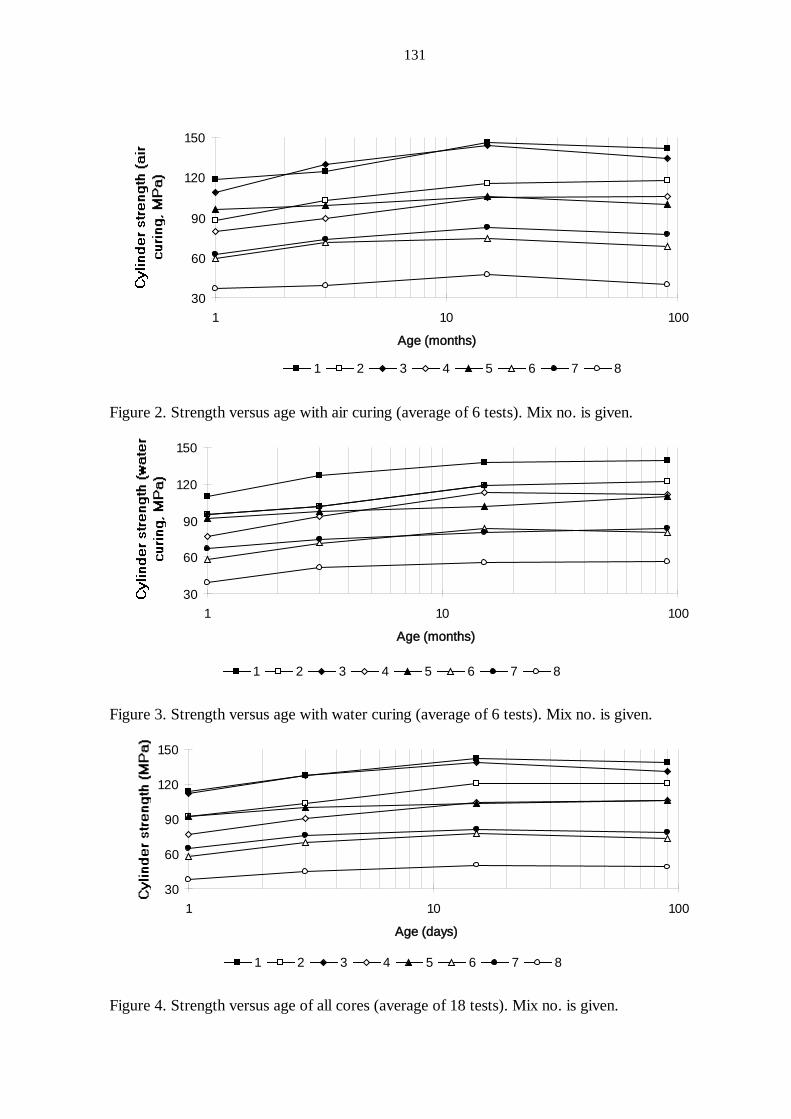
131
30
60
90
120
150
1 10 100
Age (months)
1 2 3 4 5 6 7 8
Figure 2. Strength versus age with air curing (average of 6 tests). Mix no. is given.
30
60
90
120
150
1 10 100
Age (months)
1 2 3 4 5 6 7 8
Figure 3. Strength versus age with water curing (average of 6 tests). Mix no. is given.
30
60
90
120
150
1 10 100
Age (days)
1 2 3 4 5 6 7 8
Figure 4. Strength versus age of all cores (average of 18 tests). Mix no. is given.
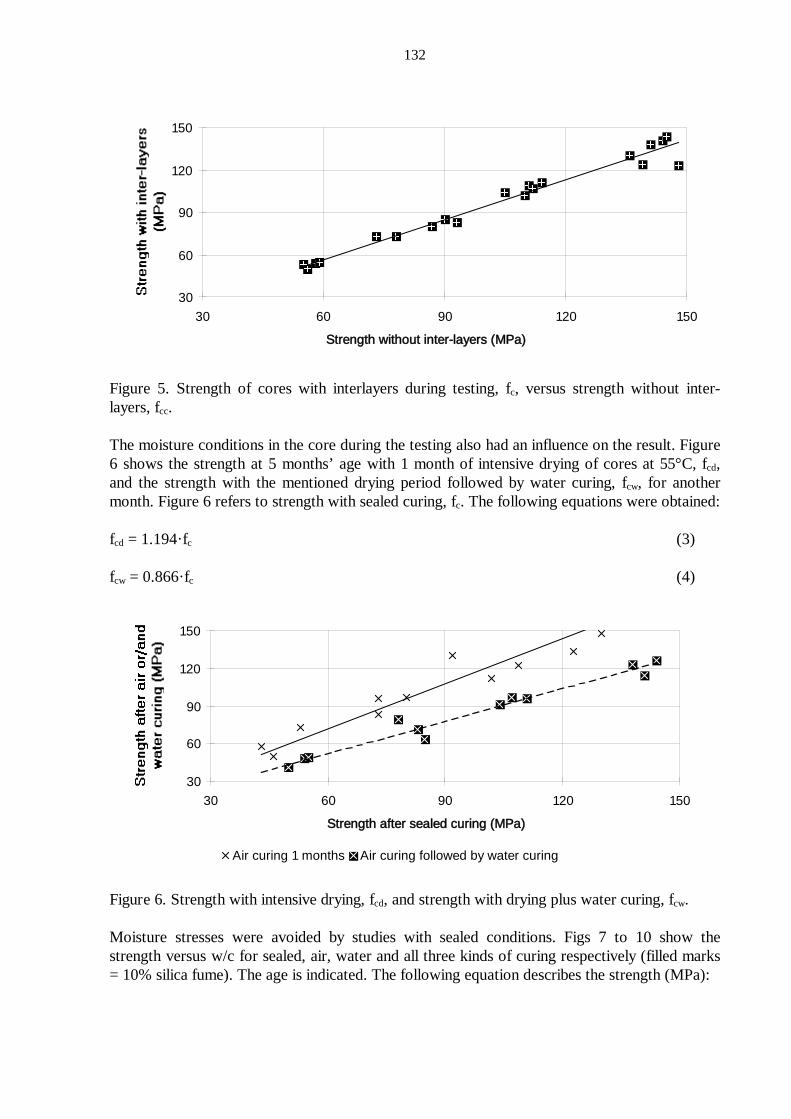
132
30
60
90
120
150
30 60 90 120 150
Strength without inter-layers (MPa)
Figure 5. Strength of cores with interlayers during testing, fc, versus strength without inter-layers, fcc. The moisture conditions in the core during the testing also had an influence on the result. Figure 6 shows the strength at 5 months’ age with 1 month of intensive drying of cores at 55°C, fcd, and the strength with the mentioned drying period followed by water curing, fcw, for another month. Figure 6 refers to strength with sealed curing, fc. The following equations were obtained: fcd = 1.194·fc (3) fcw = 0.866·fc (4)
30
60
90
120
150
30 60 90 120 150
Strength after sealed curing (MPa)
Air curing 1 months Air curing followed by water curing
Figure 6. Strength with intensive drying, fcd, and strength with drying plus water curing, fcw. Moisture stresses were avoided by studies with sealed conditions. Figs 7 to 10 show the strength versus w/c for sealed, air, water and all three kinds of curing respectively (filled marks = 10% silica fume). The age is indicated. The following equation describes the strength (MPa):
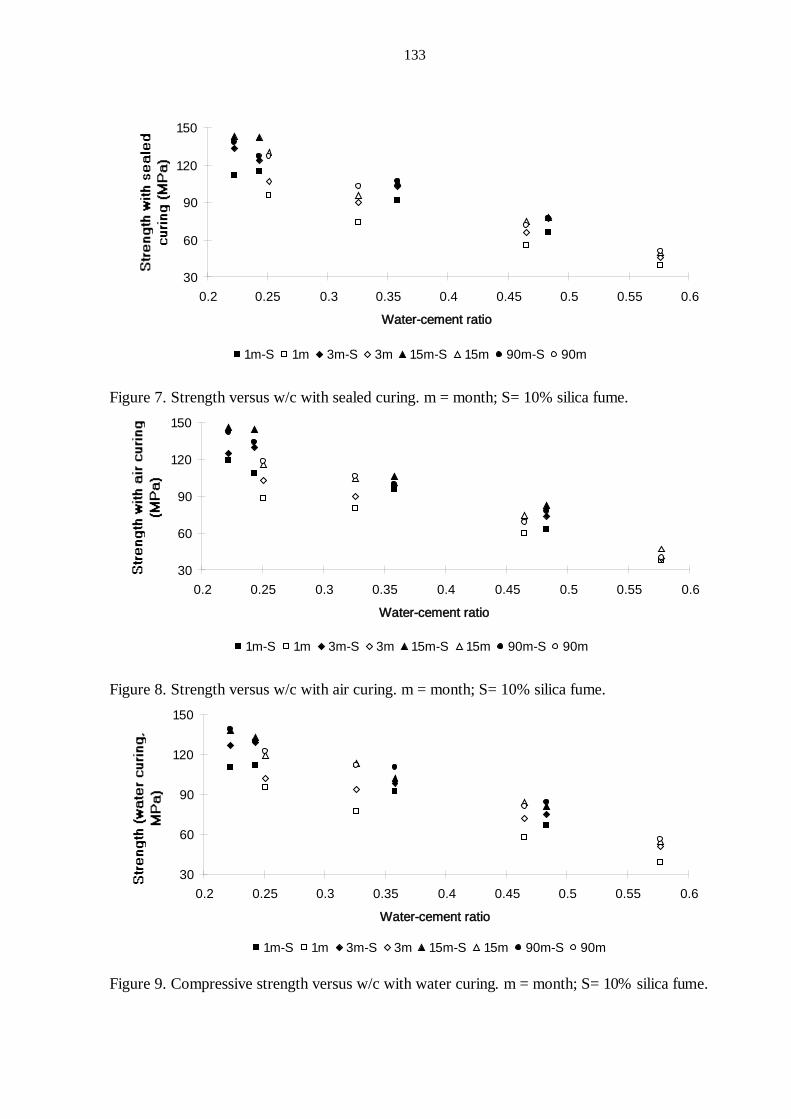
133
30
60
90
120
150
0.2 0.25 0.3 0.35 0.4 0.45 0.5 0.55 0.6
Water-cement ratio
1m-S 1m 3m-S 3m 15m-S 15m 90m-S 90m
Figure 7. Strength versus w/c with sealed curing. m = month; S= 10% silica fume.
30
60
90
120
150
0.2 0.25 0.3 0.35 0.4 0.45 0.5 0.55 0.6
Water-cement ratio
1m-S 1m 3m-S 3m 15m-S 15m 90m-S 90m
Figure 8. Strength versus w/c with air curing. m = month; S= 10% silica fume.
30
60
90
120
150
0.2 0.25 0.3 0.35 0.4 0.45 0.5 0.55 0.6
Water-cement ratio
1m-S 1m 3m-S 3m 15m-S 15m 90m-S 90m
Figure 9. Compressive strength versus w/c with water curing. m = month; S= 10% silica fume.
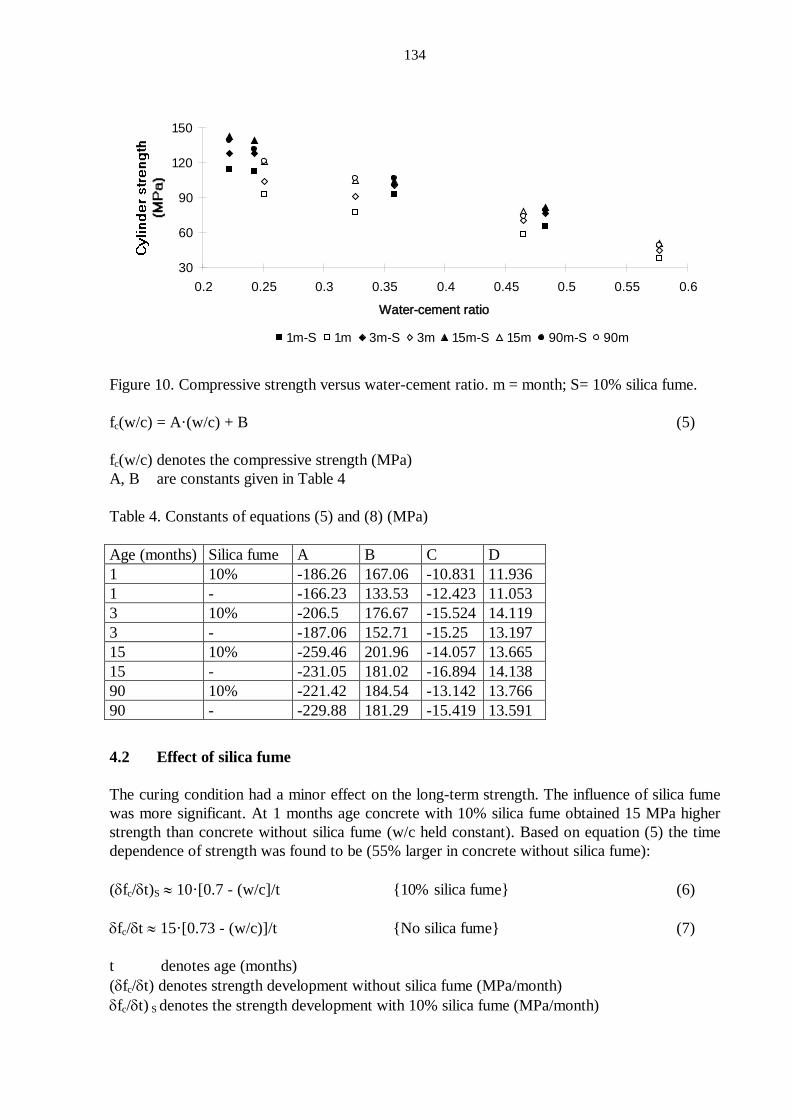
134
30
60
90
120
150
0.2 0.25 0.3 0.35 0.4 0.45 0.5 0.55 0.6
Water-cement ratio
1m-S 1m 3m-S 3m 15m-S 15m 90m-S 90m
Figure 10. Compressive strength versus water-cement ratio. m = month; S= 10% silica fume. fc(w/c) = A·(w/c) + B (5) fc(w/c) denotes the compressive strength (MPa) A, B are constants given in Table 4 Table 4. Constants of equations (5) and (8) (MPa) Age (months) Silica fume A B C D 1 10% -186.26 167.06 -10.831 11.936 1 - -166.23 133.53 -12.423 11.053 3 10% -206.5 176.67 -15.524 14.119 3 - -187.06 152.71 -15.25 13.197 15 10% -259.46 201.96 -14.057 13.665 15 - -231.05 181.02 -16.894 14.138 90 10% -221.42 184.54 -13.142 13.766 90 - -229.88 181.29 -15.419 13.591
4.2 Effect of silica fume The curing condition had a minor effect on the long-term strength. The influence of silica fume was more significant. At 1 months age concrete with 10% silica fume obtained 15 MPa higher strength than concrete without silica fume (w/c held constant). Based on equation (5) the time dependence of strength was found to be (55% larger in concrete without silica fume): (δfc/δt)S ≈ 10·[0.7 - (w/c]/t {10% silica fume} (6) δfc/δt ≈ 15·[0.73 - (w/c)]/t {No silica fume} (7) t denotes age (months) (δfc/δt) denotes strength development without silica fume (MPa/month) δfc/δt) S denotes the strength development with 10% silica fume (MPa/month)
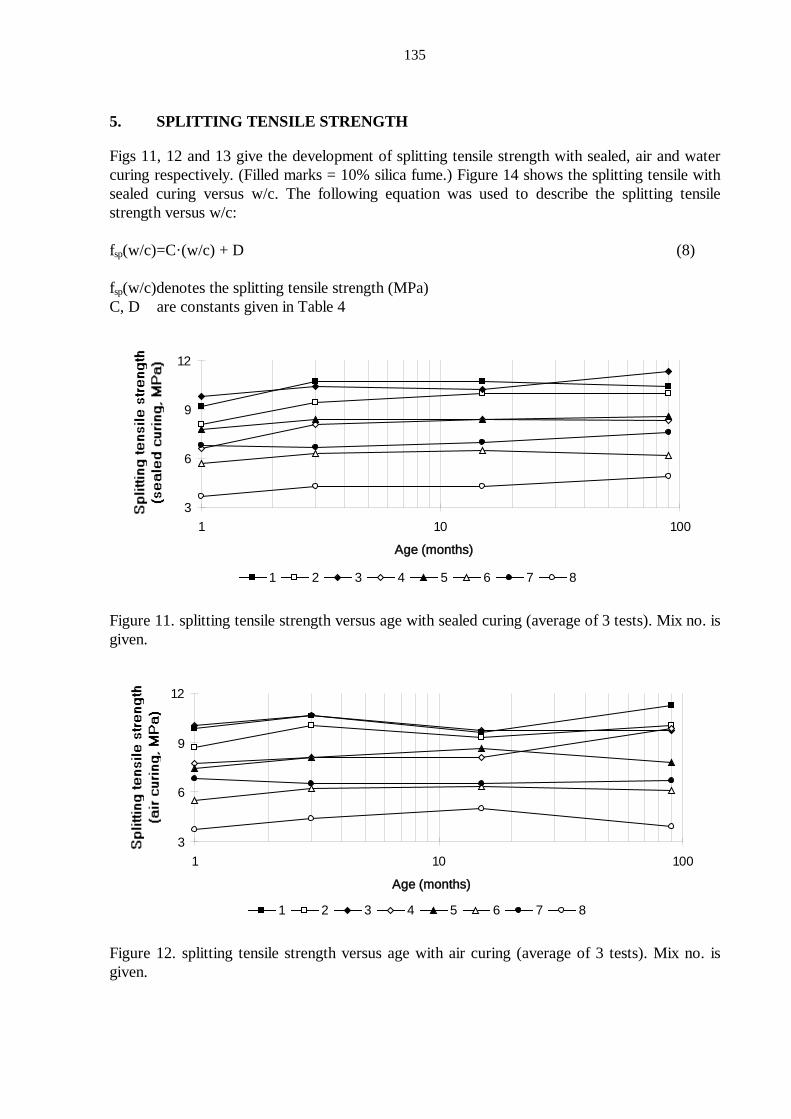
135
5. SPLITTING TENSILE STRENGTH
Figs 11, 12 and 13 give the development of splitting tensile strength with sealed, air and water curing respectively. (Filled marks = 10% silica fume.) Figure 14 shows the splitting tensile with sealed curing versus w/c. The following equation was used to describe the splitting tensile strength versus w/c: fsp(w/c)=C·(w/c) + D (8) fsp(w/c)denotes the splitting tensile strength (MPa) C, D are constants given in Table 4
3
6
9
12
1 10 100
Age (months)
1 2 3 4 5 6 7 8 Figure 11. splitting tensile strength versus age with sealed curing (average of 3 tests). Mix no. is given.
3
6
9
12
1 10 100
Age (months)
1 2 3 4 5 6 7 8 Figure 12. splitting tensile strength versus age with air curing (average of 3 tests). Mix no. is given.
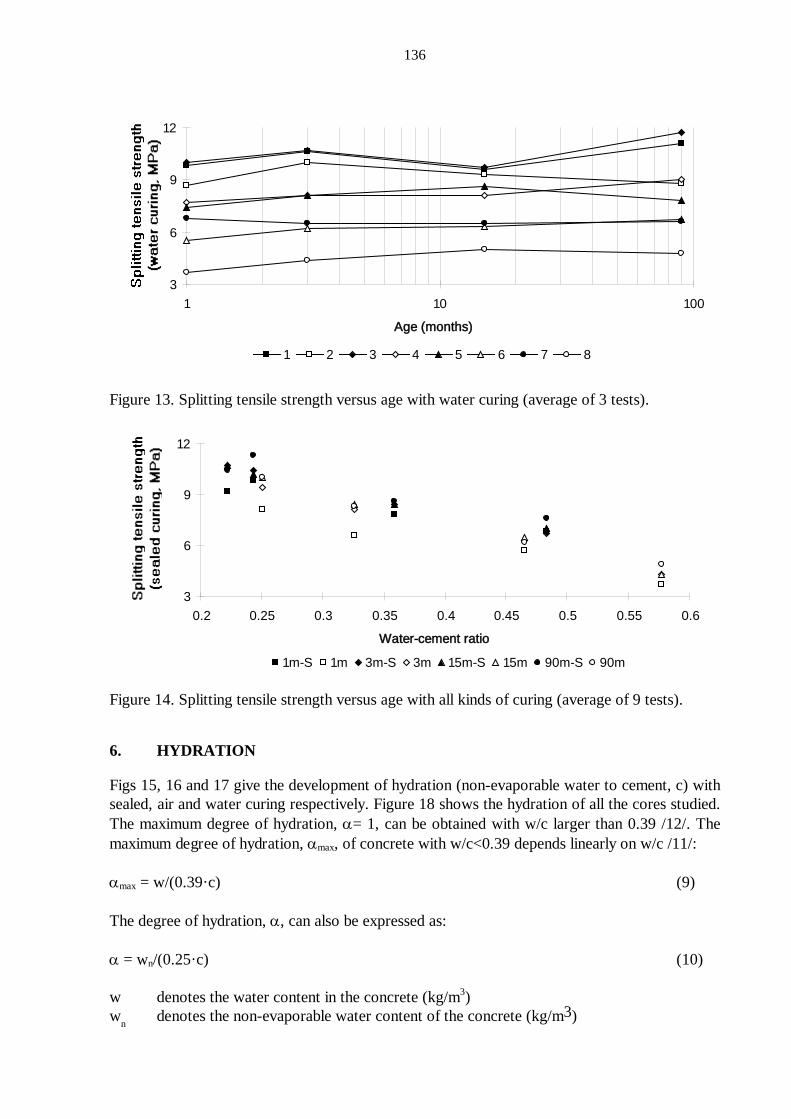
136
3
6
9
12
1 10 100
Age (months)
1 2 3 4 5 6 7 8
Figure 13. Splitting tensile strength versus age with water curing (average of 3 tests).
3
6
9
12
0.2 0.25 0.3 0.35 0.4 0.45 0.5 0.55 0.6
Water-cement ratio
1m-S 1m 3m-S 3m 15m-S 15m 90m-S 90m
Figure 14. Splitting tensile strength versus age with all kinds of curing (average of 9 tests).
6. HYDRATION
Figs 15, 16 and 17 give the development of hydration (non-evaporable water to cement, c) with sealed, air and water curing respectively. Figure 18 shows the hydration of all the cores studied. The maximum degree of hydration, α= 1, can be obtained with w/c larger than 0.39 /12/. The maximum degree of hydration, αmax, of concrete with w/c<0.39 depends linearly on w/c /11/: αmax = w/(0.39·c) (9) The degree of hydration, α, can also be expressed as: α = wn/(0.25·c) (10) w denotes the water content in the concrete (kg/m3) wn denotes the non-evaporable water content of the concrete (kg/m3)

137
0.1
0.120.14
0.160.18
0.20.22
0.24
1 10 100
Age (months)
1 2 3 4 5 6 7 8
Figure 15. Hydration versus age with sealed curing (average of 6 tests). Mix no. is given.
0.10.120.140.160.180.2
0.220.24
1 10 100
Age (months)1 2 3 4 5 6 7 8
Figure 16. Hydration) versus age with air curing (average of 6 tests). Mix no. is given.
0.10.120.140.16
0.180.2
0.220.24
1 10 100
Age (months)
1 2 3 4 5 6 7 8
Figure 17. Hydration (non-evaporable water to cement) versus age with water curing (average of 6 tests). Mix no is given.
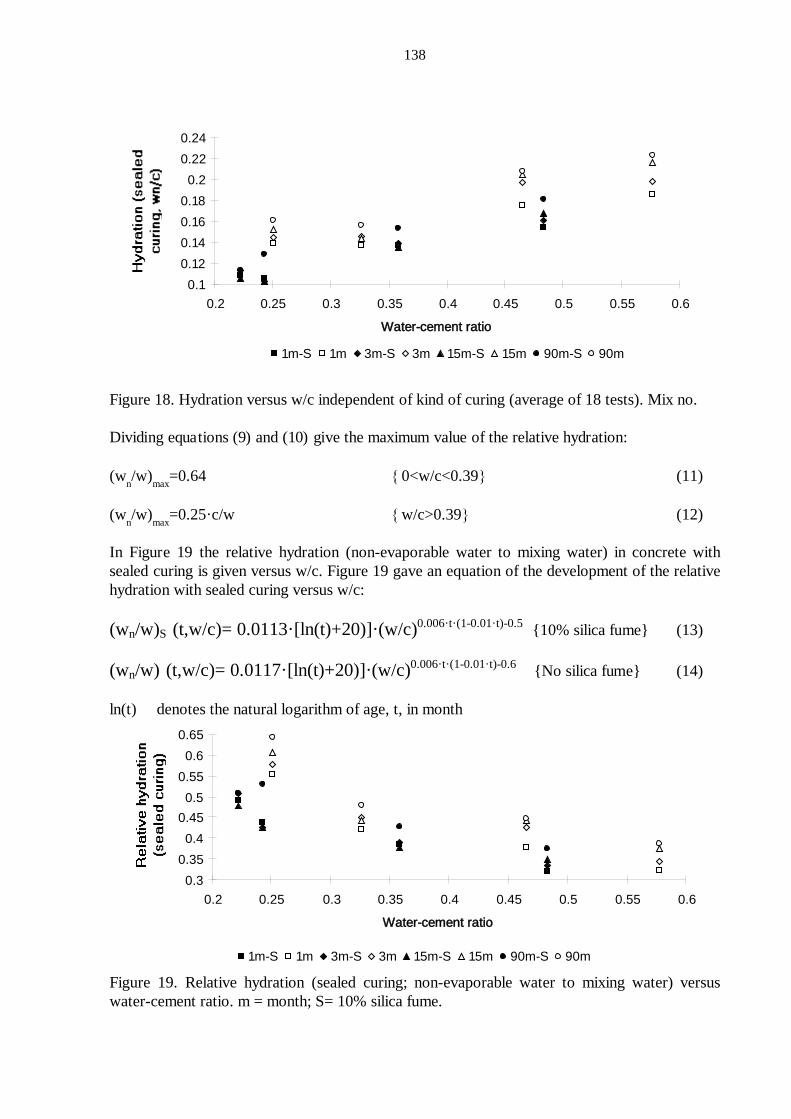
138
0.10.120.140.160.180.2
0.220.24
0.2 0.25 0.3 0.35 0.4 0.45 0.5 0.55 0.6
Water-cement ratio
1m-S 1m 3m-S 3m 15m-S 15m 90m-S 90m
Figure 18. Hydration versus w/c independent of kind of curing (average of 18 tests). Mix no. Dividing equations (9) and (10) give the maximum value of the relative hydration: (wn/w)max=0.64 {0<w/c<0.39} (11) (wn/w)max=0.25·c/w {w/c>0.39} (12) In Figure 19 the relative hydration (non-evaporable water to mixing water) in concrete with sealed curing is given versus w/c. Figure 19 gave an equation of the development of the relative hydration with sealed curing versus w/c: (wn/w)S (t,w/c)= 0.0113·[ln(t)+20)]·(w/c)0.006·t·(1-0.01·t)-0.5 {10% silica fume} (13) (wn/w) (t,w/c)= 0.0117·[ln(t)+20)]·(w/c)0.006·t·(1-0.01·t)-0.6 {No silica fume} (14) ln(t) denotes the natural logarithm of age, t, in month
0.30.350.4
0.450.5
0.550.6
0.65
0.2 0.25 0.3 0.35 0.4 0.45 0.5 0.55 0.6
Water-cement ratio
1m-S 1m 3m-S 3m 15m-S 15m 90m-S 90m
Figure 19. Relative hydration (sealed curing; non-evaporable water to mixing water) versus water-cement ratio. m = month; S= 10% silica fume.
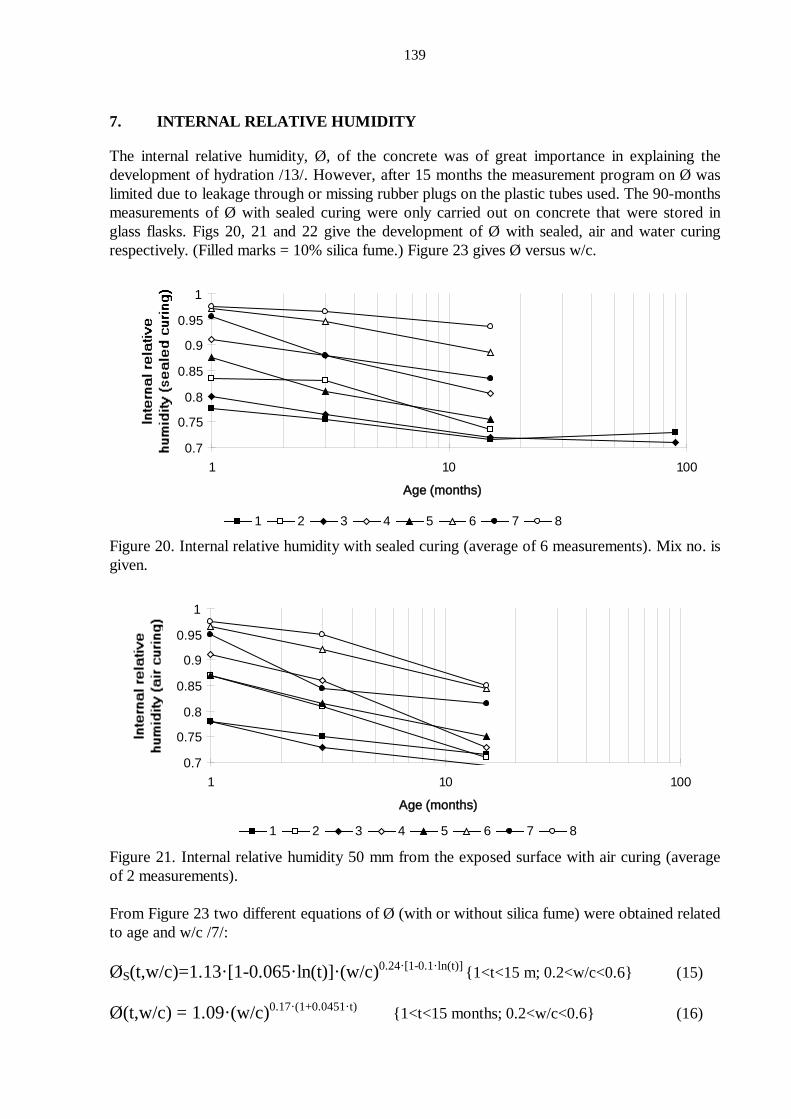
139
7. INTERNAL RELATIVE HUMIDITY
The internal relative humidity, Ø, of the concrete was of great importance in explaining the development of hydration /13/. However, after 15 months the measurement program on Ø was limited due to leakage through or missing rubber plugs on the plastic tubes used. The 90-months measurements of Ø with sealed curing were only carried out on concrete that were stored in glass flasks. Figs 20, 21 and 22 give the development of Ø with sealed, air and water curing respectively. (Filled marks = 10% silica fume.) Figure 23 gives Ø versus w/c.
0.7
0.75
0.8
0.85
0.9
0.95
1
1 10 100
Age (months)
1 2 3 4 5 6 7 8
Figure 20. Internal relative humidity with sealed curing (average of 6 measurements). Mix no. is given.
0.7
0.75
0.8
0.85
0.9
0.95
1
1 10 100
Age (months)
1 2 3 4 5 6 7 8
Figure 21. Internal relative humidity 50 mm from the exposed surface with air curing (average of 2 measurements). From Figure 23 two different equations of Ø (with or without silica fume) were obtained related to age and w/c /7/: ØS(t,w/c)=1.13·[1-0.065·ln(t)]·(w/c)0.24·[1-0.1·ln(t)] {1<t<15 m; 0.2<w/c<0.6} (15) Ø(t,w/c) = 1.09·(w/c)0.17·(1+0.0451·t) {1<t<15 months; 0.2<w/c<0.6} (16)
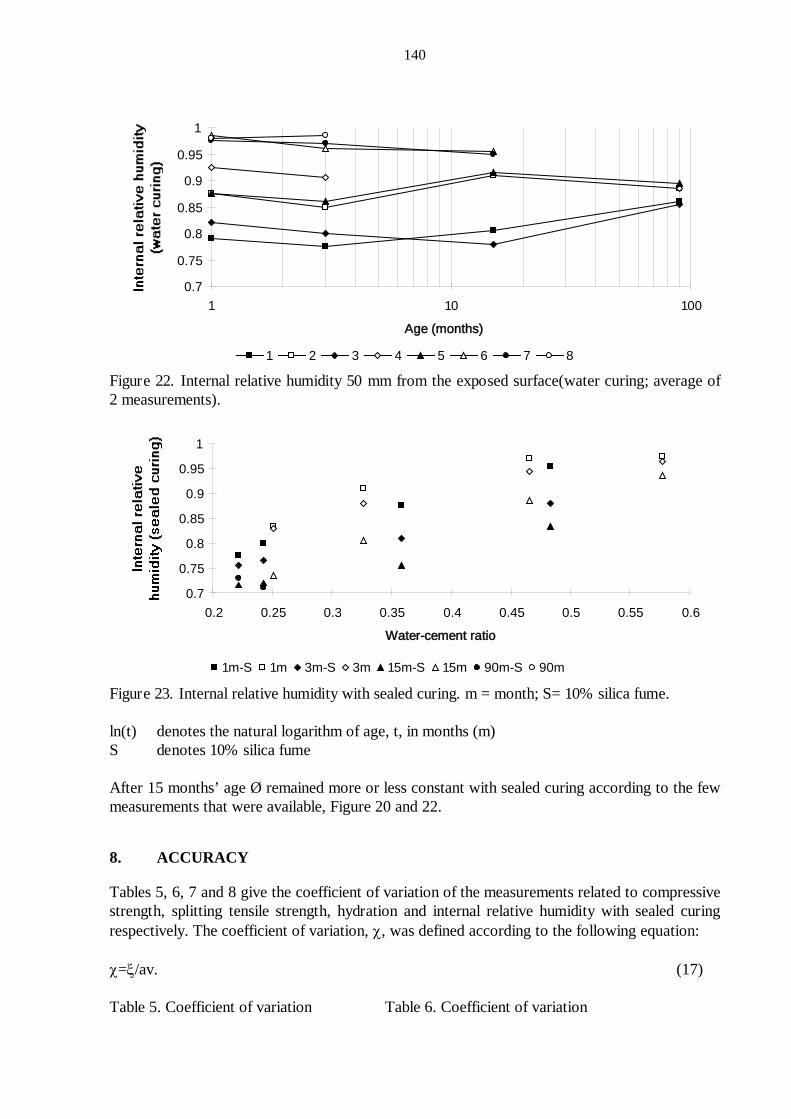
140
0.7
0.75
0.8
0.85
0.9
0.95
1
1 10 100
Age (months)
1 2 3 4 5 6 7 8
Figure 22. Internal relative humidity 50 mm from the exposed surface(water curing; average of 2 measurements).
0.7
0.75
0.8
0.85
0.9
0.95
1
0.2 0.25 0.3 0.35 0.4 0.45 0.5 0.55 0.6
Water-cement ratio
1m-S 1m 3m-S 3m 15m-S 15m 90m-S 90m
Figure 23. Internal relative humidity with sealed curing. m = month; S= 10% silica fume. ln(t) denotes the natural logarithm of age, t, in months (m) S denotes 10% silica fume After 15 months’ age Ø remained more or less constant with sealed curing according to the few measurements that were available, Figure 20 and 22.
8. ACCURACY
Tables 5, 6, 7 and 8 give the coefficient of variation of the measurements related to compressive strength, splitting tensile strength, hydration and internal relative humidity with sealed curing respectively. The coefficient of variation, χ, was defined according to the following equation: χ=ξ/av. (17) Table 5. Coefficient of variation Table 6. Coefficient of variation
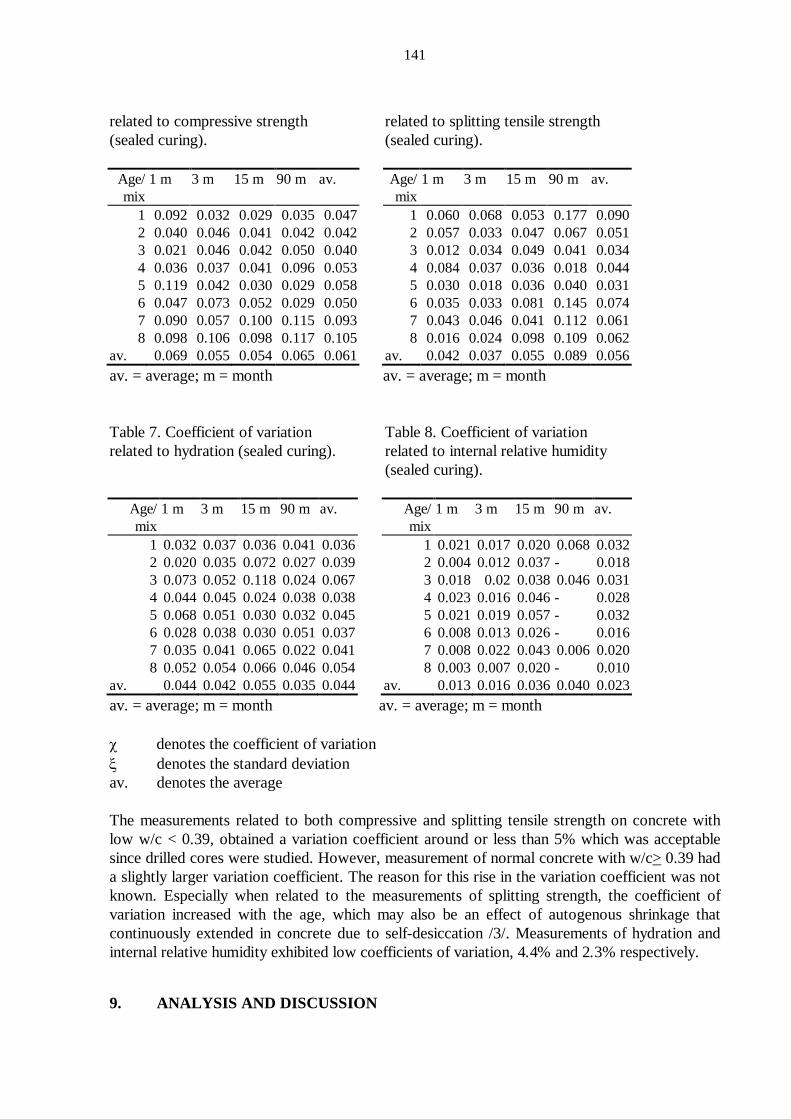
141
related to compressive strength (sealed curing).
related to splitting tensile strength (sealed curing).
Age/ mix
1 m 3 m 15 m 90 m av. Age/ mix
1 m 3 m 15 m 90 m av.
1 0.092 0.032 0.029 0.035 0.047 1 0.060 0.068 0.053 0.177 0.090 2 0.040 0.046 0.041 0.042 0.042 2 0.057 0.033 0.047 0.067 0.051 3 0.021 0.046 0.042 0.050 0.040 3 0.012 0.034 0.049 0.041 0.034 4 0.036 0.037 0.041 0.096 0.053 4 0.084 0.037 0.036 0.018 0.044 5 0.119 0.042 0.030 0.029 0.058 5 0.030 0.018 0.036 0.040 0.031 6 0.047 0.073 0.052 0.029 0.050 6 0.035 0.033 0.081 0.145 0.074 7 0.090 0.057 0.100 0.115 0.093 7 0.043 0.046 0.041 0.112 0.061 8 0.098 0.106 0.098 0.117 0.105 8 0.016 0.024 0.098 0.109 0.062
av. 0.069 0.055 0.054 0.065 0.061 av. 0.042 0.037 0.055 0.089 0.056 av. = average; m = month av. = average; m = month Table 7. Coefficient of variation related to hydration (sealed curing).
Table 8. Coefficient of variation related to internal relative humidity (sealed curing).
Age/ mix
1 m 3 m 15 m 90 m av. Age/ mix
1 m 3 m 15 m 90 m av.
1 0.032 0.037 0.036 0.041 0.036 1 0.021 0.017 0.020 0.068 0.032 2 0.020 0.035 0.072 0.027 0.039 2 0.004 0.012 0.037 - 0.018 3 0.073 0.052 0.118 0.024 0.067 3 0.018 0.02 0.038 0.046 0.031 4 0.044 0.045 0.024 0.038 0.038 4 0.023 0.016 0.046 - 0.028 5 0.068 0.051 0.030 0.032 0.045 5 0.021 0.019 0.057 - 0.032 6 0.028 0.038 0.030 0.051 0.037 6 0.008 0.013 0.026 - 0.016 7 0.035 0.041 0.065 0.022 0.041 7 0.008 0.022 0.043 0.006 0.020 8 0.052 0.054 0.066 0.046 0.054 8 0.003 0.007 0.020 - 0.010
av. 0.044 0.042 0.055 0.035 0.044 av. 0.013 0.016 0.036 0.040 0.023 av. = average; m = month av. = average; m = month χ denotes the coefficient of variation ξ denotes the standard deviation av. denotes the average The measurements related to both compressive and splitting tensile strength on concrete with low w/c < 0.39, obtained a variation coefficient around or less than 5% which was acceptable since drilled cores were studied. However, measurement of normal concrete with w/c> 0.39 had a slightly larger variation coefficient. The reason for this rise in the variation coefficient was not known. Especially when related to the measurements of splitting strength, the coefficient of variation increased with the age, which may also be an effect of autogenous shrinkage that continuously extended in concrete due to self-desiccation /3/. Measurements of hydration and internal relative humidity exhibited low coefficients of variation, 4.4% and 2.3% respectively.
9. ANALYSIS AND DISCUSSION
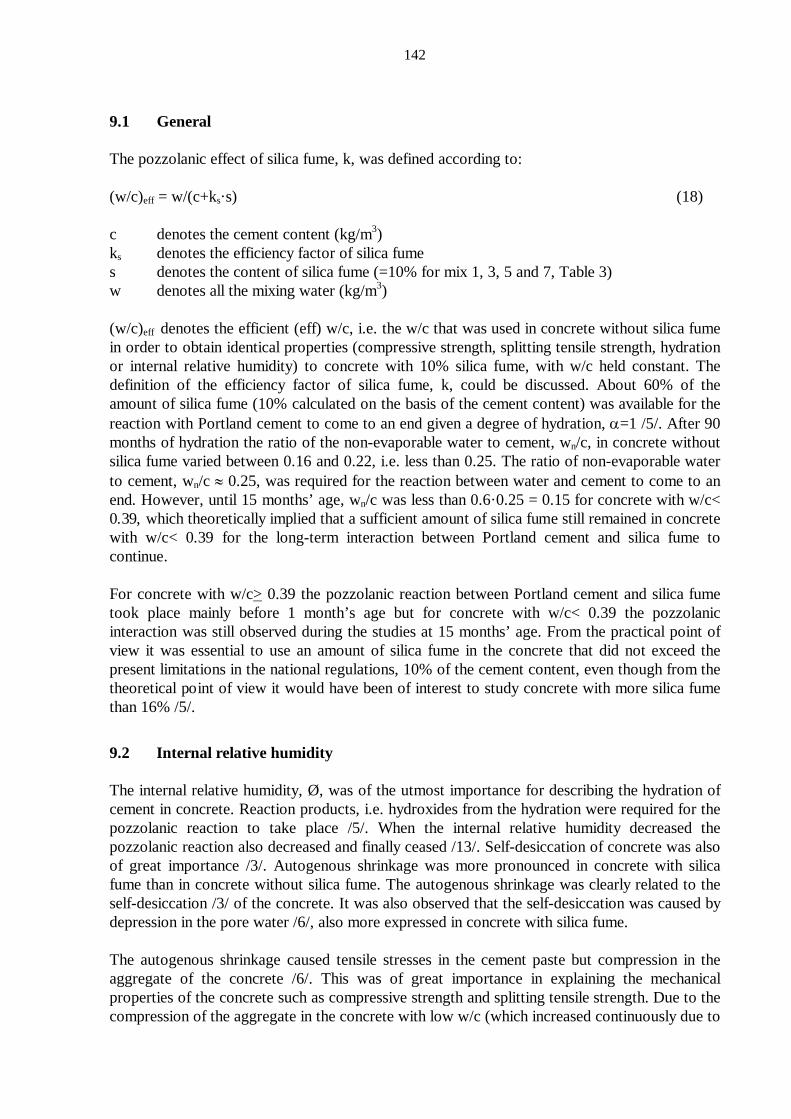
142
9.1 General The pozzolanic effect of silica fume, k, was defined according to: (w/c)eff = w/(c+ks·s) (18) c denotes the cement content (kg/m3) ks denotes the efficiency factor of silica fume s denotes the content of silica fume (=10% for mix 1, 3, 5 and 7, Table 3) w denotes all the mixing water (kg/m3) (w/c)eff denotes the efficient (eff) w/c, i.e. the w/c that was used in concrete without silica fume in order to obtain identical properties (compressive strength, splitting tensile strength, hydration or internal relative humidity) to concrete with 10% silica fume, with w/c held constant. The definition of the efficiency factor of silica fume, k, could be discussed. About 60% of the amount of silica fume (10% calculated on the basis of the cement content) was available for the reaction with Portland cement to come to an end given a degree of hydration, α=1 /5/. After 90 months of hydration the ratio of the non-evaporable water to cement, wn/c, in concrete without silica fume varied between 0.16 and 0.22, i.e. less than 0.25. The ratio of non-evaporable water to cement, wn/c ≈ 0.25, was required for the reaction between water and cement to come to an end. However, until 15 months’ age, wn/c was less than 0.6·0.25 = 0.15 for concrete with w/c< 0.39, which theoretically implied that a sufficient amount of silica fume still remained in concrete with w/c< 0.39 for the long-term interaction between Portland cement and silica fume to continue. For concrete with w/c> 0.39 the pozzolanic reaction between Portland cement and silica fume took place mainly before 1 month’s age but for concrete with w/c< 0.39 the pozzolanic interaction was still observed during the studies at 15 months’ age. From the practical point of view it was essential to use an amount of silica fume in the concrete that did not exceed the present limitations in the national regulations, 10% of the cement content, even though from the theoretical point of view it would have been of interest to study concrete with more silica fume than 16% /5/.
9.2 Internal relative humidity The internal relative humidity, Ø, was of the utmost importance for describing the hydration of cement in concrete. Reaction products, i.e. hydroxides from the hydration were required for the pozzolanic reaction to take place /5/. When the internal relative humidity decreased the pozzolanic reaction also decreased and finally ceased /13/. Self-desiccation of concrete was also of great importance /3/. Autogenous shrinkage was more pronounced in concrete with silica fume than in concrete without silica fume. The autogenous shrinkage was clearly related to the self-desiccation /3/ of the concrete. It was also observed that the self-desiccation was caused by depression in the pore water /6/, also more expressed in concrete with silica fume. The autogenous shrinkage caused tensile stresses in the cement paste but compression in the aggregate of the concrete /6/. This was of great importance in explaining the mechanical properties of the concrete such as compressive strength and splitting tensile strength. Due to the compression of the aggregate in the concrete with low w/c (which increased continuously due to
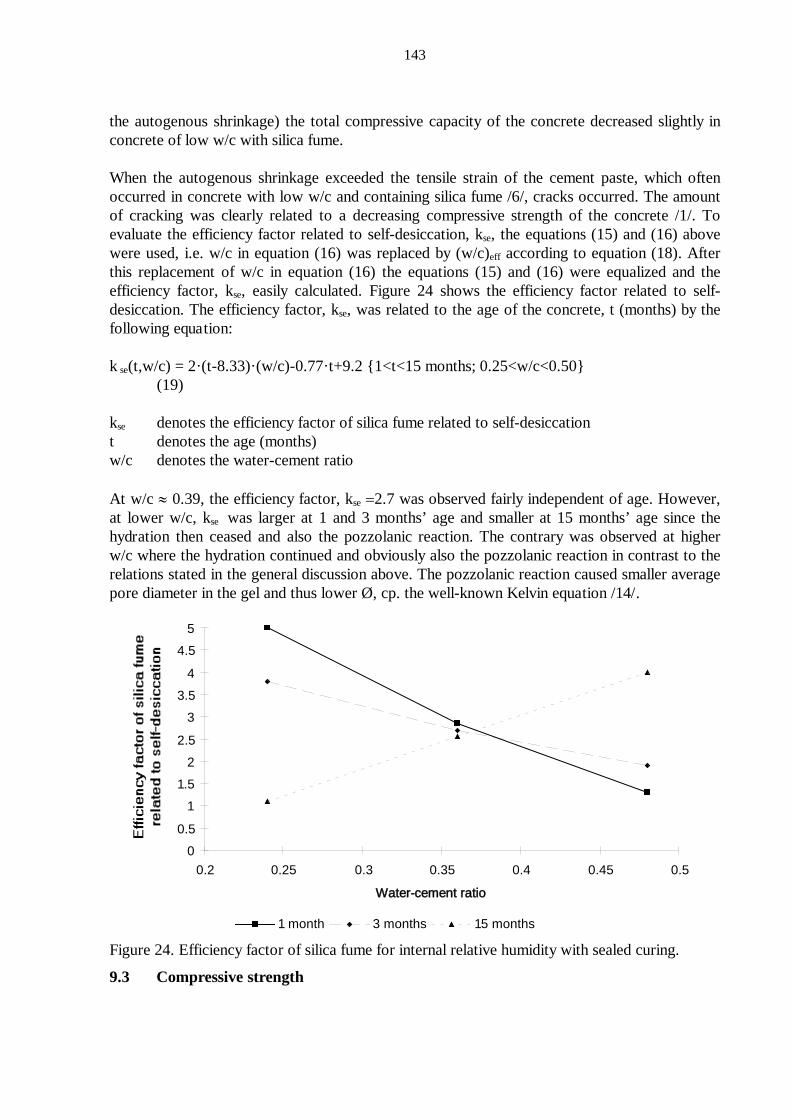
143
the autogenous shrinkage) the total compressive capacity of the concrete decreased slightly in concrete of low w/c with silica fume. When the autogenous shrinkage exceeded the tensile strain of the cement paste, which often occurred in concrete with low w/c and containing silica fume /6/, cracks occurred. The amount of cracking was clearly related to a decreasing compressive strength of the concrete /1/. To evaluate the efficiency factor related to self-desiccation, kse, the equations (15) and (16) above were used, i.e. w/c in equation (16) was replaced by (w/c)eff according to equation (18). After this replacement of w/c in equation (16) the equations (15) and (16) were equalized and the efficiency factor, kse, easily calculated. Figure 24 shows the efficiency factor related to self-desiccation. The efficiency factor, kse, was related to the age of the concrete, t (months) by the following equation: k se(t,w/c) = 2·(t-8.33)·(w/c)-0.77·t+9.2 {1<t<15 months; 0.25<w/c<0.50} (19) kse denotes the efficiency factor of silica fume related to self-desiccation t denotes the age (months) w/c denotes the water-cement ratio At w/c ≈ 0.39, the efficiency factor, kse =2.7 was observed fairly independent of age. However, at lower w/c, kse was larger at 1 and 3 months’ age and smaller at 15 months’ age since the hydration then ceased and also the pozzolanic reaction. The contrary was observed at higher w/c where the hydration continued and obviously also the pozzolanic reaction in contrast to the relations stated in the general discussion above. The pozzolanic reaction caused smaller average pore diameter in the gel and thus lower Ø, cp. the well-known Kelvin equation /14/.
00.5
11.5
22.5
33.5
4
4.55
0.2 0.25 0.3 0.35 0.4 0.45 0.5
Water-cement ratio
1 month 3 months 15 months
Figure 24. Efficiency factor of silica fume for internal relative humidity with sealed curing.
9.3 Compressive strength
144
Initially the effect of silica fume on the compressive strength was pronounced, especially in concrete with low w/c. The early pozzolanic reaction created reaction products such as calcium-silicate-hydrates instead of calcium-hydrates with about 15 MPa larger strength. However, due to the remarkable self-desiccation in concrete with silica fume, especially in concrete with low w/c, the hydration ceased and thus the hydration, the pozzolanic reaction and finally also the increase of strength, cp. equations (6) and (7) above. The rate of long-term strength was about 55% larger in concrete without silica fume than in concrete with 10% silica fume. Only sealed curing was studied regarding the efficiency factor related to strength, ksc. To evaluate the efficiency factor the equation (5) was used i.e. w/c in the equation valid for concrete without silica fume was replaced by (w/c)eff according to equation (18). After this replacement of w/c in equation (5) the equations valid for concrete with and without silica fume were equalized and the efficiency factor, ksc estimated. Figure 25 shows the efficiency factor related to compressive strength described by the following equation: k sc(t,w/c) = 0.113·[4.44-ln(t)]·(w/c)-0.056·[ln(t)+35] {1<t<90 months; 0.25<w/c<0.50} (20) ksc the efficiency factor of silica fume related to compressive strength ln(t) denotes the natural logarithm of the age of the concrete, t (months) w/c denotes the water-cement ratio
-1
0
1
2
3
4
5
6
7
8
9
0.2 0.25 0.3 0.35 0.4 0.45 0.5
Water-cement ratio
1 month 3 months 15 months 90 months
Figure 25. Efficiency factor of silica fume related to compressive strength. Sealed curing.
9.4 Splitting tensile strength
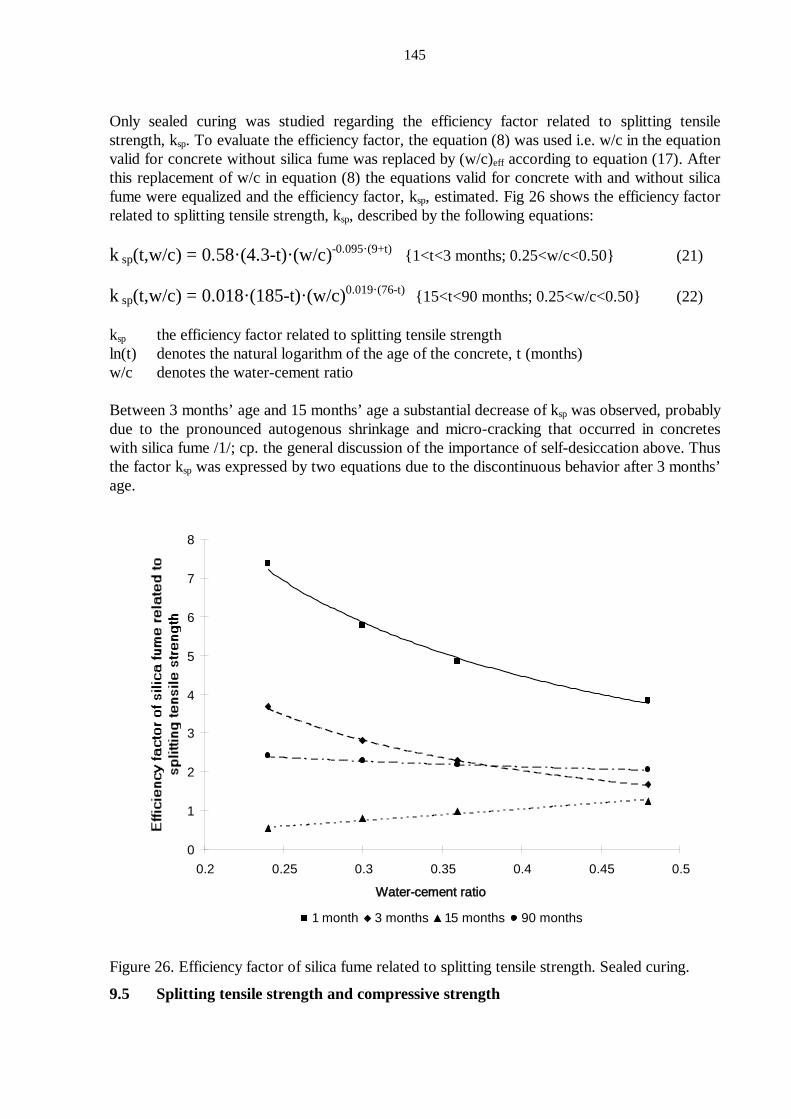
145
Only sealed curing was studied regarding the efficiency factor related to splitting tensile strength, ksp. To evaluate the efficiency factor, the equation (8) was used i.e. w/c in the equation valid for concrete without silica fume was replaced by (w/c)eff according to equation (17). After this replacement of w/c in equation (8) the equations valid for concrete with and without silica fume were equalized and the efficiency factor, ksp, estimated. Fig 26 shows the efficiency factor related to splitting tensile strength, ksp, described by the following equations: k sp(t,w/c) = 0.58·(4.3-t)·(w/c)-0.095·(9+t) {1<t<3 months; 0.25<w/c<0.50} (21) k sp(t,w/c) = 0.018·(185-t)·(w/c)0.019·(76-t) {15<t<90 months; 0.25<w/c<0.50} (22) ksp the efficiency factor related to splitting tensile strength ln(t) denotes the natural logarithm of the age of the concrete, t (months) w/c denotes the water-cement ratio Between 3 months’ age and 15 months’ age a substantial decrease of ksp was observed, probably due to the pronounced autogenous shrinkage and micro-cracking that occurred in concretes with silica fume /1/; cp. the general discussion of the importance of self-desiccation above. Thus the factor ksp was expressed by two equations due to the discontinuous behavior after 3 months’ age.
0
1
2
3
4
5
6
7
8
0.2 0.25 0.3 0.35 0.4 0.45 0.5
Water-cement ratio
1 month 3 months 15 months 90 months
Figure 26. Efficiency factor of silica fume related to splitting tensile strength. Sealed curing.
9.5 Splitting tensile strength and compressive strength
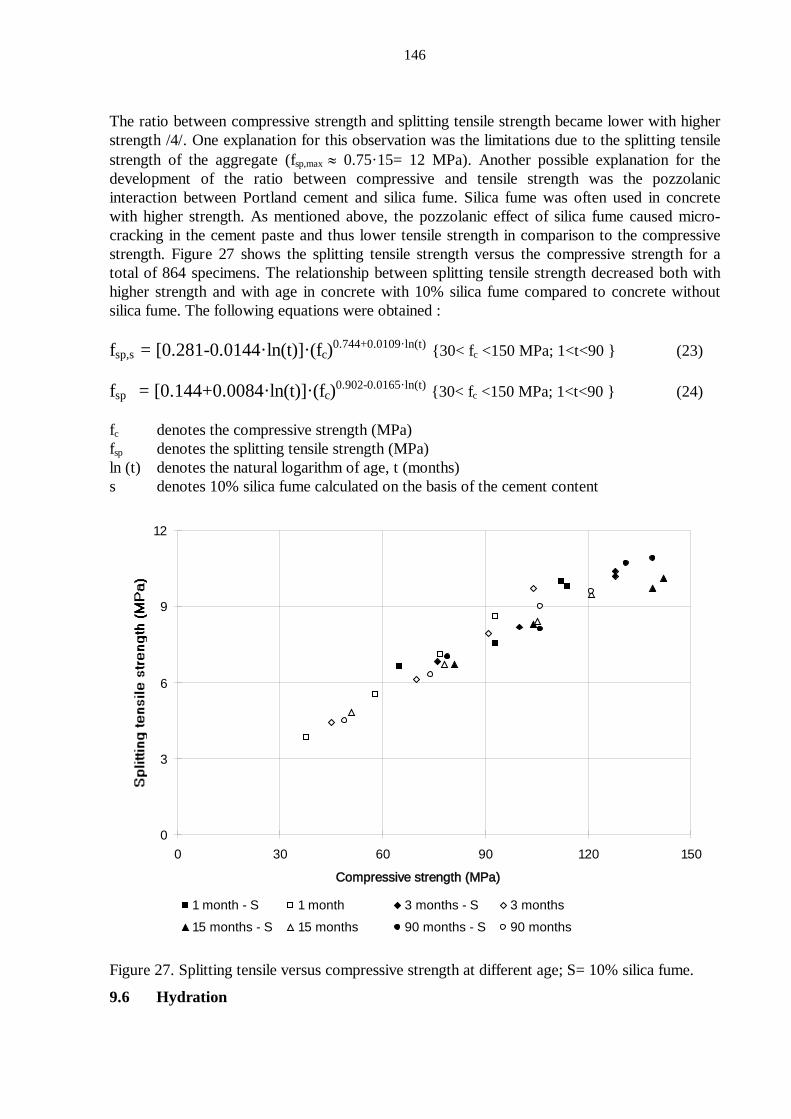
146
The ratio between compressive strength and splitting tensile strength became lower with higher strength /4/. One explanation for this observation was the limitations due to the splitting tensile strength of the aggregate (fsp,max ≈ 0.75·15= 12 MPa). Another possible explanation for the development of the ratio between compressive and tensile strength was the pozzolanic interaction between Portland cement and silica fume. Silica fume was often used in concrete with higher strength. As mentioned above, the pozzolanic effect of silica fume caused micro-cracking in the cement paste and thus lower tensile strength in comparison to the compressive strength. Figure 27 shows the splitting tensile strength versus the compressive strength for a total of 864 specimens. The relationship between splitting tensile strength decreased both with higher strength and with age in concrete with 10% silica fume compared to concrete without silica fume. The following equations were obtained : fsp,s = [0.281-0.0144·ln(t)]·(fc)0.744+0.0109·ln(t) {30< fc <150 MPa; 1<t<90 } (23) fsp = [0.144+0.0084·ln(t)]·(fc)0.902-0.0165·ln(t) {30< fc <150 MPa; 1<t<90 } (24) fc denotes the compressive strength (MPa) fsp denotes the splitting tensile strength (MPa) ln (t) denotes the natural logarithm of age, t (months) s denotes 10% silica fume calculated on the basis of the cement content
0
3
6
9
12
0 30 60 90 120 150
Compressive strength (MPa)
1 month - S 1 month 3 months - S 3 months15 months - S 15 months 90 months - S 90 months
Figure 27. Splitting tensile versus compressive strength at different age; S= 10% silica fume.
9.6 Hydration
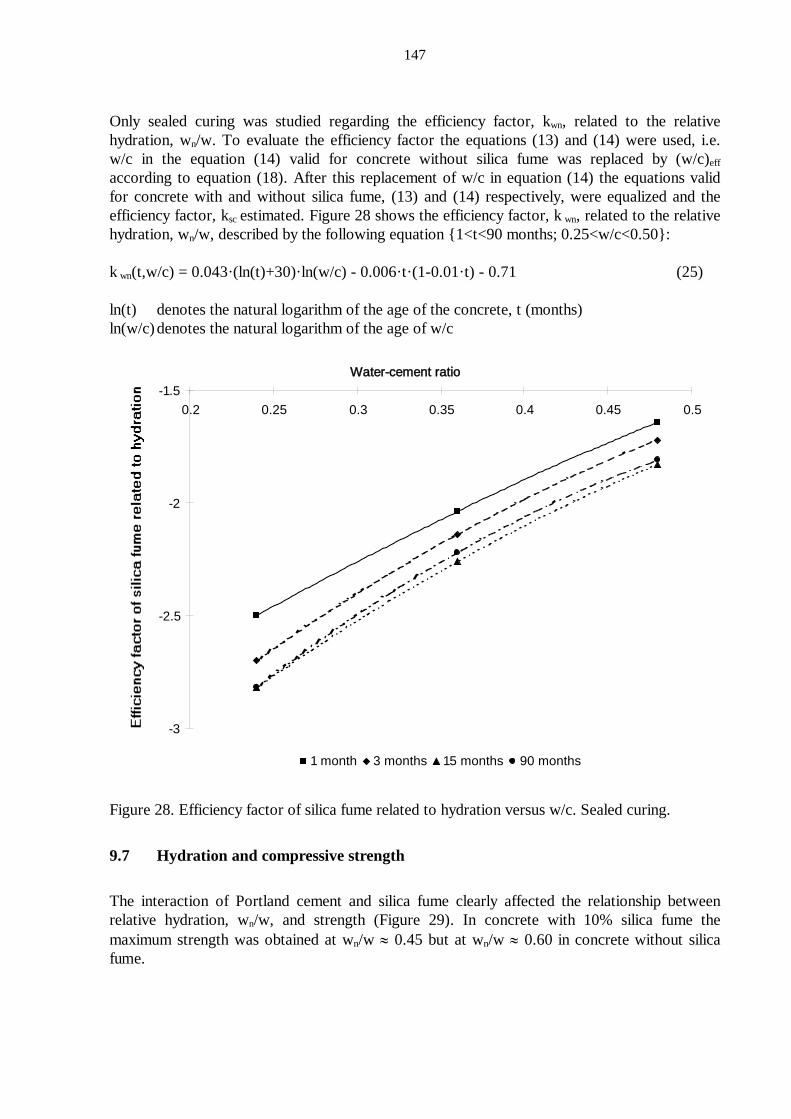
147
Only sealed curing was studied regarding the efficiency factor, kwn, related to the relative hydration, wn/w. To evaluate the efficiency factor the equations (13) and (14) were used, i.e. w/c in the equation (14) valid for concrete without silica fume was replaced by (w/c)eff according to equation (18). After this replacement of w/c in equation (14) the equations valid for concrete with and without silica fume, (13) and (14) respectively, were equalized and the efficiency factor, ksc estimated. Figure 28 shows the efficiency factor, k wn, related to the relative hydration, wn/w, described by the following equation {1<t<90 months; 0.25<w/c<0.50}: k wn(t,w/c) = 0.043·(ln(t)+30)·ln(w/c) - 0.006·t·(1-0.01·t) - 0.71 (25) ln(t) denotes the natural logarithm of the age of the concrete, t (months) ln(w/c) denotes the natural logarithm of the age of w/c
-3
-2.5
-2
-1.50.2 0.25 0.3 0.35 0.4 0.45 0.5
1 month 3 months 15 months 90 months
Water-cement ratio
Figure 28. Efficiency factor of silica fume related to hydration versus w/c. Sealed curing.
9.7 Hydration and compressive strength
The interaction of Portland cement and silica fume clearly affected the relationship between relative hydration, wn/w, and strength (Figure 29). In concrete with 10% silica fume the maximum strength was obtained at wn/w ≈ 0.45 but at wn/w ≈ 0.60 in concrete without silica fume.
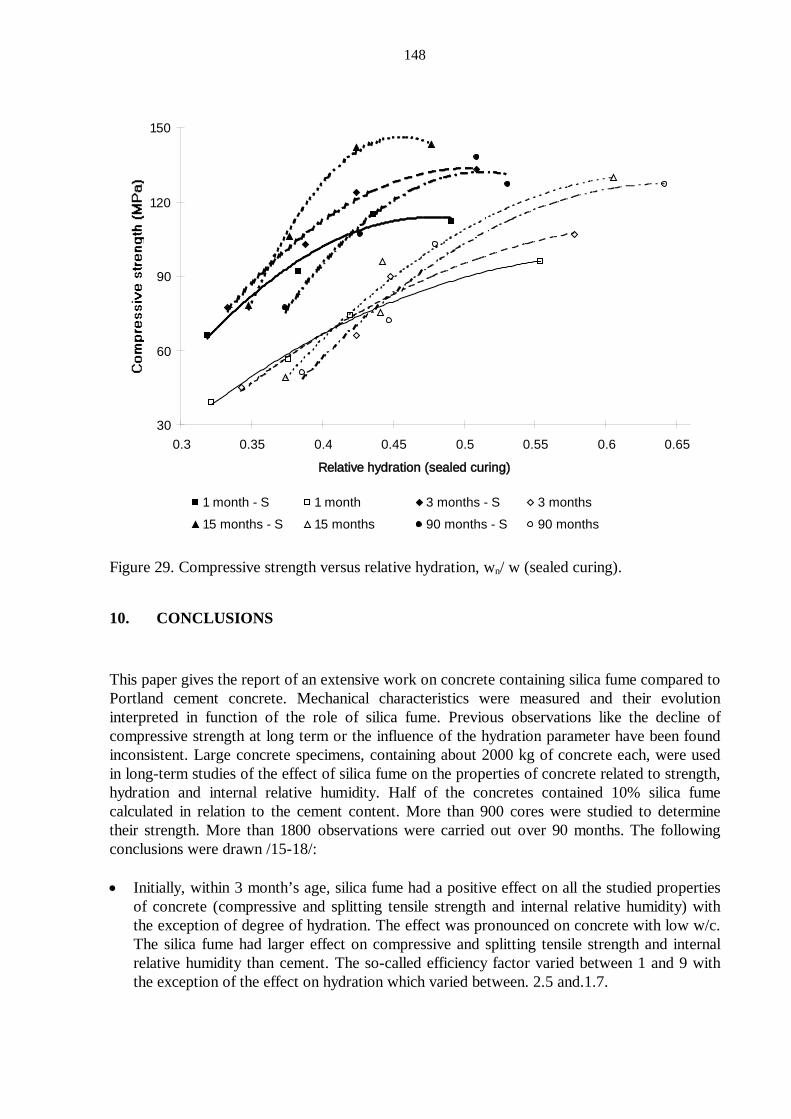
148
30
60
90
120
150
0.3 0.35 0.4 0.45 0.5 0.55 0.6 0.65
Relative hydration (sealed curing)
1 month - S 1 month 3 months - S 3 months15 months - S 15 months 90 months - S 90 months
Figure 29. Compressive strength versus relative hydration, wn/ w (sealed curing).
10. CONCLUSIONS
This paper gives the report of an extensive work on concrete containing silica fume compared to Portland cement concrete. Mechanical characteristics were measured and their evolution interpreted in function of the role of silica fume. Previous observations like the decline of compressive strength at long term or the influence of the hydration parameter have been found inconsistent. Large concrete specimens, containing about 2000 kg of concrete each, were used in long-term studies of the effect of silica fume on the properties of concrete related to strength, hydration and internal relative humidity. Half of the concretes contained 10% silica fume calculated in relation to the cement content. More than 900 cores were studied to determine their strength. More than 1800 observations were carried out over 90 months. The following conclusions were drawn /15-18/: • Initially, within 3 month’s age, silica fume had a positive effect on all the studied properties
of concrete (compressive and splitting tensile strength and internal relative humidity) with the exception of degree of hydration. The effect was pronounced on concrete with low w/c. The silica fume had larger effect on compressive and splitting tensile strength and internal relative humidity than cement. The so-called efficiency factor varied between 1 and 9 with the exception of the effect on hydration which varied between. 2.5 and.1.7.
149
• Due to the low degree of hydration of cement in concrete with low w/c< 0.39, silica fume still remained available for the pozzolanic interaction with the Portland cement, at least until 15 months’ age. In concrete with higher w/c the pozzolanic effect stopped before 1 month’s age due to the insufficient amount of silica fume available in the mix proportions.
• After 90 months, the effect of silica fume on the strength development was negligible.
Between 15 months’ age and 90 months’ age the efficiency factor of silica fume related to compressive strength became slightly negative compared to cement. This phenomenon was most probably explained by the pronounced self-desiccation which consequently stopped the hydration in low w/c concrete. In concrete with higher w/c, no more silica fume remained for the pozzolanic interaction to continue after age 1 month.
• The pozzolanic interaction between silica fume and Portland cement also affected the
autogenous shrinkage of the concrete, which most probably was the explanation for the unfavorable development of the splitting tensile strength in concrete with silica fume compared to concrete without silica fume. The tensile strain was most probably exceeded in concrete with silica fume, causing early micro-cracking in the cement-paste.
• As a consequence of the autogenous shrinkage in concrete of low w/c and with 10% silica in
the mix proportions, the efficiency factor of silica fume related to splitting tensile strength declined to about 1 before 15 months’ age. After 15 months’ age a rise to about 2 of the efficiency factor related to splitting tensile strength was observed. The rise was probably due to healing effect of the hydration of the cement occurring after 15 months’ age (after the pozzolanic reaction stopped).
• The decline of compressive strength that was observed after 90 months’ age in concrete of
low w/c with silica fume was insignificant (of the same magnitude as the standard deviation). • The relationship between degree of hydration and strength was quite different in concrete
with and without silica fume due to the pozzolanic interaction between Portland cement and silica fume. Hydration was an inconsistent parameter to describe the properties of concrete with silica fume.
11. ACKNOWLEDGMENT
Financing from the Swedish Council for Technical Development, NUTEK, is gratefully acknowledged. I am also most grateful to Professor Göran Fagerlund for his review.
REFERENCES
150
/1/ Larsen, E. S., Lauridsen, J. L., Eriksen, K., Hansen, O. R and Mølgaard, T. Durability of
Concrete in the Ryå Bridge. Changes of Properties in Concrete with Silica Fume between years 1981 and 1993. Report no. 6. The Danish Road Department. Roskilde, 16-22 (1993).
/2/ Perraton, D.; de Larrard, F. and A´itcin, P. C. Additional data on the strength retrogression of air-cured silica fume concretes. 2nd CANMET/ACI conference on durability of concrete. Nice, 2-15 (1994).
/3/ Persson, B. Self-desiccation and Its Importance in Concrete Technology. Materials and Structures. Vol. 30, 293-305 (1996).
/4/ Persson, B. Hydration and Strength of High Performance Concrete. Advanced Cement Based Material. Vol. 3, 107-123 (1996).
/5/ Peterson, O. Interaction between Silica Fume and Standard Portland Cement in Mortar and Concrete. Cementa LTD. Malmö, 1-8 (1976).
/6/ Persson, B. (Early) basic creep of High-Performance Concrete. 4th International Symposium on the Utilisation of High-Performance Concrete. Paris, 405-414 (1996).
/7/ Persson, B. Moisture in Concrete Subjected to Different Kinds of Curing. Materials and Structures. Vol. 30, 533-544 (1997).
/8/ Byfors, J. Plain concrete at early ages. Report FO 3:80. The Swedish Cement and Concrete Institute. Stockholm, 40-43 (1980).
/9/ ASTM E 104-85. Standard Practice for Maintaining Constant Relative Humidity by Means of Aqueous Solutions. ASTM, 33-34, 637 (1985).
/10/ Hassanzadeh, M. Fracture mechanical properties. Report M4:05. Lund Institute of Technology. Div. of Building Materials. Lund, 8-13 (1992).
/11/ Persson, B. Hydration, structure and strength of High Performance Concrete. Report TVBM-7011. Lund Institute of Technology. Div. of Building Materials. Lund, 38 (1992). (In Swedish.)
/12/ Powers, T. C. & Brownyard, T. L. Studies of Physical Properties of Hardened Portland Cement Paste PCA. ACI Journal. Detroit. Vol. 43, 984-987 (1947).
/13/ Norling Mjörnell, K. Self-desiccation in concrete. Report P-94:2. Div. of Building Materials. Chalmers University of Technology. Gothenburg, 21-28 (1993).
/14/ Zhang, M. H. and Gjörv, O. E. Effect of Silica Fume on Cement Hydration in Low Porosity Cement Pastes. Cement and Concrete Research. Vol. 21, 800-808 (1991).
151
/15/ Persson, B. Effect of Silica Fume on the Principal Properties of Concrete. Symposium on Advanced Design of Concrete Structures. Gothenburg, 161-168 (1997).
/16/ Persson, B. Long-term Effect of Silica Fume on the Principal Properties of Low-Temperature-Cured Ceramics. Cement and Concrete Research. Vol. 27, 1667-1680 (1997).
/17/ Persson, B. Seven-year effect of silica fume in concrete. Advanced Cement Based Material. Vol. 7, 139-155 (1998).
/18/ Persson, B. Pozzolanic Interaction between Portland Cement and Silica Fume in Concrete. Sixth CANMET/ACI International Conference on Fly Ash, Silica Fume, Slag and Natural Pozzolans in Concrete. Bangkok. 631-660 (1998).

152
153
TEXTURE AND CHEMISTRY OF HISTORIC CONCRETE SUBJECTED TO PROLONGED HYDRATION
Björn Lagerblad PhD, Assoc. Prof. Swedish Cement and Concrete Research Institute 100 44 Stockholm, Sweden [email protected]
ABSTRACT
This article presents textural and chemical changes of concrete that has been subjected to water for a very long time. The prolonged hydration results in a densification of the cement paste. The major mode of hydration is “in situ” hydration of remaining cement grains, which gives a dense and homogeneous texture. All the different types of gel have a similar chemistry, which suggest equilibrium in the system. There are no tendencies of reactions that jeopardise the stability of the cement paste as such or cement paste with low W/C ratio.
Key words: Historic concrete, prolonged hydration, cement paste texture, cement paste chemistry.
1 INTRODUCTION The nuclear waste in Sweden is to be buried in tunnels in the crystalline bedrock at a depth of about 500 meters. After being filled the tunnels will be sealed and the ground water level restored. In this repository concrete and other cementitious materials will be used. After the closure the cementitious materials will be in contact with water and Swedish Nuclear Fuel and waste Management (SKB) want to know how the cementitious materials will change properties and how the cementitious materials will interact with the groundwater and rocks. As a part of this research program CBI has investigated old concretes in water constructions, both changes of texture and leaching. As apart of this program we have investigated concrete from old water dams and power stations Lagerblad (1996). The oldest and most thoroughly investigated was the constructions at Älvkarleby power station that was build between 1911 and 1917. The results showed that the alterations and leaching is dependent on the environment and concrete quality. If water can penetrate the concrete the leaching occur in a mode where the cement clinkers first disappears and leaves a hollow. Later the portlandites crystals dissolve and the paste breaks down. If the water can not penetrate the concrete the leaching will be diffusion controlled from the surface and the interior will be subjected to a prolonged hydration that makes it very dense and strong.
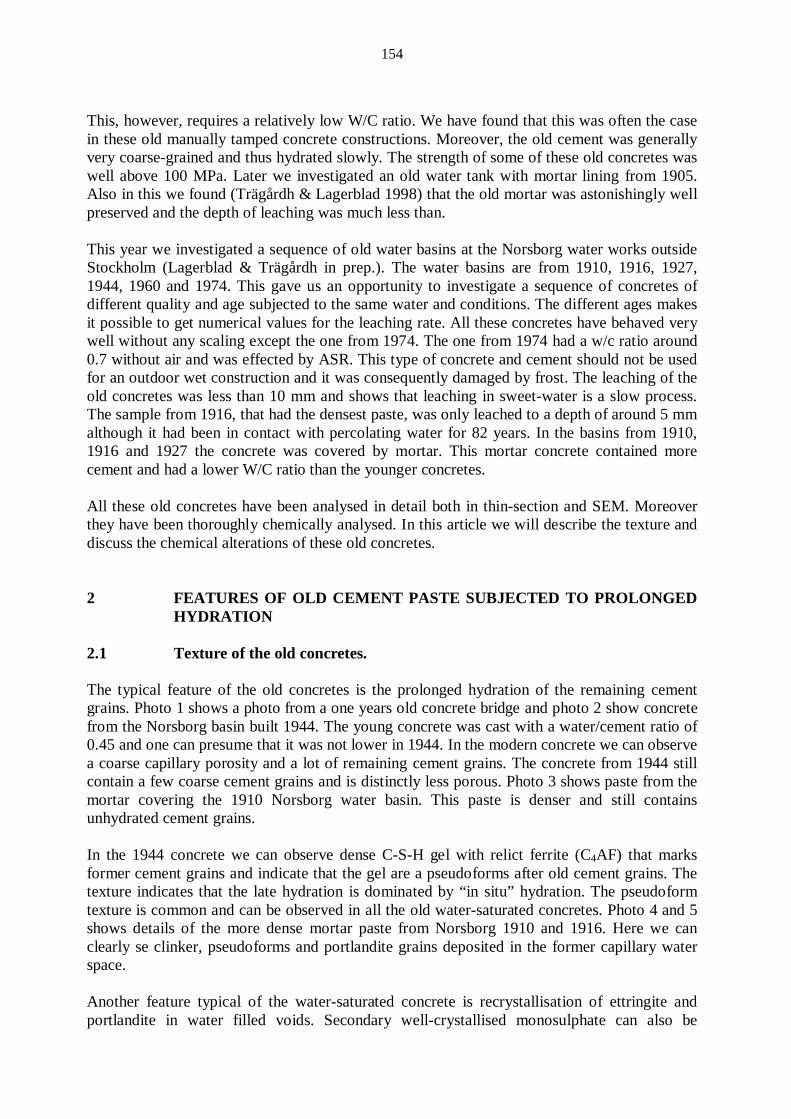
154
This, however, requires a relatively low W/C ratio. We have found that this was often the case in these old manually tamped concrete constructions. Moreover, the old cement was generally very coarse-grained and thus hydrated slowly. The strength of some of these old concretes was well above 100 MPa. Later we investigated an old water tank with mortar lining from 1905. Also in this we found (Trägårdh & Lagerblad 1998) that the old mortar was astonishingly well preserved and the depth of leaching was much less than. This year we investigated a sequence of old water basins at the Norsborg water works outside Stockholm (Lagerblad & Trägårdh in prep.). The water basins are from 1910, 1916, 1927, 1944, 1960 and 1974. This gave us an opportunity to investigate a sequence of concretes of different quality and age subjected to the same water and conditions. The different ages makes it possible to get numerical values for the leaching rate. All these concretes have behaved very well without any scaling except the one from 1974. The one from 1974 had a w/c ratio around 0.7 without air and was effected by ASR. This type of concrete and cement should not be used for an outdoor wet construction and it was consequently damaged by frost. The leaching of the old concretes was less than 10 mm and shows that leaching in sweet-water is a slow process. The sample from 1916, that had the densest paste, was only leached to a depth of around 5 mm although it had been in contact with percolating water for 82 years. In the basins from 1910, 1916 and 1927 the concrete was covered by mortar. This mortar concrete contained more cement and had a lower W/C ratio than the younger concretes. All these old concretes have been analysed in detail both in thin-section and SEM. Moreover they have been thoroughly chemically analysed. In this article we will describe the texture and discuss the chemical alterations of these old concretes. 2 FEATURES OF OLD CEMENT PASTE SUBJECTED TO PROLONGED
HYDRATION 2.1 Texture of the old concretes. The typical feature of the old concretes is the prolonged hydration of the remaining cement grains. Photo 1 shows a photo from a one years old concrete bridge and photo 2 show concrete from the Norsborg basin built 1944. The young concrete was cast with a water/cement ratio of 0.45 and one can presume that it was not lower in 1944. In the modern concrete we can observe a coarse capillary porosity and a lot of remaining cement grains. The concrete from 1944 still contain a few coarse cement grains and is distinctly less porous. Photo 3 shows paste from the mortar covering the 1910 Norsborg water basin. This paste is denser and still contains unhydrated cement grains. In the 1944 concrete we can observe dense C-S-H gel with relict ferrite (C4AF) that marks former cement grains and indicate that the gel are a pseudoforms after old cement grains. The texture indicates that the late hydration is dominated by “in situ” hydration. The pseudoform texture is common and can be observed in all the old water-saturated concretes. Photo 4 and 5 shows details of the more dense mortar paste from Norsborg 1910 and 1916. Here we can clearly se clinker, pseudoforms and portlandite grains deposited in the former capillary water space. Another feature typical of the water-saturated concrete is recrystallisation of ettringite and portlandite in water filled voids. Secondary well-crystallised monosulphate can also be
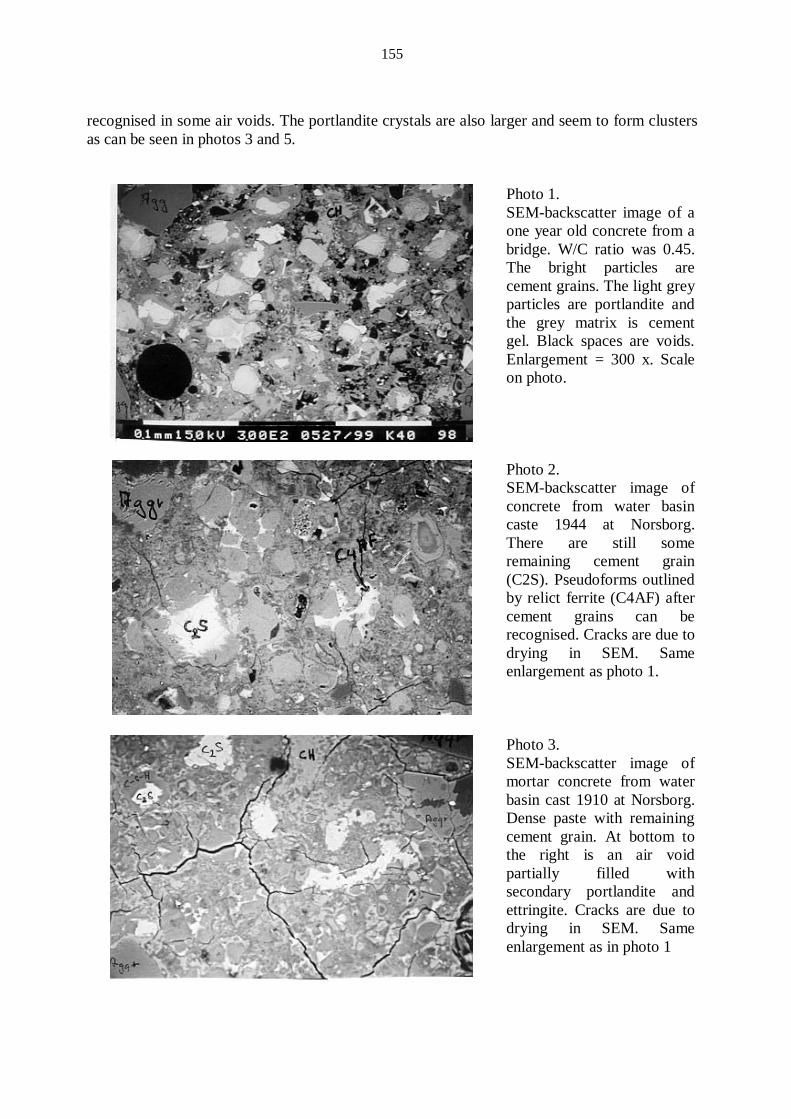
155
recognised in some air voids. The portlandite crystals are also larger and seem to form clusters as can be seen in photos 3 and 5.
Photo 1. SEM-backscatter image of a one year old concrete from a bridge. W/C ratio was 0.45. The bright particles are cement grains. The light grey particles are portlandite and the grey matrix is cement gel. Black spaces are voids. Enlargement = 300 x. Scale on photo.
Photo 2. SEM-backscatter image of concrete from water basin caste 1944 at Norsborg. There are still some remaining cement grain (C2S). Pseudoforms outlined by relict ferrite (C4AF) after cement grains can be recognised. Cracks are due to drying in SEM. Same enlargement as photo 1.
Photo 3. SEM-backscatter image of mortar concrete from water basin cast 1910 at Norsborg. Dense paste with remaining cement grain. At bottom to the right is an air void partially filled with secondary portlandite and ettringite. Cracks are due to drying in SEM. Same enlargement as in photo 1
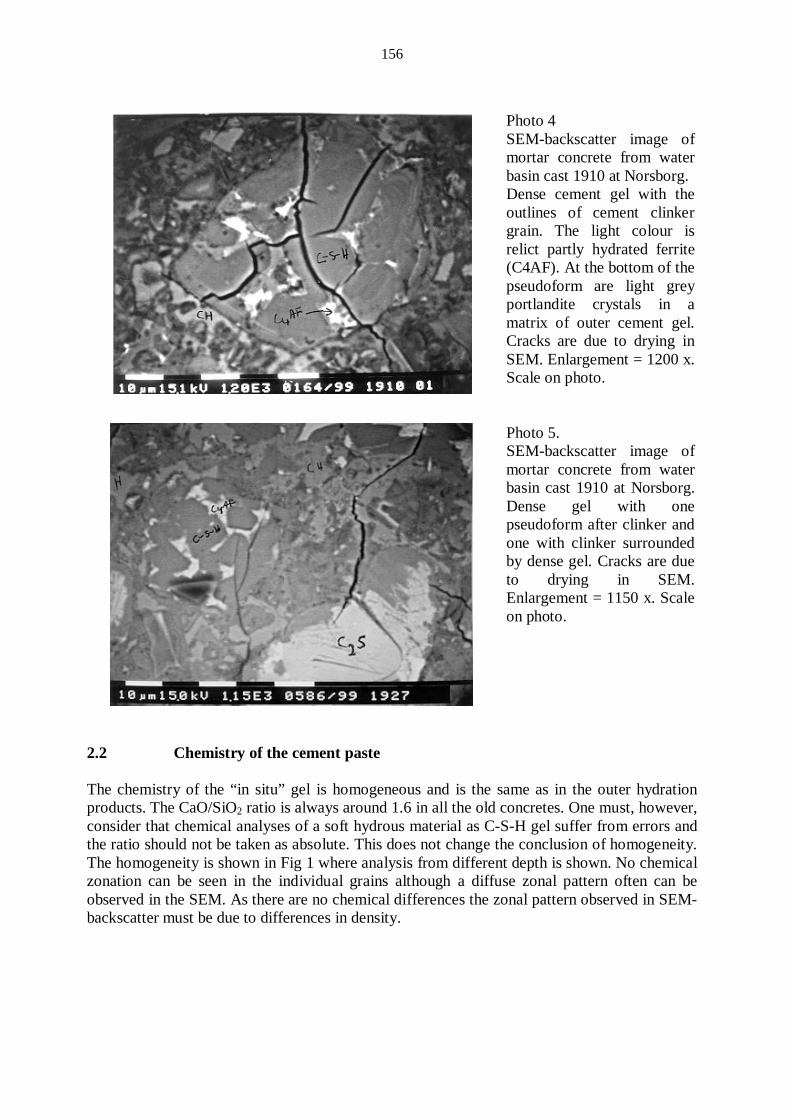
156
Photo 4 SEM-backscatter image of mortar concrete from water basin cast 1910 at Norsborg. Dense cement gel with the outlines of cement clinker grain. The light colour is relict partly hydrated ferrite (C4AF). At the bottom of the pseudoform are light grey portlandite crystals in a matrix of outer cement gel. Cracks are due to drying in SEM. Enlargement = 1200 x. Scale on photo.
Photo 5. SEM-backscatter image of mortar concrete from water basin cast 1910 at Norsborg. Dense gel with one pseudoform after clinker and one with clinker surrounded by dense gel. Cracks are due to drying in SEM. Enlargement = 1150 x. Scale on photo.
2.2 Chemistry of the cement paste The chemistry of the “in situ” gel is homogeneous and is the same as in the outer hydration products. The CaO/SiO2 ratio is always around 1.6 in all the old concretes. One must, however, consider that chemical analyses of a soft hydrous material as C-S-H gel suffer from errors and the ratio should not be taken as absolute. This does not change the conclusion of homogeneity. The homogeneity is shown in Fig 1 where analysis from different depth is shown. No chemical zonation can be seen in the individual grains although a diffuse zonal pattern often can be observed in the SEM. As there are no chemical differences the zonal pattern observed in SEM-backscatter must be due to differences in density.
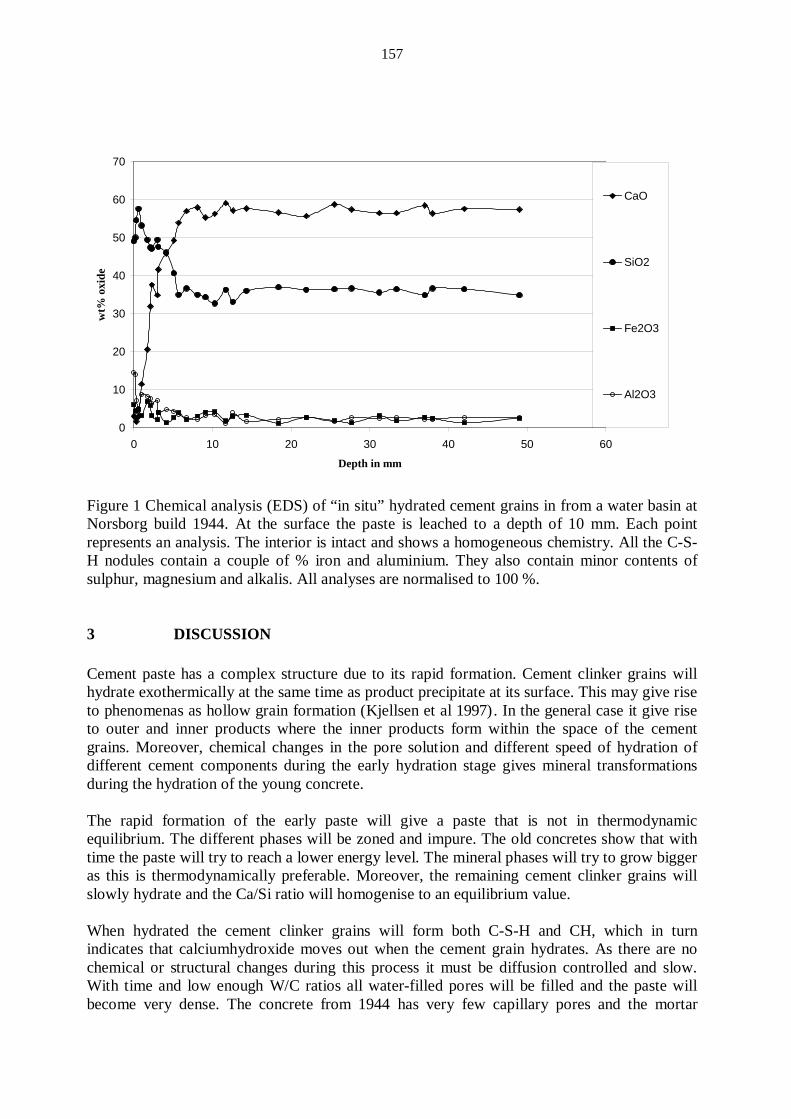
157
0
10
20
30
40
50
60
70
0 10 20 30 40 50 60
Depth in mm
wt%
oxi
de
CaO
SiO2
Fe2O3
Al2O3
Figure 1 Chemical analysis (EDS) of “in situ” hydrated cement grains in from a water basin at Norsborg build 1944. At the surface the paste is leached to a depth of 10 mm. Each point represents an analysis. The interior is intact and shows a homogeneous chemistry. All the C-S-H nodules contain a couple of % iron and aluminium. They also contain minor contents of sulphur, magnesium and alkalis. All analyses are normalised to 100 %. 3 DISCUSSION Cement paste has a complex structure due to its rapid formation. Cement clinker grains will hydrate exothermically at the same time as product precipitate at its surface. This may give rise to phenomenas as hollow grain formation (Kjellsen et al 1997). In the general case it give rise to outer and inner products where the inner products form within the space of the cement grains. Moreover, chemical changes in the pore solution and different speed of hydration of different cement components during the early hydration stage gives mineral transformations during the hydration of the young concrete. The rapid formation of the early paste will give a paste that is not in thermodynamic equilibrium. The different phases will be zoned and impure. The old concretes show that with time the paste will try to reach a lower energy level. The mineral phases will try to grow bigger as this is thermodynamically preferable. Moreover, the remaining cement clinker grains will slowly hydrate and the Ca/Si ratio will homogenise to an equilibrium value. When hydrated the cement clinker grains will form both C-S-H and CH, which in turn indicates that calciumhydroxide moves out when the cement grain hydrates. As there are no chemical or structural changes during this process it must be diffusion controlled and slow. With time and low enough W/C ratios all water-filled pores will be filled and the paste will become very dense. The concrete from 1944 has very few capillary pores and the mortar

158
concrete from 1916 and 1927 practically none. In the paste from 1916 and 1927 also the outer gel is much denser indicating that also the gel porosity is less. The W/C ratio where all the capillary water will be consumed lies around 0.42 (Young & Hansen 1987). At lower W/C ratio there will remain cement clinker grains when all free water is consumed. The old mortars are dense and still contain unreacted clinker grains. At this degree of hydration the only remaining water is that in the gel pores and this rises the question of the structure of these pores. The texture shows that there are several types of C-S-H gel, mainly fibrous outer- and dense inner gel. The more dense inner “in situ” formed gels presumably contain less water. To understand this we must look at the volume changes during hydration and the consequences of this. Young & Hansen 1987 did a theoretical volume change for the hydration of C3S where they assumed 4 molecules of water in each C-S-H. This will give; C3S + 5.3 H = C1.7SH4 + 1.3 CH Component C3S H C1.7SH4 CH Mass (g) 228 95 227 96 Density (g/cm3) 3.21 1.0 1.85 2.24 Volume (cm3) 71 95 124 43 Total volume (cm3) 166 167 This calculation was made with paste at RH = 90 %. In the Norsborg basins the RH was probably 100 % as it was newer dried had been in contact with water all the time. This calculation was, however, based on paste and did not take the different types of C-S-H into account. The calculation also shows that the C-S-H gel has a larger volume than the cement clinker. The texture in the old concretes, however, indicates hydration within the grain boundaries of the cement grain. This is the case with D-dried C-S-H, paste that has been dried at vapour pressure of ice at –78 °C. This gel that only contains 1.2 units of water will give the same volume to the C-S-H as the original C3S (Young & Hansen 1987). As silica has a restricted mobility the C2S will achieve a larger “in situ” volume than C3S. The gel water can be both adsorbed. absorbed and chemically bound. The free gel water is measured as the amount of water paste that can be released when the capillary pores are empty. This does not consider the morphology of the different types of C-S-H gel. The “in situ” gel is denser and presumably has less gel pores and lower water content than a normal bulk cement paste. This in turn indicates that one with time and slow hydration will get a more dense gel with less gel porosity. With lower W/C (more clinker grains) the overall gel porosity will be lower. As this takes such a long time the laboratory values that gel porosity comes from is too high. The old concretes have been analysed by 29Si NMR at ESPCI in Paris. This method gives the length of the silicate chains. The results (in prep) shows that the gel in the old concretes has a high grade of polymerisation (Q2 is dominating). The similar Ca/Si ratio both within and between the different concretes indicates that the gel is reaching equilibrium with time. Calciumhydroxide crystals entrapped during the fast early hydration will be released and lower the Ca content of the C-S-H. The increasing polymerisation of the tetrahedral co-ordinated
159
silicate chain will probably also release some octahedral co-ordinated CaO. Thus the slightly lower CaO/SiO2 ratio than in younger concrete might be real. When the portlandite is removed by leaching the Ca/Si ratio decreases, as can be seen in Fig. 1 At a CaO/SiO2 ratio of around 1 the gel collapses and shrinks. This indicates that the gel has a framework of silica that can loose a substantial amount of Ca without collapsing. This, in turn, indicate that the Ca is fairly loosely bound to the silicate framework 4 CONCLUSIONS In a water-saturated environment concrete with low W/C can hydrate for a very long time and form a very dense paste. The hydration is dominated by slow in situ hydration that releases calciumhydroxide that is deposited in the capillary space as portlandite. There are no tendencies of reactions that jeopardise the stability of the cement paste as such or cement paste with low W/C ratio. The prolonged hydration will consume all available water and only become denser. Eventually the density will hinder water from diffusing into the gel to the remaining cement grains. The gel will presumably remain amorphous with the same texture and chemistry and in equilibrium with portlandite for a very long time. ACKNOWLEDGEMENT I wish to thank Swedish Nuclear Fuel and Waste Management Co and the UNICORN project for financing the work upon which this article is based. UNICORN is a Brite-Euram III program financed by the European Community. I also want to thank Manfred Meier at CBI for all the difficult technical work at the SEM. REFERENCES Lagerblad 1996, Conceptual model for deterioration of Portland cements concrete in water, SKB AR 96-01. Lagerblad, B., Trägårdh, J., 1995, Conceptual model for concrete long time degradation in a deep nuclear waste repository, SKB, TR 95-31, also in CBI report 2:96. Trägårdh, J., Lagerblad, B., 1998, Leaching of 90-years old concrete mortar in contact with stagnant water. SKB, TR-98-11 Young, J. F., Hansen, W., 1987, Volume relationships based on hydration stoichiometries. Mat. Res. Soc. Symp., Proc. Vol 85, Kjellsen, K.O., Lagerblad,B., Jennings, H.M., 1997, Hollow-shell formation – an important mode in the hydration of Portland cement, Journ. Of Matr. Sci., 32, 2921-2927.

160
161
INFLUENCE OF WATER-BINDING ON THE ICE FORMATION AND FREEZE/THAW DAMAGE IN CEMENT PASTE AND CONCRETE.
Dirch H. Bager Ph.D., Chief Concrete Technologist Cement and Concrete Laboratory, Aalborg Portland A/S Rørdalsvej 44, P.O. Box 165, DK-9100 Aalborg e-mail: [email protected] Tommy B. Hansen M.Sc., Industrial Ph.D. Student Cement and Concrete Laboratory, Aalborg Portland A/S Rørdalsvej 44, P.O Box 165, DK-9100 Aalborg E-mail: [email protected] ABSTRACT The investigations carried out in the reported study have indicated that the bonding strength of water to the internal surfaces can have a marked influence on the freeze/thaw damage in concrete. Further studies of the bonding strength to internal surfaces in concrete as a function of the constituents in the concrete as well as in the water will be an essential input in order to increase the understanding of the freeze/thaw mechanism, and to make the new conceptual freeze/thaw damage model more quantitative. These measurements ought to be made in the actual temperature regime. Although out of the scope of these investigations, the measurements on old virgin mature cement pastes revealed some very interesting structural changes, which will be studied further in the near future. Key words: Ice formation, water-binding, freeze/thaw, concrete, water, physical structure
1. INTRODUCTION It has been demonstrated several times [1,2], that increasing degree of hardness of the water used as the freezing media in freeze/thaw tests of concrete, lead to more severe damage in the concrete. In the opinion of the author’s, this is hard to explain by a physical mechanism since the opposite seems to be much more reasonable. The softer the water, the more Ca(OH)2 and C-S-H will dissolute, thus coarsening the pore structure and increasing the possible ice formation.
162
In order to study the relationship between freeze/thaw damage in concrete and the water used for freezing media, several investigations have been carried out at the Cement and Concrete Laboratory during the last years. Three different types of water have been used: Tap water from Aalborg in Denmark, tap water from a site close to Borås in Sweden and demineralised water. This paper presents the presently available results. For the basic investigations, 22 years old virgin portland cement paste specimens with water/cement ratio of 0.5 have been used. The old pastes have been stored in the different types of water for three months just prior to the measurements. On these specimens the following have been measured: • Ice formation by low temperature microcalorimetry. • Binding energy of the surface adsorbed water by Differential Pressure Analysis [6]. • X-ray diffractometry to study eventual metal-ion replacement in the C-S-H. During preparation of the cement paste specimens, the specimen which had been exposed to Borås water, appeared to have a markedly higher strength, and to be more brittle. For this reason, compressive strength of mortars, mixed and stored with different types of water, have also been measured. 2. MATERIALS In this investigations three types of specimens have been used:
1) Concrete – cast and tested in 1996. 2) Hardened Portland cement paste with water/cement ratio of 0.5 – cast in 1977
and tested in 1999. 3) Mortarbars – cast and tested in 1999.
The materials used: CONCRETE
• Cement: CEMII/A-L 52.5 R; the Danish BASIS cement.
• Aggregate: The aggregate types are classified for use in aggressive environment according to the Danish Codes. (Freeze/thaw and de-icing salts). - Fine aggregate: Sand from a gravel pit in North Jutland (Nr. Halne). - Coarse aggregate: Granite from Vikans Kross in Sweden.
• Water: Tap water from Aalborg.
• Mix design: Table 1: Mix design for the concrete used for freeze/thaw test.
Cement kg/m3
Free water kg/m3
Sand 0/4 kg/m3
Stone 4/8 kg/m3
Stone 8/11 kg/m3
Density kg/m3
Slump mm
Air %
400
220
687
515
515
2370
21
1,0
• Water/cement ratio: 0.55, without air entraining.
163
• The grading curve for the aggregates: Table 2: Grading curve for the aggregate used.
0,075 mm
0,125 mm
0,25 mm
0,5 mm
1 mm
2 mm
4 mm
8 mm
16 mm
32 mm
0,8
2,8
7,1
20,3
34,7
39,5
41,8
67,0
97,3
100,0
The concrete had a 28 days cube strength of 42.7 MPa. HARDENED CEMENT PASTE
• Cement: CEM I 52.5; the Danish RAPID cement.
• Water: Tap water from the Technical University of Denmark, Lyngby.
• Water/cement ratio 0.50, without air entraining.
• The paste was mixed under vacuum and moulded in cylindrical and sealed polytetrafluoroethane forms that were slowly rotated during the first 20 hours in order to avoid bleeding. The diameter of the specimens is 14 mm. Moulding took place 19. April 1977. Immediately after demoulding, the specimens were placed in saturated limewater in sealed jars, and stored at 20 oC until 11. May 1999 (Approximately 22 years). In the period from 11. May 1999 to 16. August 1999 the specimens were stored at 20 oC in different types of water: Remaining in the original saturated lime water. Demineralised water. Tap water from Aalborg. Tap water from Borås in the Southern part of Sweden.
MORTAR BARS
• Cement: CEM I 52.5; the Danish RAPID cement.
• Sand: CEN Standard sand according to DIN EN 196-1.
• Water for both mixing and storage: Tap water from Aalborg. Tap water from Borås in the Southern part of Sweden.
• Storage: In sealed plastic boxes at 35 oC for 14 days.
CHEMICAL COMPOSITION OF WATER AND CEMENT
The two types of water had the following total degree of hardness: 17 odH and 6.9 odH respectively for the Aalborg and the Borås water. The content of bicarbonate is 197 mg/l and 183 mg/l respectively. For both types of water, the content of NH3, NO3
-, P and Mn is below the detection limit (0.01 mg/l).
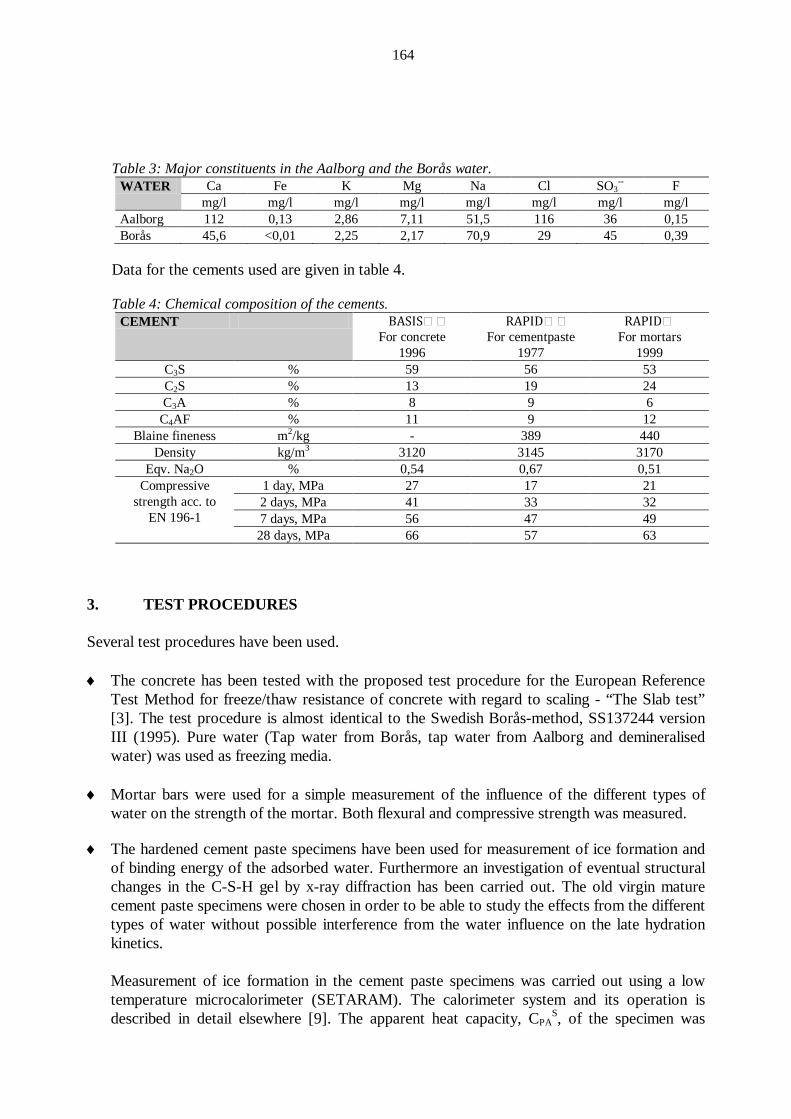
164
Table 3: Major constituents in the Aalborg and the Borås water.
WATER Ca Fe K Mg Na Cl SO3-- F
mg/l mg/l mg/l mg/l mg/l mg/l mg/l mg/l Aalborg 112 0,13 2,86 7,11 51,5 116 36 0,15 Borås 45,6 <0,01 2,25 2,17 70,9 29 45 0,39
Data for the cements used are given in table 4. Table 4: Chemical composition of the cements.
CEMENT BASIS For concrete
1996
RAPID For cementpaste
1977
RAPID For mortars
1999 C3S % 59 56 53 C2S % 13 19 24 C3A % 8 9 6
C4AF % 11 9 12 Blaine fineness m2/kg - 389 440
Density kg/m3 3120 3145 3170 Eqv. Na2O % 0,54 0,67 0,51
Compressive strength acc. to
EN 196-1
1 day, MPa 27 17 21 2 days, MPa 41 33 32 7 days, MPa 56 47 49 28 days, MPa 66 57 63
3. TEST PROCEDURES Several test procedures have been used. ♦ The concrete has been tested with the proposed test procedure for the European Reference
Test Method for freeze/thaw resistance of concrete with regard to scaling - “The Slab test” [3]. The test procedure is almost identical to the Swedish Borås-method, SS137244 version III (1995). Pure water (Tap water from Borås, tap water from Aalborg and demineralised water) was used as freezing media.
♦ Mortar bars were used for a simple measurement of the influence of the different types of
water on the strength of the mortar. Both flexural and compressive strength was measured. ♦ The hardened cement paste specimens have been used for measurement of ice formation and
of binding energy of the adsorbed water. Furthermore an investigation of eventual structural changes in the C-S-H gel by x-ray diffraction has been carried out. The old virgin mature cement paste specimens were chosen in order to be able to study the effects from the different types of water without possible interference from the water influence on the late hydration kinetics.
Measurement of ice formation in the cement paste specimens was carried out using a low temperature microcalorimeter (SETARAM). The calorimeter system and its operation is described in detail elsewhere [9]. The apparent heat capacity, CPA
S, of the specimen was
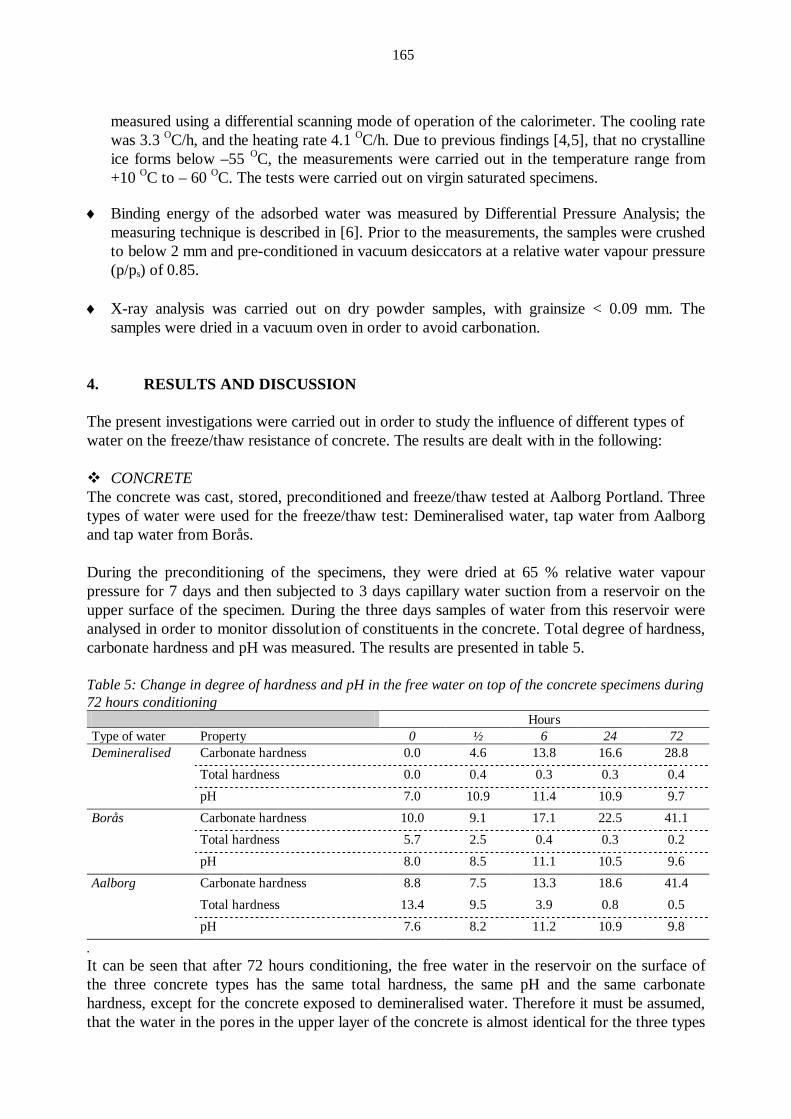
165
measured using a differential scanning mode of operation of the calorimeter. The cooling rate was 3.3 OC/h, and the heating rate 4.1 OC/h. Due to previous findings [4,5], that no crystalline ice forms below –55 OC, the measurements were carried out in the temperature range from +10 OC to – 60 OC. The tests were carried out on virgin saturated specimens.
♦ Binding energy of the adsorbed water was measured by Differential Pressure Analysis; the
measuring technique is described in [6]. Prior to the measurements, the samples were crushed to below 2 mm and pre-conditioned in vacuum desiccators at a relative water vapour pressure (p/ps) of 0.85.
♦ X-ray analysis was carried out on dry powder samples, with grainsize < 0.09 mm. The
samples were dried in a vacuum oven in order to avoid carbonation. 4. RESULTS AND DISCUSSION The present investigations were carried out in order to study the influence of different types of water on the freeze/thaw resistance of concrete. The results are dealt with in the following: CONCRETE The concrete was cast, stored, preconditioned and freeze/thaw tested at Aalborg Portland. Three types of water were used for the freeze/thaw test: Demineralised water, tap water from Aalborg and tap water from Borås. During the preconditioning of the specimens, they were dried at 65 % relative water vapour pressure for 7 days and then subjected to 3 days capillary water suction from a reservoir on the upper surface of the specimen. During the three days samples of water from this reservoir were analysed in order to monitor dissolution of constituents in the concrete. Total degree of hardness, carbonate hardness and pH was measured. The results are presented in table 5. Table 5: Change in degree of hardness and pH in the free water on top of the concrete specimens during 72 hours conditioning Hours Type of water Property 0 ½ 6 24 72 Demineralised Carbonate hardness 0.0 4.6 13.8 16.6 28.8
Total hardness 0.0 0.4 0.3 0.3 0.4 pH 7.0 10.9 11.4 10.9 9.7
Borås Carbonate hardness 10.0 9.1 17.1 22.5 41.1 Total hardness 5.7 2.5 0.4 0.3 0.2 pH 8.0 8.5 11.1 10.5 9.6
Aalborg Carbonate hardness 8.8 7.5 13.3 18.6 41.4 Total hardness 13.4 9.5 3.9 0.8 0.5 pH 7.6 8.2 11.2 10.9 9.8
. It can be seen that after 72 hours conditioning, the free water in the reservoir on the surface of the three concrete types has the same total hardness, the same pH and the same carbonate hardness, except for the concrete exposed to demineralised water. Therefore it must be assumed, that the water in the pores in the upper layer of the concrete is almost identical for the three types
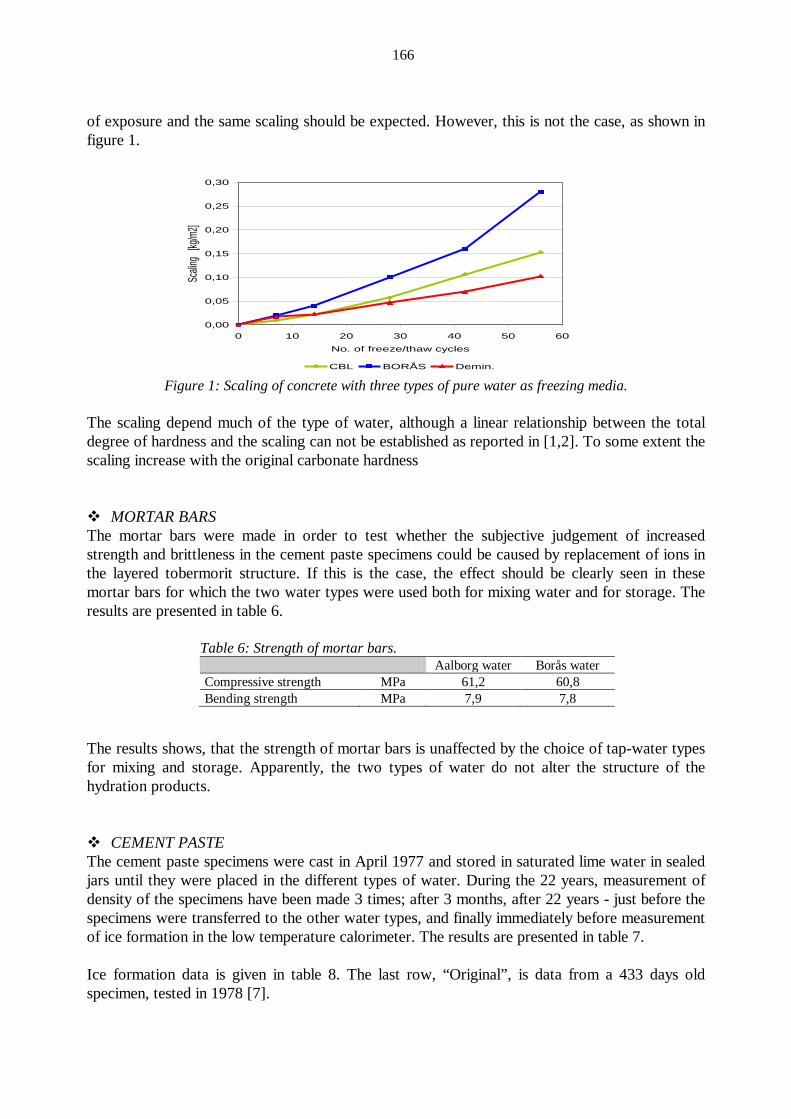
166
of exposure and the same scaling should be expected. However, this is not the case, as shown in figure 1.
Figure 1: Scaling of concrete with three types of pure water as freezing media.
The scaling depend much of the type of water, although a linear relationship between the total degree of hardness and the scaling can not be established as reported in [1,2]. To some extent the scaling increase with the original carbonate hardness MORTAR BARS The mortar bars were made in order to test whether the subjective judgement of increased strength and brittleness in the cement paste specimens could be caused by replacement of ions in the layered tobermorit structure. If this is the case, the effect should be clearly seen in these mortar bars for which the two water types were used both for mixing water and for storage. The results are presented in table 6.
Table 6: Strength of mortar bars. Aalborg water Borås water Compressive strength MPa 61,2 60,8 Bending strength MPa 7,9 7,8
The results shows, that the strength of mortar bars is unaffected by the choice of tap-water types for mixing and storage. Apparently, the two types of water do not alter the structure of the hydration products. CEMENT PASTE The cement paste specimens were cast in April 1977 and stored in saturated lime water in sealed jars until they were placed in the different types of water. During the 22 years, measurement of density of the specimens have been made 3 times; after 3 months, after 22 years - just before the specimens were transferred to the other water types, and finally immediately before measurement of ice formation in the low temperature calorimeter. The results are presented in table 7. Ice formation data is given in table 8. The last row, “Original”, is data from a 433 days old specimen, tested in 1978 [7].
0,00
0,05
0,10
0,15
0,20
0,25
0,30
0 10 20 30 40 50 60
No. of freeze/thaw cycles
Scalin
g [kg
/m2]
CBL BORÅS Demin.
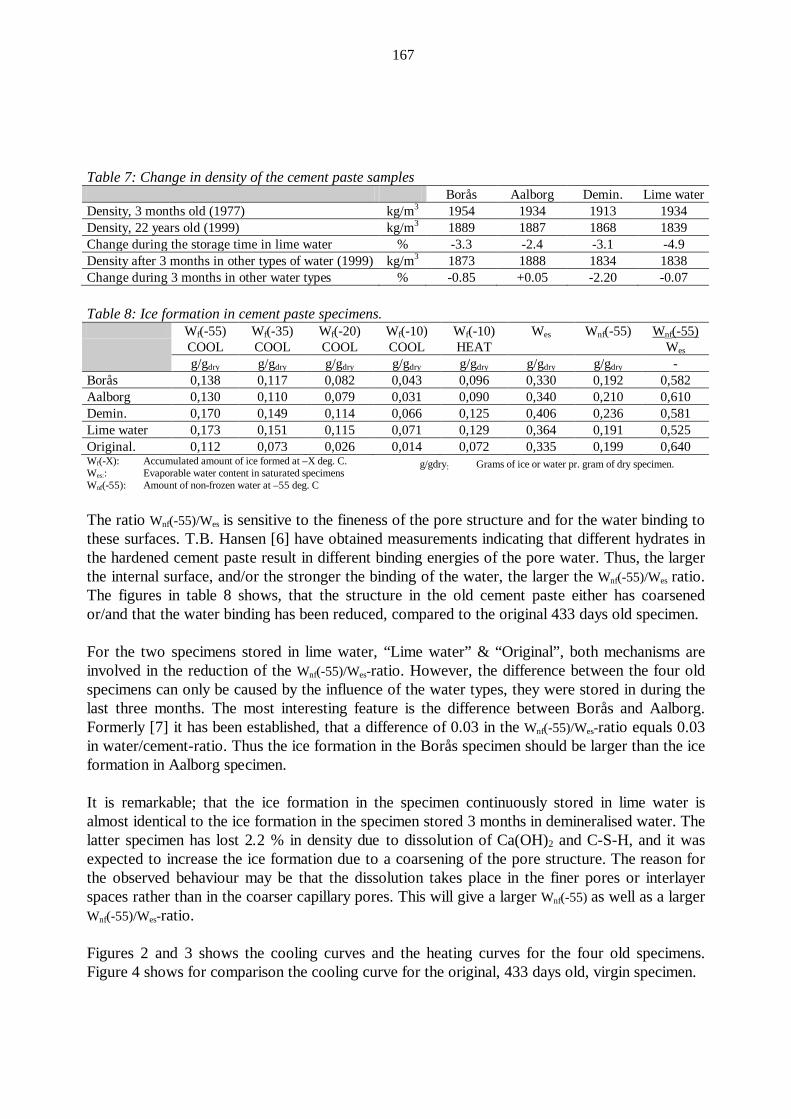
167
Table 7: Change in density of the cement paste samples Borås Aalborg Demin. Lime water Density, 3 months old (1977) kg/m3 1954 1934 1913 1934 Density, 22 years old (1999) kg/m3 1889 1887 1868 1839 Change during the storage time in lime water % -3.3 -2.4 -3.1 -4.9 Density after 3 months in other types of water (1999) kg/m3 1873 1888 1834 1838 Change during 3 months in other water types % -0.85 +0.05 -2.20 -0.07 Table 8: Ice formation in cement paste specimens. Wf(-55)
COOL Wf(-35) COOL
Wf(-20) COOL
Wf(-10) COOL
Wf(-10) HEAT
Wes Wnf(-55) Wnf(-55) Wes
g/gdry g/gdry g/gdry g/gdry g/gdry g/gdry g/gdry - Borås 0,138 0,117 0,082 0,043 0,096 0,330 0,192 0,582 Aalborg 0,130 0,110 0,079 0,031 0,090 0,340 0,210 0,610 Demin. 0,170 0,149 0,114 0,066 0,125 0,406 0,236 0,581 Lime water 0,173 0,151 0,115 0,071 0,129 0,364 0,191 0,525 Original. 0,112 0,073 0,026 0,014 0,072 0,335 0,199 0,640 Wf(-X): Accumulated amount of ice formed at –X deg. C. Wes:: Evaporable water content in saturated specimens Wnf(-55): Amount of non-frozen water at –55 deg. C
g/gdry: Grams of ice or water pr. gram of dry specimen.
The ratio Wnf(-55)/Wes is sensitive to the fineness of the pore structure and for the water binding to these surfaces. T.B. Hansen [6] have obtained measurements indicating that different hydrates in the hardened cement paste result in different binding energies of the pore water. Thus, the larger the internal surface, and/or the stronger the binding of the water, the larger the Wnf(-55)/Wes ratio. The figures in table 8 shows, that the structure in the old cement paste either has coarsened or/and that the water binding has been reduced, compared to the original 433 days old specimen. For the two specimens stored in lime water, “Lime water” & “Original”, both mechanisms are involved in the reduction of the Wnf(-55)/Wes-ratio. However, the difference between the four old specimens can only be caused by the influence of the water types, they were stored in during the last three months. The most interesting feature is the difference between Borås and Aalborg. Formerly [7] it has been established, that a difference of 0.03 in the Wnf(-55)/Wes-ratio equals 0.03 in water/cement-ratio. Thus the ice formation in the Borås specimen should be larger than the ice formation in Aalborg specimen. It is remarkable; that the ice formation in the specimen continuously stored in lime water is almost identical to the ice formation in the specimen stored 3 months in demineralised water. The latter specimen has lost 2.2 % in density due to dissolution of Ca(OH)2 and C-S-H, and it was expected to increase the ice formation due to a coarsening of the pore structure. The reason for the observed behaviour may be that the dissolution takes place in the finer pores or interlayer spaces rather than in the coarser capillary pores. This will give a larger Wnf(-55) as well as a larger Wnf(-55)/Wes-ratio. Figures 2 and 3 shows the cooling curves and the heating curves for the four old specimens. Figure 4 shows for comparison the cooling curve for the original, 433 days old, virgin specimen.
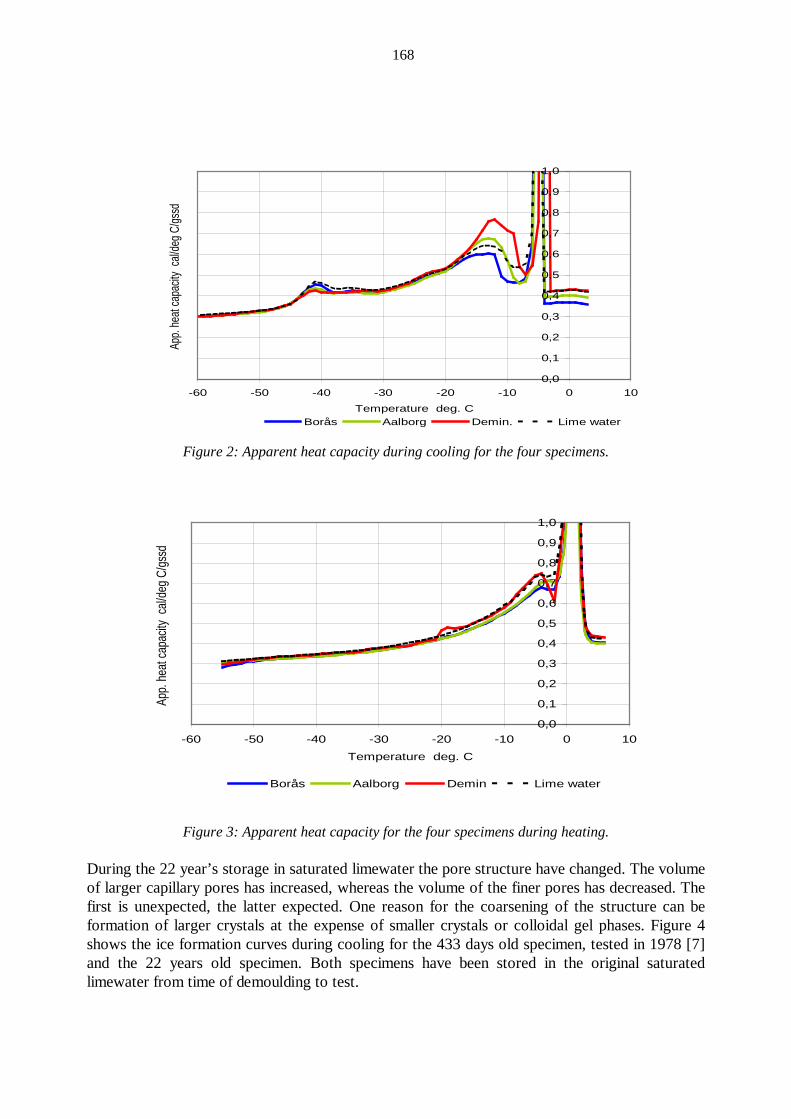
168
Figure 2: Apparent heat capacity during cooling for the four specimens.
Figure 3: Apparent heat capacity for the four specimens during heating.
During the 22 year’s storage in saturated limewater the pore structure have changed. The volume of larger capillary pores has increased, whereas the volume of the finer pores has decreased. The first is unexpected, the latter expected. One reason for the coarsening of the structure can be formation of larger crystals at the expense of smaller crystals or colloidal gel phases. Figure 4 shows the ice formation curves during cooling for the 433 days old specimen, tested in 1978 [7] and the 22 years old specimen. Both specimens have been stored in the original saturated limewater from time of demoulding to test.
0,0
0,1
0,2
0,3
0,4
0,5
0,6
0,7
0,8
0,9
1,0
-60 -50 -40 -30 -20 -10 0 10
Temperature deg. C
App.
heat
capa
city
cal/d
eg C
/gssd
Borås Aalborg Demin. Lime water
0,0
0,1
0,2
0,3
0,4
0,5
0,6
0,7
0,8
0,9
1,0
-60 -50 -40 -30 -20 -10 0 10
Temperature deg. C
App.
heat
capa
city
cal/d
eg C
/gssd
Borås Aalborg Demin Lime water
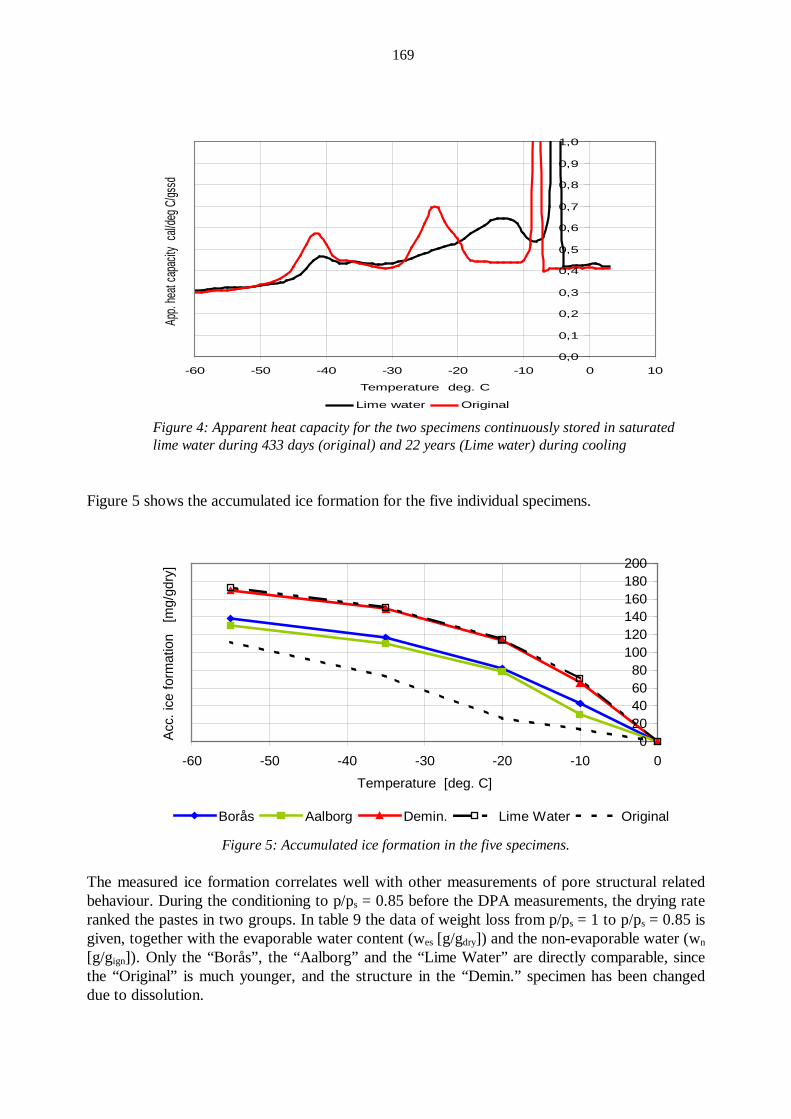
169
Figure 4: Apparent heat capacity for the two specimens continuously stored in saturated lime water during 433 days (original) and 22 years (Lime water) during cooling
Figure 5 shows the accumulated ice formation for the five individual specimens.
Figure 5: Accumulated ice formation in the five specimens.
The measured ice formation correlates well with other measurements of pore structural related behaviour. During the conditioning to p/ps = 0.85 before the DPA measurements, the drying rate ranked the pastes in two groups. In table 9 the data of weight loss from p/ps = 1 to p/ps = 0.85 is given, together with the evaporable water content (wes [g/gdry]) and the non-evaporable water (wn [g/gign]). Only the “Borås”, the “Aalborg” and the “Lime Water” are directly comparable, since the “Original” is much younger, and the structure in the “Demin.” specimen has been changed due to dissolution.
0,0
0,1
0,2
0,3
0,4
0,5
0,6
0,7
0,8
0,9
1,0
-60 -50 -40 -30 -20 -10 0 10
Temperature deg. C
App.
heat
capa
city
cal/d
eg C/
gssd
Lime water Original
020406080
100120140160180200
-60 -50 -40 -30 -20 -10 0
Temperature [deg. C]
Acc.
ice
form
atio
n [
mg/
gdry
]
Borås Aalborg Demin. Lime Water Original
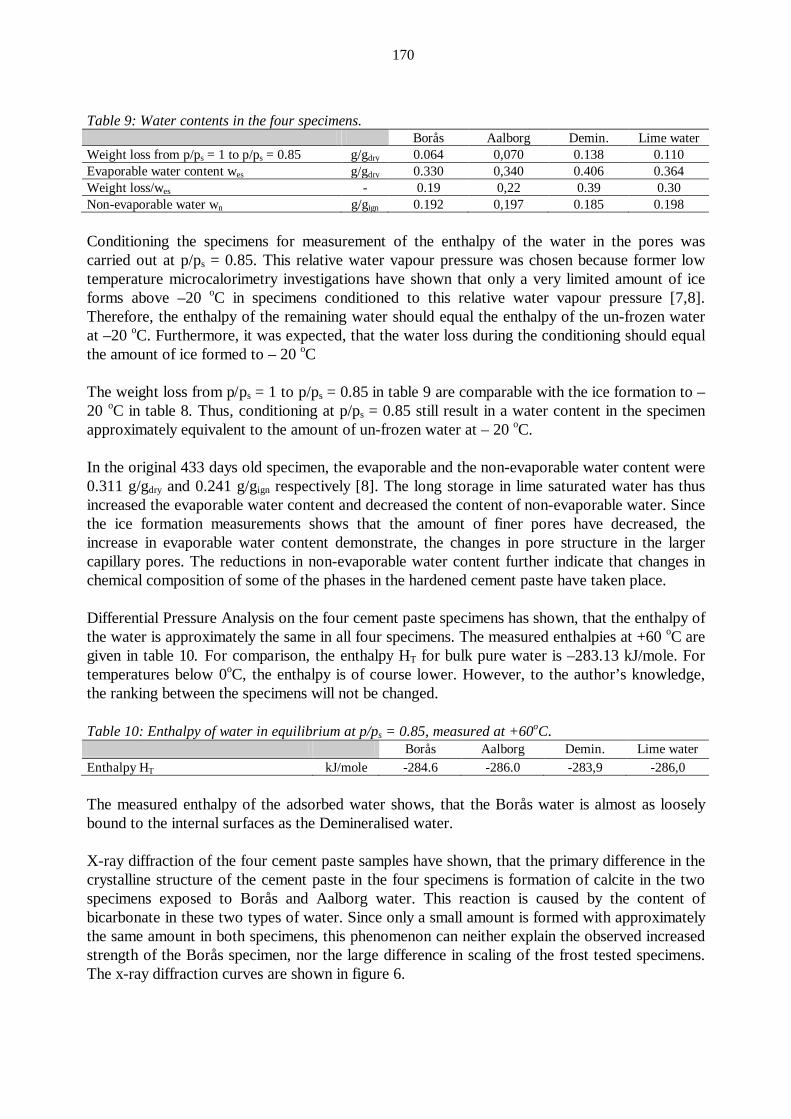
170
Table 9: Water contents in the four specimens. Borås Aalborg Demin. Lime water Weight loss from p/ps = 1 to p/ps = 0.85 g/gdry 0.064 0,070 0.138 0.110 Evaporable water content wes g/gdry 0.330 0,340 0.406 0.364 Weight loss/wes - 0.19 0,22 0.39 0.30 Non-evaporable water wn g/gign 0.192 0,197 0.185 0.198 Conditioning the specimens for measurement of the enthalpy of the water in the pores was carried out at p/ps = 0.85. This relative water vapour pressure was chosen because former low temperature microcalorimetry investigations have shown that only a very limited amount of ice forms above –20 oC in specimens conditioned to this relative water vapour pressure [7,8]. Therefore, the enthalpy of the remaining water should equal the enthalpy of the un-frozen water at –20 oC. Furthermore, it was expected, that the water loss during the conditioning should equal the amount of ice formed to – 20 oC The weight loss from p/ps = 1 to p/ps = 0.85 in table 9 are comparable with the ice formation to – 20 oC in table 8. Thus, conditioning at p/ps = 0.85 still result in a water content in the specimen approximately equivalent to the amount of un-frozen water at – 20 oC. In the original 433 days old specimen, the evaporable and the non-evaporable water content were 0.311 g/gdry and 0.241 g/gign respectively [8]. The long storage in lime saturated water has thus increased the evaporable water content and decreased the content of non-evaporable water. Since the ice formation measurements shows that the amount of finer pores have decreased, the increase in evaporable water content demonstrate, the changes in pore structure in the larger capillary pores. The reductions in non-evaporable water content further indicate that changes in chemical composition of some of the phases in the hardened cement paste have taken place. Differential Pressure Analysis on the four cement paste specimens has shown, that the enthalpy of the water is approximately the same in all four specimens. The measured enthalpies at +60 oC are given in table 10. For comparison, the enthalpy HT for bulk pure water is –283.13 kJ/mole. For temperatures below 0oC, the enthalpy is of course lower. However, to the author’s knowledge, the ranking between the specimens will not be changed. Table 10: Enthalpy of water in equilibrium at p/ps = 0.85, measured at +60oC. Borås Aalborg Demin. Lime water Enthalpy HT kJ/mole -284.6 -286.0 -283,9 -286,0 The measured enthalpy of the adsorbed water shows, that the Borås water is almost as loosely bound to the internal surfaces as the Demineralised water. X-ray diffraction of the four cement paste samples have shown, that the primary difference in the crystalline structure of the cement paste in the four specimens is formation of calcite in the two specimens exposed to Borås and Aalborg water. This reaction is caused by the content of bicarbonate in these two types of water. Since only a small amount is formed with approximately the same amount in both specimens, this phenomenon can neither explain the observed increased strength of the Borås specimen, nor the large difference in scaling of the frost tested specimens. The x-ray diffraction curves are shown in figure 6.
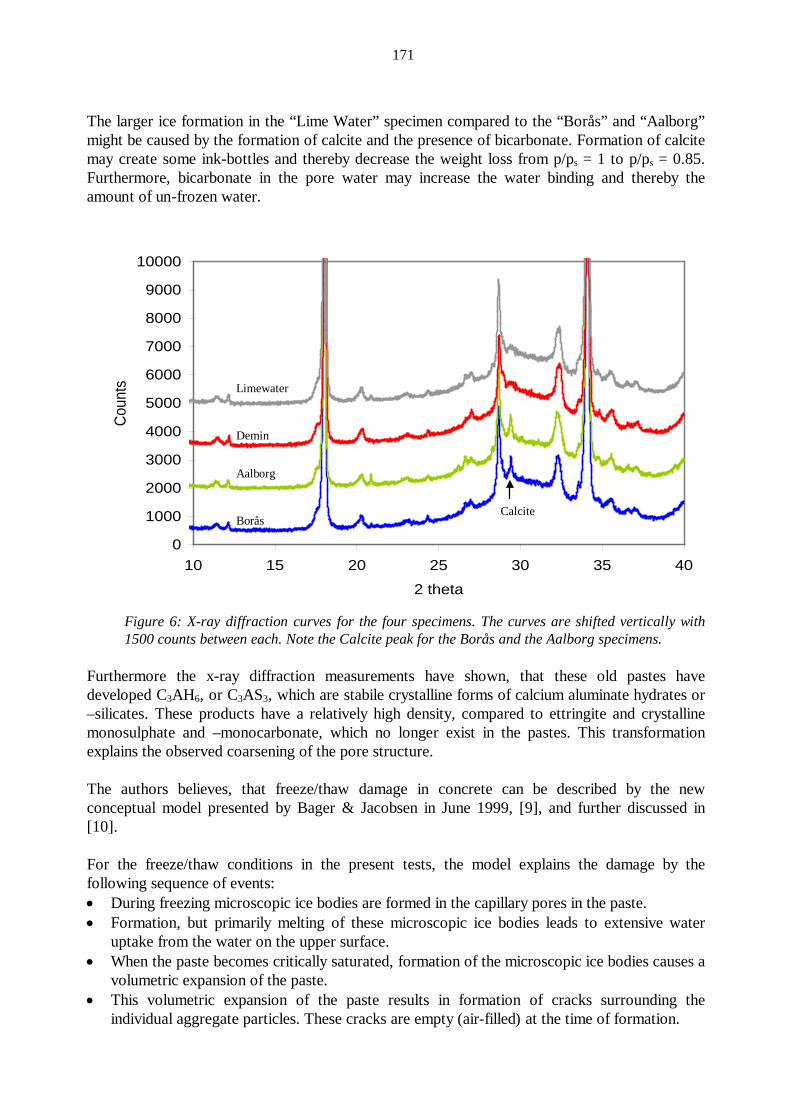
171
The larger ice formation in the “Lime Water” specimen compared to the “Borås” and “Aalborg” might be caused by the formation of calcite and the presence of bicarbonate. Formation of calcite may create some ink-bottles and thereby decrease the weight loss from p/ps = 1 to p/ps = 0.85. Furthermore, bicarbonate in the pore water may increase the water binding and thereby the amount of un-frozen water.
Figure 6: X-ray diffraction curves for the four specimens. The curves are shifted vertically with 1500 counts between each. Note the Calcite peak for the Borås and the Aalborg specimens.
Furthermore the x-ray diffraction measurements have shown, that these old pastes have developed C3AH6, or C3AS3, which are stabile crystalline forms of calcium aluminate hydrates or –silicates. These products have a relatively high density, compared to ettringite and crystalline monosulphate and –monocarbonate, which no longer exist in the pastes. This transformation explains the observed coarsening of the pore structure. The authors believes, that freeze/thaw damage in concrete can be described by the new conceptual model presented by Bager & Jacobsen in June 1999, [9], and further discussed in [10]. For the freeze/thaw conditions in the present tests, the model explains the damage by the following sequence of events: • During freezing microscopic ice bodies are formed in the capillary pores in the paste. • Formation, but primarily melting of these microscopic ice bodies leads to extensive water
uptake from the water on the upper surface. • When the paste becomes critically saturated, formation of the microscopic ice bodies causes a
volumetric expansion of the paste. • This volumetric expansion of the paste results in formation of cracks surrounding the
individual aggregate particles. These cracks are empty (air-filled) at the time of formation.
0
1000
2000
3000
4000
5000
6000
7000
8000
9000
10000
10 15 20 25 30 35 40
2 theta
Coun
ts Limewater
Demin
Aalborg
Borås Calcite
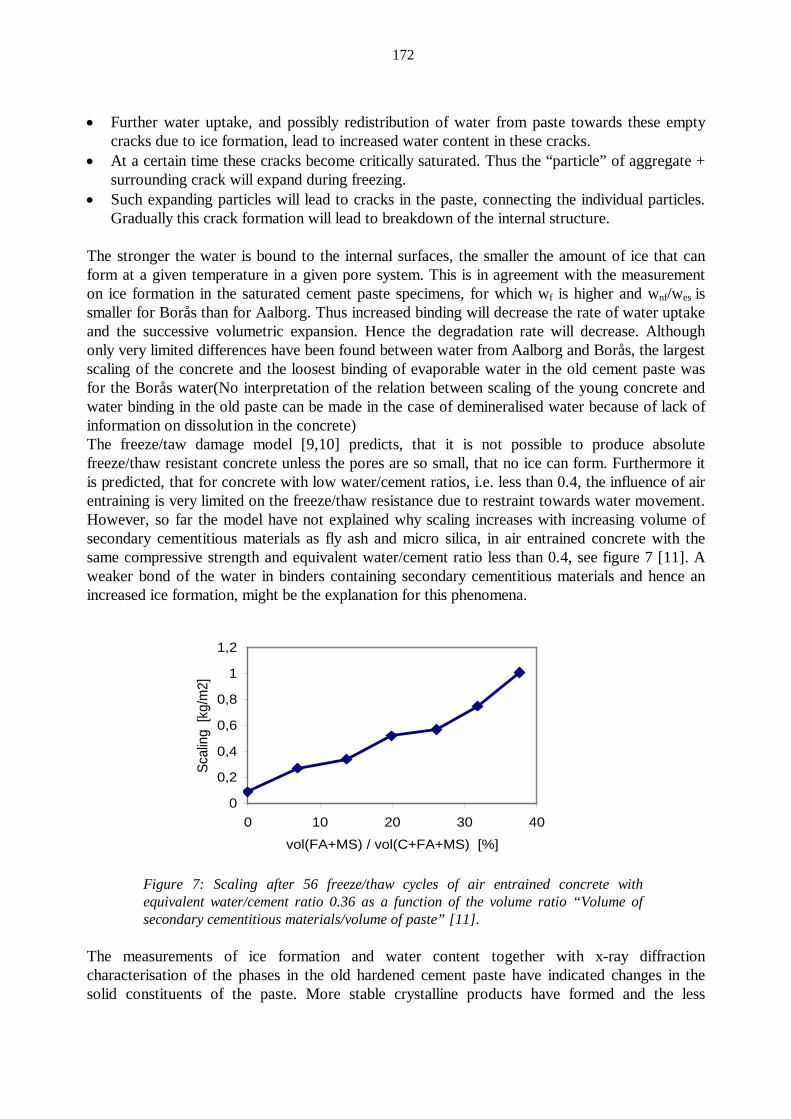
172
• Further water uptake, and possibly redistribution of water from paste towards these empty cracks due to ice formation, lead to increased water content in these cracks.
• At a certain time these cracks become critically saturated. Thus the “particle” of aggregate + surrounding crack will expand during freezing.
• Such expanding particles will lead to cracks in the paste, connecting the individual particles. Gradually this crack formation will lead to breakdown of the internal structure.
The stronger the water is bound to the internal surfaces, the smaller the amount of ice that can form at a given temperature in a given pore system. This is in agreement with the measurement on ice formation in the saturated cement paste specimens, for which wf is higher and wnf/wes is smaller for Borås than for Aalborg. Thus increased binding will decrease the rate of water uptake and the successive volumetric expansion. Hence the degradation rate will decrease. Although only very limited differences have been found between water from Aalborg and Borås, the largest scaling of the concrete and the loosest binding of evaporable water in the old cement paste was for the Borås water(No interpretation of the relation between scaling of the young concrete and water binding in the old paste can be made in the case of demineralised water because of lack of information on dissolution in the concrete) The freeze/taw damage model [9,10] predicts, that it is not possible to produce absolute freeze/thaw resistant concrete unless the pores are so small, that no ice can form. Furthermore it is predicted, that for concrete with low water/cement ratios, i.e. less than 0.4, the influence of air entraining is very limited on the freeze/thaw resistance due to restraint towards water movement. However, so far the model have not explained why scaling increases with increasing volume of secondary cementitious materials as fly ash and micro silica, in air entrained concrete with the same compressive strength and equivalent water/cement ratio less than 0.4, see figure 7 [11]. A weaker bond of the water in binders containing secondary cementitious materials and hence an increased ice formation, might be the explanation for this phenomena.
Figure 7: Scaling after 56 freeze/thaw cycles of air entrained concrete with equivalent water/cement ratio 0.36 as a function of the volume ratio “Volume of secondary cementitious materials/volume of paste” [11].
The measurements of ice formation and water content together with x-ray diffraction characterisation of the phases in the old hardened cement paste have indicated changes in the solid constituents of the paste. More stable crystalline products have formed and the less
0
0,2
0,4
0,6
0,8
1
1,2
0 10 20 30 40
vol(FA+MS) / vol(C+FA+MS) [%]
Scal
ing
[kg/
m2]
173
crystalline ettringite have disappeared as well as monosulphate and monocarbonate. These changes have lead to an increased volume of larger capillary pores. Finally it shall be mentioned, that the subjective measurement of increased strength and brittleness in mature water saturated hardened portland cement paste exposed to Borås water for only 3 months, can not be explained by any of the measurements carried out. Apparently, increased brittleness can not explain the increased scaling in the concrete tested with the Borås water. 5. CONCLUSIONS ♦ The experiments have verified that the type of water used for freeze/thaw test influence the
degree of damage significantly. ♦ Apparently, no single relation exists between single properties of the water, as for example
the degree of total hardness, and the degree of damage. ♦ Using water from Borås in freeze/thaw testing double the damage compared to samples
where water from Aalborg was used. ♦ Using the same types of water for mixing and storage of mortar bars do not influence the
strength. Apparently, chemical change in the microstructure is not the cause for the different freeze/thaw damage.
♦ X-ray diffractometry on very mature pure cement paste specimens have shown no difference between the two samples stored three months in Borås and Aalborg water.
♦ The binding of water from Borås is slightly less than the binding of water from Aalborg. This might increase the amount of ice formed in the saturated cement paste specimens using Borås water.
♦ The more loosely the water is bound to the internal surfaces, the larger the micro ice bodies can form. Hence, the looser the water is bound; the larger the suction of water from the surface during freeze/thaw testing. Therefore, concrete with loosely bound water will reach a critical degree of saturation earlier than concrete with water more strongly bound. In addition, suction might be further enlarged since water transport is easier in pores with loosely bound water. Such two concretes will probably reach the same degree of damage, although not after the same number of freeze/thaw cycles.
The performed experiments have demonstrated, that the influence of water binding in the pore system can have a marked influence on practical properties such as freeze/thaw resistance of concrete, as predicted by the freeze/thaw damage mechanism [9,10]. Hence, the influence on different cement- and binder types might be explained by the thermodynamic properties of the pore water, rather than by differences in the amount of various constituents in the cement or binder. It is most likely, that the understanding of other practical properties of microporous materials such as concrete can be improved when including the thermodynamic properties of the pore water. Therefore, study of thermodynamic properties of pore water should be given higher priority in future research.
174
6. REFERENCES 1 Stark, J., Ludwig, H.-M.: ”Influence of Water Quality on the Frost Resistance of
Concrete”. RILEM Proceeding No. 30 – ”Freeze-Thaw Durability of Concrete”, pp 157 – 164. Proceedings from the International Workshop on the Resistance of Concrete to Scaling due to Freezing in the Presence of De-icing Salts. Quebéc, Canada 1993.
2 Auberg, R.: “Zuverlässige Prüfung des Frost- und Frost-Tausalz-Widerstands von Beton mit dem CDF- und CIF-Test”. Ph.D. Thesis (In German), Universitet GH Essen, July 1998.
3 “Draft recommendations for test methods for the freeze/thaw resistance of concrete. Slab Test and Cube Test”., Materials and Structures 1995, vol. 28, p 366 – 371
4 le Sage de Fontenay, C., Sellevold, E.J.: “Ice Formation in Hardened Cement Paste - I. Mature Water-Saturated Pastes”. Durability of Building Materials and Components, ASTM STP 691, 1980.
5 Bager, D.H., Sellevold, E.J.: “Ice Formation in Hardened Cement Paste - II. Steam Cured Pastes with Variable Moisture Contents”. Durability of Building Materials and Components, ASTM STP 691, 1980
6 Hansen, T.B.: “Physical and Thermodynamical Properties of Water Phases in Hardening Cement Paste”, Ibid.
7 Bager, D.H., Sellevold, E.J.: “Ice Formation in Hardened Cement Paste, Part I – Room Temperature Cured Pastes with Variable Moisture Contents”. Cement and Concrete Research. Vol. 16, pp. 709 – 720, 1986.
8 Bager, D.H., Sellevold, E.J.: “Ice Formation in Hardened Cement Paste, Part III – Slow Resaturation of Room Temperature Cured Pastes”. Cement and Concrete Research Vol. 17, pp 1 -11, 1987
9 Bager, D.H., Jacobsen, S.: “A Model for the Freeze/thaw Damage Mechanism in Concrete”. Proceedings from Minneapolis Workshop on Freeze/thaw Damage in Concrete. Minneapolis, Minnesota, USA, June 1999. (To be published as a RILEM publication)
10 Bager, D.H., Jacobsen, S.: “A Conceptual Model for the Freeze-Thaw Damage of Concrete”. Proceedings from the 3rd Nordic Research Seminar on Frost Resistance of Building Materials. Lund 31. August – 1. September 1999. Report TVBM-3087, Lund Institute of Technology, Division of Building Materials..
11 Bager, D.H., Sørensen, B.I.: Unpublished data 1998
175
STABILITY OF PORE SIZE DISTRIBUTION IN AIR-ENTRAINED CONCRETE SUB-JECTED TO PUMPING
Tommy B. Hansen M.Sc., Industrial Ph.D. Student Aalborg Portland A/S Rørdalsvej 44, P.O Box 165, DK-9100 Aalborg E-mail: [email protected] ABSTRACT To estimate the effect of selected physical factors on the retained air-pore size distribution in air-entrained concrete subjected to pumping, an experimental study has been conducted. The experi-ments includes measuring the air-pore size distribution in fresh con-crete using a so called "bubble-apparatus" in addition to measuring total air content and workability on fresh concrete, as well as struc-tural analysis and freeze-thaw testing on hardened concrete. The concrete was subjected to different treatments, both prior to and af-ter pumping. The preliminary finding is, that the handling of air-entrained concrete prior to pumping is at least as important to the re-tained air structure as the pumping itself. Key words: Air pores, Size distribution, Stability, Pumping, Affect-
ing factors, Freeze-thaw resistance. 1. INTRODUCTION Due to demands in building codes and standards regarding frost resistance of concrete, demands are placed on ready-mix suppliers to deliver concrete that will meet specifications to air-pore spacing in the hardened concrete. Due to the pressurisation during pumping, some of the en-trained air bubbles will dissolve into the water in the fresh concrete1. When the pressure is low-ered again after pumping the released gas has a tendency to form fewer and larger bubbles in the system. This reduces the proximity of the bubbles and hence increases the risk that the concrete will fail to resist freezing and to meet the specifications, once hardened. For the ready-mix sup-plier there are two options: To increase the amount or type of air entrainment agent in the con-crete to compensate for the expected loss, or, to decrease pumping pressure reducing the impact on the air-pore structure. The former has only limited effect on the smaller bubbles and the "spacing factor"2,3, and the latter may not be possible for practical reasons. So, even though conventionally placed and compacted concrete usually retains a sufficient content of small air bubbles3, the same concrete types subjected to pumping may not. The basis for the present work is the hypothesis, that an improvement in retained air-pore struc-ture may be reached, if the solubility of the used air entrainment gas is reduced, by using a con-crete facilitating a strong binding of the evaporable water even in the fresh state. This will, in principle, increase the amount of gas that will stay in a gaseous state throughout the pumping. Unfortunately, the smallest air-pores that are the most desirable, are also the ones most vulner-able, and should be expected to disappear anyway. So the first part of the work is to establish the
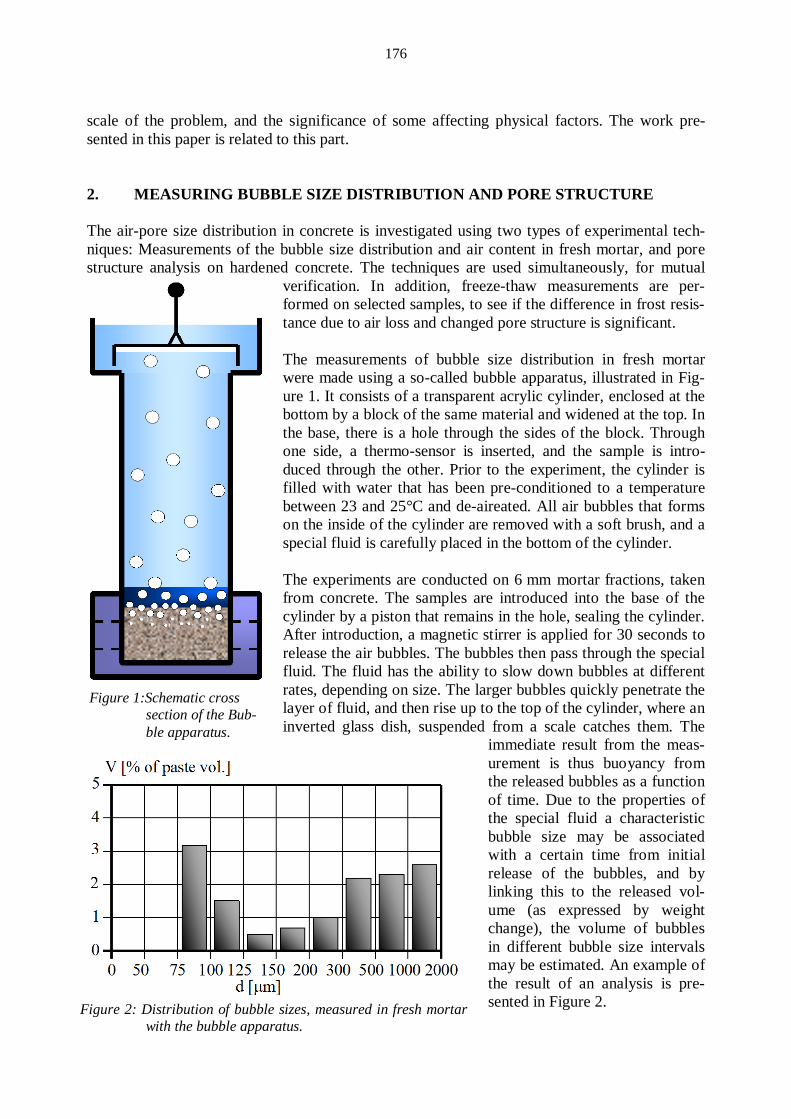
176
scale of the problem, and the significance of some affecting physical factors. The work pre-sented in this paper is related to this part. 2. MEASURING BUBBLE SIZE DISTRIBUTION AND PORE STRUCTURE The air-pore size distribution in concrete is investigated using two types of experimental tech-niques: Measurements of the bubble size distribution and air content in fresh mortar, and pore structure analysis on hardened concrete. The techniques are used simultaneously, for mutual
verification. In addition, freeze-thaw measurements are per-formed on selected samples, to see if the difference in frost resis-tance due to air loss and changed pore structure is significant. The measurements of bubble size distribution in fresh mortar were made using a so-called bubble apparatus, illustrated in Fig-ure 1. It consists of a transparent acrylic cylinder, enclosed at the bottom by a block of the same material and widened at the top. In the base, there is a hole through the sides of the block. Through one side, a thermo-sensor is inserted, and the sample is intro-duced through the other. Prior to the experiment, the cylinder is filled with water that has been pre-conditioned to a temperature between 23 and 25°C and de-aireated. All air bubbles that forms on the inside of the cylinder are removed with a soft brush, and a special fluid is carefully placed in the bottom of the cylinder. The experiments are conducted on 6 mm mortar fractions, taken from concrete. The samples are introduced into the base of the cylinder by a piston that remains in the hole, sealing the cylinder. After introduction, a magnetic stirrer is applied for 30 seconds to release the air bubbles. The bubbles then pass through the special fluid. The fluid has the ability to slow down bubbles at different rates, depending on size. The larger bubbles quickly penetrate the layer of fluid, and then rise up to the top of the cylinder, where an inverted glass dish, suspended from a scale catches them. The
immediate result from the meas-urement is thus buoyancy from the released bubbles as a function of time. Due to the properties of the special fluid a characteristic bubble size may be associated with a certain time from initial release of the bubbles, and by linking this to the released vol-ume (as expressed by weight change), the volume of bubbles in different bubble size intervals may be estimated. An example of the result of an analysis is pre-sented in Figure 2.
Figure 1:Schematic cross section of the Bub-ble apparatus.
Figure 2: Distribution of bubble sizes, measured in fresh mortar
with the bubble apparatus.
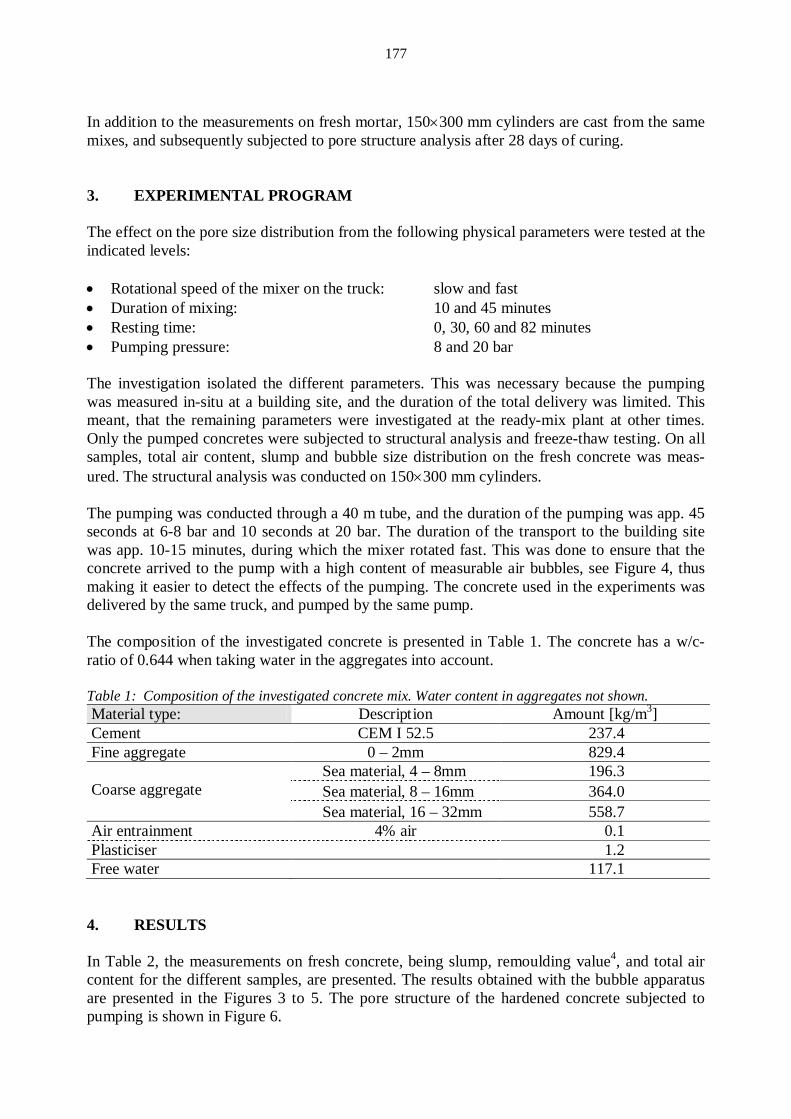
177
In addition to the measurements on fresh mortar, 150×300 mm cylinders are cast from the same mixes, and subsequently subjected to pore structure analysis after 28 days of curing. 3. EXPERIMENTAL PROGRAM The effect on the pore size distribution from the following physical parameters were tested at the indicated levels: • Rotational speed of the mixer on the truck: slow and fast • Duration of mixing: 10 and 45 minutes • Resting time: 0, 30, 60 and 82 minutes • Pumping pressure: 8 and 20 bar The investigation isolated the different parameters. This was necessary because the pumping was measured in-situ at a building site, and the duration of the total delivery was limited. This meant, that the remaining parameters were investigated at the ready-mix plant at other times. Only the pumped concretes were subjected to structural analysis and freeze-thaw testing. On all samples, total air content, slump and bubble size distribution on the fresh concrete was meas-ured. The structural analysis was conducted on 150×300 mm cylinders. The pumping was conducted through a 40 m tube, and the duration of the pumping was app. 45 seconds at 6-8 bar and 10 seconds at 20 bar. The duration of the transport to the building site was app. 10-15 minutes, during which the mixer rotated fast. This was done to ensure that the concrete arrived to the pump with a high content of measurable air bubbles, see Figure 4, thus making it easier to detect the effects of the pumping. The concrete used in the experiments was delivered by the same truck, and pumped by the same pump. The composition of the investigated concrete is presented in Table 1. The concrete has a w/c-ratio of 0.644 when taking water in the aggregates into account. Table 1: Composition of the investigated concrete mix. Water content in aggregates not shown. Material type: Description Amount [kg/m3] Cement CEM I 52.5 237.4 Fine aggregate 0 – 2mm 829.4 Coarse aggregate
Sea material, 4 – 8mm 196.3 Sea material, 8 – 16mm 364.0 Sea material, 16 – 32mm 558.7
Air entrainment 4% air 0.1 Plasticiser 1.2 Free water 117.1
4. RESULTS In Table 2, the measurements on fresh concrete, being slump, remoulding value4, and total air content for the different samples, are presented. The results obtained with the bubble apparatus are presented in the Figures 3 to 5. The pore structure of the hardened concrete subjected to pumping is shown in Figure 6.

178
Table 2: Results from measurements on fresh concrete. Remoulding figures measured according to SS
1371304. Treatment Duration
[min] Total air content
[%] Slump [mm]
Remoulding [strokes]
None 0 4.7 120 12 None 30 4.7 130 17 None 60 4.0 80 28 None 82 4.6 90 22 Slow rotation 10 4.0 90 16 Slow rotation 45 3.8 80 12 Fast rotation 10 4.2 90 14 Fast rotation 45 4.4 60 22 Pumping, 8 bar, rest: 0 4.0 70 11 Pumping, 6 bar, rest: 30 3.8 60 14 Pumping, 20 bar, rest: 0 3.3 50 9
Figure 3: Influence of resting time on accumulated bubble size distribution in fresh mortar, measured
with the bubble apparatus.

179
100 10000
2
4
6
8
10
Bubble size [µm]
Air volume in paste [%]
10 min/slow
10 min/fast
45 min/slow
45 min/fast
2000500
Figure 4: Effect of treatment prior to pumping on accumulated bubble size distribution in fresh mortar,
measured with the bubble apparatus.
100 10000
2
4
6
8
10
12
14
Bubble size [µm]
Air volume in paste [%]
2000500
8 bar/0 min. 6 bar/30 min. 20 bar/0 min. 0 bar/60 min.
Figure 5: Effect of pumping on accumulated bubble size distribution in fresh mortar, measured with the
bubble apparatus. Result from 0 bar/60 minutes shown for comparison.
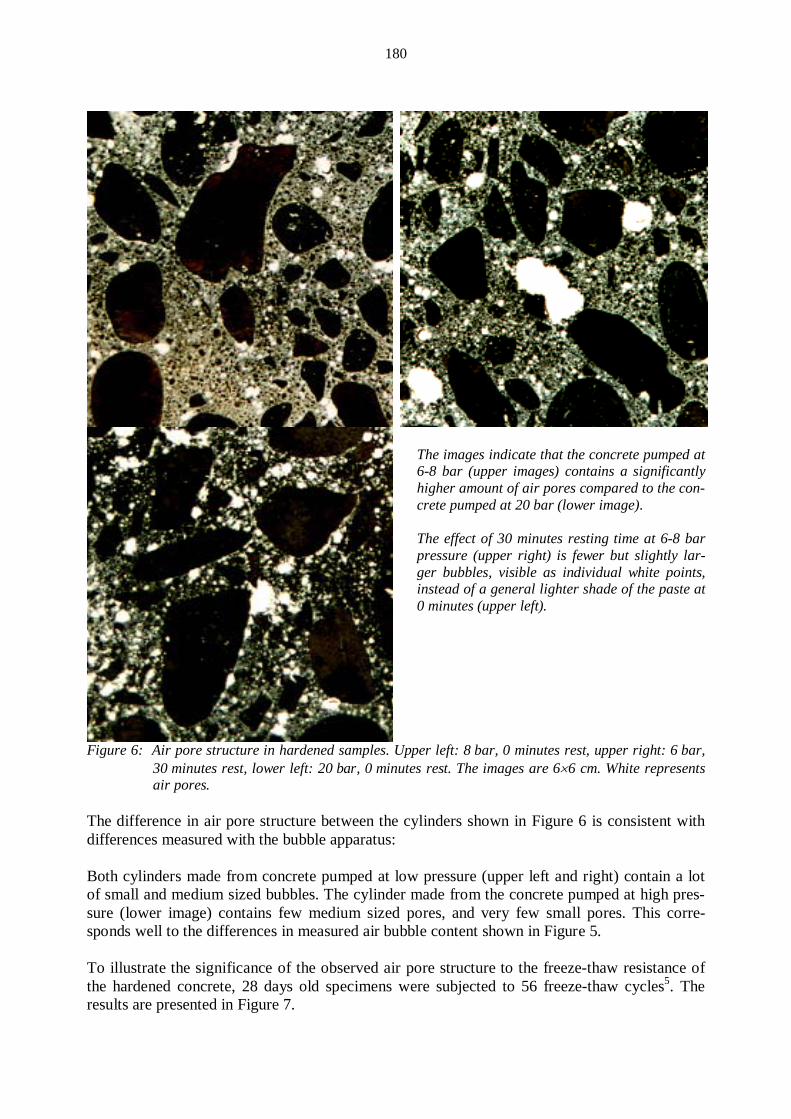
180
The images indicate that the concrete pumped at 6-8 bar (upper images) contains a significantly higher amount of air pores compared to the con-crete pumped at 20 bar (lower image). The effect of 30 minutes resting time at 6-8 bar pressure (upper right) is fewer but slightly lar-ger bubbles, visible as individual white points, instead of a general lighter shade of the paste at 0 minutes (upper left).
Figure 6: Air pore structure in hardened samples. Upper left: 8 bar, 0 minutes rest, upper right: 6 bar, 30 minutes rest, lower left: 20 bar, 0 minutes rest. The images are 6×6 cm. White represents air pores.
The difference in air pore structure between the cylinders shown in Figure 6 is consistent with differences measured with the bubble apparatus: Both cylinders made from concrete pumped at low pressure (upper left and right) contain a lot of small and medium sized bubbles. The cylinder made from the concrete pumped at high pres-sure (lower image) contains few medium sized pores, and very few small pores. This corre-sponds well to the differences in measured air bubble content shown in Figure 5. To illustrate the significance of the observed air pore structure to the freeze-thaw resistance of the hardened concrete, 28 days old specimens were subjected to 56 freeze-thaw cycles5. The results are presented in Figure 7.
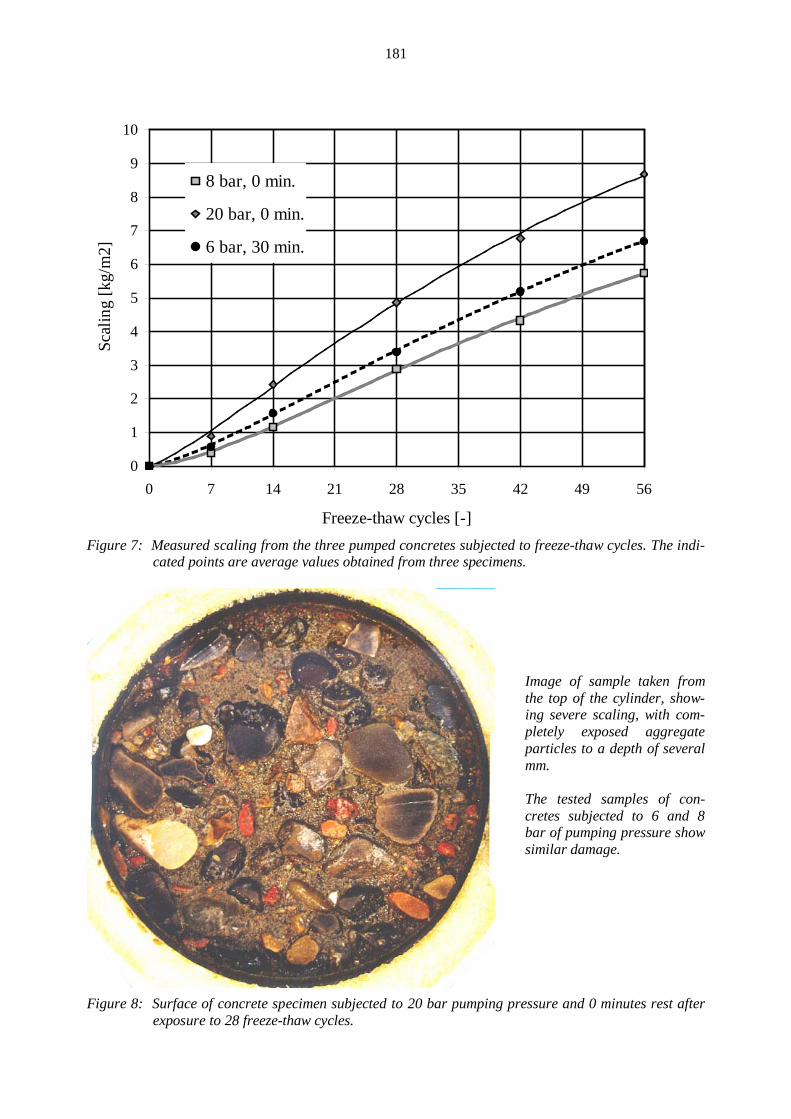
181
0
1
2
3
4
5
6
7
8
9
10
0 7 14 21 28 35 42 49 56
Freeze-thaw cycles [-]
Scal
ing
[kg/
m2]
8 bar, 0 min.
20 bar, 0 min.
6 bar, 30 min.
Figure 7: Measured scaling from the three pumped concretes subjected to freeze-thaw cycles. The indi-
cated points are average values obtained from three specimens.
Image of sample taken from the top of the cylinder, show-ing severe scaling, with com-pletely exposed aggregate particles to a depth of several mm. The tested samples of con-cretes subjected to 6 and 8 bar of pumping pressure show similar damage.
Figure 8: Surface of concrete specimen subjected to 20 bar pumping pressure and 0 minutes rest after exposure to 28 freeze-thaw cycles.
182
The indications from the freeze-thaw experiments support the general observations from the measurements with the bubble apparatus and the observed pore structure in the hardened con-crete. However, the concrete subjected to 6 bar and 30 minutes rest has a larger scaling than the one subjected to 8 bar and no rest, despite the fact, that the former contains a larger number of "small" air bubbles according to the bubble apparatus. This apparent discrepancy is due to the limited bubble size ranging measurable with the bubble apparatus: Bubbles smaller than 75µm are, for some unknown reason, not registered, leading to the false impression that the sample taken after 8 bar pressure and 0 minutes rest contains very few small bubbles, when it, as indicated by Figure 6, actually contains a significant number of these. As the bubbles with time are redistributed, the number of medium sized bubbles measurable by the bubble apparatus increases, giving the impression that the number of "small" bubbles increases. These medium sized bubbles offer less protection against freeze-thaw related damage, as is ob-served. As Figure 7 and 8 indicate, the investigated concrete was severely damaged from the freeze-thaw cycles. This was anticipated since the concrete was not designed to be frost resistant. 5. DISCUSSION The results presented in this paper are based on only a few measurements and a single pumping set-up, and this should be taken into account in the interpretation. However, the results are only intended to indicate whether any differences can be detected, and if so, which of the investigated factors are of importance. A more elaborate investigation will be undertaken shortly, based on these preliminary findings. 5.1 Bubble size distribution in fresh concrete The results from measurements of bubble size distribution in fresh mortar indicates: • Total air content is observed to vary more or less opposite to the medium sized air-pore
structure in the paste. • Given rest, medium sized air bubbles [75 µm to 2000 µm] forms up till approximately one
hour after mixing. Then the content of these bubbles reduces again. • When stirred, the bubble size distribution is highly dependent on how fast and how long the
concrete is rotated. In addition, it has been observed (outside this investigation6) that differ-ent concrete trucks affect the concrete differently.
• Pumping pressure must exceed 6-8 bar of pressure (in the concrete), before noticeable ef-fects on the bubble size distribution, as measured with the bubble apparatus, can be seen. Af-ter pumping at 6-8 bar, resting still appears to increase the number of medium sized bubbles.
The measured changes in bubble size distribution correspond well to the expected behaviour, when taking the limited range of the bubble apparatus into account, as described in chapter 4. The mechanism involved is diffusion of dissolved gas from smaller to larger bubbles through the fluid phases in the fresh concrete1. The driving force in this diffusion is differences in con-centration of dissolved gas at the immediate surfaces of the bubbles, caused by differences in bubble pressure. The bubble pressure is described through the following relation1:
183
hydpd
p +=γ4 (1)
Where:
γ is the surface tension of the water phase in plastic concrete [N/m] d is the diameter of the bubble [m] phyd is the hydrostatic pressure in the water phase of the concrete [Pa]
From this pressure, the amount of dissolved gas at the bubble surface may be calculated from1:
KpX = (2)
Where: X is the mole fraction of dissolved gas in the water phase of the concrete [-] K is the constant from Henry's law (5.75⋅107 for N2 and 2.95⋅107 for O2 at 20°C)
Using these relations it is obvious, that the lager the difference in bubble diameter, the larger the difference in concentration very close to the bubble surface, and hence the grater the potential for diffusion from the smaller bubble towards the larger. So, with time, smaller bubbles should be expected to transfer gas to larger bubbles, resulting in a continuing redistribution towards fewer larger bubbles, as is observed. In addition, the larger bubbles have a tendency to escape from the concrete altogether, resulting in a reduced total air content, as is observed. This ten-dency is also observed up to one hour after mixing, but is then reversed. This increased total air content needs further verification. Regarding the measurement of air bubble distribution in concrete it must be concluded from the results, that the area of interest, bubbles smaller than 75 µm, cannot presently be investigated by other means than structural analysis. Since this is an expensive and time-consuming task, work has been undertaken to develop a numerical program, with the purpose of simulating the redis-tribution process, by calculating the diffusion of gas between bubbles according to the above mentioned relations. In order to calibrate this program, a "pumping simulator" is also being de-veloped, to study the kinetics of the dissolution process in fresh concrete being "pumped" at isobaric conditions, at pressures up to 10 bar. 5.2 Workability of fresh concrete Measurement of workability has indicated the following: • Total air content and workability relates well. • Combined with the results on bubble size distribution it is indicated, that an increased con-
tent of medium sized air bubbles, and hence a corresponding reduction in the content of smaller bubbles, reduces the workability. This is most distinctly visualised when combining the results from the remoulding tests and the bubble apparatus.
The results indicate that bubbles smaller than some characteristic size (less than 75 µm in di-ameter) increases the concretes ability to flow, or, that the content of medium sized bubbles has the opposite effect.
184
However, the results from the stirred concrete yield the opposite result. Assuming this is caused by variations in the not-registered amount of smaller bubbles, the results indicate that the sam-ples containing the highest amount of medium sized pores after being stirred in the truck (10 minutes/fast and 45 minutes/slow) also contains more small air bubbles. This suggests that some intermediate level of stirring is favourable to the air content in general, for the considered concrete mix. 5.3 Analysis on hardened concrete Structural analysis and measurement from freeze thaw experiments indicates the following: • There is acceptable correlation between measured bubble size distribution in fresh mortar,
the observed physical structure of the hardened concrete and the results from the freeze-thaw testing.
• The freeze-thaw resistance primarily depends on the content of bubbles smaller than 75 µm. These results verify that only the smallest bubbles contribute to the freeze-thaw resistance of the concrete. In addition it is indicated that the retained air bubble size distribution in the hardened concrete is dependent primarily on concrete composition and the initial treatment of the concrete (the stir-ring), and to a lesser extend on the subsequent time spent in the mould. This greatly accentuates the importance of determining the method of pre-pumping treatment least harmful to the con-cretes inherent content of small air bubbles, and, to pump at low pressure when pumping cannot be avoided. 6. CONCLUSION In the conducted investigation, the following has been demonstrated • Increasing pumping pressure reduces the amount of small air bubbles and the frost resistance
of the considered concrete significantly. • Initial treatment (rotational speed of the mixer on the truck and the duration of the mixing) is
of major importance to the retained air-pore structure in the considered concrete, and is at least as significant as pumping it self.
• The time from completed moulding to initial setting (resting time) is also important to the retained air bubble size distribution.
• The bubble apparatus is insufficient to describe the changes in retained air bubble size dis-tribution in fresh concrete by it self, but may be used to supplement other experimental tech-niques, primarily structural analysis.
For the ready-mix industry two major tasks can be identified as a result of these conclusions, if they wish to be able to control the number of small beneficial air bubbles in the concrete: 1. The pre-pumping handling of the fresh concrete must be performed in such a way that the
damage to the air bubble size distribution prior to delivery is minimised.
185
2. Pumping must be conducted at the lowest possible pressure, and for the shortest duration possible.
The first task is rather difficult to carry out in reality, because it presumes that the "least damag-ing way" of handling the concrete is known. This will most likely not be the case, and a struc-tured analysis of different handling methods will therefor be required, costing valuable time and money. The second task is also problematic. Firstly because there are geometrical restraints to a delivery determining the length of the tube, and the minimum pressure that will transport the concrete to the end of the tube. Secondly because only an increased pumping pressure will reduce the dura-tion of the pumping for a fixed tube length. Thus, it may be possible to deliver concrete meeting specifications under a set of normally used conditions, but when altering any of these conditions or the demands, a simple, but presently unavailable method to determine the required changes, either to the concrete or the procedure, is needed. Hence combining changing demands to air bubble size distribution and the necessity for pumping the concrete constitutes a task that it is presently difficult to control efficiently for the ready mix industry. 7. ACKNOWLEDGEMENTS The present work was conducted as part of an industrial Ph.D. program under the Academy of Technical Sciences, ATV. Furthermore thanks are due to Laboratory Assistant Carsten Ottesen, Unicon Beton a/s, Aalborg dept., for assistance with the experiments. 8. REFERENCES 1 Mielenz, R.C. et. al.: "Origin, Evolution, and Effects of the Air Void System in Con-
crete. Part 1 – Entrained Air in Unhardened Concrete", ACI journal Vol. 30, No. 1, July 1958.
2 Mielenz, R.C. et. al.: "Origin, Evolution, and Effects of the Air Void System in Con-crete. Part 2 – Influence of Type and Amount of Air-Entraining Agent", ACI journal Vol. 30, No. 1, July 1958.
3 Mielenz, R.C. et. al.: "Origin, Evolution, and Effects of the Air Void System in Con-crete. Part 3 – Influence of Water-Cement Ratio and Compaction", ACI journal Vol. 30, No. 1, July 1958.
4 SS 13 71 30, "Description of remoulding-meter" (in Swedish), Swedish Standards Insti-tution, 1999.
5 SS 13 72 44, "Testing of concrete – Hardened concrete – Scaling at freezing", Swedish Standards Institution, 1995.
6 Informal information, Unicon Beton a/s, Aalborg dept.

186
187
CTS – A NEW EXPERIMENTAL TECHNIQUE TO MAP ICE FORMATION
Marianne Tange Jepsen M.Sc. Concrete Centre, Danish Technological Institute Gregersensvej, P.O. Box 141, DK-2630 Taastrup, Denmark E-mail: [email protected]
ABSTRACT
It is troublesome to prove if a specified concrete composition leads to frost resistant concrete because of the lack of a suitable theoretical or numerical model to calculate the response of the concrete to frost attack. The main point of the Ph.D. project Frost Induced Transport of Salts in Concrete is to improve the theo-retical background by investigating the interaction of salt trans-port and ice formation in freezing concrete. One of the important issues is the development of a method to observe the ice forma-tion in hardened cement paste or concrete, the so-called continu-ous temperature scanning technique. Keywords: Frost resistance, ice formation, salt transport, con-tinuous temperature scanning (CTS).
1. INTRODUCTION In a cold climate, the frost resistance is a factor of great importance for the length of the service life of a concrete structure, but at the same time it is a very uncertain factor. The national code of practice for concrete for construction gives some guidelines on how to attain frost resistant concrete, which summarises the knowledge gained through experience with conventional con-crete [1]. In Denmark it offers the person responsible for the choice of concrete mix design two options: He can make sure that the concrete fulfils some empirical and rather rigid rules or he can exceed the prescribed limits, but then he has to prove the frost resistance experimentally [2]. The latter means a long-winded and expensive series of laboratory tests. This procedure makes it difficult to optimise the concrete for a special purpose. At the same time it is a barrier for intro-ducing new types of concrete, because the limits in the code might be misleading for a type of concrete, which differs from conventional concrete. If the laboratory testing could be replaced by a theoretical or numerical tool to predict the frost resistance, the situation would be improved. Several theories have been put forth to explain the mechanisms of frost deterioration, but none of them quantifies the processes and thereby makes the engineer capable of calculating whether a concrete with a specified composition is frost re-sistant or not. 2. THE SCOPE OF THE PRESENT PH.D. PROJECT January 1999 a three year Ph.D. study was started. The title is Frost Induced Transport of Salts in Concrete, and the project is a cooperation between the Concrete Centre, Danish Technologi-

188
cal Institute, and the Department of Building Technology and Structural Engineering, Aalborg University. The main objective of the project is to investigate the interaction of salts and ice formation in freezing concrete from a thermodynamic point of view. The pore solution contains a number of soluble salts, both salts released during the cement hydration (e.g. Na2O, K2O and Ca(OH)2) and salts supplied from the surroundings, for instance de-icing chemicals (e.g. NaCl and CaCl2), but most of the earlier theories proposed ignore this fact. Knowledge of the influ-ence of salt transport on ice formation and vice versa is necessary, before the theories can be converted to calculation tools of practical use. The subject will be investigated theoretically as well as experimentally. The theoretical study will be concentrated on the thermodynamic phase equilibriums, which are established when ice is formed in a salt solution. Experimentally the focus will be on the dynamic and stochastic na-ture of the ice nucleation as well as on mapping the changes in salt concentration profiles when a test specimen is exposed to a saline environment combined with a cyclic freeze-thaw load. 3. CONTINUOUS TEMPERATURE SCANNING The aim of the experimental investigations requires that the distribution of salts and moisture in a cement paste or concrete can be determined and the ice formation mapped, so these parameters can be compared at various stages during a freeze-thaw cycle and after different numbers of cycles. Methods to determine water contents (chemically bounded, adsorbed and free capillary water) and salt profiles are well known. But a new method is needed to follow the formation of ice in a specimen. Therefore, the first step of the project is to develop such a method. 3.1 Experimental set-up It is believed that a method to map ice formation can be based on a principle of continuous tem-perature scanning (CTS), which is explained below. The demand on an experimental set-up is that it can register the temperature profile in a test specimen at short intervals. The test specimen and the experimental set-up are shown in figure 1.
Figure 1: Left: Test specimens of cement paste. Right: Experimental set-up. (a) Insulated box with test specimen inside. (b) Linear actuator and movable thermo sensor. (c) Container. (d) Thermo bath.

189
The test specimen is a cylinder of hardened cement paste or concrete with a narrow passage in the middle. In specimens of cement paste this is simply a glass tube (inner diameter ~1 mm), which is placed in the mould before the specimen is cast. The test specimen is covered with an insulating and watertight material on all sides except at the end surfaces to ensure one-dimensional moisture and heat flow. The specimen is placed in a container, so the surface is in contact with air, pure water or a salt solution and the container is then placed in a thermo bath in order to control the boundary condi-tions. During the experiment, the temperature is kept above zero at the top of the specimen, while the bottom surface is exposed to predefined freeze-thaw cycles. A thermo sensor (a copper-constantan thermo couple, diameter 0,025 mm) is placed in the pas-sage in the specimen. During the test a linear actuator moves the thermo sensor back and forth, so the temperature profile is registered. Data are collected by a Campbell Scientific CR10X unit. 3.2 The CTS principle The CTS principle to detect ice formation is actually quite simple: When water is transformed into ice, it releases energy (heat of fusion) and in a super-cooled pore solution local heating will occur, causing a local maximum on the temperature profile. By continuous registration of the temperature profile in a test specimen exposed to frost load, it is possible to trace the heat re-lease or, which is the same, when and where the ice is formed. The measurements of when and where ice is formed can be supplemented by quantitative meas-urements of ice formation with low temperature calorimetry. 4. EXPECTED RESULTS The status so far is that the mechanical parts and the control unit are ready, so initial testing and optimisation of the set-up will start in the near future. The first laboratory test series will be performed with specimens of cement paste. Later on it is the intention to modify the equipment to specimens of concrete. Concrete is a much more com-plex system, one of the reasons being the interfacial transition zones. 4.1 Sequential freezing and chloride ingress When a pore solution freezes, the ice formed will be virtually free of salts as long as there is still a liquid phase. Since the amount of salts is unaltered, the salt concentration in the remaining liquid increases. Snyder showed, that de-icing chemicals provoke a gradient in freezing tem-perature. Thereby it becomes possible for zones inside the concrete to freeze before the surface layer [3]. If the surface layer freezes too, the frozen zones may encapsulate liquid pore solution, and if this liquid freezes, the conditions will be similar to a closed container. One of the things the experimental investigation (hopefully!) will reveal is if sequential freezing actually occurs and if not only an outer salt source but also the salt transport caused by freezing itself can create the conditions for sequential freezing. Another aspect of salt transport in freezing concrete is that when the formation of an ice body locally raises the salt concentration, it increases the rate of salt diffusion to the neighbouring zones. Chloride ions are harmful to the concrete reinforcement, so it is of special interest if the
190
experimental investigations can confirm or deny if repeated freeze-thaw cycles accelerate chlo-ride ingress. 4.2 Comparison of test methods A test series is planned with different mix designs, where each concrete mix goes through both CTS measurements, air void analysis and traditional frost tests according to existing standards (e.g. the methods recommended by Henrichsen et al. [4]). It is expected that CTS measurements offer further details of what is happening during the standardised tests. A comparison of results obtained from different methods will provide a better understanding of what can be deduced by means of each method and thereby a safer interpretation of laboratory test results. 5. CONCLUDING REMARKS The CTS measuring technique will contribute with new knowledge about the physical/chemical mechanisms in the concrete. For example, a combination of CTS measurements and measure-ments of moisture and salt distributions can give information about the frost induced salt move-ments. On a short view such knowledge can be utilised to improve the relation between labora-tory test results and the durability of a concrete structure. On a long view the knowledge can be implemented in theoretical or numerical models, which can be used instead of the laborious laboratory tests. ACKOWLEDGMENT The project is partly financed by the Danish Agency for Trade and Industry as Project EF-757 under the Danish Academy of Technical Sciences. This support is gratefully acknowledged. REFERENCES 1. H. Kukko and H. Kuosa, Requirements on frost resistance of concrete in various countries,
Draft Proceedings of the Minneapolis Workshop on Frost Damage in Concrete, University of Minnesota (1999).
2. Danish Standard DS 481, Concrete – Materials, final edition dated 16.06.99 3. M. J. Snyder, Protective coatings to prevent deterioration of concrete by deicing chemicals,
Highway Research Board of the Division of Engineering and Industrial Research, National Academy of Science – National Research Council (1965).
4. A. Henrichsen, P. Laugesen, M. Geiker, E. J. Pedersen and N. Thaulow, HETEK, Method for Test of the Frost Resistance of High Performance Concrete. Summary, Conclusions and Recommendations, Road Directorate, Denmark Ministry of Transport (Report No. 97) (1997).