Embed Size (px)
Citation preview


ContentsFive Year Selected Financial Data
Letter to Stockholders
Stock and Financial Data
Consolidated Balance Sheets
Consolidated Statements of Income
Consolidated Statements of Changes in Stockholders’ Equity
Consolidated Statements of Cash Flows
Notes to Consolidated Financial Statements
Management’s Discussion and Analysis
Report of Independent Auditors and Corporate Information
The Family of Businesses
Profile of Lawson Products, Inc.
1
2
4
5
6
7
8
9
16
18
20
21

Five Year Selected Financial Data
1
Percent(Dollars in thousands, except per share data) 2003 Change 2002 2001 2000 1999
Net Sales1 $389,091 +0.4 $387,456 $379,407 $348,967 $328,987
Income Before Income Taxes2 24,892 +7.3 23,189 17,142 47,566 40,270
Net Income3 16,196 +30.1 12,447 8,787 28,136 23,928
Total Assets 246,943 +9.3 225,831 234,206 222,721 215,991
Return on Assets (percent) 6.6 +19.0 5.5 3.8 12.6 11.1
Noncurrent Liabilities 36,714 +15.6 31,765 40,520 28,946 27,525
Stockholders’ Equity 173,351 +6.8 162,343 159,898 159,912 150,040
Return on Average Equity (percent) 9.6 +24.7 7.7 5.4 18.6 16.5
Per Share of Common Stock:
Basic Net Income $1.71 +31.5 $1.30 $0.91 $2.85 $2.29
Diluted Net Income 1.70 +30.8 1.30 0.91 2.85 2.29
Stockholders’ Equity4 18.26 +7.7 16.96 16.51 16.22 14.37
Cash Dividends Declared 0.66 +3.1 0.64 0.64 0.60 0.57
Basic Weighted Average Shares Outstanding 9,492 –0.8 9,570 9,685 9,860 10,444
Diluted Weighted Average Shares Outstanding 9,511 –0.9 9,596 9,708 9,874 10,446
1 Net sales for 2003, 2002 and 2001 were also positively impacted by the acquisition of the North American Industrial Products and Kent Automotive Divisions in March 2001. In addition, net sales for the years 2000 and 1999 were positively impacted by the acquisition of ACS/SIMCO in the third quarter of 1999.
2 During 2003 the Company recorded a $2,789 pre tax loss related to the sale of Lawson Products Limited, the Company’s former UK subsidiary.
3 In 2003, the tax provision includes a $2,157 reduction to reflect the partial utilization of a capital loss generated by the sale of the Company’s former UK subsidiary.In 2003, 2002 and 1999, the Company recorded $1,477, $421 and $1,760, respectively, after tax, of charges for compensation arrangements related to managementpersonnel reductions. The Company adopted SFAs No. 142 as of January 1, 2002. Therefore, the Company discontinued amortization of goodwill for 2002 and thereafter. Net income for 2001 was reduced by $731 related to goodwill amortization. In 2001, the Company recorded non-recurring charges for the write-off of capitalized software and implementation costs related to an enterprise information system project which the Company decided to discontinue as well as a promotional program related to the acquisition of Premier operations. These charges reduced net income by $5,138 and $2,021, respectively. During 2000, the Company recorded a gain of $2,136 as a result of the sale of the Company’s interest in a real estate investment. In 1999, a gain of $554 was recorded on the sale of marketable securities.
4 These per share amounts were computed using basic weighted average shares outstanding for all periods presented.
Lawson Products, Inc. and Subsidiaries

To Our StockholdersIn 2003, Lawson Products, Inc. realized a 30.1% increase innet income. That translates to net income per diluted shareof $1.70, a 31% increase, on record sales of $389.1 million,and we noted an upward trend in sales during the fourthquarter. The increase in stockholders’ equity was $11.0 million, or 6.8%. The per share book value of our commonstock was $18.26, an increase of 7.7%. The market value of our stock increased 8.9% comparing its high in the fourth quarter of 2002 to the fourth quarter of 2003. Yourmanagers are generating increased amounts of after taxincome and significant cash flow. We are achieving substantial increases in the real value of your Company bymaking it more competitive in its ability to handle the needsof a greater number of customers and customer categoriesthan it has ever been.
Although we realized many positives, we also recognize there is room for improvement and growth. It is the job ofyour management team to make sure that however muchvalue we help to create, we must always find ways to createmore. I call it “getting better and better.”
Let’s consider getting better and better in the context of 2003.We were working in a less than encouraging business environment throughout most of the markets served by theLawson Family of Businesses. That environment was furthercomplicated by changing customer preferences as to whatthey want to buy, how they want to buy it, the type of servicethey want provided, and the price they’re willing to pay to get what they want. The marketplace is different than it used to be.
Your Company’s experiments of the past few years haveallowed for development of new systems, and more importantly, the development of people who envision themarket’s differing needs and desires, and are then able toimplement all that’s necessary to meet or exceed them.During a period of transition in our economy, we are rapidlylearning how to execute all we want to do with less inventoryand fewer but more productive people, while increasing substantially the number of SKU’s on hand and maintaining,and even exceeding, the superior service levels for which we are appreciated by our customers.
In the context of 2003, your management continued to maintain a healthy balance sheet reflecting a strong cashposition, a current ratio of 3.9 to 1, total assets of $246.9million, a debt-free condition (other than a $3 million non-recourse mortgage on an investment property), andstockholders’ equity of $173.4 million. Management has produced an improved income statement, and shown a continued willingness to experiment with markets, marketchannels, new products, delivery systems and services. And,Lawson continues, as it should, to share its successes with itsshareholders. In December, 2003, the Board increased yourdividend 12.5% to 18¢ per share per quarter, which wouldannualize to 72¢ per year, and authorized payment ofLawson’s 123rd consecutive quarterly dividend.
2
Overall, MRO and OEM sales in the United States during2003 were not as strong as we’d have liked. When a customer’s machinery and equipment are being used less,requirements for maintenance and production componentsare reduced. That directly affected a good portion of ourMRO and OEM businesses. Nevertheless, we made up forthose conditions by increasing our sales of other itemsthrough our C.B. Lynn business unit headed by ScottMcCullough and generated new business through our Inside Sales Groups. Our field sales forces showed excellentperformance, with a near majority increasing revenues andincome, while our OEM businesses expanded their customerbase. Overall, I think we made a respectable showing in achallenging time.
Our sales forces are taking advantage of sales tools which we have been developing over the past few years. Over 85% of our sales people are now doing business – selling, placing orders, providing information and services –over our computerized systems. That allows for more sellingtime, less paperwork, faster turnarounds, and improvedaccuracy. These professionals have taken hold of a variety of inventory solutions, a growing number of cross-sellingopportunities, more focused incentive programs and are participating in education programs. We have also made significant in-roads into specialized market segments onlysparingly served previously. Our sales people are enjoyingincreased income as a result of such efforts. That, of course,inures to the benefit of your Company.
A growing number of sales people at our Lawson MRO andDrummond American units are placing customers on ournew e-ordering mechanism. Faster turnaround, increasedaccuracy and a substantial increase of business generatedwith those customers has resulted. The system is being introduced at Cronatron Welding Systems and KentAutomotive during 2004.
We entered the world of Inside Sales in 2001 and engaged in a good bit of re-engineering of that unit. In 2003, we got better at this sales mechanism and enjoyed significant growth in the number of customers serviced, sales volumes achieved and types of products sold through our Inside Sales professionals. Guided by Geoffrey Turner, we continue toexpand the size and expertise of that group.
Your management team re-engineered its business processesin Mexico and the United Kingdom during 2003. We enjoyedsales increases and a broadened customer base. With DickSchwind driving our ACS subsidiary in the United States andGreg Yemm as its head of sales, these three business unitsnow have the capability of serving cross-border OEM andlarge-scale MRO customers from Mexico through the UnitedStates, Canada, the United Kingdom, and into certainEuropean countries. Those operations in Mexico and theUnited Kingdom have long been costly. Now we expect to be getting some of that money back.

3
Similarly, Michael Selby and his people at Automatic ScrewMachine Products Company re-engineered their business and processes during 2003 allowing this manufacturing unitto compete in value-added specialized manufacturing as well as in long production runs. During the fourth quarter, sales grew substantially. Automatic will now be producing specialized MRO and OEM products for our Family of Businesses.
The Strategic Plan approved by the Board of Directors inDecember, 2003, set a new and aggressive direction for theCompany. The Plan calls for a more focused review of ourcustomers’ needs, a more sophisticated marketing and saleseffort to address those needs and a new management structure to assure we achieve our goals. You will note newpeople and a modified structure at Lawson’s Board ofDirectors. In 2003, we eliminated the Executive Committee.Instead, using today’s technology, we are able to readily communicate with our Board members to more fully takeadvantage of their talents and perspectives. Sidney L. Port,our founder, has assumed the post of Vice Chairman of theBoard, and we have two new directors.
Ms. Wilma Smelcer joined the Board in December, 2003, and brings to us managerial, organizational, and financial talents gained from her banking and financial career here inChicago and in New York, including serving as Chairman ofBank of America, Illinois, along with board level involvementat the Goldman Sachs Trust, the Chicago Stock Exchange andother business organizations and groups. Wilma takes theplace of our friend, Robert Melzer, who contributed materially to our Company over the past several years.
Our former Chairman, Bernard Kalish, retired from theBoard in January, 2004 after 47 years of service to LawsonProducts, Inc. Buddy started with Lawson while a student and enjoyed a remarkable career. The seat is filled by Mr. LeeHillman.
Lee is President of Liberation Investment Advisory Group,former Chairman and CEO of Bally Total Fitness HoldingCorp. and former CFO of Bally Entertainment. Before that,Lee served as an audit partner at Ernst & Young. Currently, he is serving as an independent member of the Board andChairman of the Audit Committee of HealthSouth and as alecturer at the graduate schools of business at the Universityof Chicago and at Northwestern.
At corporate, we have eliminated the Office of the President.That office worked well in accomplishing the purpose forwhich it was intended. Jeffrey Belford, our Chief OperatingOfficer and a 23-year colleague, was elected President ofLawson with responsibility for all operating units. RogerCannon, a 29-year colleague, has been elected Executive Vice President, Chief Officer, Field Sales Strategy andDevelopment, and is concentrating on redesigning certainaspects of our sales force mechanisms, ranging from hiringagents through improving management talent with the goal of increasing productivity. This will directly benefit the SalesAgents, our Sales Managers, and the Company.
Also at corporate, Tom Neri, Executive Vice President, ChiefFinancial Officer and Treasurer, has been elected to serve asour key financial person and corporate planner. You can
assume that he, along with Neil Jenkins, our corporate counsel and now Executive Vice President, Secretary andGeneral Counsel, have their hands full as the Family ofBusinesses continues to grow, enhance its organizationalstructure and invigorate its many talented people. Tom headed our efforts in creating the Strategic Plan and Neil has carefully guided us in assuring compliance in a rapidlychanging environment.
At the Lawson MRO unit, Jim Degnan has been electedPresident and his direct reports include George Buckingham,Denny Coomes and Rick Considine as Vice Presidents ofSales. Ron Klein has turned the management of the salesorganization at Kent Automotive over to Tom Pavlick, whojoined the Family of Businesses during 2003 and is now Vice President and General Manager at Kent Automotive.
Ron has accepted the position of Vice President, BusinessDevelopment at Cronatron Welding Systems, Inc. and reportsdirectly to its President, Susan Collins. During 2003, SteveBroome joined our management team at DrummondAmerican and its J.I. Holcomb division. Later in the year,Steve accepted the position of Executive Vice President,Business Development at Drummond. We continue to refineour organizational reporting structures as opportunities arisethroughout the Family of Businesses.
This realigned management structure allows us to place the best talent available where it is needed most. The newstructure holds each manager accountable for results measured against plan, and requires the entire managementteam to operate as a cohesive unit to achieve our businesspriorities and goals.
While we’re working at getting better and better, we’ve beencareful to keep an eye on our foundations – our core values– and we’re talking about them regularly and openly:
Integrity and Respect – in everything we do.
Flexibility and Creativity – in developing and using what we have, in learning from each other and in finding better ways.
Being Nimble – in dealing with changing markets and theneeds and desires of our customers.
Passion – in all we do. Without it, success is not achievable.
The year 2003 was a good one for the Lawson Family ofBusinesses. Your Company did a better job of serving its customers, creating more opportunity for its sales peopleand its employees, enhancing its management teams, increasing its value, and planning its future. We have the people and the tools in place for achieving our plan. And, we intend to do so.
The Lawson Family of Businesses: A winning combination.
Sincerely,
Robert J. WashlowChairman of the Board and CEO
April, 2004

Stock and Financial Data
4
MARKET PRICES FOR COMMON STOCK
The Company’s Common Stock is traded in the over-the-counter market under the NASDAQ symbol of “LAWS.” The approximate
number of stockholders of record at December 31, 2003 was 871. The following table sets forth the High and Low closing sale
prices as reported on the NASDAQ National Market System during the last two years.
2003 2002
High Low High Low
First Quarter $30.81 $23.04 $29.00 $25.71
Second Quarter 28.48 24.40 33.09 26.80
Third Quarter 29.87 25.76 30.31 25.68
Fourth Quarter 34.74 27.47 31.90 27.55
CASH DIVIDENDS PAID PER SHARE
2003 2002
First Quarter $.16 $.16
Second Quarter .16 .16
Third Quarter .16 .16
Fourth Quarter .16 .16
$.64 $.64
CLASSES OF SIMILAR PRODUCTS
The Company’s products may be grouped into the following classes of similar products, each of which accounted for the indicated
percentages of consolidated revenues:
Percent of Consolidated Revenues
2003 2002 2001
Fasteners, fittings and related parts 43% 44% 45%
Industrial supplies 48 47 47
Automotive and equipment maintenance parts 9 9 8
100% 100% 100%

Consolidated Balance Sheets
5
December 31,
(Dollars in thousands) 2003 2002
ASSETSCURRENT ASSETS:
Cash and cash equivalents $ 21,399 $ 7,591Marketable securities 2,156 696Accounts receivable, less allowance for doubtful accounts
(2003 – $2,121; 2002 – $1,830) 47,972 42,990Inventories 59,817 63,851Miscellaneous receivables 4,773 3,202Prepaid expenses 6,666 7,968Deferred income taxes 1,975 3,463
Total Current Assets 144,758 129,761
Property, plant and equipment, at cost, less allowances for depreciation and amortization (2003 – $53,880; 2002 – $49,499) 42,946 39,519
Other assets:Cash value of life insurance 13,201 10,933Investments in real estate — 1,305Deferred income taxes 13,201 11,987Goodwill, less accumulated amortization 28,649 28,649Other intangible assets, less accumulated amortization
(2003 – $1,219; 2002 – $701) 1,481 1,999Other 2,707 1,678
59,239 56,551
$246,943 $225,831
LIABILITIES AND STOCKHOLDERS’ EQUITYCURRENT LIABILITIES:
Accounts payable $ 8,240 $ 8,085Accrued expenses and other liabilities 27,176 23,638Current portion of long term debt 1,462 —
Total Current Liabilities 36,878 31,723
Noncurrent liabilities and deferred credits:Accrued liability under security bonus plans 20,823 20,614Long term debt 1,573 —Deferred compensation and other liabilities 14,318 11,151
36,714 31,765
Stockholders’ equity:Preferred Stock, $1 par value: Authorized – 500,000 shares;
Issued and outstanding – None — —Common Stock, $1 par value: Authorized – 35,000,000 shares;
Issued – 2003 – 9,493,511 shares; 2002 – 9,494,011 shares 9,494 9,494Capital in excess of par value 2,667 2,387
Retained earnings 161,831 152,495
173,992 164,376Accumulated other comprehensive loss (641) (2,033)
Stockholders’ equity 173,351 162,343
$246,943 $225,831
Lawson Products, Inc. and Subsidiaries
See notes to consolidated financial statements

Consolidated Statements of IncomeYear ended December 31,
(Dollars in thousands, except per share data) 2003 2002 2001
Net sales $389,091 $387,456 $379,407
Cost of goods sold 141,124 137,129 131,065
Gross profit 247,967 250,327 248,342
Selling, general and administrative expenses 221,189 226,571 221,743
Other charges 2,459 360 8,496
Provision for doubtful accounts 1,578 1,585 1,901
Operating Income 22,741 21,811 16,202
Interest and dividend income 194 53 654
Interest expense (131) (154) (706)
Other income – net 2,088 1,479 992
2,151 1,378 940
Income Before Income Taxes 24,892 23,189 17,142
Income Tax Expense 8,696 10,742 8,355
Net Income $ 16,196 $ 12,447 $ 8,787
Net Income Per Share of Common Stock:
Basic $1.71 $1.30 $0.91
Diluted $1.70 $1.30 $0.91
See notes to consolidated financial statements
6

Consolidated Statements of Changes in Stockholders’ Equity
7
AccumulatedCommon Capital Other
Stock, in excess of Retained Comprehensive Comprehensive(Dollars in thousands) $1 par value par value Earnings Loss Income
Balance at January 1, 2001 $9,706 $ 762 $151,066 $(1,622) $ —
Net income 8,787 8,787
Other comprehensive loss, net of tax:Adjustment for foreign currency translation (576) (576)
Comprehensive income for the year $8,211
Cash dividends declared (6,191)
Stock issued under employee stock plans 7 159
Purchase and retirement of common stock (84) (8) (2,108)
Balance at December 31, 2001 9,629 913 151,554 (2,198)
Net income 12,447 $12,447
Other comprehensive income, net of tax:Adjustment for foreign currency translation 165 165
Comprehensive income for the year $12,612
Cash dividends declared (6,115)
Stock issued under employee stock plans 61 1,510
Purchase and retirement of common stock (196) (36) (5,391)
Balance at December 31, 2002 9,494 2,387 152,495 (2,033)
Net income 16,196 $16,196
Other comprehensive income, net of tax:Adjustment for foreign currency translation 1,392 1,392
Comprehensive income for the year $17,588
Cash dividends declared (6,265)
Stock issued under employee stock plans 20 285
Purchase and retirement of common stock (20) (5) (595)
Balance at December 31, 2003 $9,494 $2,667 $161,831 $ (641)
See notes to consolidated financial statements
Lawson Products, Inc. and Subsidiaries
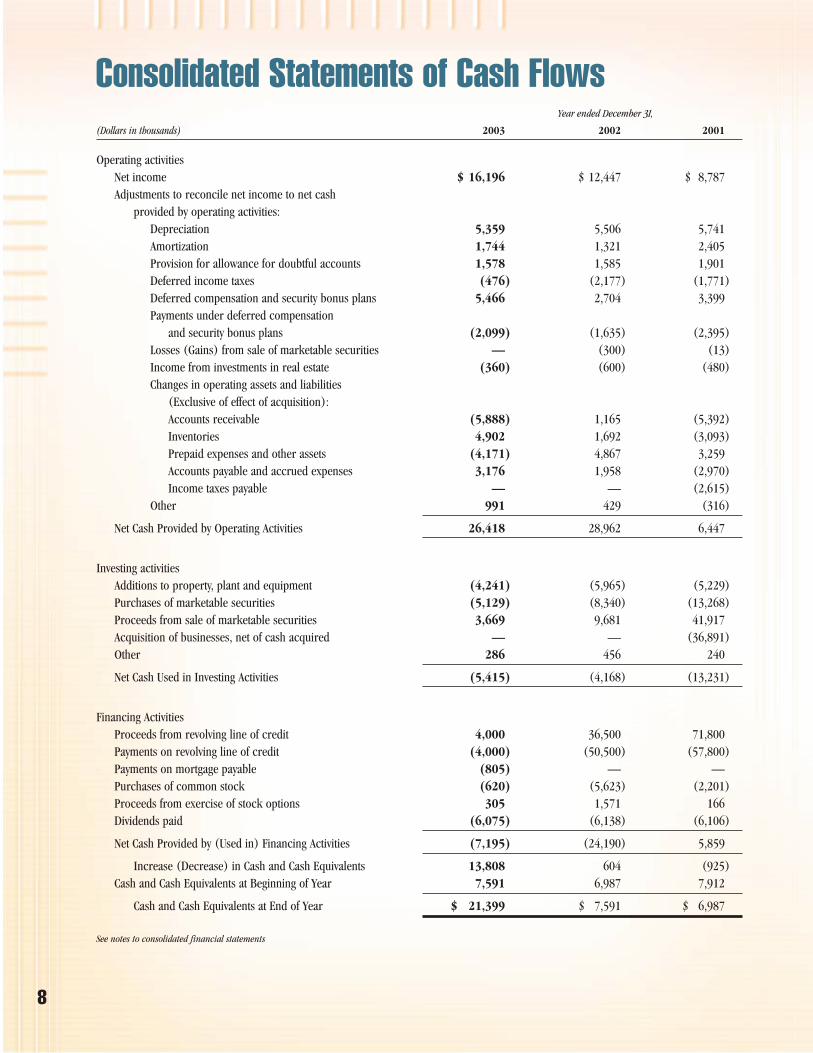
Consolidated Statements of Cash FlowsYear ended December 31,
(Dollars in thousands) 2003 2002 2001
Operating activitiesNet income $ 16,196 $ 12,447 $ 8,787Adjustments to reconcile net income to net cash
provided by operating activities:Depreciation 5,359 5,506 5,741Amortization 1,744 1,321 2,405Provision for allowance for doubtful accounts 1,578 1,585 1,901Deferred income taxes (476) (2,177) (1,771)Deferred compensation and security bonus plans 5,466 2,704 3,399Payments under deferred compensation
and security bonus plans (2,099) (1,635) (2,395)Losses (Gains) from sale of marketable securities — (300) (13)Income from investments in real estate (360) (600) (480)Changes in operating assets and liabilities
(Exclusive of effect of acquisition):Accounts receivable (5,888) 1,165 (5,392)Inventories 4,902 1,692 (3,093)Prepaid expenses and other assets (4,171) 4,867 3,259Accounts payable and accrued expenses 3,176 1,958 (2,970)Income taxes payable — — (2,615)
Other 991 429 (316)
Net Cash Provided by Operating Activities 26,418 28,962 6,447
Investing activitiesAdditions to property, plant and equipment (4,241) (5,965) (5,229)Purchases of marketable securities (5,129) (8,340) (13,268)Proceeds from sale of marketable securities 3,669 9,681 41,917Acquisition of businesses, net of cash acquired — — (36,891)Other 286 456 240
Net Cash Used in Investing Activities (5,415) (4,168) (13,231)
Financing ActivitiesProceeds from revolving line of credit 4,000 36,500 71,800Payments on revolving line of credit (4,000) (50,500) (57,800)Payments on mortgage payable (805) — —Purchases of common stock (620) (5,623) (2,201)Proceeds from exercise of stock options 305 1,571 166Dividends paid (6,075) (6,138) (6,106)
Net Cash Provided by (Used in) Financing Activities (7,195) (24,190) 5,859
Increase (Decrease) in Cash and Cash Equivalents 13,808 604 (925)Cash and Cash Equivalents at Beginning of Year 7,591 6,987 7,912
Cash and Cash Equivalents at End of Year $ 21,399 $ 7,591 $ 6,987
See notes to consolidated financial statements
8

Notes to Consolidated Financial Statements(Dollars in thousands)
9
NOTE A – DESCRIPTION OF BUSINESS
Lawson Products is an international seller and distributor ofsystems, services and products to the industrial, commercialand institutional maintenance, repair and replacement(“MRO”) marketplace. The Company also manufactures, sellsand distributes production and specialized component parts to the original equipment marketplace (“OEM”).
NOTE B – SUMMARY OF MAJOR ACCOUNTING POLICIES
Principles of Consolidation: The accompanying consolidated financial statements include the accounts and transactions of the Company and its wholly owned and majority owned subsidiaries. All inter-company accounts and transactions havebeen eliminated in consolidation.
Revenue Recognition: Sales and associated cost of goods sold are recognized when products are shipped and title passes to customers.
Shipping and Handling Fees and Costs: Costs related to shipping and handling fees are included on the IncomeStatement in the caption selling, general and administrativeexpenses and totaled $11,159, $11,898 and $11,460 in 2003,2002 and 2001, respectively. Amounts billed to customers forshipping fees are included in net sales.
Use of Estimates: The preparation of financial statements in conformity with accounting principles generally accepted inthe United States requires management to make estimates andassumptions that affect the amounts reported in the financialstatements and accompanying notes. Actual results could differfrom these estimates.
Investment in Real Estate Partnership: The Company’s investment in real estate, representing a limited partnershipinterest, was carried on the basis of the equity method untilJune 30, 2003. (See New Accounting Standards)
Marketable Securities: Marketable equity and debt securities are classified as available-for-sale and are carried at fair value,with the unrealized gains and losses, net of tax, recorded in stockholders’ equity. Realized gains and losses, declines invalue judged to be other-than-temporary, and interest and dividends are included in investment income. The cost of securities sold is based on the specific identification method.
Inventories: Inventories which consist of principally finishedgoods are stated at the lower of cost (first-in, first-out method) or market.
Property, Plant and Equipment: Provisions for depreciation and amortization are computed by the straight-line method for buildings using useful lives of 20 to 30 years and by the double declining balance method for machinery and equipment, furniture and fixtures and vehicles using usefullives of 3 to 10 years.
Investment Tax Credits: Investment tax credits on assetsleased to others (See Investment in Real Estate Partnership)are deferred and amortized over the useful life of the related asset.
Cash Equivalents: The Company considers all highly liquid investments with a maturity of three months or less when purchased to be cash equivalents
Stock Options: Stock options are accounted for under Accounting Principles Board (APB) Opinion No. 25,“Accounting For Stock Issued to Employees.” Under APB 25,the Company uses the intrinsic value method where no compensation expense is recognized because the exerciseprice of the stock options granted equals the market price of the underlying stock at the date of grant.
The following table shows the effect on net income and earnings per share if the Company had applied the fair valuerecognition provision of FASB Statement No. 123, “Accountingfor Stock-Based Compensation.”
2003 2002 2001
Net income – as reported $16,196 $12,447 $8,787Deduct: Total stock based
employee compensation expense determined under fair value method, net of tax (27) (38) (49)
Net income – pro forma 16,169 12,409 8,738Basic earnings per share – as reported 1.71 1.30 .91Diluted earnings per share – as reported 1.70 1.30 .91Basic earnings per share – pro forma 1.70 1.30 .90Diluted earnings per share – pro forma 1.70 1.29 .90
For purposes of pro forma disclosures, the estimated fair value of options granted is amortized to expense over the option’s vesting period. The pro forma effect on net income is not representative of the pro forma effect on net income in futureyears because grants made in 1996 and later years have anincreasing vesting period.
Goodwill and Other Intangibles: Goodwill represents the cost of business acquisitions in excess of the fair value of identifiable net tangible assets acquired. Goodwill was amortized over 20 years using the straight-line method untilthe end of 2001.
In June 2001, the FASB issued Statement No. 141, “BusinessCombinations” and Statement No. 142 “Goodwill and OtherIntangibles,” effective for fiscal years beginning after December15, 2001. Under the new rules, goodwill and other intangibleassets deemed to have indefinite lives will no longer be amortized but subject to annual impairment tests. (See Note G)
Foreign Currency Translation: The financial statements of foreign entities have been translated in accordance withStatement of Financial Accounting Standards No. 52 and,
Lawson Products, Inc. and Subsidiaries

The sale also generated approximately $22,441 in capital losses. The Company was able to carryback $6,163 of the capital loss to offset capital gains in prior years. The effect of the carryback resulted in $2,157 of tax benefit realized in 2003. A valuation allowance has been provided for the remainder of the capital loss due to the uncertainty of utilization.
Purchase of Industrial Products and Kent Automotive: On March 30, 2001, the Company purchased certain assets of Premier Farnell’s Cleveland based North American Industrial Products (IPD) and Kent Automotive (Kent)Divisions for approximately $28,369 plus approximately$7,267 for related inventories. This all-cash transaction wasaccounted for as a purchase; accordingly, the accounts andtransactions of the acquired business have been included inthe consolidated financial statements since the date of acquisition. Under the agreement, the Company acquired thefield sales, inside sales and customer service professionals, customer accounts, certain administrative executives, and various intellectual properties, including trademarks and trade names of the divisions in certain territories.
The identifiable intangibles acquired in the acquisitions were recorded at an independent appraised value of approximately $1,400. These intangibles are being amortizedover a weighted average estimated life of 15.14 years. Theremaining excess of purchase price over net assets acquired of approximately $27,100 represents goodwill.
The assets acquired were recorded at fair values as determined by the Company’s management. As the Companyonly acquired inventory and sales professionals of the IPD and Kent businesses, the Company is unable to provide anymeaningful pro forma information of prior period results. Net sales attributed to the acquired division representedapproximately $41,252 for 2001.
NOTE D – OTHER CHARGES
In 2003, the Company recorded charges totaling $2,459 forseverance of several members of management. Approximately$422 was paid in 2003 and the remaining benefits will be paidthrough 2006.
During 2002, the Company recorded a charge of $568 for severance for several members of management and a $208 adjustment to the reserve resulting from a severance settlement. Approximately $155 was paid in 2003 and theremaining benefits will be paid in 2004.
In 2001, the Company wrote-off capitalized software andimplementation costs of a discontinued enterprise informationsystem project. This write-off represents a non-cash charge of$8,527 ($5,138 net of tax benefits).
10
accordingly, unrealized foreign currency translation adjustments are reflected as a component of stockholders’ equity. Realized foreign currency transaction gains and losseswere not significant for the years ended December 31, 2003,2002 and 2001.
Income Per Share: Basic EPS is computed by dividing netincome by the weighted average number of common shares outstanding during the period. Diluted EPS reflects the potential dilution from the exercise or conversion of securities into common stock, such as stock options.
Reclassifications: Certain amounts have been reclassified in the 2002 and 2001 financial statements to conform with the2003 presentation.
New Accounting Standards: In January 2003, the FASB issuedFIN No. 46, “Consolidation of Variable Interest Entities,” whichaddresses the financial reporting by companies involved withvariable interest entities (“VIE”). A VIE is a corporation, partnership, trust, or any other legal structure used for business purposes that either (a) does not have equity investors with voting rights or (b) has equity investors that do not provide sufficient financial resources for the entity to support its activities. FIN No. 46 requires a VIE to be consolidated by a company if that company is subject to amajority of the risk of loss from the VIE’s activities or entitled to receive a majority of the entity’s residual returns or both.Previously, a company generally included an entity in its consolidated financial statements only if it controlled the entitythrough voting interests. The consolidation requirements of FIN No. 46 apply immediately to VIE’s created after January 31, 2003. Existing VIE’s must be consolidated in the first fiscalyear or interim period beginning after March 15, 2004. The Company adopted FIN 46 as of July 1, 2003, which hasresulted in the consolidation of the Company’s investment in alimited partnership, which owns an office building in Chicago,Illinois. An officer and member of the Board of Directors of the Company is the 1.5% general partner. (See Note I) Theoperations of the partnership consist of rental of the buildingunder a long-term lease and the servicing of the non-recoursemortgage. The activities are insignificant for separate disclosure.
NOTE C – BUSINESS COMBINATION/DISPOSITION
Sale of Lawson Products Limited, UK Subsidiary: In the fourth quarter of 2003, the Company sold its UK subsidiary, Lawson Products Limited, engaged primarily in thebusiness of MRO sales, to a third party for approximately $647. The purchase price is in the form of a note payable to theCompany over two years. Prior to the sale, the Company transferred certain assets and liabilities related to the OEM portion of this business to a newly formed subsidiary, AssemblyComponent Systems Limited. The sale of Lawson ProductsLimited resulted in a pre-tax loss of approximately $2,789,largely related to inventory write-offs and termination costsassociated with the sale. This loss is classified in selling, generaland administrative expenses in the statement of income. Thisbusiness was part of the Company’s International OEM distribution segment.

The Company’s pro forma information for intangible assetsthat are no longer being amortized effective January 1, 2002 consisted of the following:
2003 2002 2001
Net income – as reported $16,196 $12,447 $8,787Goodwill amortization – – 731Net income – pro forma 16,196 12,447 9,518Diluted earnings per share – as reported 1.70 1.30 .91Diluted earnings per share – pro forma 1.70 1.30 .98
Intangible assets subject to amortization were as follows:
December 31, 2003Gross Accumulated Net Carrying
Balance Amortization Amount
Trademarks and tradenames $1,747 $851 $896Customer lists 953 368 585
$2,700 $1,219 $1,481
December 31, 2002Gross Accumulated Net Carrying
Balance Amortization Amount
Trademarks and tradenames $1,747 $668 $1,079Customer lists 953 33 920
$2,700 $701 $1,999
Trademarks and tradenames are being amortized over aweighted average 15.14 years. Customer lists are being amortized over 13.96 years. Amortization expense, all ofwhich was included in the MRO distribution segment, for the intangible assets was $518, $377 and $137 in 2003, 2002 and2001, respectively. Amortization expense for each of the nextfive years is estimated as follows:
2004 2005 2006 2007 2008
Amortization expense $116 $83 $83 $83 $83
NOTE H – ACCRUED EXPENSES AND OTHER LIABILITIES
Accrued expenses and other liabilities consist of the following:2003 2002
Salaries, commissions and other compensation $ 6,802 $ 5,875
Accrued other charges 2,476 876Accrued and withheld taxes,
other than income taxes 2,591 2,757Accrued profit sharing
contributions 3,448 3,269Accrued self-insured health benefits 1,800 1,500Cash dividends payable 1,709 1,519Other 8,350 7,842
$27,176 $23,638
11
Lawson Products, Inc. and Subsidiaries
The table below shows an analysis of the company’s reservesfor other charges:
Severanceand Related Asset
Description of Item Expenses Writedown Total
Balance January 1, 2001 $2,373 $ – $2,373Charged to earnings 2001 – 8,527 8,527Cash paid in 2001 (884) – (884)Non-cash utilization – (8,527) (8,527)Adjustment to reserves (31) – (31)Balance December 31, 2001 1,458 – 1,458Charged to earnings 2002 568 – 568Cash paid in 2002 (942) – (942)Adjustment to reserves (208) – (208)Balance December 31, 2002 876 – 876Charged to earnings 2003 2,459 – 2,459Cash paid in 2003 (859) – (859)Balance December 31, 2003 $2,476 $ – $2,476
NOTE E – MARKETABLE SECURITIES
The following is a summary of the Company’s investments at December 31 which are classified as available-for-sale. The contractual maturity of all marketable securities atDecember 31, 2003 is less than one year.
Gross Gross EstimatedUnrealized Unrealized Fair
Cost Gains Losses Value2003
Foreign government securities $2,156 $ – $ – $2,156
2002
Foreign government securities $ 696 $ – $ – $ 696
The gross realized gains on sales of marketable securitiestotaled: $0, $300 and $13 in 2003, 2002 and 2001, respectively.
NOTE F – PROPERTY, PLANT AND EQUIPMENTThe cost of property, plant and equipment consists of:
2003 2002
Land $ 8,389 $ 6,608Buildings and improvements 51,556 42,090Machinery and equipment 30,143 32,702Furniture and fixtures 5,749 5,965Vehicles 432 406Construction in Progress 557 1,247
$96,826 $89,018
NOTE G– GOODWILL AND OTHER INTANGIBLES
As discussed in Note B - Summary of Major AccountingPolicies, the Company adopted FASB statement No. 142“Goodwill and Other Intangibles” as of January 1, 2002. The Company performed its annual impairment test in thefourth quarter which determined the Company’s goodwill wasnot impaired.
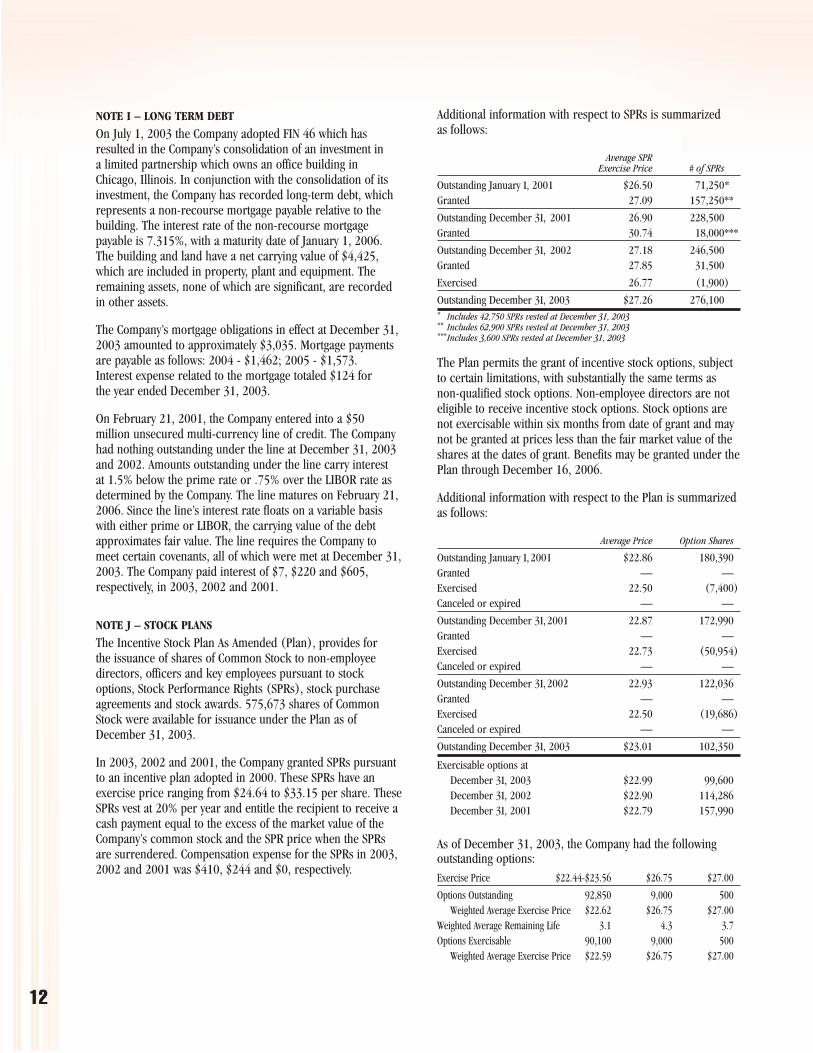
NOTE I – LONG TERM DEBT
On July 1, 2003 the Company adopted FIN 46 which has resulted in the Company’s consolidation of an investment in a limited partnership which owns an office building inChicago, Illinois. In conjunction with the consolidation of itsinvestment, the Company has recorded long-term debt, whichrepresents a non-recourse mortgage payable relative to thebuilding. The interest rate of the non-recourse mortgagepayable is 7.315%, with a maturity date of January 1, 2006.The building and land have a net carrying value of $4,425,which are included in property, plant and equipment. Theremaining assets, none of which are significant, are recordedin other assets.
The Company’s mortgage obligations in effect at December 31,2003 amounted to approximately $3,035. Mortgage paymentsare payable as follows: 2004 - $1,462; 2005 - $1,573. Interest expense related to the mortgage totaled $124 for the year ended December 31, 2003.
On February 21, 2001, the Company entered into a $50 million unsecured multi-currency line of credit. The Companyhad nothing outstanding under the line at December 31, 2003and 2002. Amounts outstanding under the line carry interest at 1.5% below the prime rate or .75% over the LIBOR rate asdetermined by the Company. The line matures on February 21,2006. Since the line’s interest rate floats on a variable basiswith either prime or LIBOR, the carrying value of the debtapproximates fair value. The line requires the Company tomeet certain covenants, all of which were met at December 31,2003. The Company paid interest of $7, $220 and $605,respectively, in 2003, 2002 and 2001.
NOTE J – STOCK PLANS
The Incentive Stock Plan As Amended (Plan), provides for the issuance of shares of Common Stock to non-employeedirectors, officers and key employees pursuant to stockoptions, Stock Performance Rights (SPRs), stock purchaseagreements and stock awards. 575,673 shares of CommonStock were available for issuance under the Plan as ofDecember 31, 2003.
In 2003, 2002 and 2001, the Company granted SPRs pursuantto an incentive plan adopted in 2000. These SPRs have anexercise price ranging from $24.64 to $33.15 per share. TheseSPRs vest at 20% per year and entitle the recipient to receive acash payment equal to the excess of the market value of theCompany’s common stock and the SPR price when the SPRsare surrendered. Compensation expense for the SPRs in 2003,2002 and 2001 was $410, $244 and $0, respectively.
12
Additional information with respect to SPRs is summarized as follows:
Average SPR Exercise Price # of SPRs
Outstanding January 1, 2001 $26.50 71,250*Granted 27.09 157,250**
Outstanding December 31, 2001 26.90 228,500Granted 30.74 18,000***
Outstanding December 31, 2002 27.18 246,500Granted 27.85 31,500
Exercised 26.77 (1,900)
Outstanding December 31, 2003 $27.26 276,100* Includes 42,750 SPRs vested at December 31, 2003** Includes 62,900 SPRs vested at December 31, 2003***Includes 3,600 SPRs vested at December 31, 2003
The Plan permits the grant of incentive stock options, subject to certain limitations, with substantially the same terms as non-qualified stock options. Non-employee directors are not eligible to receive incentive stock options. Stock options arenot exercisable within six months from date of grant and maynot be granted at prices less than the fair market value of theshares at the dates of grant. Benefits may be granted under thePlan through December 16, 2006.
Additional information with respect to the Plan is summarized as follows:
Average Price Option Shares
Outstanding January 1,2001 $22.86 180,390Granted — —Exercised 22.50 (7,400)Canceled or expired — —
Outstanding December 31,2001 22.87 172,990Granted — —Exercised 22.73 (50,954)Canceled or expired — —
Outstanding December 31,2002 22.93 122,036Granted — —Exercised 22.50 (19,686)Canceled or expired — —
Outstanding December 31, 2003 $23.01 102,350
Exercisable options atDecember 31, 2003 $22.99 99,600December 31, 2002 $22.90 114,286December 31, 2001 $22.79 157,990
As of December 31, 2003, the Company had the following outstanding options:Exercise Price $22.44-$23.56 $26.75 $27.00
Options Outstanding 92,850 9,000 500Weighted Average Exercise Price $22.62 $26.75 $27.00
Weighted Average Remaining Life 3.1 4.3 3.7Options Exercisable 90,100 9,000 500
Weighted Average Exercise Price $22.59 $26.75 $27.00
13
Lawson Products, Inc. and Subsidiaries
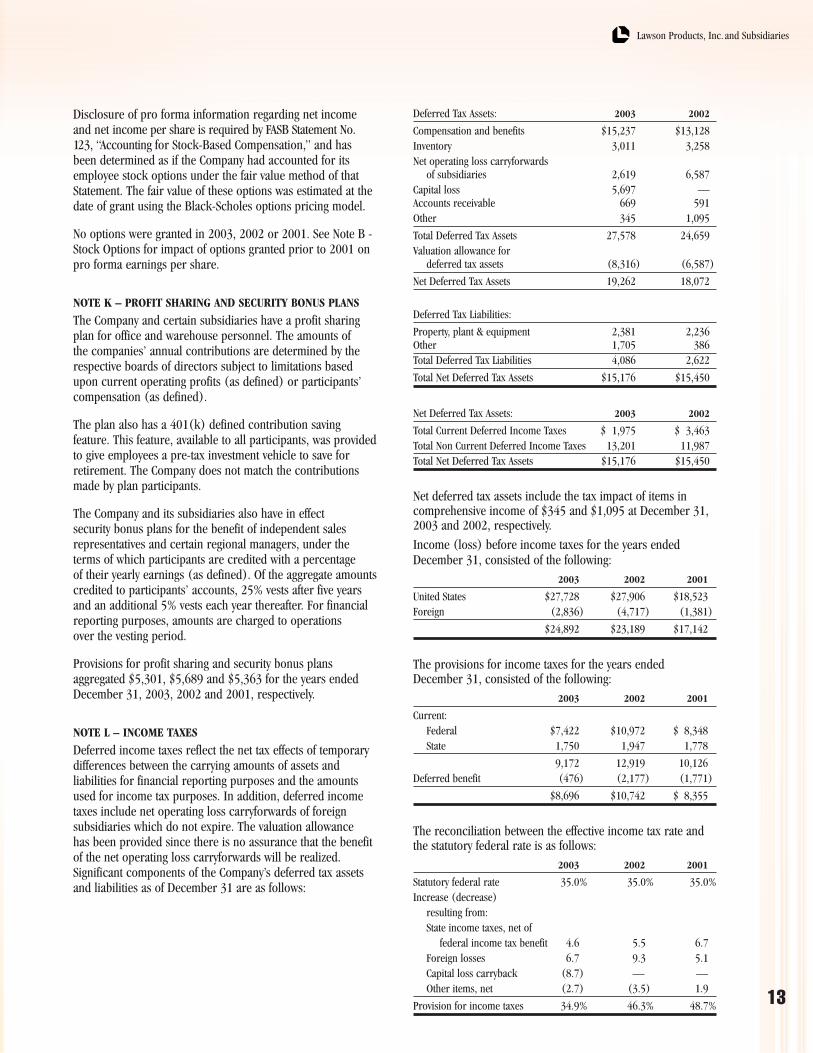
Deferred Tax Assets: 2003 2002
Compensation and benefits $15,237 $13,128Inventory 3,011 3,258Net operating loss carryforwards
of subsidiaries 2,619 6,587Capital loss 5,697 — Accounts receivable 669 591Other 345 1,095
Total Deferred Tax Assets 27,578 24,659Valuation allowance for
deferred tax assets (8,316) (6,587)
Net Deferred Tax Assets 19,262 18,072
Deferred Tax Liabilities:
Property, plant & equipment 2,381 2,236Other 1,705 386Total Deferred Tax Liabilities 4,086 2,622
Total Net Deferred Tax Assets $15,176 $15,450
Net Deferred Tax Assets: 2003 2002
Total Current Deferred Income Taxes $ 1,975 $ 3,463Total Non Current Deferred Income Taxes 13,201 11,987Total Net Deferred Tax Assets $15,176 $15,450
Net deferred tax assets include the tax impact of items in comprehensive income of $345 and $1,095 at December 31,2003 and 2002, respectively.
Income (loss) before income taxes for the years endedDecember 31, consisted of the following:
2003 2002 2001
United States $27,728 $27,906 $18,523Foreign (2,836) (4,717) (1,381)
$24,892 $23,189 $17,142
The provisions for income taxes for the years ended December 31, consisted of the following:
2003 2002 2001
Current:Federal $7,422 $10,972 $ 8,348State 1,750 1,947 1,778
9,172 12,919 10,126Deferred benefit (476) (2,177) (1,771)
$8,696 $10,742 $ 8,355
The reconciliation between the effective income tax rate andthe statutory federal rate is as follows:
2003 2002 2001
Statutory federal rate 35.0% 35.0% 35.0%Increase (decrease)
resulting from:State income taxes, net of
federal income tax benefit 4.6 5.5 6.7Foreign losses 6.7 9.3 5.1Capital loss carryback (8.7) — —Other items, net (2.7) (3.5) 1.9
Provision for income taxes 34.9% 46.3% 48.7%
Disclosure of pro forma information regarding net income and net income per share is required by FASB Statement No.123, “Accounting for Stock-Based Compensation,” and hasbeen determined as if the Company had accounted for itsemployee stock options under the fair value method of thatStatement. The fair value of these options was estimated at thedate of grant using the Black-Scholes options pricing model.
No options were granted in 2003, 2002 or 2001. See Note B -Stock Options for impact of options granted prior to 2001 onpro forma earnings per share.
NOTE K – PROFIT SHARING AND SECURITY BONUS PLANS
The Company and certain subsidiaries have a profit sharing plan for office and warehouse personnel. The amounts of the companies’ annual contributions are determined by therespective boards of directors subject to limitations basedupon current operating profits (as defined) or participants’compensation (as defined).
The plan also has a 401(k) defined contribution saving feature. This feature, available to all participants, was providedto give employees a pre-tax investment vehicle to save forretirement. The Company does not match the contributionsmade by plan participants.
The Company and its subsidiaries also have in effect security bonus plans for the benefit of independent sales representatives and certain regional managers, under theterms of which participants are credited with a percentage of their yearly earnings (as defined). Of the aggregate amountscredited to participants’ accounts, 25% vests after five yearsand an additional 5% vests each year thereafter. For financial reporting purposes, amounts are charged to operations over the vesting period.
Provisions for profit sharing and security bonus plans aggregated $5,301, $5,689 and $5,363 for the years endedDecember 31, 2003, 2002 and 2001, respectively.
NOTE L – INCOME TAXES
Deferred income taxes reflect the net tax effects of temporary differences between the carrying amounts of assets and liabilities for financial reporting purposes and the amountsused for income tax purposes. In addition, deferred incometaxes include net operating loss carryforwards of foreign subsidiaries which do not expire. The valuation allowance has been provided since there is no assurance that the benefitof the net operating loss carryforwards will be realized.Significant components of the Company’s deferred tax assetsand liabilities as of December 31 are as follows:

14
The operations of the Company’s OEM segments manufacture and distribute component parts to OEM manufacturersthrough a network of independent manufacturers representatives as well as internal sales employees.
The Company’s reportable segments are distinguished by the nature of products distributed and sold, types of customers,manner of servicing them, and geographical location.
The Company evaluates performance and allocates resources to reportable segments primarily based on operating income. The accounting policies of the reportable segments are thesame as those described in the summary of significant policiesexcept that the Company records its federal and state deferredtax assets and liabilities at corporate. Intersegment sales arenot significant.
Financial information for the Company’s reportable segments consisted of the following:
Year ended December 312003 2002 2001
Net salesMRO-US $302,047 $306,863 $306,917MRO-CAN 18,976 16,505 13,999OEM-US 54,147 55,547 52,350OEM-INTL 13,921 8,541 6,141
Consolidated total $389,091 $387,456 $379,407
Operating Income (loss)MRO-US $24,993 $23,828 $15,167MRO-CAN 1,494 1,051 870OEM-US 537 2,490 2,166OEM-INTL (4,283) (5,558) (2,001)
Consolidated total $22,741 $21,811 $16,202
Capital expendituresMRO-US $1,303 $3,941 $4,496MRO-CAN 1,229 944 40OEM-US 1,565 869 684OEM-INTL 144 211 9
Consolidated total $4,241 $5,965 $5,229
Depreciation and amortizationMRO-US $5,592 $5,650 $6,553MRO-CAN 175 121 279OEM-US 804 799 1,060OEM-INTL 532 257 254
Consolidated total $7,103 $6,827 $8,146
Total assetsMRO-US $168,783 $154,832 $165,603MRO-CAN 17,137 13,989 15,023OEM-US 36,076 33,181 34,932OEM-INTL 9,771 8,379 5,498
Segment total 231,767 210,381 221,056
Corporate 15,176 15,450 13,150
Consolidated total $246,943 $225,831 $234,206
GoodwillMRO-US $22,104 $22,104 $22,104MRO-CAN 4,294 4,294 4,294OEM-US 2,251 2,251 2,251
Consolidated total $28,649 $28,649 $28,649
The decrease in the effective income tax rate in 2003 is due tothe sale of the Company’s UK MRO business that resulted in a$22,441 capital loss. The portion of the capital loss which theCompany was able to carryback to a prior year capital gainwas realized in 2003. A valuation was provided for theremainder of the capital loss. The capital loss expires in 2008.
Income taxes paid for the years ended December 31, 2003,2002, and 2001 amounted to $10,523, $13,392 and $13,410, respectively.
NOTE M – COMMITMENTS
The Company’s minimum rental commitments, principally for equipment, under noncancelable leases in effect atDecember 31, 2003, amounted to approximately $13,971.Such rentals are payable as follows:
20092004 2005 2006 2007 2008 and thereafter
$3,056 $2,528 $2,209 $1,874 $1,081 $3,223
Total rental expense for the years ended December 31, 2003,2002 and 2001 amounted to $3,977, $3,669 and $3,090respectively.
NOTE N – INCOME PER SHARE
The computation of basic and diluted earnings per share consisted of the following:
Year ended December 312003 2002 2001
Numerator:Net income $16,196 $12,447 $8,787
Denominator:Denominator for basic income per
share – weighted average shares 9,492 9,570 9,685Effect of dilutive securities:
Stock option plans 19 26 23
Denominator for diluted income per share –
adjusted weighted average shares 9,511 9,596 9,708
Basic income per share $1.71 $1.30 $0.91
Diluted income per share $1.70 $1.30 $0.91
NOTE O – SEGMENT REPORTING
The Company has four reportable segments: Maintenance, Repair and Replacement distribution in the U.S. (MRO-US),International Maintenance, Repair and Replacement distribution in Canada (MRO-CAN), Original EquipmentManufacturer distribution and manufacturing in the U.S.(OEM-US), International Original Equipment Manufacturerdistribution in Mexico and the United Kingdom (OEM-INTL).The operations of the Company’s MRO distribution segmentsdistribute a wide range of MRO parts to repair and maintenance organizations by the Company’s force of independent sales agents.

15
Lawson Products, Inc. and Subsidiaries
NOTE P – SUMMARY OF UNAUDITED QUARTERLY RESULTS OF OPERATIONS
Unaudited quarterly results of operations for the years endedDecember 31, 2003 and 2002 are summarized as follows:
Quarter ended2003 Mar. 31 Jun. 30 Sept. 30 Dec. 31
(Dollars in thousands, except per share data)
Net sales $96,075 $97,109 $99,301 $96,606Cost of goods sold 34,548 35,034 35,349 36,193Income before income taxes1 6,621 6,705 7,488 4,078Provision for income taxes2 2,863 2,564 3,124 145Net income3 3,758 4,141 4,364 3,933Net income per share
of common stock:Basic and Diluted 0.40 0.44 0.46 0.41
Diluted weighted average shares outstanding 9,511 9,506 9,511 9,519
Quarter ended2002 Mar. 31 Jun. 30 Sept. 30 Dec. 31
(Dollars in thousands, except per share data)
Net sales $95,746 $99,890 $98,474 $93,346Cost of goods sold 33,704 35,343 35,211 32,871Income before income taxes 6,410 8,056 6,628 2,095Provision for income taxes 2,578 3,360 2,869 1,935Net income4,5 3,832 4,696 3,759 160Net income per share
of common stock:Basic and diluted 0.40 0.49 0.39 0.02
Diluted weighted average shares outstanding 9,657 9,643 9,576 9,526
1 The fourth quarter includes a $2,789 pre tax loss related to the sale of LawsonProducts Limited, the Company’s former UK subsidiary.
2 The fourth quarter includes a $2,157 reduction of the tax provision to reflect the partial utilization of a capital loss generated by the sale of the Company’s former UK subsidiary.
3 The second, third and fourth quarters, respectively, included $751, $240 and $486 of charges for compensation arrangements related to management personnel reductions.
4 Inventories and cost of goods sold during interim periods were determined through the use of estimated gross profit rates. The difference between actual and estimated gross profit rates used for interim periods was adjusted in thefourth quarter. This adjustment increased net income by approximately $1,955.
5 The fourth quarter included $421 of charges for compensation arrangementsrelated to management personnel reductions.
The reconciliation of segment profit to consolidated incomebefore income taxes consisted of the following:
Year ended December 312003 2002 2001
Total operating income for reportable segments $22,741 $21,811 $16,202
Interest and dividend income 194 53 654Interest expense (131) (154) (706)Other - net 2,088 1,479 992
Income before income taxes $24,892 $23,189 $17,142
Financial information related to the Company’s operations by geographic area consisted of the following:
Year ended December 312003 2002 2001
Net salesUnited States $356,194 $362,410 $359,267Canada 18,976 16,505 13,999Other foreign countries 13,921 8,541 6,141
Consolidated total $389,091 $387,456 $379,407
December 312003 2002 2001
Long-lived assetsUnited States $63,115 $60,678 $61,173Canada 8,193 7,129 6,300Other foreign countries 287 361 396
Consolidated total $71,595 $68,168 $67,869
Net sales are attributed to countries based on the location of customers. Long-lived assets consist of total property, plantand equipment and goodwill.

16
Management’s Discussion and Analysis of Results of Operations and Financial Condition SUMMARY OF FINANCIAL PERFORMANCE
2003 2002 2001
(Dollars in thousands, except per share data)
Net sales $389,091 $387,456 $379,407Income before taxes 24,892 23,189 17,142Net income 16,196 12,447 8,787Total assets 246,943 225,831 234,206
Return on assets (%) 6.6 % 5.5 % 3.8 %Stockholders’ equity 173,351 162,343 159,898
Return on avg. equity (%) 9.6 % 7.7 % 5.4 %Diluted earnings per share $ 1.70 $ 1.30 $ 0.91
Lawson Products, Inc. (“Lawson”, the “Company”) achieved net incomegrowth of 30.1% in 2003 to $16,196. Diluted net income per share for the year 2003 was $1.70 compared to $1.30 in 2002.
OVERVIEWLawson is an international distributor and marketer of systems, services and products to the industrial, commercial and institutional maintenance,repair and replacement (“MRO”) marketplace. The Company also manufactures and markets specialized component parts to the originalequipment marketplace (“OEM”), including automotive, appliance, aerospace, construction and transportation industries.
Lawson markets its products through a network of approximately 1,800independent and inside sales representatives. Lawson delivers “the rightproduct, at the right place, at the right time” through its state-of-the-art distribution systems.
YEAR ENDED DECEMBER 31, 2003 COMPARED TO YEARENDED DECEMBER 31, 2002
As further described in the Notes to Consolidated Financial Statements, Note O – Segment Reporting, the Company distributes Maintenance, Repair and Replacement consumables, reporting this activity as the “MRO-US” segment in the United States and as the “MRO-CAN” segment in Canada. The manufacture and distribution of specialized componentparts in the United States is reported as the “OEM-US” segment.Distribution of specialized component parts in Mexico and the United Kingdom is reported as the “OEM-INTL” segment.
The following table presents the Company’s net sales results for its MROand OEM segments for the past three years:
2003 2002 2001
MRO $321.0 $323.4 $320.9OEM 68.1 64.1 58.5
$389.1 $387.5 $379.4
The segment sales table above illustrates that OEM sales increased $4.0million (6.2%) in 2003 while MRO sales declined $2.4 million (0.7%). In the OEM segment, the Company increased key account penetration andexpanded its international business. Overall, international sales growth in the OEM segment offset a slight decline in U.S. OEM sales in 2003. The MRO segment continued to face difficult market conditions in 2003,particularly in the United States. MRO sales gains in Canada for 2003 were offset by sales declines in domestic MRO business in 2003.
Gross profit declined by $2.3 million, or 0.9%, to $248.0 million during2003 from $250.3 million in 2002. Gross profit as a percent of total sales,declined to 63.7% in 2003 from 64.6% in 2002. This decrease resultedpartially from product mix, as the Company sold a lower percentage ofMRO products as a percent of total sales in 2003 as compared to 2002. In2003, MRO gross profit was 71.3% of sales, compared to 72.4% in 2002.OEM gross profit increased in 2003 to 28.0% of sales, compared to 25.3%in 2002.
Selling, general and administrative (S,G&A) expenses decreased by $5.4 million, or 2.4%, to $221.2 million (56.8% of sales) in 2003 from$226.6 million (58.5% of sales) in 2002. The decline in S,G&A was attributable to the Company’s continuing efforts to contain and reducecosts. Lower sales agent compensation and benefit costs more than offset increases in other S,G&A expenses, principally wages and a loss of approximately $2.8 million in connection with the sale of the MROoperations of the Company’s former UK subsidiary. The decrease in salesagent compensation and benefits resulted principally from the expirationof a special promotional program ending in the second quarter of 2002.
During 2003, the Company incurred $2.5 million in charges for the retirement and severance of certain management personnel compared to$0.4 million in 2002 .
Operating income increased by $0.9 million, or 4.3%, to $22.7 million in2003 from $21.8 million in 2002. The increase resulted primarily fromlower S,G&A expenses noted above, partially offset by lower gross profit and higher other charges.
The effective income tax rates were approximately 34.9% and 46.3%,respectively, for 2003 and 2002. The decrease in the effective tax rate was primarily attributable to a $2.2 million reduction of the income tax provision to reflect the partial utilization of a capital loss carrybackgenerated by the 2003 sale of Lawson Products Limited, the Company’sformer subsidiary in the United Kingdom.
Net income increased by $3.7 million, or 30.1%, to $16.2 million during2003 from $12.5 million in 2002, while income per share increased31.0% to $1.70 in 2003 from $1.30 in 2002. The principal factors affecting net income and earnings per share were lower income taxes and higher operating income, as discussed above. Per share net incomefor 2003 and 2002 was positively impacted by the Company’s share repurchase program.
YEAR ENDED DECEMBER 31, 2002 COMPARED TO YEARENDED DECEMBER 31, 2001In 2002, total sales increased by $8.1 million, or 2.1%, to $387.5 millionfrom $379.4 million in 2001, comprising an increase of $2.5 million, or 0.8% in the MRO segments and $5.6 million, or 9.6% in the OEM segments. The MRO increase was attributable to sales generated by theaddition of field and inside sales representatives from the IPD and Kentdivisions of the North American business of Premier Farnell, acquiredMarch 30, 2001, partially offset by the effects of difficult market conditions and a planned reduction in the number of under-performingdomestic sales agents from 2001 levels. The sales increase in the OEMsegments was attributable to increased penetration of existing accounts as well as new customer development efforts, both domestically and internationally in these business segments.
Gross profit increased by $2.0 million, or 0.8%, to $250.3 million during2002 from $248.3 million in 2001. This increase resulted from the salesincrease noted above, partially offset by a decline in gross profit as a percent of total sales, to 64.6% from 65.5%. This reduction in gross profitpercentage is due to relatively higher growth in the OEM segments, whichtraditionally carry a lower gross profit rate than MRO but also have loweroperating costs. In 2002, OEM gross profit was 25.2% of sales, comparedto 30.2% in 2001. In 2002, OEM gross profit was negatively impacted by a $2.1 million inventory write-off, principally resulting from a change in the inventory profile by our U.K. business to better serve our then current customer base. Excluding this write-off, OEM gross profit was28.5% and total gross profit was 65.1%. The MRO segments gross profitpercentage was 72.4% of sales in 2002, compared to 71.9% in 2001.
Selling, general and administrative (S,G&A) expenses increased by $4.8 million, or 2.2%, to $226.6 million (58.5% of sales) in 2002 from $221.7million (58.4% of sales) in 2001. The increase in S,G&A was attributableto wage and operating cost increases, and to continued investment in various selling and product education initiatives, coupled with higherhealth costs. The increase was partially offset by the cessation of

17
amortization of goodwill pursuant to adoption of FASB Statement No. 142by the Company at the beginning of 2002, expired MRO promotional program costs put in place during 2001 to support the newly acquiredPremier business and the absence of non-recurring costs associated withthe IPD/Kent acquisition. If FASB Statement No. 142 had been adopted atthe beginning of 2001, the non-amortization of goodwill would haveresulted in decreased S,G&A expenses of approximately $1.2 million.
Operating income increased by $5.6 million, or 34.6%, to $21.8 million in 2002 from $16.2 million in 2001. The increase resulted primarily fromhigher net sales, the absence of the $8.5 million write-off of an enterpriseinformation system included in 2001 results and the absence of goodwillamortization and acquisition costs, partially offset by the higher wages and health costs and continued investment in various selling and producteducation initiatives noted above.
Interest expense was $0.2 million in 2002 compared to $0.7 million in2001. The decrease was attributable to the Company’s repayment of all of its outstanding debt from a revolving line of credit, coupled with lowerinterest rates in 2002.
The effective income tax rates were approximately 46.3% and 48.7%,respectively, for 2002 and 2001.
Net income increased by $3.6 million, or 41.6%, to $12.4 million during2002 from $8.8 million in 2001, while income per share increased 42.9%to $1.30 in 2002 from $0.91 in 2001. The principal factors affecting netincome and earnings per share are stated above. Per share net income for 2002 and 2001 was positively impacted by the Company’s share repurchase program.
LIQUIDITY AND CAPITAL RESOURCESCash flows from operations and a $50 million unsecured line of creditentered into in February 2001 have continued to be sufficient to fund operating requirements, cash dividends and capital improvements. Cashflows from operations and the line of credit are also expected to finance the Company’s future growth.
Cash flows provided by operations for 2003, 2002 and 2001 were $26.4million, $29.0 million and $6.4 million, respectively. The decline in 2003was principally attributable to increasing operating assets, primarilyaccounts receivable and cash value of life insurance, more than offsettingthe $3.7 million increase in net income. The improvement in 2002 over2001 was due primarily to decreasing operating assets, increasing operating liabilities, as well as the gain in net income noted above.Working capital at December 31, 2003 and 2002 was approximately$107.9 million and $98.0 million, respectively. At December 31, 2003 thecurrent ratio was 3.9 to 1 as compared to 4.1 to 1 at December 31, 2002.
Over the past three years, the Company has made the following purchases of its common stock:
Year Shares Cost Year AuthorizedPurchased Purchased (In millions) by Board
2003 20,186 $0.6 20002002 196,250 5.6 1999/20002001 84,497 2.2 1999
In 1999, the Board authorized the purchase of up to 500,000 shares of the Company’s common stock. In 2000, the Board authorized 500,000additional shares. At December 31, 2003, 286,399 shares were available for purchase pursuant to the 2000 Board authorization. Funds to purchase these shares were provided by investments and cash flows from operations.
Additions to property, plant and equipment were $4.2 million, $6.0 million and $5.2 million, respectively, for 2003, 2002 and 2001.Consistent with prior years, capital expenditures were incurred principallyfor improvement of existing facilities and for the purchase of relatedequipment. Capital expenditures during 2002 were incurred primarily for improvement of existing facilities and for the purchase of relatedequipment, as well as for the improvement of new leased facilities. Capital expenditures during 2001 primarily reflect purchases of computerequipment and improvement of existing facilities and purchases of related equipment.
Future contractual obligations consisted of the following at December 31, 2003:
(1) Payments to beneficiaries of the security bonus plan are made on a lump sum basis attime of retirement. No such obligations exist at December 31, 2003.
BUSINESS COMBINATIONS AND DISPOSALSSale of MRO Operations in United Kingdom: During the fourth quarter of 2003, the Company completed the sale of its United Kingdom MRO sub-sidiary. As stated above, in connection with the sale of this operation, theCompany incurred a loss of $2.8 million, including inventory write-offs of $1.8million. The Company’s OEM customers in the United Kingdom will be serv-iced through a newly formed entity, Assembly Component Systems, Ltd.
Purchase of Industrial Products and Kent Automotive: On March 30, 2001, the Company purchased certain assets of Premier Farnell’s Clevelandbased North American Industrial Products (“IPD”) and Kent AutomotiveDivisions for approximately $28.4 million plus approximately $7.2 million for related inventories. The all-cash transaction was accounted for as a purchase; accordingly the accounts and transactions of the acquired business have been included in the consolidated financial statements since the date of acquisition. Under the agreement, the Company acquired the field sales, telephone sales and customer service professionals, the customer accounts, certain administrative executives, and use of various intellectual properties, including trademarks and trade names of the Industrial Products and Kent Automotive divisions in certain territories.Premier Farnell’s Premier Fastener, Rotanium Products, Certainium Alloys, CT Engineering, JI Holcomb and Kent Automotive business units in the United States, Canada, Mexico, Central America and the Caribbean were combined with the Company’s existing operations.
The assets acquired were recorded at fair values based on actual purchasecost of inventories and valuations of various intellectual properties, including trademarks and trade names of the IPD and Kent divisions. This acquisition did not require a significant investment by the Company in facilities or equipment. The acquisition generated approximately $41.2 million of incremental sales in 2001. The Company only acquired inventoryand portions of the IPD and Kent business, and is therefore unable to provide any meaningful pro forma information of prior period results.
ADOPTION OF RECENTLY ISSUED ACCOUNTING STANDARDSIn January 2003, the FASB issued FIN No. 46, “Consolidation of Variable Interest Entities,” which addresses the financial reporting by companies involved with variable interest entities (“VIE”). A VIE is a corporation, partnership, trust or any other legal structure used for business purposes that either (a) does not have equity investors with voting rights or (b) has equity investors that do not provide sufficient financial resources for the entity to support its activities. FIN No. 46 requires a VIE to be consolidated by a company if that company is subject to a majority of the risk of loss from the VIE’s activities or entitled to receive the majority of the entity’s residual returns or both. Previously, a company generally included an entity in its consolidated financial statements only if it controlled the entitythrough voting interests. The consolidation requirements of FIN No. 46 apply immediately to VIE’s created after January 31, 2003. Existing VIE’s must be consolidated in the first fiscal year or interim period beginning after March 15, 2004.
The Company adopted FIN 46 as of July 1, 2003, which has resulted in the consolidation of the Company’s investment in a limited partnership, which owns an office building in Chicago, Illinois. An officer and member of the Board of Directors of the Company is the general partner of this VIE and holds a 1.5% interest in the partnership. The operations of the partnership consist of rental of the building under a long-term lease and the servicing of the non-recourse mortgage. In conjunction with the consolidation of its investment, the Company has recorded long-term debt, which represents anon-recourse mortgage payable relative to the building, of approximately $3.0 million at December 31, 2003. The building and land have a net carrying value of $4.4 million, which are included in property, plant andequipment. The remaining assets, none of which are significant, are recorded in other assets.
2009 and(In thousands) 2004 2005 2006 2007 2008 thereafter Total
Rents $3,056 $2,528 $2,209 $1,874 $1,081 $ 3,223 $13,971Mortgage payable 1,462 1,573 – – – – 3,035Deferred compensation 745 736 555 311 312 11,002 13,661Security bonus plan (1) – – – – – 20,823 20,823Total contractual
cash obligations $5,263 $4,837 $2,764 $2,185 $1,393 $35,048 $51,490

18
ANNUAL MEETINGThe annual meeting of stockholders will be held at 10:00 a.m.Tuesday, May 11, 2004 at Corporate Headquarters.
FORM 10-KA copy of the Company’s 2003 Annual Report on Form 10-K to the Securities and Exchange Commission is available withoutcharge to stockholders upon written request to the Secretary of the Company.
CORPORATE HEADQUARTERSLawson Products, Inc.1666 East Touhy Avenue • Des Plaines, Illinois 60018847-827-9666www.lawsonproducts.com
PROFESSIONAL SERVICESAuditorsErnst & Young LLP
Legal CounselMcDermott, Will & EmeryVedder, Price, Kaufman & Kammholz
Report of Independent Auditors
SHARE OWNER SERVICESEquiServe Trust Company, N.A.P.O. Box 43023 • Providence, RI 02940-3023Telephone: (877)498-8861
(Operators are available Monday-Friday, 8:30 a.m. to 7:00 p.m.Eastern time. An interactive automated system is available aroundthe clock every day.)Internet: http://www.equiserve.comAccess your account via the internet: http://gateway.equiserve.com
To the Stockholders and Board of Directors
Lawson Products, Inc.
We have audited the accompanying consolidated balance sheets of Lawson Products, Inc. and subsidiaries as of December 31,2003 and 2002, and the related consolidated statements ofincome, changes in stockholders’ equity, and cash flows for each of the three years in the period ended December 31, 2003. These financial statements are the responsibility of the Company’s management. Our responsibility is to express an opinion on the financial statements based on our audits.
We conducted our audits in accordance with auditing standards generally accepted in the United States. Those standardsrequire that we plan and perform the audit to obtain reasonableassurance about whether the financial statements are free of material misstatement. An audit includes examining, on a testbasis, evidence supporting the amounts and disclosures in thefinancial statements. An audit also includes assessing the accounting principles used and significant estimates made bymanagement, as well as evaluating the overall financial statementpresentation. We believe that our audits provide a reasonablebasis for our opinion.
In our opinion, the financial statements referred to above presentfairly, in all material respects, the consolidated financial positionof Lawson Products, Inc. and subsidiaries at December 31, 2003and 2002, and the consolidated results of their operations andtheir cash flows for each of the three years in the period endedDecember 31, 2003, in conformity with generally acceptedaccounting principles in the United States.
As discussed in Note B to the financial statements, in 2003 theCompany changed its method of accounting for its Investment in a Real Estate Partnership.
As discussed in Note G to the financial statements, in 2002 theCompany changed its method of accounting for goodwill andother intangible assets.
Chicago, IllinoisFebruary 25, 2004
NASDAQ NATIONAL MARKETThe common stock of Lawson Products is part of the NASDAQNational Market System. Stock quotations are included in theNational Market system table in The Wall Street Journal and in leading daily newspapers across the country. These provide thesame high, low and closing transaction prices as are shown forsecurities traded on the New York and other stock exchanges.
Corporate Information
CRITICAL ACCOUNTING POLICIESThe Company has disclosed its accounting policies in Note B to the consolidated financial statements. The following provides supplemental information to these accounting policies as well as information on the accounts requiring more significant estimates.
Allowance for Doubtful Accounts - Methodology: The Company evaluates the collectibility of accounts receivable based on a combination of factors. In circumstances where the Company is aware of a specific customer’s inability to meet its financial obligations (e.g., bankruptcy filings, substantial down-grading of credit ratings), a specific reserve for baddebts is recorded against amounts due to reduce the receivable to theamount the Company reasonably believes will be collected. For all othercustomers, the Company recognizes reserves for bad debts based on theCompany’s historical experience of bad debt write-offs as a percent ofaccounts receivable outstanding. If circumstances change (i.e., higherthan expected defaults or an unexpected material adverse change in amajor customer’s ability to meet its financial obligations), the estimates of the recoverability of amounts due the Company could be revised by amaterial amount.
Inventories - Slow Moving and Obsolescence: The Company carries significant amounts of inventories, which is a part of the Company’s strategy as a competitive advantage in its ability to fulfill the vast majorityof our customers’ orders the same day received. However, this strategyalso increases the chances that portions of the inventory have decreasedin value below their carrying cost. To reduce inventory to a lower of costor market value, the Company records a reserve for slow-moving andobsolete inventory. The Company defines obsolete as those inventory partson hand which the Company plans to discontinue to offer to its customers. Slow-moving inventory is monitored by examining reports of parts which have not been sold for extended periods. The Company records thereserve needed based on its historical experience of how much the sellingprices must be reduced to move these obsolete and slow-moving products. If experience or market conditions change, estimates of thereserves needed could be revised by a material amount.
Impact of Inflation and Changing Prices: The Company has continuedto pass on to its customers most increases in product costs. Accordingly,gross margins have not been materially impacted. The impact from inflation has been more significant on the Company’s fixed and semi-variable operating expenses, primarily wages and benefits, althoughto a lesser degree in recent years due to moderate inflation levels.
Although the Company expects that future costs of replacing warehouseand distribution facilities will rise due to inflation, such higher costs arenot anticipated to have a material effect on future earnings.

19
BOARD OF DIRECTORS
Robert J. WashlowChairman of the BoardChief Executive Officer
Lee S. Hillman(President, Liberation Investment Group)
Mitchell H. Saranow(Chairman, Saranow Group LLC) Chairman,Nominating and Governance Committee
CORPORATE OFFICERS
Jeffrey B. BelfordPresident and Chief Operating Officer
Thomas NeriExecutive Vice President, Chief Financial Officer, and Treasurer
Joseph L. PawlickSenior Vice President, Accounting
Victor GalvezVice President, Controller
SUBSIDIARIES AND DIVISIONS
CRONATRON WELDING SYSTEMS INC.Susan CollinsPresident
KENT AUTOMOTIVEThomas PavlickVice President and General Manager
C.B. LYNNScott McCulloughVice President and General Manager
INSIDE SALES Geoffrey R. TurnerDirector
Sidney L. PortVice Chairman, Board of Directors
Ronald B. Port, M.D.(Retired Physician)Chairman, Variance Committee
Jerome ShafferVice President and Special Advisor to theChief Executive Officer
James T. Brophy(Private Investor)Chairman, Audit Committee
Robert G. Rettig(Consultant)Chairman, Compensation Committee
Wilma J. Smelcer(Former Chairman,Bank of America, Illinois)
Robert J. WashlowChairman of the Board and Chief Executive Officer
Roger F. CannonExecutive Vice President, Chief Officer,Field Sales Strategy and Development
John J. MurrayGroup President, MRO and New Channels
James J. SmithVice President, Human Resources
Scott StephensVice President, Finance
Sidney L. PortVice Chairman of the Board of Directors
Neil E. JenkinsExecutive Vice President, Secretary and General Counsel
Jerome ShafferVice President and Special Advisor to theChief Executive Officer
Daniel N. LuberVice President, Corporate Planning andDevelopment
William HolmesVice President, Assistant Treasurer
LAWSON PRODUCTS, MROJames W. DegnanPresident
ASSEMBLY COMPONENT SYSTEMS, INC.Richard SchwindPresident and Chief Operating Officer
LAWSON PRODUCTS, INC.ONTARIOScott R. AimersVice President and General Manager
LAWSON PRODUCTS DE MEXICOCarlos LopezManaging Director
DRUMMOND AMERICAN CORPORATIONR. Steve BroomeExecutive Vice President, Business Development
AUTOMATIC SCREW MACHINEPRODUCTS COMPANYMichael SelbyPresident
ASSEMBLY COMPONENT SYSTEMSLIMITED UKVernon PearceDirector UK Operations
SPECTRUM INDUSTRIAL SOLUTIONSWarren LudvigsenVice President

20
Products, Services and SystemsKeeping Businesses Running, All Day - Every Day
LAWSON PRODUCTS, INC.and named subsidiaries in Canada, Mexico and the United Kingdom: Provides abrasives, electricalitems, fasteners, fittings, hardware, hoses, hydraulics, pneumatics, supplies and tools, togetherwith engineering consultations and inventory control solutions for the maintenance and repairrequirements of customers.
CRONATRON WELDING SYSTEMS, INC.Provides maintenance and repair operations with metallurgical solutions, welding equipment and supplies, wearplate, rods, polymers and powders along with inventory control systems.
DRUMMOND AMERICAN CORPORATIONProvides specialty chemical solutions and inventory control systems to maintenance and repair operations.
J.I. HOLCOMB (a Division of Drummond American Corp.)J.I. Holcomb offers to the Food Service and Housekeeping Industries "Preventative DrainMaintenance, Odor Control, Grease Trap and Ejector Pit Services & Systems" along with relatedSpecialty Chemical Products.
KENT AUTOMOTIVEKent Automotive offers a broad range of specialty, high performance, problem-solving productsystems for the automotive collision and mechanical repair aftermarket.
ASSEMBLY COMPONENT SYSTEMS, INC.Provides original equipment manufacturers with just-in-time inventories of custom-ordered component parts with in-plant inventory systems or vendor-managed inventory systems through electronic commerce mechanisms.
AUTOMATIC SCREW MACHINE PRODUCTS COMPANY, INC.Manufacturer of specialized screw machine parts for the OEM and MRO marketplaces.
C.B. LYNN COMPANYA custom solutions provider for obtaining special items and non-stock items supplemental tothose products, parts and supplies regularly inventoried by the Family of Businesses.
SPECTRUM INDUSTRIAL SOLUTIONSCustomized Inventory Management Systems and Solutions provider servicing in-plant MRO customers utilizing a wide array of channel options to support uptime goals, achieve supply chaininitiatives, system efficiencies, and to provide total cost effectiveness.
Lawson Family of Businesses

21
Lawson Products, Inc. is an international seller and distributor of products,
services and systems to the industrial, commercial and institutional
maintenance, repair and replacement marketplace. The Company also
manufactures, sells and distributes production and specialized component
parts to the original equipment marketplace including the automotive,
appliance, aerospace, construction and transportation industries.
The Company offers to customers over 900,000 products including
fasteners, parts, chemical specialties, hardware, welding supplies and
accessories, pneumatics, hydraulic and other flexible hose fittings, tools,
safety items and electrical and shop supplies.
Customers are currently served from seventeen strategically located facilities
by approximately 1,800 sales representatives in the United States, Puerto
Rico, Canada, Mexico and the United Kingdom.
Lawson Products was founded in 1952 by Sidney L. Port, Vice Chairman
of the Board of Directors.
Profile of Lawson Products, Inc.
Lawson Products, Inc.Corporate Headquarters
1666 East Touhy AvenueDes Plaines, Illinois 60018www.lawsonproducts.com