Embed Size (px)
Citation preview
Fosun Unveils New Branding Initiative2017 holds a special meaning to Fosun as it marks the 25th anniversary of the establishment of the Group and the 10th anniversary of the listing of Fosun International Limited in Hong Kong. The Group also crossed a key milestone in its endeavor to evolve and upgrade its strategy: “With roots in China, Fosun is dedicated to creating customer-to-maker (C2M) ecosystems in health, happiness and wealth. Through continuous innovation and enhanced operations, Fosun’s ecosystems provide high-quality products and services to families around the world”.
In the first half of the year, Fosun relocated its office in Shanghai to the Bund Finance Center (“BFC”). The high-end financial complex, featuring fully automated and eco-friendly facilities, sits on 420,000 square meters of prime real estate along the Huangpu River. BFC combines finance, shopping, tourism, cultural activities and art under one roof and is a showcase of Fosun’s dynamic Hive City concept.
At the heart of BFC is the Fosun Foundation Shanghai. Designed by two British architectural firms, Foster + Partners and Heatherwick Studio, the Fosun Foundation Shanghai features three moving giant bronze tube curtains that resemble bamboo sticks. The moving tubes create a semi-transparent screen that changes the dynamics and lighting from inside the art centre. This modern architectural feat has now become the new cultural art landmark of Shanghai.
Coinciding with the Shanghai office relocation, Fosun also adopted a new branding initiative featuring a new corporate logo, using “Fosunian gold” and a softer font given the Group’s focus on family. The new brand will represent the Group’s upgraded strategy to bring high-quality goods and services to families around the world. Through the One Fosun platform, the Group has unified the brand image across the entire Group and all the portfolio companies.
Centered around Family, Deeply Rooted in China, Innovating a
Global Happiness Ecosystem
PROFIT ATTRIBUTABLE TO OWNERS OF THE PARENTRMB
5,864.5million
CONTENTS
Financial Summary 2 Business Overview 3 Highlights 6 Management Discussion & Analysis 8 Interim Condensed Consolidated 41Statement of Profit or Loss Interim Condensed Consolidated Statement 42 of Comprehensive Income Interim Condensed Consolidated Statement 44 of Financial Position Interim Condensed Consolidated Statement 48of Changes in Equity Interim Condensed Consolidated Statement 50of Cash Flows Notes to Interim Condensed Consolidated 52Financial Statements Statutory Disclosures 81 Corporate Information 94 Glossary 95
FINANCIAL SUMMARY
FOSUN INTERNATIONAL L IMITED I n te r im Repor t 20172
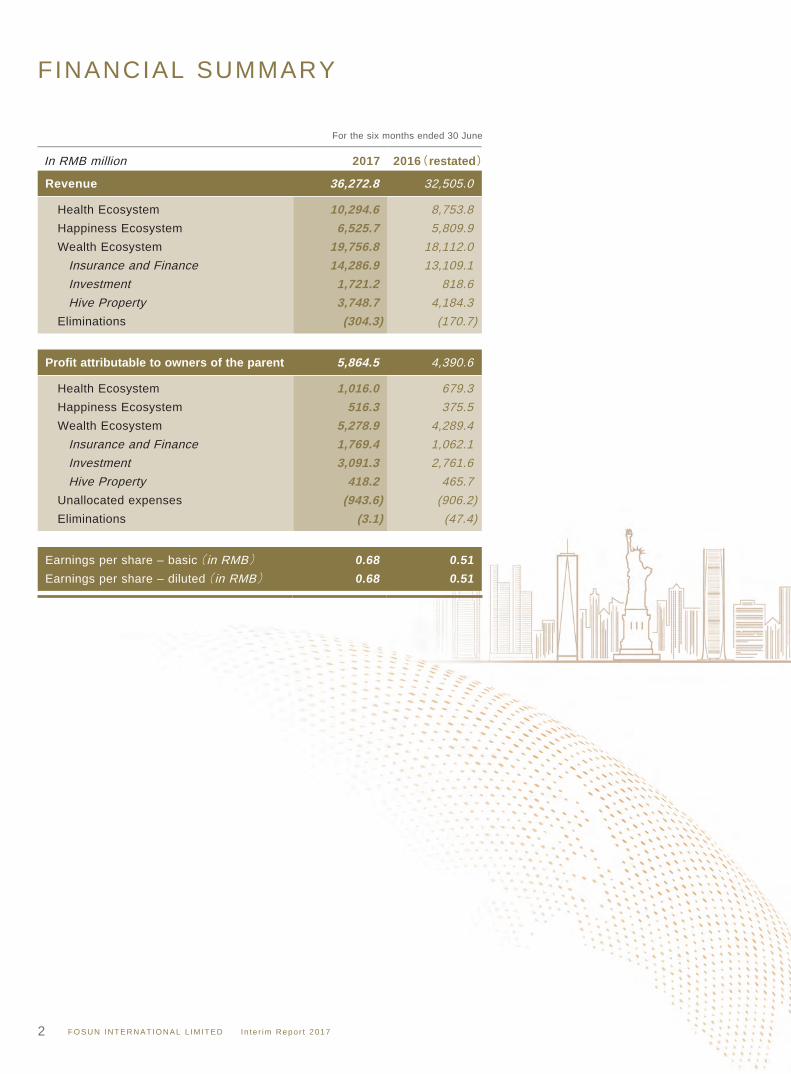
For the six months ended 30 June In RMB million 2017 2016(restated)
Revenue 36,272.8 32,505.0
Health Ecosystem 10,294.6 8,753.8 Happiness Ecosystem 6,525.7 5,809.9 Wealth Ecosystem 19,756.8 18,112.0 Insurance and Finance 14,286.9 13,109.1 Investment 1,721.2 818.6 Hive Property 3,748.7 4,184.3 Eliminations (304.3) (170.7)
Profit attributable to owners of the parent 5,864.5 4,390.6
Health Ecosystem 1,016.0 679.3 Happiness Ecosystem 516.3 375.5 Wealth Ecosystem 5,278.9 4,289.4 Insurance and Finance 1,769.4 1,062.1 Investment 3,091.3 2,761.6 Hive Property 418.2 465.7 Unallocated expenses (943.6) (906.2) Eliminations (3.1) (47.4)
Earnings per share – basic (in RMB) 0.68 0.51Earnings per share – diluted (in RMB) 0.68 0.51
BUSINESS OVERVIEW
FOSUN INTERNATIONAL L IMITED I n te r im Repor t 2017 3
With its roots in China, and through technology and innovation, Fosun’s mission is to create customer-to-maker (C2M) ecosystems in health, happiness and wealth and provide high-quality products and services for families around the world. Fosun was founded in 1992. The Company (00656.HK) has been listed on the Hong Kong Stock Exchange since 2007.
Over the past five years, Fosun has achieved a compound annual growth rate of 25% in our net profit with earnings per share growing at a compound annual growth rate of 18%. This growth rate is contributed by investing in and developing three core ecosystems: health, happiness and wealth; driven primarily by the growing consumption of global families, particularly from China.
In the first half of 2017, Fosun’s three core ecosystems all achieved strong growths, with key family facing platforms such as Fosun Pharma, Club Med, Yuyuan and Fosun Insurance Portugal reporting a strong growth momentum. Leveraging the C2M strategic operating model, the Group’s portfolio companies provide genuine end-to-end connection to Fosun’s ecosystems and provide high-quality products and services to more than 30 million families.
FOSUN INTERNATIONAL L IMITED I n te r im Repor t 20174
Health Ecosystem Happiness Ecosystem
BUSINESS OVERVIEW
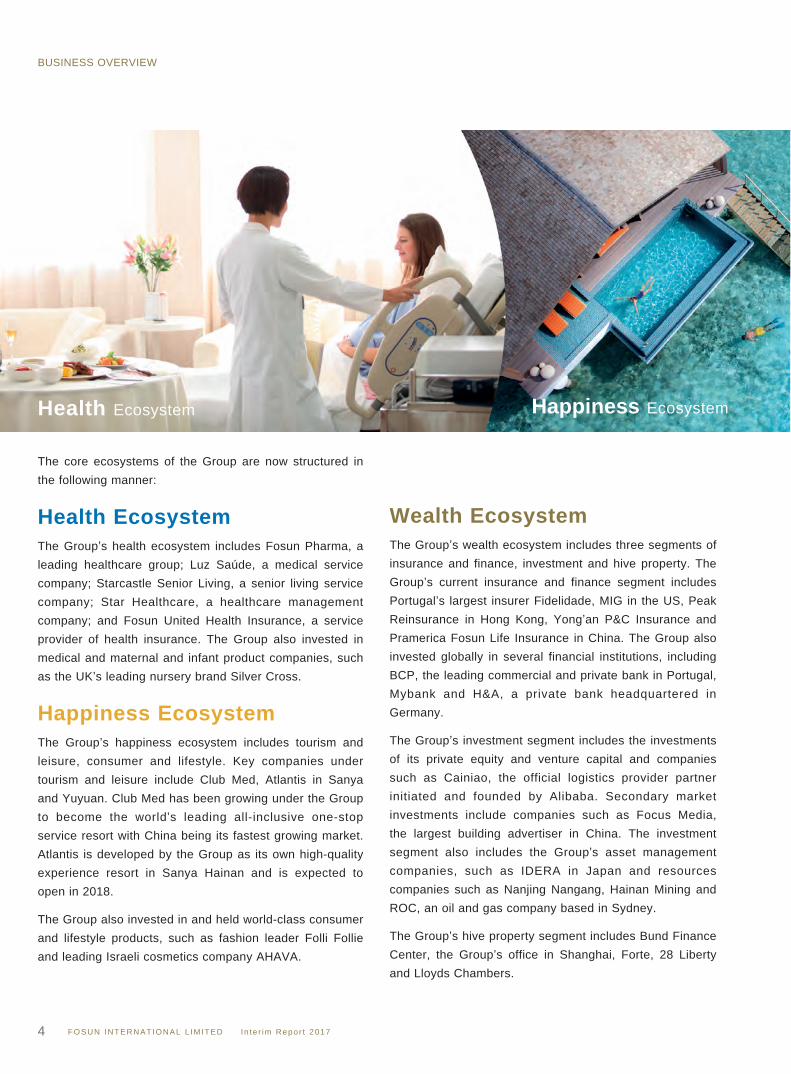
The core ecosystems of the Group are now structured in the following manner:
Health EcosystemThe Group’s health ecosystem includes Fosun Pharma, a leading healthcare group; Luz Saúde, a medical service company; Starcastle Senior Living, a senior living service company; Star Healthcare, a healthcare management company; and Fosun United Health Insurance, a service provider of health insurance. The Group also invested in medical and maternal and infant product companies, such as the UK’s leading nursery brand Silver Cross.
Happiness EcosystemThe Group’s happiness ecosystem includes tourism and leisure, consumer and lifestyle. Key companies under tourism and leisure include Club Med, Atlantis in Sanya and Yuyuan. Club Med has been growing under the Group to become the world’s leading all-inclusive one-stop service resort with China being its fastest growing market. Atlantis is developed by the Group as its own high-quality experience resort in Sanya Hainan and is expected to open in 2018.
The Group also invested in and held world-class consumer and lifestyle products, such as fashion leader Folli Follie and leading Israeli cosmetics company AHAVA.
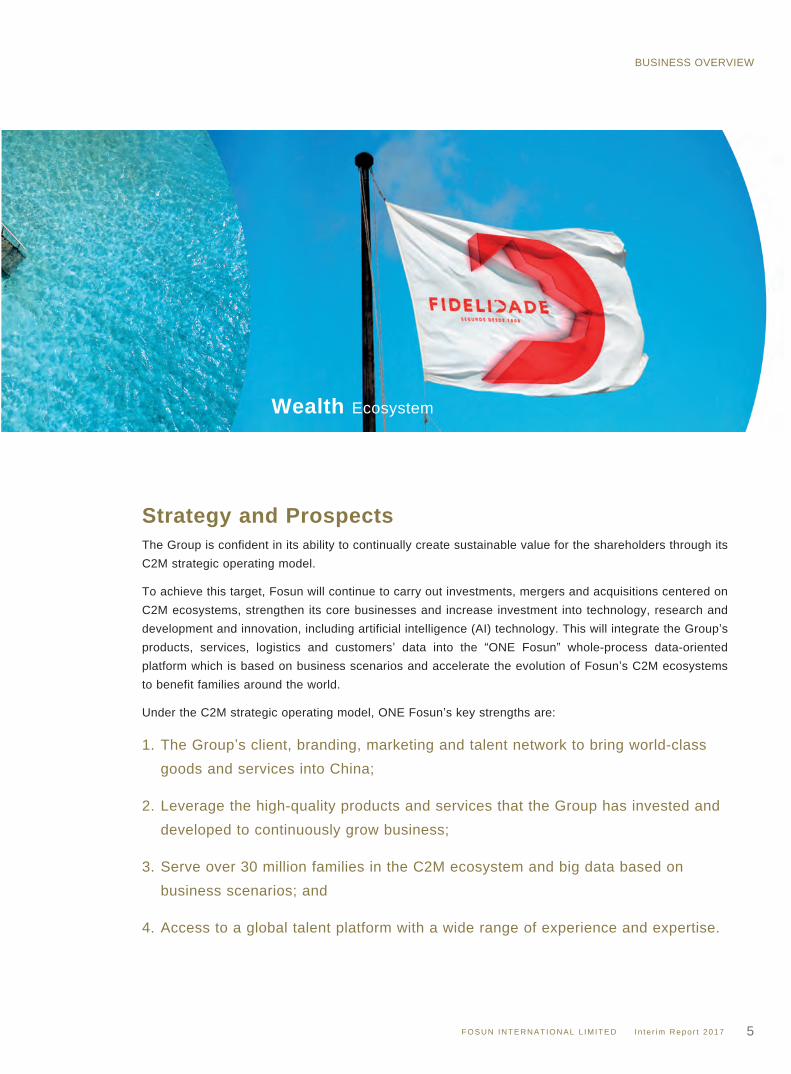
Wealth EcosystemThe Group’s wealth ecosystem includes three segments of insurance and finance, investment and hive property. The Group’s current insurance and finance segment includes Portugal’s largest insurer Fidelidade, MIG in the US, Peak Reinsurance in Hong Kong, Yong’an P&C Insurance and Pramerica Fosun Life Insurance in China. The Group also invested globally in several financial institutions, including BCP, the leading commercial and private bank in Portugal, Mybank and H&A, a private bank headquartered in Germany.
The Group’s investment segment includes the investments of its private equity and venture capital and companies such as Cainiao, the official logistics provider partner initiated and founded by Alibaba. Secondary market investments include companies such as Focus Media, the largest building advertiser in China. The investment segment also includes the Group’s asset management companies, such as IDERA in Japan and resources companies such as Nanjing Nangang, Hainan Mining and ROC, an oil and gas company based in Sydney.
The Group’s hive property segment includes Bund Finance Center, the Group’s office in Shanghai, Forte, 28 Liberty and Lloyds Chambers.
FOSUN INTERNATIONAL L IMITED I n te r im Repor t 2017 5
Wealth Ecosystem
BUSINESS OVERVIEW
Strategy and ProspectsThe Group is confident in its ability to continually create sustainable value for the shareholders through its C2M strategic operating model.
To achieve this target, Fosun will continue to carry out investments, mergers and acquisitions centered on C2M ecosystems, strengthen its core businesses and increase investment into technology, research and development and innovation, including artificial intelligence (AI) technology. This will integrate the Group’s products, services, logistics and customers’ data into the “ONE Fosun” whole-process data-oriented platform which is based on business scenarios and accelerate the evolution of Fosun’s C2M ecosystems to benefit families around the world.
Under the C2M strategic operating model, ONE Fosun’s key strengths are:
1. The Group’s client, branding, marketing and talent network to bring world-class goods and services into China;
2. Leverage the high-quality products and services that the Group has invested and developed to continuously grow business;
3. Serve over 30 million families in the C2M ecosystem and big data based on business scenarios; and
4. Access to a global talent platform with a wide range of experience and expertise.
HIGHLIGHTS
FOSUN INTERNATIONAL L IMITED I n te r im Repor t 20176
Financial Highlights In the first half of 2017, profit attributable to owners of the parent was RMB5.86 billion, a 33.6%
increase from the first half of 2016;
Successful completion of sale of US insurer Ironshore to Liberty Mutual Group Inc. for approximately USD2.94 billion in May 2017, realizing a net gain of approximately USD290 million;
6 successful A share IPOs, 1 international IPO subsequent to the end of the Reporting Period1;
The Group’s cash position2 at the end of June 2017 was RMB78.24 billion, a 50.0% increase from 31 December 2016; and
Net debt as a proportion of total equity (net gearing ratio) decreased from 60.3% as of 31 December 2016 to 47.4% as of 30 June 2017.
Note:1 Including the portfolio companies of the Group.2 It refers to cash and bank and term deposits.
Change over the same period of last year
33.6%In the first half of 2017, profit attributable to owners of the parent
RMB5.86billion
HIGHLIGHTS
FOSUN INTERNATIONAL L IMITED I n te r im Repor t 2017 7
Grew year on year
8.1%Club Med
Net profit of approximately
Euro 89.9million
BCP
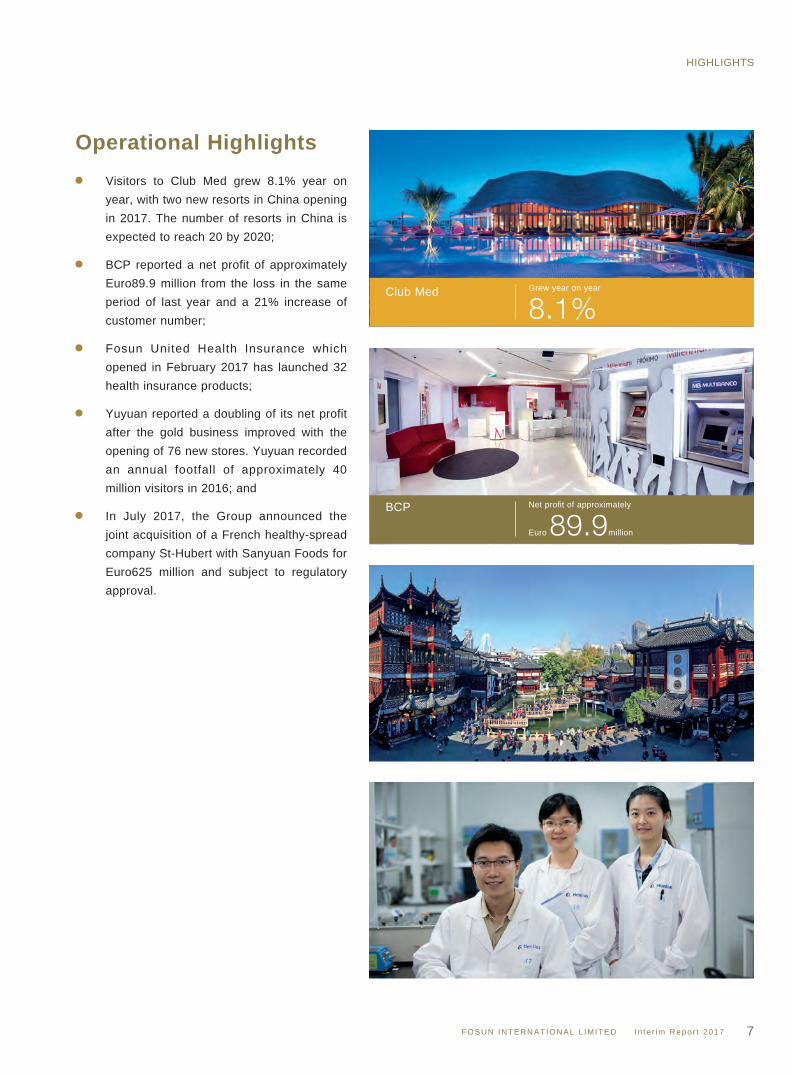
Operational Highlights Visitors to Club Med grew 8.1% year on
year, with two new resorts in China opening in 2017. The number of resorts in China is expected to reach 20 by 2020;
BCP reported a net profit of approximately Euro89.9 million from the loss in the same period of last year and a 21% increase of customer number;
Fosun United Health Insurance which opened in February 2017 has launched 32 health insurance products;
Yuyuan reported a doubling of its net profit after the gold business improved with the opening of 76 new stores. Yuyuan recorded an annual footfall of approximately 40 million visitors in 2016; and
In July 2017, the Group announced the joint acquisition of a French healthy-spread company St-Hubert with Sanyuan Foods for Euro625 million and subject to regulatory approval.
MANAGEMENT DISCUSSION &ANALYSIS
FOSUN INTERNATIONAL L IMITED I n te r im Repor t 20178
Business ReviewAs at the end of the Reporting Period, net assets attributable to owners of the parent of the Group reached RMB98,760.3 million, representing an increase of 6.9% from the end of 2016. During the Reporting Period, profit attributable to owners of the parent of the Group amounted to RMB5,864.5 million, representing an increase of 33.6% over the same period in 2016.
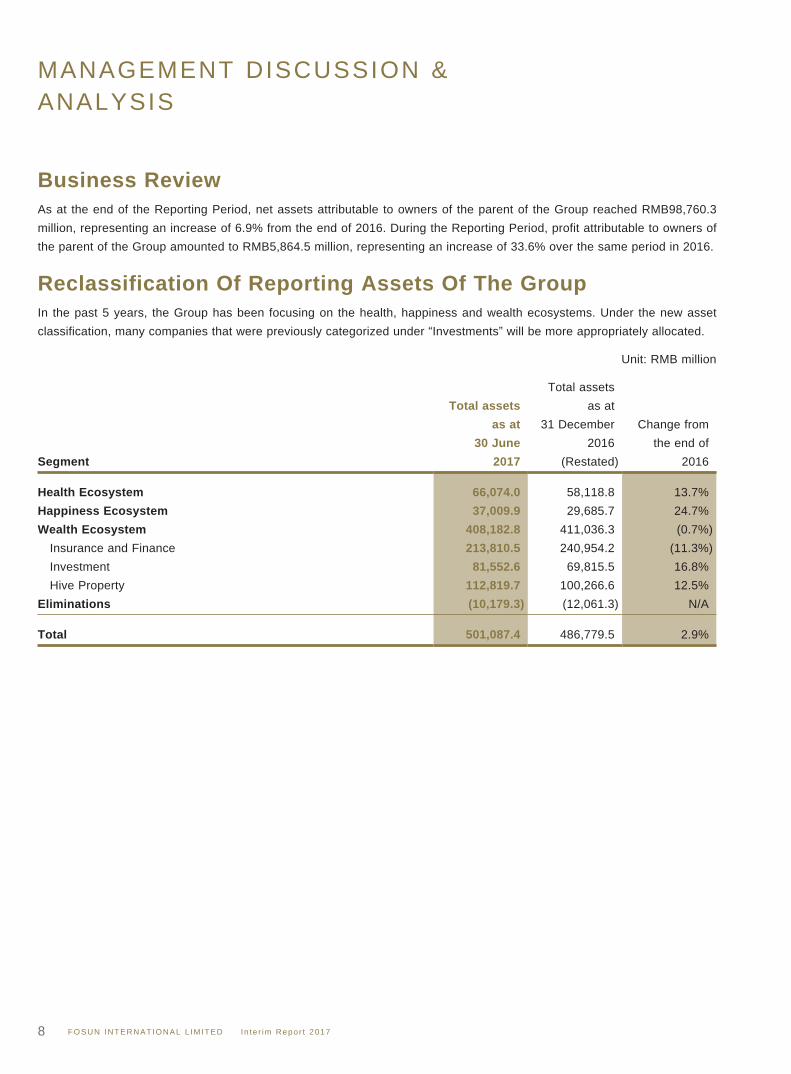
Reclassification Of Reporting Assets Of The GroupIn the past 5 years, the Group has been focusing on the health, happiness and wealth ecosystems. Under the new asset classification, many companies that were previously categorized under “Investments” will be more appropriately allocated.
Unit: RMB million
Segment
Total assetsas at
30 June2017
Total assetsas at
31 December2016
(Restated)
Change fromthe end of
2016 Health Ecosystem 66,074.0 58,118.8 13.7%Happiness Ecosystem 37,009.9 29,685.7 24.7%Wealth Ecosystem 408,182.8 411,036.3 (0.7%) Insurance and Finance 213,810.5 240,954.2 (11.3%) Investment 81,552.6 69,815.5 16.8% Hive Property 112,819.7 100,266.6 12.5%Eliminations (10,179.3) (12,061.3) N/A Total 501,087.4 486,779.5 2.9%
MANAGEMENT DISCUSSION & ANALYSIS
FOSUN INTERNATIONAL L IMITED I n te r im Repor t 2017 9
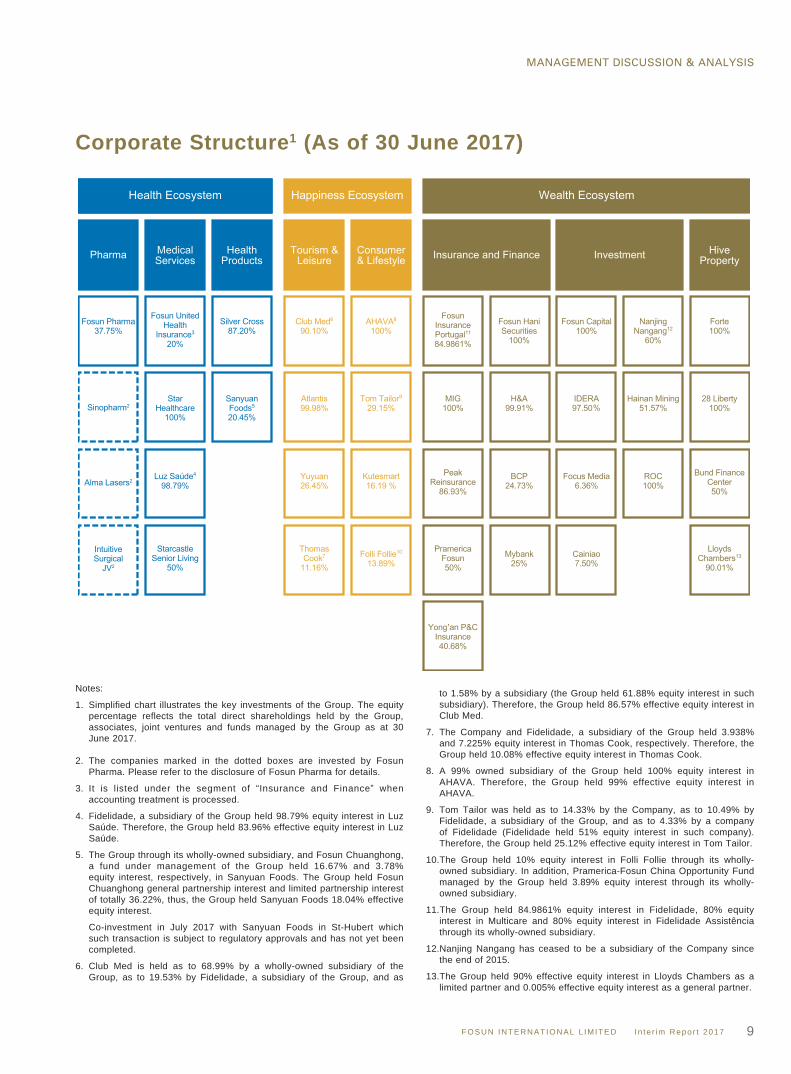
Corporate Structure1 (As of 30 June 2017)
Notes:
1. Simplified chart illustrates the key investments of the Group. The equity percentage reflects the total direct shareholdings held by the Group, associates, joint ventures and funds managed by the Group as at 30 June 2017.
2. The companies marked in the dotted boxes are invested by Fosun Pharma. Please refer to the disclosure of Fosun Pharma for details.
3. It is listed under the segment of “Insurance and Finance” when accounting treatment is processed.
4. Fidelidade, a subsidiary of the Group held 98.79% equity interest in Luz Saúde. Therefore, the Group held 83.96% effective equity interest in Luz Saúde.
5. The Group through its wholly-owned subsidiary, and Fosun Chuanghong, a fund under management of the Group held 16.67% and 3.78% equity interest, respectively, in Sanyuan Foods. The Group held Fosun Chuanghong general partnership interest and limited partnership interest of totally 36.22%, thus, the Group held Sanyuan Foods 18.04% effective equity interest.
Co-investment in July 2017 with Sanyuan Foods in St-Hubert which such transaction is subject to regulatory approvals and has not yet been completed.
6. Club Med is held as to 68.99% by a wholly-owned subsidiary of the Group, as to 19.53% by Fidelidade, a subsidiary of the Group, and as
to 1.58% by a subsidiary (the Group held 61.88% equity interest in such subsidiary). Therefore, the Group held 86.57% effective equity interest in Club Med.
7. The Company and Fidelidade, a subsidiary of the Group held 3.938% and 7.225% equity interest in Thomas Cook, respectively. Therefore, the Group held 10.08% effective equity interest in Thomas Cook.
8. A 99% owned subsidiary of the Group held 100% equity interest in AHAVA. Therefore, the Group held 99% effective equity interest in AHAVA.
9. Tom Tailor was held as to 14.33% by the Company, as to 10.49% by Fidelidade, a subsidiary of the Group, and as to 4.33% by a company of Fidelidade (Fidelidade held 51% equity interest in such company). Therefore, the Group held 25.12% effective equity interest in Tom Tailor.
10.The Group held 10% equity interest in Folli Follie through its wholly-owned subsidiary. In addition, Pramerica-Fosun China Opportunity Fund managed by the Group held 3.89% equity interest through its wholly-owned subsidiary.
11.The Group held 84.9861% equity interest in Fidelidade, 80% equity interest in Multicare and 80% equity interest in Fidelidade Assistência through its wholly-owned subsidiary.
12.Nanjing Nangang has ceased to be a subsidiary of the Company since the end of 2015.
13.The Group held 90% effective equity interest in Lloyds Chambers as a limited partner and 0.005% effective equity interest as a general partner.
During the Reporting Period, the revenue and profit attributable to owners of the parent of the Health Ecosystem segment were as follows:
HEALTH ECOSYSTEMThe Group’s Health Ecosystem business includes three major parts:
Fosun Pharma, Medical Services and Health Products.
MANAGEMENT DISCUSSION & ANALYSIS
FOSUN INTERNATIONAL L IMITED I n te r im Repor t 201710
MANAGEMENT DISCUSSION & ANALYSIS
FOSUN INTERNATIONAL L IMITED I n te r im Repor t 2017 11
During the Reporting Period, the increase in revenue of the Health Ecosystem segment was mainly attributable to the continuous and steady growth of Fosun Pharma’s revenue. The increase in profit attributable to owners of the parent was mainly due to the increase of Fosun Pharma’s profit and the gain on disposal of an available-for-sale investment.
The Group’s Health Ecosystem business includes three major parts: Fosun Pharma, Medical Services and Health Products.
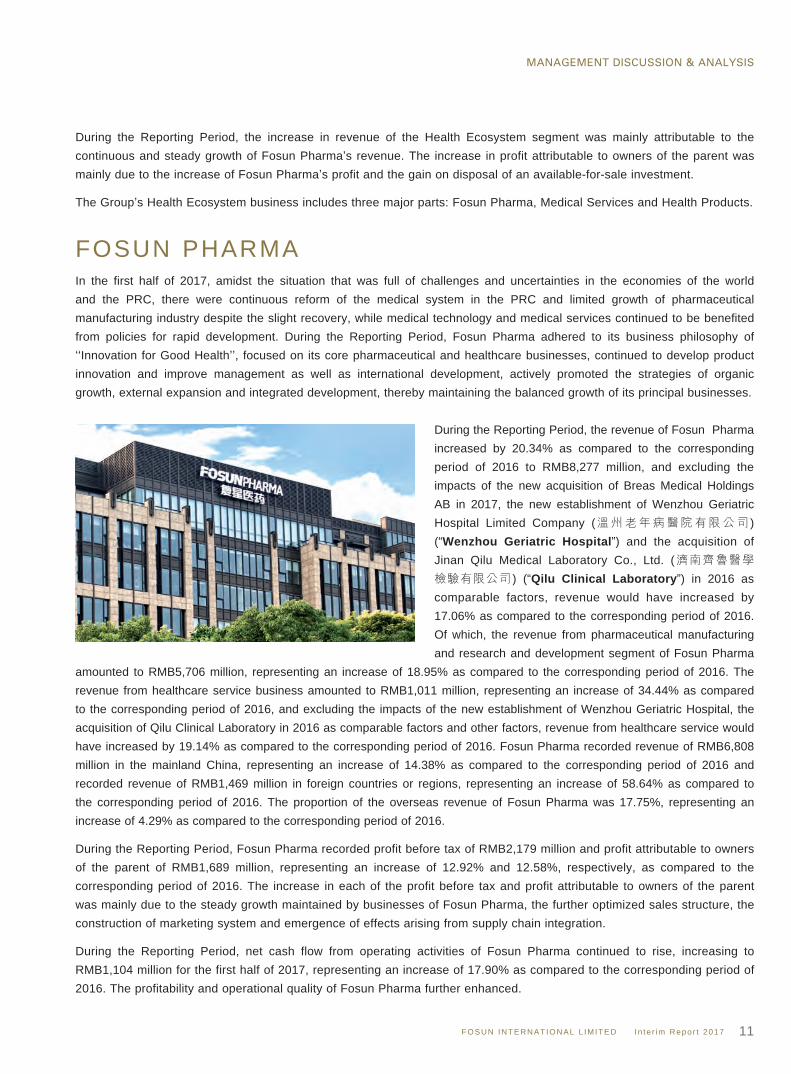
FOSUN PHARMAIn the first half of 2017, amidst the situation that was full of challenges and uncertainties in the economies of the world and the PRC, there were continuous reform of the medical system in the PRC and limited growth of pharmaceutical manufacturing industry despite the slight recovery, while medical technology and medical services continued to be benefited from policies for rapid development. During the Reporting Period, Fosun Pharma adhered to its business philosophy of ‘‘Innovation for Good Health’’, focused on its core pharmaceutical and healthcare businesses, continued to develop product innovation and improve management as well as international development, actively promoted the strategies of organic growth, external expansion and integrated development, thereby maintaining the balanced growth of its principal businesses.
During the Reporting Period, the revenue of Fosun Pharma increased by 20.34% as compared to the corresponding period of 2016 to RMB8,277 million, and excluding the impacts of the new acquisition of Breas Medical Holdings AB in 2017, the new establishment of Wenzhou Geriatric Hospital Limited Company (溫州老年病醫院有限公司 ) (“Wenzhou Geriatric Hospital”) and the acquisition of Jinan Qilu Medical Laboratory Co., Ltd. (濟南齊魯醫學檢驗有限公司 ) (“Qilu Clinical Laboratory”) in 2016 as comparable factors, revenue would have increased by 17.06% as compared to the corresponding period of 2016. Of which, the revenue from pharmaceutical manufacturing and research and development segment of Fosun Pharma
amounted to RMB5,706 million, representing an increase of 18.95% as compared to the corresponding period of 2016. The revenue from healthcare service business amounted to RMB1,011 million, representing an increase of 34.44% as compared to the corresponding period of 2016, and excluding the impacts of the new establishment of Wenzhou Geriatric Hospital, the acquisition of Qilu Clinical Laboratory in 2016 as comparable factors and other factors, revenue from healthcare service would have increased by 19.14% as compared to the corresponding period of 2016. Fosun Pharma recorded revenue of RMB6,808 million in the mainland China, representing an increase of 14.38% as compared to the corresponding period of 2016 and recorded revenue of RMB1,469 million in foreign countries or regions, representing an increase of 58.64% as compared to the corresponding period of 2016. The proportion of the overseas revenue of Fosun Pharma was 17.75%, representing an increase of 4.29% as compared to the corresponding period of 2016.
During the Reporting Period, Fosun Pharma recorded profit before tax of RMB2,179 million and profit attributable to owners of the parent of RMB1,689 million, representing an increase of 12.92% and 12.58%, respectively, as compared to the corresponding period of 2016. The increase in each of the profit before tax and profit attributable to owners of the parent was mainly due to the steady growth maintained by businesses of Fosun Pharma, the further optimized sales structure, the construction of marketing system and emergence of effects arising from supply chain integration.
During the Reporting Period, net cash flow from operating activities of Fosun Pharma continued to rise, increasing to RMB1,104 million for the first half of 2017, representing an increase of 17.90% as compared to the corresponding period of 2016. The profitability and operational quality of Fosun Pharma further enhanced.
MANAGEMENT DISCUSSION & ANALYSIS
FOSUN INTERNATIONAL L IMITED I n te r im Repor t 201712
MEDICAL SERVICES
Star Healthcare
Star Healthcare is a wholly-owned subsidiary of the Group following an initial capital injection of RMB50 million. Star Healthcare is devoted to integrate the Group’s internal and external eminent medical resources, with an aim to provide one-stop and whole-process health management service and third-party insurance service for mid- to high-end member and corporate customers.
As at the end of the Reporting Period, Star Healthcare has launched different one-stop healthcare management products targeting mid- to high-end member customers, with employee healthcare benefits planning products targeting corporate customers, innovative fusion products targeting insurance customers and healthcare service products targeting mothers with their children. Star Healthcare has formed a professional service team comprising insurance settlement specialists, medical experts, health managers and nutritionists to provide professional health management services to target customers through their own proprietary multimedia customer service system and healthcare management system.
In the first half of 2017, the direct billing network resources of Star Healthcare in China mainly concentrated on 30 provinces, including 119 cities with approximately 500 cooperative medical checkup institutions. By leveraging the leading insurance settlement core system within the industry, Star Healthcare provided professional direct payment of medical management and settlement services for insurance companies.
Luz Saúde
Luz Saúde is a leading private healthcare provider group in Portugal with 98.79% of its capital held by Fidelidade as of 30 June 2017. Luz Saúde owns eleven private hospitals, one national health service hospital under a public private partnership, eight private ambulatory clinics and two senior residences. Luz Saúde has been operating in the Madeira archipelago since the beginning of this year.
In the first half of 2017, Luz Saúde provided 1,430 beds and continued its growth in the Portuguese private healthcare market, namely through the acquisition of a hospital and a clinic in Madeira archipelago and subsequent to the Reporting Period, acquired a British hospital group in Lisbon.
Luz Saúde’s operating revenue increased by 4.3% comparing to the same period of 2016, reaching Euro241.2 million, mainly driven by the 4.9% growth of the private segment; EBITDA of Euro26.8 million in the first half of 2017 and EBITDA margin of 11.1%, representing a 1 percentage point decrease compared to the same period of 2016. The profit attributable to owners of the parent was Euro8.7 million compared to Euro10.0 million of the same period in 2016.
In the first half of 2017, Luz Saúde opened the expanded area of Hospital da Luz Arrábida in the Oporto region. Hospital da Luz Lisboa (already the largest private hospital in the country) and Hospital da Luz Oeiras are also undergoing their expansions. In addition, a new private hospital in Vila Real (north of Portugal) is also under construction in order to reinforce its presence in the region with an aim to expand its client base.
MANAGEMENT DISCUSSION & ANALYSIS
FOSUN INTERNATIONAL L IMITED I n te r im Repor t 2017 13
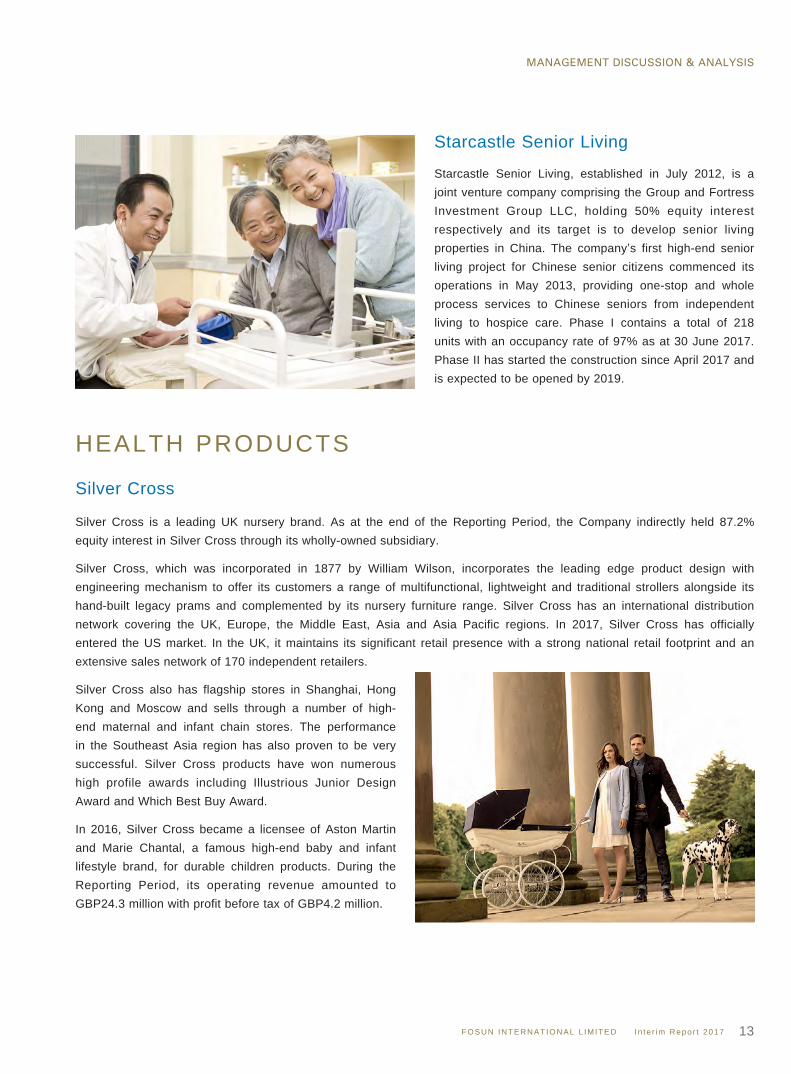
Starcastle Senior Living
Starcastle Senior Living, established in July 2012, is a joint venture company comprising the Group and Fortress Investment Group LLC, holding 50% equity interest respectively and its target is to develop senior living properties in China. The company’s first high-end senior living project for Chinese senior citizens commenced its operations in May 2013, providing one-stop and whole process services to Chinese seniors from independent living to hospice care. Phase I contains a total of 218 units with an occupancy rate of 97% as at 30 June 2017. Phase II has started the construction since April 2017 and is expected to be opened by 2019.
HEALTH PRODUCTS
Silver Cross
Silver Cross is a leading UK nursery brand. As at the end of the Reporting Period, the Company indirectly held 87.2% equity interest in Silver Cross through its wholly-owned subsidiary.
Silver Cross, which was incorporated in 1877 by William Wilson, incorporates the leading edge product design with engineering mechanism to offer its customers a range of multifunctional, lightweight and traditional strollers alongside its hand-built legacy prams and complemented by its nursery furniture range. Silver Cross has an international distribution network covering the UK, Europe, the Middle East, Asia and Asia Pacific regions. In 2017, Silver Cross has officially entered the US market. In the UK, it maintains its significant retail presence with a strong national retail footprint and an extensive sales network of 170 independent retailers.
Silver Cross also has flagship stores in Shanghai, Hong Kong and Moscow and sells through a number of high-end maternal and infant chain stores. The performance in the Southeast Asia region has also proven to be very successful. Silver Cross products have won numerous high profile awards including Illustrious Junior Design Award and Which Best Buy Award.
In 2016, Silver Cross became a licensee of Aston Martin and Marie Chantal, a famous high-end baby and infant lifestyle brand, for durable children products. During the Reporting Period, its operating revenue amounted to GBP24.3 million with profit before tax of GBP4.2 million.
MANAGEMENT DISCUSSION & ANALYSIS
FOSUN INTERNATIONAL L IMITED I n te r im Repor t 201714
Sanyuan Foods
The Group made a domestic investment in Sanyuan Foods in February 2015. As at the end of the Reporting Period, the Group and Fosun Chuanghong, a fund managed by the Group, held an equity interest of 16.67% and 3.78% in Sanyuan Foods respectively.
Sanyuan Foods is one of China’s largest state-owned and renowned brands in the dairy industry of China. Being famous for the quality and safety of its products, it enjoys significant market advantages in Beijing and other peripheral markets.
After acquiring shares in Sanyuan Foods, Fosun utilized its global resources to assist Sanyuan Foods to enhance its leading position in the dairy industry of China through formulating corporate strategies and introducing merger and acquisition targets for realizing integrated development.
In 2016, Sanyuan Foods completed the merger of “Baxy (八喜 )”, a domestic leading brand in ice-cream industry, and a Canadian high-end organic dairy brand. Meanwhile, Sanyuan Foods has also successfully launched new products, such as “Iceland yogurt (冰島式酸奶 )” and “Light Energy (輕能 )”. In order to upgrade the company products and to realize large-scale and professional production, Sanyuan Foods set up a dairy processing, research and development and logistics center for dairy products to process 1,000 tonnes of fresh milk on a daily basis in the Xinle Economic and Development Zone of Shijiazhuang, Hebei.
As at 30 June 2017, Sanyuan Foods recorded operating revenue of RMB3,088.7 million, and profit attributable to shareholders of the listed company amounted to RMB34.5 million.
Sun Paper
In October 2016, the Group, being a strategic investor, made an investment in China’s leading paper enterprise, Sun Paper, with an accumulated investment of RMB1.14 billion to hold 7.49% of shares.
The Group believes that the paper industry is picking up momentum from the further advancement of China’s supply-side reform. Sun Paper is a leading enterprise in the paper industry in various aspects such as profitability, operational capacity and environmental protection. Sun Paper leads the transformation and enhancement of the traditional paper industry by devotedly using high-technologies, and has developed a number of subversive technologies and won a number of honors such as the National Science and Technology Progress Award. Sun Paper is a leader in the use of biomass, one of the new biological materials, and its scale of utilizing this material ranked first in China and third in the world. Furthermore, the fast-moving consumer goods represented by diapers have significant growth potential. Sun Paper’s integrated operations, from its forestry-pulp-paper operations, upstream and downstream industrial operations, to its production of fast moving consumer goods (such as tissues and baby diapers) enable the Group to achieve synergies.
After investing in Sun Paper, the Group has been actively seeking for different integrations synergies through integration within the health ecosystem. For example, Sun Paper is now able to partner with a prominent online portal for mothers, by allowing the user data to simulate accurate analysis and research on customer demands.
As of the first quarter of 2017, revenue in the amount of RMB4,410.9 million was realized and profit attributable to shareholders of the listed company amounted to RMB440.1 million.
MANAGEMENT DISCUSSION & ANALYSIS
FOSUN INTERNATIONAL L IMITED I n te r im Repor t 2017 15
Juewei Food
In March 2011, the Group invested RMB104 million in Juewei Food to hold 8% of shares. In March 2017, Juewei Food was listed on the SSE with stock code 603517 and the Group held 28.8 million shares with a diluted shareholding of 7.02% after listing. On 30 June 2017, the closing price of Juewei Food was RMB34.87 per share and its total market capitalization was approximately RMB14,297 million.
Juewei Food, a company mainly engaged in the research and development, production and sales of braised foods, is the leader in the braised food products industry. Its current market share in China’s leisure braised products amounts to 8.9%. Being benefited from the rapid development of the leisure fast moving consumer goods market in China, there are significant rooms for future growth in the braised food products market.
Juewei Food has an established direct sale and franchise chain sales network covering 29 provinces/municipalities. As at the end of the Reporting Period, Juewei Food had more than 3,000 franchisees and more than 8,000 offline stores nationwide, leading the market of China in terms of the number of stores and the coverage of sales networks.
As at 30 June 2017, it recorded operating revenue of RMB1,851.4 million, and profit attributable to shareholders of the listed company amounted to RMB237.7 million.
MANAGEMENT DISCUSSION & ANALYSIS
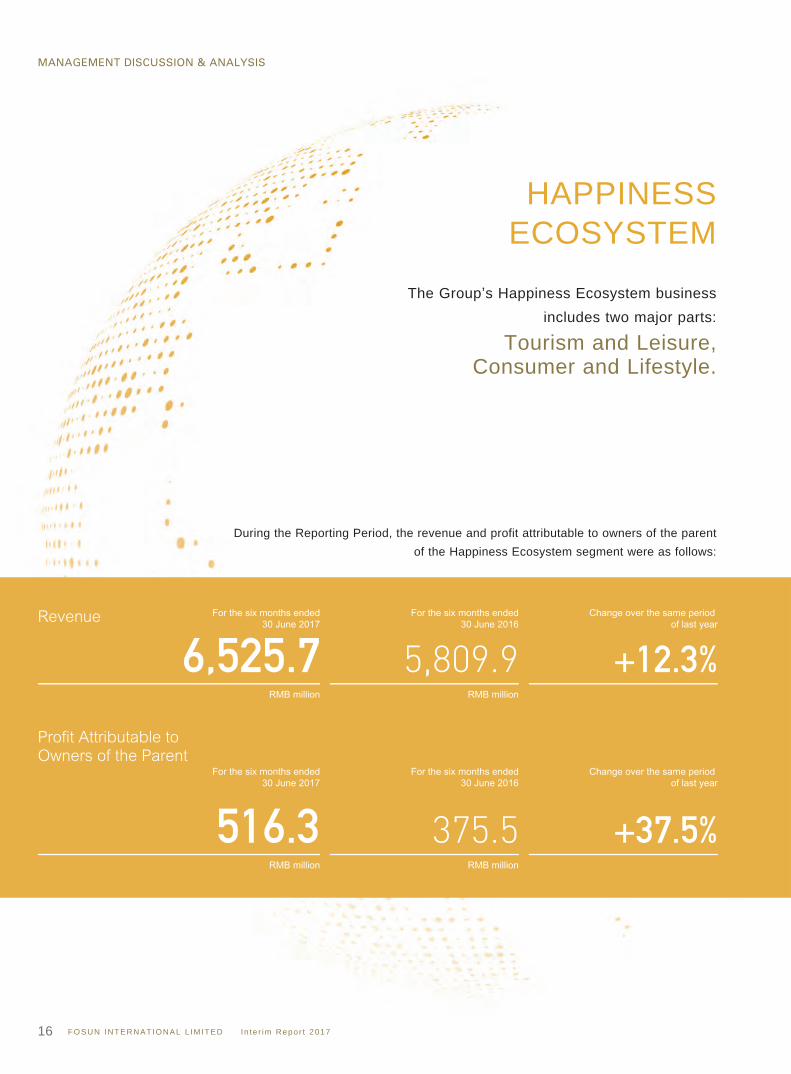
During the Reporting Period, the revenue and profit attributable to owners of the parent of the Happiness Ecosystem segment were as follows:
HAPPINESSECOSYSTEM
The Group’s Happiness Ecosystem business includes two major parts:
Tourism and Leisure, Consumer and Lifestyle.
FOSUN INTERNATIONAL L IMITED I n te r im Repor t 201716
MANAGEMENT DISCUSSION & ANALYSIS
FOSUN INTERNATIONAL L IMITED I n te r im Repor t 2017 17
During the Reporting Period, the increase in revenue of the Happiness Ecosystem segment was mainly due to the revenue growth as a result of business expansion of Club Med. The increase in profit attributable to owners of the parent was mainly attributable to the good performance of Club Med and Yuyuan during the first half of 2017, and also to the gain on disposal of an available-for-sale investment.
The Group’s Happiness Ecosystem business includes two major parts: Tourism and Leisure, Consumer and Lifestyle.
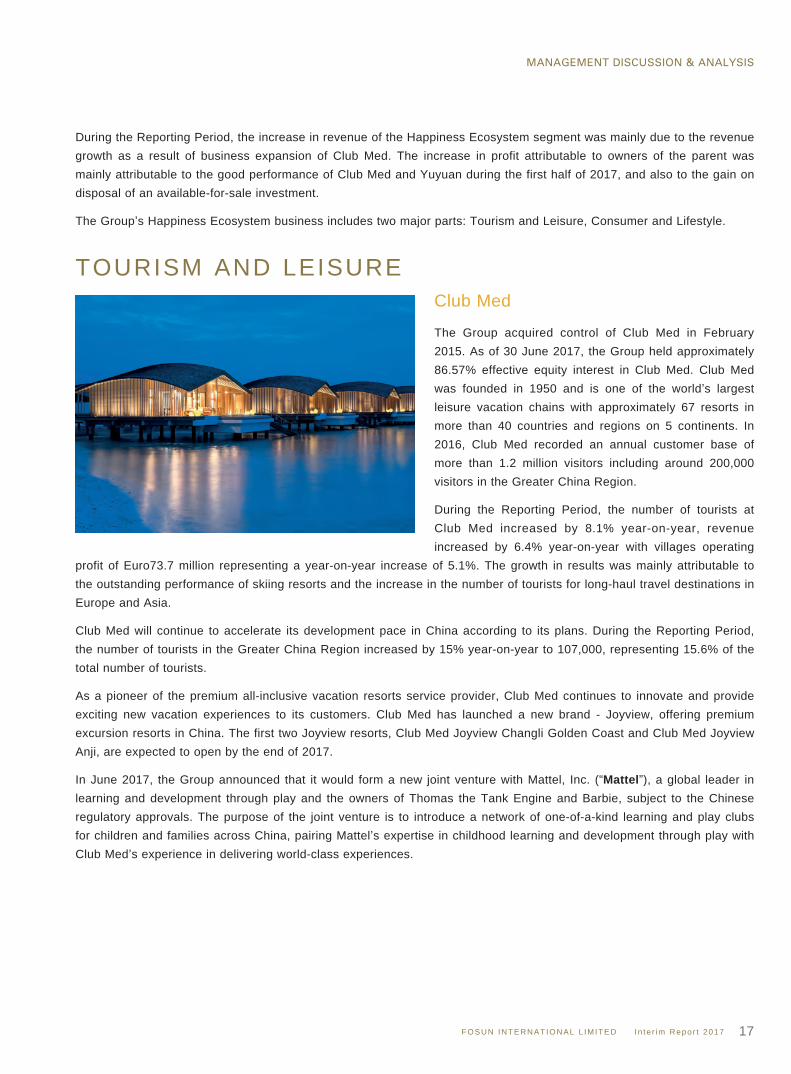
TOURISM AND LEISUREClub Med
The Group acquired control of Club Med in February 2015. As of 30 June 2017, the Group held approximately 86.57% effective equity interest in Club Med. Club Med was founded in 1950 and is one of the world’s largest leisure vacation chains with approximately 67 resorts in more than 40 countries and regions on 5 continents. In 2016, Club Med recorded an annual customer base of more than 1.2 million visitors including around 200,000 visitors in the Greater China Region.
During the Reporting Period, the number of tourists at Club Med increased by 8.1% year-on-year, revenue increased by 6.4% year-on-year with villages operating
profit of Euro73.7 million representing a year-on-year increase of 5.1%. The growth in results was mainly attributable to the outstanding performance of skiing resorts and the increase in the number of tourists for long-haul travel destinations in Europe and Asia.
Club Med will continue to accelerate its development pace in China according to its plans. During the Reporting Period, the number of tourists in the Greater China Region increased by 15% year-on-year to 107,000, representing 15.6% of the total number of tourists.
As a pioneer of the premium all-inclusive vacation resorts service provider, Club Med continues to innovate and provide exciting new vacation experiences to its customers. Club Med has launched a new brand - Joyview, offering premium excursion resorts in China. The first two Joyview resorts, Club Med Joyview Changli Golden Coast and Club Med Joyview Anji, are expected to open by the end of 2017.
In June 2017, the Group announced that it would form a new joint venture with Mattel, Inc. (“Mattel”), a global leader in learning and development through play and the owners of Thomas the Tank Engine and Barbie, subject to the Chinese regulatory approvals. The purpose of the joint venture is to introduce a network of one-of-a-kind learning and play clubs for children and families across China, pairing Mattel’s expertise in childhood learning and development through play with Club Med’s experience in delivering world-class experiences.
MANAGEMENT DISCUSSION & ANALYSIS
FOSUN INTERNATIONAL L IMITED I n te r im Repor t 201718
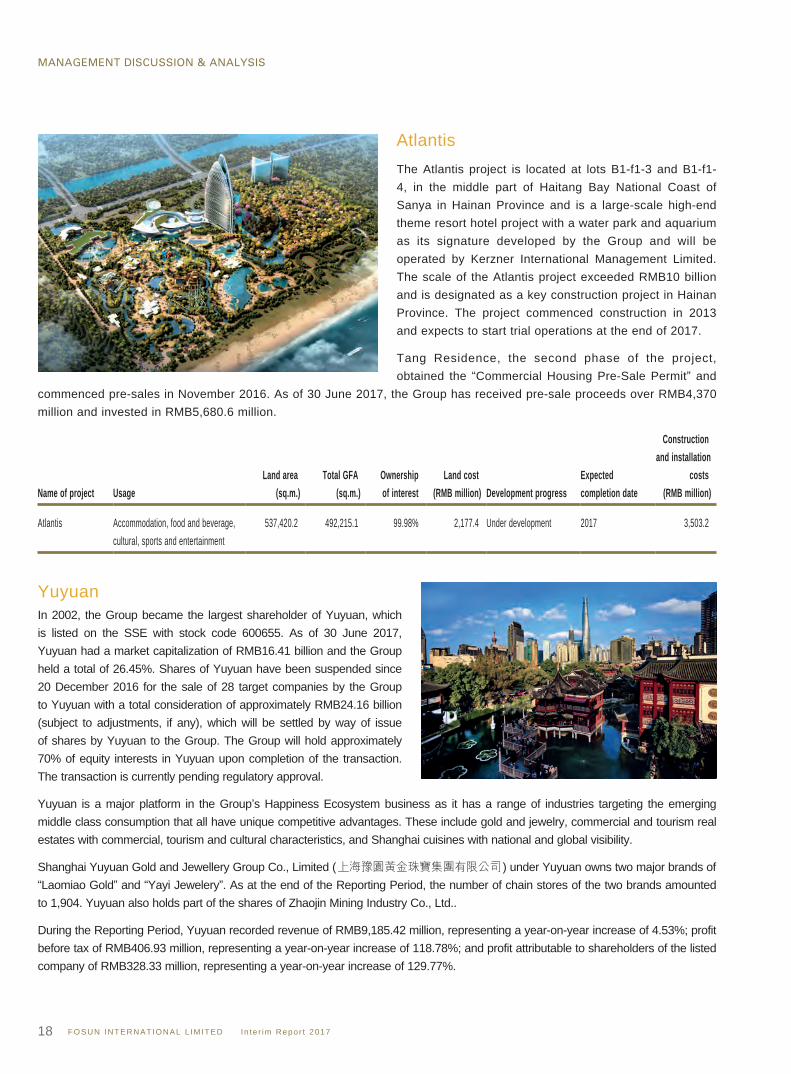
AtlantisThe Atlantis project is located at lots B1-f1-3 and B1-f1-4, in the middle part of Haitang Bay National Coast of Sanya in Hainan Province and is a large-scale high-end theme resort hotel project with a water park and aquarium as its signature developed by the Group and will be operated by Kerzner International Management Limited. The scale of the Atlantis project exceeded RMB10 billion and is designated as a key construction project in Hainan Province. The project commenced construction in 2013 and expects to start trial operations at the end of 2017.
Tang Residence, the second phase of the project, obtained the “Commercial Housing Pre-Sale Permit” and
commenced pre-sales in November 2016. As of 30 June 2017, the Group has received pre-sale proceeds over RMB4,370 million and invested in RMB5,680.6 million.
Name of project UsageLand area
(sq.m.)Total GFA
(sq.m.)Ownershipof interest
Land cost(RMB million) Development progress
Expectedcompletion date
Constructionand installation
costs(RMB million)
Atlantis Accommodation, food and beverage,
cultural, sports and entertainment537,420.2 492,215.1 99.98% 2,177.4 Under development 2017 3,503.2
YuyuanIn 2002, the Group became the largest shareholder of Yuyuan, which is listed on the SSE with stock code 600655. As of 30 June 2017, Yuyuan had a market capitalization of RMB16.41 billion and the Group held a total of 26.45%. Shares of Yuyuan have been suspended since 20 December 2016 for the sale of 28 target companies by the Group to Yuyuan with a total consideration of approximately RMB24.16 billion (subject to adjustments, if any), which will be settled by way of issue of shares by Yuyuan to the Group. The Group will hold approximately 70% of equity interests in Yuyuan upon completion of the transaction. The transaction is currently pending regulatory approval.
Yuyuan is a major platform in the Group’s Happiness Ecosystem business as it has a range of industries targeting the emerging middle class consumption that all have unique competitive advantages. These include gold and jewelry, commercial and tourism real estates with commercial, tourism and cultural characteristics, and Shanghai cuisines with national and global visibility.
Shanghai Yuyuan Gold and Jewellery Group Co., Limited (上海豫園黃金珠寶集團有限公司 ) under Yuyuan owns two major brands of “Laomiao Gold” and “Yayi Jewelery”. As at the end of the Reporting Period, the number of chain stores of the two brands amounted to 1,904. Yuyuan also holds part of the shares of Zhaojin Mining Industry Co., Ltd..
During the Reporting Period, Yuyuan recorded revenue of RMB9,185.42 million, representing a year-on-year increase of 4.53%; profit before tax of RMB406.93 million, representing a year-on-year increase of 118.78%; and profit attributable to shareholders of the listed company of RMB328.33 million, representing a year-on-year increase of 129.77%.
MANAGEMENT DISCUSSION & ANALYSIS
FOSUN INTERNATIONAL L IMITED I n te r im Repor t 2017 19
Thomas Cook
As of 30 June 2017, the Group held approximately 11.16% in Thomas Cook.
Thomas Cook is one of the world’s leading leisure travel groups with a strong position in the European tourism market. For the six months ended 31 March 2017, Thomas Cook recorded revenue of GBP2,994 million, representing an increase of 12% over the same period of last year. After eliminating the effects of exchange rates and oil prices, comparable revenue increased by GBP77 million. Losses for the period decreased by GBP11 million compared with the same period of 2016. During the Reporting Period, Kuyi International Travel Agency (Shanghai) Co., Ltd. (“KUYI”), a joint venture jointly established by the Group and Thomas Cook have commenced its business operations to offer domestic, overseas and MICE (meetings, incentives, conferencing/conventions, exhibitions and events) travel services to the growing middle class population both inside and outside China. As at the end of the Reporting Period, the Group held 51% equity interest in KUYI.
Albion
Shanghai Fosun Albion Tourism Development Company Limited (上海復星愛必儂旅遊發展有限公司 or “Albion”) is a hotel and tourism management company. It is primarily engaged in providing design, technical, operation and management services for popular tourism destinations in the PRC and also providing services for tourists through HO (Holiday Organizer) services. The revenue for the Reporting Period was around RMB4.4 million.
Studio 8
Studio 8, LLC (“Studio 8”) is an important investment made by the Group in the film industry, a significant step for the Group to enter the film and television entertainment industry. As at the end of the Reporting Period, the Group held 80% equity interest in the Class A shares in Studio 8. Billy Lynn’s Long Halftime Walk directed by Ang Lee was co-invested and produced by Studio 8 and Columbia TriStar Motion Picture Group (a company under Sony) and it was released in November 2016. This movie was the first movie in the world applying 120fps 4K3D technology which completely changed the way how film was made.
During the Reporting Period, The Alpha and White Boy Rick (starring Matthew McConaughey), the first two projects developed independently by Studio 8, have been in post-production stage. World premiere is expected by the end of year 2017. In addition, after two and half years of research and development, Studio 8 has reserved around 40 projects, 20 of which are prepared to proceed. Its production capacity will be gradually released in the near future.
MANAGEMENT DISCUSSION & ANALYSIS
FOSUN INTERNATIONAL L IMITED I n te r im Repor t 201720
CONSUMER AND LIFESTYLE
AHAVA
The Group invested RMB539 million into AHAVA in September 2016 and as of 30 June 2017, the Group held 100% equity interest in AHAVA.
AHAVA (Hebrew for ‘love’) is a Dead Sea beauty and wellness brand. It is the only cosmetics brand licensed by the Israeli government to sustainably mine natural mud from the Dead Sea, which has the highest mineral concentration in the world. Globally recognized, AHAVA is also the only cosmetics company with research and development and manufacturing facilities located along the Dead Sea’s shores, giving it a complete understanding of the locality’s natural elements.
In the first half of 2017, AHAVA’s net sales saw positive growth for the first time in the past 3 years with its first 22 Stock Keeping Units (“SKUs”) receiving China Food and Drug Administration approval in May 2017.
Since the acquisition, Fosun has closely cooperated with the Israeli management. AHAVA expects further opportunities in sustainable growth in Israel with more new products to be launched in the second half of 2017. Furthermore, AHAVA expects expansion opportunities in Asia, especially in China. Also, AHAVA expects that more SKUs (over 40) will be approved by China Food and Drug Administration to enter into China in the fourth quarter of 2017 and will be sold through both online and offline channels.
Tom Tailor
The Group first invested in Tom Tailor in 2014. As of 30 June 2017, the Group held 29.15% equity interest in Tom Tailor.
Tom Tailor is an international, vertically integrated fashion company focusing on casual wear in the medium price segment. Its product portfolio is complemented by an extensive range of fashionable accessories and home textiles. With the brands TOM TAILOR and BONITA, Tom Tailor addresses various segments of the fashion market. Tom Tailor is one of the most important investments of the Group in the fashion industry.
Tom Tailor successfully continued implementing its strategic redirection in the first half of 2017. Tom Tailor pursued its “RESET-initiatives” to boost the efficiency and the quality of the earnings and was thus able to achieve visible cost savings. With a new marketing strategy, spearheaded by new fashion highlights in its collections and refocused campaign presence, Tom Tailor aims to strengthen its core brands in the fierce competitive fashion industry. Tom Tailor is already much further along with its RESET cost and process optimization program than it originally planned. With the momentum following the second successful capital increase and the generated net proceeds, now Tom Tailor is ushering in phase two “the prudent development of growth initiatives”.
As the major strategic investor, the Group continues to be involved in the development of Tom Tailor.
MANAGEMENT DISCUSSION & ANALYSIS
FOSUN INTERNATIONAL L IMITED I n te r im Repor t 2017 21
Kutesmart
The Group invested in Kutesmart in 2015 and as of 30 June 2017, the Group owned 16.19% equity interest. Kutesmart is a well-known enterprise in the transformation and upgrade of domestic textile and garment industry and in the field of smart manufacturing, realizing data-driven processes from key user information, building a seamless manufacturing connection between consumers and manufacturer.
Its leading edge of flexible manufacturing ensures a rapid growth of its performance. In the first half of 2017, the sales volume of trailer-made garments by Kutesmart grew by over 50% compared to the same period of 2016. The Group hopes that through its investment in Kutesmart, it will become an integral part of the Group’s C2M ecosystem to form good synergies with relevant enterprises of the Group’s consumer and lifestyle part of the happiness segment.
Looking forward to the second half of 2017, with the further increase in production capacity, Kutesmart will continue to display better growth, and its influence and visibility are expected to be further enhanced.
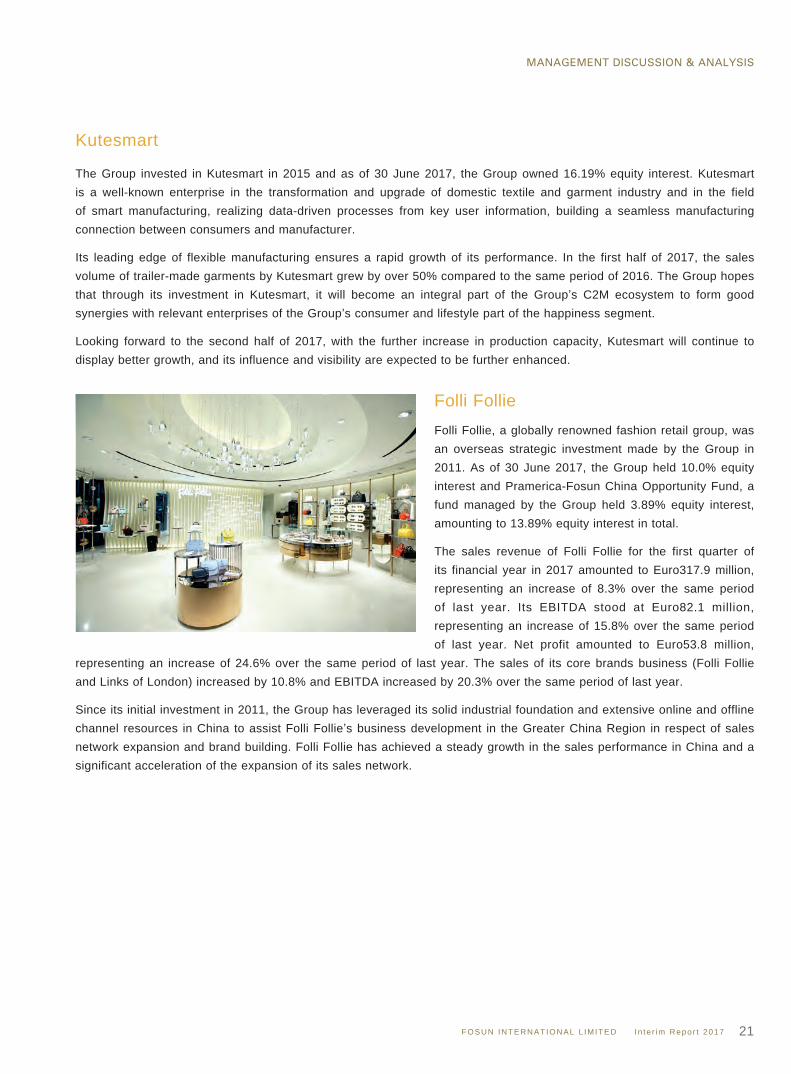
Folli FollieFolli Follie, a globally renowned fashion retail group, was an overseas strategic investment made by the Group in 2011. As of 30 June 2017, the Group held 10.0% equity interest and Pramerica-Fosun China Opportunity Fund, a fund managed by the Group held 3.89% equity interest, amounting to 13.89% equity interest in total.
The sales revenue of Folli Follie for the first quarter of its financial year in 2017 amounted to Euro317.9 million, representing an increase of 8.3% over the same period of last year. Its EBITDA stood at Euro82.1 million, representing an increase of 15.8% over the same period of last year. Net profit amounted to Euro53.8 million,
representing an increase of 24.6% over the same period of last year. The sales of its core brands business (Folli Follie and Links of London) increased by 10.8% and EBITDA increased by 20.3% over the same period of last year.
Since its initial investment in 2011, the Group has leveraged its solid industrial foundation and extensive online and offline channel resources in China to assist Folli Follie’s business development in the Greater China Region in respect of sales network expansion and brand building. Folli Follie has achieved a steady growth in the sales performance in China and a significant acceleration of the expansion of its sales network.
MANAGEMENT DISCUSSION & ANALYSIS
FOSUN INTERNATIONAL L IMITED I n te r im Repor t 201722
During the Reporting Period, the revenue and profit attributable to owners of the parent of the Insurance and Finance segment were as follows:
WEALTH ECOSYSTEMThe Group’s Wealth Ecosystem business includes three major segments:
Insurance and Finance, Investment and Hive Property.
MANAGEMENT DISCUSSION & ANALYSIS
FOSUN INTERNATIONAL L IMITED I n te r im Repor t 2017 23
INSURANCE AND FINANCE NOTE
During the Reporting Period, the increase in revenue of the Insurance and Finance segment was mainly resulted from Fosun Insurance Portugal, Peak Reinsurance, and Fosun Hani Securities. Additionally, the Group completed the acquisition of 99.91% equity interest in H&A in September 2016, which partially attributed to the increase in revenue of the Insurance and Finance segment. The increase in profit attributable to owners of the parent was mainly due to the increase in Peak Reinsurance’s profit and the share of profits of the associates of BCP, New China Life Insurance and Mybank. Both the growth factors of revenue and profit attributable to owners of the parent above were partially net off by the disposal of 100% equity interest in Ironshore completed in May 2017.
Note: Financial data of individual insurance portfolio companies presented in this section are based on local general accounting standards, and all quoted numbers are unaudited management information.
Under the Insurance and Finance segment, the Group includes its insurance and banking business.
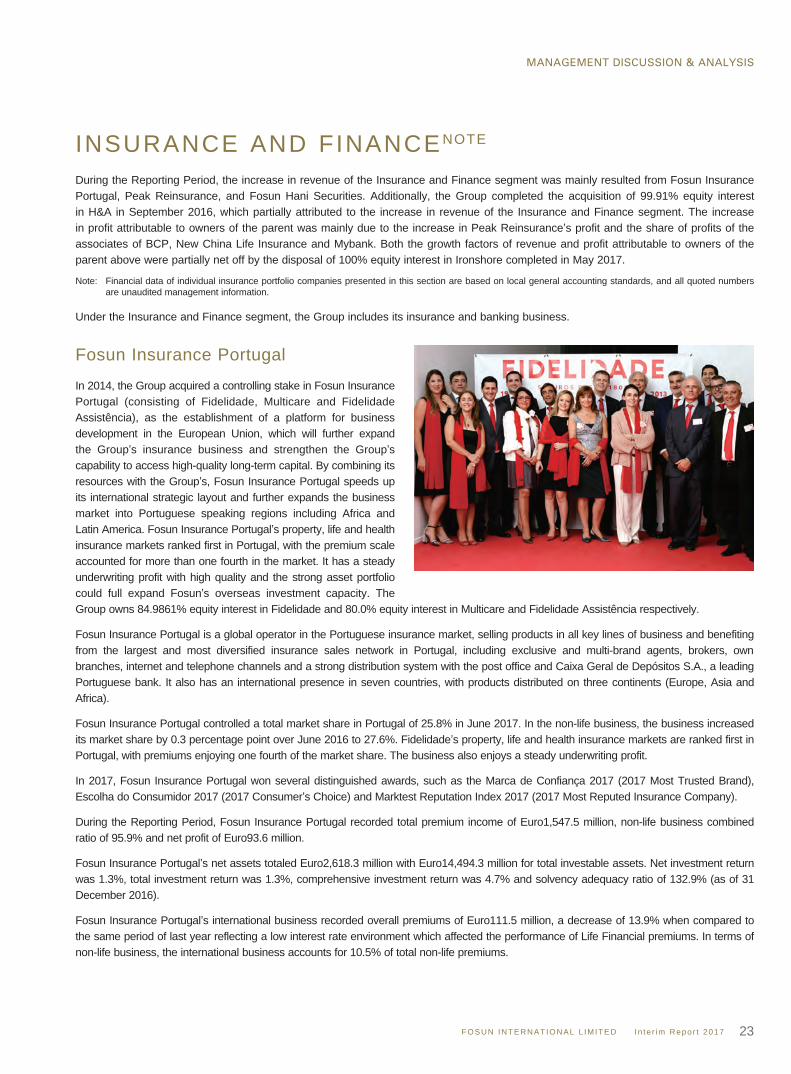
Fosun Insurance Portugal
In 2014, the Group acquired a controlling stake in Fosun Insurance Portugal (consisting of Fidelidade, Multicare and Fidelidade Assistência), as the establishment of a platform for business development in the European Union, which will further expand the Group’s insurance business and strengthen the Group’s capability to access high-quality long-term capital. By combining its resources with the Group’s, Fosun Insurance Portugal speeds up its international strategic layout and further expands the business market into Portuguese speaking regions including Africa and Latin America. Fosun Insurance Portugal’s property, life and health insurance markets ranked first in Portugal, with the premium scale accounted for more than one fourth in the market. It has a steady underwriting profit with high quality and the strong asset portfolio could full expand Fosun’s overseas investment capacity. The Group owns 84.9861% equity interest in Fidelidade and 80.0% equity interest in Multicare and Fidelidade Assistência respectively.
Fosun Insurance Portugal is a global operator in the Portuguese insurance market, selling products in all key lines of business and benefiting from the largest and most diversified insurance sales network in Portugal, including exclusive and multi-brand agents, brokers, own branches, internet and telephone channels and a strong distribution system with the post office and Caixa Geral de Depósitos S.A., a leading Portuguese bank. It also has an international presence in seven countries, with products distributed on three continents (Europe, Asia and Africa).
Fosun Insurance Portugal controlled a total market share in Portugal of 25.8% in June 2017. In the non-life business, the business increased its market share by 0.3 percentage point over June 2016 to 27.6%. Fidelidade’s property, life and health insurance markets are ranked first in Portugal, with premiums enjoying one fourth of the market share. The business also enjoys a steady underwriting profit.
In 2017, Fosun Insurance Portugal won several distinguished awards, such as the Marca de Confiança 2017 (2017 Most Trusted Brand), Escolha do Consumidor 2017 (2017 Consumer’s Choice) and Marktest Reputation Index 2017 (2017 Most Reputed Insurance Company).
During the Reporting Period, Fosun Insurance Portugal recorded total premium income of Euro1,547.5 million, non-life business combined ratio of 95.9% and net profit of Euro93.6 million.
Fosun Insurance Portugal’s net assets totaled Euro2,618.3 million with Euro14,494.3 million for total investable assets. Net investment return was 1.3%, total investment return was 1.3%, comprehensive investment return was 4.7% and solvency adequacy ratio of 132.9% (as of 31 December 2016).
Fosun Insurance Portugal’s international business recorded overall premiums of Euro111.5 million, a decrease of 13.9% when compared to the same period of last year reflecting a low interest rate environment which affected the performance of Life Financial premiums. In terms of non-life business, the international business accounts for 10.5% of total non-life premiums.
MANAGEMENT DISCUSSION & ANALYSIS
FOSUN INTERNATIONAL L IMITED I n te r im Repor t 201724
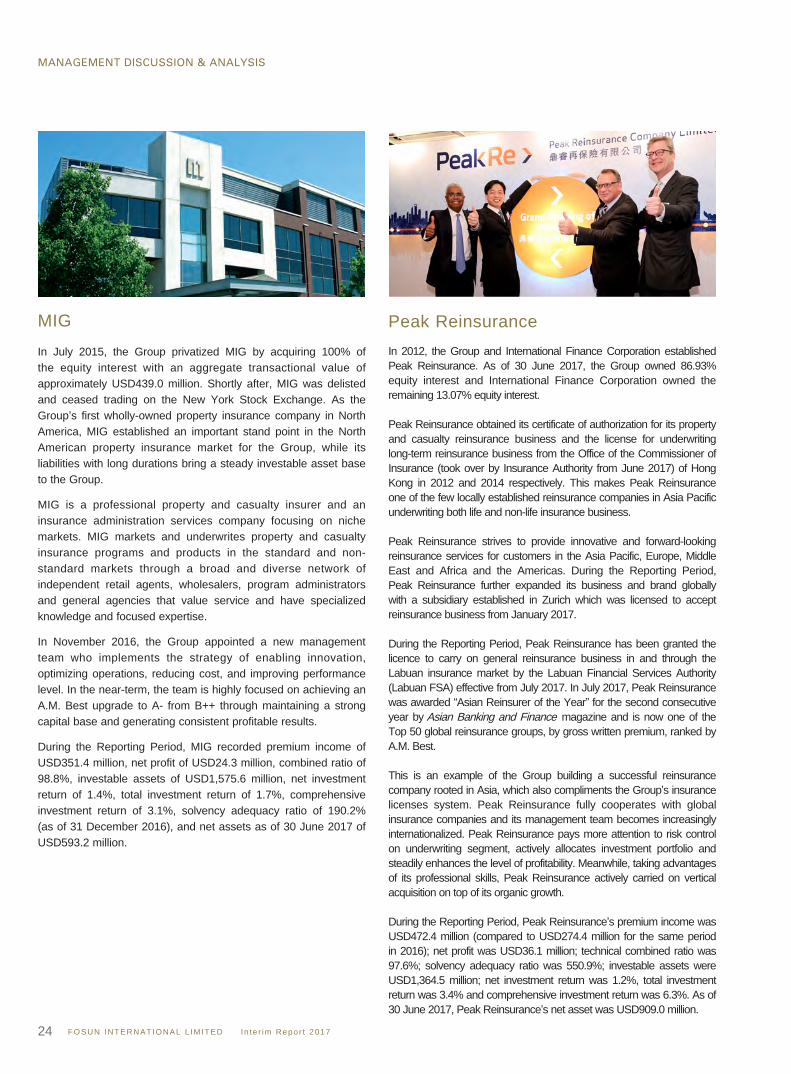
MIG
In July 2015, the Group privatized MIG by acquiring 100% of the equity interest with an aggregate transactional value of approximately USD439.0 million. Shortly after, MIG was delisted and ceased trading on the New York Stock Exchange. As the Group’s first wholly-owned property insurance company in North America, MIG established an important stand point in the North American property insurance market for the Group, while its liabilities with long durations bring a steady investable asset base to the Group.
MIG is a professional property and casualty insurer and an insurance administration services company focusing on niche markets. MIG markets and underwrites property and casualty insurance programs and products in the standard and non-standard markets through a broad and diverse network of independent retail agents, wholesalers, program administrators and general agencies that value service and have specialized knowledge and focused expertise.
In November 2016, the Group appointed a new management team who implements the strategy of enabling innovation, optimizing operations, reducing cost, and improving performance level. In the near-term, the team is highly focused on achieving an A.M. Best upgrade to A- from B++ through maintaining a strong capital base and generating consistent profitable results.
During the Reporting Period, MIG recorded premium income of USD351.4 million, net profit of USD24.3 million, combined ratio of 98.8%, investable assets of USD1,575.6 million, net investment return of 1.4%, total investment return of 1.7%, comprehensive investment return of 3.1%, solvency adequacy ratio of 190.2% (as of 31 December 2016), and net assets as of 30 June 2017 of USD593.2 million.
Peak ReinsuranceIn 2012, the Group and International Finance Corporation established Peak Reinsurance. As of 30 June 2017, the Group owned 86.93% equity interest and International Finance Corporation owned the remaining 13.07% equity interest.
Peak Reinsurance obtained its certificate of authorization for its property and casualty reinsurance business and the license for underwriting long-term reinsurance business from the Office of the Commissioner of Insurance (took over by Insurance Authority from June 2017) of Hong Kong in 2012 and 2014 respectively. This makes Peak Reinsurance one of the few locally established reinsurance companies in Asia Pacific underwriting both life and non-life insurance business.
Peak Reinsurance strives to provide innovative and forward-looking reinsurance services for customers in the Asia Pacific, Europe, Middle East and Africa and the Americas. During the Reporting Period, Peak Reinsurance further expanded its business and brand globally with a subsidiary established in Zurich which was licensed to accept reinsurance business from January 2017.
During the Reporting Period, Peak Reinsurance has been granted the licence to carry on general reinsurance business in and through the Labuan insurance market by the Labuan Financial Services Authority (Labuan FSA) effective from July 2017. In July 2017, Peak Reinsurance was awarded “Asian Reinsurer of the Year” for the second consecutive year by Asian Banking and Finance magazine and is now one of the Top 50 global reinsurance groups, by gross written premium, ranked by A.M. Best.
This is an example of the Group building a successful reinsurance company rooted in Asia, which also compliments the Group’s insurance licenses system. Peak Reinsurance fully cooperates with global insurance companies and its management team becomes increasingly internationalized. Peak Reinsurance pays more attention to risk control on underwriting segment, actively allocates investment portfolio and steadily enhances the level of profitability. Meanwhile, taking advantages of its professional skills, Peak Reinsurance actively carried on vertical acquisition on top of its organic growth.
During the Reporting Period, Peak Reinsurance’s premium income was USD472.4 million (compared to USD274.4 million for the same period in 2016); net profit was USD36.1 million; technical combined ratio was 97.6%; solvency adequacy ratio was 550.9%; investable assets were USD1,364.5 million; net investment return was 1.2%, total investment return was 3.4% and comprehensive investment return was 6.3%. As of 30 June 2017, Peak Reinsurance’s net asset was USD909.0 million.
MANAGEMENT DISCUSSION & ANALYSIS
FOSUN INTERNATIONAL L IMITED I n te r im Repor t 2017 25
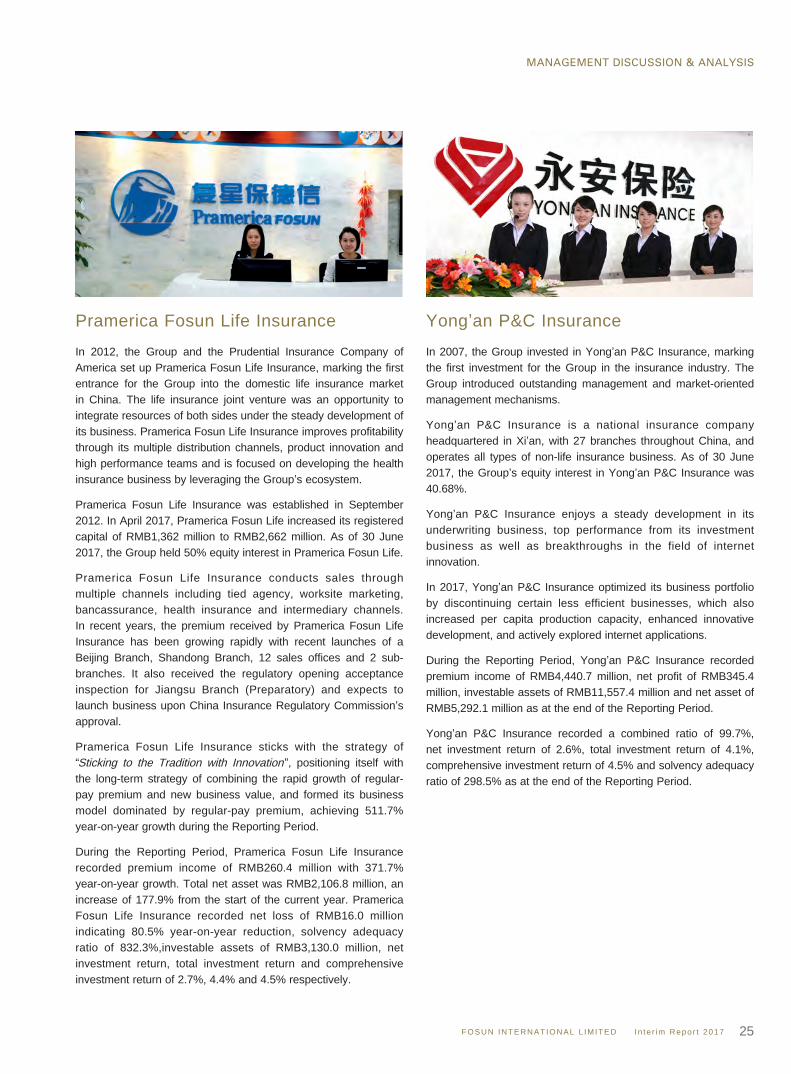
Pramerica Fosun Life Insurance
In 2012, the Group and the Prudential Insurance Company of America set up Pramerica Fosun Life Insurance, marking the first entrance for the Group into the domestic life insurance market in China. The life insurance joint venture was an opportunity to integrate resources of both sides under the steady development of its business. Pramerica Fosun Life Insurance improves profitability through its multiple distribution channels, product innovation and high performance teams and is focused on developing the health insurance business by leveraging the Group’s ecosystem.
Pramerica Fosun Life Insurance was established in September 2012. In April 2017, Pramerica Fosun Life increased its registered capital of RMB1,362 million to RMB2,662 million. As of 30 June 2017, the Group held 50% equity interest in Pramerica Fosun Life.
Pramerica Fosun Life Insurance conducts sales through multiple channels including tied agency, worksite marketing, bancassurance, health insurance and intermediary channels. In recent years, the premium received by Pramerica Fosun Life Insurance has been growing rapidly with recent launches of a Beijing Branch, Shandong Branch, 12 sales offices and 2 sub-branches. It also received the regulatory opening acceptance inspection for Jiangsu Branch (Preparatory) and expects to launch business upon China Insurance Regulatory Commission’s approval.
Pramerica Fosun Life Insurance sticks with the strategy of “Sticking to the Tradition with Innovation”, positioning itself with the long-term strategy of combining the rapid growth of regular-pay premium and new business value, and formed its business model dominated by regular-pay premium, achieving 511.7% year-on-year growth during the Reporting Period.
During the Reporting Period, Pramerica Fosun Life Insurance recorded premium income of RMB260.4 million with 371.7% year-on-year growth. Total net asset was RMB2,106.8 million, an increase of 177.9% from the start of the current year. Pramerica Fosun Life Insurance recorded net loss of RMB16.0 million indicating 80.5% year-on-year reduction, solvency adequacy ratio of 832.3%,investable assets of RMB3,130.0 million, net investment return, total investment return and comprehensive investment return of 2.7%, 4.4% and 4.5% respectively.
Yong’an P&C Insurance
In 2007, the Group invested in Yong’an P&C Insurance, marking the first investment for the Group in the insurance industry. The Group introduced outstanding management and market-oriented management mechanisms.
Yong’an P&C Insurance is a national insurance company headquartered in Xi’an, with 27 branches throughout China, and operates all types of non-life insurance business. As of 30 June 2017, the Group’s equity interest in Yong’an P&C Insurance was 40.68%.
Yong’an P&C Insurance enjoys a steady development in its underwriting business, top performance from its investment business as well as breakthroughs in the field of internet innovation.
In 2017, Yong’an P&C Insurance optimized its business portfolio by discontinuing certain less efficient businesses, which also increased per capita production capacity, enhanced innovative development, and actively explored internet applications.
During the Reporting Period, Yong’an P&C Insurance recorded premium income of RMB4,440.7 million, net profit of RMB345.4 million, investable assets of RMB11,557.4 million and net asset of RMB5,292.1 million as at the end of the Reporting Period.
Yong’an P&C Insurance recorded a combined ratio of 99.7%, net investment return of 2.6%, total investment return of 4.1%, comprehensive investment return of 4.5% and solvency adequacy ratio of 298.5% as at the end of the Reporting Period.
MANAGEMENT DISCUSSION & ANALYSIS
FOSUN INTERNATIONAL L IMITED I n te r im Repor t 201726
Ironshore
As of 30 April 2017, Ironshore recorded net asset of USD2,112.8 million, for the period ended 30 April 2017, Ironshore recorded net profit of USD28.0 million. The Ironshore disposal transaction was completed on 1 May 2017 generating about USD2.94 billion proceeds for the Group.
Fosun United Health Insurance
Fosun United Health Insurance, which was co-established by the Group and other shareholders and was incorporated in Guangzhou, Guangdong Province in January 2017 with the formal approval by the China Insurance Regulatory Commission. The registered capital of Fosun United Health Insurance is RMB500 million, of which 20% equity interest is contributed by the Group.
Fosun United Health Insurance actively operates in medical insurance, illness insurance, disability income insurance, health care insurance and accident insurance in the PRC market with the aim of providing a complete life-cycle of high quality insurance products for Chinese families. As of 30 June 2017, Fosun United Health Insurance recorded total premium incomes of RMB12.8 million; 32 products have been launched to serve more than 13,000 customers.
Fosun Hani Securities
Fosun Hani Securities is an investment entity and comprehensive financial platform based in Hong Kong that is wholly owned by the Group. Established in 1987, Fosun Hani Securities is a member of the Hong Kong Stock Exchange (member ID: 0820 and 0829). The Group has started a comprehensive financial service platform by acquiring the PIBA (Professional Insurance Brokers Association) license through purchasing a Hong Kong insurance broker firm in 2016. In the first half of 2017, supported by the Group, Fosun Hani Securities increased its issued capital by over HKD1 billion for development in future.
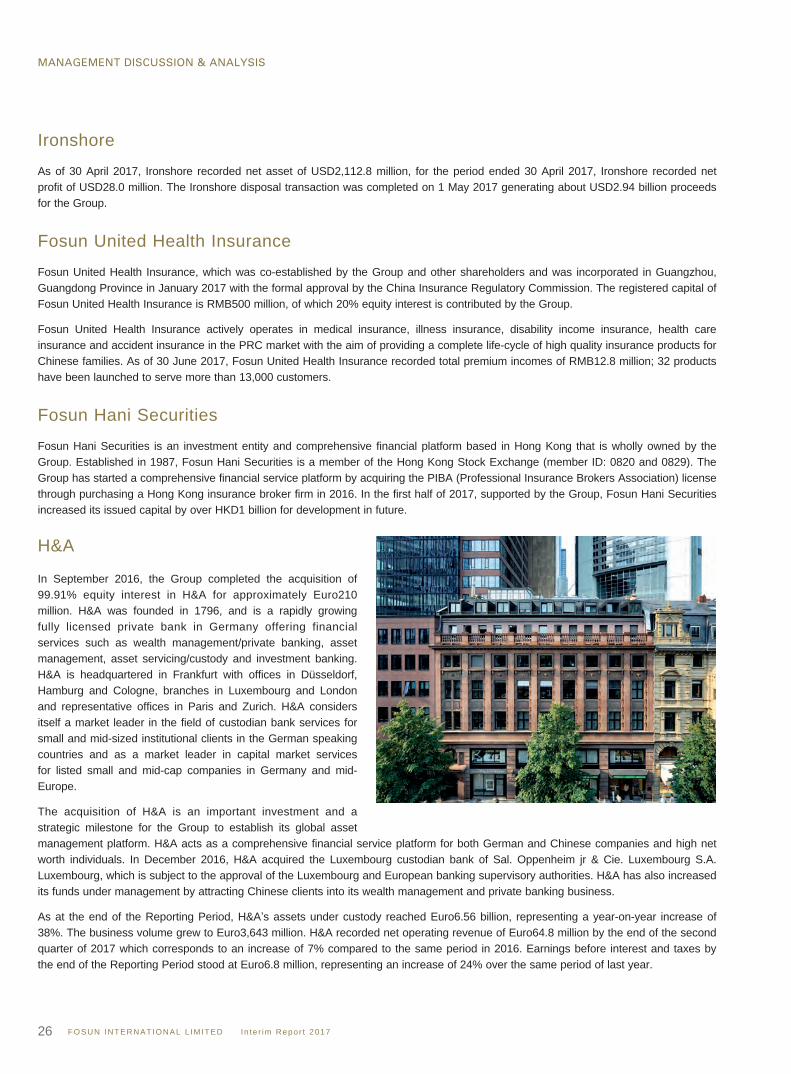
H&A
In September 2016, the Group completed the acquisition of 99.91% equity interest in H&A for approximately Euro210 million. H&A was founded in 1796, and is a rapidly growing fully licensed private bank in Germany offering financial services such as wealth management/private banking, asset management, asset servicing/custody and investment banking. H&A is headquartered in Frankfurt with offices in Düsseldorf, Hamburg and Cologne, branches in Luxembourg and London and representative offices in Paris and Zurich. H&A considers itself a market leader in the field of custodian bank services for small and mid-sized institutional clients in the German speaking countries and as a market leader in capital market services for listed small and mid-cap companies in Germany and mid-Europe.
The acquisition of H&A is an important investment and a strategic milestone for the Group to establish its global asset management platform. H&A acts as a comprehensive financial service platform for both German and Chinese companies and high net worth individuals. In December 2016, H&A acquired the Luxembourg custodian bank of Sal. Oppenheim jr & Cie. Luxembourg S.A. Luxembourg, which is subject to the approval of the Luxembourg and European banking supervisory authorities. H&A has also increased its funds under management by attracting Chinese clients into its wealth management and private banking business.
As at the end of the Reporting Period, H&A’s assets under custody reached Euro6.56 billion, representing a year-on-year increase of 38%. The business volume grew to Euro3,643 million. H&A recorded net operating revenue of Euro64.8 million by the end of the second quarter of 2017 which corresponds to an increase of 7% compared to the same period in 2016. Earnings before interest and taxes by the end of the Reporting Period stood at Euro6.8 million, representing an increase of 24% over the same period of last year.
MANAGEMENT DISCUSSION & ANALYSIS
FOSUN INTERNATIONAL L IMITED I n te r im Repor t 2017 27
BCP
In November 2016 and February 2017 the Group completed subscriptions of shares in BCP through private placement and rights issue respectively. After the completion of these two phases, the Group holds approximately 23.9% of BCP’s share capital, with total consideration of approximately Euro549.0 million. During the Reporting Period, the Group also increased its shareholding in BCP by acquiring shares in the secondary market. As of 30 June 2017, the Company indirectly held approximately 24.73% of BCP’s share capital.
BCP is the largest Portuguese privately-owned bank and a leader in retail, corporate and investment banking in Portugal. The Bank also operates an online platform called ActivoBank. BCP’s local market share in loans is approximately 17.8% and market share in deposits is approximately 17.3%.
BCP also offers various banking services and products in overseas markets such as Poland, Switzerland, Mozambique and Angola. BCP has been operating in Macau through a full-license branch since 2010 and has expanded into the Chinese mainland market through its Guangzhou representative office. The Group believes that BCP will serve as the comprehensive financial service platform as part of the government’s “Belt and Road” initiative, further improve the Group’s capacity to combine China’s growth momentum with global resources in Europe and Africa.
As at the end of the Reporting Period, BCP’s total assets reached approximately Euro73.0 billion, with net loans to customers of approximately Euro48.1 billion and customer deposits of approximately Euro50.6 billion. During the Reporting Period, BCP’s profitability, asset quality, and business performance have improved. The net interest income of BCP improved by 12.9% to approximately Euro678.5 million compared to the same period of 2016, with its net interest margin improved by 32 basis points to 2.2%. The net profit of BCP stood at approximately Euro89.9 million, compared to a loss of approximately Euro197.3 million in the same period of 2016. During the Reporting Period, the non-performing exposure of BCP in Portugal was reduced by approximately Euro0.7 billion to approximately Euro7.8 billion, of which the non-performing loan over 90 days was reduced by approximately Euro0.5 billion to approximately Euro4.6 billion. The coverage of non-performing exposure including mortgage and guarantees in Portugal increased from 100% to 105%. In addition, by the end of the Reporting Period, the number of BCP’s active customers reached over 5.2 million, increased by approximately 4.4% compared to June 2016. In the first half of 2017, the Portuguese economy continued to recover significantly within a framework of increasing investment activities and improving employment, which supported the sustainable environment of the banking sector.
Mybank
In May 2015, the Group, as a founder, injected registered capital of RMB1,000 million to acquire 25% equity interest in Mybank.
Commencing operation in June 2015, Mybank is a joint-stock commercial bank which provides financial services to small and micro enterprises, individual entrepreneurs and individual consumers on the internet based on a cloud-based financial platform. Mybank serves small and micro customers in rural markets, providing clients with online financing and other financial services.
In the past two years since operations commenced, Mybank has provided loan services to 3.5 million small enterprises in 32 provinces, municipalities and autonomous regions. Accumulated loans of RMB197.1 billion have been granted to small enterprises. The balance of loans granted under “Wang Nong Loan (旺農貸 )” was almost RMB650 million, and “Wang Nong Loan (旺農貸 )” now covers 231 cities and 557 towns in China.
As of 31 December 2016, Mybank had total assets of RMB61.5 billion, of which approximately RMB32.9 billion was balance of loans with non-performance ratio of 1.1% and provision coverage of 291.5%.
MANAGEMENT DISCUSSION & ANALYSIS
FOSUN INTERNATIONAL L IMITED I n te r im Repor t 201728
INVESTMENTDuring the Reporting Period, the revenue and profit attributable to owners of the parent of the Investment segment were as follows:
Unit: RMB million
For thesix months
ended30 June 2017
For thesix months
ended30 June 2016
Change overthe sameperiod oflast year
Revenue 1,721.2 818.6 110.3%Profit attributable to owners of the parent 3,091.3 2,761.6 11.9%
During the Reporting Period, the increase in revenue and profit attributable to owners of the parent of the Investment segment were mainly due to the continuous expansion of investment scale and increase in investment income.
In the first half of 2017, the Group split the previous category of “Investment” into their respective ecosystems to allow for greater transparency and simpler understanding of the Group for investors. The Investment segment includes primary market investments, secondary market investments, asset management companies and others.
Primary Market InvestmentsThe Group’s primary market investments include international fashion, mass consumption, advanced manufacturing and other industries. As of 30 June 2017, the Group has invested in 89 projects (including the projects invested by the consolidated funds) with a balance of investment amount of approximately RMB15,531.6 million (at the accumulated cost of investment) under the wealth ecosystem.
Cainiao
In May 2013, the Group invested RMB500 million into Cainiao as one of the founding shareholders. Cainiao is the official logistics partner for Alibaba with a vision to develop a smart logistics network that can help deliver online shopping within 24 hours to all cities across China and 72 hours worldwide. The Group’s equity interest in Cainiao is now 7.5% (excluding the effect of equity incentive) after its first round of financing in early 2016.
Cainiao has currently developed five key networks, including delivery data and technology solutions, domestic fulfilment solutions, cross-border logistics, urban and rural last mile logistics. Cainiao has achieved rapid growth in the first half of 2017, including network coverage, product penetration, package volume and timeliness of delivery. The brand awareness of Cainiao Alliance has also witnessed significant enhancement. Cainiao has brought in over 100 logistics partners and intends to better serve merchants within the e-commerce ecosystem by building an open platform.
As of 30 June 2017, Cainiao had next-day delivery coverage capacity in over 1,000 districts and counties. Cainiao’s logistics data platform enabled the delivery of an average of approximately 55 million packages per day during the second quarter of 2017.
MANAGEMENT DISCUSSION & ANALYSIS
FOSUN INTERNATIONAL L IMITED I n te r im Repor t 2017 29
Secondary Market InvestmentsTop 10 Secondary Holdings1
No. Stock name
Percentageheld3 as of
30 June 2017Market Value(RMB billion)
1 Focus Media 6.36% 7.652 Minsheng Bank (H) 2.12%2 4.503 Sun Paper4 7.12% 1.334 Ping An Insurance (A)5 0.13% 1.22
Ping An Insurance (H)5 0.00% 0.025 Folli Follie6 10.00% 1.116 Yunda 1.61% 0.847 Cosmo Lady6 11.18% 0.668 Botian Environment4 2.97% 0.509 Thomas Cook6 3.94% 0.4810 Shida Shenghua Chemical 7.28% 0.42
Note:
1. Only include the positions of the Company, Shanghai Fosun High Technology (Group) Co., Ltd. and special purpose vehicles of the above two companies, and the effective equity interests held by the consolidated funds of the Group; exclude the Group’s interests in the listed subsidiaries, associates and joint ventures; exclude the investments of subsidiaries, associates and joint ventures.
2. Including deemed derivative interests of 390 million shares.
3. It refers to percentage of effective equity interests.
4. It belongs to health ecosystem segment of the Group.
5. It belongs to insurance and finance segment under the wealth ecosystem of the Group.
6. It belongs to happiness ecosystem segment of the Group.
Zhongshan Public UtilitiesIn August 2014, the Group acquired from Zhongshan Zhonghui Investment Group Co., Ltd., the controlling shareholder of Zhongshan Public Utilities Group Co., Ltd. (“Zhongshan Public Utilities”), 13% of equity interest in Zhongshan Public Utilities at a price of RMB10.52 per share. As at the end of the Reporting Period, the Group held 12.35% of equity interest in Zhongshan Public Utilities.
Zhongshan Public Utilities, established since 1998, is a state-owned listed company whose A shares are listed on the Shenzhen Stock Exchange with stock code of 000685. During the Reporting Period, the profit of Zhongshan Public Utilities attributable to shareholders of the listed company was RMB525.9 million, representing an increase of 12.3% over the same period of 2016. As of 30 June 2017, Zhongshan Public Utilities had total assets of RMB16,369.5 million and net assets of RMB11,626.3 million.
Zhongshan Public Utilities is a corporation which focuses on environmental friendly water treatment operations. It also works on other aspects such as agricultural trade market operation, financial services and equity investments.
Asset ManagementOver the past few years, the Group has actively expanded the size of its asset management business. In April 2007, the Group established and wholly owned Fosun Capital, an equity investment and management company. In May 2014, the Group acquired 98% equity interest in IDERA, a Japanese real estate capital management company before acquiring 60% equity interest in Resolution Property, a European real estate capital management company headquartered in London in June 2015. In August 2015, the Group established Fosun Eurasia Capital, a Russian asset management company and held 75% equity interest in Fosun Eurasia Capital. In November 2016, the Group acquired 50.1% equity interest in Rio Bravo, a Brazilian fund asset management firm.
The asset management business of the Group mainly targets domestic and international high-end large institutional clients and high net worth individual clients, and actively seeks institutional investors, large enterprises and family capital to become limited partners of the Group for long term cooperation.
As at the end of the Reporting Period, the scale of the asset management business of the Group reached RMB100,366.1 million, of which RMB12,845.8 million was managed by Fosun Capital, RMB14,908.9 million was managed by IDERA, RMB7,005.0 million was managed by Resolution Property, RMB1,355.9 million was managed by Fosun Eurasia Capital, and RMB24,314.7 million was managed by Rio Bravo. The management fee derived from the asset management business amounted to RMB304.8 million. In addition, during the Reporting Period, the asset management business of the Group invested in 7 new projects and increased investment in 1 existing project, with an accumulated investment of RMB2,247.7 million.
MANAGEMENT DISCUSSION & ANALYSIS
FOSUN INTERNATIONAL L IMITED I n te r im Repor t 201730
Fosun CapitalFosun Capital is an investment and management company established and wholly owned by the Group. Established in April 2007, the total paid-in capital as at the end of the Reporting Period was RMB600.0 million.
For a decade, based on the global vision and profound industrial background of the Group, Fosun Capital has provided high-quality investment and management services for investors such as well-known family funds, insurance companies, listed companies, large investment institutions and high net worth individuals all over the world. Assets currently managed include a fund of funds, private equity funds, venture capital funds, industrial funds of listed companies and other equity investment funds, covering industries such as advanced manufacturing, energy and environmental protection, modern services, fashion consumption, healthcare and TMT. In 2016, it was selected among “China’s top 10 private equity investment institutions” by the Zero2IPO Group.
During the Reporting Period, a total of four portfolio enterprises have been listed in China, while two enterprises have been acquired by listed company in the PRC. As at the end of the Reporting Period, the size of the assets under management was RMB12,845.8 million.
IDERAIn May 2014, the Group completed the acquisition of 98% equity interest in IDERA, a Japanese real estate capital management company, at a consideration of JPY6,811.0 million. IDERA is a leading Japanese independent real estate capital management and fund platform and at the end of the Reporting Period, managed over JPY246,469 million assets. In order to reflect consistent interests of management and shareholders, and to indicate the confidence of management in corporate development, the CEO of IDERA, acquired 0.5% equity interest in IDERA from the Group in February 2017. The Group now holds 97.5% equity interest in IDERA.
During the Reporting Period, IDERA recorded an unaudited operating revenue of JPY2,108.4 million, net profit of JPY1,097.4 million and net asset book value of JPY12,071 million according to the Japanese accounting standards.
Resolution PropertyIn June 2015, the Group acquired 60% equity interest in Resolution Property, a European real estate capital management company headquartered in London, for a consideration of Euro15.6 million. Resolution Property is a leading fund manager focusing on real estate investment in Europe and will become a priority platform of Fosun in the European market for real estate investment. As at the end of the Reporting Period, total funds under its management were approximately RMB7,005.0 million.
Fosun Eurasia CapitalFosun Eurasia Capital was established in Moscow in August 2015 and the Group holds 75% of its equity interest. Fosun Eurasia Capital serves as a major comprehensive financial platform for the Group, providing financial, asset management and investment advisory services throughout Russia and its neighbouring countries. Fosun Eurasia Capital’s scope of investment deploys across all asset classes, including fixed income, direct investments, real estate, bonds, listed and private equity and identifies and evaluates investment opportunities in various industries including energy, natural resources, consumption and manufacturing industries. Fosun Eurasia Capital also provides foreign investment advisory services and seeks underlying high-quality investment projects for local Russian and international investors.
Since 2017, actively following Fosun’s strategy, and closely cooperating with teams of other industries, Fosun Eurasia Capital has focused on opportunities in health, agriculture, financial services and other industries. As at the end of the Reporting Period, its investment projects have performed well, which is significantly higher than the market benchmark, total assets under its management were approximately RMB1,355.9 million.
Rio BravoIn November 2016, the Group acquired 50.1% equity interest in Rio Bravo, a fund asset management company headquartered in São Paulo, Brazil. Rio Bravo is a leading fund management company in the Brazilian market specializing in various asset categories, including private equity, public equity funds, real estate funds, credit funds, infrastructure funds, financial advisory and multi-class portfolio asset management. This is the first equity acquisition of the Group in the Latin American region. Rio Bravo looks for high-quality project opportunities in real estate, financial services, and natural resources, closely cooperates with Fosun’s other teams from other industries, and strengthens Fosun’s investment and strategy in emerging countries.
In the first half of 2017, Brazil’s economy finally achieved GDP growth of more than 1% after experiencing several years of decline. At the same time, inflation fell to a record low of 3.5%. Various types of assets in future, especially real estate and stocks will obviously benefit from the current low cost environment. As at the end of the Reporting Period, Rio Bravo’s total assets under its management were approximately RMB24,314.7 million.
MANAGEMENT DISCUSSION & ANALYSIS
FOSUN INTERNATIONAL L IMITED I n te r im Repor t 2017 31
Others
ROC
The Company launched an offer of acquisition for ROC, an Australian oil and gas company in August 2014. In January 2015, ROC was wholly-owned by the Group and officially delisted from the Australian Securities Exchange.
The Company intended to utilize ROC as its strategic platform in the oil and gas sector. Leveraging ROC’s leading operational and management capabilities and business development potential, the company will integrate its existing business bases in the PRC, Southeast Asia and Australia to capture the global oil and gas investment opportunities under the environment of declining oil prices, so as to obtain sustainable returns.
During the Reporting Period, ROC realized sales revenue of USD65.1 million, net profit amounted to USD25.1 million, EBITDA was USD54.9 million and net cash inflow from operating activities amounted to USD42.2 million.
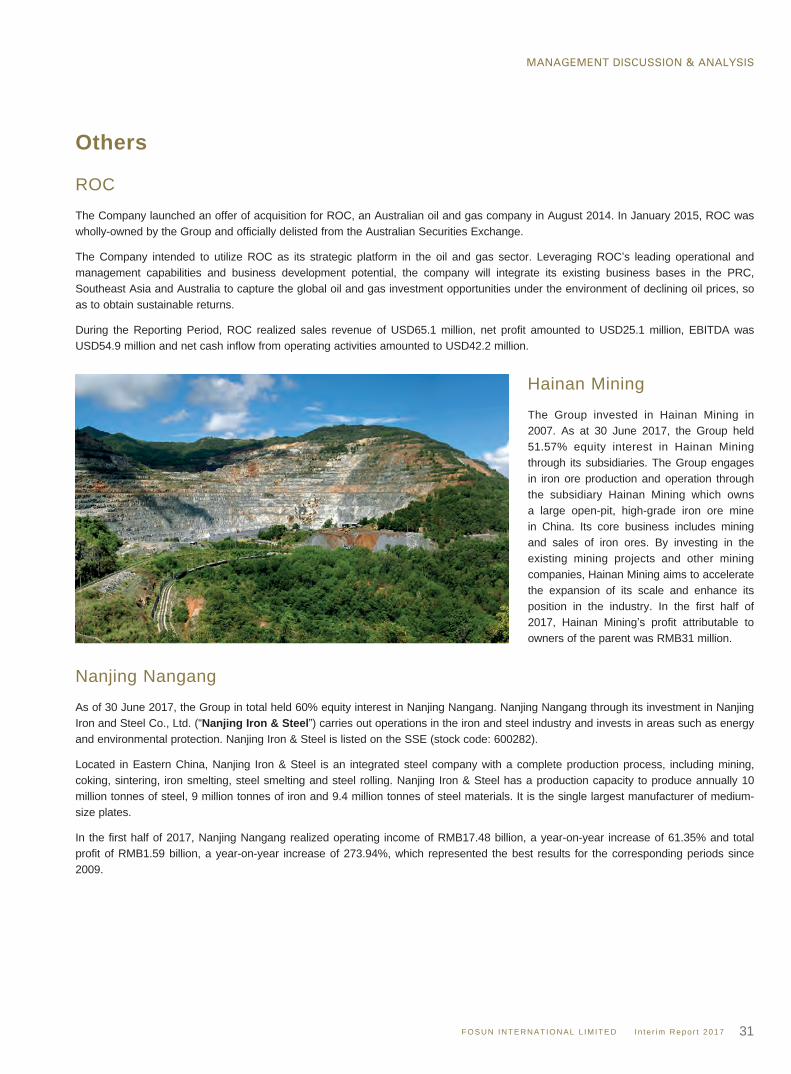
Hainan Mining
The Group invested in Hainan Mining in 2007. As at 30 June 2017, the Group held 51.57% equity interest in Hainan Mining through its subsidiaries. The Group engages in iron ore production and operation through the subsidiary Hainan Mining which owns a large open-pit, high-grade iron ore mine in China. Its core business includes mining and sales of iron ores. By investing in the existing mining projects and other mining companies, Hainan Mining aims to accelerate the expansion of its scale and enhance its position in the industry. In the first half of 2017, Hainan Mining’s profit attributable to owners of the parent was RMB31 million.
Nanjing Nangang
As of 30 June 2017, the Group in total held 60% equity interest in Nanjing Nangang. Nanjing Nangang through its investment in Nanjing Iron and Steel Co., Ltd. (“Nanjing Iron & Steel”) carries out operations in the iron and steel industry and invests in areas such as energy and environmental protection. Nanjing Iron & Steel is listed on the SSE (stock code: 600282).
Located in Eastern China, Nanjing Iron & Steel is an integrated steel company with a complete production process, including mining, coking, sintering, iron smelting, steel smelting and steel rolling. Nanjing Iron & Steel has a production capacity to produce annually 10 million tonnes of steel, 9 million tonnes of iron and 9.4 million tonnes of steel materials. It is the single largest manufacturer of medium-size plates.
In the first half of 2017, Nanjing Nangang realized operating income of RMB17.48 billion, a year-on-year increase of 61.35% and total profit of RMB1.59 billion, a year-on-year increase of 273.94%, which represented the best results for the corresponding periods since 2009.
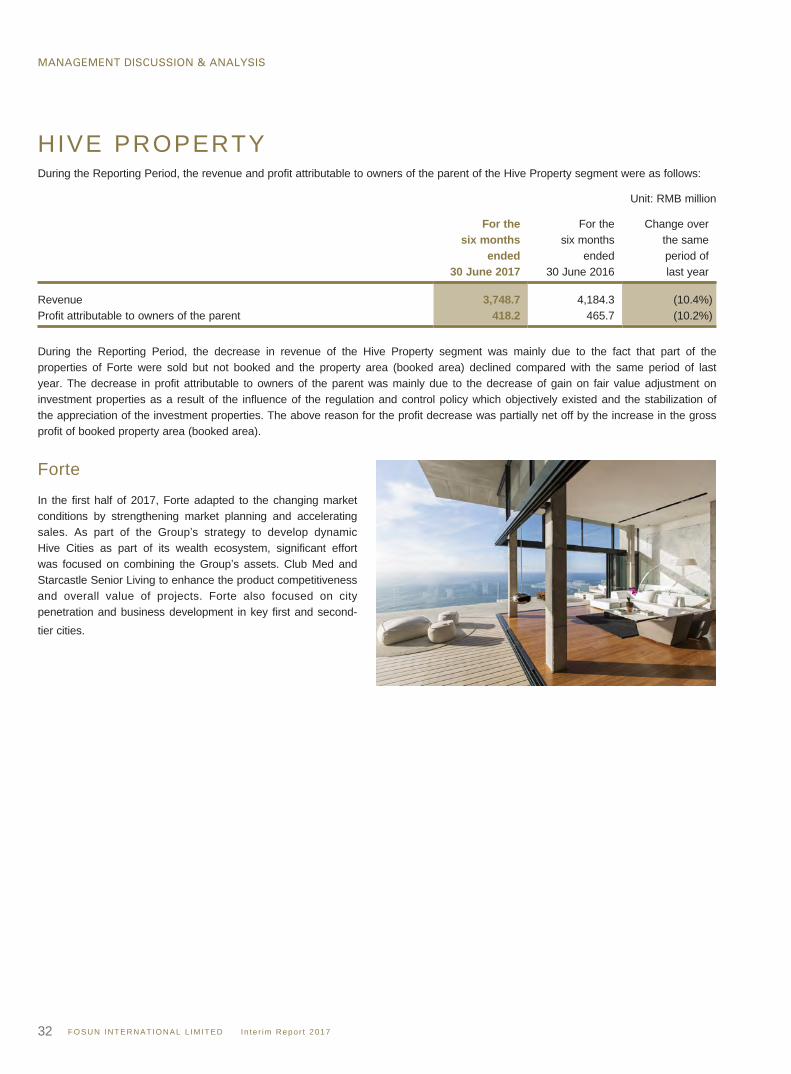
MANAGEMENT DISCUSSION & ANALYSIS
FOSUN INTERNATIONAL L IMITED I n te r im Repor t 201732
HIVE PROPERTYDuring the Reporting Period, the revenue and profit attributable to owners of the parent of the Hive Property segment were as follows:
Unit: RMB million
For thesix months
ended30 June 2017
For thesix months
ended30 June 2016
Change overthe sameperiod oflast year
Revenue 3,748.7 4,184.3 (10.4%)Profit attributable to owners of the parent 418.2 465.7 (10.2%)
During the Reporting Period, the decrease in revenue of the Hive Property segment was mainly due to the fact that part of the properties of Forte were sold but not booked and the property area (booked area) declined compared with the same period of last year. The decrease in profit attributable to owners of the parent was mainly due to the decrease of gain on fair value adjustment on investment properties as a result of the influence of the regulation and control policy which objectively existed and the stabilization of the appreciation of the investment properties. The above reason for the profit decrease was partially net off by the increase in the gross profit of booked property area (booked area).
Forte
In the first half of 2017, Forte adapted to the changing market conditions by strengthening market planning and accelerating sales. As part of the Group’s strategy to develop dynamic Hive Cities as part of its wealth ecosystem, significant effort was focused on combining the Group’s assets. Club Med and Starcastle Senior Living to enhance the product competitiveness and overall value of projects. Forte also focused on city penetration and business development in key first and second-tier cities.
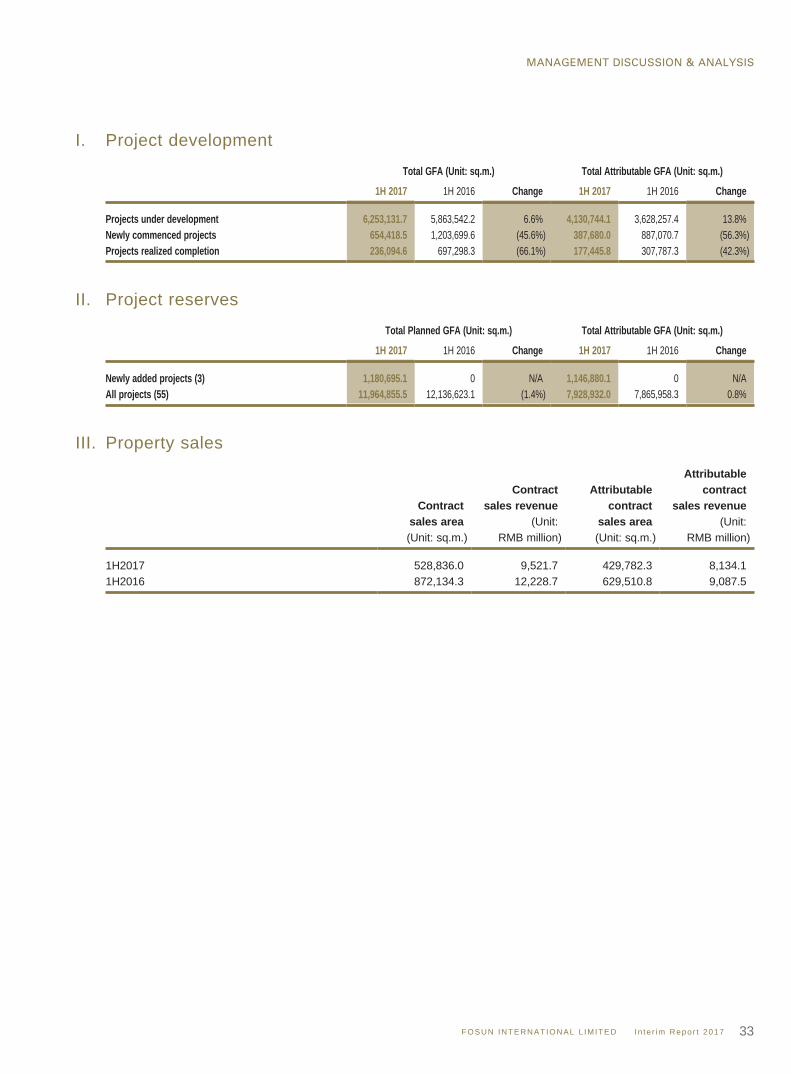
MANAGEMENT DISCUSSION & ANALYSIS
FOSUN INTERNATIONAL L IMITED I n te r im Repor t 2017 33
I. Project development
Total GFA (Unit: sq.m.) Total Attributable GFA (Unit: sq.m.)
1H 2017 1H 2016 Change 1H 2017 1H 2016 Change Projects under development 6,253,131.7 5,863,542.2 6.6% 4,130,744.1 3,628,257.4 13.8%Newly commenced projects 654,418.5 1,203,699.6 (45.6%) 387,680.0 887,070.7 (56.3%)Projects realized completion 236,094.6 697,298.3 (66.1%) 177,445.8 307,787.3 (42.3%)
II. Project reserves
Total Planned GFA (Unit: sq.m.) Total Attributable GFA (Unit: sq.m.)
1H 2017 1H 2016 Change 1H 2017 1H 2016 Change Newly added projects (3) 1,180,695.1 0 N/A 1,146,880.1 0 N/AAll projects (55) 11,964,855.5 12,136,623.1 (1.4%) 7,928,932.0 7,865,958.3 0.8%
III. Property sales
Contractsales area(Unit: sq.m.)
Contractsales revenue
(Unit:RMB million)
Attributablecontract
sales area(Unit: sq.m.)
Attributablecontract
sales revenue(Unit:
RMB million) 1H2017 528,836.0 9,521.7 429,782.3 8,134.11H2016 872,134.3 12,228.7 629,510.8 9,087.5
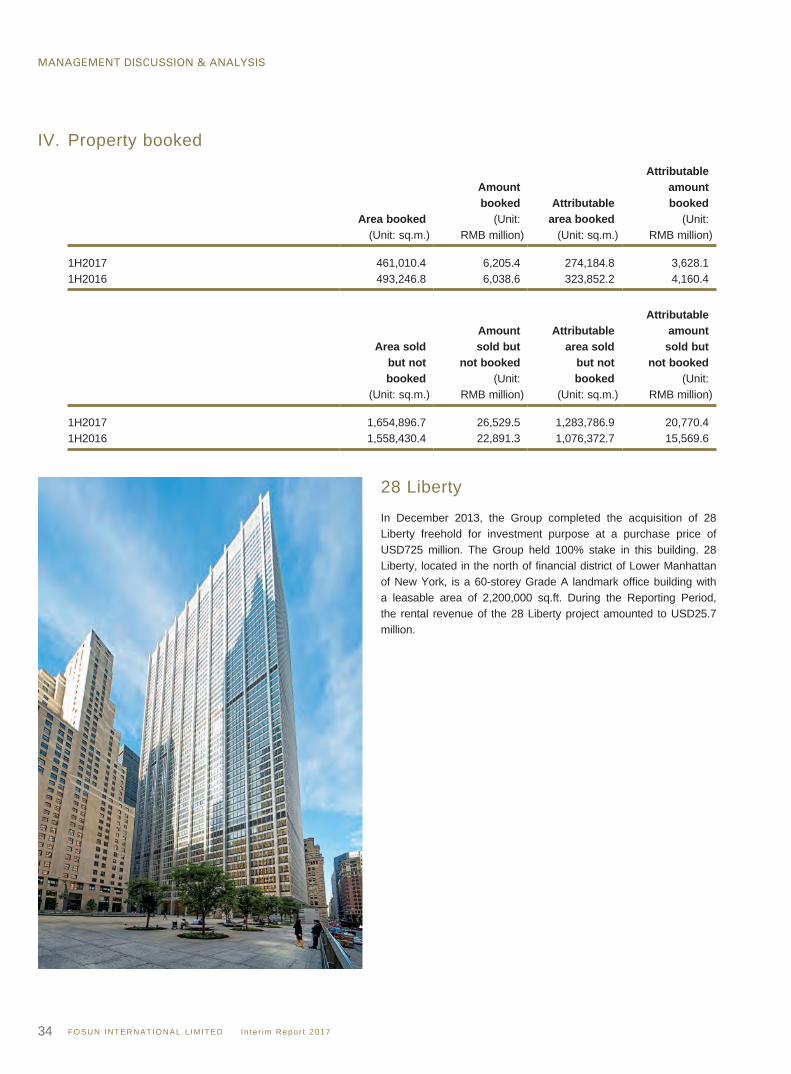
MANAGEMENT DISCUSSION & ANALYSIS
FOSUN INTERNATIONAL L IMITED I n te r im Repor t 201734
IV. Property booked
Area booked(Unit: sq.m.)
Amountbooked
(Unit:RMB million)
Attributablearea booked (Unit: sq.m.)
Attributableamountbooked
(Unit:RMB million)
1H2017 461,010.4 6,205.4 274,184.8 3,628.11H2016 493,246.8 6,038.6 323,852.2 4,160.4
Area soldbut notbooked
(Unit: sq.m.)
Amountsold but
not booked(Unit:
RMB million)
Attributablearea sold
but notbooked
(Unit: sq.m.)
Attributableamount
sold butnot booked
(Unit:RMB million)
1H2017 1,654,896.7 26,529.5 1,283,786.9 20,770.41H2016 1,558,430.4 22,891.3 1,076,372.7 15,569.6
28 Liberty
In December 2013, the Group completed the acquisition of 28 Liberty freehold for investment purpose at a purchase price of USD725 million. The Group held 100% stake in this building. 28 Liberty, located in the north of financial district of Lower Manhattan of New York, is a 60-storey Grade A landmark office building with a leasable area of 2,200,000 sq.ft. During the Reporting Period, the rental revenue of the 28 Liberty project amounted to USD25.7 million.
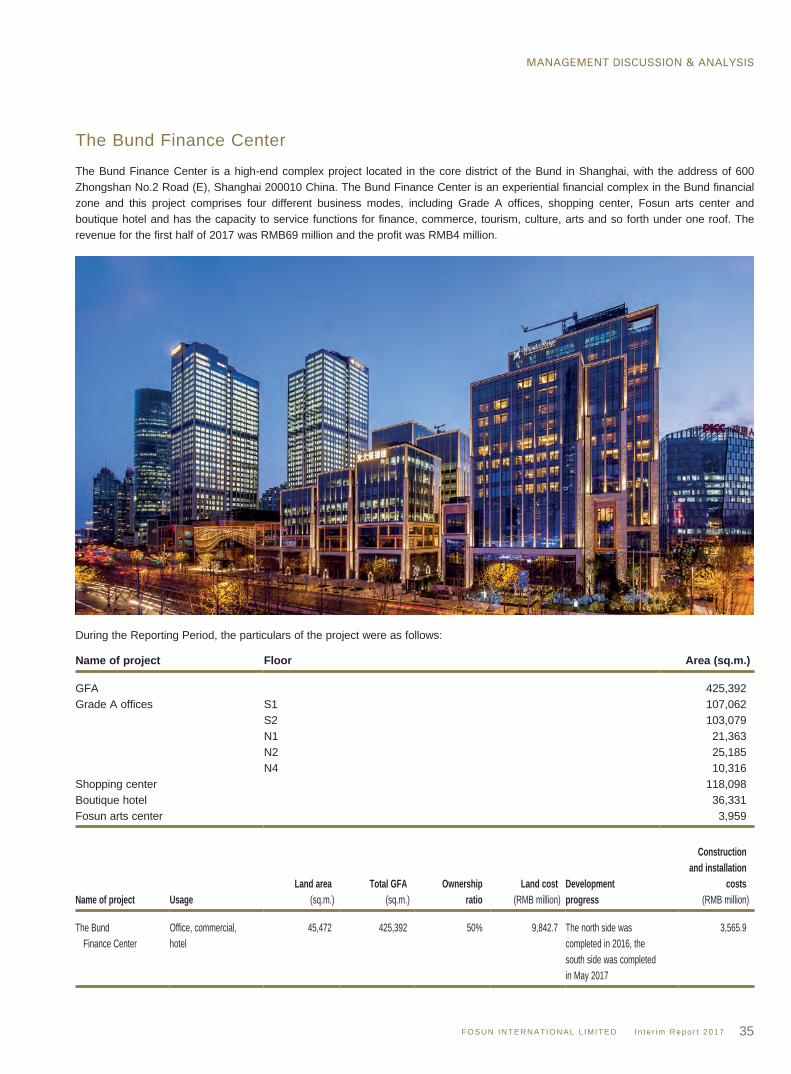
MANAGEMENT DISCUSSION & ANALYSIS
FOSUN INTERNATIONAL L IMITED I n te r im Repor t 2017 35
The Bund Finance Center
The Bund Finance Center is a high-end complex project located in the core district of the Bund in Shanghai, with the address of 600 Zhongshan No.2 Road (E), Shanghai 200010 China. The Bund Finance Center is an experiential financial complex in the Bund financial zone and this project comprises four different business modes, including Grade A offices, shopping center, Fosun arts center and boutique hotel and has the capacity to service functions for finance, commerce, tourism, culture, arts and so forth under one roof. The revenue for the first half of 2017 was RMB69 million and the profit was RMB4 million.
During the Reporting Period, the particulars of the project were as follows:
Name of project Floor Area (sq.m.) GFA 425,392Grade A offices S1 107,062
S2 103,079N1 21,363N2 25,185N4 10,316
Shopping center 118,098Boutique hotel 36,331Fosun arts center 3,959
Name of project UsageLand area
(sq.m.)Total GFA
(sq.m.)Ownership
ratioLand cost
(RMB million)Developmentprogress
Constructionand installation
costs(RMB million)
The Bund Finance Center
Office, commercial,hotel
45,472 425,392 50% 9,842.7 The north side wascompleted in 2016, thesouth side was completedin May 2017
3,565.9
MANAGEMENT DISCUSSION & ANALYSIS
FOSUN INTERNATIONAL L IMITED I n te r im Repor t 201736
Lloyds Chambers
In October 2013, the Group purchased Lloyds Chambers with its partner for GBP64.5 million. The Group held 90.01% stake in this building. The project is located at 1 Portsoken Street E1 in the financial district of London. Lloyds Chambers has a sound financing, taxation, property management and corporate governance structure. During the Reporting Period, its rental income was GBP3.55 million. Asset management of the project is being implemented in accordance with the business plan.
RECENT DEVELOPMENTSubsequent to the end of the Reporting Period, the Group announced several key international acquisitions.
St-Hubert
In July 2017, the Group announced the joint acquisition of St-Hubert SAS, a French healthy-spread company, with Sanyuan Foods for Euro625 million. The proposed acquisition is subject to regulatory approval. The acquisition brings St-Hubert’s advanced and innovative production technologies to China, and also strengthens Sanyuan Foods’s product capability and increases its global competitiveness. This acquisition between Fosun and Sanyuan Foods, one of China’s largest state-owned dairy groups, also represents an important and practical step towards China’s mixed-ownership reform.
Koller
In August 2017, Nanjing Nangang, a joint venture of the Group completed its acquisition of a majority stake in leading German automotive supplier Koller Beteiligungs GmbH (“Koller”), a lightweight automotive specialist headquartered in Dietfurt, Germany. It is the first overseas investment for Nanjing Nangang and the first overseas industrial investment in the automotive industry for Nanjing Nangang.
MANAGEMENT DISCUSSION & ANALYSIS
FOSUN INTERNATIONAL L IMITED I n te r im Repor t 2017 37
F INANCIAL REVIEW
Net Interest ExpendituresNet interest expenditures, net of capitalized amounts of the Group, increased to RMB2,488.9 million for the six months ended 30 June 2017 from RMB2,125.4 million for the six months ended 30 June 2016. The increase in net interest expenditures was mainly attributable to the growth in scale of total borrowings. For the six months ended 30 June 2017, the interest rates of borrowings were approximately between 0.64% and 8.5% as compared with approximately between 0.37% and 8.7% for the same period of last year.
TaxTax of the Group increased to RMB1,708.3 million for the six months ended 30 June 2017 from RMB1,343.5 million for the six months ended 30 June 2016. The increase in tax was mainly due to the increase in taxable profit from the Group.
Capital Expenditures And Capital CommitmentThe capital expenditures of the Group mainly consist of additions to property, plant and equipment, prepaid land lease payments, exploration and evaluation assets, mining rights, intangible assets, investment properties and oil and gas assets. We have been increasing our investment in the research and development of pharmaceutical products in order to produce more proprietary products with higher gross profit margin. We continued our commitment in property development, but will adjust our strategy according to market conditions. With an aim to further strengthen our leading role in the happiness industry, we have made extra efforts in the happiness ecosystem.
As at 30 June 2017, the Group’s capital commitment contracted but not provided for was RMB25,440.9 million. It was mainly committed for property development, purchase of plant and machinery and investments. Details of capital commitment are set out in note 17 to interim condensed consolidated financial statements.
Indebtedness And Liquidity Of The GroupAs at 30 June 2017, the total debt of the Group was RMB141,294.8 million, representing an increase over RMB126,276.8 million as at 31 December 2016, which was mainly due to the increase in borrowings as a result of business expansion of various segments of the Group. As at 30 June 2017, mid-to-long-term debt of the Group accounted for 62.7% of total debt, as opposed to 65.3% as at 31 December 2016. As at 30 June 2017, cash and bank balance and term deposits increased by 50.0% to RMB78,241.6 million as compared with RMB52,156.4 million as at 31 December 2016.
Unit: RMB million
30 June 2017 31 December 2016 Total debt 141,294.8 126,276.8Cash and bank and term deposits 78,241.6 52,156.4
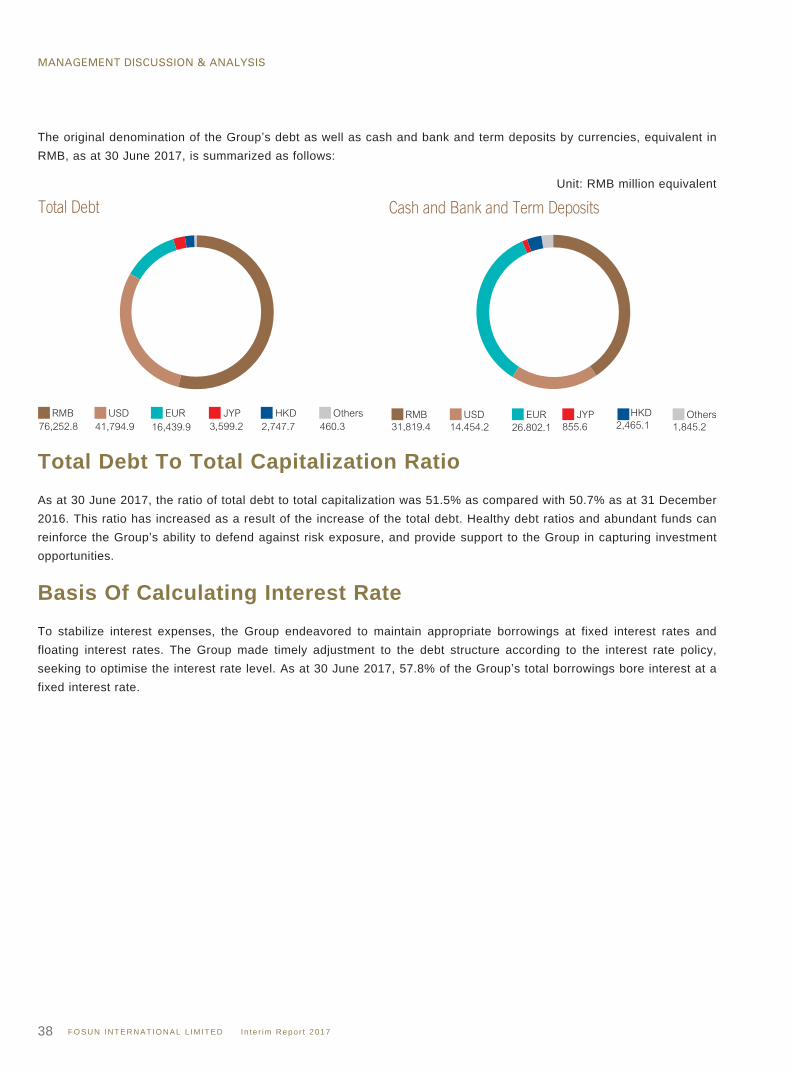
MANAGEMENT DISCUSSION & ANALYSIS
FOSUN INTERNATIONAL L IMITED I n te r im Repor t 201738
The original denomination of the Group’s debt as well as cash and bank and term deposits by currencies, equivalent in RMB, as at 30 June 2017, is summarized as follows:
Unit: RMB million equivalent
Total Debt To Total Capitalization RatioAs at 30 June 2017, the ratio of total debt to total capitalization was 51.5% as compared with 50.7% as at 31 December 2016. This ratio has increased as a result of the increase of the total debt. Healthy debt ratios and abundant funds can reinforce the Group’s ability to defend against risk exposure, and provide support to the Group in capturing investment opportunities.
Basis Of Calculating Interest RateTo stabilize interest expenses, the Group endeavored to maintain appropriate borrowings at fixed interest rates and floating interest rates. The Group made timely adjustment to the debt structure according to the interest rate policy, seeking to optimise the interest rate level. As at 30 June 2017, 57.8% of the Group’s total borrowings bore interest at a fixed interest rate.
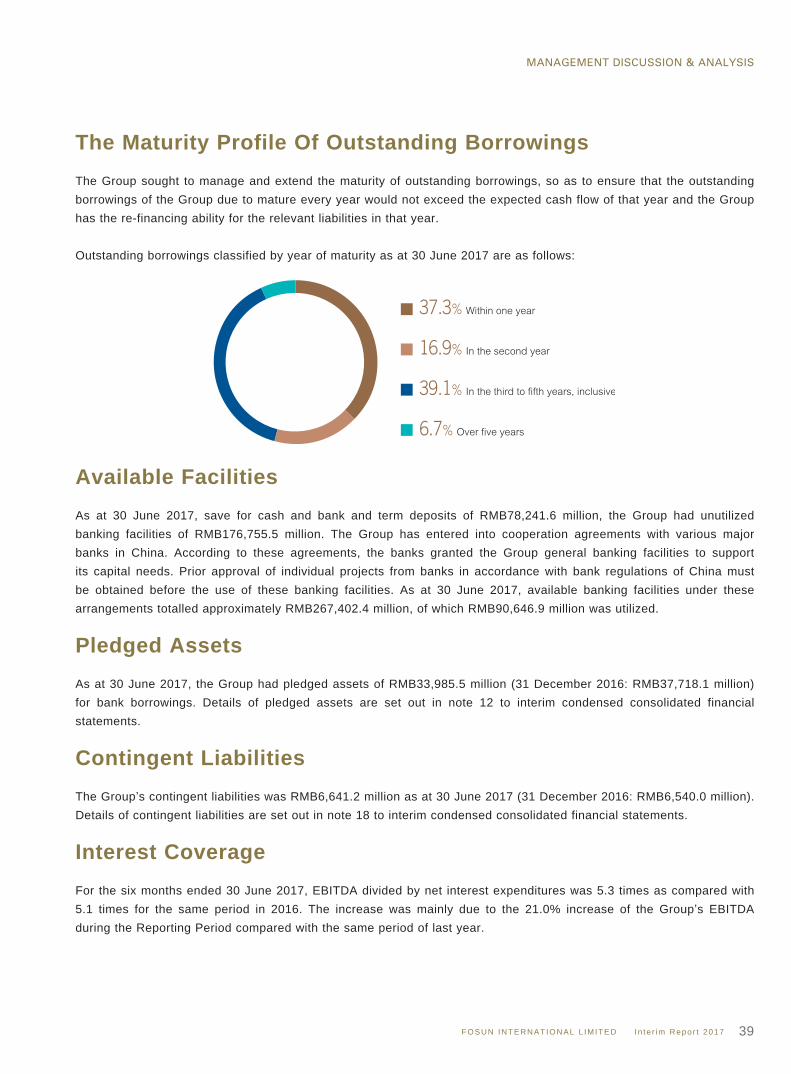
MANAGEMENT DISCUSSION & ANALYSIS
FOSUN INTERNATIONAL L IMITED I n te r im Repor t 2017 39
The Maturity Profile Of Outstanding BorrowingsThe Group sought to manage and extend the maturity of outstanding borrowings, so as to ensure that the outstanding borrowings of the Group due to mature every year would not exceed the expected cash flow of that year and the Group has the re-financing ability for the relevant liabilities in that year.
Outstanding borrowings classified by year of maturity as at 30 June 2017 are as follows:
Available FacilitiesAs at 30 June 2017, save for cash and bank and term deposits of RMB78,241.6 million, the Group had unutilized banking facilities of RMB176,755.5 million. The Group has entered into cooperation agreements with various major banks in China. According to these agreements, the banks granted the Group general banking facilities to support its capital needs. Prior approval of individual projects from banks in accordance with bank regulations of China must be obtained before the use of these banking facilities. As at 30 June 2017, available banking facilities under these arrangements totalled approximately RMB267,402.4 million, of which RMB90,646.9 million was utilized.
Pledged AssetsAs at 30 June 2017, the Group had pledged assets of RMB33,985.5 million (31 December 2016: RMB37,718.1 million) for bank borrowings. Details of pledged assets are set out in note 12 to interim condensed consolidated financial statements.
Contingent LiabilitiesThe Group’s contingent liabilities was RMB6,641.2 million as at 30 June 2017 (31 December 2016: RMB6,540.0 million). Details of contingent liabilities are set out in note 18 to interim condensed consolidated financial statements.
Interest CoverageFor the six months ended 30 June 2017, EBITDA divided by net interest expenditures was 5.3 times as compared with 5.1 times for the same period in 2016. The increase was mainly due to the 21.0% increase of the Group’s EBITDA during the Reporting Period compared with the same period of last year.
MANAGEMENT DISCUSSION & ANALYSIS
FOSUN INTERNATIONAL L IMITED I n te r im Repor t 201740
Financial Policies And Risk Management
General policy
The Company maintains the financial independence of different business segments. Nevertheless, the Company also gives appropriate guidance on the fund management of different segments so as to ensure that risks of the Group are well monitored and financial resources are being effectively applied. To maintain multiple financing channels, the Group tries to obtain funds from different channels through banks and capital markets. Finance arrangements are organised to meet the needs of business development and match the Group’s cash flow.
Foreign currency exposure
RMB is the functional and presentation currency of the Group. As a result of the launching of global strategy, the proportion of assets denominated in currencies other than RMB held by the Group had continuously increased. Financial settlement and currency conversion as at the reporting date of these non-RMB assets may generate a certain amount of foreign exchange losses or gains, thereby affecting the Group’s profits or net assets. Since the exchange rate reform in August 2015, the exchange rate of RMB against USD depreciated for a time and the volatility increased. We are uncertain of the trend of the exchange rate of RMB in the future. The cost of conversion of RMB into foreign currencies will be subject to the fluctuation of the exchange rate of RMB.
Interest rate exposure
The Group uses bank loans and other borrowings to meet its capital expenditure and working capital requirements from time to time and is subjected to the risk of interest rate fluctuation. Since a certain amount of the Group’s borrowings is provided at floating interest rates which are subjected to change by the lenders as required by amendments of regulations of the People’s Bank of China and the market conditions in and outside Mainland China, the interest expenses of the Group will increase if the People’s Bank of China or foreign banks increase their interest rates.
Application of derivatives
The Group will apply derivative instruments as necessary to hedge the risk exposure instead of speculation.
Forward-Looking StatementsThis interim report includes certain forward-looking statements which involve the financial conditions, results and businesses of the Group. These forward-looking statements are the Group’s expectation or beliefs on future events and they involve known and unknown risks and uncertainties, which may cause actual results, performance or development of the situation to differ materially from the situation expressed or implied by these statements.
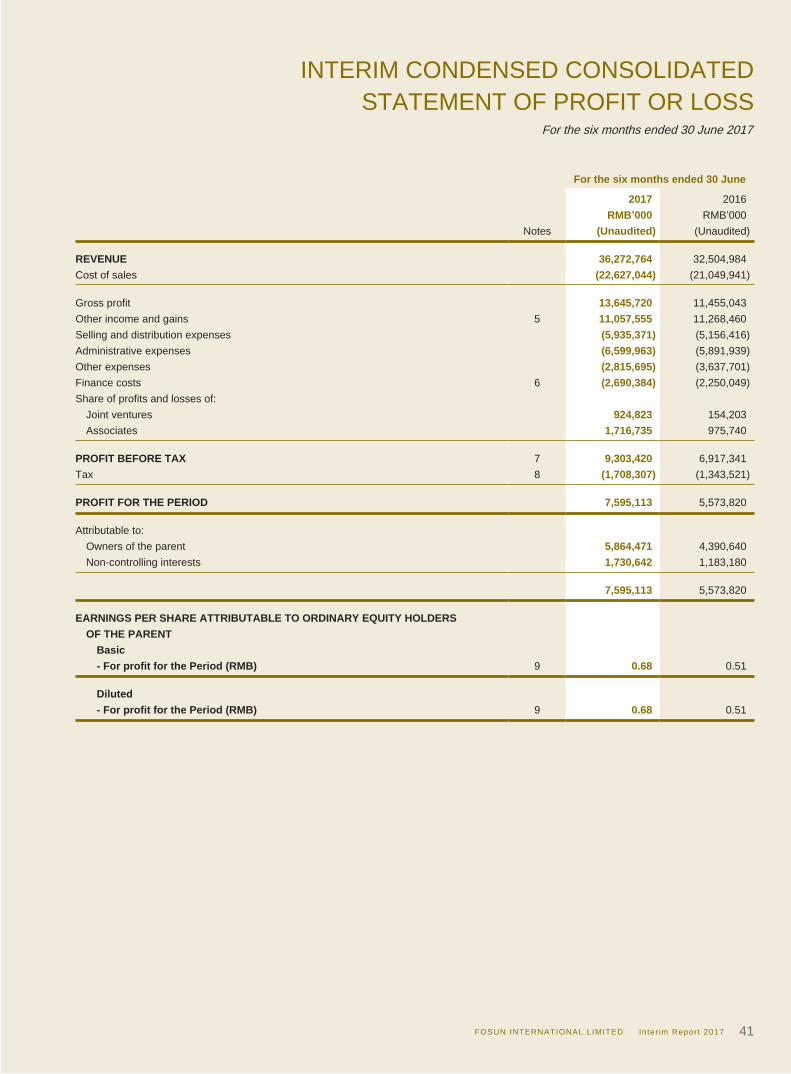
INTERIM CONDENSED CONSOLIDATEDSTATEMENT OF PROFIT OR LOSS
For the six months ended 30 June 2017
FOSUN INTERNATIONAL LIMITED Inter im Report 2017 41
For the six months ended 30 June
2017 2016RMB’000 RMB’000
Notes (Unaudited) (Unaudited) REVENUE 36,272,764 32,504,984Cost of sales (22,627,044) (21,049,941) Gross profit 13,645,720 11,455,043Other income and gains 5 11,057,555 11,268,460Selling and distribution expenses (5,935,371) (5,156,416)Administrative expenses (6,599,963) (5,891,939)Other expenses (2,815,695) (3,637,701)Finance costs 6 (2,690,384) (2,250,049)Share of profits and losses of: Joint ventures 924,823 154,203 Associates 1,716,735 975,740 PROFIT BEFORE TAX 7 9,303,420 6,917,341Tax 8 (1,708,307) (1,343,521) PROFIT FOR THE PERIOD 7,595,113 5,573,820 Attributable to: Owners of the parent 5,864,471 4,390,640 Non-controlling interests 1,730,642 1,183,180
7,595,113 5,573,820 EARNINGS PER SHARE ATTRIBUTABLE TO ORDINARY EQUITY HOLDERS OF THE PARENT Basic - For profit for the Period (RMB) 9 0.68 0.51 Diluted - For profit for the Period (RMB) 9 0.68 0.51
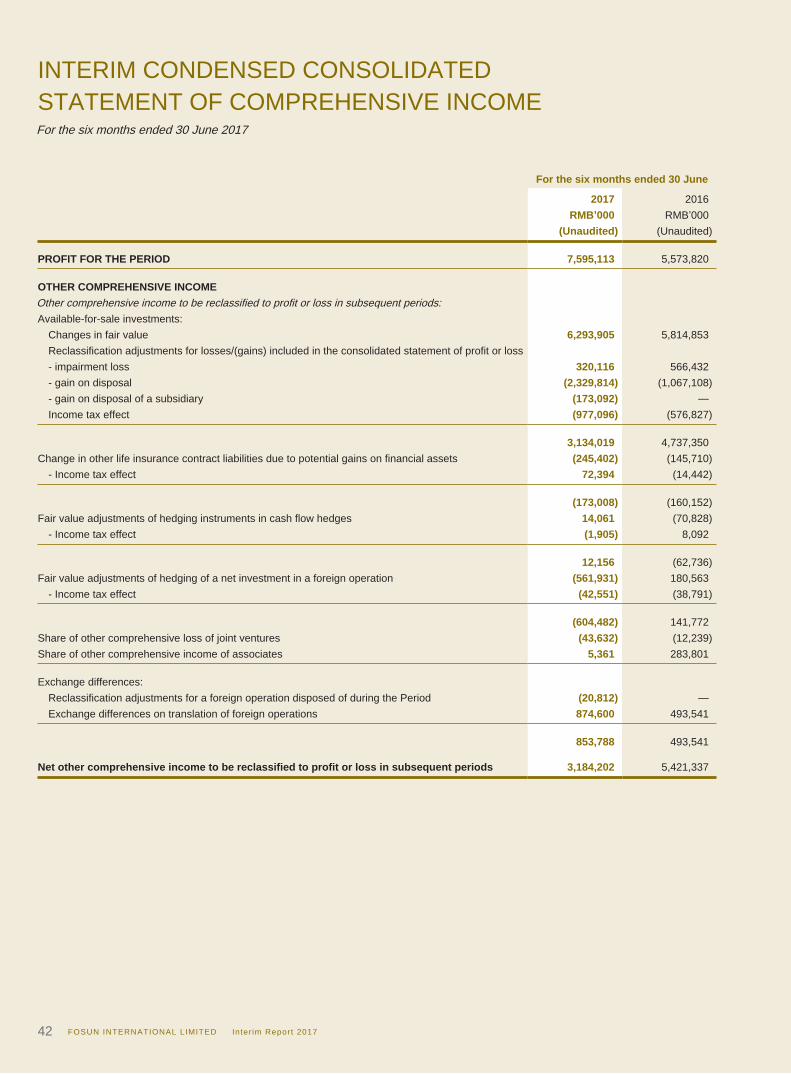
INTERIM CONDENSED CONSOLIDATEDSTATEMENT OF COMPREHENSIVE INCOMEFor the six months ended 30 June 2017
FOSUN INTERNATIONAL LIMITED Inter im Report 201742
For the six months ended 30 June
2017 2016RMB’000 RMB’000
(Unaudited) (Unaudited) PROFIT FOR THE PERIOD 7,595,113 5,573,820 OTHER COMPREHENSIVE INCOMEOther comprehensive income to be reclassified to profit or loss in subsequent periods:Available-for-sale investments: Changes in fair value 6,293,905 5,814,853 Reclassification adjustments for losses/(gains) included in the consolidated statement of profit or loss - impairment loss 320,116 566,432 - gain on disposal (2,329,814) (1,067,108) - gain on disposal of a subsidiary (173,092) — Income tax effect (977,096) (576,827)
3,134,019 4,737,350Change in other life insurance contract liabilities due to potential gains on financial assets (245,402) (145,710) - Income tax effect 72,394 (14,442)
(173,008) (160,152)Fair value adjustments of hedging instruments in cash flow hedges 14,061 (70,828) - Income tax effect (1,905) 8,092
12,156 (62,736)Fair value adjustments of hedging of a net investment in a foreign operation (561,931) 180,563 - Income tax effect (42,551) (38,791)
(604,482) 141,772Share of other comprehensive loss of joint ventures (43,632) (12,239)Share of other comprehensive income of associates 5,361 283,801 Exchange differences: Reclassification adjustments for a foreign operation disposed of during the Period (20,812) — Exchange differences on translation of foreign operations 874,600 493,541
853,788 493,541 Net other comprehensive income to be reclassified to profit or loss in subsequent periods 3,184,202 5,421,337
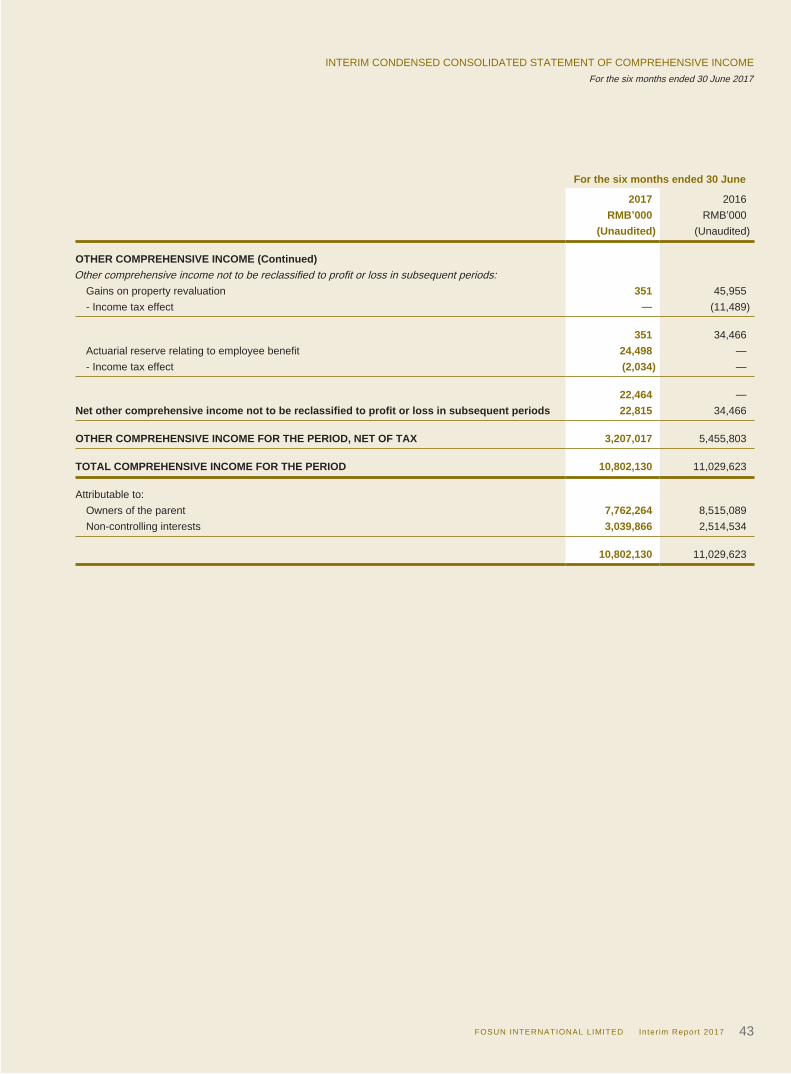
INTERIM CONDENSED CONSOLIDATED STATEMENT OF COMPREHENSIVE INCOMEFor the six months ended 30 June 2017
FOSUN INTERNATIONAL LIMITED Inter im Report 2017 43
For the six months ended 30 June
2017 2016RMB’000 RMB’000
(Unaudited) (Unaudited) OTHER COMPREHENSIVE INCOME (Continued)Other comprehensive income not to be reclassified to profit or loss in subsequent periods: Gains on property revaluation 351 45,955 - Income tax effect — (11,489)
351 34,466 Actuarial reserve relating to employee benefit 24,498 — - Income tax effect (2,034) —
22,464 —Net other comprehensive income not to be reclassified to profit or loss in subsequent periods 22,815 34,466 OTHER COMPREHENSIVE INCOME FOR THE PERIOD, NET OF TAX 3,207,017 5,455,803 TOTAL COMPREHENSIVE INCOME FOR THE PERIOD 10,802,130 11,029,623 Attributable to: Owners of the parent 7,762,264 8,515,089 Non-controlling interests 3,039,866 2,514,534
10,802,130 11,029,623
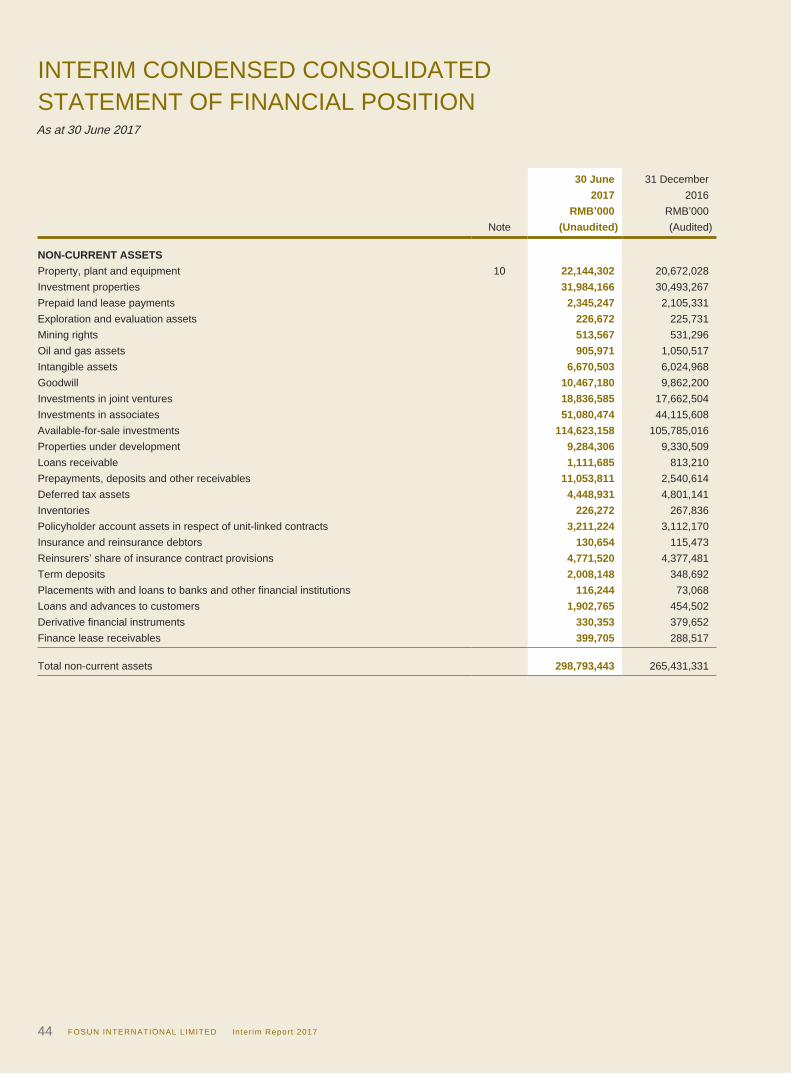
INTERIM CONDENSED CONSOLIDATEDSTATEMENT OF FINANCIAL POSITIONAs at 30 June 2017
FOSUN INTERNATIONAL LIMITED Inter im Report 201744
30 June 31 December2017 2016
RMB’000 RMB’000Note (Unaudited) (Audited)
NON-CURRENT ASSETSProperty, plant and equipment 10 22,144,302 20,672,028Investment properties 31,984,166 30,493,267Prepaid land lease payments 2,345,247 2,105,331Exploration and evaluation assets 226,672 225,731Mining rights 513,567 531,296Oil and gas assets 905,971 1,050,517Intangible assets 6,670,503 6,024,968Goodwill 10,467,180 9,862,200Investments in joint ventures 18,836,585 17,662,504Investments in associates 51,080,474 44,115,608Available-for-sale investments 114,623,158 105,785,016Properties under development 9,284,306 9,330,509Loans receivable 1,111,685 813,210Prepayments, deposits and other receivables 11,053,811 2,540,614Deferred tax assets 4,448,931 4,801,141Inventories 226,272 267,836Policyholder account assets in respect of unit-linked contracts 3,211,224 3,112,170Insurance and reinsurance debtors 130,654 115,473Reinsurers’ share of insurance contract provisions 4,771,520 4,377,481Term deposits 2,008,148 348,692Placements with and loans to banks and other financial institutions 116,244 73,068Loans and advances to customers 1,902,765 454,502Derivative financial instruments 330,353 379,652Finance lease receivables 399,705 288,517 Total non-current assets 298,793,443 265,431,331
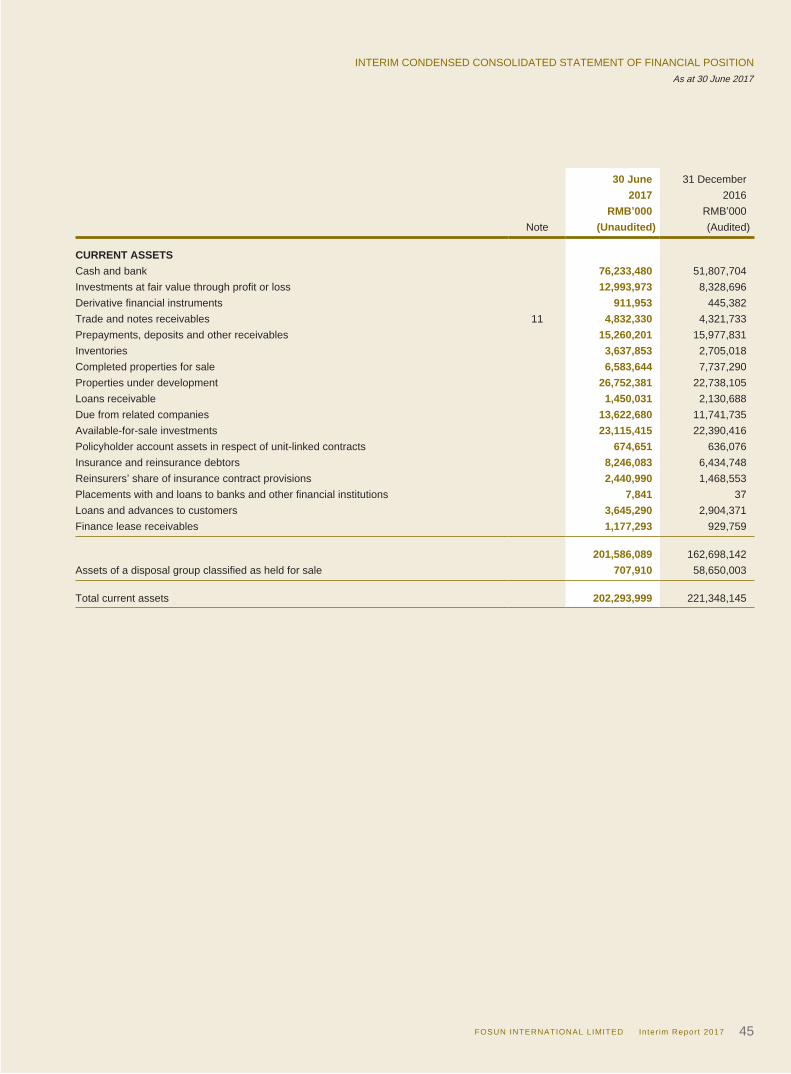
INTERIM CONDENSED CONSOLIDATED STATEMENT OF FINANCIAL POSITIONAs at 30 June 2017
FOSUN INTERNATIONAL LIMITED Inter im Report 2017 45
30 June 31 December2017 2016
RMB’000 RMB’000Note (Unaudited) (Audited)
CURRENT ASSETSCash and bank 76,233,480 51,807,704Investments at fair value through profit or loss 12,993,973 8,328,696Derivative financial instruments 911,953 445,382Trade and notes receivables 11 4,832,330 4,321,733Prepayments, deposits and other receivables 15,260,201 15,977,831Inventories 3,637,853 2,705,018Completed properties for sale 6,583,644 7,737,290Properties under development 26,752,381 22,738,105Loans receivable 1,450,031 2,130,688Due from related companies 13,622,680 11,741,735Available-for-sale investments 23,115,415 22,390,416Policyholder account assets in respect of unit-linked contracts 674,651 636,076Insurance and reinsurance debtors 8,246,083 6,434,748Reinsurers’ share of insurance contract provisions 2,440,990 1,468,553Placements with and loans to banks and other financial institutions 7,841 37Loans and advances to customers 3,645,290 2,904,371Finance lease receivables 1,177,293 929,759
201,586,089 162,698,142Assets of a disposal group classified as held for sale 707,910 58,650,003 Total current assets 202,293,999 221,348,145
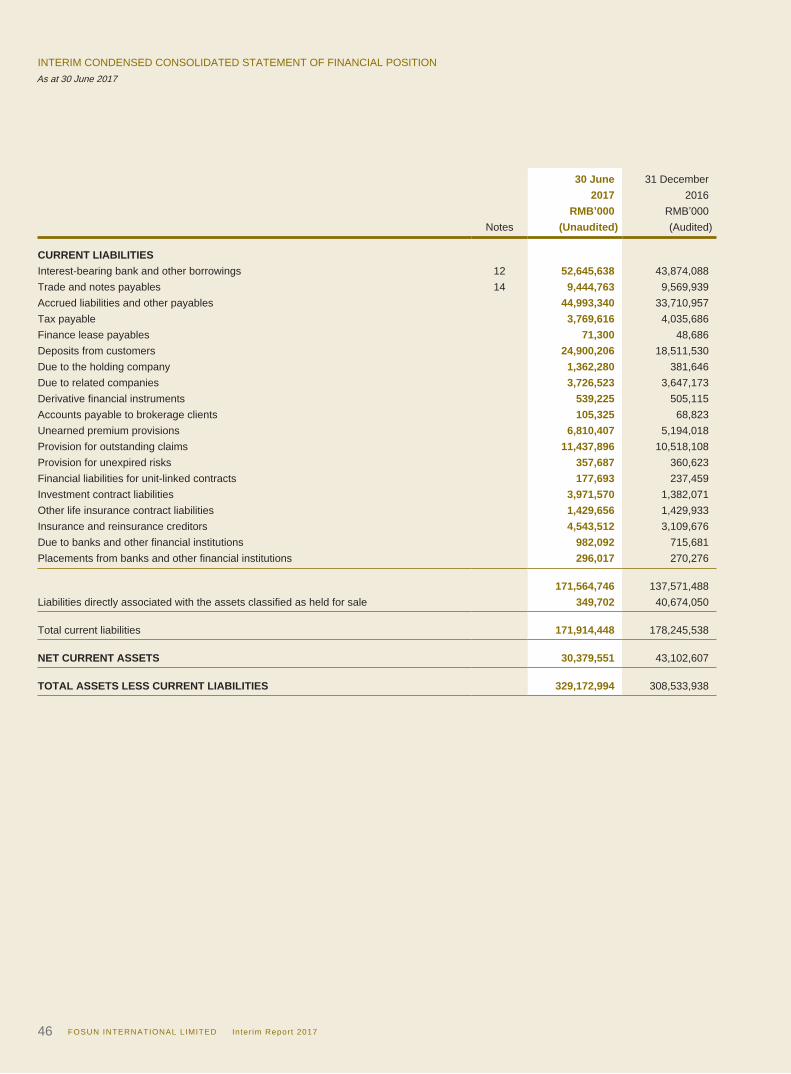
INTERIM CONDENSED CONSOLIDATED STATEMENT OF FINANCIAL POSITIONAs at 30 June 2017
FOSUN INTERNATIONAL LIMITED Inter im Report 201746
30 June 31 December2017 2016
RMB’000 RMB’000Notes (Unaudited) (Audited)
CURRENT LIABILITIESInterest-bearing bank and other borrowings 12 52,645,638 43,874,088Trade and notes payables 14 9,444,763 9,569,939Accrued liabilities and other payables 44,993,340 33,710,957Tax payable 3,769,616 4,035,686Finance lease payables 71,300 48,686Deposits from customers 24,900,206 18,511,530Due to the holding company 1,362,280 381,646Due to related companies 3,726,523 3,647,173Derivative financial instruments 539,225 505,115Accounts payable to brokerage clients 105,325 68,823Unearned premium provisions 6,810,407 5,194,018Provision for outstanding claims 11,437,896 10,518,108Provision for unexpired risks 357,687 360,623Financial liabilities for unit-linked contracts 177,693 237,459Investment contract liabilities 3,971,570 1,382,071Other life insurance contract liabilities 1,429,656 1,429,933Insurance and reinsurance creditors 4,543,512 3,109,676Due to banks and other financial institutions 982,092 715,681Placements from banks and other financial institutions 296,017 270,276
171,564,746 137,571,488Liabilities directly associated with the assets classified as held for sale 349,702 40,674,050 Total current liabilities 171,914,448 178,245,538 NET CURRENT ASSETS 30,379,551 43,102,607 TOTAL ASSETS LESS CURRENT LIABILITIES 329,172,994 308,533,938
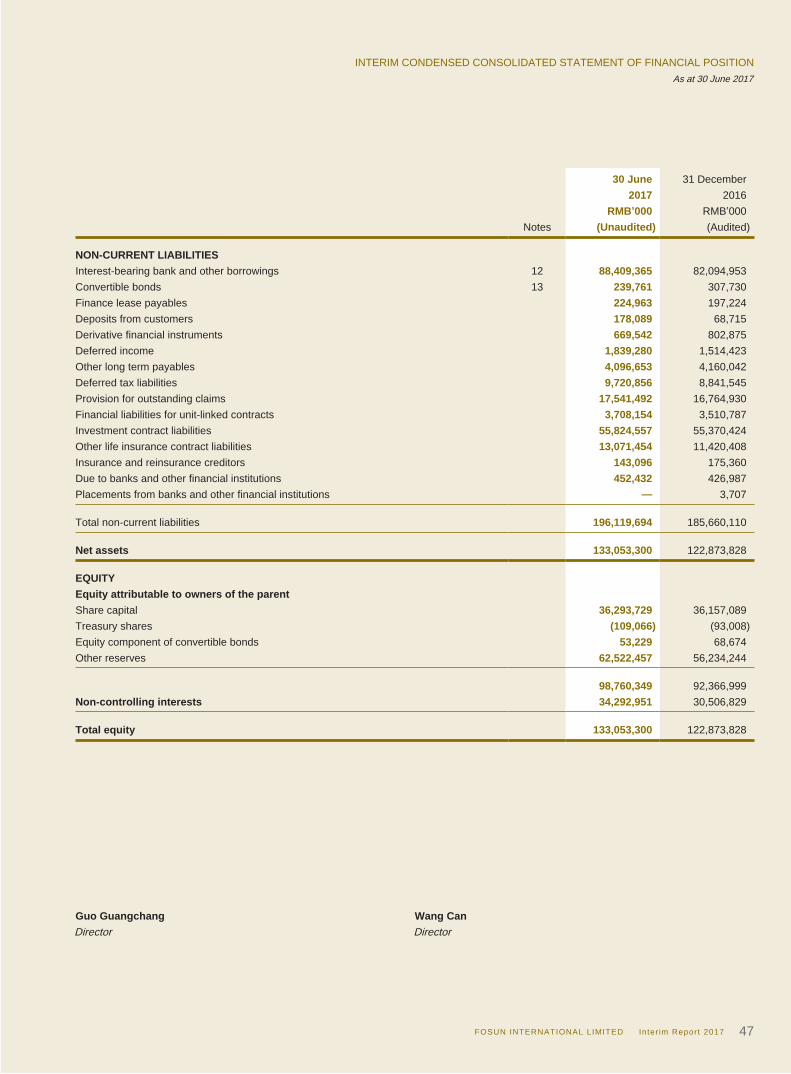
INTERIM CONDENSED CONSOLIDATED STATEMENT OF FINANCIAL POSITIONAs at 30 June 2017
FOSUN INTERNATIONAL LIMITED Inter im Report 2017 47
30 June 31 December2017 2016
RMB’000 RMB’000Notes (Unaudited) (Audited)
NON-CURRENT LIABILITIESInterest-bearing bank and other borrowings 12 88,409,365 82,094,953Convertible bonds 13 239,761 307,730Finance lease payables 224,963 197,224Deposits from customers 178,089 68,715Derivative financial instruments 669,542 802,875Deferred income 1,839,280 1,514,423Other long term payables 4,096,653 4,160,042Deferred tax liabilities 9,720,856 8,841,545Provision for outstanding claims 17,541,492 16,764,930Financial liabilities for unit-linked contracts 3,708,154 3,510,787Investment contract liabilities 55,824,557 55,370,424Other life insurance contract liabilities 13,071,454 11,420,408Insurance and reinsurance creditors 143,096 175,360Due to banks and other financial institutions 452,432 426,987Placements from banks and other financial institutions — 3,707 Total non-current liabilities 196,119,694 185,660,110 Net assets 133,053,300 122,873,828 EQUITYEquity attributable to owners of the parentShare capital 36,293,729 36,157,089Treasury shares (109,066) (93,008)Equity component of convertible bonds 53,229 68,674Other reserves 62,522,457 56,234,244
98,760,349 92,366,999Non-controlling interests 34,292,951 30,506,829 Total equity 133,053,300 122,873,828
Guo Guangchang Wang CanDirector Director
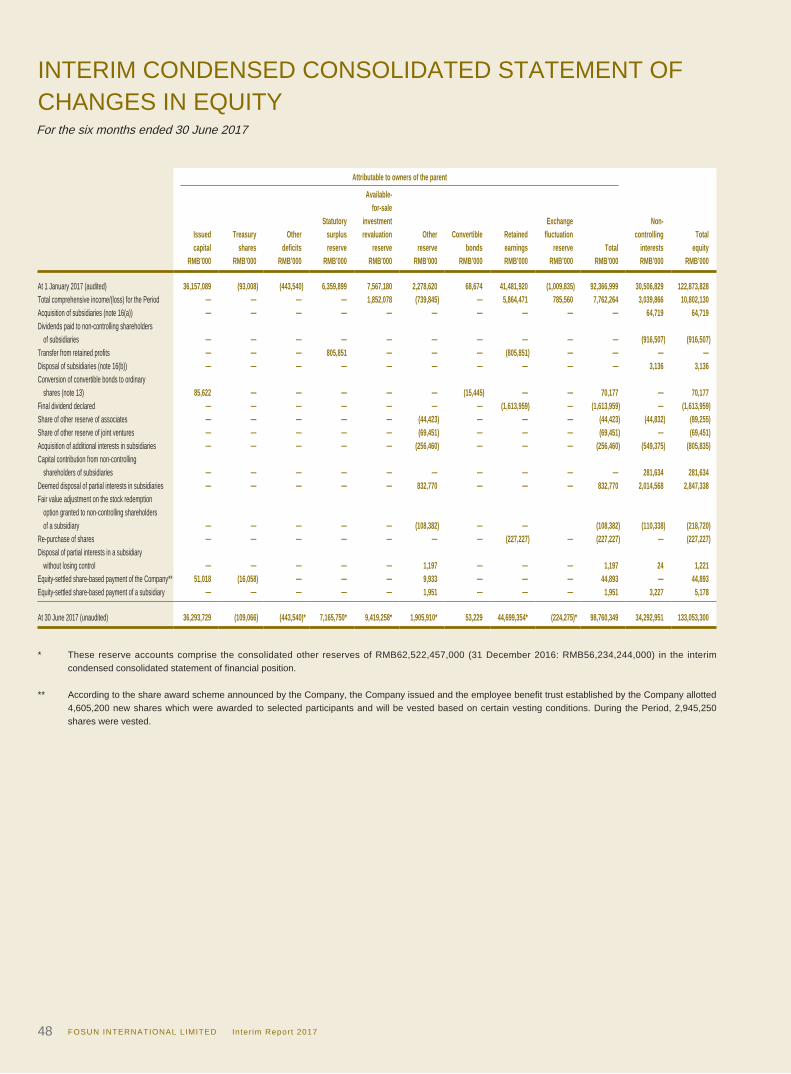
INTERIM CONDENSED CONSOLIDATED STATEMENT OF CHANGES IN EQUITYFor the six months ended 30 June 2017
FOSUN INTERNATIONAL LIMITED Inter im Report 201748
Attributable to owners of the parent
Available-for-sale
Statutory investment Exchange Non-Issued Treasury Other surplus revaluation Other Convertible Retained fluctuation controlling Totalcapital shares deficits reserve reserve reserve bonds earnings reserve Total interests equity
RMB’000 RMB’000 RMB’000 RMB’000 RMB’000 RMB’000 RMB’000 RMB’000 RMB’000 RMB’000 RMB’000 RMB’000 At 1 January 2017 (audited) 36,157,089 (93,008) (443,540) 6,359,899 7,567,180 2,278,620 68,674 41,481,920 (1,009,835) 92,366,999 30,506,829 122,873,828Total comprehensive income/(loss) for the Period — — — — 1,852,078 (739,845) — 5,864,471 785,560 7,762,264 3,039,866 10,802,130Acquisition of subsidiaries (note 16(a)) — — — — — — — — — — 64,719 64,719Dividends paid to non-controlling shareholders of subsidiaries — — — — — — — — — — (916,507) (916,507)Transfer from retained profits — — — 805,851 — — — (805,851) — — — —Disposal of subsidiaries (note 16(b)) — — — — — — — — — — 3,136 3,136Conversion of convertible bonds to ordinary shares (note 13) 85,622 — — — — — (15,445) — — 70,177 — 70,177Final dividend declared — — — — — — — (1,613,959) — (1,613,959) — (1,613,959)Share of other reserve of associates — — — — — (44,423) — — — (44,423) (44,832) (89,255)Share of other reserve of joint ventures — — — — — (69,451) — — — (69,451) — (69,451)Acquisition of additional interests in subsidiaries — — — — — (256,460) — — — (256,460) (549,375) (805,835)Capital contribution from non-controlling shareholders of subsidiaries — — — — — — — — — — 281,634 281,634Deemed disposal of partial interests in subsidiaries — — — — — 832,770 — — — 832,770 2,014,568 2,847,338Fair value adjustment on the stock redemption option granted to non-controlling shareholders of a subsidiary — — — — — (108,382) — — (108,382) (110,338) (218,720)Re-purchase of shares — — — — — — — (227,227) — (227,227) — (227,227)Disposal of partial interests in a subsidiary without losing control — — — — — 1,197 — — — 1,197 24 1,221Equity-settled share-based payment of the Company** 51,018 (16,058) — — — 9,933 — — — 44,893 — 44,893Equity-settled share-based payment of a subsidiary — — — — — 1,951 — — — 1,951 3,227 5,178 At 30 June 2017 (unaudited) 36,293,729 (109,066) (443,540)* 7,165,750* 9,419,258* 1,905,910* 53,229 44,699,354* (224,275)* 98,760,349 34,292,951 133,053,300
* These reserve accounts comprise the consolidated other reserves of RMB62,522,457,000 (31 December 2016: RMB56,234,244,000) in the interim condensed consolidated statement of financial position.
** According to the share award scheme announced by the Company, the Company issued and the employee benefit trust established by the Company allotted 4,605,200 new shares which were awarded to selected participants and will be vested based on certain vesting conditions. During the Period, 2,945,250 shares were vested.
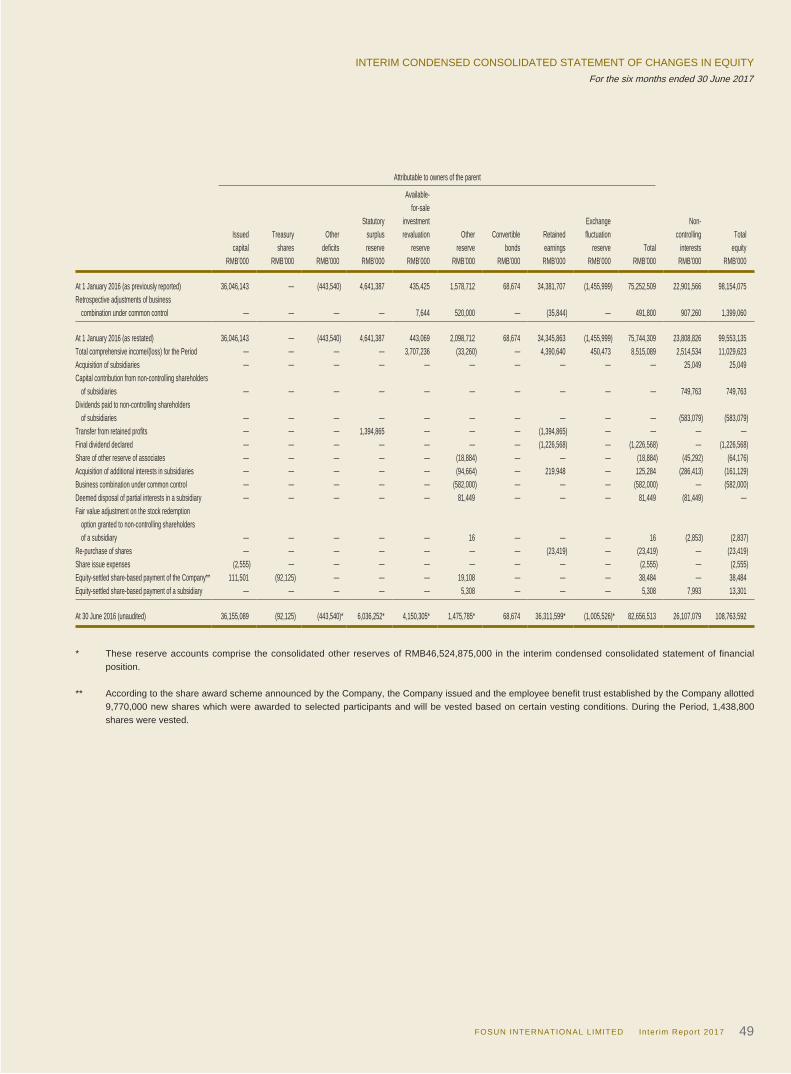
INTERIM CONDENSED CONSOLIDATED STATEMENT OF CHANGES IN EQUITYFor the six months ended 30 June 2017
FOSUN INTERNATIONAL LIMITED Inter im Report 2017 49
Attributable to owners of the parent Available-
for-saleStatutory investment Exchange Non-
Issued Treasury Other surplus revaluation Other Convertible Retained fluctuation controlling Totalcapital shares deficits reserve reserve reserve bonds earnings reserve Total interests equity
RMB’000 RMB’000 RMB’000 RMB’000 RMB’000 RMB’000 RMB’000 RMB’000 RMB’000 RMB’000 RMB’000 RMB’000 At 1 January 2016 (as previously reported) 36,046,143 — (443,540) 4,641,387 435,425 1,578,712 68,674 34,381,707 (1,455,999) 75,252,509 22,901,566 98,154,075Retrospective adjustments of business combination under common control — — — — 7,644 520,000 — (35,844) — 491,800 907,260 1,399,060 At 1 January 2016 (as restated) 36,046,143 — (443,540) 4,641,387 443,069 2,098,712 68,674 34,345,863 (1,455,999) 75,744,309 23,808,826 99,553,135Total comprehensive income/(loss) for the Period — — — — 3,707,236 (33,260) — 4,390,640 450,473 8,515,089 2,514,534 11,029,623Acquisition of subsidiaries — — — — — — — — — — 25,049 25,049Capital contribution from non-controlling shareholders of subsidiaries — — — — — — — — — — 749,763 749,763Dividends paid to non-controlling shareholders of subsidiaries — — — — — — — — — — (583,079) (583,079)Transfer from retained profits — — — 1,394,865 — — — (1,394,865) — — — —Final dividend declared — — — — — — — (1,226,568) — (1,226,568) — (1,226,568)Share of other reserve of associates — — — — — (18,884) — — — (18,884) (45,292) (64,176)Acquisition of additional interests in subsidiaries — — — — — (94,664) — 219,948 — 125,284 (286,413) (161,129)Business combination under common control — — — — — (582,000) — — — (582,000) — (582,000)Deemed disposal of partial interests in a subsidiary — — — — — 81,449 — — — 81,449 (81,449) —Fair value adjustment on the stock redemption option granted to non-controlling shareholders of a subsidiary — — — — — 16 — — — 16 (2,853) (2,837)Re-purchase of shares — — — — — — — (23,419) — (23,419) — (23,419)Share issue expenses (2,555) — — — — — — — — (2,555) — (2,555)Equity-settled share-based payment of the Company** 111,501 (92,125) — — — 19,108 — — — 38,484 — 38,484Equity-settled share-based payment of a subsidiary — — — — — 5,308 — — — 5,308 7,993 13,301 At 30 June 2016 (unaudited) 36,155,089 (92,125) (443,540)* 6,036,252* 4,150,305* 1,475,785* 68,674 36,311,599* (1,005,526)* 82,656,513 26,107,079 108,763,592
* These reserve accounts comprise the consolidated other reserves of RMB46,524,875,000 in the interim condensed consolidated statement of financial position.
** According to the share award scheme announced by the Company, the Company issued and the employee benefit trust established by the Company allotted 9,770,000 new shares which were awarded to selected participants and will be vested based on certain vesting conditions. During the Period, 1,438,800 shares were vested.
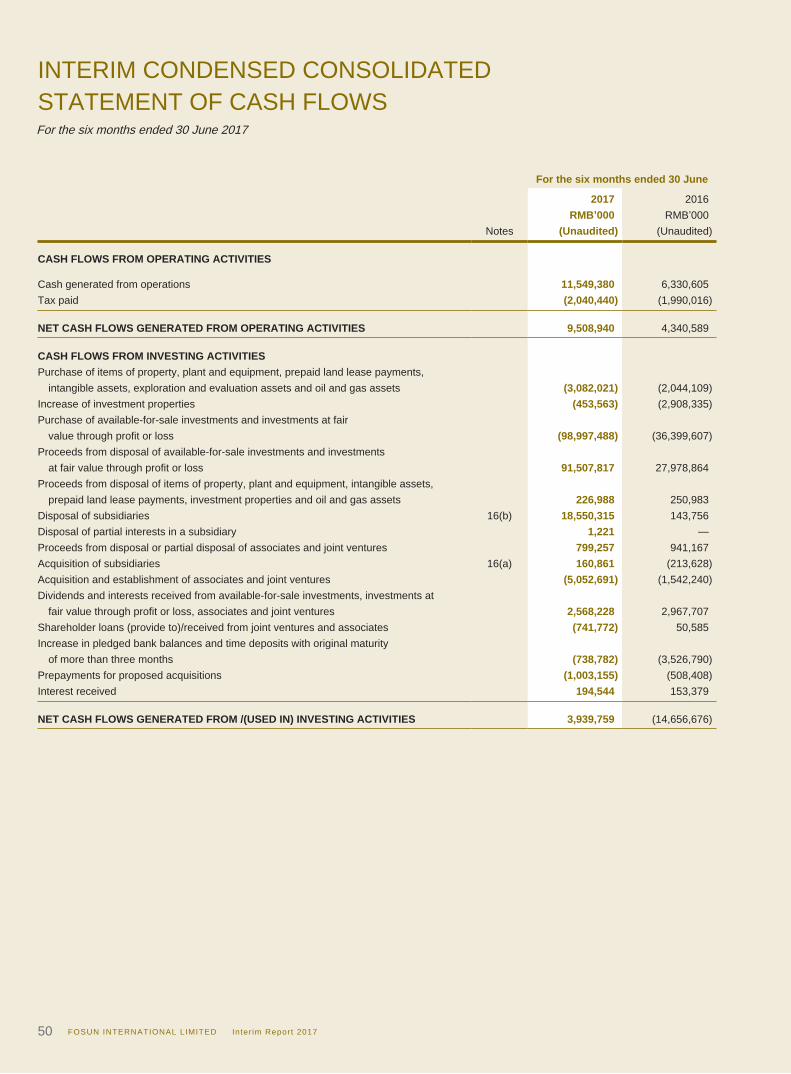
INTERIM CONDENSED CONSOLIDATEDSTATEMENT OF CASH FLOWSFor the six months ended 30 June 2017
FOSUN INTERNATIONAL LIMITED Inter im Report 201750
For the six months ended 30 June
2017 2016RMB’000 RMB’000
Notes (Unaudited) (Unaudited) CASH FLOWS FROM OPERATING ACTIVITIES
Cash generated from operations 11,549,380 6,330,605Tax paid (2,040,440) (1,990,016) NET CASH FLOWS GENERATED FROM OPERATING ACTIVITIES 9,508,940 4,340,589 CASH FLOWS FROM INVESTING ACTIVITIESPurchase of items of property, plant and equipment, prepaid land lease payments, intangible assets, exploration and evaluation assets and oil and gas assets (3,082,021) (2,044,109)Increase of investment properties (453,563) (2,908,335)Purchase of available-for-sale investments and investments at fair value through profit or loss (98,997,488) (36,399,607)Proceeds from disposal of available-for-sale investments and investments at fair value through profit or loss 91,507,817 27,978,864Proceeds from disposal of items of property, plant and equipment, intangible assets, prepaid land lease payments, investment properties and oil and gas assets 226,988 250,983Disposal of subsidiaries 16(b) 18,550,315 143,756Disposal of partial interests in a subsidiary 1,221 —Proceeds from disposal or partial disposal of associates and joint ventures 799,257 941,167Acquisition of subsidiaries 16(a) 160,861 (213,628)Acquisition and establishment of associates and joint ventures (5,052,691) (1,542,240)Dividends and interests received from available-for-sale investments, investments at fair value through profit or loss, associates and joint ventures 2,568,228 2,967,707Shareholder loans (provide to)/received from joint ventures and associates (741,772) 50,585Increase in pledged bank balances and time deposits with original maturity of more than three months (738,782) (3,526,790)Prepayments for proposed acquisitions (1,003,155) (508,408)Interest received 194,544 153,379 NET CASH FLOWS GENERATED FROM /(USED IN) INVESTING ACTIVITIES 3,939,759 (14,656,676)
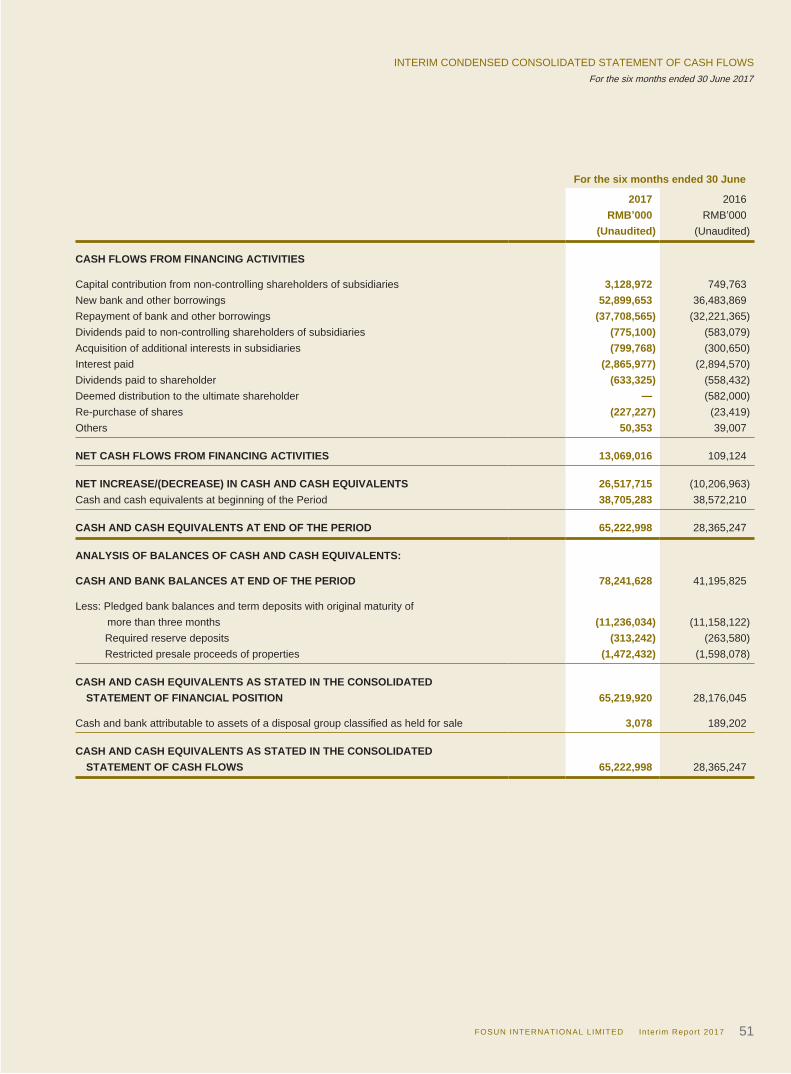
INTERIM CONDENSED CONSOLIDATED STATEMENT OF CASH FLOWSFor the six months ended 30 June 2017
FOSUN INTERNATIONAL LIMITED Inter im Report 2017 51
For the six months ended 30 June
2017 2016RMB’000 RMB’000
(Unaudited) (Unaudited) CASH FLOWS FROM FINANCING ACTIVITIES
Capital contribution from non-controlling shareholders of subsidiaries 3,128,972 749,763New bank and other borrowings 52,899,653 36,483,869Repayment of bank and other borrowings (37,708,565) (32,221,365)Dividends paid to non-controlling shareholders of subsidiaries (775,100) (583,079)Acquisition of additional interests in subsidiaries (799,768) (300,650)Interest paid (2,865,977) (2,894,570)Dividends paid to shareholder (633,325) (558,432)Deemed distribution to the ultimate shareholder — (582,000)Re-purchase of shares (227,227) (23,419)Others 50,353 39,007 NET CASH FLOWS FROM FINANCING ACTIVITIES 13,069,016 109,124 NET INCREASE/(DECREASE) IN CASH AND CASH EQUIVALENTS 26,517,715 (10,206,963)Cash and cash equivalents at beginning of the Period 38,705,283 38,572,210 CASH AND CASH EQUIVALENTS AT END OF THE PERIOD 65,222,998 28,365,247 ANALYSIS OF BALANCES OF CASH AND CASH EQUIVALENTS:
CASH AND BANK BALANCES AT END OF THE PERIOD 78,241,628 41,195,825
Less: Pledged bank balances and term deposits with original maturity of more than three months (11,236,034) (11,158,122) Required reserve deposits (313,242) (263,580) Restricted presale proceeds of properties (1,472,432) (1,598,078) CASH AND CASH EQUIVALENTS AS STATED IN THE CONSOLIDATED STATEMENT OF FINANCIAL POSITION 65,219,920 28,176,045
Cash and bank attributable to assets of a disposal group classified as held for sale 3,078 189,202 CASH AND CASH EQUIVALENTS AS STATED IN THE CONSOLIDATED STATEMENT OF CASH FLOWS 65,222,998 28,365,247
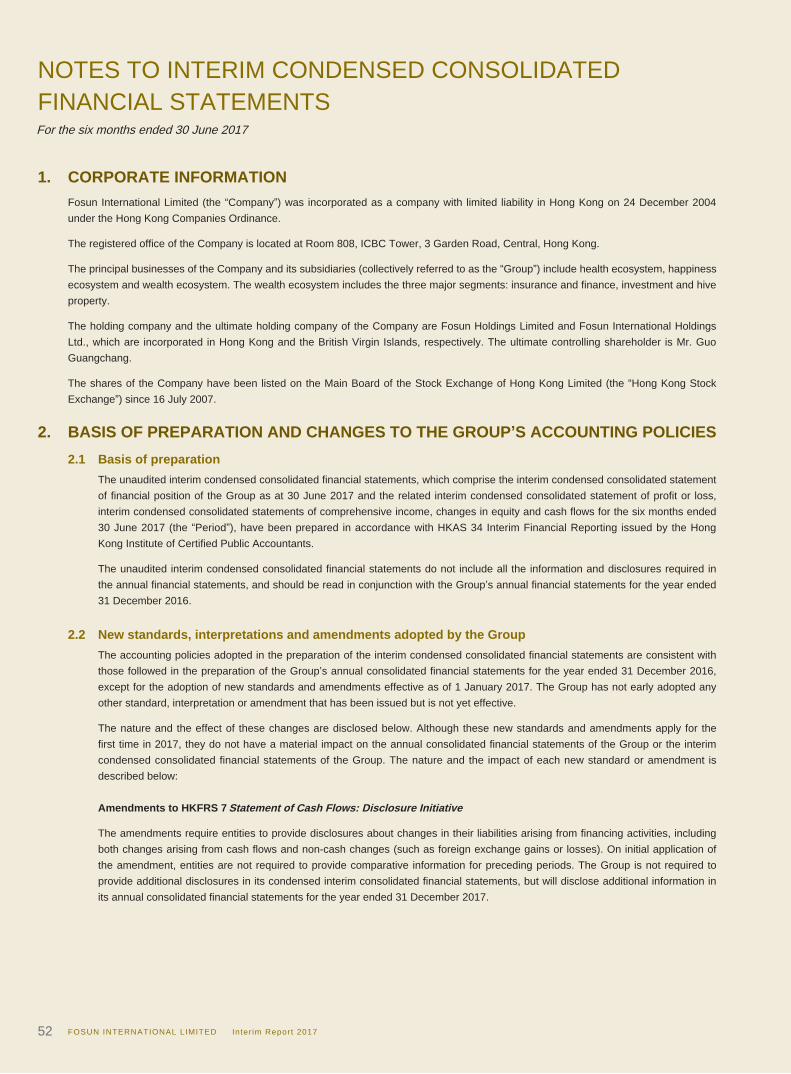
NOTES TO INTERIM CONDENSED CONSOLIDATED FINANCIAL STATEMENTSFor the six months ended 30 June 2017
FOSUN INTERNATIONAL LIMITED Inter im Report 201752
1. CORPORATE INFORMATIONFosun International Limited (the “Company”) was incorporated as a company with limited liability in Hong Kong on 24 December 2004 under the Hong Kong Companies Ordinance.
The registered office of the Company is located at Room 808, ICBC Tower, 3 Garden Road, Central, Hong Kong.
The principal businesses of the Company and its subsidiaries (collectively referred to as the “Group”) include health ecosystem, happiness ecosystem and wealth ecosystem. The wealth ecosystem includes the three major segments: insurance and finance, investment and hive property.
The holding company and the ultimate holding company of the Company are Fosun Holdings Limited and Fosun International Holdings Ltd., which are incorporated in Hong Kong and the British Virgin Islands, respectively. The ultimate controlling shareholder is Mr. Guo Guangchang.
The shares of the Company have been listed on the Main Board of the Stock Exchange of Hong Kong Limited (the “Hong Kong Stock Exchange”) since 16 July 2007.
2. BASIS OF PREPARATION AND CHANGES TO THE GROUP’S ACCOUNTING POLICIES2.1 Basis of preparation
The unaudited interim condensed consolidated financial statements, which comprise the interim condensed consolidated statement of financial position of the Group as at 30 June 2017 and the related interim condensed consolidated statement of profit or loss, interim condensed consolidated statements of comprehensive income, changes in equity and cash flows for the six months ended 30 June 2017 (the “Period”), have been prepared in accordance with HKAS 34 Interim Financial Reporting issued by the Hong Kong Institute of Certified Public Accountants.
The unaudited interim condensed consolidated financial statements do not include all the information and disclosures required in the annual financial statements, and should be read in conjunction with the Group’s annual financial statements for the year ended 31 December 2016.
2.2 New standards, interpretations and amendments adopted by the GroupThe accounting policies adopted in the preparation of the interim condensed consolidated financial statements are consistent with those followed in the preparation of the Group’s annual consolidated financial statements for the year ended 31 December 2016, except for the adoption of new standards and amendments effective as of 1 January 2017. The Group has not early adopted any other standard, interpretation or amendment that has been issued but is not yet effective.
The nature and the effect of these changes are disclosed below. Although these new standards and amendments apply for the first time in 2017, they do not have a material impact on the annual consolidated financial statements of the Group or the interim condensed consolidated financial statements of the Group. The nature and the impact of each new standard or amendment is described below:
Amendments to HKFRS 7 Statement of Cash Flows: Disclosure Initiative
The amendments require entities to provide disclosures about changes in their liabilities arising from financing activities, including both changes arising from cash flows and non-cash changes (such as foreign exchange gains or losses). On initial application of the amendment, entities are not required to provide comparative information for preceding periods. The Group is not required to provide additional disclosures in its condensed interim consolidated financial statements, but will disclose additional information in its annual consolidated financial statements for the year ended 31 December 2017.
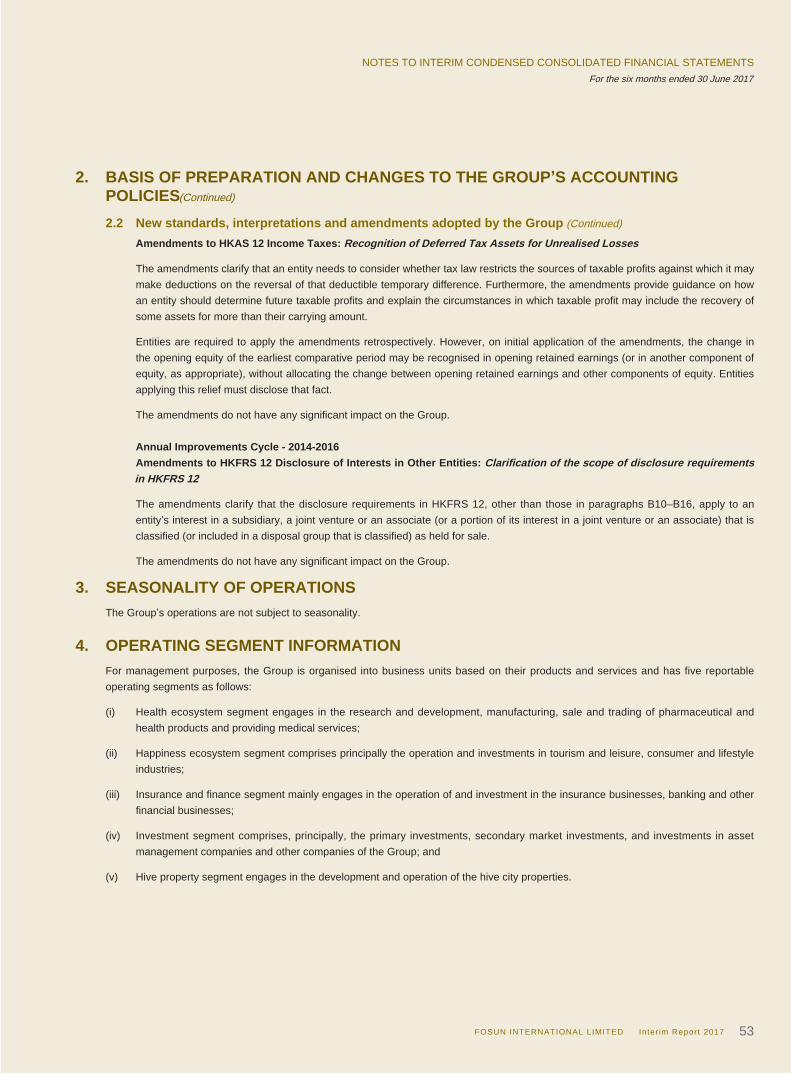
NOTES TO INTERIM CONDENSED CONSOLIDATED FINANCIAL STATEMENTSFor the six months ended 30 June 2017
FOSUN INTERNATIONAL LIMITED Inter im Report 2017 53
2. BASIS OF PREPARATION AND CHANGES TO THE GROUP’S ACCOUNTING POLICIES(Continued)
2.2 New standards, interpretations and amendments adopted by the Group (Continued)
Amendments to HKAS 12 Income Taxes: Recognition of Deferred Tax Assets for Unrealised Losses
The amendments clarify that an entity needs to consider whether tax law restricts the sources of taxable profits against which it may make deductions on the reversal of that deductible temporary difference. Furthermore, the amendments provide guidance on how an entity should determine future taxable profits and explain the circumstances in which taxable profit may include the recovery of some assets for more than their carrying amount.
Entities are required to apply the amendments retrospectively. However, on initial application of the amendments, the change in the opening equity of the earliest comparative period may be recognised in opening retained earnings (or in another component of equity, as appropriate), without allocating the change between opening retained earnings and other components of equity. Entities applying this relief must disclose that fact.
The amendments do not have any significant impact on the Group.
Annual Improvements Cycle - 2014-2016Amendments to HKFRS 12 Disclosure of Interests in Other Entities: Clarification of the scope of disclosure requirements in HKFRS 12
The amendments clarify that the disclosure requirements in HKFRS 12, other than those in paragraphs B10–B16, apply to an entity’s interest in a subsidiary, a joint venture or an associate (or a portion of its interest in a joint venture or an associate) that is classified (or included in a disposal group that is classified) as held for sale.
The amendments do not have any significant impact on the Group.
3. SEASONALITY OF OPERATIONSThe Group’s operations are not subject to seasonality.
4. OPERATING SEGMENT INFORMATIONFor management purposes, the Group is organised into business units based on their products and services and has five reportable operating segments as follows:
(i) Health ecosystem segment engages in the research and development, manufacturing, sale and trading of pharmaceutical and health products and providing medical services;
(ii) Happiness ecosystem segment comprises principally the operation and investments in tourism and leisure, consumer and lifestyle industries;
(iii) Insurance and finance segment mainly engages in the operation of and investment in the insurance businesses, banking and other financial businesses;
(iv) Investment segment comprises, principally, the primary investments, secondary market investments, and investments in asset management companies and other companies of the Group; and
(v) Hive property segment engages in the development and operation of the hive city properties.
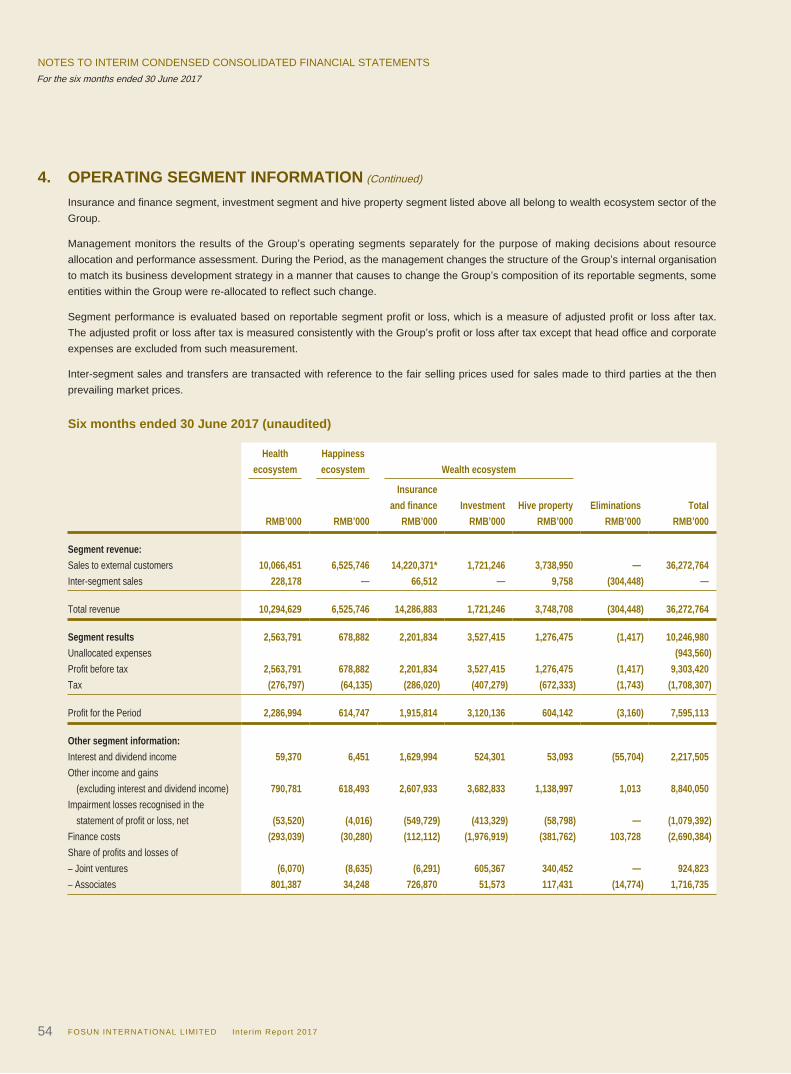
NOTES TO INTERIM CONDENSED CONSOLIDATED FINANCIAL STATEMENTSFor the six months ended 30 June 2017
FOSUN INTERNATIONAL LIMITED Inter im Report 201754
4. OPERATING SEGMENT INFORMATION (Continued)
Insurance and finance segment, investment segment and hive property segment listed above all belong to wealth ecosystem sector of the Group.
Management monitors the results of the Group’s operating segments separately for the purpose of making decisions about resource allocation and performance assessment. During the Period, as the management changes the structure of the Group’s internal organisation to match its business development strategy in a manner that causes to change the Group’s composition of its reportable segments, some entities within the Group were re-allocated to reflect such change.
Segment performance is evaluated based on reportable segment profit or loss, which is a measure of adjusted profit or loss after tax. The adjusted profit or loss after tax is measured consistently with the Group’s profit or loss after tax except that head office and corporate expenses are excluded from such measurement.
Inter-segment sales and transfers are transacted with reference to the fair selling prices used for sales made to third parties at the then prevailing market prices.
Six months ended 30 June 2017 (unaudited)
Health ecosystem
Happiness ecosystem Wealth ecosystem
Insurance and finance Investment Hive property Eliminations Total
RMB’000 RMB’000 RMB’000 RMB’000 RMB’000 RMB’000 RMB’000 Segment revenue:Sales to external customers 10,066,451 6,525,746 14,220,371* 1,721,246 3,738,950 — 36,272,764Inter-segment sales 228,178 — 66,512 — 9,758 (304,448) — Total revenue 10,294,629 6,525,746 14,286,883 1,721,246 3,748,708 (304,448) 36,272,764 Segment results 2,563,791 678,882 2,201,834 3,527,415 1,276,475 (1,417) 10,246,980Unallocated expenses (943,560)Profit before tax 2,563,791 678,882 2,201,834 3,527,415 1,276,475 (1,417) 9,303,420Tax (276,797) (64,135) (286,020) (407,279) (672,333) (1,743) (1,708,307) Profit for the Period 2,286,994 614,747 1,915,814 3,120,136 604,142 (3,160) 7,595,113 Other segment information:Interest and dividend income 59,370 6,451 1,629,994 524,301 53,093 (55,704) 2,217,505Other income and gains (excluding interest and dividend income) 790,781 618,493 2,607,933 3,682,833 1,138,997 1,013 8,840,050Impairment losses recognised in the statement of profit or loss, net (53,520) (4,016) (549,729) (413,329) (58,798) — (1,079,392)Finance costs (293,039) (30,280) (112,112) (1,976,919) (381,762) 103,728 (2,690,384)Share of profits and losses of– Joint ventures (6,070) (8,635) (6,291) 605,367 340,452 — 924,823– Associates 801,387 34,248 726,870 51,573 117,431 (14,774) 1,716,735
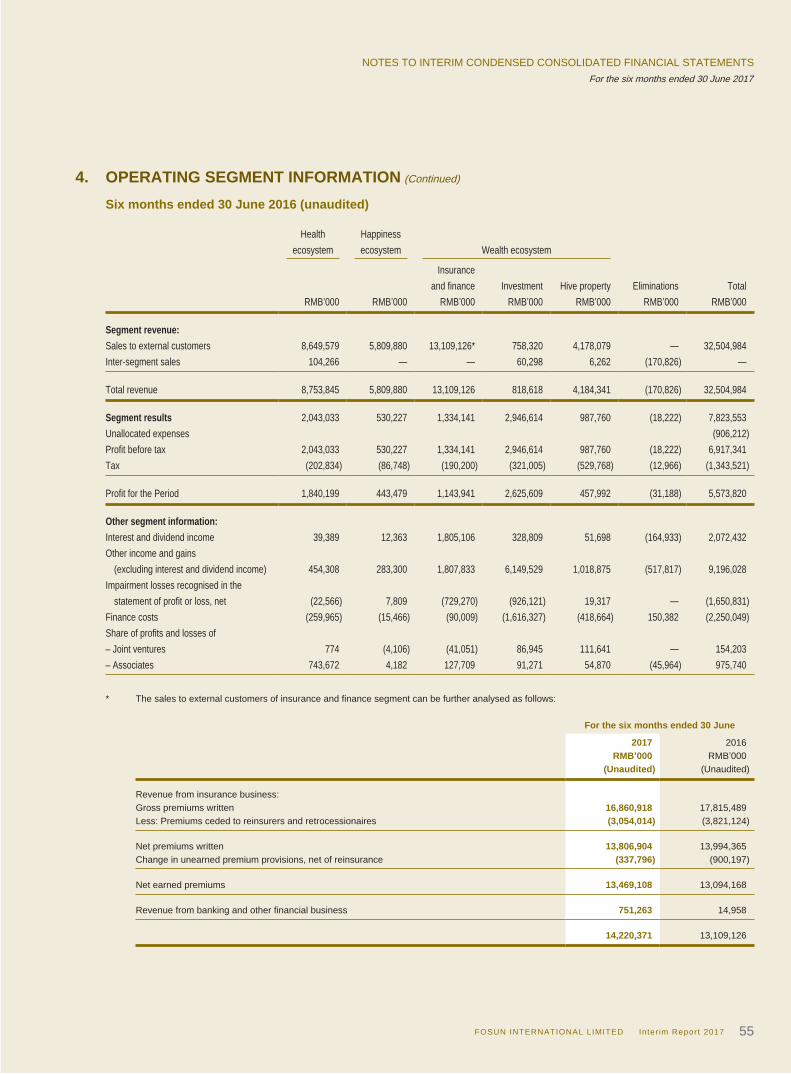
NOTES TO INTERIM CONDENSED CONSOLIDATED FINANCIAL STATEMENTSFor the six months ended 30 June 2017
FOSUN INTERNATIONAL LIMITED Inter im Report 2017 55
4. OPERATING SEGMENT INFORMATION (Continued)
Six months ended 30 June 2016 (unaudited)
Health ecosystem
Happiness ecosystem Wealth ecosystem
Insurance and finance Investment Hive property Eliminations Total
RMB’000 RMB’000 RMB’000 RMB’000 RMB’000 RMB’000 RMB’000 Segment revenue:Sales to external customers 8,649,579 5,809,880 13,109,126* 758,320 4,178,079 — 32,504,984Inter-segment sales 104,266 — — 60,298 6,262 (170,826) — Total revenue 8,753,845 5,809,880 13,109,126 818,618 4,184,341 (170,826) 32,504,984 Segment results 2,043,033 530,227 1,334,141 2,946,614 987,760 (18,222) 7,823,553Unallocated expenses (906,212)Profit before tax 2,043,033 530,227 1,334,141 2,946,614 987,760 (18,222) 6,917,341Tax (202,834) (86,748) (190,200) (321,005) (529,768) (12,966) (1,343,521) Profit for the Period 1,840,199 443,479 1,143,941 2,625,609 457,992 (31,188) 5,573,820 Other segment information:Interest and dividend income 39,389 12,363 1,805,106 328,809 51,698 (164,933) 2,072,432Other income and gains (excluding interest and dividend income) 454,308 283,300 1,807,833 6,149,529 1,018,875 (517,817) 9,196,028Impairment losses recognised in the statement of profit or loss, net (22,566) 7,809 (729,270) (926,121) 19,317 — (1,650,831)Finance costs (259,965) (15,466) (90,009) (1,616,327) (418,664) 150,382 (2,250,049)Share of profits and losses of– Joint ventures 774 (4,106) (41,051) 86,945 111,641 — 154,203– Associates 743,672 4,182 127,709 91,271 54,870 (45,964) 975,740
* The sales to external customers of insurance and finance segment can be further analysed as follows:
For the six months ended 30 June
2017 2016RMB’000 RMB’000
(Unaudited) (Unaudited) Revenue from insurance business:Gross premiums written 16,860,918 17,815,489Less: Premiums ceded to reinsurers and retrocessionaires (3,054,014) (3,821,124) Net premiums written 13,806,904 13,994,365Change in unearned premium provisions, net of reinsurance (337,796) (900,197) Net earned premiums 13,469,108 13,094,168 Revenue from banking and other financial business 751,263 14,958
14,220,371 13,109,126
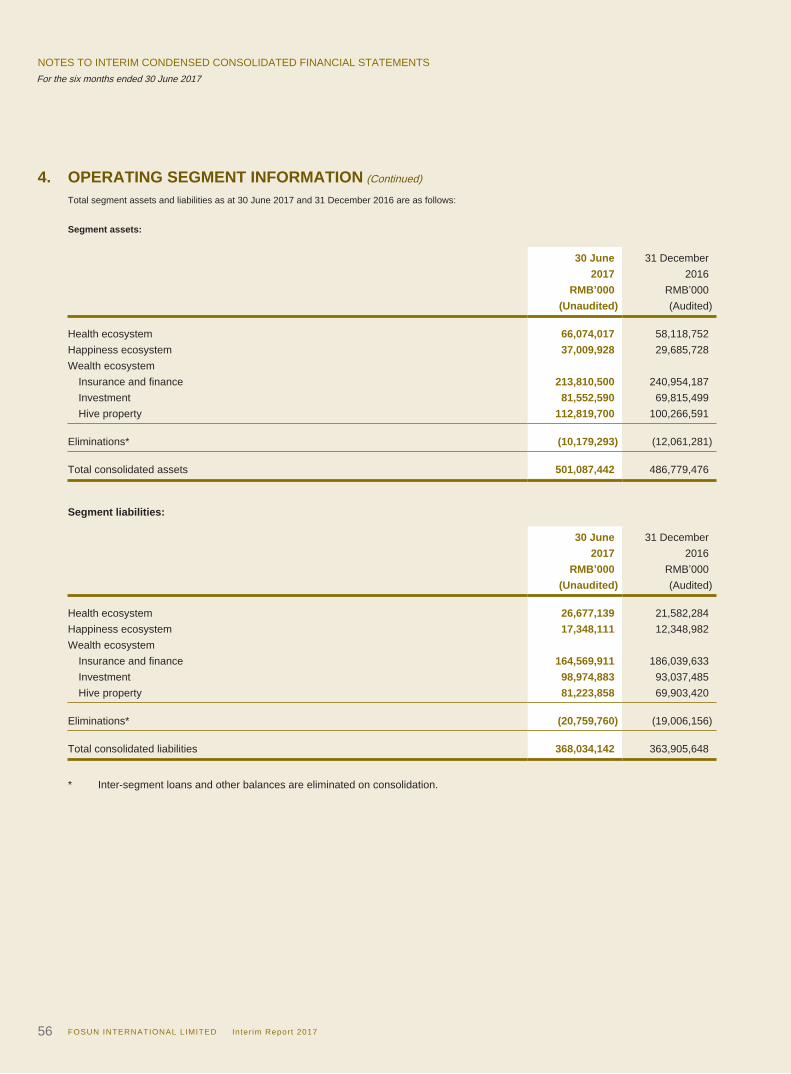
NOTES TO INTERIM CONDENSED CONSOLIDATED FINANCIAL STATEMENTSFor the six months ended 30 June 2017
FOSUN INTERNATIONAL LIMITED Inter im Report 201756
4. OPERATING SEGMENT INFORMATION (Continued)
Total segment assets and liabilities as at 30 June 2017 and 31 December 2016 are as follows:
Segment assets:
30 June 31 December2017 2016
RMB’000 RMB’000(Unaudited) (Audited)
Health ecosystem 66,074,017 58,118,752Happiness ecosystem 37,009,928 29,685,728Wealth ecosystem Insurance and finance 213,810,500 240,954,187 Investment 81,552,590 69,815,499 Hive property 112,819,700 100,266,591 Eliminations* (10,179,293) (12,061,281) Total consolidated assets 501,087,442 486,779,476
Segment liabilities:
30 June 31 December2017 2016
RMB’000 RMB’000(Unaudited) (Audited)
Health ecosystem 26,677,139 21,582,284Happiness ecosystem 17,348,111 12,348,982Wealth ecosystem Insurance and finance 164,569,911 186,039,633 Investment 98,974,883 93,037,485 Hive property 81,223,858 69,903,420 Eliminations* (20,759,760) (19,006,156) Total consolidated liabilities 368,034,142 363,905,648
* Inter-segment loans and other balances are eliminated on consolidation.
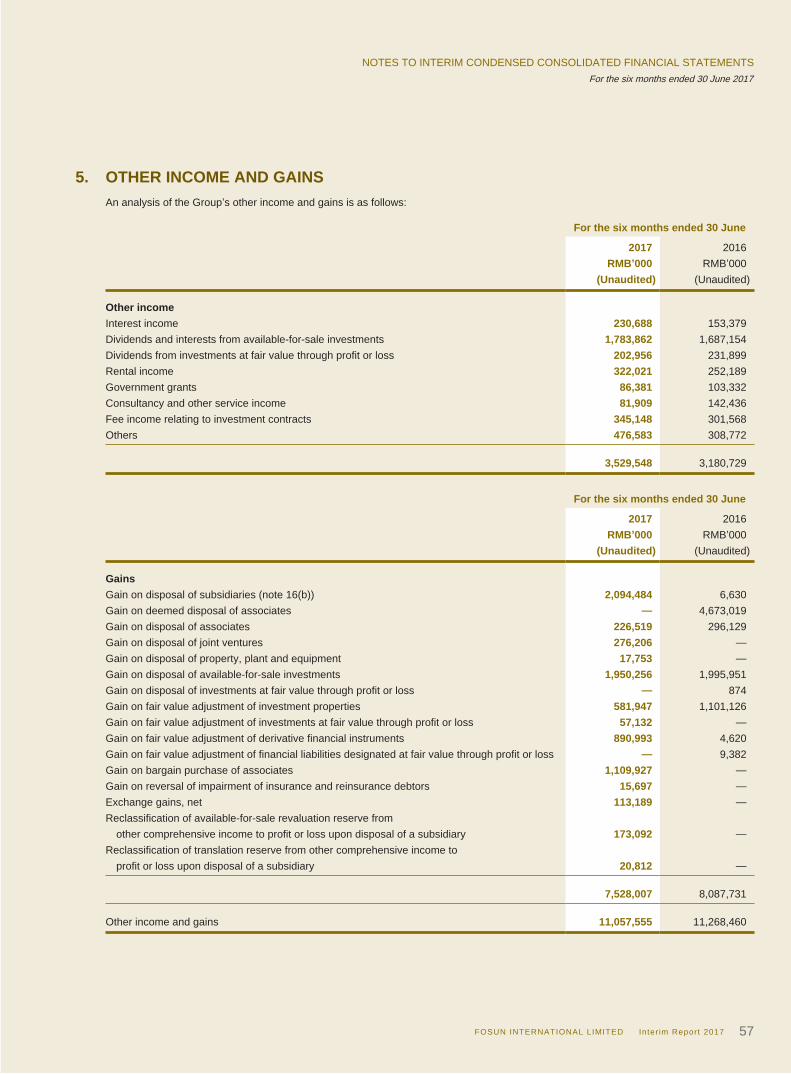
NOTES TO INTERIM CONDENSED CONSOLIDATED FINANCIAL STATEMENTSFor the six months ended 30 June 2017
FOSUN INTERNATIONAL LIMITED Inter im Report 2017 57
5. OTHER INCOME AND GAINSAn analysis of the Group’s other income and gains is as follows:
For the six months ended 30 June
2017 2016RMB’000 RMB’000
(Unaudited) (Unaudited) Other incomeInterest income 230,688 153,379Dividends and interests from available-for-sale investments 1,783,862 1,687,154Dividends from investments at fair value through profit or loss 202,956 231,899Rental income 322,021 252,189Government grants 86,381 103,332Consultancy and other service income 81,909 142,436Fee income relating to investment contracts 345,148 301,568Others 476,583 308,772
3,529,548 3,180,729
For the six months ended 30 June
2017 2016RMB’000 RMB’000
(Unaudited) (Unaudited) GainsGain on disposal of subsidiaries (note 16(b)) 2,094,484 6,630Gain on deemed disposal of associates — 4,673,019Gain on disposal of associates 226,519 296,129Gain on disposal of joint ventures 276,206 —Gain on disposal of property, plant and equipment 17,753 —Gain on disposal of available-for-sale investments 1,950,256 1,995,951Gain on disposal of investments at fair value through profit or loss — 874Gain on fair value adjustment of investment properties 581,947 1,101,126Gain on fair value adjustment of investments at fair value through profit or loss 57,132 —Gain on fair value adjustment of derivative financial instruments 890,993 4,620Gain on fair value adjustment of financial liabilities designated at fair value through profit or loss — 9,382Gain on bargain purchase of associates 1,109,927 —Gain on reversal of impairment of insurance and reinsurance debtors 15,697 —Exchange gains, net 113,189 —Reclassification of available-for-sale revaluation reserve from other comprehensive income to profit or loss upon disposal of a subsidiary 173,092 —Reclassification of translation reserve from other comprehensive income to profit or loss upon disposal of a subsidiary 20,812 —
7,528,007 8,087,731 Other income and gains 11,057,555 11,268,460
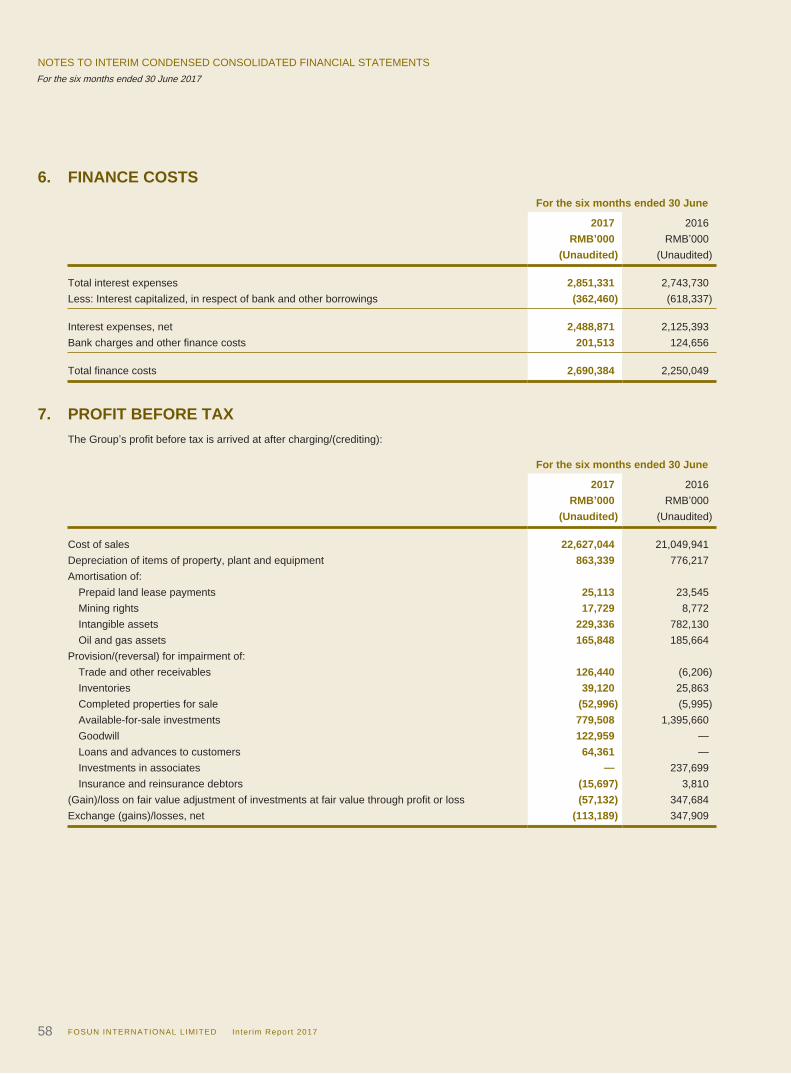
NOTES TO INTERIM CONDENSED CONSOLIDATED FINANCIAL STATEMENTSFor the six months ended 30 June 2017
FOSUN INTERNATIONAL LIMITED Inter im Report 201758
6. FINANCE COSTSFor the six months ended 30 June
2017 2016RMB’000 RMB’000
(Unaudited) (Unaudited) Total interest expenses 2,851,331 2,743,730Less: Interest capitalized, in respect of bank and other borrowings (362,460) (618,337) Interest expenses, net 2,488,871 2,125,393Bank charges and other finance costs 201,513 124,656 Total finance costs 2,690,384 2,250,049
7. PROFIT BEFORE TAXThe Group’s profit before tax is arrived at after charging/(crediting):
For the six months ended 30 June
2017 2016RMB’000 RMB’000
(Unaudited) (Unaudited) Cost of sales 22,627,044 21,049,941Depreciation of items of property, plant and equipment 863,339 776,217Amortisation of: Prepaid land lease payments 25,113 23,545 Mining rights 17,729 8,772 Intangible assets 229,336 782,130 Oil and gas assets 165,848 185,664Provision/(reversal) for impairment of: Trade and other receivables 126,440 (6,206) Inventories 39,120 25,863 Completed properties for sale (52,996) (5,995) Available-for-sale investments 779,508 1,395,660 Goodwill 122,959 — Loans and advances to customers 64,361 — Investments in associates — 237,699 Insurance and reinsurance debtors (15,697) 3,810(Gain)/loss on fair value adjustment of investments at fair value through profit or loss (57,132) 347,684Exchange (gains)/losses, net (113,189) 347,909
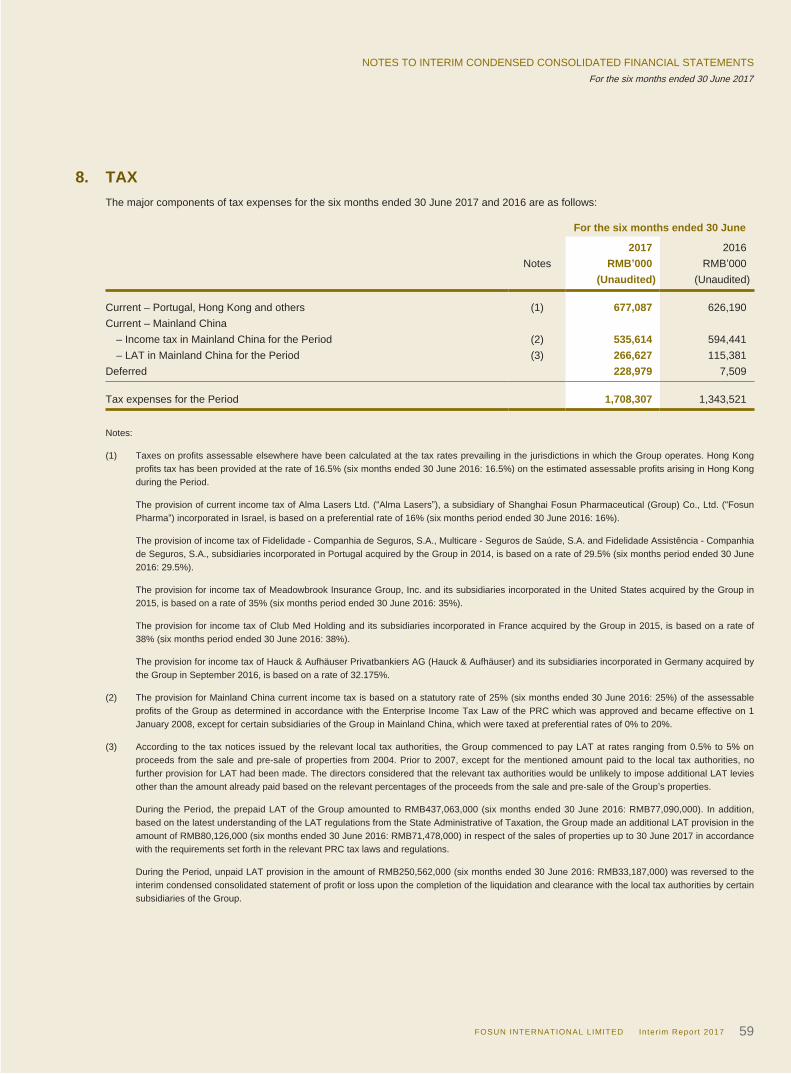
NOTES TO INTERIM CONDENSED CONSOLIDATED FINANCIAL STATEMENTSFor the six months ended 30 June 2017
FOSUN INTERNATIONAL LIMITED Inter im Report 2017 59
8. TAXThe major components of tax expenses for the six months ended 30 June 2017 and 2016 are as follows:
For the six months ended 30 June
2017 2016Notes RMB’000 RMB’000
(Unaudited) (Unaudited) Current – Portugal, Hong Kong and others (1) 677,087 626,190Current – Mainland China – Income tax in Mainland China for the Period (2) 535,614 594,441 – LAT in Mainland China for the Period (3) 266,627 115,381Deferred 228,979 7,509 Tax expenses for the Period 1,708,307 1,343,521
Notes:
(1) Taxes on profits assessable elsewhere have been calculated at the tax rates prevailing in the jurisdictions in which the Group operates. Hong Kong profits tax has been provided at the rate of 16.5% (six months ended 30 June 2016: 16.5%) on the estimated assessable profits arising in Hong Kong during the Period.
The provision of current income tax of Alma Lasers Ltd. (“Alma Lasers”), a subsidiary of Shanghai Fosun Pharmaceutical (Group) Co., Ltd. (“Fosun Pharma”) incorporated in Israel, is based on a preferential rate of 16% (six months period ended 30 June 2016: 16%).
The provision of income tax of Fidelidade - Companhia de Seguros, S.A., Multicare - Seguros de Saúde, S.A. and Fidelidade Assistência - Companhia de Seguros, S.A., subsidiaries incorporated in Portugal acquired by the Group in 2014, is based on a rate of 29.5% (six months period ended 30 June 2016: 29.5%).
The provision for income tax of Meadowbrook Insurance Group, Inc. and its subsidiaries incorporated in the United States acquired by the Group in 2015, is based on a rate of 35% (six months period ended 30 June 2016: 35%).
The provision for income tax of Club Med Holding and its subsidiaries incorporated in France acquired by the Group in 2015, is based on a rate of 38% (six months period ended 30 June 2016: 38%).
The provision for income tax of Hauck & Aufhäuser Privatbankiers AG (Hauck & Aufhäuser) and its subsidiaries incorporated in Germany acquired by the Group in September 2016, is based on a rate of 32.175%.
(2) The provision for Mainland China current income tax is based on a statutory rate of 25% (six months ended 30 June 2016: 25%) of the assessable profits of the Group as determined in accordance with the Enterprise Income Tax Law of the PRC which was approved and became effective on 1 January 2008, except for certain subsidiaries of the Group in Mainland China, which were taxed at preferential rates of 0% to 20%.
(3) According to the tax notices issued by the relevant local tax authorities, the Group commenced to pay LAT at rates ranging from 0.5% to 5% on proceeds from the sale and pre-sale of properties from 2004. Prior to 2007, except for the mentioned amount paid to the local tax authorities, no further provision for LAT had been made. The directors considered that the relevant tax authorities would be unlikely to impose additional LAT levies other than the amount already paid based on the relevant percentages of the proceeds from the sale and pre-sale of the Group’s properties.
During the Period, the prepaid LAT of the Group amounted to RMB437,063,000 (six months ended 30 June 2016: RMB77,090,000). In addition, based on the latest understanding of the LAT regulations from the State Administrative of Taxation, the Group made an additional LAT provision in the amount of RMB80,126,000 (six months ended 30 June 2016: RMB71,478,000) in respect of the sales of properties up to 30 June 2017 in accordance with the requirements set forth in the relevant PRC tax laws and regulations.
During the Period, unpaid LAT provision in the amount of RMB250,562,000 (six months ended 30 June 2016: RMB33,187,000) was reversed to the interim condensed consolidated statement of profit or loss upon the completion of the liquidation and clearance with the local tax authorities by certain subsidiaries of the Group.
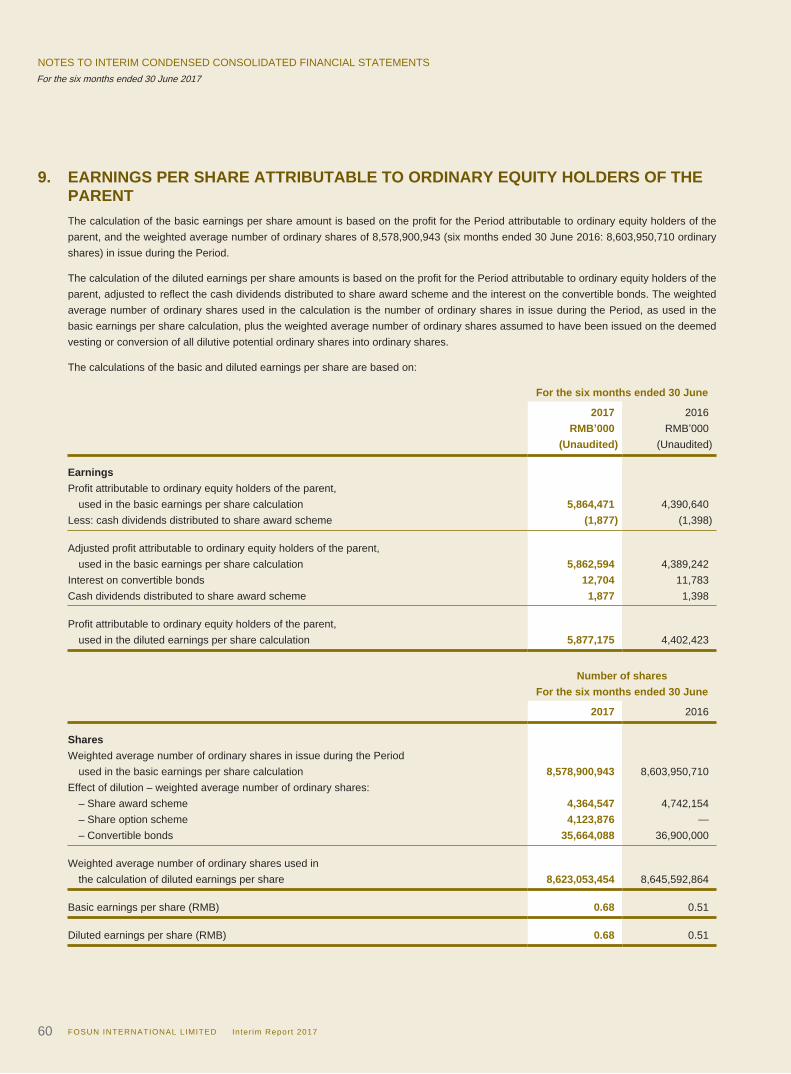
NOTES TO INTERIM CONDENSED CONSOLIDATED FINANCIAL STATEMENTSFor the six months ended 30 June 2017
FOSUN INTERNATIONAL LIMITED Inter im Report 201760
9. EARNINGS PER SHARE ATTRIBUTABLE TO ORDINARY EQUITY HOLDERS OF THE PARENTThe calculation of the basic earnings per share amount is based on the profit for the Period attributable to ordinary equity holders of the parent, and the weighted average number of ordinary shares of 8,578,900,943 (six months ended 30 June 2016: 8,603,950,710 ordinary shares) in issue during the Period.
The calculation of the diluted earnings per share amounts is based on the profit for the Period attributable to ordinary equity holders of the parent, adjusted to reflect the cash dividends distributed to share award scheme and the interest on the convertible bonds. The weighted average number of ordinary shares used in the calculation is the number of ordinary shares in issue during the Period, as used in the basic earnings per share calculation, plus the weighted average number of ordinary shares assumed to have been issued on the deemed vesting or conversion of all dilutive potential ordinary shares into ordinary shares.
The calculations of the basic and diluted earnings per share are based on:
For the six months ended 30 June
2017 2016RMB’000 RMB’000
(Unaudited) (Unaudited) EarningsProfit attributable to ordinary equity holders of the parent, used in the basic earnings per share calculation 5,864,471 4,390,640Less: cash dividends distributed to share award scheme (1,877) (1,398) Adjusted profit attributable to ordinary equity holders of the parent, used in the basic earnings per share calculation 5,862,594 4,389,242Interest on convertible bonds 12,704 11,783Cash dividends distributed to share award scheme 1,877 1,398 Profit attributable to ordinary equity holders of the parent, used in the diluted earnings per share calculation 5,877,175 4,402,423
Number of sharesFor the six months ended 30 June
2017 2016 SharesWeighted average number of ordinary shares in issue during the Period used in the basic earnings per share calculation 8,578,900,943 8,603,950,710Effect of dilution – weighted average number of ordinary shares: – Share award scheme 4,364,547 4,742,154 – Share option scheme 4,123,876 — – Convertible bonds 35,664,088 36,900,000 Weighted average number of ordinary shares used in the calculation of diluted earnings per share 8,623,053,454 8,645,592,864 Basic earnings per share (RMB) 0.68 0.51 Diluted earnings per share (RMB) 0.68 0.51
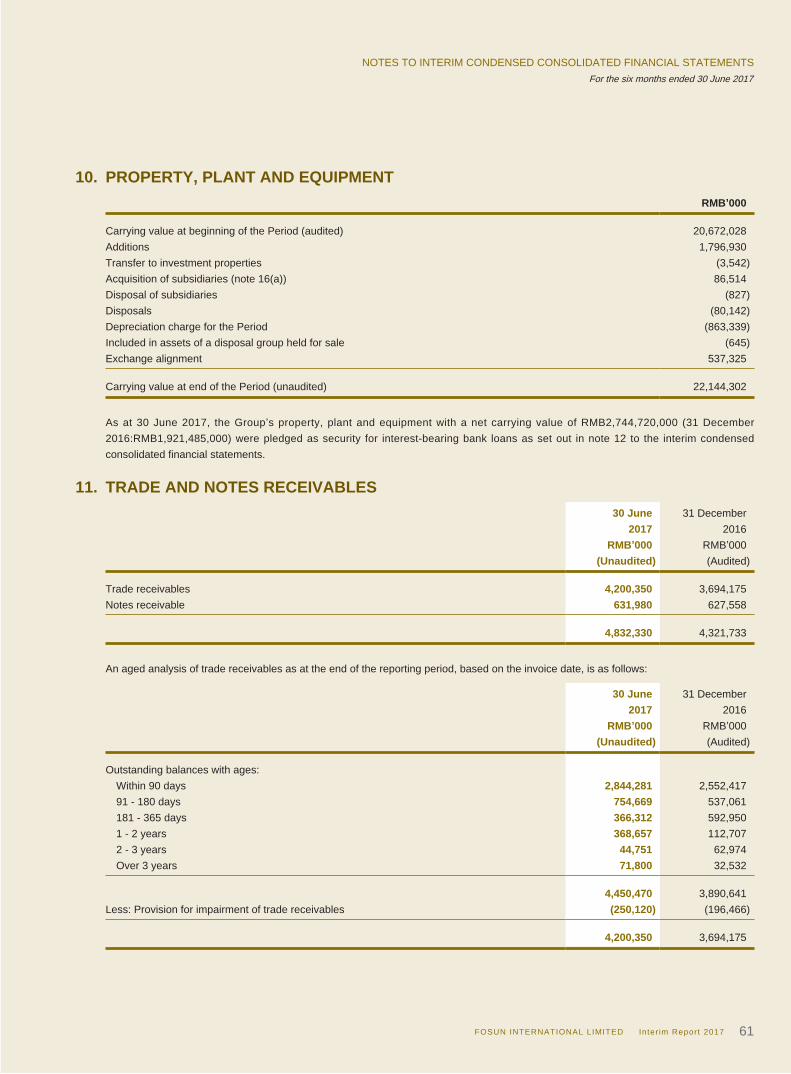
NOTES TO INTERIM CONDENSED CONSOLIDATED FINANCIAL STATEMENTSFor the six months ended 30 June 2017
FOSUN INTERNATIONAL LIMITED Inter im Report 2017 61
10. PROPERTY, PLANT AND EQUIPMENTRMB’000
Carrying value at beginning of the Period (audited) 20,672,028Additions 1,796,930Transfer to investment properties (3,542)Acquisition of subsidiaries (note 16(a)) 86,514Disposal of subsidiaries (827)Disposals (80,142)Depreciation charge for the Period (863,339)Included in assets of a disposal group held for sale (645)Exchange alignment 537,325 Carrying value at end of the Period (unaudited) 22,144,302
As at 30 June 2017, the Group’s property, plant and equipment with a net carrying value of RMB2,744,720,000 (31 December 2016:RMB1,921,485,000) were pledged as security for interest-bearing bank loans as set out in note 12 to the interim condensed consolidated financial statements.
11. TRADE AND NOTES RECEIVABLES30 June 31 December
2017 2016RMB’000 RMB’000
(Unaudited) (Audited) Trade receivables 4,200,350 3,694,175Notes receivable 631,980 627,558
4,832,330 4,321,733
An aged analysis of trade receivables as at the end of the reporting period, based on the invoice date, is as follows:
30 June 31 December2017 2016
RMB’000 RMB’000(Unaudited) (Audited)
Outstanding balances with ages: Within 90 days 2,844,281 2,552,417 91 - 180 days 754,669 537,061 181 - 365 days 366,312 592,950 1 - 2 years 368,657 112,707 2 - 3 years 44,751 62,974 Over 3 years 71,800 32,532
4,450,470 3,890,641Less: Provision for impairment of trade receivables (250,120) (196,466)
4,200,350 3,694,175
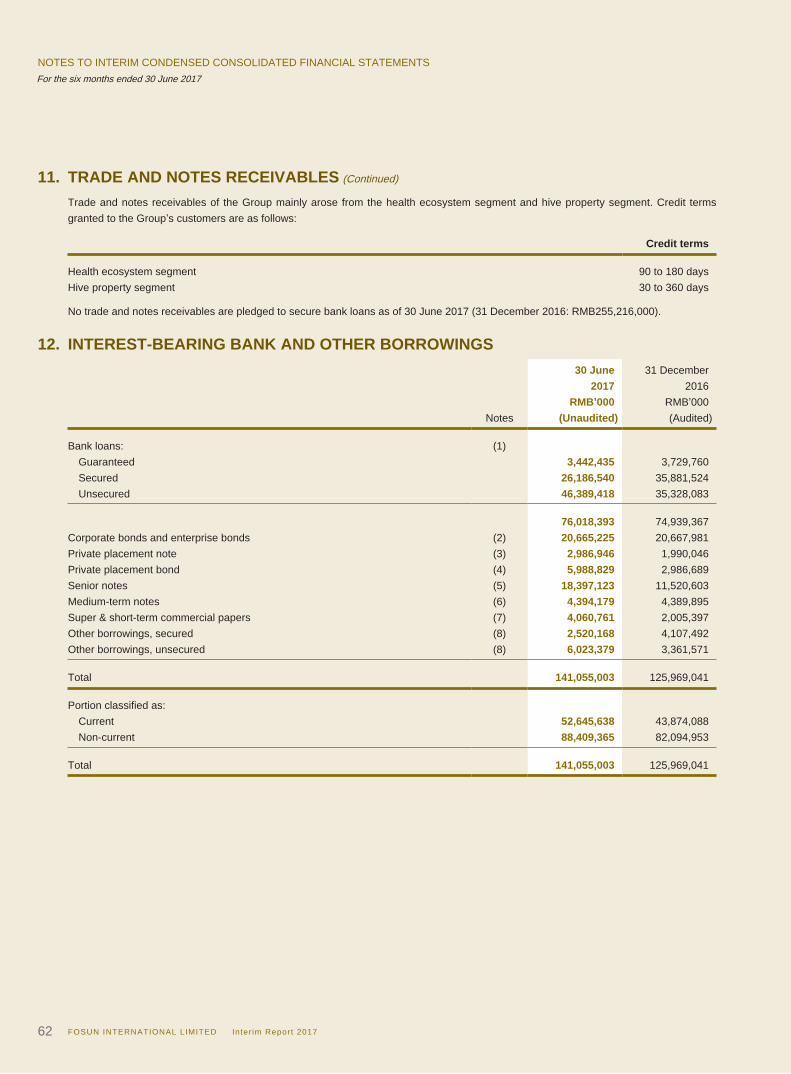
NOTES TO INTERIM CONDENSED CONSOLIDATED FINANCIAL STATEMENTSFor the six months ended 30 June 2017
FOSUN INTERNATIONAL LIMITED Inter im Report 201762
11. TRADE AND NOTES RECEIVABLES (Continued)
Trade and notes receivables of the Group mainly arose from the health ecosystem segment and hive property segment. Credit terms granted to the Group’s customers are as follows:
Credit terms Health ecosystem segment 90 to 180 daysHive property segment 30 to 360 days
No trade and notes receivables are pledged to secure bank loans as of 30 June 2017 (31 December 2016: RMB255,216,000).
12. INTEREST-BEARING BANK AND OTHER BORROWINGS30 June 31 December
2017 2016RMB’000 RMB’000
Notes (Unaudited) (Audited) Bank loans: (1) Guaranteed 3,442,435 3,729,760 Secured 26,186,540 35,881,524 Unsecured 46,389,418 35,328,083
76,018,393 74,939,367Corporate bonds and enterprise bonds (2) 20,665,225 20,667,981Private placement note (3) 2,986,946 1,990,046Private placement bond (4) 5,988,829 2,986,689Senior notes (5) 18,397,123 11,520,603Medium-term notes (6) 4,394,179 4,389,895Super & short-term commercial papers (7) 4,060,761 2,005,397Other borrowings, secured (8) 2,520,168 4,107,492Other borrowings, unsecured (8) 6,023,379 3,361,571 Total 141,055,003 125,969,041 Portion classified as: Current 52,645,638 43,874,088 Non-current 88,409,365 82,094,953 Total 141,055,003 125,969,041
NOTES TO INTERIM CONDENSED CONSOLIDATED FINANCIAL STATEMENTSFor the six months ended 30 June 2017
FOSUN INTERNATIONAL LIMITED Inter im Report 2017 63
12. INTEREST-BEARING BANK AND OTHER BORROWINGS (Continued)
Notes:
(1) Certain of the Group’s bank loans and other borrowings are secured by:
The pledge of certain of the Group’s buildings amounting to RMB193,294,000 (31 December 2016: RMB137,833,000), construction in progress to RMB2,551,426,000 (31 December 2016: RMB1,783,652,000), investment properties amounting to RMB6,919,849,000 (31 December 2016: RMB8,769,265,000), prepaid land lease payments amounting to RMB890,242,000 (31 December 2016: RMB1,098,517,000), properties under development amounting to RMB14,352,729,000 (31 December 2016: RMB14,488,486,000), completed properties for sale amounting to RMB1,300,674,000 (31 December 2016: RMB3,452,109,000), no trade and notes receivables was pledged as the date of 30 June 2017 (31 December 2016: RMB255,216,000), inventory amounting to RMB101,075,000 (no inventory pledged in 2016), finance lease receivables amounting to RMB906,604,000 (2016: RMB562,857,000), equity investment at fair value through profit or loss amounting to RMB1,110,385,000 (31 December 2016: RMB940,778,000), investments in associates amounting to RMB8,478,000 (31 December 2016: RMB10,376,000), no investment in a joint venture amounting was pledged as the date of 30 June 2017 (2016: RMB500,920,000) investments in available-for-sale entities amounting to RMB5,345,274,000 (31 December 2016: RMB5,365,658,000), and investments in subsidiaries.
Bank balances amounting to RMB305,427,000 (31 December 2016: RMB352,478,000) were pledged to secure the interest-bearing bank and other borrowings.
The Group’s interest-bearing bank and other borrowings amounting to RMB3,251,712,000 (31 December 2016: RMB3,329,760,000) were guaranteed by Fosun Holdings Limited which is the holding company of the Group, and RMB190,723,000 (31 December 2016: RMB400,000,000) were guaranteed by management of Hainan Mining Co., Ltd. (“Hainan Mining”) which is the subsidiary of the Group.
The bank loans bear interest at rates ranging from 0.64% to 6.65% (31 December 2016: 0.13% to 6.65%) per annum.
(2) Corporate bonds and enterprise bonds
On 24 December 2010, Shanghai Fosun High Technology (Group) Co., Ltd. (“Fosun Group”) issued seven-year domestic corporate bonds with a par value of RMB1,100,000,000 and an effective interest rate of 6.17% per annum. The interest is paid annually in arrears and the maturity date is 23 December 2017.
On 20 November 2015, Forte issued five-year domestic corporate bonds with a par value of RMB4,000,000,000 and an effective interest rate of 4.39% per annum. The interest is paid annually in arrears and the maturity date is 20 November 2020.
On 17 December 2015, Eynsford Tokutei Mokuteki Kaisha, an indirect subsidiary of Fosun Property Holdings Limited, issued five-year corporate bonds with a par value of JPY1,000,000,000 and an interest rate of 3 month Tokyo Interbank Offered Rate plus 5.30% per annum. The interest will be paid quarterly in arrears since April 2016. The principal amount of the corporate bonds will be repaid by instalments and the final maturity date is 17 December 2020.
On 21 January 2016, Fosun Group issued five-year domestic corporate bonds with a par value of RMB4,000,000,000 and an effective interest rate of 3.89% per annum. The interest is paid annually in arrears and the maturity date is 21 January 2021.
On 4 March 2016, Fosun Pharma issued five-year domestic corporate bonds with a par value of RMB3,000,000,000 and an effective interest rate of 3.46% per annum. The interest is paid annually in arrears and the maturity date is 4 March 2021.
On 21 March 2016, Forte issued three-year domestic corporate bonds with a par value of RMB1,000,000,000 and an effective interest rate of 3.76% per annum. The interest is paid annually in arrears and the maturity date is 21 March 2019.
On 14 April 2016, Fosun Group issued five-year domestic corporate bonds with a par value of RMB1,600,000,000 and an effective interest rate of 3.81% per annum. The interest is paid annually in arrears and the maturity date is 14 April 2021.
On 26 May 2016, Fosun Group issued five-year domestic corporate bonds with a par value of RMB4,400,000,000 and an effective interest rate of 3.87% per annum. The interest is paid annually in arrears and the maturity date is 26 May 2021.
On 30 August 2016, Hainan Mining issued five-year domestic corporate bonds with a par value of RMB106,000,000 and an effective interest rate of 5.65% per annum. The interest is paid annually in arrears and the maturity date is 30 August 2021.
On 14 March 2017, Fosun Pharma issued five-year domestic corporate bonds with a par value of RMB1,250,000,000 and an effective interest rate of 4.66% per annum. The interest is paid annually in arrears and the maturity date is 14 March 2022.
On 24 March 2017, Hainan Mining issued five-year domestic corporate bonds with a par value of RMB200,000,000 and an effective interest rate of 6.50% per annum. The interest is paid annually in arrears and the maturity date is 27 March 2022.
On 3 April 2017, Tekapo TMK, a subsidiary of Fosun Management Holdings Limited, issued five-year corporate bonds with a par value of JPY700,000,000 and an effective interest rate of 2.02% per annum. The interest will be paid quarterly in arrears since April 2017. The final maturity date is 3 April 2022.
NOTES TO INTERIM CONDENSED CONSOLIDATED FINANCIAL STATEMENTSFor the six months ended 30 June 2017
FOSUN INTERNATIONAL LIMITED Inter im Report 201764
12. INTEREST-BEARING BANK AND OTHER BORROWINGS (Continued)
Notes (Continued):
(3) Private placement note
On 3 April 2015, Fosun Group issued three-year private placement notes with a par value of RMB1,000,000,000 and the effective interest rate is 5.82% per annum. The interest will be paid annually in arrears and the maturity date is 3 April 2018.
On 18 November 2016, Fosun Group issued three-year private placement notes with a par value of RMB1,000,000,000 and the effective interest rate is 3.91% per annum. The interest is paid annually in arrears and the maturity date which is 18 November 2019.
On 17 March 2017, Fosun Group issued three-year private placement notes with a par value of RMB1,000,000,000 and the effective interest rate is 5.41% per annum. The interest is period annually in arrears and the maturity date which is 17 March 2020.
(4) Private placement bond
On 24 August 2016, Forte issued three-year private placement bonds with a par value of RMB3,000,000,000 and the effective interest rate is 4.56% per annum. The interest is paid annually in arrears and the maturity date which is 24 August 2019.
On 2 May 2017, Forte issued three-year private placement bonds with a par value of RMB3,000,000,000 and the effective interest rate is 6.66% per annum. The interest is paid annually in arrears and the maturity date which is 2 May 2020.
(5) Senior notes
In 2015, eight-year senior notes with a par value of EUR672,000,000 and an effective interest rate of 3.31% per annum issued by Xingtao Assets Limited, a direct subsidiary of Fosun Industrial Holdings Limited, were purchased by third party investors. The interest will be paid annually in arrears and the maturity date is 9 October 2022.
On 17 August 2016, three tranches of seven-year senior notes with the par values of USD180,000,000, USD120,000,000 and USD255,000,000 and the effective interest rates of 5.603%, 5.599% and 5.41% respectively issued by Wealth Driven Limited, a subsidiary of Fosun Industrial Holdings Limited, were purchased by third party investors. The interest is paid annually in arrears and the maturity date is 17 August 2023.
On 23 March 2017, Fortune Star, a subsidiary of Fosun Industrial Holdings Limited, issued two tranches of five-year senior notes with the par values of USD800,000,000 and USD600,000,000 and the effective interest rates of 5.33% and 5.04%, respectively. Among these, senior notes with the par values of USD1,390,000,000 were purchased by third party investors. The interest is paid semi-annually in arrears and the maturity date is 23 March 2022.
(6) Medium-term notes
On 24 October 2014, Fosun Group issued three-year medium-term notes with a par value of RMB2,000,000,000 and an effective interest rate of 5.26% per annum. The interest is paid annually in arrears and the maturity date is 24 October 2017.
On 5 March 2015, Fosun Group issued three-year medium-term notes with a par value of RMB2,000,000,000 and an effective interest rate of 5.21% per annum. The interest is paid annually in arrears and the maturity date is 5 March 2018.
On 10 September 2015, Fosun Pharma issued three-year medium-term notes with a par value of RMB400,000,000 and an effective interest rate of 4.05% per annum. The interest is paid annually in arrears and the maturity date is 10 September 2018.
(7) Super & short-term commercial papers
On 24 October 2016, Fosun Group issued super & short-term commercial paper with a par value of RMB1,500,000,000 and an effective interest rate of 3.21% per annum. The interest is payable at the maturity date is 21 July 2017.
On 9 March 2017, Fosun Group issued super & short-term commercial paper with a par value of RMB2,500,000,000 and an effective interest rate of 4.62% per annum. The interest is payable at the maturity date is 5 September 2017.
(8) The other borrowings represent borrowings from third parties, which bear interest at rates ranging from 1.76% to 8.5% (31 December 2016: 1.13% to 8.5%) per annum.
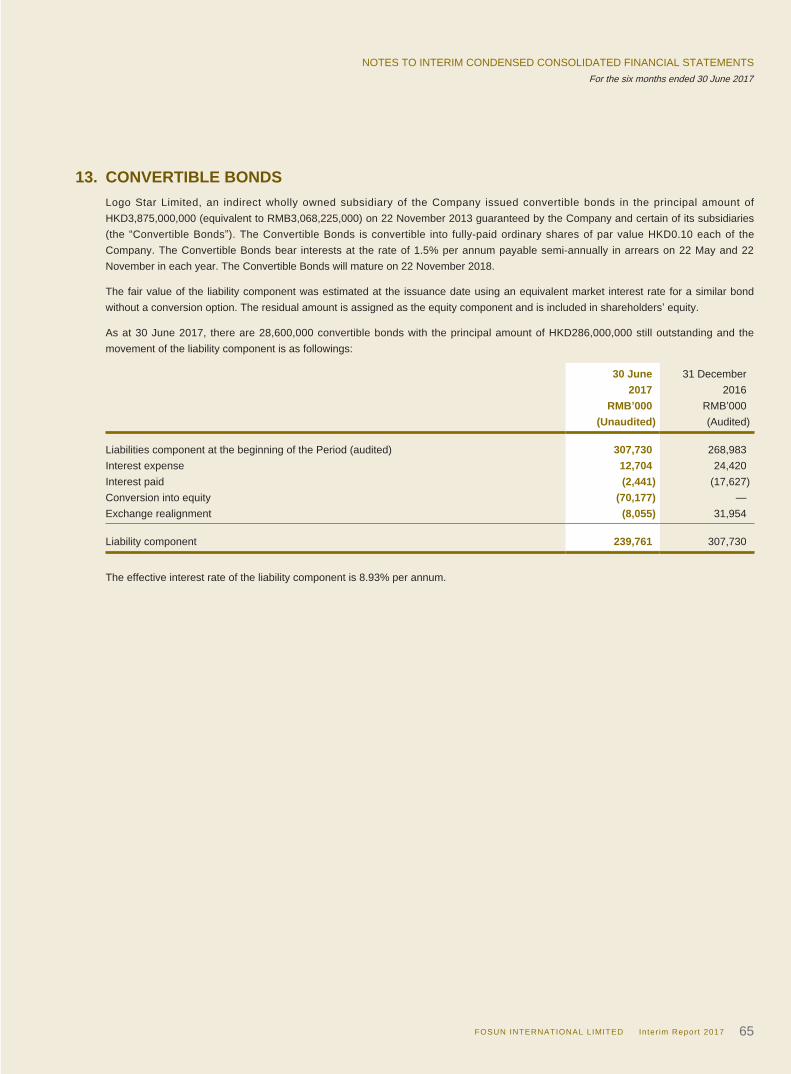
FOSUN INTERNATIONAL LIMITED Inter im Report 2017 65
NOTES TO INTERIM CONDENSED CONSOLIDATED FINANCIAL STATEMENTSFor the six months ended 30 June 2017
13. CONVERTIBLE BONDSLogo Star Limited, an indirect wholly owned subsidiary of the Company issued convertible bonds in the principal amount of HKD3,875,000,000 (equivalent to RMB3,068,225,000) on 22 November 2013 guaranteed by the Company and certain of its subsidiaries (the “Convertible Bonds”). The Convertible Bonds is convertible into fully-paid ordinary shares of par value HKD0.10 each of the Company. The Convertible Bonds bear interests at the rate of 1.5% per annum payable semi-annually in arrears on 22 May and 22 November in each year. The Convertible Bonds will mature on 22 November 2018.
The fair value of the liability component was estimated at the issuance date using an equivalent market interest rate for a similar bond without a conversion option. The residual amount is assigned as the equity component and is included in shareholders’ equity.
As at 30 June 2017, there are 28,600,000 convertible bonds with the principal amount of HKD286,000,000 still outstanding and the movement of the liability component is as followings:
30 June 31 December2017 2016
RMB’000 RMB’000(Unaudited) (Audited)
Liabilities component at the beginning of the Period (audited) 307,730 268,983Interest expense 12,704 24,420Interest paid (2,441) (17,627)Conversion into equity (70,177) —Exchange realignment (8,055) 31,954 Liability component 239,761 307,730
The effective interest rate of the liability component is 8.93% per annum.
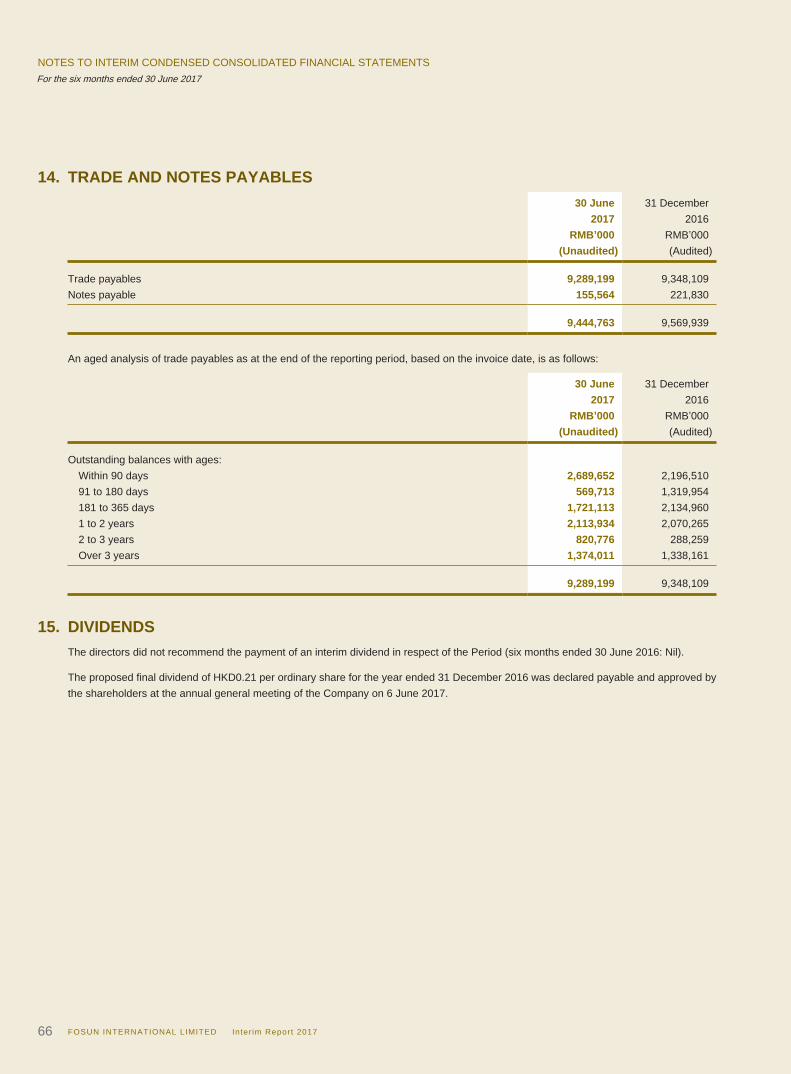
FOSUN INTERNATIONAL LIMITED Inter im Report 201766
NOTES TO INTERIM CONDENSED CONSOLIDATED FINANCIAL STATEMENTSFor the six months ended 30 June 2017
14. TRADE AND NOTES PAYABLES30 June 31 December
2017 2016RMB’000 RMB’000
(Unaudited) (Audited) Trade payables 9,289,199 9,348,109Notes payable 155,564 221,830
9,444,763 9,569,939
An aged analysis of trade payables as at the end of the reporting period, based on the invoice date, is as follows:
30 June 31 December2017 2016
RMB’000 RMB’000(Unaudited) (Audited)
Outstanding balances with ages: Within 90 days 2,689,652 2,196,510 91 to 180 days 569,713 1,319,954 181 to 365 days 1,721,113 2,134,960 1 to 2 years 2,113,934 2,070,265 2 to 3 years 820,776 288,259 Over 3 years 1,374,011 1,338,161
9,289,199 9,348,109
15. DIVIDENDSThe directors did not recommend the payment of an interim dividend in respect of the Period (six months ended 30 June 2016: Nil).
The proposed final dividend of HKD0.21 per ordinary share for the year ended 31 December 2016 was declared payable and approved by the shareholders at the annual general meeting of the Company on 6 June 2017.
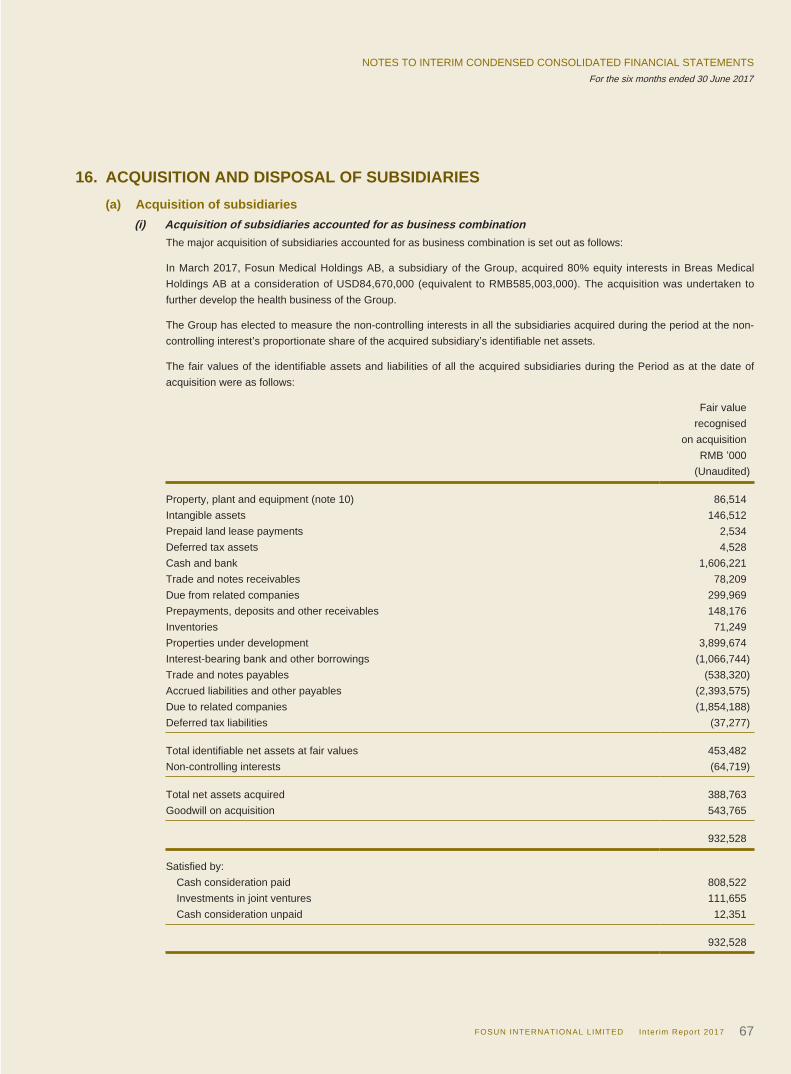
FOSUN INTERNATIONAL LIMITED Inter im Report 2017 67
NOTES TO INTERIM CONDENSED CONSOLIDATED FINANCIAL STATEMENTSFor the six months ended 30 June 2017
16. ACQUISITION AND DISPOSAL OF SUBSIDIARIES(a) Acquisition of subsidiaries
(i) Acquisition of subsidiaries accounted for as business combinationThe major acquisition of subsidiaries accounted for as business combination is set out as follows:
In March 2017, Fosun Medical Holdings AB, a subsidiary of the Group, acquired 80% equity interests in Breas Medical Holdings AB at a consideration of USD84,670,000 (equivalent to RMB585,003,000). The acquisition was undertaken to further develop the health business of the Group.
The Group has elected to measure the non-controlling interests in all the subsidiaries acquired during the period at the non-controlling interest’s proportionate share of the acquired subsidiary’s identifiable net assets.
The fair values of the identifiable assets and liabilities of all the acquired subsidiaries during the Period as at the date of acquisition were as follows:
Fair value recognised
on acquisitionRMB ’000
(Unaudited) Property, plant and equipment (note 10) 86,514Intangible assets 146,512Prepaid land lease payments 2,534Deferred tax assets 4,528Cash and bank 1,606,221Trade and notes receivables 78,209Due from related companies 299,969Prepayments, deposits and other receivables 148,176Inventories 71,249Properties under development 3,899,674Interest-bearing bank and other borrowings (1,066,744)Trade and notes payables (538,320)Accrued liabilities and other payables (2,393,575)Due to related companies (1,854,188)Deferred tax liabilities (37,277) Total identifiable net assets at fair values 453,482Non-controlling interests (64,719) Total net assets acquired 388,763Goodwill on acquisition 543,765
932,528 Satisfied by: Cash consideration paid 808,522 Investments in joint ventures 111,655 Cash consideration unpaid 12,351
932,528
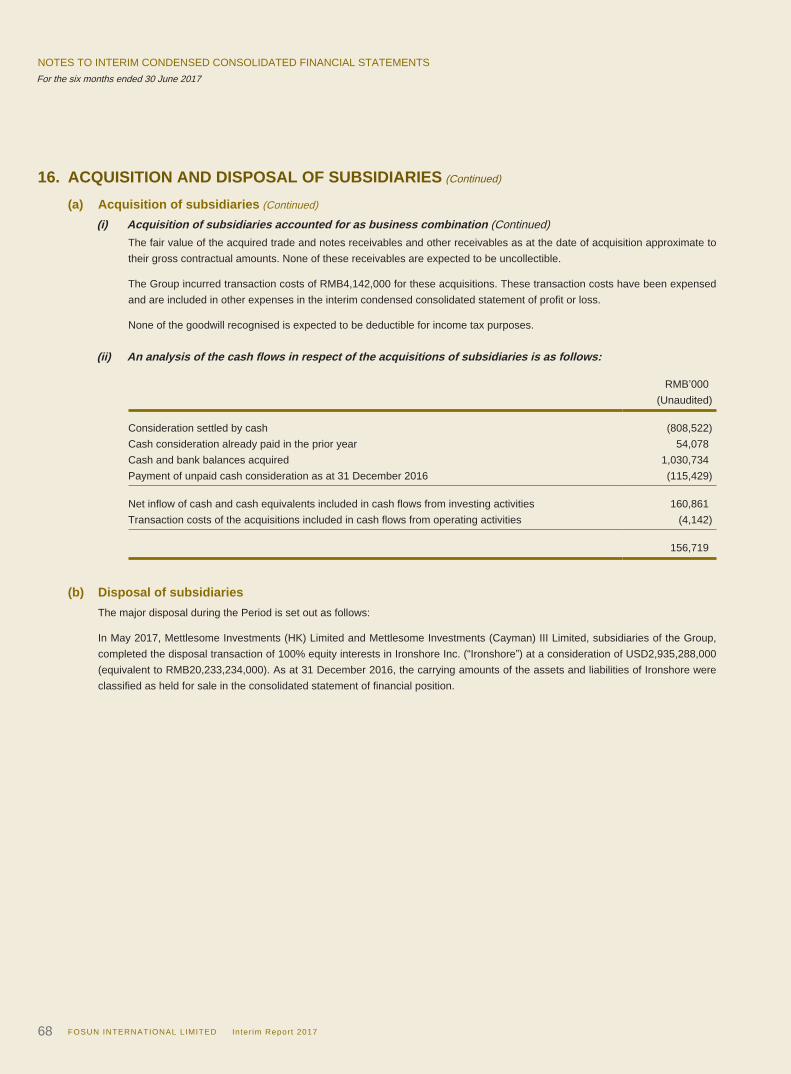
FOSUN INTERNATIONAL LIMITED Inter im Report 201768
NOTES TO INTERIM CONDENSED CONSOLIDATED FINANCIAL STATEMENTSFor the six months ended 30 June 2017
16. ACQUISITION AND DISPOSAL OF SUBSIDIARIES (Continued)
(a) Acquisition of subsidiaries (Continued)
(i) Acquisition of subsidiaries accounted for as business combination (Continued)The fair value of the acquired trade and notes receivables and other receivables as at the date of acquisition approximate to their gross contractual amounts. None of these receivables are expected to be uncollectible.
The Group incurred transaction costs of RMB4,142,000 for these acquisitions. These transaction costs have been expensed and are included in other expenses in the interim condensed consolidated statement of profit or loss.
None of the goodwill recognised is expected to be deductible for income tax purposes.
(ii) An analysis of the cash flows in respect of the acquisitions of subsidiaries is as follows:
RMB’000(Unaudited)
Consideration settled by cash (808,522)Cash consideration already paid in the prior year 54,078Cash and bank balances acquired 1,030,734Payment of unpaid cash consideration as at 31 December 2016 (115,429) Net inflow of cash and cash equivalents included in cash flows from investing activities 160,861Transaction costs of the acquisitions included in cash flows from operating activities (4,142)
156,719
(b) Disposal of subsidiariesThe major disposal during the Period is set out as follows:
In May 2017, Mettlesome Investments (HK) Limited and Mettlesome Investments (Cayman) III Limited, subsidiaries of the Group, completed the disposal transaction of 100% equity interests in Ironshore Inc. (“Ironshore”) at a consideration of USD2,935,288,000 (equivalent to RMB20,233,234,000). As at 31 December 2016, the carrying amounts of the assets and liabilities of Ironshore were classified as held for sale in the consolidated statement of financial position.
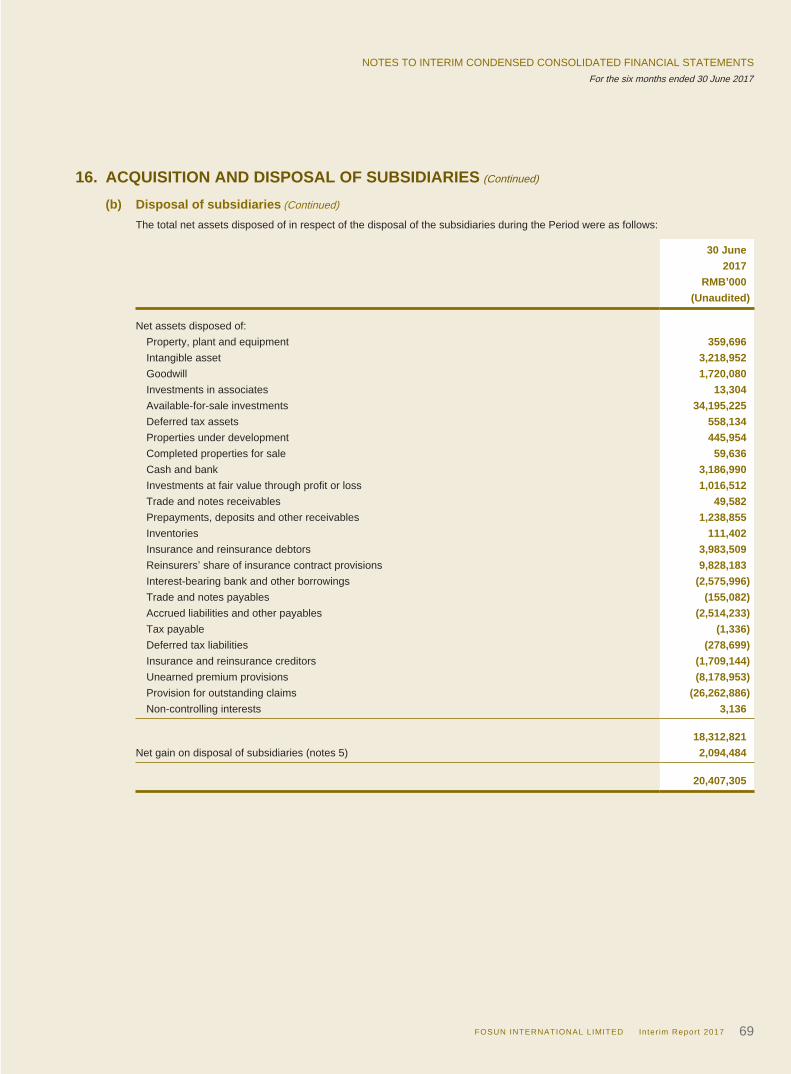
FOSUN INTERNATIONAL LIMITED Inter im Report 2017 69
NOTES TO INTERIM CONDENSED CONSOLIDATED FINANCIAL STATEMENTSFor the six months ended 30 June 2017
16. ACQUISITION AND DISPOSAL OF SUBSIDIARIES (Continued)
(b) Disposal of subsidiaries (Continued)
The total net assets disposed of in respect of the disposal of the subsidiaries during the Period were as follows:
30 June2017
RMB’000(Unaudited)
Net assets disposed of: Property, plant and equipment 359,696 Intangible asset 3,218,952 Goodwill 1,720,080 Investments in associates 13,304 Available-for-sale investments 34,195,225 Deferred tax assets 558,134 Properties under development 445,954 Completed properties for sale 59,636 Cash and bank 3,186,990 Investments at fair value through profit or loss 1,016,512 Trade and notes receivables 49,582 Prepayments, deposits and other receivables 1,238,855 Inventories 111,402 Insurance and reinsurance debtors 3,983,509 Reinsurers’ share of insurance contract provisions 9,828,183 Interest-bearing bank and other borrowings (2,575,996) Trade and notes payables (155,082) Accrued liabilities and other payables (2,514,233) Tax payable (1,336) Deferred tax liabilities (278,699) Insurance and reinsurance creditors (1,709,144) Unearned premium provisions (8,178,953) Provision for outstanding claims (26,262,886) Non-controlling interests 3,136
18,312,821Net gain on disposal of subsidiaries (notes 5) 2,094,484
20,407,305
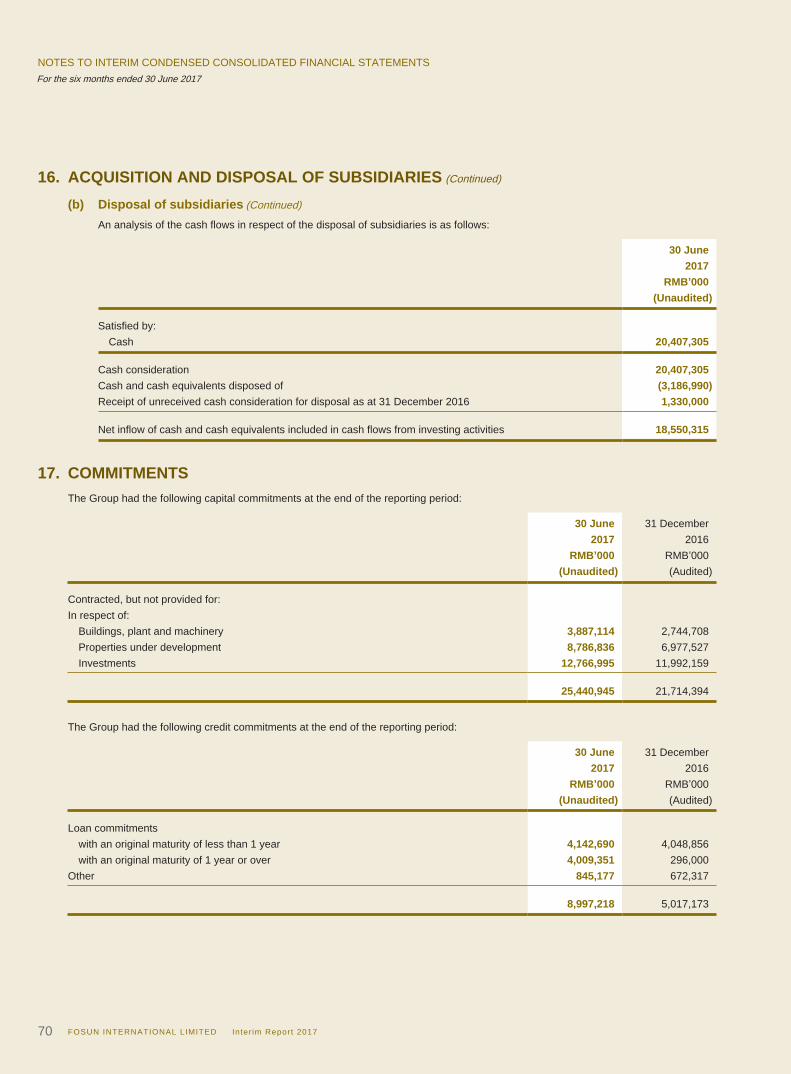
FOSUN INTERNATIONAL LIMITED Inter im Report 201770
NOTES TO INTERIM CONDENSED CONSOLIDATED FINANCIAL STATEMENTSFor the six months ended 30 June 2017
16. ACQUISITION AND DISPOSAL OF SUBSIDIARIES (Continued)
(b) Disposal of subsidiaries (Continued)
An analysis of the cash flows in respect of the disposal of subsidiaries is as follows:
30 June2017
RMB’000(Unaudited)
Satisfied by: Cash 20,407,305 Cash consideration 20,407,305Cash and cash equivalents disposed of (3,186,990)Receipt of unreceived cash consideration for disposal as at 31 December 2016 1,330,000 Net inflow of cash and cash equivalents included in cash flows from investing activities 18,550,315
17. COMMITMENTSThe Group had the following capital commitments at the end of the reporting period:
30 June 31 December2017 2016
RMB’000 RMB’000(Unaudited) (Audited)
Contracted, but not provided for:In respect of: Buildings, plant and machinery 3,887,114 2,744,708 Properties under development 8,786,836 6,977,527 Investments 12,766,995 11,992,159
25,440,945 21,714,394
The Group had the following credit commitments at the end of the reporting period:
30 June 31 December2017 2016
RMB’000 RMB’000(Unaudited) (Audited)
Loan commitments with an original maturity of less than 1 year 4,142,690 4,048,856 with an original maturity of 1 year or over 4,009,351 296,000Other 845,177 672,317
8,997,218 5,017,173
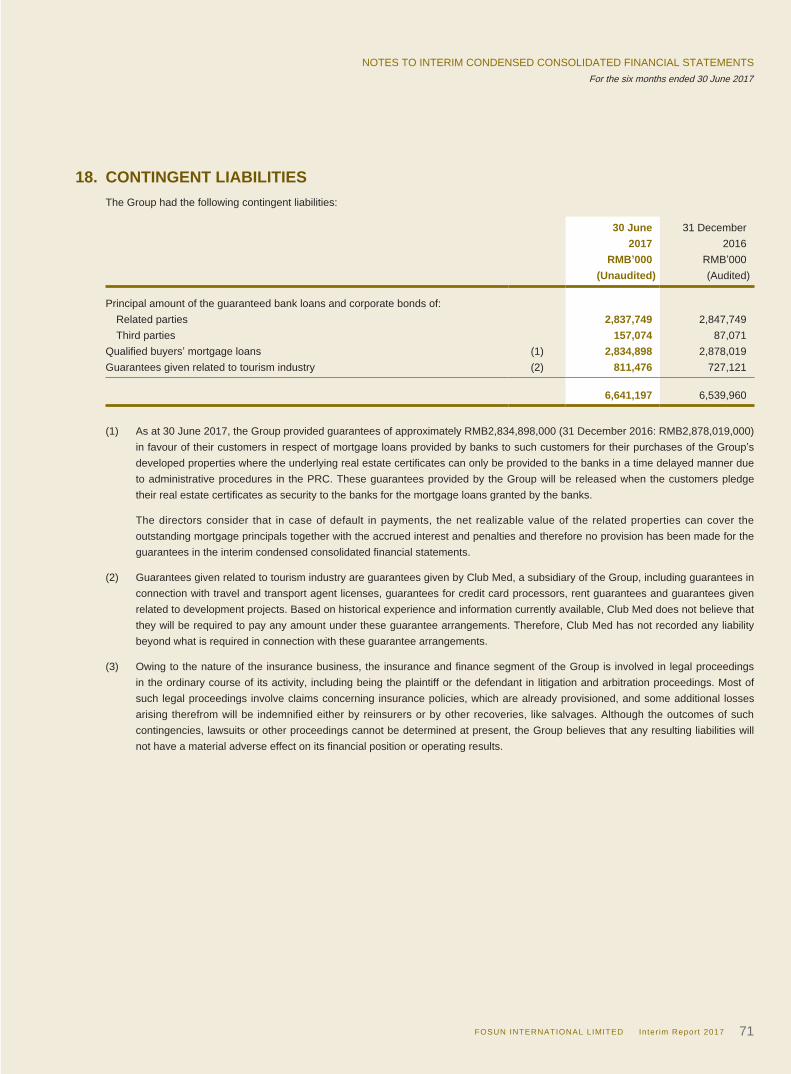
FOSUN INTERNATIONAL LIMITED Inter im Report 2017 71
NOTES TO INTERIM CONDENSED CONSOLIDATED FINANCIAL STATEMENTSFor the six months ended 30 June 2017
18. CONTINGENT LIABILITIESThe Group had the following contingent liabilities:
30 June 31 December2017 2016
RMB’000 RMB’000(Unaudited) (Audited)
Principal amount of the guaranteed bank loans and corporate bonds of: Related parties 2,837,749 2,847,749 Third parties 157,074 87,071Qualified buyers’ mortgage loans (1) 2,834,898 2,878,019Guarantees given related to tourism industry (2) 811,476 727,121
6,641,197 6,539,960
(1) As at 30 June 2017, the Group provided guarantees of approximately RMB2,834,898,000 (31 December 2016: RMB2,878,019,000) in favour of their customers in respect of mortgage loans provided by banks to such customers for their purchases of the Group’s developed properties where the underlying real estate certificates can only be provided to the banks in a time delayed manner due to administrative procedures in the PRC. These guarantees provided by the Group will be released when the customers pledge their real estate certificates as security to the banks for the mortgage loans granted by the banks.
The directors consider that in case of default in payments, the net realizable value of the related properties can cover the outstanding mortgage principals together with the accrued interest and penalties and therefore no provision has been made for the guarantees in the interim condensed consolidated financial statements.
(2) Guarantees given related to tourism industry are guarantees given by Club Med, a subsidiary of the Group, including guarantees in connection with travel and transport agent licenses, guarantees for credit card processors, rent guarantees and guarantees given related to development projects. Based on historical experience and information currently available, Club Med does not believe that they will be required to pay any amount under these guarantee arrangements. Therefore, Club Med has not recorded any liability beyond what is required in connection with these guarantee arrangements.
(3) Owing to the nature of the insurance business, the insurance and finance segment of the Group is involved in legal proceedings in the ordinary course of its activity, including being the plaintiff or the defendant in litigation and arbitration proceedings. Most of such legal proceedings involve claims concerning insurance policies, which are already provisioned, and some additional losses arising therefrom will be indemnified either by reinsurers or by other recoveries, like salvages. Although the outcomes of such contingencies, lawsuits or other proceedings cannot be determined at present, the Group believes that any resulting liabilities will not have a material adverse effect on its financial position or operating results.
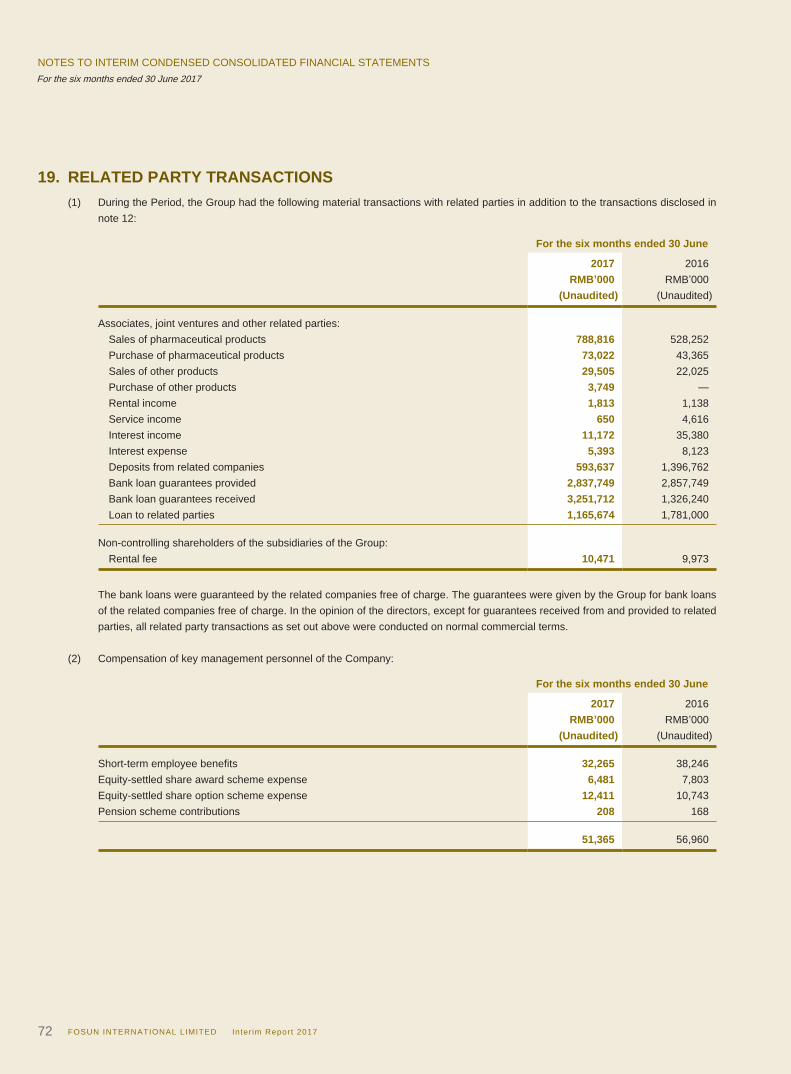
FOSUN INTERNATIONAL LIMITED Inter im Report 201772
NOTES TO INTERIM CONDENSED CONSOLIDATED FINANCIAL STATEMENTSFor the six months ended 30 June 2017
19. RELATED PARTY TRANSACTIONS(1) During the Period, the Group had the following material transactions with related parties in addition to the transactions disclosed in
note 12:
For the six months ended 30 June
2017 2016RMB’000 RMB’000
(Unaudited) (Unaudited) Associates, joint ventures and other related parties: Sales of pharmaceutical products 788,816 528,252 Purchase of pharmaceutical products 73,022 43,365 Sales of other products 29,505 22,025 Purchase of other products 3,749 — Rental income 1,813 1,138 Service income 650 4,616 Interest income 11,172 35,380 Interest expense 5,393 8,123 Deposits from related companies 593,637 1,396,762 Bank loan guarantees provided 2,837,749 2,857,749 Bank loan guarantees received 3,251,712 1,326,240 Loan to related parties 1,165,674 1,781,000 Non-controlling shareholders of the subsidiaries of the Group: Rental fee 10,471 9,973
The bank loans were guaranteed by the related companies free of charge. The guarantees were given by the Group for bank loans of the related companies free of charge. In the opinion of the directors, except for guarantees received from and provided to related parties, all related party transactions as set out above were conducted on normal commercial terms.
(2) Compensation of key management personnel of the Company:
For the six months ended 30 June
2017 2016RMB’000 RMB’000
(Unaudited) (Unaudited) Short-term employee benefits 32,265 38,246Equity-settled share award scheme expense 6,481 7,803Equity-settled share option scheme expense 12,411 10,743Pension scheme contributions 208 168
51,365 56,960
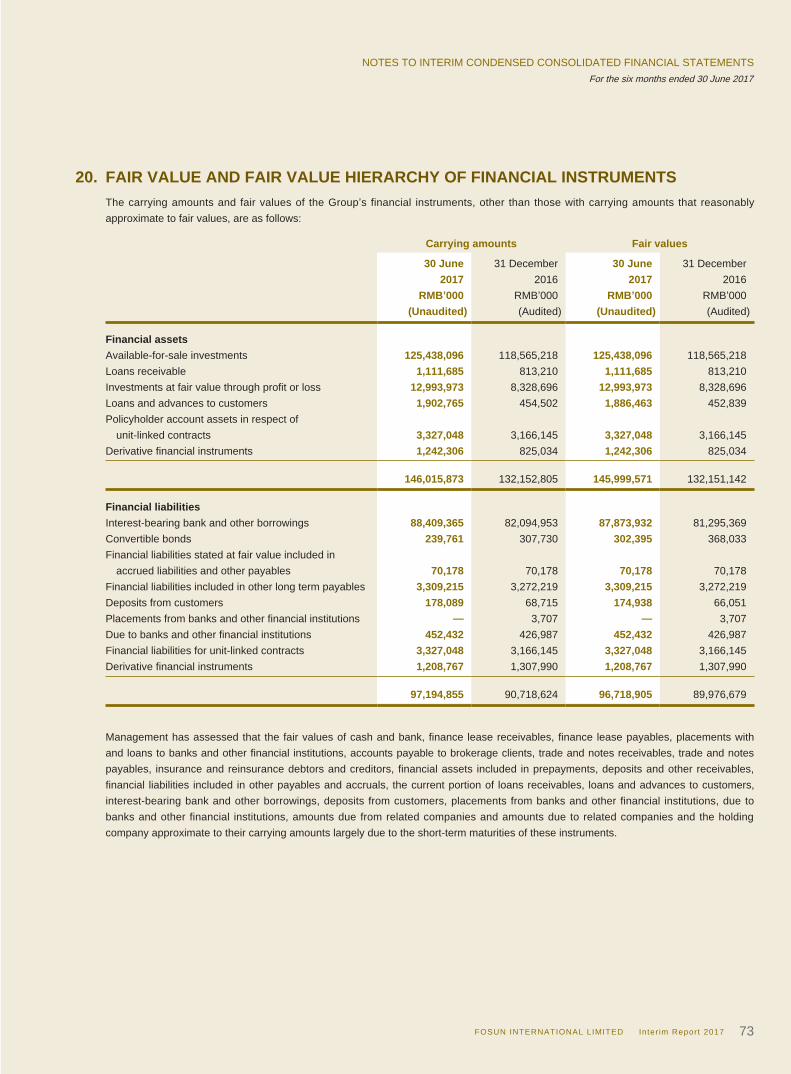
FOSUN INTERNATIONAL LIMITED Inter im Report 2017 73
NOTES TO INTERIM CONDENSED CONSOLIDATED FINANCIAL STATEMENTSFor the six months ended 30 June 2017
20. FAIR VALUE AND FAIR VALUE HIERARCHY OF FINANCIAL INSTRUMENTSThe carrying amounts and fair values of the Group’s financial instruments, other than those with carrying amounts that reasonably approximate to fair values, are as follows:
Carrying amounts Fair values
30 June 31 December 30 June 31 December2017 2016 2017 2016
RMB’000 RMB’000 RMB’000 RMB’000(Unaudited) (Audited) (Unaudited) (Audited)
Financial assetsAvailable-for-sale investments 125,438,096 118,565,218 125,438,096 118,565,218Loans receivable 1,111,685 813,210 1,111,685 813,210Investments at fair value through profit or loss 12,993,973 8,328,696 12,993,973 8,328,696Loans and advances to customers 1,902,765 454,502 1,886,463 452,839Policyholder account assets in respect of unit-linked contracts 3,327,048 3,166,145 3,327,048 3,166,145Derivative financial instruments 1,242,306 825,034 1,242,306 825,034
146,015,873 132,152,805 145,999,571 132,151,142 Financial liabilitiesInterest-bearing bank and other borrowings 88,409,365 82,094,953 87,873,932 81,295,369Convertible bonds 239,761 307,730 302,395 368,033Financial liabilities stated at fair value included in accrued liabilities and other payables 70,178 70,178 70,178 70,178Financial liabilities included in other long term payables 3,309,215 3,272,219 3,309,215 3,272,219Deposits from customers 178,089 68,715 174,938 66,051Placements from banks and other financial institutions — 3,707 — 3,707Due to banks and other financial institutions 452,432 426,987 452,432 426,987Financial liabilities for unit-linked contracts 3,327,048 3,166,145 3,327,048 3,166,145Derivative financial instruments 1,208,767 1,307,990 1,208,767 1,307,990
97,194,855 90,718,624 96,718,905 89,976,679
Management has assessed that the fair values of cash and bank, finance lease receivables, finance lease payables, placements with and loans to banks and other financial institutions, accounts payable to brokerage clients, trade and notes receivables, trade and notes payables, insurance and reinsurance debtors and creditors, financial assets included in prepayments, deposits and other receivables, financial liabilities included in other payables and accruals, the current portion of loans receivables, loans and advances to customers, interest-bearing bank and other borrowings, deposits from customers, placements from banks and other financial institutions, due to banks and other financial institutions, amounts due from related companies and amounts due to related companies and the holding company approximate to their carrying amounts largely due to the short-term maturities of these instruments.
FOSUN INTERNATIONAL LIMITED Inter im Report 201774
NOTES TO INTERIM CONDENSED CONSOLIDATED FINANCIAL STATEMENTSFor the six months ended 30 June 2017
20. FAIR VALUE AND FAIR VALUE HIERARCHY OF FINANCIAL INSTRUMENTS (Continued)
The Group’s corporate finance team is responsible for determining the policies and procedures for the fair value measurement of financial instruments. The corporate finance team reports directly to the chief financial officer. At each reporting date, the corporate finance team analyses the movements in the values of financial instruments and determines the major inputs applied in the valuation. The valuation is reviewed and approved by the chief financial officer.
The fair values of the financial assets and liabilities are included at the amount at which the instrument could be exchanged in a current transaction between willing parties, other than in a forced or liquidation sale. The following methods and assumptions were used to estimate the fair values:
The fair values of the non-current portion of financial liabilities included in other long term payables, non-current portion of loans receivable, interest-bearing bank and other borrowings and convertible bonds have been calculated by discounting the expected future cash flows using rates currently available for instruments with similar terms, credit risk and remaining maturities. The Group’s own non-performance risk for the non-current portion of amounts due to related companies, financial liabilities included in other long term payables, loans from related companies, finance lease payables and non-current portion of interest-bearing bank and other borrowings as at 30 June 2017 was assessed to be insignificant. The fair value of the convertible bonds and other listed bonds is based on the quoted market price which represents the fair value for both the liability and equity components of the convertible bonds and the fair values of listed bonds and senior notes are based on quoted market prices.
The Group enters into derivative financial instruments with various counterparties, principally financial institutions with high credit ratings. Derivative financial instruments include interest rate swaps. As at 30 June 2017, the fair values of interest rate swaps were measured using valuation techniques similar to swap models, using present value calculations. The models incorporate various market observable inputs include the credit quality of counterparties and interest rate curves. The carrying amounts of interest rate swaps are the same as their fair values.
The fair values of listed equity investments without a lock-up period are based on quoted market prices. The fair values of listed equity investments with a lock-up period have been estimated based on assumptions that are supported by observable market prices and discount for lack of marketability. The directors believe that the estimated fair values resulting from the valuation technique, which are recorded in the consolidated statement of financial position, and the related changes in fair values, which are recorded in other comprehensive income or profit or loss, are reasonable, and that they were the most appropriate values at the end of the reporting period.
As at 30 June 2017, the fair value has not been disclosed for certain available-for-sale investments in equity instruments that do not have a quoted market price in an active market and is measured at cost less any impairment because their fair value cannot be measured reliably. The reason why the fair value cannot be measured reliably is that the variability in the range of reasonable fair value estimates is significant for that investment or the probabilities of the various estimates within the range cannot be reasonably assessed and used in estimating fair value. The carrying amount of these available-for-sale investments was RMB12,300,477,000 (31 December 2016: RMB9,610,214,000). All of them are unlisted equity investments held by the Group in China, North America, Europe and other countries, which are intended to be disposed of by the Group after getting listed on the designated stock exchanges in the future.
During the Period, the available-for-sale investments whose fair value could not be reliably measured with carrying amount of RMB4,255,268,000 were derecognised and the relevant gain on disposal amounted to RMB174,092,000 was recognized in the interim condensed consolidated statement of profit or loss.

FOSUN INTERNATIONAL LIMITED Inter im Report 2017 75
NOTES TO INTERIM CONDENSED CONSOLIDATED FINANCIAL STATEMENTSFor the six months ended 30 June 2017
20. FAIR VALUE AND FAIR VALUE HIERARCHY OF FINANCIAL INSTRUMENTS (Continued)
Below is a summary of significant unobservable inputs to the valuation of financial instruments as at 30 June 2017:
Unobservable inputs and sensitivity analysis for Level 3 assetsThe financial assets measured at fair value held by Portuguese Insurance Group which were classified in Level 3 primarily correspond to debt securities and investment funds not quoted in an active market.
The fair value of debt securities, which consist of public and corporate bonds, is determined using broker quotes that cannot be corroborated with observable market transactions. Significant unobservable inputs for these bonds would include proprietary cash flow models and issuer spreads, which are comprised of credit, liquidity, and other security-specific features of the bonds. An increase (decrease) in these issuer spreads would result in a lower (higher) fair value. Due to the unobservable nature of these quotes, the Group do not assess whether applying reasonably possible alternative assumptions would have an impact on the fair value of the Level 3 bonds.
The fair values of investment funds classified in Level 3 are based on net asset value (NAV) reports provided by the management of such funds. Based on the unobservable nature of these NAV’s, the Group do not assess whether applying reasonably possible alternative assumptions would have an impact on the fair value of the Level 3 investment funds.
Fair value hierarchyThe following tables illustrate the fair value measurement hierarchy of the Group’s financial instruments:
Level 1: Fair values measured based on quoted prices (unadjusted) in active markets for identical assets or liabilities
Level 2: Fair values measured based on valuation techniques for which all inputs which have a significant effect on the recorded fair value are observable, either directly or indirectly
Level 3: Fair values measured based on valuation techniques for which any inputs which have a significant effect on the recorded fair value are not based on observable market data (unobservable inputs)
Assets measured at fair value:As at 30 June 2017 (unaudited)
Fair value measurement using Quoted prices Significant Significant
in active observable unobservablemarkets inputs inputsLevel 1 Level 2 Level 3 Total
RMB'000 RMB'000 RMB'000 RMB'000 Available-for-sale investments 76,845,441 43,817,533 4,775,122 125,438,096Investments at fair value through profit or loss 9,575,034 3,392,060 26,879 12,993,973Policyholder account assets in respect of unit-linked contracts 2,877,862 448,786 400 3,327,048Derivative financial instruments 456,942 785,364 — 1,242,306
89,755,279 48,443,743 4,802,401 143,001,423
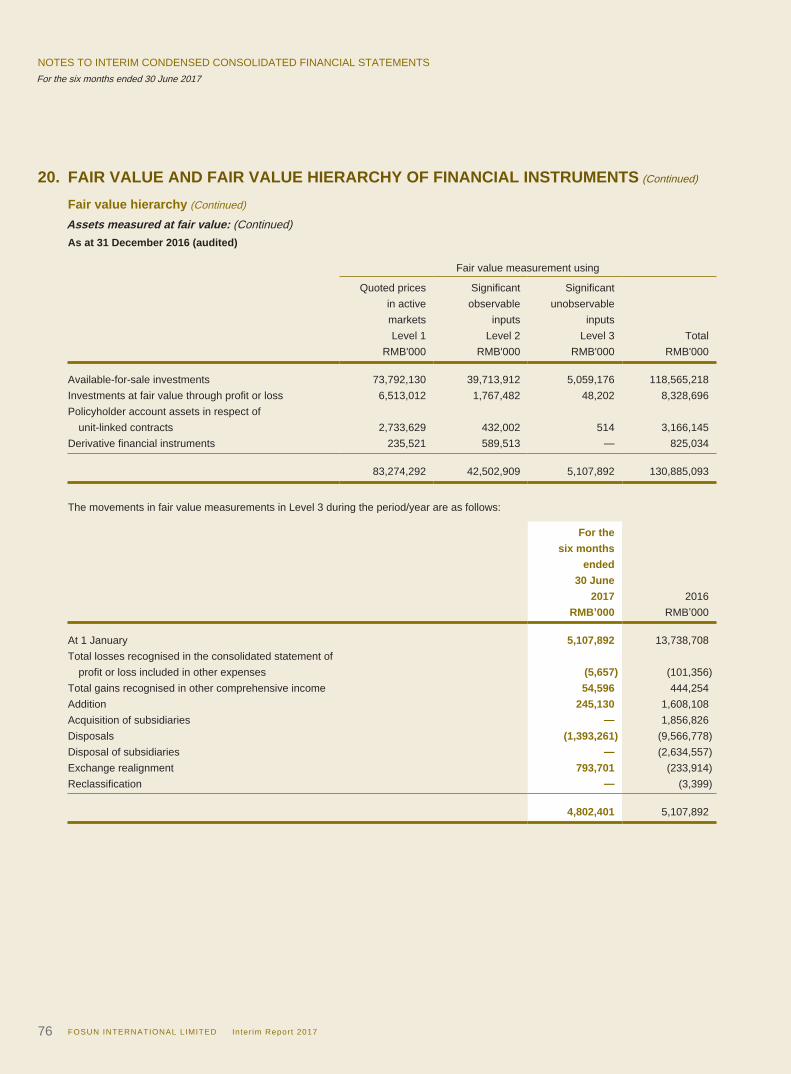
FOSUN INTERNATIONAL LIMITED Inter im Report 201776
NOTES TO INTERIM CONDENSED CONSOLIDATED FINANCIAL STATEMENTSFor the six months ended 30 June 2017
20. FAIR VALUE AND FAIR VALUE HIERARCHY OF FINANCIAL INSTRUMENTS (Continued)
Fair value hierarchy (Continued)
Assets measured at fair value: (Continued)As at 31 December 2016 (audited)
Fair value measurement using Quoted prices Significant Significant
in active observable unobservablemarkets inputs inputsLevel 1 Level 2 Level 3 Total
RMB'000 RMB'000 RMB'000 RMB'000 Available-for-sale investments 73,792,130 39,713,912 5,059,176 118,565,218Investments at fair value through profit or loss 6,513,012 1,767,482 48,202 8,328,696Policyholder account assets in respect of unit-linked contracts 2,733,629 432,002 514 3,166,145Derivative financial instruments 235,521 589,513 — 825,034
83,274,292 42,502,909 5,107,892 130,885,093
The movements in fair value measurements in Level 3 during the period/year are as follows:
For thesix months
ended30 June
2017 2016RMB’000 RMB’000
At 1 January 5,107,892 13,738,708Total losses recognised in the consolidated statement of profit or loss included in other expenses (5,657) (101,356)Total gains recognised in other comprehensive income 54,596 444,254Addition 245,130 1,608,108Acquisition of subsidiaries — 1,856,826Disposals (1,393,261) (9,566,778)Disposal of subsidiaries — (2,634,557)Exchange realignment 793,701 (233,914)Reclassification — (3,399)
4,802,401 5,107,892
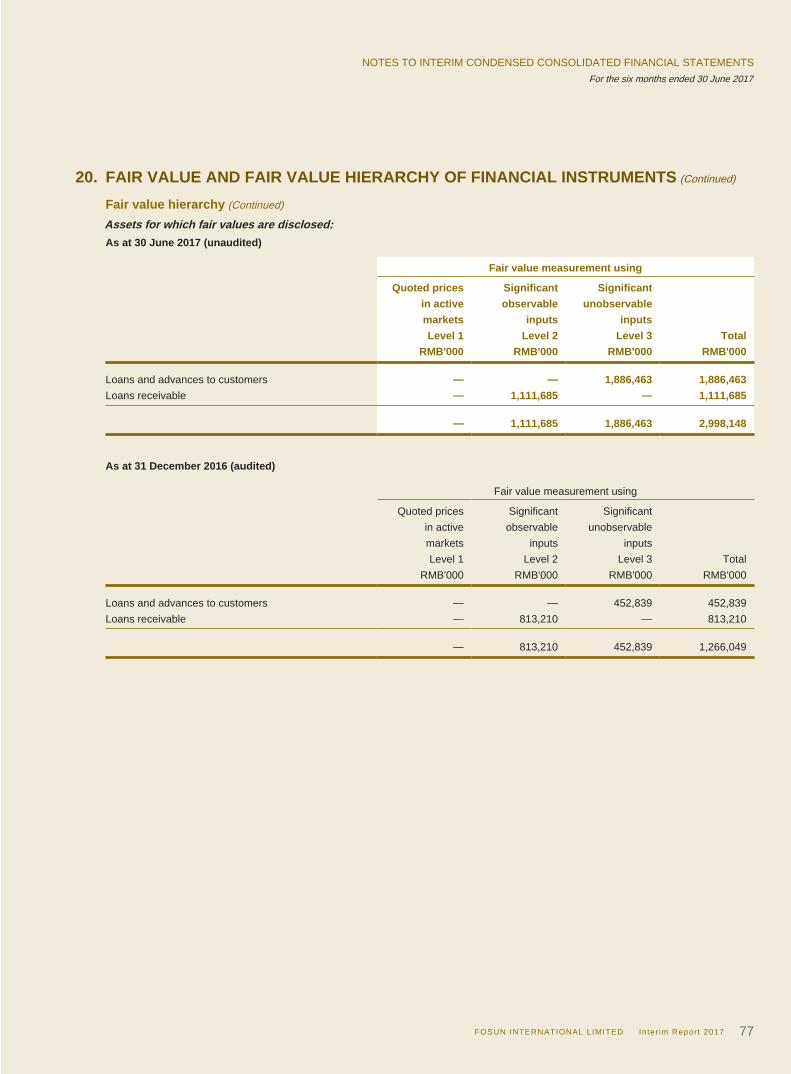
FOSUN INTERNATIONAL LIMITED Inter im Report 2017 77
NOTES TO INTERIM CONDENSED CONSOLIDATED FINANCIAL STATEMENTSFor the six months ended 30 June 2017
20. FAIR VALUE AND FAIR VALUE HIERARCHY OF FINANCIAL INSTRUMENTS (Continued)
Fair value hierarchy (Continued)
Assets for which fair values are disclosed:As at 30 June 2017 (unaudited)
Fair value measurement using Quoted prices Significant Significant
in active observable unobservablemarkets inputs inputsLevel 1 Level 2 Level 3 Total
RMB'000 RMB'000 RMB'000 RMB'000 Loans and advances to customers — — 1,886,463 1,886,463Loans receivable — 1,111,685 — 1,111,685
— 1,111,685 1,886,463 2,998,148
As at 31 December 2016 (audited)
Fair value measurement using Quoted prices Significant Significant
in active observable unobservablemarkets inputs inputsLevel 1 Level 2 Level 3 Total
RMB'000 RMB'000 RMB'000 RMB'000 Loans and advances to customers — — 452,839 452,839Loans receivable — 813,210 — 813,210
— 813,210 452,839 1,266,049
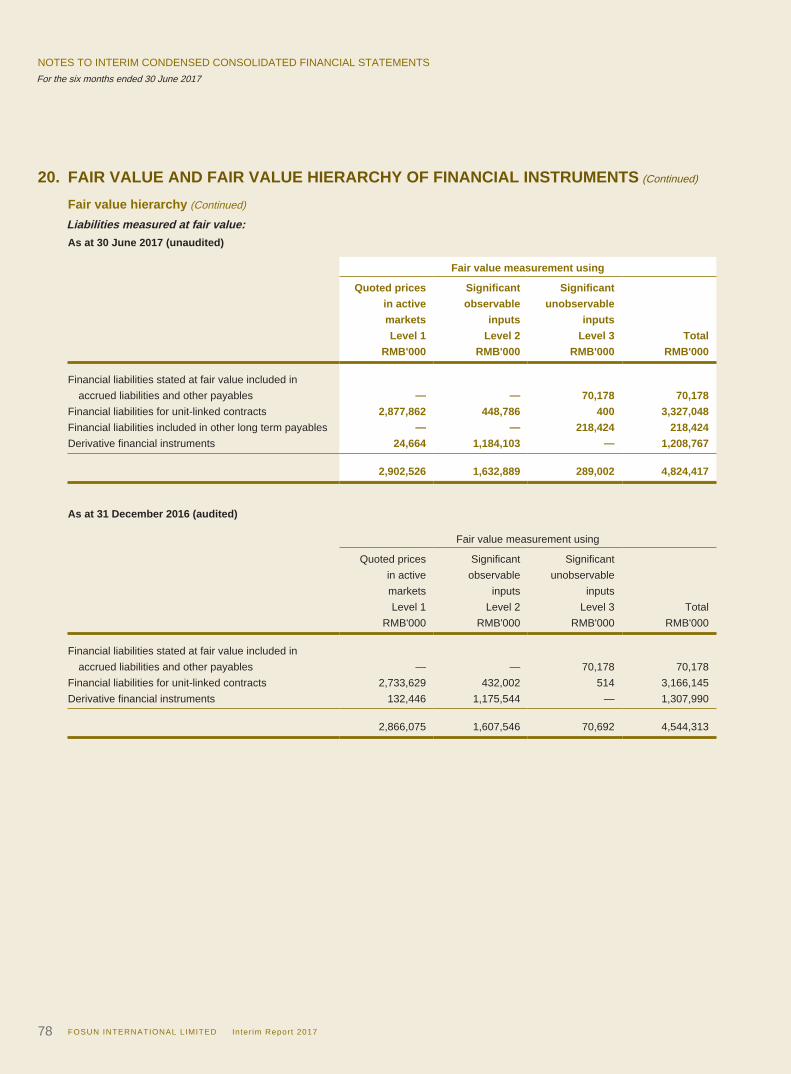
FOSUN INTERNATIONAL LIMITED Inter im Report 201778
NOTES TO INTERIM CONDENSED CONSOLIDATED FINANCIAL STATEMENTSFor the six months ended 30 June 2017
20. FAIR VALUE AND FAIR VALUE HIERARCHY OF FINANCIAL INSTRUMENTS (Continued)
Fair value hierarchy (Continued)
Liabilities measured at fair value:As at 30 June 2017 (unaudited)
Fair value measurement using Quoted prices Significant Significant
in active observable unobservablemarkets inputs inputsLevel 1 Level 2 Level 3 Total
RMB'000 RMB'000 RMB'000 RMB'000 Financial liabilities stated at fair value included in accrued liabilities and other payables — — 70,178 70,178Financial liabilities for unit-linked contracts 2,877,862 448,786 400 3,327,048Financial liabilities included in other long term payables — — 218,424 218,424Derivative financial instruments 24,664 1,184,103 — 1,208,767
2,902,526 1,632,889 289,002 4,824,417
As at 31 December 2016 (audited)
Fair value measurement using Quoted prices Significant Significant
in active observable unobservablemarkets inputs inputsLevel 1 Level 2 Level 3 Total
RMB'000 RMB'000 RMB'000 RMB'000 Financial liabilities stated at fair value included in accrued liabilities and other payables — — 70,178 70,178Financial liabilities for unit-linked contracts 2,733,629 432,002 514 3,166,145Derivative financial instruments 132,446 1,175,544 — 1,307,990
2,866,075 1,607,546 70,692 4,544,313
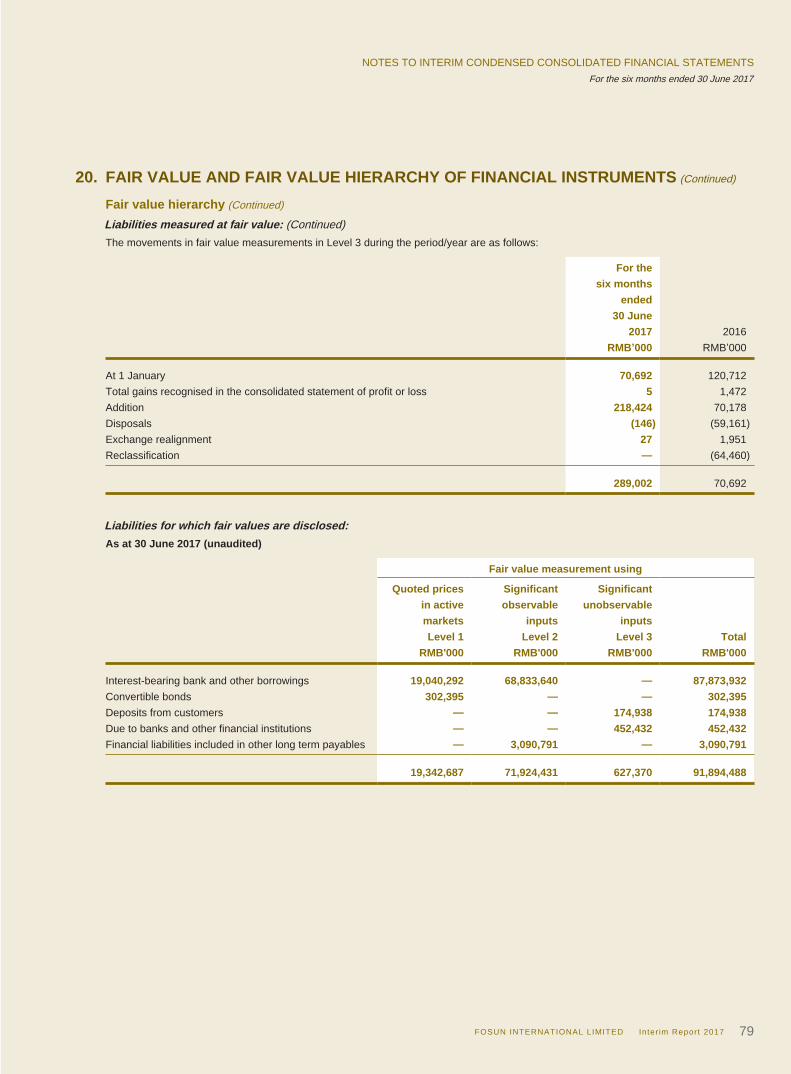
FOSUN INTERNATIONAL LIMITED Inter im Report 2017 79
NOTES TO INTERIM CONDENSED CONSOLIDATED FINANCIAL STATEMENTSFor the six months ended 30 June 2017
20. FAIR VALUE AND FAIR VALUE HIERARCHY OF FINANCIAL INSTRUMENTS (Continued)
Fair value hierarchy (Continued)
Liabilities measured at fair value: (Continued)The movements in fair value measurements in Level 3 during the period/year are as follows:
For thesix months
ended30 June
2017 2016RMB’000 RMB’000
At 1 January 70,692 120,712Total gains recognised in the consolidated statement of profit or loss 5 1,472Addition 218,424 70,178Disposals (146) (59,161)Exchange realignment 27 1,951Reclassification — (64,460)
289,002 70,692
Liabilities for which fair values are disclosed:As at 30 June 2017 (unaudited)
Fair value measurement using Quoted prices Significant Significant
in active observable unobservablemarkets inputs inputsLevel 1 Level 2 Level 3 Total
RMB'000 RMB'000 RMB'000 RMB'000 Interest-bearing bank and other borrowings 19,040,292 68,833,640 — 87,873,932Convertible bonds 302,395 — — 302,395Deposits from customers — — 174,938 174,938Due to banks and other financial institutions — — 452,432 452,432Financial liabilities included in other long term payables — 3,090,791 — 3,090,791
19,342,687 71,924,431 627,370 91,894,488
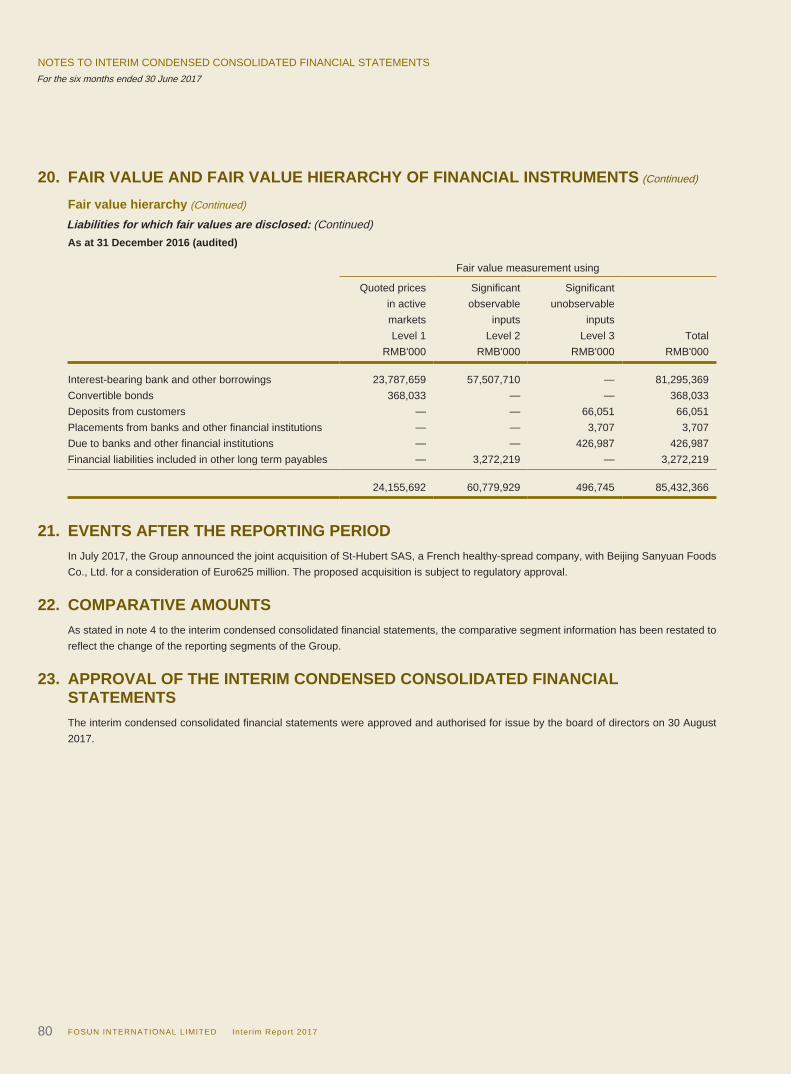
FOSUN INTERNATIONAL LIMITED Inter im Report 201780
NOTES TO INTERIM CONDENSED CONSOLIDATED FINANCIAL STATEMENTSFor the six months ended 30 June 2017
20. FAIR VALUE AND FAIR VALUE HIERARCHY OF FINANCIAL INSTRUMENTS (Continued)
Fair value hierarchy (Continued)
Liabilities for which fair values are disclosed: (Continued)As at 31 December 2016 (audited)
Fair value measurement using Quoted prices Significant Significant
in active observable unobservablemarkets inputs inputsLevel 1 Level 2 Level 3 Total
RMB'000 RMB'000 RMB'000 RMB'000 Interest-bearing bank and other borrowings 23,787,659 57,507,710 — 81,295,369Convertible bonds 368,033 — — 368,033Deposits from customers — — 66,051 66,051Placements from banks and other financial institutions — — 3,707 3,707Due to banks and other financial institutions — — 426,987 426,987Financial liabilities included in other long term payables — 3,272,219 — 3,272,219
24,155,692 60,779,929 496,745 85,432,366
21. EVENTS AFTER THE REPORTING PERIODIn July 2017, the Group announced the joint acquisition of St-Hubert SAS, a French healthy-spread company, with Beijing Sanyuan Foods Co., Ltd. for a consideration of Euro625 million. The proposed acquisition is subject to regulatory approval.
22. COMPARATIVE AMOUNTSAs stated in note 4 to the interim condensed consolidated financial statements, the comparative segment information has been restated to reflect the change of the reporting segments of the Group.
23. APPROVAL OF THE INTERIM CONDENSED CONSOLIDATED FINANCIAL STATEMENTSThe interim condensed consolidated financial statements were approved and authorised for issue by the board of directors on 30 August 2017.
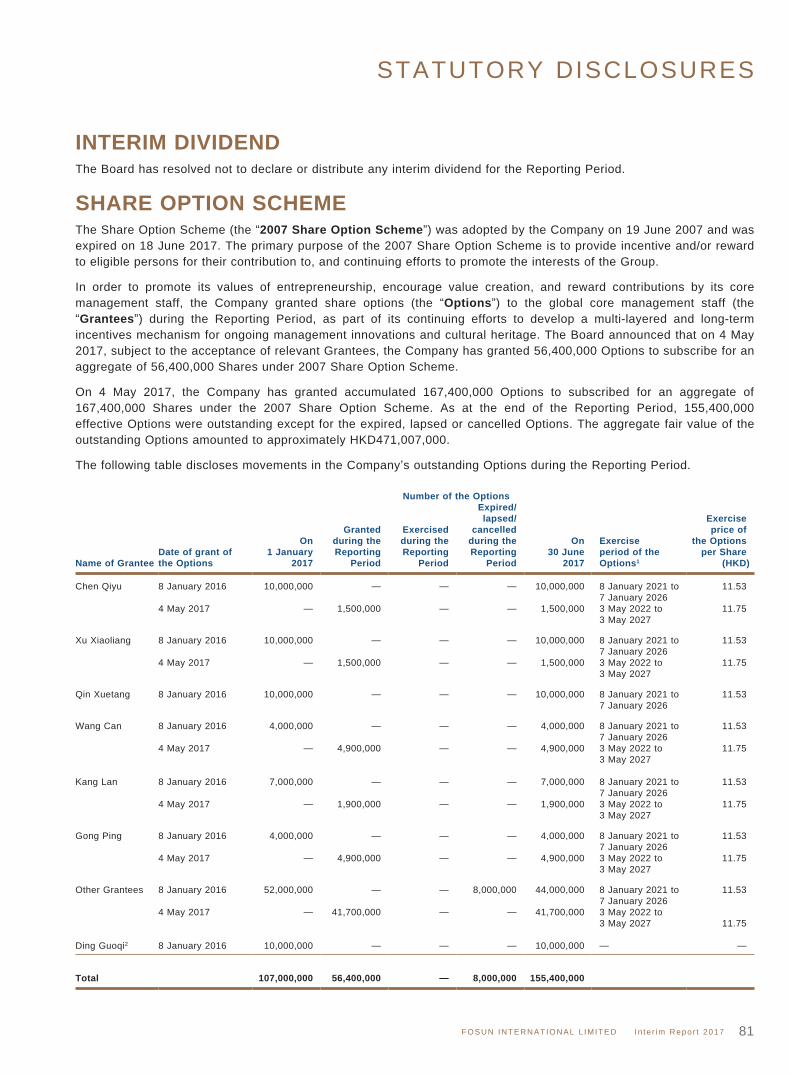
STATUTORY DISCLOSURES
FOSUN INTERNATIONAL L IMITED I n te r im Repor t 2017 81
INTERIM DIVIDENDThe Board has resolved not to declare or distribute any interim dividend for the Reporting Period.
SHARE OPTION SCHEMEThe Share Option Scheme (the “2007 Share Option Scheme”) was adopted by the Company on 19 June 2007 and was expired on 18 June 2017. The primary purpose of the 2007 Share Option Scheme is to provide incentive and/or reward to eligible persons for their contribution to, and continuing efforts to promote the interests of the Group.
In order to promote its values of entrepreneurship, encourage value creation, and reward contributions by its core management staff, the Company granted share options (the “Options”) to the global core management staff (the “Grantees”) during the Reporting Period, as part of its continuing efforts to develop a multi-layered and long-term incentives mechanism for ongoing management innovations and cultural heritage. The Board announced that on 4 May 2017, subject to the acceptance of relevant Grantees, the Company has granted 56,400,000 Options to subscribe for an aggregate of 56,400,000 Shares under 2007 Share Option Scheme.
On 4 May 2017, the Company has granted accumulated 167,400,000 Options to subscribed for an aggregate of 167,400,000 Shares under the 2007 Share Option Scheme. As at the end of the Reporting Period, 155,400,000 effective Options were outstanding except for the expired, lapsed or cancelled Options. The aggregate fair value of the outstanding Options amounted to approximately HKD471,007,000.
The following table discloses movements in the Company’s outstanding Options during the Reporting Period.
Number of the Options
Name of GranteeDate of grant ofthe Options
On 1 January
2017
Granted during the Reporting
Period
Exercised during the Reporting
Period
Expired/lapsed/
cancelled during the Reporting
Period
On 30 June
2017
Exercise period of the Options1
Exercise price of
the Options per Share
(HKD) Chen Qiyu 8 January 2016 10,000,000 — — — 10,000,000 8 January 2021 to 11.53
7 January 20264 May 2017 — 1,500,000 — — 1,500,000 3 May 2022 to 11.75
3 May 2027
Xu Xiaoliang 8 January 2016 10,000,000 — — — 10,000,000 8 January 2021 to 11.537 January 2026
4 May 2017 — 1,500,000 — — 1,500,000 3 May 2022 to 11.753 May 2027
Qin Xuetang 8 January 2016 10,000,000 — — — 10,000,000 8 January 2021 to 11.537 January 2026
Wang Can 8 January 2016 4,000,000 — — — 4,000,000 8 January 2021 to 11.537 January 2026
4 May 2017 — 4,900,000 — — 4,900,000 3 May 2022 to 11.753 May 2027
Kang Lan 8 January 2016 7,000,000 — — — 7,000,000 8 January 2021 to 11.537 January 2026
4 May 2017 — 1,900,000 — — 1,900,000 3 May 2022 to 11.753 May 2027
Gong Ping 8 January 2016 4,000,000 — — — 4,000,000 8 January 2021 to 11.537 January 2026
4 May 2017 — 4,900,000 — — 4,900,000 3 May 2022 to 11.753 May 2027
Other Grantees 8 January 2016 52,000,000 — — 8,000,000 44,000,000 8 January 2021 to 11.537 January 2026
4 May 2017 — 41,700,000 — — 41,700,000 3 May 2022 to3 May 2027 11.75
Ding Guoqi2 8 January 2016 10,000,000 — — — 10,000,000 — —
Total 107,000,000 56,400,000 — 8,000,000 155,400,000
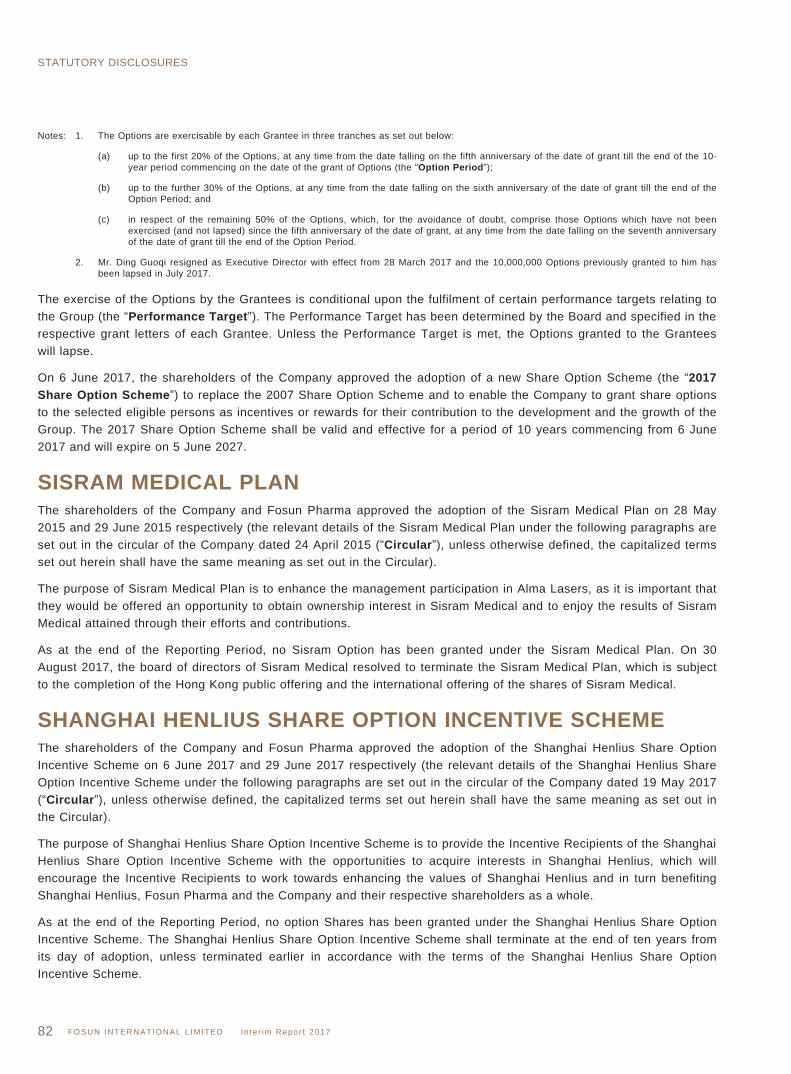
STATUTORY DISCLOSURES
FOSUN INTERNATIONAL L IMITED I n te r im Repor t 201782
Notes: 1. The Options are exercisable by each Grantee in three tranches as set out below:
(a) up to the first 20% of the Options, at any time from the date falling on the fifth anniversary of the date of grant till the end of the 10-year period commencing on the date of the grant of Options (the “Option Period”);
(b) up to the further 30% of the Options, at any time from the date falling on the sixth anniversary of the date of grant till the end of the Option Period; and
(c) in respect of the remaining 50% of the Options, which, for the avoidance of doubt, comprise those Options which have not been exercised (and not lapsed) since the fifth anniversary of the date of grant, at any time from the date falling on the seventh anniversary of the date of grant till the end of the Option Period.
2. Mr. Ding Guoqi resigned as Executive Director with effect from 28 March 2017 and the 10,000,000 Options previously granted to him has been lapsed in July 2017.
The exercise of the Options by the Grantees is conditional upon the fulfilment of certain performance targets relating to the Group (the “Performance Target”). The Performance Target has been determined by the Board and specified in the respective grant letters of each Grantee. Unless the Performance Target is met, the Options granted to the Grantees will lapse.
On 6 June 2017, the shareholders of the Company approved the adoption of a new Share Option Scheme (the “2017 Share Option Scheme”) to replace the 2007 Share Option Scheme and to enable the Company to grant share options to the selected eligible persons as incentives or rewards for their contribution to the development and the growth of the Group. The 2017 Share Option Scheme shall be valid and effective for a period of 10 years commencing from 6 June 2017 and will expire on 5 June 2027.
SISRAM MEDICAL PLANThe shareholders of the Company and Fosun Pharma approved the adoption of the Sisram Medical Plan on 28 May 2015 and 29 June 2015 respectively (the relevant details of the Sisram Medical Plan under the following paragraphs are set out in the circular of the Company dated 24 April 2015 (“Circular”), unless otherwise defined, the capitalized terms set out herein shall have the same meaning as set out in the Circular).
The purpose of Sisram Medical Plan is to enhance the management participation in Alma Lasers, as it is important that they would be offered an opportunity to obtain ownership interest in Sisram Medical and to enjoy the results of Sisram Medical attained through their efforts and contributions.
As at the end of the Reporting Period, no Sisram Option has been granted under the Sisram Medical Plan. On 30 August 2017, the board of directors of Sisram Medical resolved to terminate the Sisram Medical Plan, which is subject to the completion of the Hong Kong public offering and the international offering of the shares of Sisram Medical.
SHANGHAI HENLIUS SHARE OPTION INCENTIVE SCHEMEThe shareholders of the Company and Fosun Pharma approved the adoption of the Shanghai Henlius Share Option Incentive Scheme on 6 June 2017 and 29 June 2017 respectively (the relevant details of the Shanghai Henlius Share Option Incentive Scheme under the following paragraphs are set out in the circular of the Company dated 19 May 2017 (“Circular”), unless otherwise defined, the capitalized terms set out herein shall have the same meaning as set out in the Circular).
The purpose of Shanghai Henlius Share Option Incentive Scheme is to provide the Incentive Recipients of the Shanghai Henlius Share Option Incentive Scheme with the opportunities to acquire interests in Shanghai Henlius, which will encourage the Incentive Recipients to work towards enhancing the values of Shanghai Henlius and in turn benefiting Shanghai Henlius, Fosun Pharma and the Company and their respective shareholders as a whole.
As at the end of the Reporting Period, no option Shares has been granted under the Shanghai Henlius Share Option Incentive Scheme. The Shanghai Henlius Share Option Incentive Scheme shall terminate at the end of ten years from its day of adoption, unless terminated earlier in accordance with the terms of the Shanghai Henlius Share Option Incentive Scheme.
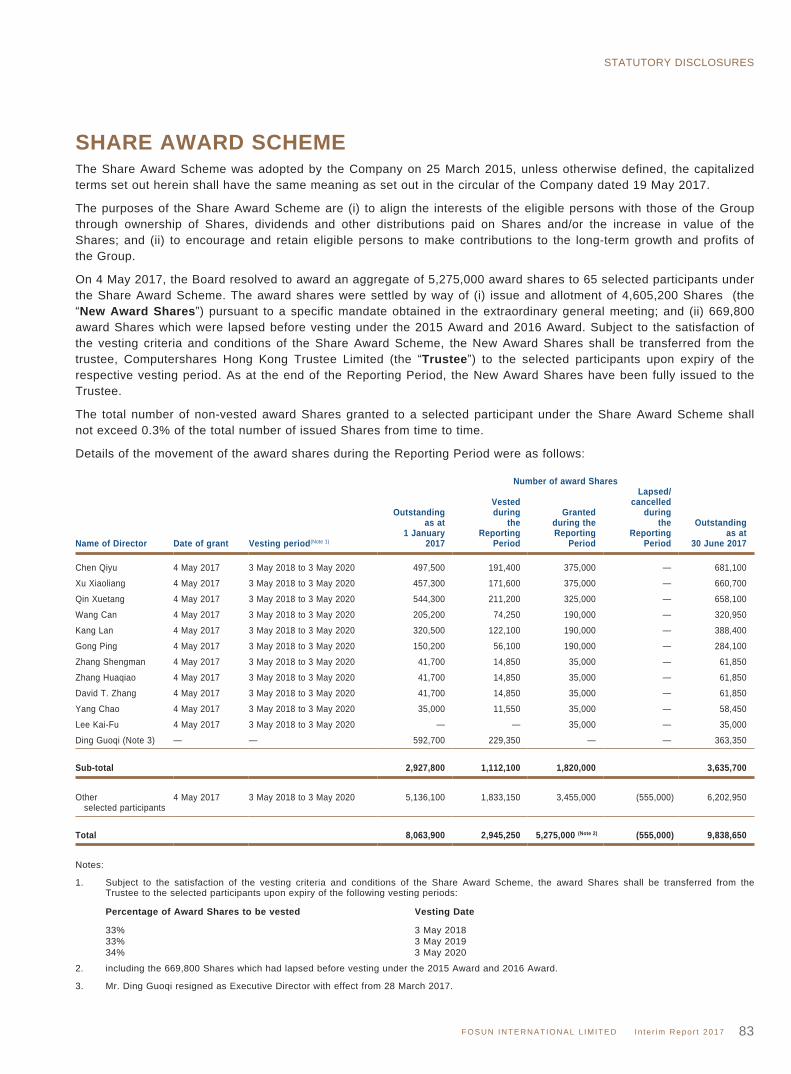
STATUTORY DISCLOSURES
FOSUN INTERNATIONAL L IMITED I n te r im Repor t 2017 83
SHARE AWARD SCHEMEThe Share Award Scheme was adopted by the Company on 25 March 2015, unless otherwise defined, the capitalized terms set out herein shall have the same meaning as set out in the circular of the Company dated 19 May 2017.
The purposes of the Share Award Scheme are (i) to align the interests of the eligible persons with those of the Group through ownership of Shares, dividends and other distributions paid on Shares and/or the increase in value of the Shares; and (ii) to encourage and retain eligible persons to make contributions to the long-term growth and profits of the Group.
On 4 May 2017, the Board resolved to award an aggregate of 5,275,000 award shares to 65 selected participants under the Share Award Scheme. The award shares were settled by way of (i) issue and allotment of 4,605,200 Shares (the “New Award Shares”) pursuant to a specific mandate obtained in the extraordinary general meeting; and (ii) 669,800 award Shares which were lapsed before vesting under the 2015 Award and 2016 Award. Subject to the satisfaction of the vesting criteria and conditions of the Share Award Scheme, the New Award Shares shall be transferred from the trustee, Computershares Hong Kong Trustee Limited (the “Trustee”) to the selected participants upon expiry of the respective vesting period. As at the end of the Reporting Period, the New Award Shares have been fully issued to the Trustee.
The total number of non-vested award Shares granted to a selected participant under the Share Award Scheme shall not exceed 0.3% of the total number of issued Shares from time to time.
Details of the movement of the award shares during the Reporting Period were as follows:
Number of award Shares
Name of Director Date of grant Vesting period(Note 1)
Outstanding as at
1 January2017
Vestedduring
theReporting
Period
Grantedduring theReporting
Period
Lapsed/ cancelled
duringthe
ReportingPeriod
Outstandingas at
30 June 2017 Chen Qiyu 4 May 2017 3 May 2018 to 3 May 2020 497,500 191,400 375,000 — 681,100
Xu Xiaoliang 4 May 2017 3 May 2018 to 3 May 2020 457,300 171,600 375,000 — 660,700
Qin Xuetang 4 May 2017 3 May 2018 to 3 May 2020 544,300 211,200 325,000 — 658,100
Wang Can 4 May 2017 3 May 2018 to 3 May 2020 205,200 74,250 190,000 — 320,950
Kang Lan 4 May 2017 3 May 2018 to 3 May 2020 320,500 122,100 190,000 — 388,400
Gong Ping 4 May 2017 3 May 2018 to 3 May 2020 150,200 56,100 190,000 — 284,100
Zhang Shengman 4 May 2017 3 May 2018 to 3 May 2020 41,700 14,850 35,000 — 61,850
Zhang Huaqiao 4 May 2017 3 May 2018 to 3 May 2020 41,700 14,850 35,000 — 61,850
David T. Zhang 4 May 2017 3 May 2018 to 3 May 2020 41,700 14,850 35,000 — 61,850
Yang Chao 4 May 2017 3 May 2018 to 3 May 2020 35,000 11,550 35,000 — 58,450
Lee Kai-Fu 4 May 2017 3 May 2018 to 3 May 2020 — — 35,000 — 35,000
Ding Guoqi (Note 3) — — 592,700 229,350 — — 363,350 Sub-total 2,927,800 1,112,100 1,820,000 3,635,700 Other selected participants
4 May 2017 3 May 2018 to 3 May 2020 5,136,100 1,833,150 3,455,000 (555,000) 6,202,950
Total 8,063,900 2,945,250 5,275,000 (Note 2) (555,000) 9,838,650 Notes:
1. Subject to the satisfaction of the vesting criteria and conditions of the Share Award Scheme, the award Shares shall be transferred from the Trustee to the selected participants upon expiry of the following vesting periods:
Percentage of Award Shares to be vested Vesting Date
33% 3 May 201833% 3 May 201934% 3 May 2020
2. including the 669,800 Shares which had lapsed before vesting under the 2015 Award and 2016 Award.
3. Mr. Ding Guoqi resigned as Executive Director with effect from 28 March 2017.
STATUTORY DISCLOSURES
FOSUN INTERNATIONAL L IMITED I n te r im Repor t 201784
HUMAN RESOURCESAs of 30 June 2017, the Group had approximately 56,000 employees.
In the first half of 2017, the strategic initiatives of Fosun’s Human Resources division were to focus on families around the world by innovating a C2M ecosystems in health, happiness and wealth. Under the guidance of Fosun’s cultural values, we reviewed and continually attracted strategic talents, optimized and promoted the multi-dimensional partnership model amongst the Group, strengthened core management teams and talent pipeline, innovated the talent management mechanism, optimized the organizational and talent structure and built an elite organization. We emphasized on rationality and sustainability of the talent structure to improve talent management.
We further optimized the talent recruitment mechanism, and enabled talent sharing by building One Fosun talent database system and integrate talents through utilizing big data. To support the Group’s global business and strategy in development, we strengthened the implementation of “glocalized” talent strategy and introduced talents in the field of creative intelligence. By organizing the global campus recruitment continuously, a batch of “post-90s” excellent investment personnel was recruited successfully from local and overseas top universities and colleges, serving as “fresh blood supply” for implementing our global deployment strategy.
The organization has been continually developed to improve its overall efficiency. There has been more transparency on promotion criteria and career path for talented personnel. Meanwhile, further improvements were made to the “partnership models” at various levels and to all ancillary measures to implement the global partner share option scheme, key talent Share Award Scheme and other incentive programs. Continuous efforts were made to optimize and enhance the effectiveness of various incentive mechanisms
Fulfillment of the Commitment to EmployeesFosun regards its employees as its most valuable capital. Meanwhile, Fosun has been aiming to provide the best platform for employees to realize their values. We fully protect the interests of employees, and we are always concerned with the personal development of our staff. We empathized on the importance of cultivating outstanding talents with an international perspective, and provide career development path with Fosun characteristics to allow both the Company and our employees to develop together.
Employee Caring and ServicesFosun persists in improving, innovating and strengthening the establishment of a comprehensive and diversified benefit system in order to create a sound enterprise atmosphere and promote the sense of belonging among the employees. Fosun cares for not only its employees, but also their families. These are consistent with the value of “Self-improvement, Teamwork, Performance and Contribution to Society” which has been upheld by Fosun.
Employee CaringFosun established different schemes for various employee groups. We enhanced caring for expatriate employees and their families and created caring models for senior employees. The company will send birthday wishes and gifts to expatriate employees every year and hold New Year celebrations for them, and for their families, the Company will send festival gifts during festivals and holidays to console them. For long-term service employees, the Company will commend and reward them during the New Year celebration. We also adopted incentive and benefit schemes tailored for our core talents, outstanding performers and young people with high potential. We take full advantage of the Group’s own insurance, finance, tourism, health and other resources so that employees can share all types of internal products, services and related resources at lower costs more conveniently.
STATUTORY DISCLOSURES
FOSUN INTERNATIONAL L IMITED I n te r im Repor t 2017 85
Fosun also cares about both the physical and mental health of female employees and provides extra care to them. The Group expresses its appreciation to the female employees on Women’s Day every year. We also organize lectures regularly on women’s health and prevention of occupational diseases.
We have been striving to provide diverse forms of care to employees and their families (including all-round care for the growth of the “Children of Fosun Employees” and enrich the family life of our employees). We prepare gifts for “Children of Fosun Employees” on Children’s Day every year, organize various activities irregularly and invite employees and their families to participate, hoping to help our employees and their families to enjoy a happy life.
Employee ServicesWe use the internet and various innovative channels to enrich employee services. We have further optimized and innovated methods of benefit distribution and propaganda, such as announcing or introducing employee benefits through our own mobile application, displaying various remuneration benefits and human resources policies and online banners on the home page of the Group’s intranet. We distribute employee benefits through our self-developed mobile application platform. We also use the platform to organize virtual fairs, allow users to recharge value online and pay for meals. Meanwhile, we established Global HR Shared Service Center to share resources all over the world, so that we are able to provide better service to our global employees.
Fosun has hired a full-time employee service staff who assist the employees in applying for various certificates, such as employment permits/residence permits for expatriate employees, permits for introduction of high caliber employees from other provinces or cities/residence certificates for employees from other cities, college graduates settlement and collective residence affiliation (集體戶口掛靠 ) so as to reduce time and efforts spent by employees on applying for these certificates, which effectively supported the introduction of excellent talents.
We actively promote the use of English in our internal systems, processes, rules and regulations so as to drive the Group’s globalization and meet the demands of our diverse employees. We also studied and formulated exclusive welfare policies and systems according to the laws, regulations and market practices in different countries and regions. Meanwhile, we also introduced induction courses and the “Buddy” (小伙伴 ) program tailored for our overseas staff to help expatriate workers to quickly understand and integrate into our corporate culture.
Employee Learning and DevelopmentThe Group believes that talents represent the core competitiveness of an enterprise, and as such, it has always been valuing the development of both the company and its staff as one of the most important responsibilities of Fosun. It provides the employees with more opportunities for career development and better working conditions through sustained efforts. With continuous growth and structural improvement, we have promoted the integration and cooperation among team members, created value and built groups with elitism culture. These measures allow both the company and its staff to build a brilliant future together.
Cultural PromotionEmployees will have a more unified understanding of the Group’s corporate culture and values through training. Meanwhile, we also work with external consulting firms, institutes and universities to integrate our internal and external training materials and resources, in attempt to promote our corporate brand. In addition, the Company has developed a unified mechanism regarding the promotion, guidance, communication and coordination of talents. It effectively bridges the gap between the diverse talents of different cultural backgrounds, and realizes harmonious relationships among the members of Fosun’s big family.
STATUTORY DISCLOSURES
FOSUN INTERNATIONAL L IMITED I n te r im Repor t 201786
Strategy InterpretationThe Group focuses on its development strategy to solve practical issues, assists the staff in understanding the key strategies of the Group by sharing cases of innovation and best practices with them so they could better implement our strategy extensively and in a well-coordinated manner.
Overseas Talents TrainingThe Group accelerates its globalization by promoting the exchanges of talents between domestic and overseas portfolio companies and realizing cross-cultural management. It facilitates cultural integration and strategic collaboration, and aims at setting common objectives; it also provides a more worldwide cross-regional training in terms of culture, skill and knowledge.
Career DevelopmentIn accordance with the development strategy and the human resources planning requirements of the Group and taking into account the characteristics of its own development, we have established talent development and professional talent training programs for different echelons. We plan development paths and design methods of learning in a scientific and rational manner that matches different development goals. We further design training courses in accordance with the quality of capabilities and specialized requirements to help employees grow rapidly.
Learning and Development CasesInvestment Case ReviewThe think tank of Fosun system has typical cases from work for study and exceptional cases of outstanding performance of high-caliber employees who share their work experience with others. It focuses on three targets: firstly, to improve the staff’s investment and management capability by conducting internal training and sharing experience with the investment teams; secondly, to gradually develop tools or methods that Fosun should have possessed in investment through the experience related to many cases of investments; thirdly, to progressively refine the learning-and-growth model of our core investment members through a range of case studies.
Professional Talent TrainingEstablishing various professional and specialized training, focusing on investment, insurance, finance, risk control, human resources and other areas; with the aim of honing the employees’ business ability to “learn from practice” and enhancing their adaptability.
Skills Enhancement TrainingEstablishing Fosun’s lecture to help employees enhance basic knowledge and skills, improve efficiency and effectiveness at work, enable them to efficiently carry out work as professional managers of business whose work are up to standard.
Mobile Learning PlatformWe built an anytime, anywhere and unobstructed learning platform by utilizing fragmented time. In the first half year of 2017, we introduced and internally transformed a total of 22 mini courses covering skill-training classes in a variety of areas such as investment, finance and soft skills, which provided a convenient online learning platform for employees of the Group, employees of enterprises under incubation and employees of some core portfolio companies.
Luncheon SessionAccording to its strategic focus, the Group held 13 lunch-time sharing sessions in the first half of 2017 to share its corporate strategies, hot topics on investment, internet and best practices. More than 588 employees attended the sessions.
STATUTORY DISCLOSURES
FOSUN INTERNATIONAL L IMITED I n te r im Repor t 2017 87
The Boss ShowWe invited directors and global partners of Fosun, and other entrepreneurs to share their business strategies, the logic of investment, and the research of the cutting-edge industry etc., to help our employees to understand the development strategy of Fosun, to widen sight and to obtain knowledge. Since May of 2017, we already held 3 topic sharing sessions. More than 310 employees attended.
Talent Echelon Training ProgramThe training program lasting for nearly one year was organized for employees with high potentials at all levels internally in accordance with the Group’s development strategy and planning, which is an important way for Fosun to train investment experts and potential business leaders. With the form of interactive project learning as the main theme, the highly potential talent training program brought students under different plans together to form project teams and improved the comprehensive ability of employees through real project cases to precipitate and accumulate business experience. Meanwhile, combined with classroom learning, interactive learning, online learning and other forms of multi-dimensional learning, we helped students consolidate their business base and enhance business skills.
Post-90s Fresh TalkAs a young company, Fosun has also set up a showcase stage for post-90s employees. Emerging things in the current industry such as various interesting and cutting-edge topics like hand games, school district housing, online celebrity, IP, bike-sharing, robot, VP, knowledge-based economy and NBA were explained by post-90s young employees using the mobile internet platform. In the first half year of 2017, 19 episodes were released in Season 2.
Employment and Labour StandardsOur employees are our most valuable asset and also the core of competitive advantages of the Group. The Group has been adhering to the principle of “attracting people with development, aggregating people by career, training people with work and appraising people with performance” and advocates fair competition and opposes discrimination. All employees and job applicants are not confined by factors such as gender, age, race, skin color and religious belief. The establishment of all human resources policies strictly complies with all rules and relevant regulations in connection with remuneration and dismissal, recruitment and promotion, employee schedule, equal opportunities, diversity and other benefits in countries/regions where our operations are located.
During the Reporting Period, all employees of the Group met the minimum working age requirements set out in the relevant laws of the countries/regions where our operations were located and the employment of child labor or forced labor was prohibited.
Employee IncentiveThe Group has consistently implemented a performance-oriented Total Reward System in line with internal and external market trends.
The Group has established and constantly improved the “multi-level, entire-coverage” remuneration incentive system to advocate the concept of “sharing gains and risks”, share the fruits of business growth with employees, build a diligent and dedicated professional manager team, and achieve personal growth and development while receiving incentive incomes.
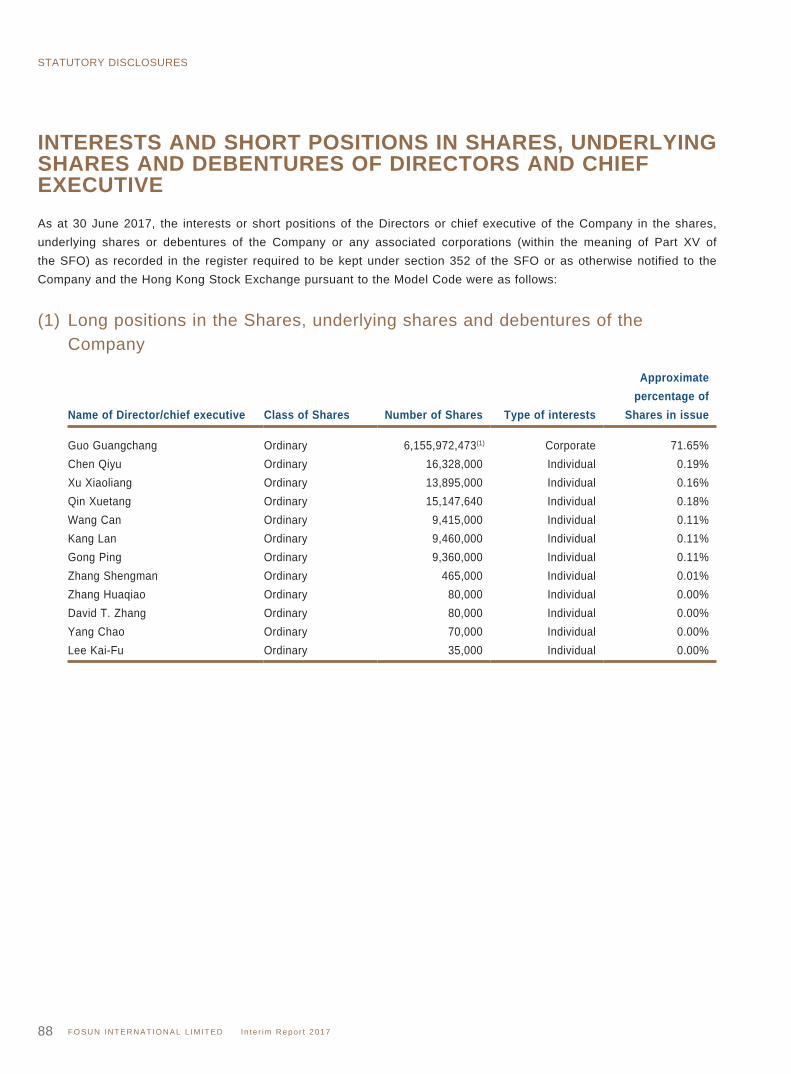
STATUTORY DISCLOSURES
FOSUN INTERNATIONAL L IMITED I n te r im Repor t 201788
INTERESTS AND SHORT POSITIONS IN SHARES, UNDERLYING SHARES AND DEBENTURES OF DIRECTORS AND CHIEF EXECUTIVEAs at 30 June 2017, the interests or short positions of the Directors or chief executive of the Company in the shares, underlying shares or debentures of the Company or any associated corporations (within the meaning of Part XV of the SFO) as recorded in the register required to be kept under section 352 of the SFO or as otherwise notified to the Company and the Hong Kong Stock Exchange pursuant to the Model Code were as follows:
(1) Long positions in the Shares, underlying shares and debentures of the Company
Name of Director/chief executive Class of Shares Number of Shares Type of interests
Approximate percentage of
Shares in issue Guo Guangchang Ordinary 6,155,972,473(1) Corporate 71.65%Chen Qiyu Ordinary 16,328,000 Individual 0.19%Xu Xiaoliang Ordinary 13,895,000 Individual 0.16%Qin Xuetang Ordinary 15,147,640 Individual 0.18%Wang Can Ordinary 9,415,000 Individual 0.11%Kang Lan Ordinary 9,460,000 Individual 0.11%Gong Ping Ordinary 9,360,000 Individual 0.11%Zhang Shengman Ordinary 465,000 Individual 0.01%Zhang Huaqiao Ordinary 80,000 Individual 0.00%David T. Zhang Ordinary 80,000 Individual 0.00%Yang Chao Ordinary 70,000 Individual 0.00%Lee Kai-Fu Ordinary 35,000 Individual 0.00%
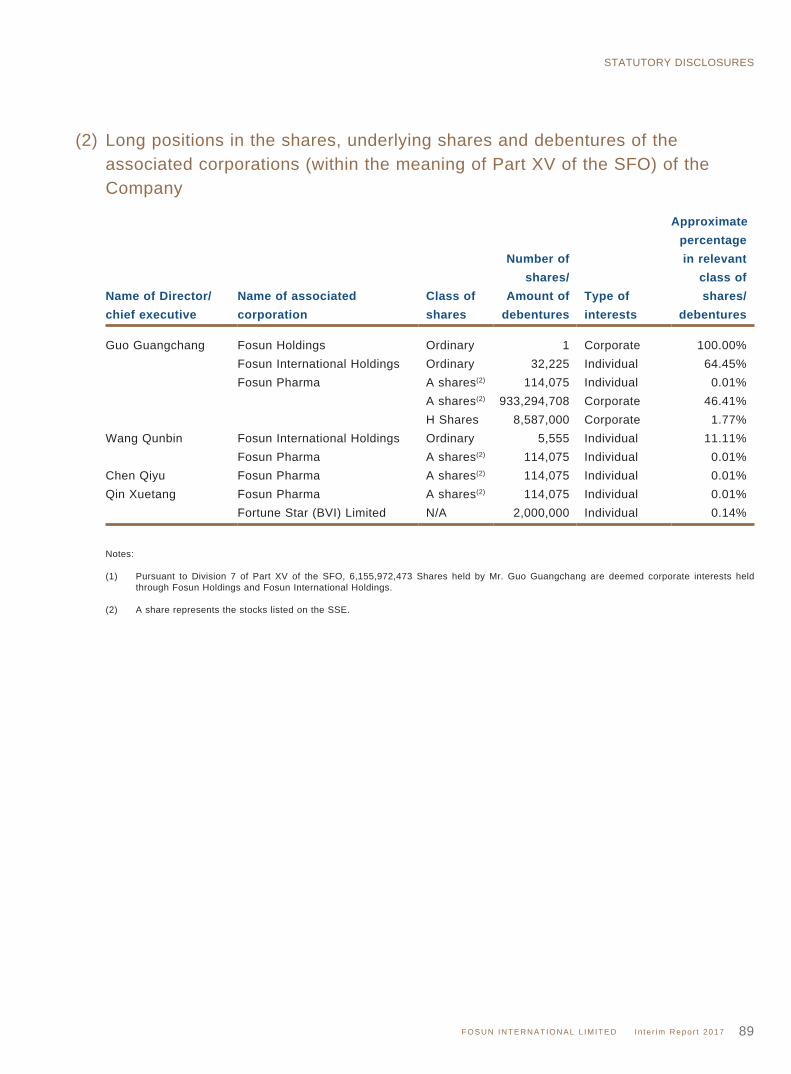
STATUTORY DISCLOSURES
FOSUN INTERNATIONAL L IMITED I n te r im Repor t 2017 89
(2) Long positions in the shares, underlying shares and debentures of the associated corporations (within the meaning of Part XV of the SFO) of the Company
Name of Director/chief executive
Name of associated corporation
Class of shares
Number of shares/
Amount of debentures
Type of interests
Approximatepercentagein relevant
class ofshares/
debentures Guo Guangchang Fosun Holdings Ordinary 1 Corporate 100.00%
Fosun International Holdings Ordinary 32,225 Individual 64.45%Fosun Pharma A shares(2) 114,075 Individual 0.01%
A shares(2) 933,294,708 Corporate 46.41%H Shares 8,587,000 Corporate 1.77%
Wang Qunbin Fosun International Holdings Ordinary 5,555 Individual 11.11%Fosun Pharma A shares(2) 114,075 Individual 0.01%
Chen Qiyu Fosun Pharma A shares(2) 114,075 Individual 0.01%Qin Xuetang Fosun Pharma A shares(2) 114,075 Individual 0.01%
Fortune Star (BVI) Limited N/A 2,000,000 Individual 0.14%
Notes:
(1) Pursuant to Division 7 of Part XV of the SFO, 6,155,972,473 Shares held by Mr. Guo Guangchang are deemed corporate interests held through Fosun Holdings and Fosun International Holdings.
(2) A share represents the stocks listed on the SSE.
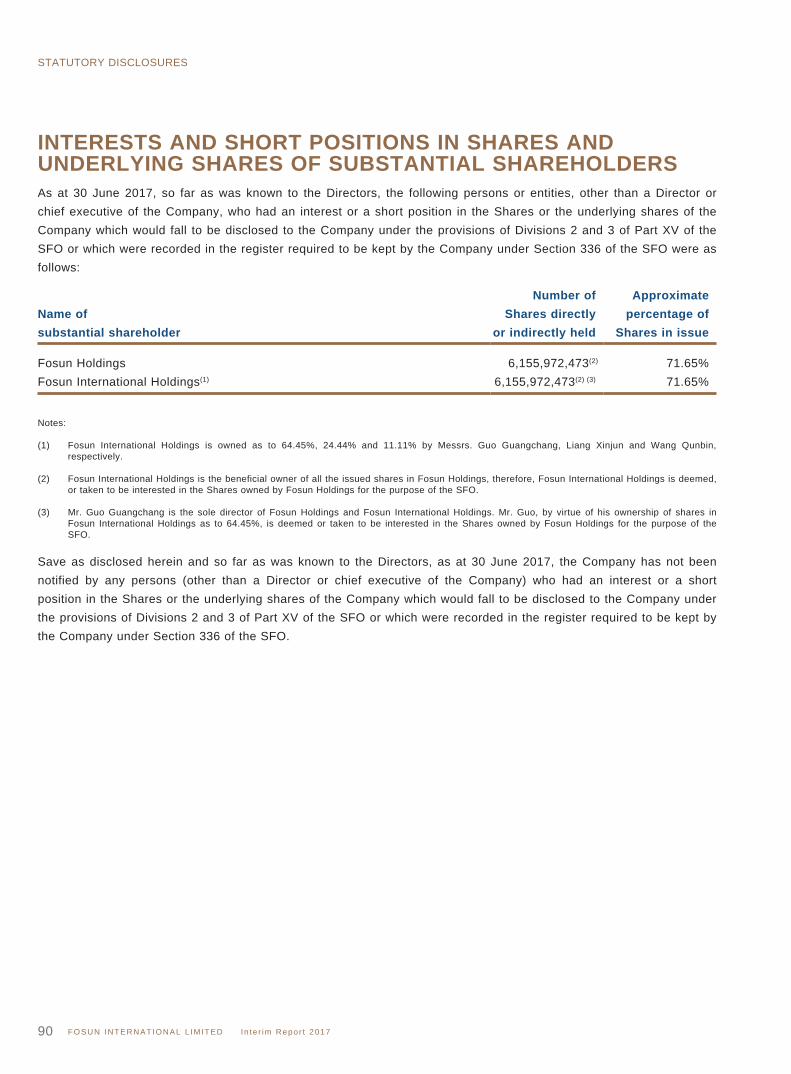
STATUTORY DISCLOSURES
FOSUN INTERNATIONAL L IMITED I n te r im Repor t 201790
INTERESTS AND SHORT POSITIONS IN SHARES AND UNDERLYING SHARES OF SUBSTANTIAL SHAREHOLDERSAs at 30 June 2017, so far as was known to the Directors, the following persons or entities, other than a Director or chief executive of the Company, who had an interest or a short position in the Shares or the underlying shares of the Company which would fall to be disclosed to the Company under the provisions of Divisions 2 and 3 of Part XV of the SFO or which were recorded in the register required to be kept by the Company under Section 336 of the SFO were as follows:
Number of ApproximateName of Shares directly percentage ofsubstantial shareholder or indirectly held Shares in issue Fosun Holdings 6,155,972,473(2) 71.65%Fosun International Holdings(1) 6,155,972,473(2) (3) 71.65%
Notes:
(1) Fosun International Holdings is owned as to 64.45%, 24.44% and 11.11% by Messrs. Guo Guangchang, Liang Xinjun and Wang Qunbin, respectively.
(2) Fosun International Holdings is the beneficial owner of all the issued shares in Fosun Holdings, therefore, Fosun International Holdings is deemed, or taken to be interested in the Shares owned by Fosun Holdings for the purpose of the SFO.
(3) Mr. Guo Guangchang is the sole director of Fosun Holdings and Fosun International Holdings. Mr. Guo, by virtue of his ownership of shares in Fosun International Holdings as to 64.45%, is deemed or taken to be interested in the Shares owned by Fosun Holdings for the purpose of the SFO.
Save as disclosed herein and so far as was known to the Directors, as at 30 June 2017, the Company has not been notified by any persons (other than a Director or chief executive of the Company) who had an interest or a short position in the Shares or the underlying shares of the Company which would fall to be disclosed to the Company under the provisions of Divisions 2 and 3 of Part XV of the SFO or which were recorded in the register required to be kept by the Company under Section 336 of the SFO.
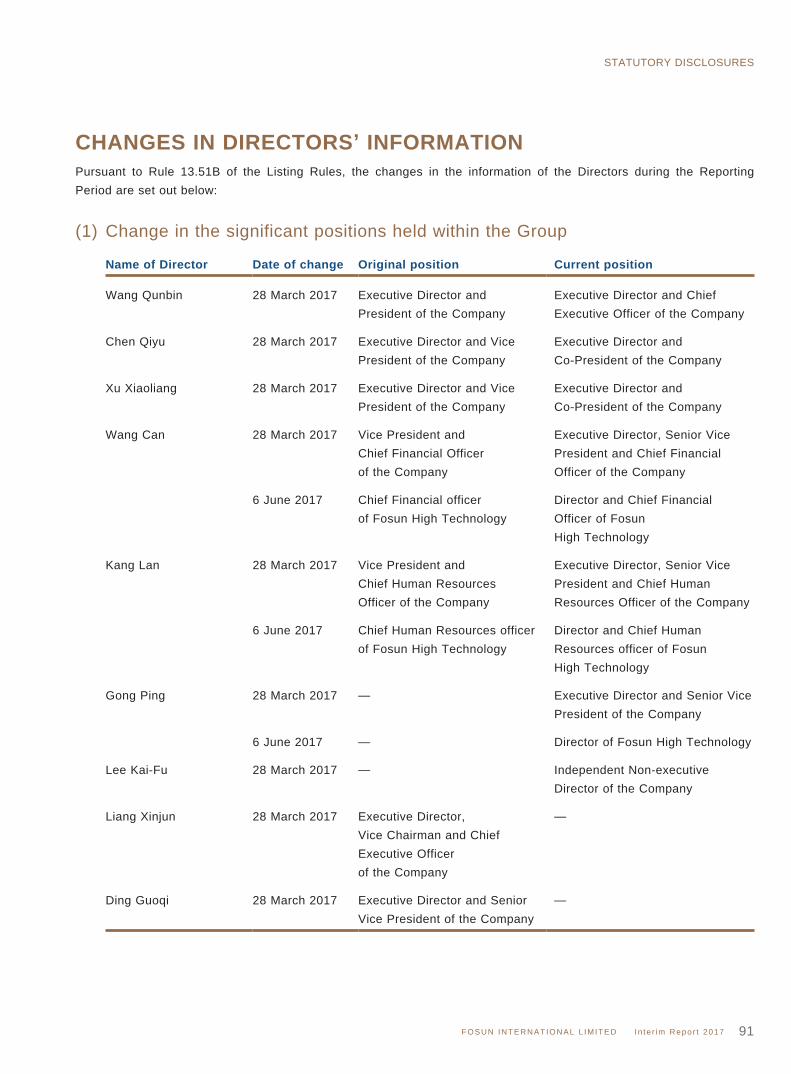
STATUTORY DISCLOSURES
FOSUN INTERNATIONAL L IMITED I n te r im Repor t 2017 91
CHANGES IN DIRECTORS’ INFORMATIONPursuant to Rule 13.51B of the Listing Rules, the changes in the information of the Directors during the Reporting Period are set out below:
(1) Change in the significant positions held within the Group
Name of Director Date of change Original position Current position Wang Qunbin 28 March 2017 Executive Director and
President of the CompanyExecutive Director and Chief Executive Officer of the Company
Chen Qiyu 28 March 2017 Executive Director and Vice President of the Company
Executive Director and Co-President of the Company
Xu Xiaoliang 28 March 2017 Executive Director and Vice President of the Company
Executive Director and Co-President of the Company
Wang Can 28 March 2017 Vice President andChief Financial Officer of the Company
Executive Director, Senior Vice President and Chief Financial Officer of the Company
6 June 2017 Chief Financial officer of Fosun High Technology
Director and Chief Financial Officer of Fosun High Technology
Kang Lan 28 March 2017 Vice President andChief Human Resources Officer of the Company
Executive Director, Senior Vice President and Chief Human Resources Officer of the Company
6 June 2017 Chief Human Resources officer of Fosun High Technology
Director and Chief Human Resources officer of Fosun High Technology
Gong Ping 28 March 2017 — Executive Director and Senior Vice President of the Company
6 June 2017 — Director of Fosun High Technology
Lee Kai-Fu 28 March 2017 — Independent Non-executive Director of the Company
Liang Xinjun 28 March 2017 Executive Director, Vice Chairman and Chief Executive Officer of the Company
—
Ding Guoqi 28 March 2017 Executive Director and Senior Vice President of the Company
—
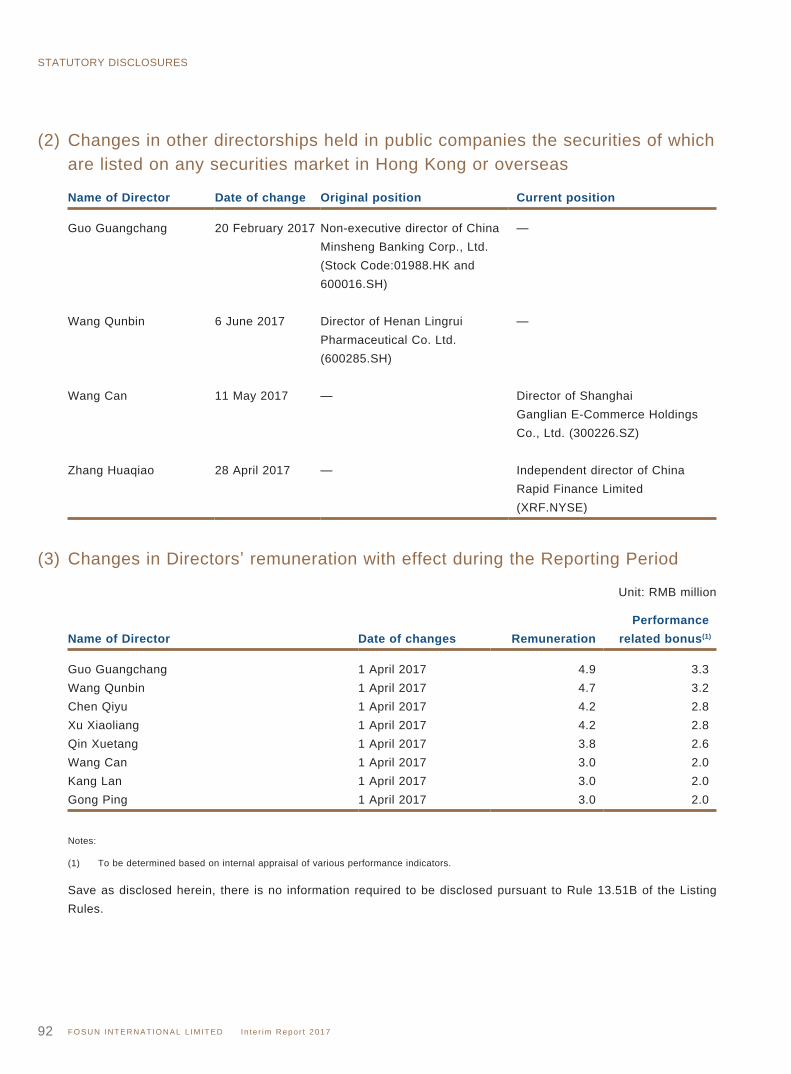
STATUTORY DISCLOSURES
FOSUN INTERNATIONAL L IMITED I n te r im Repor t 201792
(2) Changes in other directorships held in public companies the securities of which are listed on any securities market in Hong Kong or overseas
Name of Director Date of change Original position Current position Guo Guangchang 20 February 2017 Non-executive director of China
Minsheng Banking Corp., Ltd. (Stock Code:01988.HK and 600016.SH)
—
Wang Qunbin 6 June 2017 Director of Henan Lingrui Pharmaceutical Co. Ltd. (600285.SH)
—
Wang Can 11 May 2017 — Director of ShanghaiGanglian E-Commerce Holdings Co., Ltd. (300226.SZ)
Zhang Huaqiao 28 April 2017 — Independent director of China Rapid Finance Limited (XRF.NYSE)
(3) Changes in Directors’ remuneration with effect during the Reporting Period
Unit: RMB million
Name of Director Date of changes RemunerationPerformance
related bonus(1)
Guo Guangchang 1 April 2017 4.9 3.3Wang Qunbin 1 April 2017 4.7 3.2Chen Qiyu 1 April 2017 4.2 2.8Xu Xiaoliang 1 April 2017 4.2 2.8Qin Xuetang 1 April 2017 3.8 2.6Wang Can 1 April 2017 3.0 2.0Kang Lan 1 April 2017 3.0 2.0Gong Ping 1 April 2017 3.0 2.0
Notes:
(1) To be determined based on internal appraisal of various performance indicators.
Save as disclosed herein, there is no information required to be disclosed pursuant to Rule 13.51B of the Listing Rules.
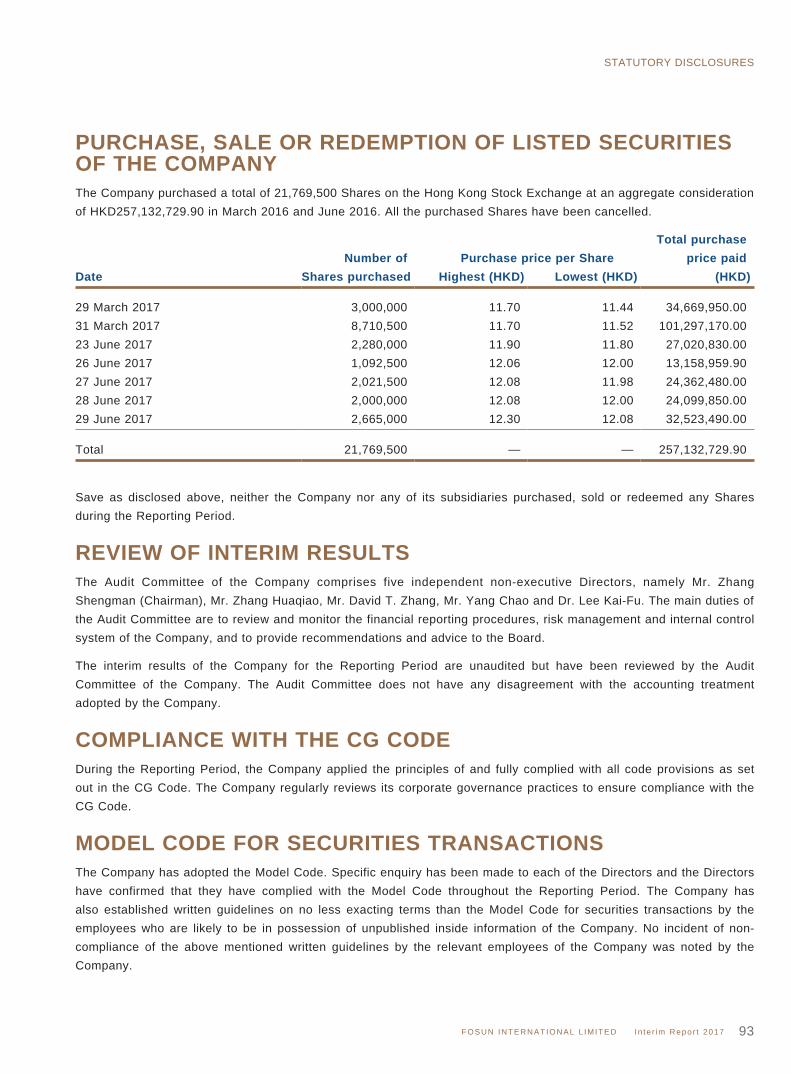
STATUTORY DISCLOSURES
FOSUN INTERNATIONAL L IMITED I n te r im Repor t 2017 93
PURCHASE, SALE OR REDEMPTION OF LISTED SECURITIES OF THE COMPANYThe Company purchased a total of 21,769,500 Shares on the Hong Kong Stock Exchange at an aggregate consideration of HKD257,132,729.90 in March 2016 and June 2016. All the purchased Shares have been cancelled.
Number of Purchase price per ShareTotal purchase
price paidDate Shares purchased Highest (HKD) Lowest (HKD) (HKD) 29 March 2017 3,000,000 11.70 11.44 34,669,950.0031 March 2017 8,710,500 11.70 11.52 101,297,170.0023 June 2017 2,280,000 11.90 11.80 27,020,830.0026 June 2017 1,092,500 12.06 12.00 13,158,959.9027 June 2017 2,021,500 12.08 11.98 24,362,480.0028 June 2017 2,000,000 12.08 12.00 24,099,850.0029 June 2017 2,665,000 12.30 12.08 32,523,490.00 Total 21,769,500 — — 257,132,729.90
Save as disclosed above, neither the Company nor any of its subsidiaries purchased, sold or redeemed any Shares during the Reporting Period.
REVIEW OF INTERIM RESULTSThe Audit Committee of the Company comprises five independent non-executive Directors, namely Mr. Zhang Shengman (Chairman), Mr. Zhang Huaqiao, Mr. David T. Zhang, Mr. Yang Chao and Dr. Lee Kai-Fu. The main duties of the Audit Committee are to review and monitor the financial reporting procedures, risk management and internal control system of the Company, and to provide recommendations and advice to the Board.
The interim results of the Company for the Reporting Period are unaudited but have been reviewed by the Audit Committee of the Company. The Audit Committee does not have any disagreement with the accounting treatment adopted by the Company.
COMPLIANCE WITH THE CG CODEDuring the Reporting Period, the Company applied the principles of and fully complied with all code provisions as set out in the CG Code. The Company regularly reviews its corporate governance practices to ensure compliance with the CG Code.
MODEL CODE FOR SECURITIES TRANSACTIONSThe Company has adopted the Model Code. Specific enquiry has been made to each of the Directors and the Directors have confirmed that they have complied with the Model Code throughout the Reporting Period. The Company has also established written guidelines on no less exacting terms than the Model Code for securities transactions by the employees who are likely to be in possession of unpublished inside information of the Company. No incident of non-compliance of the above mentioned written guidelines by the relevant employees of the Company was noted by the Company.
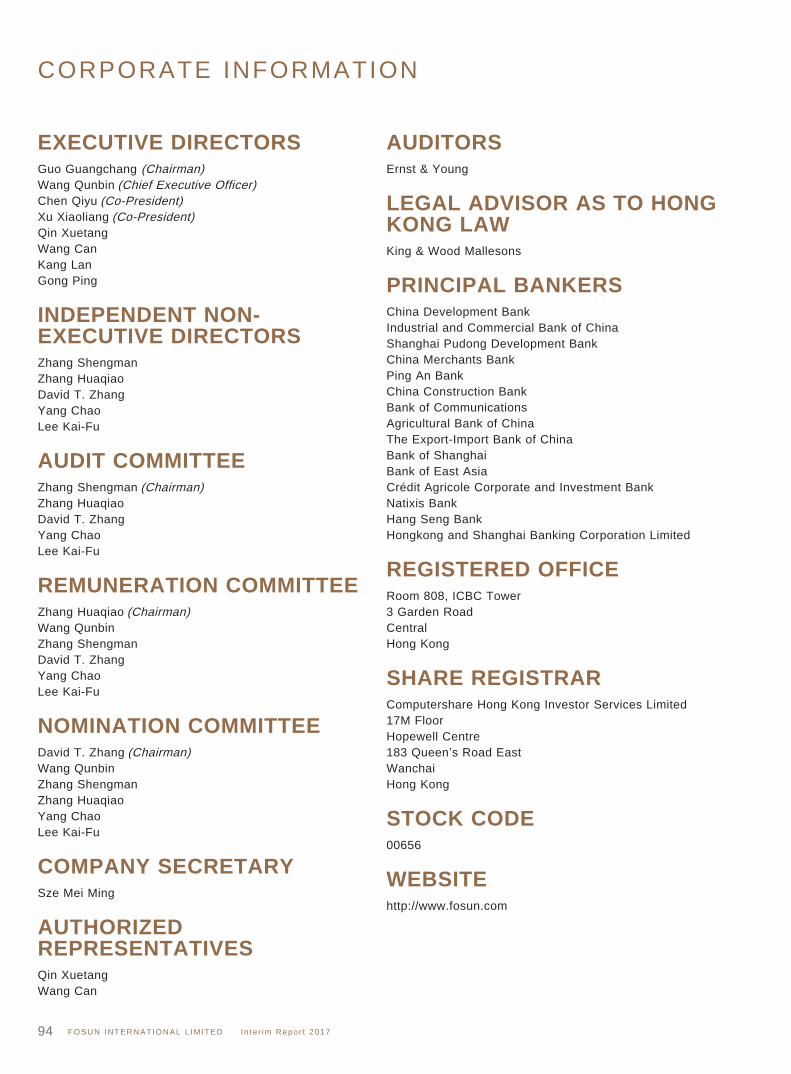
CORPORATE INFORMATION
FOSUN INTERNATIONAL L IMITED I n te r im Repor t 201794
EXECUTIVE DIRECTORSGuo Guangchang (Chairman)Wang Qunbin (Chief Executive Officer)Chen Qiyu (Co-President)Xu Xiaoliang (Co-President)Qin XuetangWang CanKang LanGong Ping
INDEPENDENT NON-EXECUTIVE DIRECTORSZhang ShengmanZhang HuaqiaoDavid T. ZhangYang ChaoLee Kai-Fu
AUDIT COMMITTEEZhang Shengman (Chairman)Zhang HuaqiaoDavid T. ZhangYang ChaoLee Kai-Fu
REMUNERATION COMMITTEEZhang Huaqiao (Chairman)Wang QunbinZhang ShengmanDavid T. ZhangYang ChaoLee Kai-Fu
NOMINATION COMMITTEEDavid T. Zhang (Chairman)Wang QunbinZhang ShengmanZhang HuaqiaoYang ChaoLee Kai-Fu
COMPANY SECRETARYSze Mei Ming
AUTHORIZED REPRESENTATIVESQin XuetangWang Can
AUDITORSErnst & Young
LEGAL ADVISOR AS TO HONG KONG LAWKing & Wood Mallesons
PRINCIPAL BANKERSChina Development BankIndustrial and Commercial Bank of ChinaShanghai Pudong Development BankChina Merchants BankPing An BankChina Construction BankBank of CommunicationsAgricultural Bank of ChinaThe Export-Import Bank of ChinaBank of ShanghaiBank of East AsiaCrédit Agricole Corporate and Investment BankNatixis BankHang Seng BankHongkong and Shanghai Banking Corporation Limited
REGISTERED OFFICERoom 808, ICBC Tower3 Garden RoadCentralHong Kong
SHARE REGISTRARComputershare Hong Kong Investor Services Limited17M FloorHopewell Centre183 Queen’s Road EastWanchaiHong Kong
STOCK CODE00656
WEBSITEhttp://www.fosun.com
GLOSSARY
FOSUN INTERNATIONAL L IMITED I n te r im Repor t 2017 95
FORMULAEBITDA = profit for the period + tax + net interest expenditures + depreciation and amortisationInterest coverage = EBITDA/net interest expendituresNet gearing ratio = net debt/shareholder’s equityTotal capitalization = equity attributable to owners of the parent + non-controlling interests + total debtTotal debt = current and non-current interest-bearing borrowings + convertible bonds
ABBREVIATIONSAHAVA AHAVA Dead Sea Laboratories Ltd.BCP Banco Comercial Português, S.A.the Board the board of DirectorsCainiao Cainiao Network Technology Co., Ltd.CG Code Corporate Governance Code and Corporate Governance Report contained in
Appendix 14 of the Listing RulesClub Med Club Med SASthe Company Fosun International Limitedthe Director(s) the director(s) of the CompanyEuro Euro, the official currency of the EurozoneFidelidade Fidelidade-Companhia de Seguros, S.A.Fidelidade Assistência Fidelidade Assistência-Companhia de Seguros, S.A.Focus Media Focus Media Information Technology Co., Ltd., a company whose A shares are
listed on the Shenzhen Stock Exchange with stock code 002027Folli Follie Folli Follie Group, a company listed on the Athens Stock Exchange with
stock code FFGRPForte Shanghai Forte Land Co., Ltd.Fosun Capital Shanghai Fosun Capital Investment Management Co., Ltd.Fosun Chuanghong Shanghai Fosun Chuanghong Equity Investment Fund Partnership (L.P.)Fosun Eurasia Capital Fosun Eurasia Capital Limited Liability CompanyFosun Hani Securities Fosun Hani Securities LimitedFosun High Technology Shanghai Fosun High Technology (Group) Co., Ltd.Fosun Holdings Fosun Holdings LimitedFosun Insurance Portugal Fidelidade, Multicare and Fidelidade AssistênciaFosun International Holdings Fosun International Holdings Ltd.Fosun Pharma Shanghai Fosun Pharmaceutical (Group) Co., Ltd., a company whose A shares are
listed on the SSE with stock code 600196, and whose H shares are listed on the Hong Kong Stock Exchange with stock code 02196
Fosun United Health Insurance Fosun United Health Insurance Company LimitedGBP Pound Sterling, the official currency of United KingdomGFA gross floor areathe Group or Fosun the Company and its subsidiariesH&A Hauck & Aufhäuser Privatbankiers AG (formerly known as
Hauck & Aufhäuser Privatbankiers KGaA)Hainan Mining Hainan Mining Co., Ltd., a company whose A shares are listed on the SSE
with stock code 601969
GLOSSARY
FOSUN INTERNATIONAL L IMITED I n te r im Repor t 201796
HKD Hong Kong dollars, the official currency of Hong KongHong Kong the Hong Kong Special Administrative Region of PRCHong Kong Stock Exchange The Stock Exchange of Hong Kong LimitedIDERA IDERA Capital Management Ltd.Ironshore Ironshore Inc.JPY Japanese yen, the official currency of JapanJuewei Food Juewei Food Co., Ltd.Kutesmart Qingdao Kutesmart Co., Ltd.Listing Rules the Rules Governing the Listing of Securities on the Hong Kong Stock ExchangeLuz Saúde Luz Saúde, S.A., a company listed on the Euronext Lisbon with stock code LUZMIG Meadowbrook Insurance Group, Inc.Model Code the Model Code for Securities Transactions by Directors of Listed Issuers contained
in Appendix 10 of the Listing RulesMulticare Multicare-Seguros de Saúde, S.A.Mybank Zhejiang E-Commerce Bank Co., Ltd.Nanjing Nangang Nanjing Nangang Iron & Steel United Co., Ltd.Peak Reinsurance Peak Reinsurance Company LimitedPramerica-Fosun China Opportunity Fund
Pramerica-Fosun China Opportunity Fund, L.P.
Pramerica Fosun Life Insurance Pramerica Fosun Life Insurance Co., Ltd.PRC or China the People’s Republic of ChinaReporting Period the six months ended 30 June 2017Resolution Property Resolution Property Investment Management LLPRio Bravo Rio Bravo Investimentos S.A.RMB Renminbi, the official currency of the PRCROC Roc Oil Company LimitedSanyuan Foods Beijing Sanyuan Foods Co., Ltd., a company whose A shares are listed on the SSE
with stock code 600429SFO the Securities and Futures Ordinance (Charter 571) of the laws of Hong KongShare(s) the share(s) of the CompanyShare Award Scheme the share award scheme adopted by the Company on 25 March 2015,
as amended from time to timeSilver Cross Silver Cross Nurseries LimitedSSE the Shanghai Stock ExchangeStar Healthcare Shanghai Star Healthcare Co., Ltd.St-Hubert St-Hubert SASStarcastle Senior Living Shanghai Starcastle Senior Living Co., Ltd.Sun Paper Shan Dong Sun Paper Industry Joint Stock Co., Ltd.,a company whose A shares
are listed on the Shenzhen Stock Exchange with stock code 002078Thomas Cook Thomas Cook Group plcTom Tailor TOM TAILOR Holding AGUSD United States dollars, the official currency of the United StatesYong’an P&C Insurance Yong’an Property Insurance Company LimitedYuyuan Shanghai Yuyuan Tourist Mart Co., Ltd., a company whose A shares
are listed on the SSE with stock code 600655