Embed Size (px)
Citation preview
2
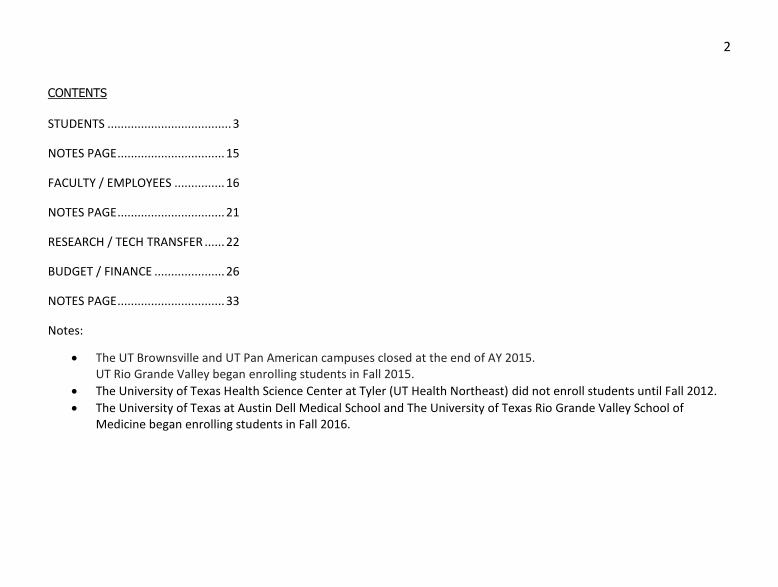
CONTENTS
STUDENTS ..................................... 3
NOTES PAGE ................................ 15
FACULTY / EMPLOYEES ............... 16
NOTES PAGE ................................ 21
RESEARCH / TECH TRANSFER ...... 22
BUDGET / FINANCE ..................... 26
NOTES PAGE ................................ 33
Notes:
• The UT Brownsville and UT Pan American campuses closed at the end of AY 2015. UT Rio Grande Valley began enrolling students in Fall 2015.
• The University of Texas Health Science Center at Tyler (UT Health Northeast) did not enroll students until Fall 2012.
• The University of Texas at Austin Dell Medical School and The University of Texas Rio Grande Valley School of Medicine began enrolling students in Fall 2016.
3
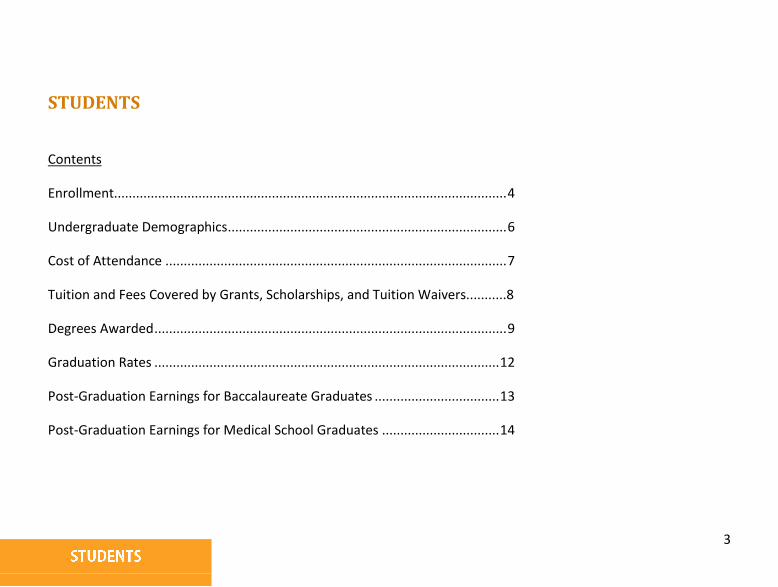
STUDENTS
Contents
Enrollment........................................................................................................... 4
Undergraduate Demographics ............................................................................ 6
Cost of Attendance ............................................................................................. 7
Tuition and Fees Covered by Grants, Scholarships, and Tuition Waivers...........8
Degrees Awarded ................................................................................................ 9
Graduation Rates .............................................................................................. 12
Post-Graduation Earnings for Baccalaureate Graduates .................................. 13
Post-Graduation Earnings for Medical School Graduates ................................ 14
4
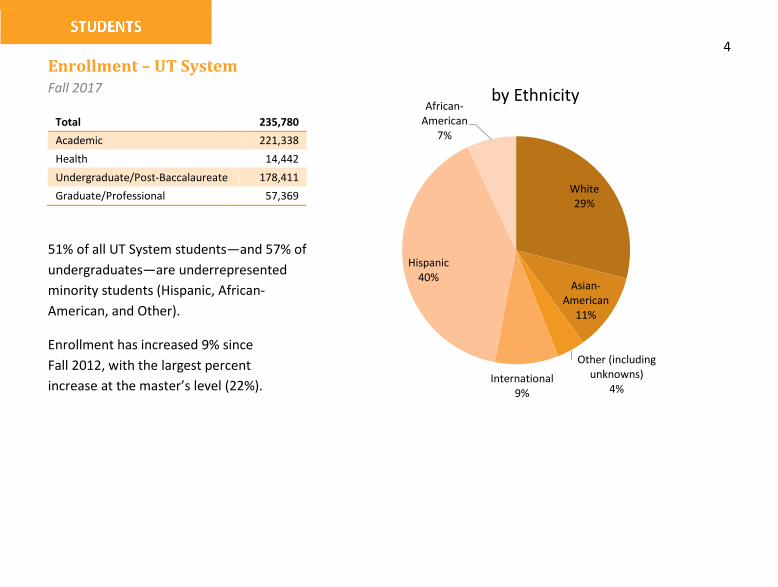
Enrollment – UT System Fall 2017
Total 235,780
Academic 221,338
Health 14,442
Undergraduate/Post-Baccalaureate 178,411
Graduate/Professional 57,369
51% of all UT System students—and 57% of
undergraduates—are underrepresented
minority students (Hispanic, African-
American, and Other).
Enrollment has increased 9% since
Fall 2012, with the largest percent
increase at the master’s level (22%).
White29%
Asian-American
11%
Other (including unknowns)
4%International
9%
Hispanic40%
African-American
7%
by Ethnicity
5
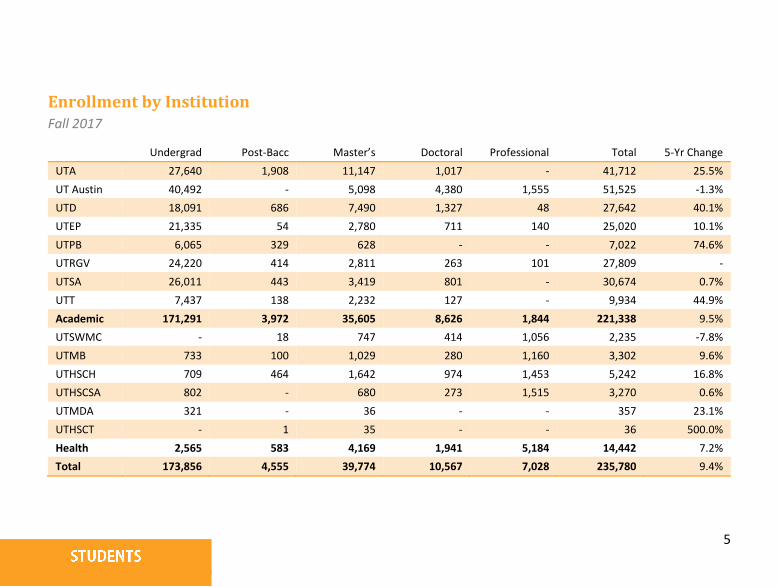
Enrollment by Institution Fall 2017
Undergrad Post-Bacc Master’s Doctoral Professional Total 5-Yr Change
UTA 27,640 1,908 11,147 1,017 - 41,712 25.5%
UT Austin 40,492 - 5,098 4,380 1,555 51,525 -1.3%
UTD 18,091 686 7,490 1,327 48 27,642 40.1%
UTEP 21,335 54 2,780 711 140 25,020 10.1%
UTPB 6,065 329 628 - - 7,022 74.6%
UTRGV 24,220 414 2,811 263 101 27,809 -
UTSA 26,011 443 3,419 801 - 30,674 0.7%
UTT 7,437 138 2,232 127 - 9,934 44.9%
Academic 171,291 3,972 35,605 8,626 1,844 221,338 9.5%
UTSWMC - 18 747 414 1,056 2,235 -7.8%
UTMB 733 100 1,029 280 1,160 3,302 9.6%
UTHSCH 709 464 1,642 974 1,453 5,242 16.8%
UTHSCSA 802 - 680 273 1,515 3,270 0.6%
UTMDA 321 - 36 - - 357 23.1%
UTHSCT - 1 35 - - 36 500.0%
Health 2,565 583 4,169 1,941 5,184 14,442 7.2%
Total 173,856 4,555 39,774 10,567 7,028 235,780 9.4%
6
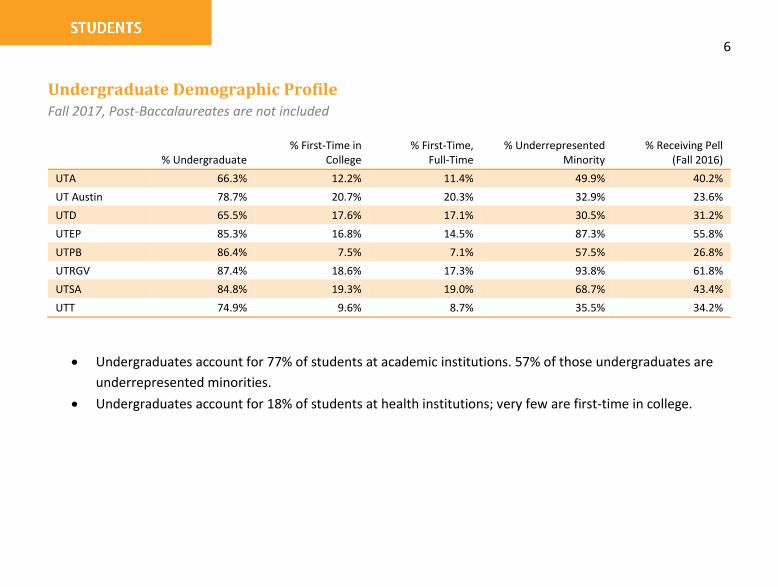
Undergraduate Demographic Profile Fall 2017, Post-Baccalaureates are not included
% Undergraduate
% First-Time in College
% First-Time, Full-Time
% Underrepresented Minority
% Receiving Pell (Fall 2016)
UTA 66.3% 12.2% 11.4% 49.9% 40.2%
UT Austin 78.7% 20.7% 20.3% 32.9% 23.6%
UTD 65.5% 17.6% 17.1% 30.5% 31.2%
UTEP 85.3% 16.8% 14.5% 87.3% 55.8%
UTPB 86.4% 7.5% 7.1% 57.5% 26.8%
UTRGV 87.4% 18.6% 17.3% 93.8% 61.8%
UTSA 84.8% 19.3% 19.0% 68.7% 43.4%
UTT 74.9% 9.6% 8.7% 35.5% 34.2%
• Undergraduates account for 77% of students at academic institutions. 57% of those undergraduates are
underrepresented minorities.
• Undergraduates account for 18% of students at health institutions; very few are first-time in college.
7
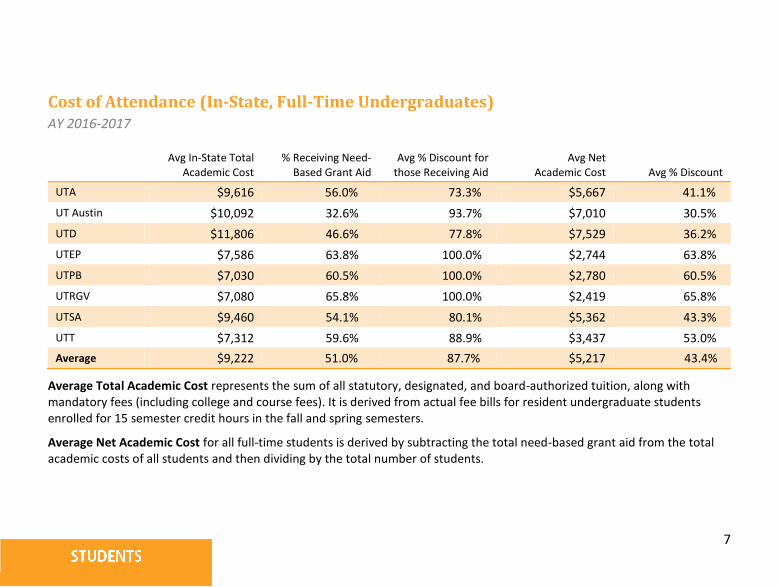
Cost of Attendance (In-State, Full-Time Undergraduates) AY 2016-2017
Avg In-State Total
Academic Cost % Receiving Need-
Based Grant Aid Avg % Discount for
those Receiving Aid Avg Net
Academic Cost Avg % Discount
UTA $9,616 56.0% 73.3% $5,667 41.1%
UT Austin $10,092 32.6% 93.7% $7,010 30.5%
UTD $11,806 46.6% 77.8% $7,529 36.2%
UTEP $7,586 63.8% 100.0% $2,744 63.8%
UTPB $7,030 60.5% 100.0% $2,780 60.5%
UTRGV $7,080 65.8% 100.0% $2,419 65.8%
UTSA $9,460 54.1% 80.1% $5,362 43.3%
UTT $7,312 59.6% 88.9% $3,437 53.0%
Average $9,222 51.0% 87.7% $5,217 43.4%
Average Total Academic Cost represents the sum of all statutory, designated, and board-authorized tuition, along with mandatory fees (including college and course fees). It is derived from actual fee bills for resident undergraduate students enrolled for 15 semester credit hours in the fall and spring semesters.
Average Net Academic Cost for all full-time students is derived by subtracting the total need-based grant aid from the total academic costs of all students and then dividing by the total number of students.
8
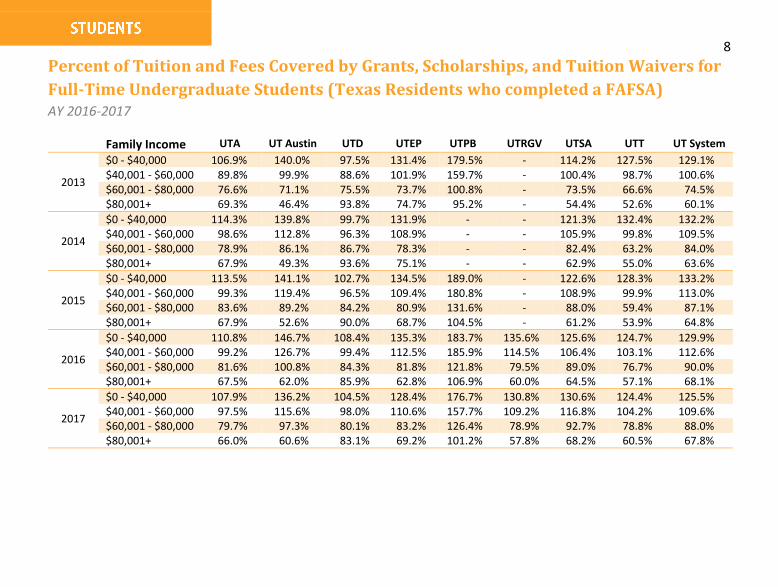
Percent of Tuition and Fees Covered by Grants, Scholarships, and Tuition Waivers for
Full-Time Undergraduate Students (Texas Residents who completed a FAFSA) AY 2016-2017
Family Income UTA UT Austin UTD UTEP UTPB UTRGV UTSA UTT UT System
2013
$0 - $40,000 106.9% 140.0% 97.5% 131.4% 179.5% - 114.2% 127.5% 129.1% $40,001 - $60,000 89.8% 99.9% 88.6% 101.9% 159.7% - 100.4% 98.7% 100.6% $60,001 - $80,000 76.6% 71.1% 75.5% 73.7% 100.8% - 73.5% 66.6% 74.5% $80,001+ 69.3% 46.4% 93.8% 74.7% 95.2% - 54.4% 52.6% 60.1%
2014
$0 - $40,000 114.3% 139.8% 99.7% 131.9% - - 121.3% 132.4% 132.2% $40,001 - $60,000 98.6% 112.8% 96.3% 108.9% - - 105.9% 99.8% 109.5% $60,001 - $80,000 78.9% 86.1% 86.7% 78.3% - - 82.4% 63.2% 84.0% $80,001+ 67.9% 49.3% 93.6% 75.1% - - 62.9% 55.0% 63.6%
2015
$0 - $40,000 113.5% 141.1% 102.7% 134.5% 189.0% - 122.6% 128.3% 133.2% $40,001 - $60,000 99.3% 119.4% 96.5% 109.4% 180.8% - 108.9% 99.9% 113.0% $60,001 - $80,000 83.6% 89.2% 84.2% 80.9% 131.6% - 88.0% 59.4% 87.1% $80,001+ 67.9% 52.6% 90.0% 68.7% 104.5% - 61.2% 53.9% 64.8%
2016
$0 - $40,000 110.8% 146.7% 108.4% 135.3% 183.7% 135.6% 125.6% 124.7% 129.9% $40,001 - $60,000 99.2% 126.7% 99.4% 112.5% 185.9% 114.5% 106.4% 103.1% 112.6% $60,001 - $80,000 81.6% 100.8% 84.3% 81.8% 121.8% 79.5% 89.0% 76.7% 90.0% $80,001+ 67.5% 62.0% 85.9% 62.8% 106.9% 60.0% 64.5% 57.1% 68.1%
2017
$0 - $40,000 107.9% 136.2% 104.5% 128.4% 176.7% 130.8% 130.6% 124.4% 125.5% $40,001 - $60,000 97.5% 115.6% 98.0% 110.6% 157.7% 109.2% 116.8% 104.2% 109.6% $60,001 - $80,000 79.7% 97.3% 80.1% 83.2% 126.4% 78.9% 92.7% 78.8% 88.0% $80,001+ 66.0% 60.6% 83.1% 69.2% 101.2% 57.8% 68.2% 60.5% 67.8%
9
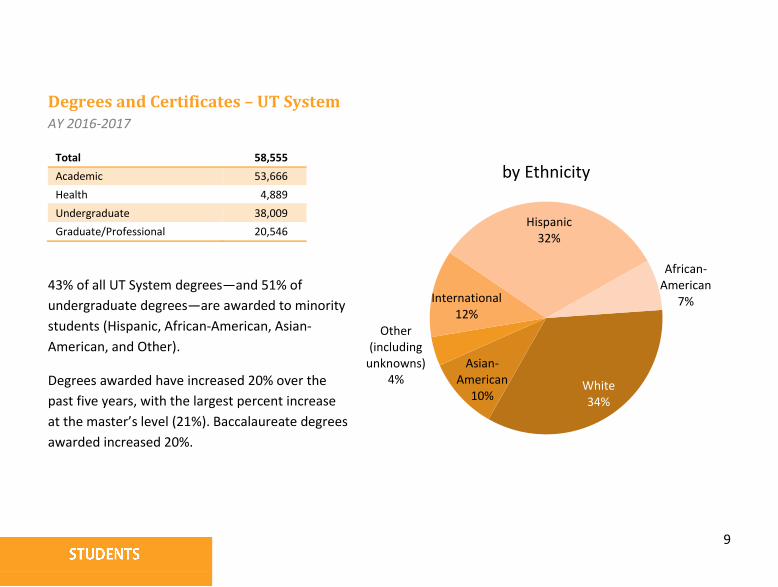
Degrees and Certificates – UT System AY 2016-2017
Total 58,555
Academic 53,666
Health 4,889
Undergraduate 38,009
Graduate/Professional 20,546
43% of all UT System degrees—and 51% of
undergraduate degrees—are awarded to minority
students (Hispanic, African-American, Asian-
American, and Other).
Degrees awarded have increased 20% over the
past five years, with the largest percent increase
at the master’s level (21%). Baccalaureate degrees
awarded increased 20%.
White34%
Asian-American
10%
Other (including
unknowns)4%
International12%
Hispanic32%
African-American
7%
by Ethnicity
10
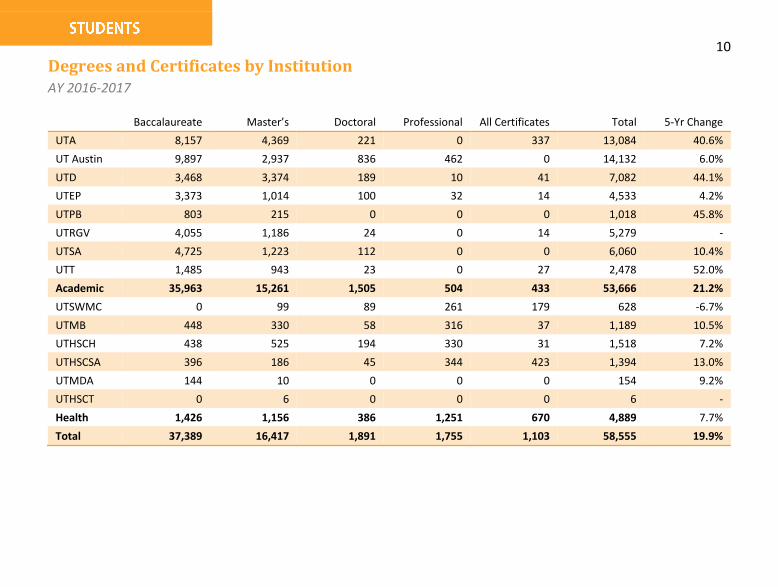
Degrees and Certificates by Institution AY 2016-2017
Baccalaureate Master’s Doctoral Professional All Certificates Total 5-Yr Change
UTA 8,157 4,369 221 0 337 13,084 40.6%
UT Austin 9,897 2,937 836 462 0 14,132 6.0%
UTD 3,468 3,374 189 10 41 7,082 44.1%
UTEP 3,373 1,014 100 32 14 4,533 4.2%
UTPB 803 215 0 0 0 1,018 45.8%
UTRGV 4,055 1,186 24 0 14 5,279 -
UTSA 4,725 1,223 112 0 0 6,060 10.4%
UTT 1,485 943 23 0 27 2,478 52.0%
Academic 35,963 15,261 1,505 504 433 53,666 21.2%
UTSWMC 0 99 89 261 179 628 -6.7%
UTMB 448 330 58 316 37 1,189 10.5%
UTHSCH 438 525 194 330 31 1,518 7.2%
UTHSCSA 396 186 45 344 423 1,394 13.0%
UTMDA 144 10 0 0 0 154 9.2%
UTHSCT 0 6 0 0 0 6 -
Health 1,426 1,156 386 1,251 670 4,889 7.7%
Total 37,389 16,417 1,891 1,755 1,103 58,555 19.9%
11
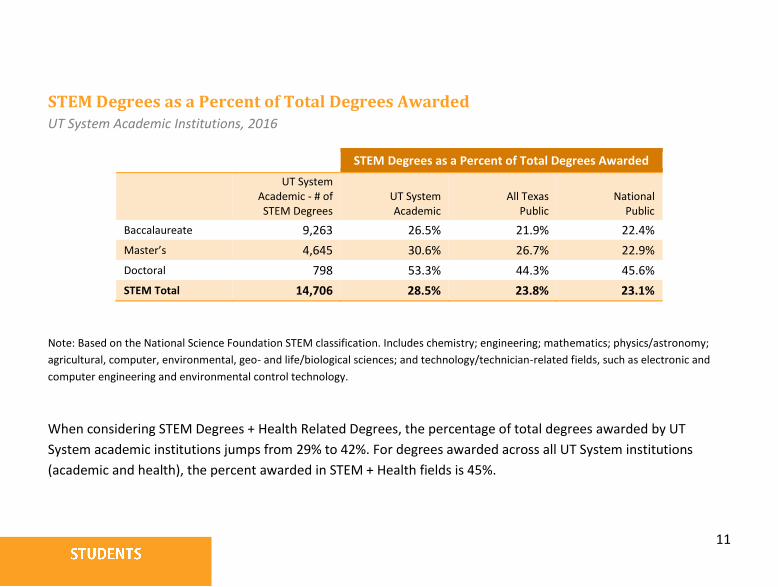
STEM Degrees as a Percent of Total Degrees Awarded UT System Academic Institutions, 2016
STEM Degrees as a Percent of Total Degrees Awarded
UT System Academic - # of STEM Degrees
UT System Academic
All Texas Public
National Public
Baccalaureate 9,263 26.5% 21.9% 22.4%
Master’s 4,645 30.6% 26.7% 22.9%
Doctoral 798 53.3% 44.3% 45.6%
STEM Total 14,706 28.5% 23.8% 23.1%
Note: Based on the National Science Foundation STEM classification. Includes chemistry; engineering; mathematics; physics/astronomy;
agricultural, computer, environmental, geo- and life/biological sciences; and technology/technician-related fields, such as electronic and
computer engineering and environmental control technology.
When considering STEM Degrees + Health Related Degrees, the percentage of total degrees awarded by UT
System academic institutions jumps from 29% to 42%. For degrees awarded across all UT System institutions
(academic and health), the percent awarded in STEM + Health fields is 45%.
12
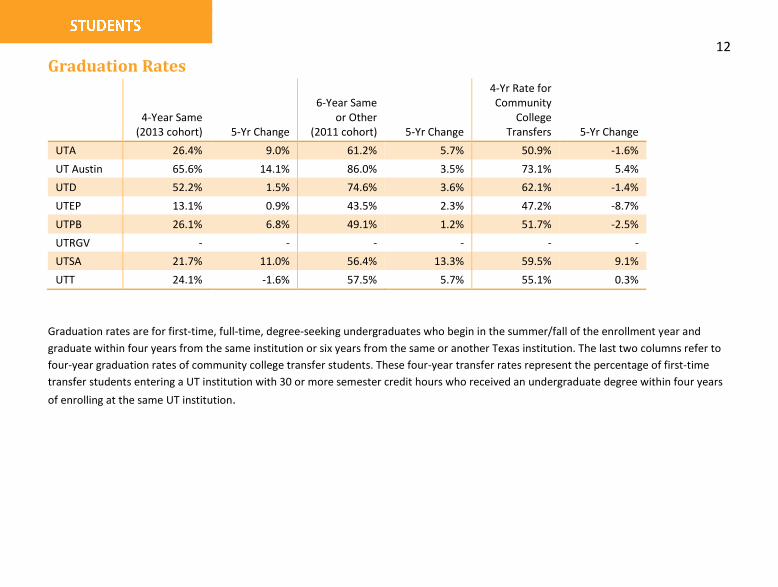
Graduation Rates
4-Year Same (2013 cohort) 5-Yr Change
6-Year Same or Other
(2011 cohort) 5-Yr Change
4-Yr Rate for Community
College Transfers 5-Yr Change
UTA 26.4% 9.0% 61.2% 5.7% 50.9% -1.6%
UT Austin 65.6% 14.1% 86.0% 3.5% 73.1% 5.4%
UTD 52.2% 1.5% 74.6% 3.6% 62.1% -1.4%
UTEP 13.1% 0.9% 43.5% 2.3% 47.2% -8.7%
UTPB 26.1% 6.8% 49.1% 1.2% 51.7% -2.5%
UTRGV - - - - - -
UTSA 21.7% 11.0% 56.4% 13.3% 59.5% 9.1%
UTT 24.1% -1.6% 57.5% 5.7% 55.1% 0.3%
Graduation rates are for first-time, full-time, degree-seeking undergraduates who begin in the summer/fall of the enrollment year and
graduate within four years from the same institution or six years from the same or another Texas institution. The last two columns refer to
four-year graduation rates of community college transfer students. These four-year transfer rates represent the percentage of first-time
transfer students entering a UT institution with 30 or more semester credit hours who received an undergraduate degree within four years
of enrolling at the same UT institution.
13
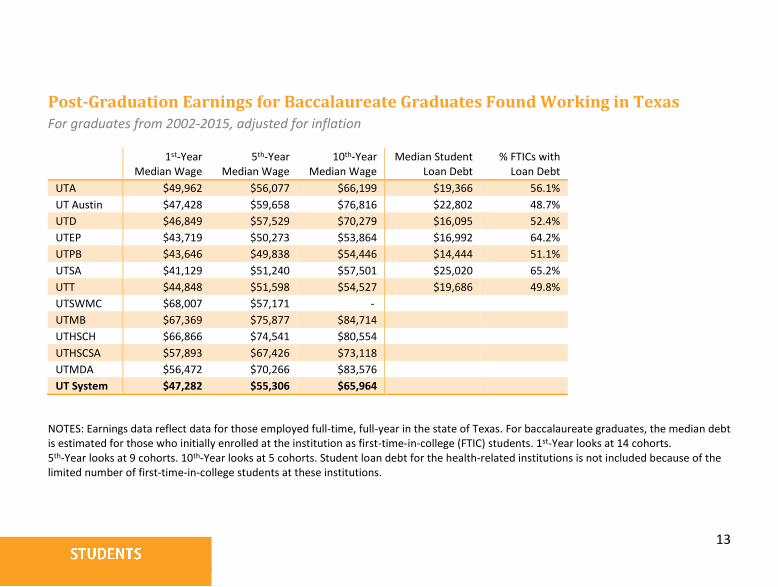
Post-Graduation Earnings for Baccalaureate Graduates Found Working in Texas For graduates from 2002-2015, adjusted for inflation
1st-Year Median Wage
5th-Year Median Wage
10th-Year Median Wage
Median Student Loan Debt
% FTICs with Loan Debt
UTA $49,962 $56,077 $66,199 $19,366 56.1%
UT Austin $47,428 $59,658 $76,816 $22,802 48.7%
UTD $46,849 $57,529 $70,279 $16,095 52.4%
UTEP $43,719 $50,273 $53,864 $16,992 64.2%
UTPB $43,646 $49,838 $54,446 $14,444 51.1%
UTSA $41,129 $51,240 $57,501 $25,020 65.2%
UTT $44,848 $51,598 $54,527 $19,686 49.8%
UTSWMC $68,007 $57,171 -
UTMB $67,369 $75,877 $84,714
UTHSCH $66,866 $74,541 $80,554
UTHSCSA $57,893 $67,426 $73,118
UTMDA $56,472 $70,266 $83,576
UT System $47,282 $55,306 $65,964
NOTES: Earnings data reflect data for those employed full-time, full-year in the state of Texas. For baccalaureate graduates, the median debt is estimated for those who initially enrolled at the institution as first-time-in-college (FTIC) students. 1st-Year looks at 14 cohorts. 5th-Year looks at 9 cohorts. 10th-Year looks at 5 cohorts. Student loan debt for the health-related institutions is not included because of the limited number of first-time-in-college students at these institutions.
14
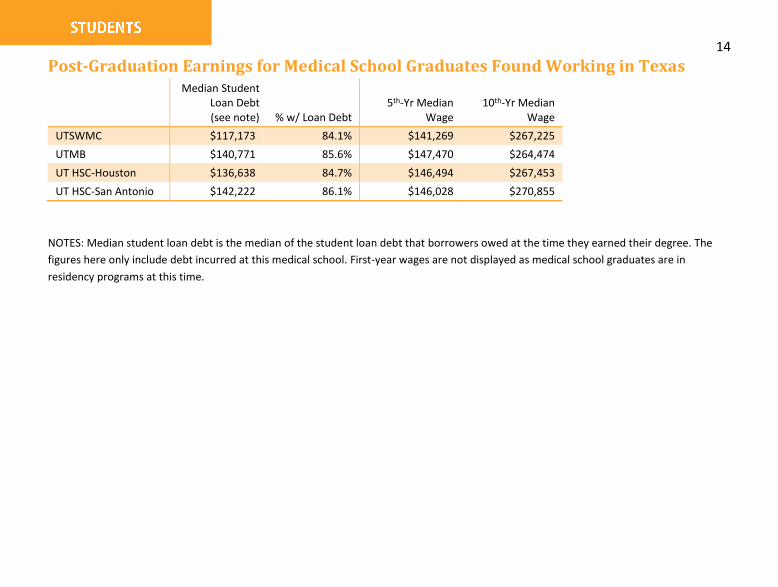
Post-Graduation Earnings for Medical School Graduates Found Working in Texas
Median Student Loan Debt (see note) % w/ Loan Debt
5th-Yr Median Wage
10th-Yr Median Wage
UTSWMC $117,173 84.1% $141,269 $267,225
UTMB $140,771 85.6% $147,470 $264,474
UT HSC-Houston $136,638 84.7% $146,494 $267,453
UT HSC-San Antonio $142,222 86.1% $146,028 $270,855
NOTES: Median student loan debt is the median of the student loan debt that borrowers owed at the time they earned their degree. The
figures here only include debt incurred at this medical school. First-year wages are not displayed as medical school graduates are in
residency programs at this time.
15
Notes
_________________________________________________________________________
_________________________________________________________________________
_________________________________________________________________________
_________________________________________________________________________
_________________________________________________________________________
_________________________________________________________________________
_________________________________________________________________________
_________________________________________________________________________
_________________________________________________________________________
_________________________________________________________________________
_________________________________________________________________________
_________________________________________________________________________
_________________________________________________________________________
_________________________________________________________________________
__________________________________________________________
16
FACULTY / EMPLOYEES
Content
Faculty Headcount by Status .............. 17
Employee Headcount .......................... 18
Faculty Awards and Honors ................ 19
Faculty Appointments ......................... 20
17
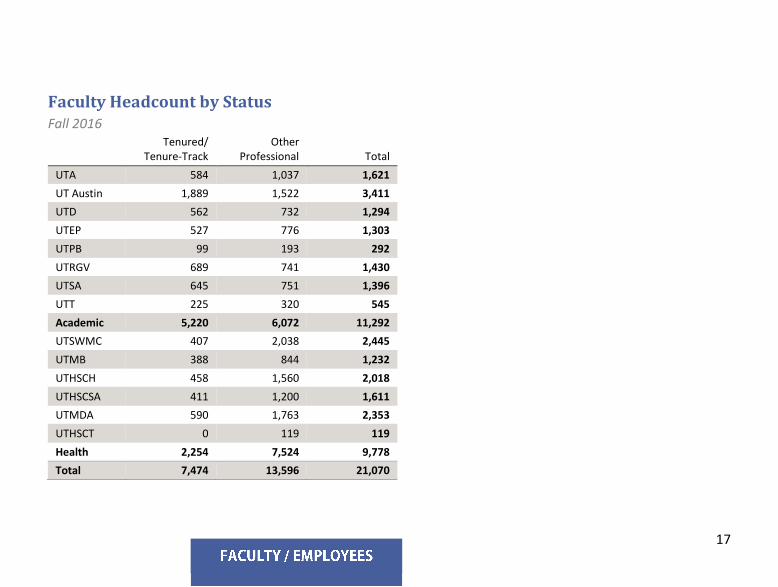
Faculty Headcount by Status Fall 2016
Tenured/ Tenure-Track
Other Professional Total
UTA 584 1,037 1,621
UT Austin 1,889 1,522 3,411
UTD 562 732 1,294
UTEP 527 776 1,303
UTPB 99 193 292
UTRGV 689 741 1,430
UTSA 645 751 1,396
UTT 225 320 545
Academic 5,220 6,072 11,292
UTSWMC 407 2,038 2,445
UTMB 388 844 1,232
UTHSCH 458 1,560 2,018
UTHSCSA 411 1,200 1,611
UTMDA 590 1,763 2,353
UTHSCT 0 119 119
Health 2,254 7,524 9,778
Total 7,474 13,596 21,070
18
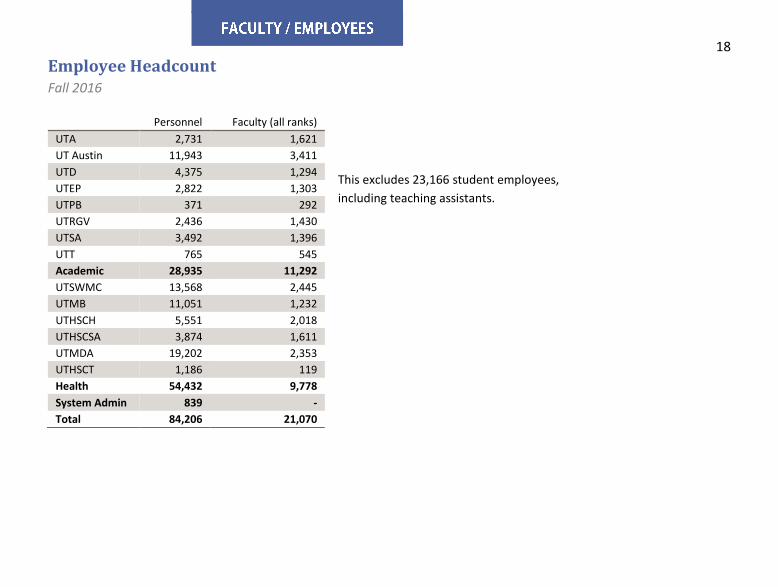
Employee Headcount Fall 2016
This excludes 23,166 student employees,
including teaching assistants.
Personnel Faculty (all ranks)
UTA 2,731 1,621
UT Austin 11,943 3,411
UTD 4,375 1,294
UTEP 2,822 1,303
UTPB 371 292
UTRGV 2,436 1,430
UTSA 3,492 1,396
UTT 765 545
Academic 28,935 11,292
UTSWMC 13,568 2,445
UTMB 11,051 1,232
UTHSCH 5,551 2,018
UTHSCSA 3,874 1,611
UTMDA 19,202 2,353
UTHSCT 1,186 119
Health 54,432 9,778
System Admin 839 -
Total 84,206 21,070
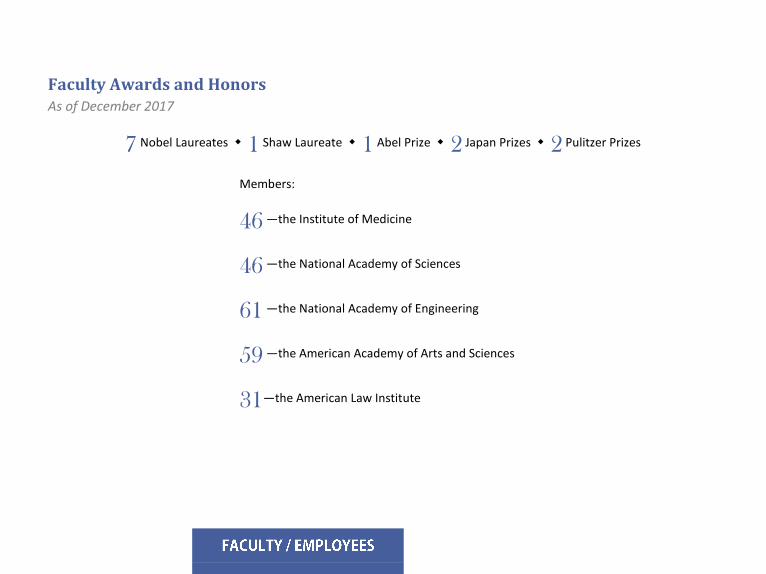
Faculty Awards and Honors As of December 2017
7 Nobel Laureates 1 Shaw Laureate 1 Abel Prize 2 Japan Prizes 2 Pulitzer Prizes
Members:
46 —the Institute of Medicine
46 —the National Academy of Sciences
61 —the National Academy of Engineering
59 —the American Academy of Arts and Sciences
31—the American Law Institute
20
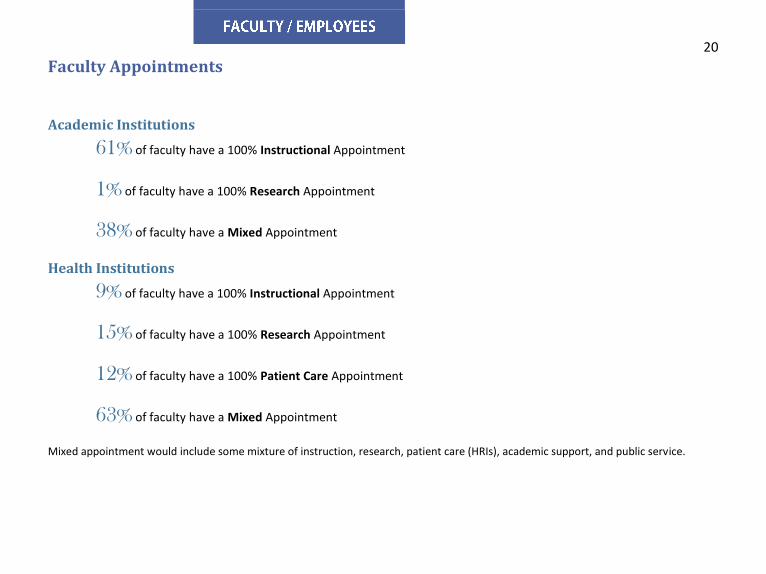
Faculty Appointments
Academic Institutions
61% of faculty have a 100% Instructional Appointment
1% of faculty have a 100% Research Appointment
38% of faculty have a Mixed Appointment
Health Institutions
9% of faculty have a 100% Instructional Appointment
15% of faculty have a 100% Research Appointment
12% of faculty have a 100% Patient Care Appointment
63% of faculty have a Mixed Appointment
Mixed appointment would include some mixture of instruction, research, patient care (HRIs), academic support, and public service.
21
Notes
________________________________________________________________________
________________________________________________________________________
________________________________________________________________________
________________________________________________________________________
________________________________________________________________________
________________________________________________________________________
________________________________________________________________________
________________________________________________________________________
________________________________________________________________________
________________________________________________________________________
________________________________________________________________________
________________________________________________________________________
________________________________________________________________________
________________________________________________________________________
________________________________________________________________________
22
RESEARCH / TECHNOLOGY TRANSFER
Content
Research Expenditures ........... 23
Technology Transfer .............. 25
23
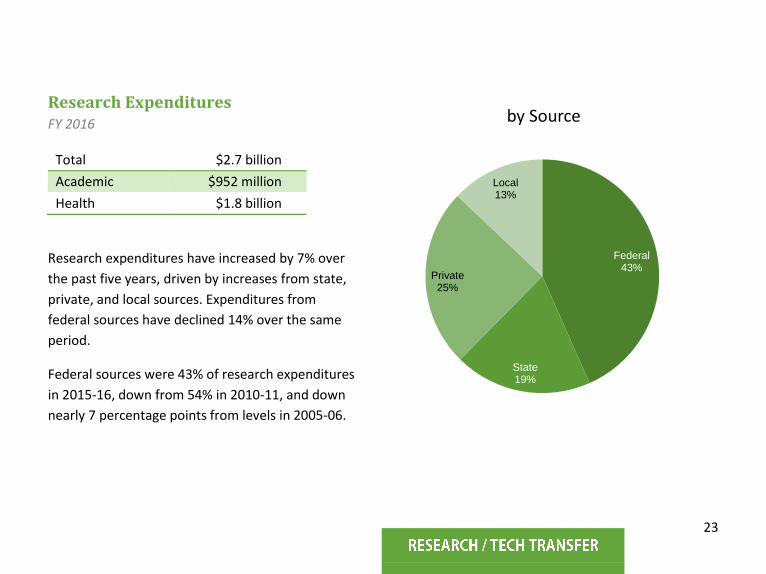
Research Expenditures FY 2016
Total $2.7 billion
Academic $952 million
Health $1.8 billion
Research expenditures have increased by 7% over
the past five years, driven by increases from state,
private, and local sources. Expenditures from
federal sources have declined 14% over the same
period.
Federal sources were 43% of research expenditures
in 2015-16, down from 54% in 2010-11, and down
nearly 7 percentage points from levels in 2005-06.
Federal43%
State19%
Private25%
Local13%
by Source
24
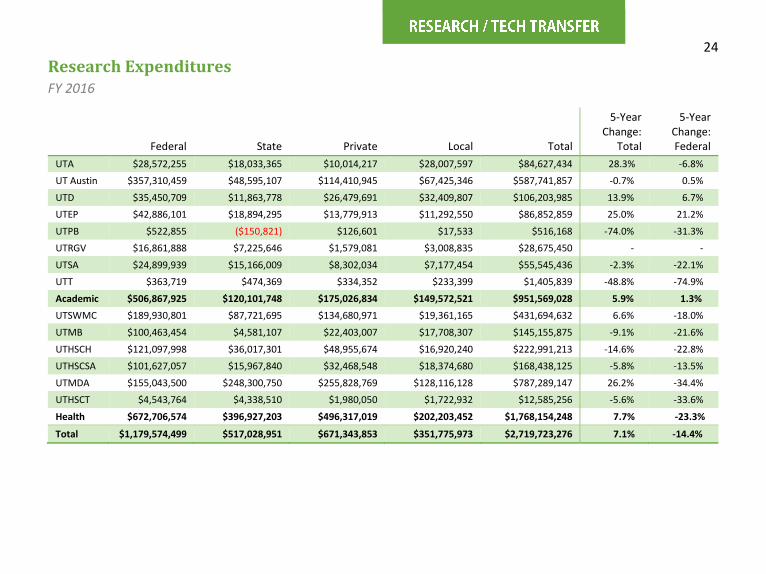
Research Expenditures FY 2016
Federal State Private Local Total
5-Year Change:
Total
5-Year Change: Federal
UTA $28,572,255 $18,033,365 $10,014,217 $28,007,597 $84,627,434 28.3% -6.8%
UT Austin $357,310,459 $48,595,107 $114,410,945 $67,425,346 $587,741,857 -0.7% 0.5%
UTD $35,450,709 $11,863,778 $26,479,691 $32,409,807 $106,203,985 13.9% 6.7%
UTEP $42,886,101 $18,894,295 $13,779,913 $11,292,550 $86,852,859 25.0% 21.2%
UTPB $522,855 ($150,821) $126,601 $17,533 $516,168 -74.0% -31.3%
UTRGV $16,861,888 $7,225,646 $1,579,081 $3,008,835 $28,675,450 - -
UTSA $24,899,939 $15,166,009 $8,302,034 $7,177,454 $55,545,436 -2.3% -22.1%
UTT $363,719 $474,369 $334,352 $233,399 $1,405,839 -48.8% -74.9%
Academic $506,867,925 $120,101,748 $175,026,834 $149,572,521 $951,569,028 5.9% 1.3%
UTSWMC $189,930,801 $87,721,695 $134,680,971 $19,361,165 $431,694,632 6.6% -18.0%
UTMB $100,463,454 $4,581,107 $22,403,007 $17,708,307 $145,155,875 -9.1% -21.6%
UTHSCH $121,097,998 $36,017,301 $48,955,674 $16,920,240 $222,991,213 -14.6% -22.8%
UTHSCSA $101,627,057 $15,967,840 $32,468,548 $18,374,680 $168,438,125 -5.8% -13.5%
UTMDA $155,043,500 $248,300,750 $255,828,769 $128,116,128 $787,289,147 26.2% -34.4%
UTHSCT $4,543,764 $4,338,510 $1,980,050 $1,722,932 $12,585,256 -5.6% -33.6%
Health $672,706,574 $396,927,203 $496,317,019 $202,203,452 $1,768,154,248 7.7% -23.3%
Total $1,179,574,499 $517,028,951 $671,343,853 $351,775,973 $2,719,723,276 7.1% -14.4%
25
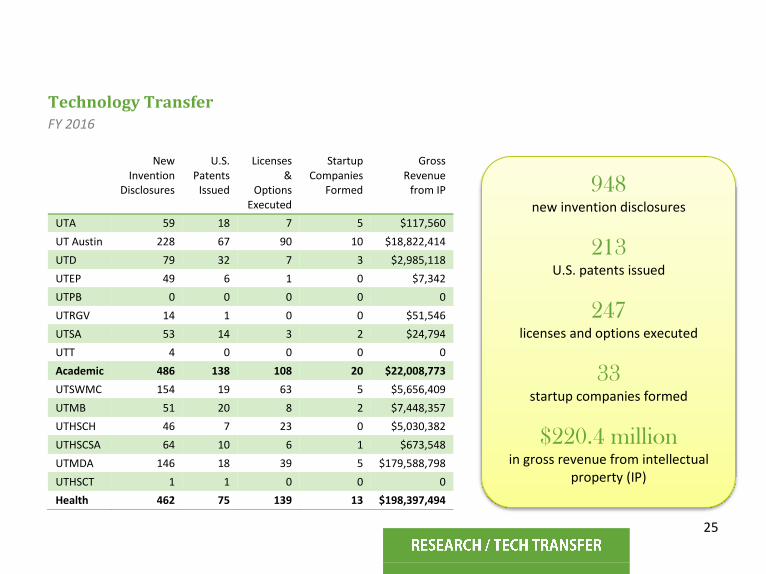
Technology Transfer FY 2016
New Invention
Disclosures
U.S. Patents
Issued
Licenses &
Options Executed
Startup Companies
Formed
Gross Revenue
from IP
UTA 59 18 7 5 $117,560
UT Austin 228 67 90 10 $18,822,414
UTD 79 32 7 3 $2,985,118
UTEP 49 6 1 0 $7,342
UTPB 0 0 0 0 0
UTRGV 14 1 0 0 $51,546
UTSA 53 14 3 2 $24,794
UTT 4 0 0 0 0
Academic 486 138 108 20 $22,008,773
UTSWMC 154 19 63 5 $5,656,409
UTMB 51 20 8 2 $7,448,357
UTHSCH 46 7 23 0 $5,030,382
UTHSCSA 64 10 6 1 $673,548
UTMDA 146 18 39 5 $179,588,798
UTHSCT 1 1 0 0 0
Health 462 75 139 13 $198,397,494
948
new invention disclosures
213
U.S. patents issued
247
licenses and options executed
33
startup companies formed
$220.4 million
in gross revenue from intellectual property (IP)
26
BUDGET / FINANCE
Content
Budget: Revenue ........................................................................ 27
Budget: Expenses ....................................................................... 28
Institutional Budgets .................................................................. 29
Funding Trends - Revenue per FTE Student ............................... 30
Endowment Value and Annual Giving ....................................... 31
Patient Care................................................................................ 32
27
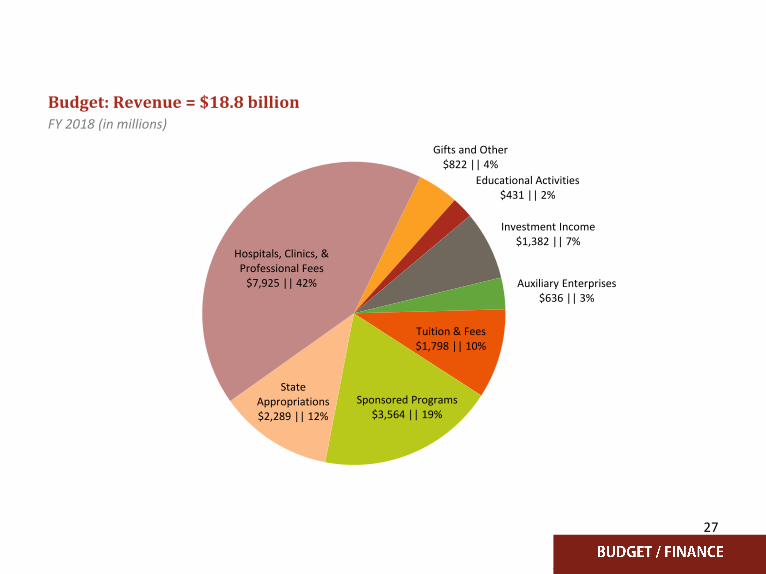
Budget: Revenue = $18.8 billion FY 2018 (in millions)
Gifts and Other$822 || 4%
Educational Activities$431 || 2%
Investment Income$1,382 || 7%
Auxiliary Enterprises$636 || 3%
Tuition & Fees$1,798 || 10%
Sponsored Programs$3,564 || 19%
State Appropriations$2,289 || 12%
Hospitals, Clinics, & Professional Fees
$7,925 || 42%
28
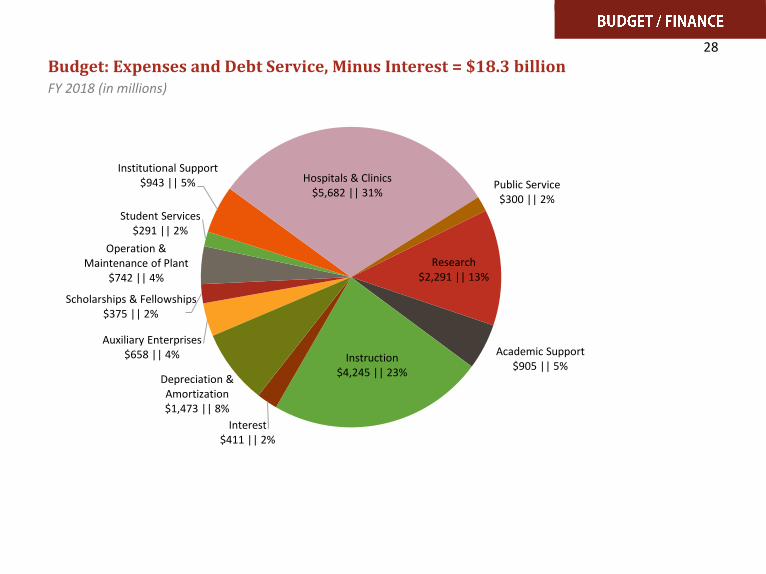
Budget: Expenses and Debt Service, Minus Interest = $18.3 billion FY 2018 (in millions)
Auxiliary Enterprises$658 || 4%
Scholarships & Fellowships$375 || 2%
Operation & Maintenance of Plant
$742 || 4%
Student Services$291 || 2%
Institutional Support$943 || 5% Hospitals & Clinics
$5,682 || 31%Public Service
$300 || 2%
Research$2,291 || 13%
Academic Support$905 || 5%
Instruction$4,245 || 23%
Interest$411 || 2%
Depreciation & Amortization$1,473 || 8%
29
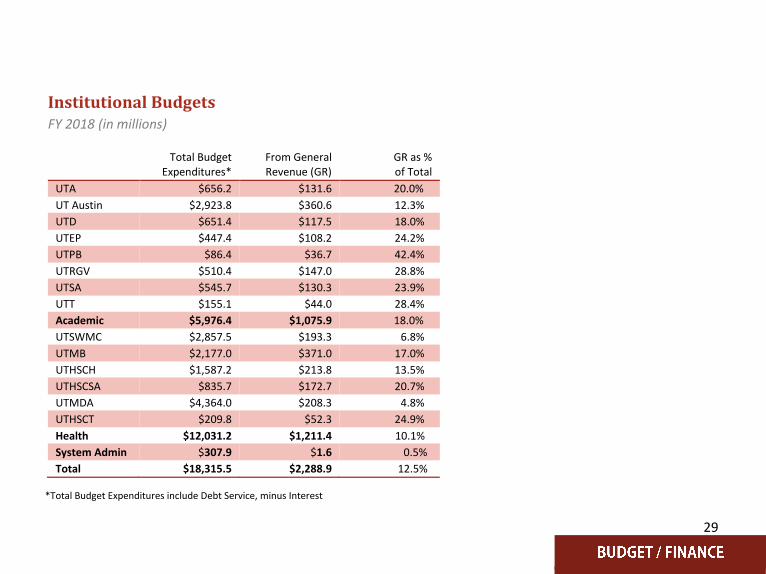
Institutional Budgets FY 2018 (in millions)
Total Budget Expenditures*
From General Revenue (GR)
GR as % of Total
UTA $656.2 $131.6 20.0%
UT Austin $2,923.8 $360.6 12.3%
UTD $651.4 $117.5 18.0%
UTEP $447.4 $108.2 24.2%
UTPB $86.4 $36.7 42.4%
UTRGV $510.4 $147.0 28.8%
UTSA $545.7 $130.3 23.9%
UTT $155.1 $44.0 28.4%
Academic $5,976.4 $1,075.9 18.0%
UTSWMC $2,857.5 $193.3 6.8%
UTMB $2,177.0 $371.0 17.0%
UTHSCH $1,587.2 $213.8 13.5%
UTHSCSA $835.7 $172.7 20.7%
UTMDA $4,364.0 $208.3 4.8%
UTHSCT $209.8 $52.3 24.9%
Health $12,031.2 $1,211.4 10.1%
System Admin $307.9 $1.6 0.5%
Total $18,315.5 $2,288.9 12.5%
*Total Budget Expenditures include Debt Service, minus Interest
30
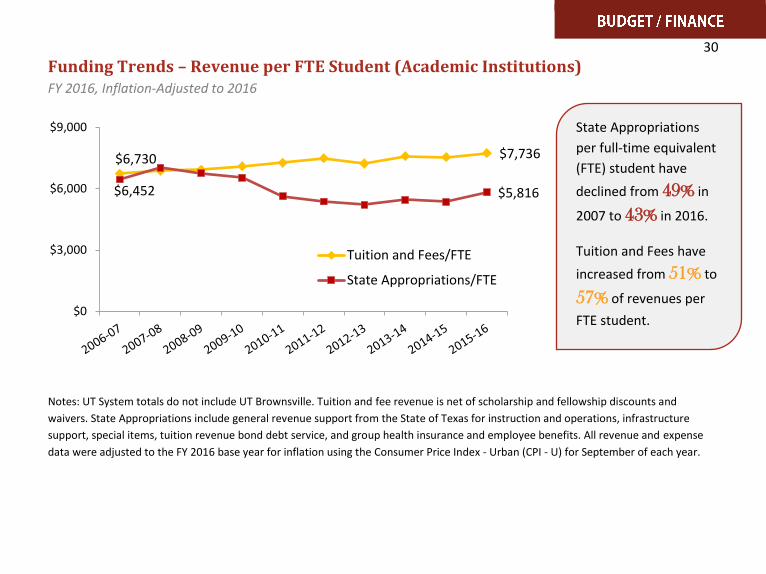
Funding Trends – Revenue per FTE Student (Academic Institutions) FY 2016, Inflation-Adjusted to 2016
Notes: UT System totals do not include UT Brownsville. Tuition and fee revenue is net of scholarship and fellowship discounts and
waivers. State Appropriations include general revenue support from the State of Texas for instruction and operations, infrastructure
support, special items, tuition revenue bond debt service, and group health insurance and employee benefits. All revenue and expense
data were adjusted to the FY 2016 base year for inflation using the Consumer Price Index - Urban (CPI - U) for September of each year.
$6,730 $7,736
$6,452 $5,816
$0
$3,000
$6,000
$9,000
Tuition and Fees/FTE
State Appropriations/FTE
State Appropriations
per full-time equivalent
(FTE) student have
declined from 49% in
2007 to 43% in 2016.
Tuition and Fees have
increased from 51% to
57% of revenues per
FTE student.
31
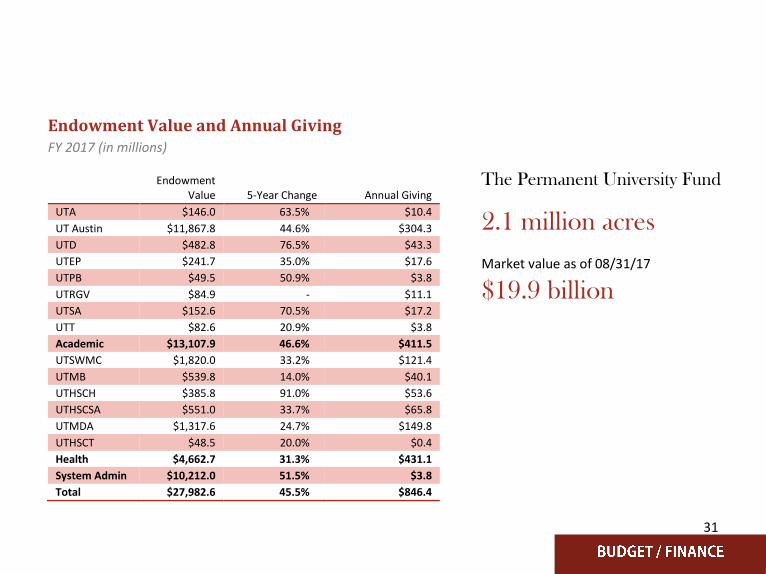
Endowment Value and Annual Giving FY 2017 (in millions)
Endowment Value 5-Year Change Annual Giving
UTA $146.0 63.5% $10.4
UT Austin $11,867.8 44.6% $304.3
UTD $482.8 76.5% $43.3
UTEP $241.7 35.0% $17.6
UTPB $49.5 50.9% $3.8
UTRGV $84.9 - $11.1
UTSA $152.6 70.5% $17.2
UTT $82.6 20.9% $3.8
Academic $13,107.9 46.6% $411.5
UTSWMC $1,820.0 33.2% $121.4
UTMB $539.8 14.0% $40.1
UTHSCH $385.8 91.0% $53.6
UTHSCSA $551.0 33.7% $65.8
UTMDA $1,317.6 24.7% $149.8
UTHSCT $48.5 20.0% $0.4
Health $4,662.7 31.3% $431.1
System Admin $10,212.0 51.5% $3.8
Total $27,982.6 45.5% $846.4
The Permanent University Fund
2.1 million acres
Market value as of 08/31/17
$19.9 billion
32
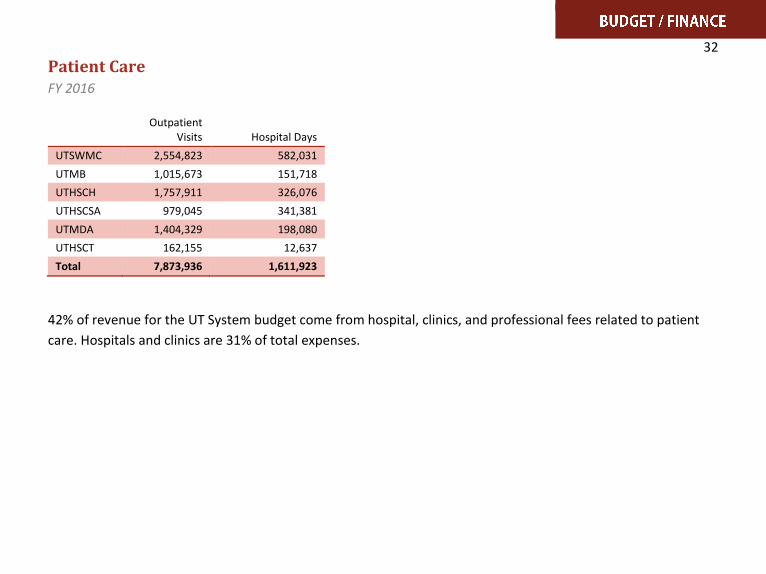
Patient Care FY 2016
Outpatient Visits Hospital Days
UTSWMC 2,554,823 582,031
UTMB 1,015,673 151,718
UTHSCH 1,757,911 326,076
UTHSCSA 979,045 341,381
UTMDA 1,404,329 198,080
UTHSCT 162,155 12,637
Total 7,873,936 1,611,923
42% of revenue for the UT System budget come from hospital, clinics, and professional fees related to patient
care. Hospitals and clinics are 31% of total expenses.

33
Notes
________________________________________________________________________
________________________________________________________________________
________________________________________________________________________
________________________________________________________________________
________________________________________________________________________
________________________________________________________________________
________________________________________________________________________
________________________________________________________________________
________________________________________________________________________
________________________________________________________________________
________________________________________________________________________
________________________________________________________________________
________________________________________________________________________
________________________________________________________________________
_______________________________________________________________________
Additionally, you may also find the following two online resources useful:
seekUT - UT System’s free, online resource for college and
career planning is designed to help students and their families
plan their academic and financial future based on a foundation
of realistic expectations of potential student loan debt and post-
graduation earnings.
https://seekut.utsystem.edu/
UT System Dashboard - a business intelligence system that
includes web-based applications for extracting and analyzing
institutional data. It provides current data, trends over time,
and comparative benchmarking across a variety of metrics in
support of better decision- and policy-making.
https://data.utsystem.edu/