Embed Size (px)
Citation preview


TitlePage
CopyrightPage
Dedication
Foreword
Introduction
PartI:Identifying
andUnderstandingtheTrend
Chapter1:IdentifyingtheMajorTrend
MarketInfluencersandIntermarket

RelationshipsSignificantMarketRatiosOtherIndicatorsConclusion
Chapter2:SectorReviewAnalysis
CaseStudy:SectorRanking
RelativeStrengthConclusion
PartII:TechnicalAnalysisforIdentifyingIndividualStocks
Chapter3:Classical

TechnicalAnalysisSupportandResistancePatternsConclusion
Chapter4:JapaneseCandlestickPatterns
ReversalPatternsContinuation

PatternsIndecisionCandlesConclusion
Chapter5:DerivedandQuantitativeAnalysis
FibonacciAnalysis
HarmonicTradingElliottWaveAndrews’PitchforkConclusion
Chapter6:PriceDerivatives,Momentum,andOther
IndicatorsRelativeStrengthIndex(RSI)MovingAverageConvergence/Divergence(MACD)IndicatorBollingerBandsMovingAverages
Conclusion
Chapter7:TheWatchListandInitialPlan
CreatetheMosaicOtherInformationThePlanConclusion
PartIII:Options

Strategies
Chapter8:IntroductiontoOptions
DefinitionsExpirationandExerciseContractSizePrice

TerminologyWhyUseOptionsHowDifferentfromStockOptionsTablesSomeBasicsAppliedConclusion
Chapter9:Options
CombinationsCoveredCallorBuyWriteLongaPutorCallShortaPutorCallLongaPutSpreadorCallSpread
ShortaPutSpreadorCallSpreadLongaRatioPutorCallSpreadLongorShortaCalendarLongorShortaDiagonalLongorShorta

ButterflyLongorShortaStraddleLongorShortaStrangleLongorShortanIronCondorLongorShortaRiskReversalConclusion

PartIV:DesignandExecution
Chapter10:TheElementsofDesign
TheElementsPositionSizingandStopLossesConclusion
Chapter11:TradingPlan
WhattoLookForConclusion
Chapter12:ExecutionandBeyond
ExecutionHedging,ProfitTaking,and

AdjustmentsConclusion
Conclusion
AdditionalResourcesBooksWebsites
AbouttheCompanion
Website
AbouttheAuthor
Index

TRADINGOPTIONS

Foundedin1807,JohnWiley& Sons is the oldestindependent publishingcompanyintheUnitedStates.With offices in NorthAmerica, Europe, Australia,and Asia, Wiley is globallycommitted to developing andmarketingprintandelectronicproductsand services forour

customers' professional andpersonal knowledge andunderstanding.The Wiley Trading series
featuresbooksbytraderswhohave survived the market'sever changing temperamentand have prospered—someby reinventing systems,others by getting back tobasics. Whether a novicetrader, professional, orsomewhere in-between, these

bookswillprovidetheadviceand strategies needed toprosper today and well intothefuture.Foralistofavailabletitles,
visit our website atwww.WileyFinance.com.

TRADINGOPTIONS

UsingTechnicalAnalysistoDesignWinningTrades
GregHarmon


Coverimage:©BarsoomDesignCoverdesign:©BarsoomDesignCopyright©2014byGregHarmon.Allrightsreserved.PublishedbyJohnWiley&Sons,Inc.,Hoboken,NewJersey.PublishedsimultaneouslyinCanada.Allchartsusedwith
permissionfromTradingView.Allrightsreserved.Nopartofthispublicationmaybereproduced,storedinaretrievalsystem,ortransmittedinanyformorbyanymeans,electronic,mechanical,photocopying,recording,scanning,orotherwise,exceptaspermittedunderSection107or108ofthe1976United
StatesCopyrightAct,withouteitherthepriorwrittenpermissionofthePublisher,orauthorizationthroughpaymentoftheappropriateper-copyfeetotheCopyrightClearanceCenter,Inc.,222RosewoodDrive,Danvers,MA01923,(978)750-8400,fax(978)646-8600,orontheWebatwww.copyright.com.RequeststothePublisherforpermissionshouldbe

addressedtothePermissionsDepartment,JohnWiley&Sons,Inc.,111RiverStreet,Hoboken,NJ07030,(201)748-6011,fax(201)748-6008,oronlineatwww.wiley.com/go/permissionsLimitofLiability/DisclaimerofWarranty:Whilethepublisherandauthorhaveusedtheirbesteffortsinpreparingthisbook,theymakenorepresentationsor

warrantieswithrespecttotheaccuracyorcompletenessofthecontentsofthisbookandspecificallydisclaimanyimpliedwarrantiesofmerchantabilityorfitnessforaparticularpurpose.Nowarrantymaybecreatedorextendedbysalesrepresentativesorwrittensalesmaterials.Theadviceandstrategiescontainedhereinmaynotbesuitablefor
yoursituation.Youshouldconsultwithaprofessionalwhereappropriate.Neitherthepublishernorauthorshallbeliableforanylossofprofitoranyothercommercialdamages,includingbutnotlimitedtospecial,incidental,consequential,orotherdamages.Forgeneralinformationonourotherproductsandservicesorfortechnical
support,pleasecontactourCustomerCareDepartmentwithintheUnitedStatesat(800)762-2974,outsidetheUnitedStatesat(317)572-3993,orfax(317)572-4002.Wileypublishesinavarietyofprintandelectronicformatsandbyprint-on-demand.Somematerialincludedwithstandardprintversionsofthisbookmaynotbeincludedine-booksorin

print-on-demand.IfthisbookreferstomediasuchasaCDorDVDthatisnotincludedintheversionyoupurchased,youmaydownloadthismaterialathttp://booksupport.wiley.com.FormoreinformationaboutWileyproducts,visitwww.wiley.com.LibraryofCongressCataloging-in-PublicationData:

Harmon,Greg.Tradingoptions:usingtechnicalanalysistodesignwinningtrades/GregHarmon.pagescm.–(Wileytradingseries)Includesindex.ISBN978-1-118-67913-5(hardcover);ISBN978-1-118-67912-8(ePDF);ISBN978-1-118-67917-3(ePub)

1.Technicalanalysis(Investmentanalysis)2.Investments.3.Speculation.I.Title.HG4529.H3662014332.64'53–dc232013039744

Iwishtodedicatethisbooktomylovelywife,Christine.
Withoutherlove,supportandencouragement
itneverwouldhavehappened.Andtoourtwo
buddingyoungtechnicalanalysts,
DrewandBronwyn,eversupportiveandalways
learning.

T
FOREWORD
he subject of thiswonderful book is
options, and its theme istechnical analysis. GregHarmon deftly describes andteaches us that the
commonality inbothsubjectsis price. The laws of supplyand demand, or, said anotherway,theinteractionsbetweenbuyers and sellers, dictatewhat the trends and thepatterns of price will be.Trading Options goes on tomeld these trends andpatterns into a top-down andbottom-up approach totrading. The macro or top-down view starts with an
index and works its waythrough a sector, intermarketrelationships (e.g., fixedincome, commodities, etc.),andthentoindividualstocks.Conversely, the micro orbottom-up approachcommences with a singleissue and wends its waythrough intermarket factors,corresponding sectors, and,ending with a marketoverview, via an index. This

is by far the most efficientway to cover themarket andidentifynewoptionableideas.Inpricethereisknowledge.
One trades differentlywhether in a bullish or in abearish trend; for example,certain distinct price andvolume patterns manifestthemselves in a bull marketwhereasquiteoften theexactoppositeoccurswithinabeartrend.Theearlypagesofthis
book help identify thesedistinctions. The timing ofpurchases and sales is onlypartofthetaskrequiredtobea successful trader; thesecondandequally importantconsideration is riskmanagement—when andwheretotakesmalllosses.The universality of
technicalanalysiscomesalivein this book: Gregemphasizes ratio charts that

cover abroadarrayof topics—for example, emergingmarkets,U.S.Treasuries,andsilver/gold; they instantlyexpand one's horizons andtake the reader around theglobe. Nowhere is there aworldwide language ascomprehensive and as easilyaccessible as the charting ofprices. This book should bemandatoryreadingforanyoneinterested in options and its

mutually interdependentsubject,technicalanalysis.Trading Options also
provides the reader with anintegrated system of criticaldisciplines starting withclassical technical analysiswith its ability to identifytrends and myriad importantprice patterns. Then it layerson top of this foundationcandlestick charting with itsunique series of key

reversals; indicators like theRelativeStrengthIndex(RSI)are used to create a baselineof future strength andweakness. Last, it gleansareas of potential buyers(support zones) and potentialsellers (resistance zones)along with meaningful priceobjectivesbyusingFibonacciretracements along withElliott Wave principles andHarmonics. This carefully

laid out technical tapestry isthe mosaic that providesreaders with the ingredientsneeded to create their watchlistsandplansofaction.Now, theoperativeword is
change.GregHarmoninsists,and rightly so, that positionsshould be initiated whenprices actually break aboveresistance or below supportlevels—he refers to thisphenomenon as “triggers.”

Andwhentriggersoccur,youmustapplythecorrectoptionstrategy. Here is where thebook once again truly addsvalue: It explains in-the-money, at-the-money, andout-of-the-moneyoptionsandhow they consist of intrinsicvalue and time value, alongwith 13 differentcombinations of puts andcalls. He then combines theconcepts of the driver,
funding option, and risklimiter into a trading plan.And he finalizes everythingwith the execution andadjustments for profit takingandhedging.I wholeheartedly endorse
Trading Options because itencourages a set ofdisciplines that are soimportant in any kind oftrading; for example, itcautions that prejudging

triggers can often lead to anincorrect call. Now, that'sverysoundadvice!
—RalphAcampora

H
INTRODUCTION
Luck is what happenswhen preparation meetsopportunity.
—Senecaow did Seneca, nearly2,000 years ago, have

the key to success in nearlyeveryendeavor in theworld?We have heard it a thousandtimes: be prepared and workhard. This is how you giveyourself the opportunity tosucceed.Sooftenwe seek toshortcut this process and getto the prize more quickly.Why do we think thisapproach can be successful?Malcolm Gladwell has therule of 10,000 hours. He

states that it takes 10,000hours of preparation to begreat at something. So whydo you hear people so oftenattribute theirsuccess to luckwhen it is preparation that isthekey?Andwhydotheynotspend more time talkingabout how they went aboutpreparing, so that when luckpresented itself they couldseize the opportunity?Whether you are preparing
for an Olympic competition,to lead a country, to start anew business, or even to dosomething as mundane astrading stocks and options,theseconceptsapply.Thisbookisaboutprocess,
myprocess.Theprocess thatI repeat every week. Theprocess that I have laid bareonsocialmediaoverthepastfour years. The process oftrading stocks and options,

using technical analysis. It isnot glamorous, but a cold,definedprocessbuiltupovertime to be prepared tosucceed in trading when theopportunity presents itself. Iam a self-proclaimed top-down technician.Thatmeansthat I start with the macropicture and work my waydown to specific ideas. EachweekIstartwiththisprocessat 4:30 Friday afternoon just

minutes after the marketcloses, and drill down fromthe broad end to the finedetail to be prepared forMonday morning at 9:30when the market opens.Every week. This book iswritten in that manner aswell.Itiswritteninfourpartsthat act as building blocks,starting with the broad endthat can help you be betterprepared for any type of

trading or investing, andworking down to the fineedgethatisspecifictotradingoptions using technical tools.There is something for everytype of trader and investorhere.I am an old-school
technician. I look at charts. Ilook at a lot of charts. Myuniverse is more than 1,000stocks,andIlookateachoneatleastonceperweek.There

are many scanning tools andcharting packages that canautomatically cut the listdownandgiveyoujustafewnames to look at. There isnothingwrongwiththatstyleof analysis; it is just not theway I work; it is not oldschool. I like to look at theprice action myself. Manywill think it is crazy, but itgives me an edge in severalways.First,itkeepsmyskills
sharp. Second, I have theopportunity to see a nuancethat a scanning toolmay notpick up and to see the onesthat are close but miss thescans.Finally,itgivesmetheedge to react quickly in achanging market withoutwaitingforthescantonarrowthings down for me. Thisbook iswritten from theold-school perspective, but theconcepts are valid no matter

how you select your targetsfortrading.Itisworthnotingthatmostofthechartsusedasillustrations come from the2011 to 2013 time period.This was a very bullish timeinthemarket,andbecauseofthat the illustrations forbullish patterns and reversalsare often stronger than forbearishones.Whenit ishardto find long-term bearishpatterns and reversals, that is
a sign of a strong bullishmarket trend. Also, the timeframe matters. This book iswritten from the perspectiveof a swing trader or positiontraderwhoholdsastockforafewdaystoafewweeks,butthe concepts are equallyapplied today tradingon theshorter end and investing onthelongerend.PartIgivesyouthetoolsto
identify the trend and what
might change it. This is animportant first step. Ninety-nine percent of investorswouldbebetterpreparedifalltheyeverreadwerejustthesefew pages, as most stockstrade in the direction of theprevailing trend.Part IIdrillsdownfurtherintothetoolstoselectspecificsecurities.Thisis where the meat of thetechnical analysis is found.This isnot likewhatyousee

on television or you hearfromyourbrokerorwhatyoulearned in business school.There will be no balancesheet analyses or price-earnings (P/E) ratiosorotheraccounting metrics involved,just price analysis usingtradingconcepts formedoverhundreds of years ofpractitioners. There will bejust an interpretationofpriceactionwith simple illustrated
rules thatprofessional tradersuseeveryday,presentedinaneasy-to-understand way withlotsofpicturesandexamples.Part III starts the explorationof options, but don’t worry.There will be no complexdiscussions of the Greeks(delta, gamma, theta, etc.) orBlack-Scholes pricingmodels, but just simpledescriptionsof the toolsusedandhowtheywork,writtenin

plain English. Maybe it willhelp demystify some of thejargon in the optionsmarket.Finally,PartIVputsthesealltogether to show how todesign specific trades,execute them, and makeadjustmentswhennecessary.Thisbookwaswrittentobe
used as a learning tool and areference.Asyoumakeyourway through it, the bookgives you knowledge to
improve as you go along. Itcanbereadandprocessedallat once or in pieces with apause for some time topractice what you arelearning. The processdescribedisalotlikepeelingan onion.The deeper you gointoitandthebook,themoredetail you will find and themore you will get out of it.You can use this book inmany ways, like peeling
layers of that onion as well.The first part, on identifyingthemajor trend,hasa simpleconcept as its basis. If youcan identify the trend, youknow which way 70 percentor more of the stocks in themarket are going to moveovertime.Withtheability todetermine the trend, you canvastly improve your tradingand investment decisions.There are many tools to use
to do this, and they are laidout for you to explore.Withthis ability in hand, you canstop reading and trade orinvestusingthebroadmarketindexes and be successful.But why stop there? Peelinganother layer down to thesector analysis allows you tomovebeyondthemajorindexexchange-traded funds(ETFs) and into the specificsectors that are driving the

trend. Look at it as movingfrom trading five indexes toaddingninesectorsaswell.Ifunderstandingthepriceactionof the indexes gets you 70percentofthewaythere,thenthis layer gives you another10percent.These twopiecesshould put you light-yearsahead of the majority ofinvestors and traders inunderstanding how theindexes and broad markets

operate.IfyoucontinueontoPartII
and the chapters on securityselection, your understandinggoes up another 5 to 10percent again. Not only willtradersusethetoolsfromthefirst two chapters (Part I) toidentifythespecificstockstotrade or invest in, but theywill also get exposure to amuchlargerboxoftoolsthanin the first two chapters.
There are practical examplesof traditional technicalanalysis and patternrecognition as well as anintroduction to technicalmethods like Fibonaccianalysis, Harmonics, andElliott Wave principles. Ifthat is not enough, keepreading to learn aboutmethods using derivatives ofprice like moving averages,momentum indicators and

oscillators, and volatility.Allofthesetoolscanthenalsobeapplied back to yourunderstanding of the indexesand sectors from earlier,creating a sort of feedbackloop to continue to practicethe art.This secondpart alsodiscusses how outsideinfluences like news or highshort interest may influencetheuseofagreattradesetup.With the added tools and

knowledge, you will now beable to identify individualsecurities to trade, regardlessofwhetheryougoontolearnto use options to createtrades.Fortradersorinvestorswho
are then looking to up theirgame a notch by using theleverage and riskmanagement characteristicsprovidedbyoptions, thenextlayerof theonioncangive it

to them.Part IIIstartswithastraightforward discussion ofthebasicsofoptionsfollowedby practical applications anddescriptions of some moreadvancedstrategies.Thispartis written for optionsbeginnersbuthascontentthatmany professionals use. Thedifference is that it ispresented in amanner that iseasy to understand without aPhD in mathematics or
engineering. There are norequirements to calculatetheoreticalvalues. Inkeepingwith the technical analysistradition of observing price,not deriving it, you will usethe prices of options indesigningtradesbasedonthetechnicalanalysisofthestock—not based on the impliedvolatility, gamma, delta, orany other Greek. Sure, youwillgetanoverviewofeach,

but the nuances of tradingoptions off of impliedvolatility are for peopletrading with computermodels. Youwill be lookingat pictures. When you havecompleted the optionschapters,youwillunderstandyetanother layerof thepriceaction. Even if you are aseasoned optionsprofessional, you may seesomethingnewinthispart,as

it is lookingat optionsbasedonhow they fit the technicalanalysis and not based ontheirfairvalue.The final part will show
youhowtoputitalltogetherinto a trading plan completewithproperriskmanagement,including position sizing,hedging,andprofittakingforthe securities you now knowhowtoidentifytotrade.Youwill be able to understand

how to look at options anddetermine the driver in thetrade as well as the optionsthat are used to manage riskand finance the trade.For allthe value in the first threeparts of the book onidentifying the trend,selecting the propersecurities, andemploying thebest combination of optionstotakeadvantageofthetradesetup, this may be the most

important part. Without theproper risk management andposition sizing, a trade thatgoes against you can turnfrom a small hit to yourportfolio into a total disaster.If you keep the hits small,that iswinning asmuch as atrade that goes your way.Winning is defined not asbeingrightbut insteadasnotlosingeverythingorsomuchthat you cannot try again the

nextday.Thispart hasvaluefor at least 95 percent of thetraders and investors I havecomeacross.Itcanbereadasa stand-alone part like theprevious three but reallywraps up the process. Afterreading this part, you are asfarintotheonionasisneededtohaveagoodintroductiontotheprocessofusingtechnicalanalysis to develop winningoptionstrades.

This book can be used byeveryone. You don’t believeme?Evenifallyouhaveisa401(k) that allows you tochooseamongastockfund,abond fund, and cash, it isuseful. Identifying the trendinstocksandbonds,usingthefirst chapter, can put you inthe right fund at the righttime.Areyouallowed touseETFs?Thenmovingontothechapteronsectoranalysiscan

help you identify whichsector and ETFs to choosethatwillmovewiththetrend.If your 401(k) allows you tobuy individual stocks, thenyou can use the tools andconcepts in Part II to helpfindspecificstockstohold.Ifyou have a separatebrokerageaccountthatallowsmargin and options, then thethird part can help leverageyour ideas using proper risk

managementthroughoptions.Fundamental traderscangainan understanding of theproper entry or exit on ashort-termor long-termbasisto fit their fundamental caseor develop strategies toprotect gains against theback-and-forth of the marketto improve their ideas. Theprofessional technical tradercan gain an introduction intohow these concepts can be

used to develop a trade thatuseslesscash,hasproperriskmanagement, and appliesmoreleveragethanjustusingthe stock as a tradinginstrument. And the optionstrader can learn how todevelopanduseoptionsoffatechnical setup. From noviceto expert, there is somethingforeveryone.Asatechnical trader,I like
pictures. I look at thousands

of them every week in theform of stock price charts.Therearealotofpricechartsand examples of theseconcepts in this book as youread through it to make iteasier to see the concepts inaction.Thechartsinthebookarealsomadeavailableinfullcolor on the book’scompanionwebsite.You canfind information on how toaccess this website at the

back of this book. Don’t bescared;picturestrumpwords.You will start to see thesepatternsandtechniquesinthecharts in time without thelines drawn. You may alsosee more technical setupsthan are discussed with eachexample.That isgood,anditbringsupan importantpoint.Technicalanalysisisasmuchanartas it isasciencewhenpracticed properly. As you
learn how to identify levelsandpricesthataresignificant,you must keep this in mind.There is no absoluteboundary for a pricemovement. Prices canovershoot and come back orstop just before or just afteryour targets. Most of thedetractors from technicalanalysis fail to understandthis point. If you look attechnical analysis as a hard-

and-fastsetofrules,thenyouwill be wrong most of thetime and think that it is abunch of voodoo or hocus-pocus. Technical analysisshows what could be andwhere prices have hadprevious history. That is it.Look at it as creating pointsof reflection, not points ofinflection, and you will dowellusing technical analysis,whether you are trading
indexes, sectors, stocks, oroptions.If you want thousands of
pages of detailedexplanations, you can findthem in the additionalresources listed at the end ofthe book. I urge you to seekthem out and expand yourpersonal knowledge base.You can never fully learneverything. Also, despite theopening quote from Seneca

andthereferencetoMalcolmGladwell, this book isintended to be accessible,written in plain English, andusable by everybody on theplanet, not just theexperienced trader. Everyoneneeds to know how to bebetter prepared to trade andinvest so that they can getlucky, too. There are manywaystoaccomplishthis.Thisismy process. Come on and

joinme.

PARTI

W
IDENTIFYINGAND
UNDERSTANDINGTHETREND
e will get to theoptions part of the
book(trustme),butfirstthereis some groundwork to layout. Options are derivatives

and are based on stock andindex prices, so it is firstnecessarytounderstandthosestockandindexpricesfromatechnical perspective beforelooking for an options trade.Theprimarygoaloftechnicalanalysis is to identify themajor trend. What does thatmean? It simply meansknowing the direction of themajor market indexes. Youhear about the Dow Jones

IndustrialAverage (DJIA) orDow 30 in the news all thetime. This is one of thoseindexes. The others are theStandard & Poor’s (S&P)500, Russell 2000, andNASDAQ-100.Despiteallofthe mainstream mediaattention to theDJIA, tradersand investors rely on theother indexes much more astheyarebroadbased andnotfocused on a narrow set of
only30companies.Themostliquid and heavily traded ofthese is the S&P 500, and Iwillfocusonthat.These indexes are
influenced by many outsidefactors andmarkets. It is notenough solely to determinethe direction of the majortrend. To be prepared totrade, you must alsounderstand what caninfluence that trendandhow.

A thorough analysis leaves atraderorinvestorpreparedforanything. Indexes are bydefinition made up ofconstituent parts. The S&P500 is comprised of 500stocks, the Russell 2000 ismadeupof2,000stocks,andthe NASDAQ-100 is acollectionof100stocks.Youcouldjumprightdowntotheindividual pieces in eachindex to seewhere theymay

impactthebiggerpicture.Butanalystsgroupthemintoninesectors, which can bereviewedmuchmore quicklytogetaheadstart.Inthispartofthebookyou
will learnhowtoidentifythemajor trend and whatinfluences it. You will thenexplore thesectors,one layerdeeper into the onion of themarketstructure,toseewhereto focus. With this process

mastered, you will be readyto make the biggest decisionofyour investingand tradinglife:Whichwaythemarketismoving, and how you willusethatinformation.

CHAPTER1
T
IdentifyingtheMajorTrend
his chapter explores thetools used to determine
themajor trendinthemarketand what large-scale outsidefactors may change it andhow. By the end of this
chapteryoushouldbeabletoidentify themajor trend on achartandbegintounderstandhow other markets canchangethattrend.Whydoweneedtoidentify
thetrendinthefirstplace?Ifyou consider that the fourlarge indexes listedpreviously hold 2,630 stocksand the vast majority of themarket capitalization of theentiremarket,theyareagood

approximation for thedirection of all stocks.Identifying the trend, then, islike knowing which way thewindisblowingwhenyouareraking leaves or which waythecurrentflowsintheriver.No matter which individualleafyouaretryingtopickup,itwill be blownby the samebreeze to some extent. Ithelpstodosomeoftheworkwith the wind behind you,

and it is easier tomoveyourboatdownstreamthanagainstthe current. Trading orinvestingwiththedirectionofthe trend is the same. Thetrendhelpsgiveeverystockatailwind tosomeextent.Thatmakes sense, right? If theStandard&Poor’s(S&P)500is going up, then on averageall500stocksincludedintheindexarealsogoingup.Ifalloftheotherindexesarerising

as well, then there are, onaverage,2,630stocksthatarerising.However,weknow inpractice that not all stocksmove in the direction of themajor trend all the time. Infact, the indexes themselvesmay move against the trendfor periods of time withoutchanging the trend. But thedefinitionofthetrendissuchthat if it is determined to bemoving higher, then the vast

majorityofstockswillalsobemovinghigher.At theendofany analysis you want to bechoosing stocksor sectors orindexes that aremovingwiththetrendtotradeorinvestin.Think about it this way.Which has an easier way oflife:adolphinridingthewaveor the salmon trying to swimupstream?Doyouwanttobethe salmon swimmingupstream or the dolphin

ridingthewave?Tradingandinvesting are hard, so try tomake it as easy as it can be.And for simplicity Iwill usethe S&P 500 to illustrate allindexes.WhenIrefer to thetrend,I
mean the major direction ofprices. That is, are pricesgoingup,down,orsideways?It really is that simple.Well,itiseasytowritethatatleast.Inpracticeitisnotalwaysso

simple. Take a look at thechart in Figure 1.1 of theprices of the S&P 500 fromthepast20years.
FIGURE1.120-YearMonthlyS&P500

Which way is the trend?There are many answers tothat question from thispicture. From 2009 through2013 the S&P trend washigher.Butin2008and2009

itwasdown.And from1997through to 2013 it wassideways, albeit in a verybroad channel. Looking at atighter picture of weeklyprices in Figure 1.2, theupward trend from 2009 to2013 is noticeable, but youcan also see that from ApriltoJuly2010andfromJulytoOctober 2011 the trend wasdown,with sideways periodsfrom May until September
2010 and January throughJuly 2011. And if you zoomin further to the daily timeframe shown in Figure 1.3,there is a clear upward trendhigher from mid-November2012untilmid-May2013buta downtrend from mid-October to mid-November2012. We could continue todrill down further to the 30-minute, 15-minute, and even5-minute price charts where
each plot represents only 5minutes of price action.Which gives the rightanswer?
FIGURE1.22009–2013WeeklyS&P500
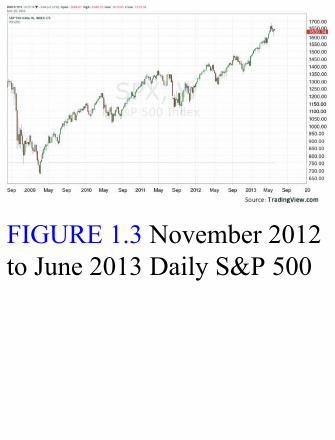
FIGURE1.3November2012toJune2013DailyS&P500

What is clear is that thetimeframeofyourtradingorinvesting matters. Also, thetrendcanchangemanytimes.Asaninvestorholdingstocksfor weeks or months at a

time, it is not necessary tolook any closer than theweeklycharts.Theywillgiveyou enough information andfilter out the daily noise. Atrader holding much shorter-term positions may want tofocus on the daily and evenshorter charts. How youdetermine where you focusyouranalysisshouldbebasedonhowmuchtimeduringtheday you have to devote to

managing your trades, yourrisk tolerance and returnexpectations, and thedirection of the trend. If youcan spend only 30minutes adayandareinvestingforlongperiods of time, then theweeklytimeframeisforyou.If you are sitting all daystaring at your brokerageaccountwithyourexpendablecash, then maybe you canfocusonashortertimeframe.

As a swing trader holdingpositionsforafewdaysuptoacoupleofweeksonaverage,I spend my time looking atdaily charts and occasionallyweeklycharts.Iwillbeusingdailychartsfortherestofthisbook.Daytraderswilllookatdaily charts to identify thetrend,butthenuseshorter30-minute or even 5-minutecharts of price action todeterminetheirentryandexit

points.When you determine your
timeframe,itisalsousefultolook at the next larger timeframetoseehowthetrendinyourcontextfitswiththenextbroaderview.Pricechartsarecontinuous, so the priceaction at a 30-minute levelmay give a signal that achange might be about tohappen in the daily charts.Theoppositemightbetrueas

well; a daily chart may beshowing a potential for atrend change that does notshowup in theweekly chart,for example. Having theperspectives from thedifferent time frames isimportant.With the indexes and time
frames determined, the nexttask is to identify thedirection of the trend. Let’sstart by assuming it is

obvious and, as in theNovember2012toMay2013timeperiod,upward.Ifthatisthecase,thenwecanquicklyshift to the rest of the worldto determine what mightchangeit.
ReadingtheChart
AllofthechartsinthisbookuseJapanesecandlesticks.Thereareotherchartingmethodsaswell.ThepricebarsshowninFigure1.4,used

inbarcharts,arewhatmostpeoplearefamiliarwithiftheyhavebeenlookingatcharts.Pricebarsarereadfromlefttoright.Thenubstickingouttotheleftistheopeningpriceoftheperiod,andthenubstickingouttotherightistheclosingprice.Mostbarchartsareallthesamecolor,solidblack,sothereisnodistinctionbetweenanupwardpriceperiodandadownwardpriceperiodwithoutacloseexaminationofthenubs.Thetwoendsofthebardesignatetherangefortheday—thehighandthelowprices.Japanesecandlesticksareverysimilarbutalsocomewithcolor
codingtomakethemeasytoreadataquickglance.ThesametwoperiodsinaJapanesecandlestickchartareshowninFigure1.5.Noticethatthechangefortheperiod(thedifferencebetweentheopenandclose)isreadilyidentifiedbythecolored(shaded)segment.Thisiscalledtherealbody.Itiseasytoseeataglancewhetherthestockmovedmoreorlessthanthepriordayfromopentoclose—thatis,whetherithadabigrangeoralittlerange.However,thefullrangeforthedayincludestheupperandlowershadowsaswell.Thesearetheneedlelikelinesthatextendoutof

therealbody.Theshadowscanalsoconveyinformationataglance.Theexistenceofsmallornoshadowsimpliesthatthestockhadastrongmovementduringthedayfromopentoclose.Theexistenceoflongshadowsimpliesthatithadareversalintraday,retracingfromtheextreme.Thecoloroftherealbodyalsoconveysinformationquicklyonthecomputerscreen.Agreencandle(ormoretraditionallyablackoutlinewithahollowinterior,makingawhitecandle)designatesaperiodwhenthepricemovedhigher,andared(orlighter)candledesignatesa

periodwhenitmovedlower.Therearealsotwospecialcandlecolors.Ifthepriceclosesabovethepreviouscandlebuttheintradaypricemovementwaslower(i.e.,itstartedhighandfellbutnotbelowthepreviousclose),thenthecandleismadesolidblack.Thisshowsataglancethatthestockclosedhigherthanthelastperiodbuthaddownwardpriceactionthroughouttheperiod.Theotherisahollowredcandle,whichwouldbeprintediftheclosingpriceisbelowthepreviousclosebuttheintradaypricemovementwashigher.SowithJapanesecandlesticksitis

easytoseethreethingsataglance:theopenandcloserangeagainstthefullrangefortheperiod,whetherthepricemovementwaspositiveornegative,andtherelativestrengthoftheperiod’smove.
FIGURE1.4PriceBarsforBarChart


FIGURE1.5JapaneseCandlesticks


■MarketInfluencersandIntermarketRelationshipsArmed with the knowledgethat the S&P 500, Russell2000, andNASDAQ-100 are
themostimportantindexes,itis easy to follow these andcollect price data using theETFsS&P500SPDR(ticker:SPY), Russell 2000 iShares(ticker: IWM), andPowerShares QQQ Trust(ticker:QQQ).Asmentionedbefore, it can sometimes bevery easy to determine thetrend. If the index is risingandhasbeen rising for sometime, the trend ishigher. If it

has been moving sidewaysfor six months, then it isneutral or said to beconsolidating; and if it hasbeenfalling,thenthetrendislower. It does not take adegree in anything torecognizea longtrendinonedirection. But just becausethis part is easy does notmeanthatyourworkisdone.When the trend is easy todetermine, it becomes more
importanttounderstandthoseoutside forces and marketsthat affect the trend. Thesemay not always lead orinfluence the U.S. equityindexes,buttheyaretheonesthat can change thingsquickly if they experience ashock. There are countlessexamples of markets thathave an impact on the U.S.markets,butIliketofocusonseven: gold, crude oil, the
U.S. Dollar Index, U.S.Treasurybonds,theShanghaiComposite Index, emergingmarkets, and the ChicagoBoard Options ExchangeMarket Volatility Index. Ichecktheseonaweeklybasistohelpdiscerntheirpotentialto move markets. Smallmovements generally do nothave a big impact, so I amlooking for the potential foroutsized moves that either
have happened or mayhappen.This isdone througha direct review of the priceaction (charts) of eachinfluencer.Gold is known both as a
store of real value andmeasureof inflationandasavehicle in which to placewealth during times ofuncertainty, likewarorothercrisis. It is one of the mostheavily traded commodities

andcertainlyoneof themostcontroversial.Intheoryithasno actual intrinsic value, yetithascastaspelloverpeopleforthousandsofyears.Atonepoint it backed the majorcurrencies of the world, butnowitjustsitsintheformofbars in the vaults of banksdeep underground. Someparts of the world find goldmore important than others,and some give it almost a

religiousconnotation.Ittendsto gain in importance duringtimes of political uncertaintyor social unrest as a safehaven. It also gainsimportance in times whenpaper currency is beingdebased quickly throughinflation. A shock higher ingold has at times led to orconfirmed higher equityprices,asitdidwiththeonsetof quantitative easing during

the recent financial crisis.Conversely, during times ofdeflationitmaybeasignaltothemarketsandraisetheriskof a potential downturn.Examining the chart for goldprices can give clues tochanges in its trend thatmaylead to changes in the broadindexes.Crude oil is another
measure of inflation, as ahardasset.Youcanuseeither

West Texas IntermediateCrude (WTIC) or Brent tolook for an impact. A signalthat the price of crude oil isgoinghighercanmeanmanythings. It can be bullish forequity prices if it is notassociated with a potentialshortage, like from awar, asit shows increased demandfor power and thus anexpected robust economy. Itcanalsomeanrisinginflation,
so the relationship with goldis important. A falling crudeoilpricecanalsobegoodforthe economy and thus stockprices, as it will reduce thecostofgasolineandinputstoconsumer products.Following thecrudeoil chartcan often give a heads-up asto what may happen toequities.The U.S. Dollar Index has
long been thought to be
inversely correlated withequitymarkets.As thedollarstrengthens, equities usuallyfallandviceversa.Butthisisnotalways thecase.The twocan trend together for longperiods of time, when thedollar is appreciating mainlydue to weakening worldeconomies outside of theUnited States or thoseeconomies depreciating theircurrencies,asishappeningin
the2012to2013timeframe.The U.S. Dollar Index isheavily weighted toward theeuro (over 50 percent) butalso has a large allocation tothe Japanese yen, Britishpound, and Canadian dollar.So extreme currency movesin thosecountriescan impactthe U.S. Dollar Index andthusU.S.equities.U.S. Treasuries are also
normally inversely correlated

with U.S. equities. So astrong move higher inTreasury prices (fallingTreasury yields) often leadsto falling equity prices. Butlike theU.S.dollar,Treasuryprices canmove in the samedirection as equity prices forlong periods of time. Thistendstobetruewhenashockhappens to Treasury prices.From the chart in Figure 1.6you can see that in general

Treasuries and equitiesmovedhighertogetherduringthe period between 2003 and2008. But spikes inTreasuries in 2009, 2010,2012,and2013havechangedthat relationship for periodsoftime.Also,amajorshiftininterest rates over a longperiod of time can vastlyimpact equity indexes, as itcan lead to a reallocation offunds, away from Treasuries

and into stocks, or the otherwayaround.
FIGURE1.6SPYversusTLTWeeklysince2003
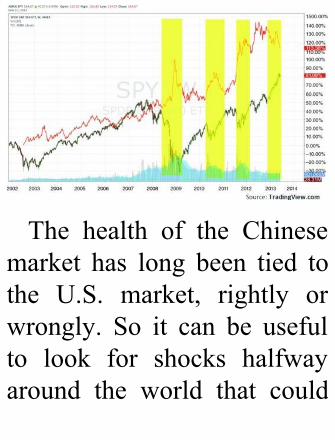
The health of the Chinesemarket has long been tied tothe U.S. market, rightly orwrongly. So it can be usefulto look for shocks halfwayaround the world that could
impactmarketshereathome.With the intertwined tradebetween the countries, this iseasy to understand. A strongChinese market can signalgrowth in the country anddemand for U.S. commodityconsumer products. Weakgrowth and a weak stockmarket can drag down theworld economy and, ifsubstantial enough, impactequityindexprices.Sincethe
bottom in theU.S.market in2009,theChinesemarkethasbeen negatively correlated,with a fall in the ShanghaiComposite being positive forU.S.equities.Perhapsalittlelessobvious
is the relationship betweenemergingmarketequitiesandthe U.S. equity market.Strengthinemergingmarketsis seen as a measure of risktaking. This is a positive for
U.S.equities,astheyarealsodeemed to be risky assets.U.S. equities can surely gohigher without strength inemerging markets. FactorslikeslowThirdWorldgrowthor war can impact thisrelationship. But in generalstrong emerging markets arepositive for U.S. equities.Crises in emerging marketscanleadtoadragontheU.S.equityindexes.

The Volatility Index, alsoknownastheFearIndex,canforetell moves in U.S.equities.Abigtrendhigherisgenerally a negative forequitieswhereas a low valueis like the tailwind wediscussed earlier. This indexis derived from S&P 500optionspricing,andcanrangeonly between 0 and 100.Extremely high values rarelylast, whereas extremely low

values can persist for years.What ismost tellingwith theVolatility Index is if it startsto change character, movingfromaflattoarisingtrendorrising to falling. Short-termspikes that remain in a tightrange do not usually impactequities for more than a dayor two, despite the fact thattheymaybebigmovesintheactual value of the index.Sharp persistent spikes in

volatility do have a negativeimpactonstockprices.Each of these influencers
can be measured eitherdirectly or by usingexchange-traded funds(ETFs). I prefer the directmeasurewhen looking to seehow they may influence theequity trend. The ETFs aregood for trading theseinfluencersifyoudonottradefuturescontracts.Rather than
a derived value from thedirect markets for trading,using the direct measuremight give a nuance that anETFdoesnot see. In theendif they are used to helpidentify the influence to theequity trend, and not fortrading, it does not reallymatter which you use. Eachfactor may not have anysignificant role fromweek toweek. Some may dominate

for weeks at a time. Somemay seem unimportant formonths. It is important tocarry this analysis throughtime to gather a goodunderstanding of whichinfluencers are important andhow they change thoroughtime.Itisthemosaicofallofthese influencers that ismostimportant. In a time withEuropean economies inrecession and the United

States and other worldpowers fighting globaldeflation,astrongreversal ingold to go higher, forexample, would cut acrossmanyrelationshipsandmightforetell a major change inequities.Theseareobviouslynotthe
onlyinfluencers,andyoucanpick more. On a monthlybasis I also use the GermanDAXIndex,thestrongestand

most powerful market inEurope;thepriceofcopper,acommodity that is said tohaveaPhDineconomicsasitisusedworldwideinhousingand other areas so canforecast economic growthglobally; and natural gas, afuelofgrowingimportanceinthe U.S. economy as itreplaces coal and takesmarket share away fromcrude oil. Bringing in the

Japanesemarketmakessenseasitanditscurrencycanplaya major role in our marketsthrough how large investorsandhedgefundsfinancetheirtrading activity. The key toany of these influencers isthat alongwith a feel for thedirectionoftheprimarytrendoftheequityindexes,youarewatchingforexternalitiesthatcould change that trendquickly.Outsideoflookingat

the price action of each ofthese influencers directly,many areworth reviewing inratiochartsaswell.
RatioCharts
Aratiochartshowsthepriceofonesecurityvaluedintermsoftheothersecurity.Saidanotherway,takethepriceofonesecurityanddivideitbythepriceofthesecondsecuritytogettheratio.Theactualvalueisnotusuallyasimportantasthetechnicaltrendoftheratio.Thistypeofchart
isquiteusefulinuncoveringtrendsbetweentwoassetsandwhentheymaychange.Itcanalsobeusefulindebunkingmythsaboutperceivedrelationshipsbetweenassets.OneofthesemythsisthattheChinesemarketishighlycorrelatedtoU.S.equitymarkets.Therearemanyso-calledexpertopinionsastowhythisisso.SomesayithastodowiththeuseofChineselabortomanufacturegoodsforU.S.companies.OtherspointtotheChinesehousingmarketanditsuseofrawmaterialsfromtheUnitedStates.StillothersreferencethesizeofthepopulationofChinaandthegrowthofitsmiddleclassas
apotentialmarketforU.S.goods.Theseareallgoodtheoriesandmayholdsomemerit.ButtheratiochartoftheChinaASharesIndex(abroad-basedindexofChinesecompanystocksavailableonlytoChineseinvestors)totheS&P500showninFigure1.7suggestsotherwise.Thischartshowsacleardowntrendingchannelcontinuingfromlate2009throughtolate2013.Asofthiswriting,theratiohasretraced88.6percentoftheentirerun-upitsawfrom2006to2008,thetimethatbuilttheseexpertopinions.Nothingcontinuesforeverand
trendscanchangeonadime,somakingsweepingstatementsaboutcorrelationscanbedangerous.Butthischartlookstobeheadinglowertowardafullretracement.Sowhathashappenedduringthistime?TheU.S.markethasrecoveredfromthefinancialcrisislowstonewall-timehighs.YettheratiochartshowsthatallduringthattimetheChinesemarkethasbeencedinggroundtotheU.S.market.Clearly,forafour-yearperiodthesemarketswerenotpositivelycorrelatedbutinverselycorrelated.Armedwiththatknowledge,itwilllikelybeimportantwhenthistrendchanges.I

wonderifatthatpointtheexpertopinionswillbethatthesemarketsarealwaysinverselycorrelated.
FIGURE1.7RatioChart—ChinaASharesversusSPY


■SignificantMarketRatiosEvery trader has additionalmeasures that are used tomonitorthehealthofatrend.For me, aside from seeing avisual of the aforementionedinfluencers,itisalsousefultolookatmanyratiosinvolvingthose influencers. The ratio

chart can be interpreted as avisualization of the flow ofcapital from one market toanother.Itisnotameasurableflow like the flow of moneyinto or out of mutual funds,for example, but a flow interms of relative strength. Inthat way relative riskmeasures can be quicklyestablished. Here is a quickrundownofseveralthatIuse.Most are a proxy for global

market risk appetite in oneway or another. The trend isthe most important aspect ofthese charts.The actual levelis often not important at all.And even more importantthanthetrenditselfisatrendthatisstartingtochange.Thisis where that portion of theratio,thepotentialinfluencer,needs to be watched mostclosely for a possible impacttotheindexes.
TheS&P500versusEmergingMarketsThe ratio that looks at theflow of funds between theS&P 500 and emergingmarkets is a very goodindicator of the global riskappetite. When the ratio isrising there is relativestrength in the S&P 500compared to emerging
markets.Atrendlikethiscanoccurwhenemergingmarketsexperience a recession orother shock to theireconomies.Itcanalsohappenwhen the U.S. economy isperceivedtobegrowingmorestrongly than those ofemerging countries. In thistrend, the S&P 500 looks tocontinue strong. But oddly,even if the flow is favoringemergingmarkets,thiscanbe

good for the U.S. market.Especially deep into a trend,it can show that the appetiteforriskisgrowing,whichcansignal that thestrength in theU.S. market can continue.Trends inbothdirectionscanbegoodforU.S.stocks.Thisratio really emphasizes theimportance of the change intrendoverthetrenditself.

U.S.TreasuriesversusJunkBondsU.S. Treasuries versus high-yield (“junk”) bonds isanother measure of riskappetite, but mainly withinthe U.S. economy. Asinvestors and traders take onmorerisk,thereisaflowintohigh-yield bonds from U.S.Treasuries. A trend lower in

U.S. Treasury pricescompared to high-yield bondprices is an indication ofacceptanceofmoreriskinthebondmarket.Itisnotadirectone-for-one correlationbetween high-yield bondpricesandU.S.equityprices,buthigh-yieldbondscanbeagood proxy for equities interms of the amount of risktaking in the broadmarketplace. This is a very

goodmeasureofthedirectionof risk appetite in fixedincomesecurities.
S&P500versusU.S.TreasuriesThe S&P 500 versus U.S.Treasury securities is anothermeasure of risk appetitewithin the U.S. marketplace.As discussed earlier, thesetwo markets are usuallyperceived to be negativelycorrelated. So a flow fromone to the other can indicate

eithertheadditionofriskoraflight to safety that may notbe as obvious in theindividual charts. That is agood short-term view. In thelonger term, though, asdiscussed in the previoussection, bond prices andstockshavetendedtomoveinthe same direction. Thisratio’scurrenttrendpersistingisanonevent,butachangeisoften triggered by some sort

of shock and becomesimportant. If the trendchanges,keepwatching.

SilvertoGoldRatioThesilvertogoldratiostandsas a good proxy for thedirection of the S&P 500.FromthechartinFigure1.8itis easy to see that thecorrelation between this ratioand the S&P 500 was verystrong until the end of 2011.Priortothat,formorethan10years, the direction of this

ratiocouldbeusedtoidentifythedirectionoftheS&P500.Themagnitudesofthemoveswerenotprecise,butknowingthedirection is70percentofthe game. Many tradersfollow it to look for clues,based on this correlation, asto when the S&P 500 mightturnbeforethechangeshowsup in stock prices. Sadly, itlooks as if this relationshiphas run its course, with the

correlation flipping 180degreesin2012toaninversecorrelation.Again, itwas thechange that mattered. As thecorrelation flipped, the S&P500 started its long uptrend,with gold reversing its 15-yearuptrend.
FIGURE1.8SilvertoGoldRatioversusS&P500


ShanghaiCompositetoS&P500RatioThe ratio of the ShanghaiComposite totheS&P500isa recent addition. It hasshown over the past fouryears that there is a negativecorrelation between the twomarkets (see the “RatioCharts” sidebar and Figure1.7).WhatisbadforChinese
stocks is good for the S&P500.Thislistisnotexhaustive,noris it always useful. Buthaving these additional toolsintheshedcanhelpthetraderoccasionally to clarify ascenario that cannot be seenintheindividualcharts.Focusonthechangestotrendsmorethan the trends themselves intermsofwhatcan impact theequityindexes.

■OtherIndicatorsThere are many other time-tested indicators thatprofessionals have used foryearsaswell.
SentimentThe put/call ratio is one tomeasure bullish or bearishsentiment. The higher theratio, the higher the bullishsentiment is thought to be.Therearealsomany investorsurveys that measuresentiment, like the AmericanAssociation of IndividualInvestors (AAII) Sentiment

Survey. I also use somebreadth measures, like thepercentage of stocks that areover their 200-day simplemovingaverage (SMA).Youdonotneed touseanyor allof these. The point is to getcomfortable with a set ofindicators that do not allderive from the samemarketthat you are trying to learnabout.Sentiment can play a large

roleinthemarkets,andmanytraders base their decisionsentirely on sentiment. Theareaofbehavioral economicsis attempting to addperspectiveinthisarea.
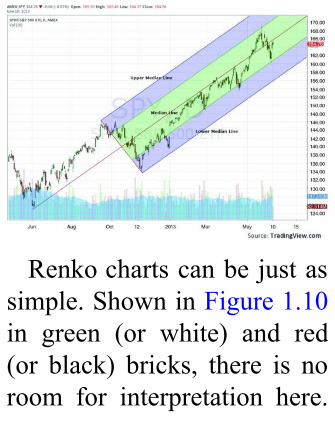
TrendToolsThere are a couple of trendtools that I find particularlyuseful: Andrews’ PitchforkandRenko charts.These twotypes of charts do not givetargets but can be veryhelpful in determining thetrend.Andrews’ Pitchfork is
namedforDr.AlanAndrews,
who developed it. It is verysimple in its interpretation.The chart of theS&P500 inFigure 1.9 displays apitchfork active in the S&P500 SPDR as I am writingthis book. From the uptrendthatbeganinJune2012,thereis a pullback that definesthree parallel lines, like thetinesofapitchfork.Thesearecalled the upper median,median, and lower median

lines—not very creative, butdescriptive. There are alsotwomidlinesinthischartthatshow the midpoints betweenthe three main lines. Thethesis is that the three majorlines attract the stock priceandtheremaybeastruggleatthe midline between them.Thischartisagreatadvocatefor theiruse,as thepricehasbeen tightly tied to themedian line and has snapped

back after wandering awayeverytimeforthesixmonthsshown. This can be an easyway to see the trend. Thereare more complicatedmeasures and indicators thatcan be applied to Andrews’Pitchforksthatcangiveabuyor sell signal, whichwewilltouch on later. For now, justnotice the simplicity of thetool in showing which waythetrendisheading.

FIGURE1.9SPY—Andrews’Pitchfork
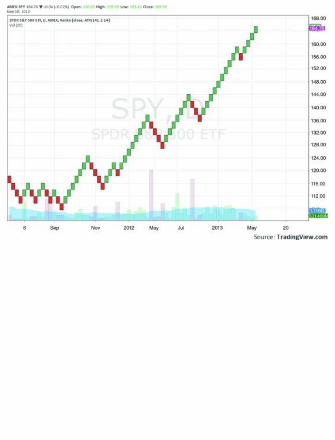
Renkochartscanbejustassimple.ShowninFigure1.10in green (or white) and red(or black) bricks, there is noroom for interpretation here.

Up means buy and downmeanssell.Ifitisgreenitisabuy signal. If it is red it is asell signal. There are mostlygreen bricks in this trend, soitisbullish.Howeasyisthat?ThesechartsarederivedfromJapanese candlestick charts,which we will discuss inmore depth later with theindividualcharts.
FIGURE1.10SPY—RenkoChart

MomentumandOtherIndicatorsAsstatedearlier,sometimesitiseasytoseethetrend.Othertimesitisnotsoclear.Whenitislessclear,therearemanytools that have beendeveloped that can help.Someofthesearemomentumbased,othersvolatilitybased,and still others can be based

on historical price datadirectly.Let’stakealookatafew of these. There will bemoredetaillaterinthebook.Simple moving averages
(SMAs) are one of the mostfrequently used indicators.A50-daySMAisnothingmorethan the average of the priceoftheindexovertheprior50trading days. Traders use allsorts of SMAs, including the9-, 13-, 20-, 50-, 100-, 150-,
and 200-day SMAs. Forsimple trend analysis, thereare only two things to lookfor in the SMA:whether theindex is above or below theSMA, and the direction inwhich they are bothheading.In the simplest terms, if theindex is above the 50-daySMA, that is bullish, and thebias is for it to continuehigher. If it is below theSMA, that is the opposite. If

the SMA is rising, that alsosupportsa rising trend,andafalling SMA emphasizes afalling trend. The chart inFigure 1.11 shows the S&P500 with its 50-day SMA(dark line) since January2012.Therearethreedistinctperiods when the index wasabove the 50-day SMA, andin each period the trend wasrising. Also notice that thetwo periods when the index

crossed below the 50-daySMAthetrendchangedforaperiodoftimeuntilitcrossedbackabove.
FIGURE1.11SPYsinceJanuary2012

Using the same chart, theBollinger bands (the channelabove and below the indexprice) can be used to find atrend. They use the standard
20-day SMA as the midlineand two standard deviationstoeachsidefortheenvelope.When the channel is rising,thetrendisup;andwhenitisfalling, the trend is down.Traders use these for othernuances, which we willdiscuss later in the book aswell.At the top of the chart,the Relative Strength Index(RSI) is a measure of thestrength of the trend, a
momentum oscillator. On ascaleof0to100itisdeemedto indicate a bullish (higher)trend over 50 and a bearish(lower)trendunder50.Manytraders expand this forstronger confirmation to lookformeasuresover60orunder40.WhentheRSIisover70,the index is consideredoverbought,andunder30itisconsideredoversold.Finally,atthebottomofthe

chart, the moving averageconvergence/divergence(MACD) indicator is ameasure of momentumstrength. In simple terms,when the choppier (blue)signal lineisrising, thetrendis higher; and when it isfalling, it is lower. A trendchange occurs when thesignal line crosses up ordown. The (red or black)histogram can be viewed the

same way. When it isgrowing and positive, thetrendishigher;andwhenitisfallingandnegative,thetrendislower.Eachoftheseindicatorscan
be customized by traders totry to gain an edge. Like the9-, 13-, 20-, 50-, 100-, 150-,and 200-day SMAs, I havealso seen 144 and 250 daysused. Traders will convertthem to exponential moving

averages (EMAs), givingmore weight to the recentactivity than the distant past,whereas the SMAs areequally weighted. TheBollingerbands(ameasureofvolatility) can be replacedwith moving averageenvelopes, Average TrueRange (ATR), or othervolatilitymeasures.Theycanalso be adjusted to use otherthan the standard 20-day

SMAas themidline and twostandard deviations to eachside for the envelope. TheRSI, which uses a 14-daymoving average on a closingbasis on the chart, can useany other moving average; Iseemanydaytradersusetwodays.AndtheMACD,whichusestwodifferentexponentialmovingaverages,canalsobecustomized to suit the trader,or any number of other

momentum oscillators cansubstitutefortheMACD.I am not advocating any
particular combination herefor help in determining thetrend, but will make threepoints. First, keep it prettysimple. One SMA, oneoscillator, and one otherindicator are enough. I haveseen traders’ charts with 15indicatorsonthemandcannotunderstandhowtheycanever

make a decision with thatmuch information. Theindicators will all turn atslightly different times. Playaroundwith them if you liketo find theones that suityoubest, but do keep it simple.Second, many chartingpackages comepreprogrammed for RSI,MACD, and other indicators.For use in determining thetrend, it is not necessary to
changethesefactory-installedsettingsatall.Youwilllikelyhave the same settings as 95percent of users and maythinkthatwillnotgiveyouanedge. But it is much moreefficient just to leave themalone if you are using themonly for trend identification.Unlessyouhavesomekindofquantitative system that hasbeen tested and proven towork, you are likely just
spitting into the wind tryingto customize these tools forthis exercise. Finally,remember that theseindicators are derived fromprice action. The primarysource of trend identificationshould be from examiningprice.Trylookingatthechartwith nothing but the priceaction first to determine thetrend. Then add theindicators. These indicators
may confirm that action orshow divergences that mayleadtoachangeintrend,buttheemphasisisonmay.Priceshould always be the firstdeterminantofthetrend.
■ConclusionYou should now be prettywellinitiatedintotheprocessof trend identification. Youshouldbeabletoidentifythetrend as either rising,consolidating, or falling overthe proper time frame. Youshouldalsobeabletoidentifywhich, if any, other marketsmay influence that trend and
change its direction. Finally,you should be able to useother indicators such assentiment, trend tools likeAndrews’ Pitchfork andRenko charts, momentum,and other tools like SMAs,RSI, Bollinger bands, andMACD to help identify thetrendwhenitmaybechoppyorhardtodetermine.You have seen that there
canbemanyvariationsonthe
multitude of indicators used,which can create an infinitenumber of potential tools touse to follow and determinethe trend. Do not get suckedinto the complexity. If youcan see that the price ismovingfromthelowerleftofthe chart to the upper right,then thatmaybeall thatyouneed.Itcanbethatobvious.To determine what could
impact that trend, again look

atthepriceaction.Itisbettertolookatthepriceactionofafewkeymarketsweekinandweekouttocreateamontageof the global marketplacethantotrytocreateprecisionin any particular indicator.There will be few outsideinfluences that give an edgein determining a trendchange. Most will continuealongthesamepaththattheyhave been on without
impactingtheequityindexes.Look specifically for
changes in trends of thosemarketsthatcaninfluencetheequity indexes to heightenyourawarenessofapotentialimpact on the equitymarket.Even then they still may notmake an impact. It is theshocks to the system thatsometimes show up early inother markets that matter interms of a change of trend,

notacontinuingtrend.When adding other
indicators, again keep itsimple. Putting two or moremomentum indicators andfour oscillators will not domuchtoimproveyourabilityto identify the trendandmayeveninhibitthatability.InChapter2,wedelveinto
the next layer of the onion,sectoranalysis,toseehowtorefinetheprocess.

CHAPTER2

I
SectorReviewAnalysisn this chapter we look atmarket sectors usingmany
ofthesametoolsthatweusedto identify theprimary trend.We will also introduce theconceptofrelativestrengthas

an additional tool, a conceptthat is different from theRelativeStrengthIndex(RSI)discussed previously inChapter 1.By the end of thechapter you should be armedwith the skills to furtherrefine the process of lookingfor good trading setups byidentifying the strongest andweakest sectors in terms oftheir alignment with thetrend.Throughacombination
of relative strength and trendanalysis,itispossibletorankthe sectors in terms of theirshort-termstrength.With the trend in the
indexes determined, you canmove directly to looking forstocks that have a goodtrading setup within thattrend.Thisnext stephelps innarrowingthesearch,butitisnotarequirement.Itcanbeamajor time-saver for the

trader who is timeconstrained or an essentialtool for the trader who istrading indexes and sectors.The process peels the oniononemore level to lookat thestock sector indexes, to seewhere there is strength andwhere there is weakness. Byreviewing the charts of themarketsectors,youcanoftenaccomplishthisquickly.Iusethe Select Sector SPDR

series, but there are otherchoices as well. The ninesectors (Basic Materials,Energy, Financials,Industrials, Technology,Consumer Staples, Utilities,Healthcare, and ConsumerDiscretionary) make up theentire universe. There arealwaysafewsectorsthatleadandafewthatlag.Byfindingthose laggard sectors andtossing them aside and then

drilling down into only thestocks in the leading sectors,you can cut out a review ofseveral hundred charts in a1,000-stock universe. Butthere is a side benefit fromthis analysis as well. Sectorrotation in stocks is a realthing. You will get tounderstand this through trendanalysisofsectors.Defensivesectors like Utilities andHealthcare rarely trade in the

same trending direction asEnergy and Financials, forexample. When an indexlooks to be stronger in onedirection but the leadingsectors are getting extendedor tired, thiscanbeasignofsector rotation and newleadersemerging.Movingthrougheachsector
chart, start with the sameprocessaswejustranthroughfor the indexes inChapter 1.

Lookforapricetrendfirst.Ifit is obvious, that is great. Ifthat trend is also followingthe trend of the index, it isevenbetter. If there isnotaneasily discernible trend, thenuse the tools previouslymentioned. The same simplemoving averages (SMAs),RSIs, and moving averageconvergence/divergence(MACD) indicators can beapplied here, too. Don’t

forget to pull out to a longertimeframeaswelltoseehowthat trend may change.Finding that four sectors aremoving with the index isgreat. But if one of them islookingtiredonalongertimeframeand theother threearestill strong, then you cannarrow your focus further.The same goes for thosesectorsthatarelagging.Ifona longer time frame one or
two look to be gettingstronger or turning up, thenyou have already savedyourself some time for thenext week. I like to print achart of each sector and thenrankthemfrombesttoworst.My wife and kids see mespreadingthemoutonthebedSaturday morning andmoving them around like ajigsawpuzzle.Thatisme,butremember I am old school

andmaybealittlequirky.

■CaseStudy:SectorRankingInthissectionthenineSelectSector SPDR charts areranked from strongest toweakestagainstaSPDRS&P500thatisinanuptrend.Thiscangetverycomplicated,but

I liketomakeitverysimple.Istartbyprintingoutallninecharts using just a fewindicators: price, the 50-daySMA, Bollinger bands, RSI,andMACD. I like tobeableto physically move themaround.Infact,Ilaythemalloutonthebed.Mywifelovesthis part of the weekend.(You can just open them indifferent windows on yourcomputer screen.) From that
point I sort them into threepiles: one for strong charts,oneforweakcharts,andthenthe last one for “other.”Sometimes the “other” pilebecomes twopiles,onemoretied to the strong and onemoretiedtotheweak.Howdoes thiswork?Let’s
start with the charts labeledA-1 through A-3. TheTechnology Select SectorSPDR (ticker: XLK),

MaterialsSelectSectorSPDR(XLB),andIndustrialsSelectSector SPDR (XLI)make upthe strongest group A. (SeeFigures2.1to2.3.)
FIGURE2.1TechnologySelectSectorSPDR(XLK)

FIGURE2.2MaterialsSelectSectorSPDR(XLB)

FIGURE2.3IndustrialsSelectSectorSPDR(XLI)

Following them are theEnergy Select Sector SPDR(XLE), Healthcare SelectSector SPDR (XLV),Consumer Discretionary

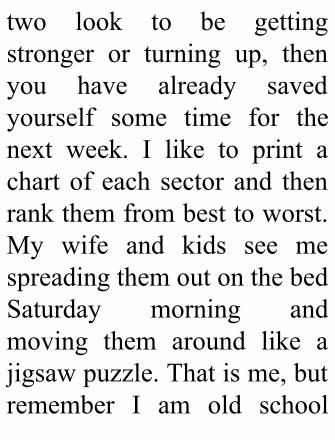
Select Sector SPDR (XLY),and Financials Select SectorSPDR (XLF) shown inFigures2.4 to 2.7. These arethe “Other” pile (group B).Theyareneitherthestrongestnortheweakestsectors.
FIGURE2.4EnergySelectSectorSPDR(XLE)

FIGURE2.5HealthcareSelectSectorSPDR(XLV)

FIGURE2.6ConsumerDiscretionarySelectSectorSPDR(XLY)
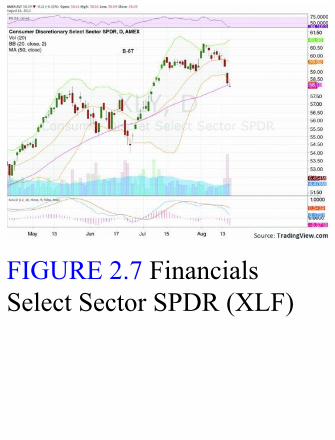
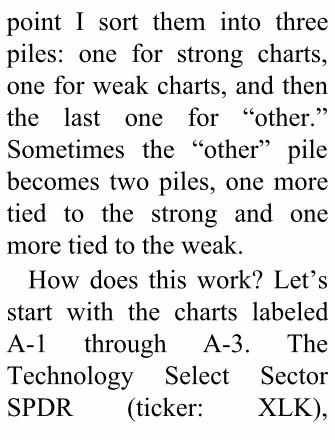
FIGURE2.7FinancialsSelectSectorSPDR(XLF)
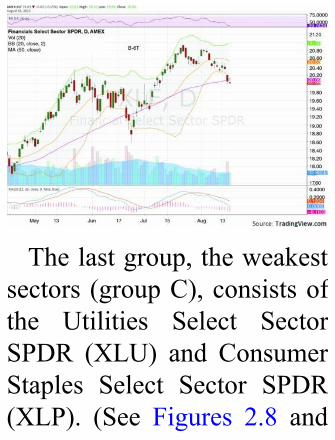
Thelastgroup,theweakestsectors (groupC),consistsofthe Utilities Select SectorSPDR (XLU) and ConsumerStaples Select Sector SPDR(XLP). (See Figures 2.8 and

2.9.)
FIGURE2.8UtilitiesSelectSectorSPDR(XLU)
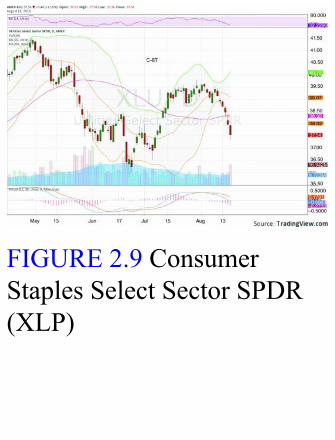
FIGURE2.9ConsumerStaplesSelectSectorSPDR(XLP)

Can you see the nuancesamong the three groups? Allof the stocks in the stronggroup A have five things incommon.First,theyareinanuptrend.Theymaybepulling
back but have notmade newlowerlows.Next,theyareallabove their 50-day SMAs.Third, they all have an RSIthat is above the midline.Next, they are not pressingtheir respective Bollingerbands. Finally, theirMACDsare flat but not yet rollinglower.Notice how these factors
change when looking at thegroup B sectors. All are

testing support at the 50-daySMA or have just brokenthrough it. The price ismaking a lower low. TheRSIs are through themidlinewith MACDs that aredeclining on the signal line.And they are all pushing thelowerBollingerbandlower.Moving to the group C
sectors, it gets even worse.These sectors have movedwell through their 50-day

SMAs. They have RSIs thatareclosetotestingsupportattechnically oversold levels.TheirMACDsarefallingandtheir prices are falling inlonger(redorblack)candles.Finally, they have blown thelower Bollinger band out tothe downside, and price hasmovedoutsideof it.Youcanadd all sorts of otherindicators, but this simplewayof lookingat the sectors

all at once makes it easyvisually to separate winnersfromlaggards.Once that is done, you can
focusonfindingstocksintheleading sectors. In this caseyou would focus onTechnology, BasicMaterials,and Industrials. But theanalysis can be refined byranking the sectors withineach group. This is thenumber associated with the

letter on each chart. This isvery subjective, but I haverankedtheTechnologysector#1foritsrelativelyhighpricecompared to the previouslow, and the distance fromthe 50-day SMA and thelower Bollinger band. TheMaterials sector is at themiddleoftheBollingerbandsand at the 20-day SMA aswell, but was pushed to #2due to theRSI rolling lower.

The Industrials sector comesin#3,aspriceisclosesttotheBollinger band, nearly at anew low, and the chart hastheweakest-lookingMACD.Repeatingthisforthegroup
B sectors shows both theEnergy sector and theHealthcare sector at the 50-day SMA, while theConsumer Discretionary andFinancials sectors havepushed below it. This gives
the edge to Energy andHealthcare; Energy has aslightlystrongerRSI,withtheotherfactorsbeingsimilar,soitgets#4andthen#5goestoHealthcare. The ConsumerDiscretionary and Financialssectors have similarcharacteristics all around sotheyenduptiedat#6.Finally, moving on to the
group C sectors, they bothlook ugly. The Consumer

Staples sectormight be a bituglier with the extent of theprice move, but the two arenot different enough toseparate them inmyopinion,sotheybothcomeinat#8.The final ranking:
Technology, BasicMaterials,Industrials, Energy,Healthcare, ConsumerDiscretionary, Financials,Utilities, and ConsumerStaples. Sometimes you can

alsogetsignalsfromthistypeofanalysis.WithTechnologyleading and ConsumerStaples and Utilities lagging,thisconfirmsastrongmarket,for example. Defensivesectors are lagging andinnovative sectors areleading.
■RelativeStrengthAnother useful tool for thispart of the process ismeasuring relative strength.Thisisadirectmeasureofthestrength of the sector againstthe index, and is differentfrom the Relative StrengthIndex (RSI) discussed

previously in Chapter 1. Byplotting the returns of eachsector against the returns ofthe index,youcanseewhichsectorsareoutperformingandwhich are underperforming.The chart in Figure 2.10shows the returns of severalsectors plotted with thereturnsoftheS&P500SPDRfromOctober2012untilJune2013.Itiseasytoseethatthemovehigher in theS&Pwas

helpedbytheoutperformanceof the Financials SelectSector SPDR (XLF) andHealthcare Select SectorSPDR(XLV)despitethedragfrom the underperformingEnergy Select Sector SPDR(XLE) and Utilities SelectSector SPDR (XLU). If youdo not have time to look atthe nine graphs from eachsector to identify the strongand weak sectors, you can
certainly find a few secondsto review one chart withseveralofthemonit.
FIGURE2.10RelativeStrength—BroadScale

Time scale matters in thisregard. Ifyouareconductinga weekly search for thestrongestandweakestsectorsto trade that week, then thenine-month chart of weekly

plotsofperformancewillnotbe relevant. Using a one-month chart of daily or evenhourlyperformancewouldbemore suited to this analysis,and will give very differentresults.Thesamesectorsonaone-month scale in Figure2.11 show that only theFinancials sectoroutperformed the S&P 500over a shorter one-monthperiod.

FIGURE2.11RelativeStrength—ShortScale

■ConclusionYou now have two easyvisual methods fordeterminingwhichsectorsarelikelytocontinuetodrivethetrend in the major indexes.Neitherisessentialtofindingtheultimate individualstocksthat you will trade, but bothallowforashortcuttingoftheprocesswithvery littleeffort
—a highly efficient andeffective shortcut to yourprocess.What can beat that?Thesenewtools to refine thesearchwhilemoving forwardinto selecting individualstockscansavehoursofchartreview. It is not a substituteforlookingateverychart,butnarrowingthesearchtothosesectors that are driving thetrend will catch the vastmajority of the tradable

setups. There will always beothers that have someelement that moves themagainst other tends.Youwillnever find every setup or beabletotradeallthosethatyoufind. But it should becomforting to know that theonesyoudofindnowwillbealignedwith the trendand inthesectorsthataresupportingand driving that trend,whetheritbeupordown.

PartI:ConclusionWiththeprocesscomplete,younowhaveasolidunderstandingofthedirectionofthetrendandwhatsectorsaredrivingit.Youhaveanunderstandingofwhatmightchangethetrendandhowtheleadingsectorsmaychangeintheshortrun.Notbadforafewhoursofwork!Withthataloneyouwouldbepreparedwellbeyondmostpeoplewhoaretryingtotradetheirownmoney,whetheritisa401(k),
inheritance,ortheresultofyearsoftoil.Thisisjustscratchingthesurface,butitisalsoenoughforasolidfoundationtomoveontosingle-stocktechnicalanalysis.Youcanspendthousandsofhoursandpagesofreadingdelvingfurtherintothistypeofanalysis,andIurgeyoudoso,especiallyifyoutradeindexfuturesorexchange-tradedfunds(ETFs)onindexes.Thelistofadditionalreadingresourcesatthebackofthebookisagreatplacetostart.Youalsodidnotlookatanyfundamentalsofthemarketin
thispartorreadaboutthedeathoftheeuro,howthelatestelectionwillchangethemarkets,thedebtcrisis,orwarintheMiddleEast.Ialsourgeyoutostopreadingthenewspapersandwatchingtelevisiontogetyournewsaboutthemarkets.Thereisinterestinginformationthereanditcanhelpmakeyouamoreroundedperson,butitwillnothelpyoutradeonMonday.Inthenextpartwewilldelveintothetechnicalanalysisofindividualstockstodeterminewhichoneswewilldesigntradesaround.Therewillbemanymore

toolsintroducedandpracticalexamplestomoveonelayerdeeperintotheonion.Ipromiseyouwewillgettooptions,buttakeamomenttocongratulateyourselffirstforgettingthroughthefirstpart,onidentifyingandunderstandingthetrend.

PARTII

TECHNICALANALYSIS
FORIDENTIFYINGINDIVIDUALSTOCKS

Thetrendisidentified,thepotential catalysts for
change have been reviewed,and now it is time to tradeoptions, right? Not so fast.All you know right now inthe process is the trend.Thisisakintoknowingwhichwaythewindisblowing.Nowitistime to dig deeper and lookfor opportunities wheremaybe the wind is blowingfasterorwheresomethinggot
caught on a branch and isabouttobereleasedandcatchup. But enough of themetaphors; let’s start toanalyze that universe ofstocks.PutawayyourcopyofGraham andDodd’s SecurityAnalysis. While interesting,valuation has little or nobearingontrading.Therewillbe no accounting ratios, noprice-earnings (P/E)multiples,andnocompetitive
industry analysis, just priceactioninitsmanyforms.Youcouldgetoutacalculator,butrelax. There will be nocompoundannualgrowthrate(CAGR) or discounted cashflow (DCF) analysis, justsimple adding, subtracting,multiplying,anddividing.In Part I we made the
assumption that it is easy tofindthetrendand,ifnot,thata few simple tools—the

Relative Strength Index(RSI), moving averageconvergence/divergence(MACD) indicator, andsimple moving averages(SMAs)—could help. If youfollow the trend, thenbuyingand selling stocks that movewithitcanbeenoughtomakemoney. When the trendchanges or when your stoplossishit,yousellandthatistheend.Thisisaverysimple

approach. But there are alsomanyinstanceswhereastockdisplayspricehistorythathasled to the expected futureprice action. As optionstraders, there are additionaldimensionstoourtrades,oneof which is time.Understanding how a stockpricemightreactandroughlyhow long it may take canmake or break an optionstrade. Our goal is to find
stocksthathaveapotentialtomove5to10percentormorein a very short time period.So before we delve intooptions,let’sexploremanyofthese tools of technicalanalysisthatwillbeusefulindesigning those trades, andapply them to individualstock charts. At this point, Ibreak from the processoutlined in Part I and bringback into the analysis every

stockinmyuniverse,notjustthose in leading sectors. Wewill startwith the basics andendwithsomemorecomplexpatterns.Recall that technical
analysisisasmuchanartasitis a science. As you learnhow to identify levels andpricesthataresignificantyoumustkeepthisinmind.Thereisnoabsoluteboundaryforaprice movement. Prices can
overshoot and come back orstop just before or just afteryourtargets.Itisbesttothinkofyourtargetsasarangeorareally wide, blurry line, orelse you will get totallyfrustrated. Also, technicalanalysis does not alwayswork. Yes, I said it. That isthe way it goes with bothtechnical analysis andfundamental analysis.Technical analysisat itsbase

is an interpretation of priceaction, plain and simple. Itcan be interpreted in manyways,manyofwhichwewillreview next. But no matterwhat tools they use, alltechniciansarelookingforanedge to give a good entry orexitonarisk/rewardbasisfora deployment of capital. Itcan be a risk framework todesign a trading strategyaround. It is sometimes a

forecast.Itisapossiblefuturewith contingencies. This is asubtlety that many who donotpracticetechnicalanalysisfailtograsp.Thereisnothingabout certainty in any ofthose statements. Technicalanalysis isnota roadmap. Itdoesnotpointtoanoutcome.Probability ismore like it. Itis not fixed in time, either.Thetechnicalreadcanchangewith changes in the price
action, expected orunexpected. Nothing iscertain. It can change withtime.Inthispartwewilldelvein
to four types of technicalanalysis. The first area toexplore in Chapter 3 isclassical technical analysis,the study of support andresistance, and of patterns.We will then move into theworldofJapanesecandlestick
formationsinChapter4.NextfollowsthemethodsbasedonrhythmicflowslikeFibonacciretracements, Harmonicpatterns, Elliott Waveprinciples, Andrews’Pitchfork, and more inChapter 5. In Chapter 6 wedeal with technical toolsbased on price derivationslike momentum oscillatorsandmovingaverages,aswellas volatility-based analysis.

Each of these methods oftechnical analysis has hadmanybooksandthousandsofpages written about it. Wewillnotbedelvingintomuchofthetheorybehindthembutrather the practicalapplication of the principlesto find stocks that are readytomove.Ifindthederivationand history as fascinating asthe practical application, butthey are not for this text.

Consult the AdditionalResourcessectionatthebackof the book for furtherinsightsandhistory.With these sets of tools in
your belt, wewill then learntocreatethetradingwatchlistand start on the trading planin Chapter 7. Here we willlook at how news and otherevents can influence a stockand your decision to trade itoravoidit.AttheendofPart

IIyoushouldbeabletostudycharts using these multiplemethodstocreateamosaicofthe stock and determine itsviability to be traded. Thenscriptaplantoexecuteusingthatstock.

CHAPTER3
I
ClassicalTechnicalAnalysisn this chapter, we exploremethods used in classical
Western technical analysis,popularized through the textsof Edwards and Magee andothers. This includes support

and resistance as well aspatterns that emerge throughthe push and pull betweensupply and demand. By theend of this chapter, youshould be able to identifystocks that are potentialtrading vehicles using thesetechniques and be ready toexploreadditionaltechniques.Theclosest thing tocertaintyin the technical analysisworld is a horizontal support
or resistance line. They donot change, but they are alsonot made of concrete. Pricecan just as easily blow rightthrough them or gap overthem as it can be halted bythese lines. And what hasworked in the past may ormay not work in the future.With that inmind, let’s startthejourneythere.

■SupportandResistanceThe simplest technicalindicator to look for ishorizontal support andresistance,asshowninFigure3.1. These lines show up ineverystockatdifferentpointsin time. They are calledsupport and resistance

becausetheyseemtoprovidea floor and a ceiling to thepricemovement in the stock.The chart for DSW Inc.shows both horizontalresistance and horizontalsupport in the first half of2013. The upper horizontalline in the chart marks theresistance at 69.50. This canbe viewed as buyers andsellers at a crossroads. Thebuyers were seeing a reason
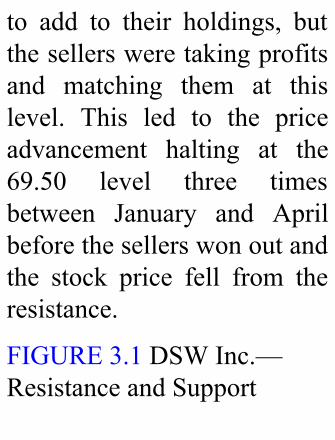
to add to their holdings, butthesellersweretakingprofitsand matching them at thislevel. This led to the priceadvancement halting at the69.50 level three timesbetween January and Aprilbeforethesellerswonoutandthe stock price fell from theresistance.
FIGURE3.1DSWInc.—ResistanceandSupport

The same thing happens inthischartat the lower lineofsupport but in reverse. Thesellerslookingtounloadtheirstock were being matchedshare for share by buyers at
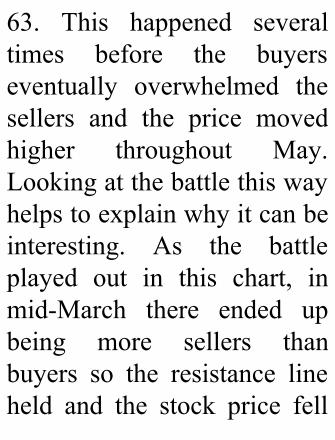
63. This happened severaltimes before the buyerseventually overwhelmed thesellers and the price movedhigher throughout May.Lookingatthebattlethiswayhelpstoexplainwhyitcanbeinteresting. As the battleplayed out in this chart, inmid-March there ended upbeing more sellers thanbuyers so the resistance lineheld and the stock price fell

asthesellersprevailed.Atthebottom the buyers eventuallywon the battle as the sellerswereexhausted,andthestockpricerose.This can also have a
different outcome. The chartof Hain Celestial Group inFigure 3.2 shows that thebattle between buyers andsellersatthe62levelbetweenNovember 2012 and April2013was eventually won by

thebuyers inMay2013.The62 price had clearly beenimportant since September2012 when the price firstfound support there, and thesellerswon battles there fourtimes before the buyersprevailed. It is at that pointthat these levels areparticularlyinteresting.Whenthe buyers win the battle atresistance or the sellers atsupport, the stock can move
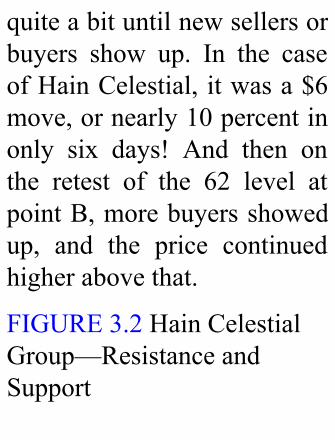
quiteabituntilnewsellersorbuyers show up. In the caseofHainCelestial, itwasa$6move,ornearly10percentinonly six days! And then onthe retest of the 62 level atpointB,morebuyersshowedup, and the price continuedhigherabovethat.
FIGURE3.2HainCelestialGroup—ResistanceandSupport

Looking back at DSWshows that a rejection atsupportorresistancecanalsobe a catalyst for a bigmove.The third touch before areversal is not so important,
butmultipletouchesdoallowthe support and resistance tobe seen more readily and intimetobeabletomeasurethepotential for a reaction.PriortothethirddropinDSW,thefirst two drops showed thepotentialforamovelowerto66 from the 69.50 resistancelevel or about 5 percent. Ifyou were prepared for a 5percent move lower on thethird failure and claimed it,

youwerepleasantlysurprisedto get an extra 5 percentbefore it stopped. On therejection at support at 63 thethird time, itwasclear thatabounce to 68 could happenandevento69.50abovethat.That brings up another
point on horizontal supportand resistance. They do notgoaway.PointAontheHainCelestial chart shows wherewhat was initially support

turned into resistance on amove below it. Then as thepricebrokebackabove62theresistance turned back intosupportagainatpointB.Thatis another key concept:Support becomes resistanceand resistance becomessupport when they arebreached. It is no wonder,then, that in the DSW chartthemove higher inMaymetresistance almost right at the
prior horizontal resistancelevel.Onefinalpointneeds tobe
made.Imentionedbeforethatsometimes technical analysisworks and sometimes it doesnot.Thelongcandlestickthatpierced the resistance in theHain Celestial chart in lateApril isagoodillustrationofthis. This candle movedhigher like therewasnothingstoppingitstraightfrom61to
64.Whydoesthishappen?Itjustdoes.Itisthingslikethisthat lead technical analystsand traders to frustratefundamental traders withsayingslike“Itworksuntil itdoesn’t.”Resistance and support
levels work with rising andfalling lines as well. Theseare often called trend lineresistance and trend linesupport. M&T Bank, shown

in Figure 3.3, had a risingtrend line support from June2012untilMarch2013.Therewere no less than fiveinstances when it acted assupport until price brokebelowitinMarch2013.Eachof these after the secondtouchwasapotentialcatalystfor a move. It also showedthat support can becomeresistance on the retest inApril. Eventually the stock

fellnearly8percent.Anotherexample of this is shown intheSunPowerchart inFigure3.4. The falling trend lineresistance was touched threetimes before being brokenfollowing the fourth touch.With so many touches, thesellers had been exhausted,and the buyers pushed thestock dramatically higherafterthebreakthrough.

FIGURE3.3M&TBank—RisingSupportandResistance

FIGURE3.4SunPower—FallingResistance

Support and resistancelevels are the easiest toeyeball and draw on a chart.Thekey is to look for a flat,risingorfallingconsolidationthat creates a line. As the

stock isapproaching the line,it creates a potential catalystpoint. These catalyst pointsthen allow you to prepare totrade.Ifyouseethatthenextpotential level of priceconsolidation, upon a failureat the current one, is farenoughawayforyourrewardcriteria,thenthisstockshouldbe on your list of potentialstocks to trade. I say“potential”becauseremember
that these are called supportor resistance levels for areason.Theymaycontinuetoact in that manner and thenno trade appears. I find thathorizontal support andresistance are more reliabletoolstotradefromthanrisingor falling support orresistance, so if you are at apointwhereyouarechoosingbetweena setupwith a stockthat has horizontal resistance
and one with risingresistance, I would focus onthe one with horizontalresistance.

■PatternsThere are many shapes andpatterns that technical tradersusetoidentifytradesetups.Inthissectionwecoverthemostpopular: flags, pennants,Head and Shoulders,diamonds, channels,CupandHandles,triangles,andRisingWedges. These are wheretechnical analysis gets its

reputation (amongnonpractitioners)asavoodooscience.Let’sdispelthatrightnow with some facts. Asnoted in the support andresistance section, a chart ofpriceactioncanbeviewedasa battlefield between buyersand sellers. Every patternhappensasa resultofbuyersandsellerstrading.Theactionis not always rational and infactisoftenbasedonchanges
in sentiment that may havenothing to do with thefundamentals of thecompany, but it givesimportant information andopportunities. Each situationis a bit different. But mostimportant is thateachpatternhereischosenbecauseof thepotential for a big move inthestockpriceuponatriggerbased on historicalperformance.Theymaynever

trigger and they may notreach their potential, but in aworldwithover5,000stocksto pick from they can helpnarrow the field to the bestalternatives.Let’sgetstarted.
FlagsA flag is a short-termconsolidation after a trendhigher or lower. If it occursafterariseinpriceitiscalleda bull flag; after a fall inprice, a bear flag. These canbeflatortheycanmovebackagainst the previous move.There are three instances ofbull flags in the chart for

GNCHoldings inFigure3.5,two that move back towardthe breakout level and thethird a flat one. Also noticethatthebreakoutofeachflagmoved roughly the sameamount. This is anothertechnical analysis rule ofthumb. We say flags fly athalf-mast. This means that aflagoftenoccurshalfwayinamove, as is shown in thischart,or that themoveto the
flag should happen again outoftheflag.Lookforthemovethat led into the flag andproject it forward out of theflag. The price moves from36to42andpullsbackto38beforemovingfrom38to44.Then it pulls back again to40.50 before jumping to46.50.Eachadvance isabout$6,andyoucouldprojectthatonabreakabove46 thenextlegwouldbeto52.Theshort-

term stock trader buying thebreakoutandsellingonastoploss after the top has beenformed can often capturemore than the total movehigherthatalong-termbuyermight see, in this case closerto $18 on themove from 36to46,insteadof$10.
FIGURE3.5GNCHoldings—BullFlags
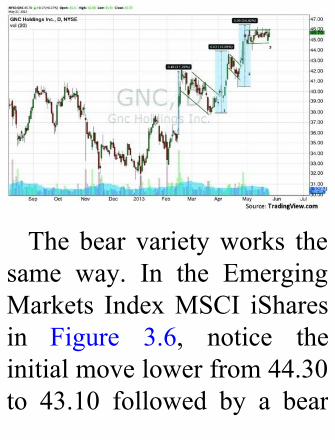
The bear varietyworks thesame way. In the EmergingMarkets IndexMSCI iSharesin Figure 3.6, notice theinitialmovelowerfrom44.30to 43.10 followed by a bear

flag moving higher againstthe trend, and finally abreakdown of similar size.The value in a flag for atradercomes in identifying itbefore the breakout andunderstanding the potentialmove. These can movequickly, and that is what weas traders like. In the twoexamples, GNC moved eachofitsroughly15percentlegsinamatterofonlyoneweek
or less. The EmergingMarkets IndexMSCI iSharesmoved3percentintwodays.
FIGURE3.6EmergingMarketsIndexMSCIiShares—BearFlag

It is important to note thatflags move in the oppositedirectionofthemoveintotheflag. Looking at GNC, notethe pullback in each of thefirst two flags and that the

third flag is flat.Flat isokaytoo, but the preference is aslight pullback in the flag.This shows up in the flag inthe Emerging Markets IndexMSCI iShares aswell, risingagainst the downward move.This contrary price actionshowsminorprofit takingbysellers being eventuallyoverwhelmedbynewbuyers.What you do not want to
see is a flag that is rising or

fallingwith themove. In thechart of Chipotle MexicanGrilleinFigure3.7thisisthecase. These structures areknown not as flags but aspennants and are a sign oftrend exhaustion. After asharp move higher, slowcontinuedbuyingwithfallingvolume(seearrow)isasignalthat few buyers are meetingthe sellers from the move.You can see the result in

Chipotle Mexican Grille, afull retracement of the movehigher and then some.Ouch.Stayawayfrompennants.
FIGURE3.7ChipotleMexicanGrille—Pennant


HeadandShouldersAHeadandShoulderspatternis a popular technical patternthat is often misunderstood.Many people can recognizetheshouldersandhigherheadas in the chart for Apple inFigure 3.8. Looking at theApril left shoulder, the headin late September, and theright shoulder at the end of

November, it is easilyrecognizable. The identifiersthat get misconstrued are (1)that it is not a Head andShoulders pattern until itbreaks below the necklineafter making the rightshoulder, and (2) that priceshould touch the necklineafter both the left shoulderand the head as well; if allthree do not touch thenecklinewiththepriceaction

following through below it,then it is not a Head andShoulders formation. Theshouldersshouldbeaboutthesame height (remember, thisis art, not science), and thehead should be noticeablyhigher than the shoulders.These are guidelines abouttheform.
FIGURE3.8Apple—HeadandShoulders
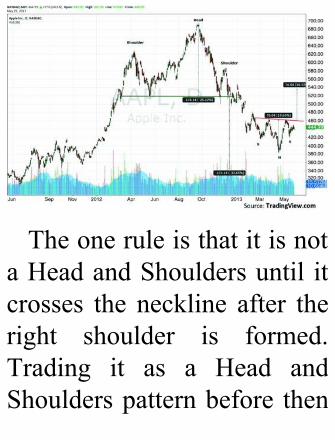
TheoneruleisthatitisnotaHeadandShouldersuntil itcrosses the neckline after theright shoulder is formed.Trading it as a Head andShoulderspatternbefore then

leaves you open to gettingdecapitated. Ideally, thevolume should also bedecreasing from the leftshoulder through to the rightshoulder. This was moreimportant many years ago,but is worth noting andlooking out for. What lookslike a Head and Shoulderspattern that has flat volumemaynotbe abigdeal, but ifthe volume is rising

throughout the pattern youshouldbesuspect.Why is this pattern
important?Whenyouseethisformation,thepriceobjectivelower(ontheconfirmationbythe breakdown) is amove atleast measured from the topof the head to the neckline,projected lower. In thisexample that would be the174.14 points from the headto the neckline, projected

below the neckline at thepointofthebreak,foratargetof about 343 on Apple. Itdoes not mean that the pricewill go that far, but it is atarget based on pastexperience.These patterns can have
verylargemovesbutcanalsoplay out on a much smallerscaleandonaninversebasis.The smaller potential InverseHead and Shoulders on the
right-handsideofthechartisan example of this. On anInverse Head and Shoulders,the volume is less importantbuteachtouchatthenecklinemust still happen. For thispattern to trigger an InverseHead and Shoulders, it mustfirst reach the neckline nowthat a possible right shoulderis forming. If it does andbreaks through that necklinetotheupside,itwill triggera

price objective to 536,assumingitbreaksthroughatabout460.Thesetwopatternscanhelp
illustrate an important pointabout aHead and Shoulders.The pattern stays in effectuntileitherthepriceobjectiveis reached or it fails bymoving back through thenecklineandpast thepeakofthe right shoulder. Movingbeyond the right shoulder

peak negates it. In thisexample,Applecould triggerthe Inverse Head andShouldersandreachthepriceobjective at 536 withoutnegating the Head andShoulders top. So it couldstill thenreverselowertothebearishpriceobjectiveat343.Another point illustrated
from these two examples isthat the neckline does nothave to be horizontal. It is

horizontal in the biggerformation, but it is decliningin the smaller formation.Experience suggests that theangleofthenecklinematters.For a Head and Shoulderstop, a flat or falling necklineismore likely to trigger thana neckline that is rising, thatis, making higher lows. TheoppositeistrueforanInverseHeadandShoulders,inwhicha flat or rising neckline is
expected to trigger with agreater likelihood than afallingneckline.Potential Head and
Shoulders patterns are foundoften, but it is important towait to trade them until theyhave triggered. Otherwise aquickreversalat thenecklinecould decapitate you. Thevalue in looking for them isthesizeandpotentialspeedofthe move. The Head and
Shoulders top in Apple didnot complete its priceobjective, but it did achieve90 percent of it or a 30percent move in the stockpriceinlessthanfivemonths,and this was after it hadalreadyfallen25percent.
DiamondsDiamonds are known as agirl’sbestfriend,buttheycanalso be a great tradingpattern. They are a form ofconsolidation pattern. As aconsolidationpatterntheycanhappen as a top, bottom, orcontinuation. The mechanicsaresimilartothepriceactiondescribed earlier for support
and resistance lines. Thepattern startsoutwithprobesgrowing higher and lowerthat eventually narrow andendwithone sideexhaustingits strength and the otherprevailing and movingforward. Diamonds are saidtoberare,but Ihavenoticeda lot of them in the past twoyears.ThechartofTimkeninFigure3.9from2011showsavery clean diamond top. The
chief characteristic of adiamond is that theconsolidation broadens firstandthennarrows.Thereisanexpandingbattlefordirectionthat ends up with both sideseventually getting moreaggressive before one runsout of ammunition and theothersideprevails.Themoveinto the diamond is expectedto be the same as the moveout.Soifitmoves$10intoa

diamond,thenitshouldmove$10out.
FIGURE3.9Timken—DiamondTop

A diamond continuation islike a flag, in that it usuallyrepresents the halfway pointfor a move. The chart forNordstrominFigure3.10isagood example of this. A

diamond bottom or top canlook like a cup or a tower.Oneoftheuncertaintiesaboutadiamond is thatyoudonotknowwhichwayitwillbreakuntil it does. In the Timkenexample, the price movedfrom30 to47or$17up intothe diamond so on the breaklower it was expected tomove down $17 back to 30.In this case itdid.Buthad itbrokenhigheratpointA,then

the target would have been$17 higher, or about to 64.The Nordstrom exampleshows the break lower,continuing the downwardmove. The $3 move lowerintothediamondresultedina$3 move lower out of itbeforeconsolidation.
FIGURE3.10Nordstrom(JWN)—DiamondContinuation

This pattern can alsoproduce big moves if themove into the diamond hasbeen large or smallmoves ifit has been less extreme. Asthepriceapproachesoneside

ofthediamond,putitonyourradarbutdonot tradeuntil ittriggersthroughthediamond.It is important to look forthesepatternsastheycanalsocreate fast moves. In theTimken example, the 36percentmovelowerhappenedin less than two months andthe Nordstrom move in justoneday.

ChannelsAchannelischaracterizedbya narrow horizontal range,much like combining asupport and resistance linefrom the earlier discussion.Asthepricegetstothetopofthe range the sellers start totake control, and at thebottom the buyers takecontrol. Eventually one runs

outofstocktosellorcashtobuy and the other sideprevails as the price movesoutofthechannel.Manyliketolookattheseasboxes,andone is illustrated in Figure3.11 for Visa from early2013. The power of thechannel looks for an initialmove equal to the channelwidth once it breaks out ofthe channel. In thisillustration the channel is

$7.75 wide with a top at161.50 and a bottom at153.75. On the break over161.50, theexpectedmove isto169.25,whichyoucanseewas met in four days. Notethat, like in the horizontalsupportandresistancebreaks,this too came back to thebreakout levelbeforemovinghigheragain.
FIGURE3.11Visa(V)—Channel


This pattern can also actlike a flag in that theconsolidationintheboxaftera longmove higher can leadtoanequalmovebeyond the

channel target. Thedistinction of naming it achannel is generally due tothe duration of theconsolidation. A long periodofconsolidation isachannel,whereas a shorter period isdeemedaflag.Soifpriceranup$25intothe$5channel,asecondary target would be$25abovethechannel.
CupandHandleTheCup and Handle patterntakes its name from itsresemblance toa teacupwitha tiny handle. The roundingpattern of the cup shows achange of sentiment fromsellers to buyers, with thecritical juncture being aretracement from the lowpoint of the cup to the prior
high.At thispoint theremaybemoresellersagainasthosewho did not sell during thecup look to get out atbreakeven,andthestockpullsback slightly. This results inthe handle. The chart ofNavistar in Figure 3.12 is agood example of a Cup andHandle.Notice thepeaknear38 followed by the orderlysell-offdownto30andthenasteady rise back to 38.50
beforemoresellingbroughtitback to 36. The Cup andHandlecarriesatargethigherequal to thedepthof thecuptothehighestpointofthecupadded to the breakout. Thispattern for the Navistarexample has a target on abreak back above the highpoint, 38.50, equal to theclimbfromthedeepestpartofthe cup to the rim, about $9,addedtothebreakoftherim.
So in this case the $9 addedto the break back over 38.50istoabout47.50.
FIGURE3.12Navistar(NAV)—CupandHandle
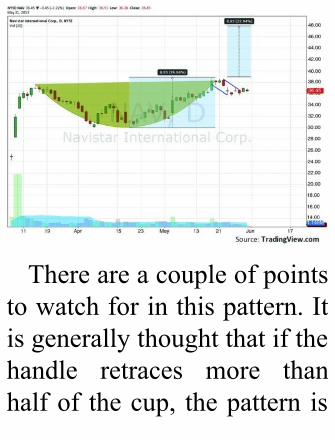
Thereareacoupleofpointstowatchforinthispattern.Itisgenerallythoughtthatifthehandle retraces more thanhalfof thecup, thepattern is
negated or at least lesspowerful.Also, rounder cupsperform better to the upsidethan sharp V patterns.Finally,notethatthispattern,too, has a large potential forgain, with upwards of 20percentintheillustration.

TrianglesTriangles are some of themost frequent patterns foundin charts. There are threetypes that are important torecognize: symmetrical,ascending,anddescending.Atriangleisreferredtoasa
symmetrical triangle whenthe price action is wide atfirst and narrows to lower
highs and higher lows overtimearoundahorizontalline.The price movement aboveand below the centerline issymmetrical, like in thechartforTravelCentersofAmericain Figure 3.13 (again, this isart,notscience,sothiscountsas symmetrical even thoughthe tophalf is larger than thebottomhalf). In thisexampleyou can see that at the wideend of the triangle there is a

price spread of about $2.50and it is fairly evenly splitaroundacenterlineat11.Theimportance of a symmetricaltrianglecanbetwofold.First,the triangle itself oftenresolves the war betweenbuyers and sellers with amove out of the triangle thatis equal to thewidest part ofthe triangle. In this case a$2.50 move would beexpected out of this triangle.
Thisalonecanmakeitworthwatching for a breakout, asthe chart shows it isequivalent tomore than a 20percent move. Second, thesetriangles often act like flagsaswell,flyinghalf-mast,soasecondary move is alsoprojected.For amovehigherout of the flag onTravelCenters of America,you would project thesecondarymoveequivalentto

themovethat tookit intothetriangle. From the bottomnear7tothemidlineat11,or$4, added to the midlinewouldgiveasecondarytargetof 15 on a breakout of thetrianglehigher.
FIGURE3.13TravelCentersofAmerica—SymmetricalTriangle

For a symmetrical triangle(and all triangles for thatmatter), it is said that thepower of the move isstrongest about two-thirds of

theway through the triangle.As pricemoves closer to theapex, the power of theexpected move diminishes.Beyond the two-thirds point,itistimetogivelessfocustothestockandlookelsewhere.One final note on
symmetrical triangles: Theycan break either up or down.As price approaches one ofthesides,itistimetopreparefor a break in that direction.
A failure to break meansthere isno trigger fora tradeand you just keep watching.Thispoint isapplicabletoalltriangles and trading setups.Wait for completion of thepatternandatriggertoenteratrade.Ascending triangles have
similar characteristics tosymmetrical triangles, butlookmore like thehorizontalresistance described

previously on the top side.Thebottom(andthustriangleshape) comes fromprogressively higher lows.The chart of PPG Industriesin Figure 3.14 from 2012gives a good illustration. Onthe left-hand side the twotrend lines outline theascendingtriangle.Thereisaflathorizontaltopandarisingtrend line as support thatcreates the triangle. The

measurementforthepotentialmove is taken in the sameway as in symmetricaltriangles.Lookforthewidestspotofthetriangle,wherethepricehitstherisingtrendlinefirst, and measure to thehorizontal resistance. On thePPG chart this is about $15.That move is then added tothe breakout price level tocreate a target on the move.Adding $15 to the breakout

level of about 105 gives atarget of 120. You can seethat this did reach that targetand a little more (to 122)before a pullback inNovember.
FIGURE3.14PPGIndustries—AscendingTriangle

Recall that the touchesalong either the horizontalresistance or the rising trendsupport are potential actionspots. Each time the price

approachesthetrendlinesisatime to analyze and preparefor a potential trade.Although it is presumed thatascendingtriangleswillbreakhigher, they can break eitherway. So the touch on therising trend line in June andagain in July could haveresulted in a breakdown outof the triangle and shouldhave beenwatchedwhen theprice approached it as well.
Thischartisaverygoodonetoreview,asitalsoillustratesthat a breakout does notalwaysresultinastraight-linemove to a target.Notice thatthe price consolidated aftermoving above the trianglewithamove from98 to112,or $14. As it broke out ofconsolidation in thehorizontal channel, it had atarget similar to that of theinitial triangle break (that is,
to 120).You can see all thisfrom the arrows. This isinterestingbecausewhen twopricetargetslineupfromtwodifferent methods ofprojection, it increases thesignificance of the target.Think of it as two differentsets of traders who are nowtargeting the same higherlevel.Descending triangles round
outthetrianglefamily.Where

ascending triangles arepresumed to break higher,descending triangles arepresumed to break lower outof thepattern.But this isnotalways the case and in factthey also can break eitherway. They look the oppositeof ascending triangles, asshown in the chart forAtwood Oceanics in Figure3.15 from late 2012 into2013. The horizontal support

at the bottom is tested againand again and progressivelylower highs form a fallingtrend resistance. The priceactionisstillthewidestattheleft side of the pattern andbecomes narrower as timeprogresses, squeezing priceinto a tighter range againsthorizontal support. In thisillustration the maximumpricerangeisjustover$6.25,so thebreakof thepattern is

looking for a similar move.Butthisexamplealsoshowsacase where the expectedbreakdown did not happen.Rather, price broke thepatterntotheupside.Thisledtoatargetofabout52.25(thebreakout at 46 plus 6.25).Fromthechartyoucanseeitwas attained in about onemonthand it continuedon to55.50, or 150 percent of the6.25move.There ismoreon

this extension later in thebook.
FIGURE3.15AtwoodOceanics(ATW)—DescendingTriangle

All three types of triangles—symmetrical, ascending,and descending—have somesimilar characteristics. Allproject a move out of the

triangle that is equivalent tothe broadest part of thetriangle. All are thought tohave the most powerfulmovesabouttwo-thirdsoftheway through the triangle. Asthe price action movesthrough the power zone andinto the apex, it becomesuninterestingtotrade.Allcanbreak either higher or loweras the battle between buyersand sellers plays out,

although ascending trianglesare biased for a break higheranddescendingtrianglesforabreak lower.Most important,though, is that these patternscan generate large moves insmall amounts of time andthatiswhywelookforthem.Each of the three exampleswas looking for at least a 13percent move, and the twothat triggered made thosemoves in one and two
months’ time. Those areenormousannualizedreturns.

RisingWedgeTheRisingWedge looks likeasymmetricaltriangle,exceptthatitistiltedupward.Theseare typically thought to bebearish patterns, but like allother triangles can breakeither up or down.The chartof JC Penney in Figure 3.16from late 2011 into 2012shows a Rising Wedge. The

width at the back of thewedge is about $6 (fromabout 29.50 to 35.50), so anexpected move out of thewedgewouldbe$6.Andyoucan see that once the pricebroke out of the wedge,although it was a surprise totheupside,itdidmovealittleover that $6 expectationhigherto43.
FIGURE3.16JCPenney—RisingWedge


The opposite variation, aFallingWedge,alsoexists. Itnaturally has a bias for abreakout higher and isconsidered a bullish pattern,but can break out of the

wedge in either direction aswell and seek the sametargeted move. Like everypattern discussed here, anapproach of price to theboundariesof thepattern isatimetoprepareforaction.
■ConclusionThere are hundreds of otherpatterns and variations thattraders swear by, and if youare comfortable with one ormany of them, by all meansgo ahead and use them, too.The point is that theseformations can lead toextraordinary short-termmovesinthestockprice.The
patterns described in thischapterare someof themostcommonandwidelyfollowedones. Discovering theseformations can vastlyincrease your chances of asuccessfultrade.Ifthepatternis there but the target is notbig enough, then pass on it,and look for the next one.Remember that the pattern isjust a setup. Do not trade ituntil it triggers. I see many
traders try to cheat, buyingthe stock in anticipation of abreak of a resistance orsupport level. Sometimestheyareright,butmanytimesthey are wrong and end uptaking a loss as the stockreverses direction atresistance or support.Commonwisdomtellstradersto keep losses small, so itmay seem contradictory tosuggest that it is not worth

taking a lot of small losseswhentheexpectedmoveissolarge.Butlookbackatallthecharts in this chapter. Howmany timesdid theprice failto trigger?Multiply all thosetimes by even a 1 percentstop loss on a cheating earlyentry and you willsubstantially lower yourreturn.Nowlookatallofthetimes that the breakouthappened and then continued

the move. Taking just thosetrades that have confirmedbreakouts has amuch highersuccessrateandhigherreturnon your capital. Plus you donot get frustrated from all ofthe losses, even if they aresmall. Those lines werenamedresistanceandsupportlines for a reason.Wait untiltheyhave failed to liveup totheir reputation to start yourtrade.
You should now have adeeper understanding ofsupport and resistance. Youshould also be able torecognize many classicaltechnical patterns, includingflags, pennants, Head andShoulders, diamonds,channels, Cup and Handles,andvarioustypesoftrianglesandwedges.Youshouldalsobe able to measure anexpected move from the

pattern and be able todetermineifthepatternisinasituation that is ready totrade. But this is just oneform of technical analysis.Let’s move on to the nextform.

CHAPTER4

T
JapaneseCandlestickPatterns
hereareseveralmethodsof illustrating the price
action of a stock. The mostpopular are bar charts, linecharts, area charts, andJapanese candlestick charts.

Bar charts were discussed inChapter 1. Line charts usejust the closing value tocreateasmoothlinethatrisesand falls over time, and areacharts fill in the space underthatlinetodistinguishitfromthe territory above the linewhere price did not travel.Japanese candlestick chartsare the charts used in theprevious illustrations onpatterns.Likebarcharts,they
convey a lot of information:the open, high, low, andclose. I prefer them becausethey are also color coded toshow at a quick glancewhether the price action wasan up or down day (see thesidebar in Chapter 1). Agreen (or white) candle is apositive day and a red (orblack) candle is a down day.Thesehavealongandrobusthistory, and I urge you to

learn it. Steve Nison is thefatherofcandlestickcharting,and his books are a greatresource that I refer tooften;hisclassictextislistedintheAdditional Resources sectionat the end of the book.Japanese candlestick chartingis a fascinating subject, butthatisnotforthisbook.Whatis important for our analysisis using the result of thathistory and Nison’s work to
identify potential tradesetups.In this chapter you will
learnhowtoidentifyspecificcandlestick formations andunderstand their significance.With that knowledge, youwill then learn how toidentify potential tradingopportunities using theseformations.Thesecanbesplitinto three groups: reversalpatterns, continuation
patterns, and indecisioncandles. These patterns cansignal an opportunity for anew trade or they can signalthat a trend reachingresistance may be ending.Almostallofthemneedsomekind of confirmation. Thereare many of these; we willfocus on some of the mostcommon reversal andcontinuationpatterns,butalsointroduce a couple of others

tohelp.Theyusuallycomeinpairsdescribingwhether theyareobservedinanuptrendora downtrend. One drawbackwith Japanese candlestickpatternscomparedtoclassicaltechnical analysis is that theformationsdonotgiveapriceprojection or target, just adirection. That is perfect forthe trend follower butmeansthattheybecomemoreusefulwhen combined and
confirmedwithothermethodswhen applying the setups tooptions trades. And that iswhere the focus should be.Adding the knowledge fromJapanese candlestick patternsas another determinant ofwhenatradecatalystisaboutto happen. Let’s move on tothefirstpair.

■ReversalPatternsHere are some key reversalpatterns and a discussion ofeach.

Hammer/HangingManThe Hammer comes at thebottomofadowntrend,andaHanging Man occurs at thetop of an uptrend. I havealwaysimaginedtheHammernailing into place a bottomand a Hanging Man beingthat guy hanging over theedge of a cliff by his

fingernails. These are singlecandlesticks representing onetime frame of price action.Both are characterized by anopenandaclosenearthetopofthepriceactionforthedaybut with a probe lowerintraday. The real body(difference between the openand the close) is smallcompared to the lowershadow created by thatintradayprobelower.Itisnot
very important whether theopenorthecloseishigher,sothe color of the Hammer orHanging Man does notmatter,justthatboththeopenand close are in the topportionof theprice actionoftheday.If the opening and closing
prices are very close to eachother, this candlestick looksmore like the letter T than ahammer.Thereareallsortsof

crazy names for specificcandles that fit thisdescription. If the openingand closing prices are thesame, then it is also a doji.Thishasaddedimportanceasit signifies indecision, withbuyersorsellersincontroltostart the day, then reversing,and then sellers or buyerstaking control to bring theprice right back where itstarted. If that were not

enough,ifthedojihappensinan uptrend and at the lowpriceoftheday,itiscalledaGravestone Doji. This isthought to be very bearish.And finally, if the dojihappens at the high price ofthe day, it is called aDragonfly Doji. At thebottom of a downtrend aDragonfly Doji is the onecandlestick reversal patternthat does not need

confirmation the next day totrade. It is also where thename of my company,Dragonfly CapitalManagement,comesfrom.The chart of Apple in
Figure 4.1 as it was makingits 2012 highs and thenpulling back containsexamples of both theHammer (in the yellow orlighter circle) and theHangingMan (there are two

—thefirst,second,andfourthcandlesticks in the blue ordarker box). Each one oftheseisa typeofHammerorHanging Man candlestick.This candlestick patternshows a potential for areversal of the trend. Andeachneedstobeconfirmedtotrade. A Hammer isconfirmed by a higher closethe following period and aHanging Man by a lower

close the following period.Whenconfirmedbyacloseinthe direction of the reversal,like the first candlesticks outof the box and the circle,these are triggers to trade anewtrend.
FIGURE4.1Apple—HangingManandHammer

We are just getting started,and already you can see thatJapanese candlestick patternscan have colorful names.Let’s move on to the next

pair. They can also set up anew level of preparedness tolook for reversals. TheHanging Man candles in the(blue) box gave a heads-upforapotentialreversalbeforea consolidation channel hadevenstartedtoform.

BullishEngulfing/BearishEngulfingThis pair is very easy todetect.TheBullishorBearishEngulfing candle is one thatextends beyond the range ofthe previous candle in bothdirections. These needconfirmation to signal areversal: a higher high and a

lower low, with the recentcandle engulfing the totalpriceactionfromthepreviousday’s candle. Some tradersusejusttherealbodytomakethisdetermination,measuringoneagainst thenext,whereasothers use the fullcandlestick, including theupperandlowershadows.Asthis is an art and not ascience, either is fine. To bevalid, each needs to be

confirmed the next day by acloseinthereversaldirection,but it does not really matterwhichmethodyouuseifyouwaitforthatsignal.Thesecangive a heads-up of a changein direction of a trend, andthatiswhywelookforthem.An example of the Bullish
Engulfing is shown in thechart for Estée Lauder inFigure4.2fromlate2012into2013. Notice that the long

(green or white) candlegobbleduptheentiretyoftheprevious (red or black)candle, including the longupper shadow or tail. All ittakesisapennyoneithersidefor this candlestick pattern.Likeotherreversalpatterns,itneedstobeconfirmed,inthiscase with a higher close thenext day. Here the next daywas a “gap and go,” so thepattern did not technically

confirm until the price hadmoved to 60.68. From thatpoint you can see that itcontinuedtomovetoover64foranicereturn.
FIGURE4.2EstéeLauder—BullishEngulfing

Often the confirmation caneat well into the potentialprofit in the reversal trade.Becauseofthis,manytraderscheat on their entry, buying

early, especially when theBullishEngulfingcandleissolarge,toincreasetheirchancefor profits. The technicalconfirmation for this reversalcameat about60.75 thenextday, a full $2 above theBullish Engulfing candleclosing price. This can bedangerous. Notice a littlefurther left in the chart thatpoint A is also a BullishEngulfing candlestick after a

consolidation period in thesamestock.Itdidnotconfirmwith a higher close thefollowing day, though, andnever went higher. Jumpingthe gun on this trade wouldhaveresultedinaloss.Donotjumptheguntoenteratrade;waitfortheconfirmation.With that said, there is
another signal in this chartthat would get many tradersto cheat with regard to the

labeled Bullish Engulfingcandle. The actual BullishEngulfingcandleitselfisalsowhatisknownasaMarubozucandle. The Marubozu is alongcandlewithverylittleorpreferably no upper andlowershadows.Thissignifiesa very strong trend day, inthis instance starting at thelow, continuing higher allday, and signaling moreupside to come. It also

requires confirmation totrade, but the combinationofa Marubozu and a BullishEngulfing candle would getmany traders to enter on apositiveopenthenextday.The Bearish Engulfing
candle operates the sameway. The chart of Take-TwoInteractiveSoftwareinFigure4.3 shows two examples. Ineach case the BearishEngulfingcandlehasahigher

high and a lower low. In thefirst example it is confirmedlower the followingdaywitha close at 13.55 but neverreally goes much lower withthe ultimate low at 13.24.This one was a dud. Thesecond example was neverconfirmed, as the candle thenext day closed above theclose on the BearishEngulfing candle and in factthe following day a Bullish

Engulfing candle printed andwas confirmed higher twodays later for an eventualmoveuptonear17.
FIGURE4.3Take-TwoInteractiveSoftware—BearishEngulfing

The Bullish and BearishEngulfing candles can signalpowerfulmoves.But,asseenin these examples, cheatingon an early entry before

confirmation can lead to aloss. Wait for theconfirmation. From myexperience these candlestickpatternshavemorepowerforatrendreversalthelongerthetrendthatprecedesthem.Thefirstexample,withanine-daydowntrend before a BullishEngulfing candle, provedmore important than theothers.Also, ineachof theseinstances there was no long-
term support or resistance orothertrendlinethatcameintoplaytodrawyourattentiontoa potential catalyst forreversal; there was only thecandlestickpattern.
DarkCloudCover/PiercingLineThenextpair revertsback tomore colorful naming. TheDark Cloud Cover evokes agloomy picture of a stormapproaching,anditshould.Itdescribesacandlestickwherea long positive day isfollowedbyareversalofover50 percent of that move. It

rainsonyourhappiness fromthemovehigher thepreviousday. The chart for Crocs inFigure 4.4 shows the down(red or black) candle onDecember 12, 2012,following the up (green orwhite) candle: an up dayfollowed by a higher openand a down day, but not anengulfingcandle.Thispatternalso needs to be confirmedwithadowndaythenextday
to signal a trend changelower.Manywillcheatontheentry on this pattern aswell,butnotice that it did confirmlowerandcontinueddownforthenextday.
FIGURE4.4Crocs—DarkCloudCover
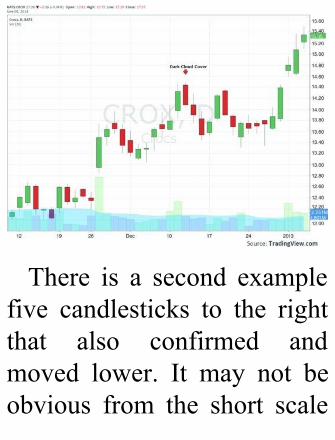
There is a second examplefive candlesticks to the rightthat also confirmed andmoved lower. It may not beobvious from the short scale

of the chart, but thesehappened in an uptrend, andwould not be expected toyieldstrongreversals.Butfortactical shorts that couldpotentially turn into bigreversals, the candlestickpattern offered entries thatdid not show up fromclassical technical analysis.Thepotentialtoadd3percenton the first short(confirmationthenextday)to
a stock in an uptrend is nottooshabby.The Piercing Line or
PiercingCandleisthebullishcounterparttotheDarkCloudCover. It has a militaryconnotation like manyJapanesecandlestickpatterns:piercing the line to reversethe move against you andadvancefurther.ThechartforKroger Company in Figure4.5 illustrates this pattern
with a long red (or black)candle followed by a green(or white) candle that opensbelow thepreviouscloseandthen retraces over 50 percentof the previous day’s move.The confirmation candlecame the next day and thenthe price ran higher from21.70 to 23.60 over the next11 days. You should noticethat inthatuptrendtherewasa Dark Cloud Cover pattern

—the (red) candle with thelong lower shadow onSeptember7thatfollowedanupday—butalsothatitneverconfirmedlower.Sothetrendnever changed. Obey thesignals.
FIGURE4.5KrogerCompany—PiercingLine

TheDarkCloudCoverandPiercing Line can signalpowerful moves. These alsotend to perform better frommyexperience the longer the
trend that preceded them.Keep your eyes open forthese patterns, as they canforetellatrendchangebeforeotherpatternsseeit.

StarsStarscome in threevarieties:Evening, Morning, andShooting. They are allreversalpatternsafteratrend.A Star is characterized by athree-candlestickpattern.Thefirst is a relatively long realbody candlestick in thedirectionofthecurrenttrend.The second, often referred to

as the Star, is a small realbodycandlethatcontinuesinthe direction of the trend. Itdoesnot have to close in thedirection of the trend, justextenditabitandbesmall.Itshould not overlap with thefirst candle. The third is thereversal candle, which islonger. Not until the thirdcandle is printed does thereversalstand.The Evening Star, as you

might have guessed, happensat the end of an uptrend. Asthedaycomes toacloseandmoves intoevening, thisalsodescribes the Evening Starlate in a trend higher. The(yellow or light) oval on thechart of Illumina in Figure4.6 from late 2012 is a goodexample.Thesepatternsshowstrong demand from buyersthat forces the stock to gaphigher in price, only to find
that there are no follow-through buyers, and maybethere are sellers in thefollowing day. The patterndoes not need furtherconfirmationbut,asshowninthe example, it does notalways work out. This oneconfirmed on the close at51.17 andmoved lower onlyasfaras50.25beforeturningback higher. If you took thisshort trade you were likely

stopped out quickly for asmallloss.Wewilltalkmoreabout stop losses in Chapter10.
FIGURE4.6Illumina—EveningStar
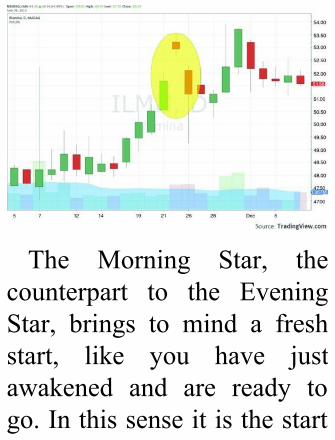
The Morning Star, thecounterpart to the EveningStar, brings to mind a freshstart, like you have justawakened and are ready togo.Inthissenseitisthestart

to a trend reversal higher. Itstartswitha longcandlesticklower followed by a gapdownwith a small real bodyand then a gap higher and along body candle against theprevious trend. The (yellow)circle at point 2 on the chartforMarriottinFigure4.7isagood example of a MorningStar. This one did signal anewtrendhigherandamovefrom the low at 25 to 28.50

over just a few days. Againyou can notice that the thirdcandlestick runs quite a bitand the close at 26.60absorbed nearly half of themovehigher.Becauseof thispossibility, many tradersshortcuttheEveningStarandMorning Star patterns bybuying on the signal that thethird candle is reversingintraday instead of waitingfor the close to confirm it.
The most important part ofthe pattern is the smallergapping candle and theclosing of the gap. That iswhat to look for whenpreppingforatrade.
FIGURE4.7Marriott—MorningStarandShootingStar
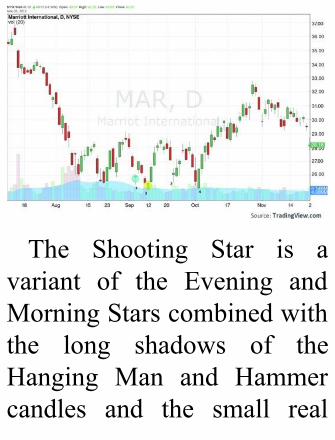
The Shooting Star is avariant of the Evening andMorningStarscombinedwiththe long shadows of theHanging Man and Hammercandles and the small real

bodiesof theGravestoneandDragonflyDojis.Itcanoccurafteratrendhigheroratrendlowerandtypicallyhasalongshadow and small real bodyafter a gap from the trend,with the real body at theextreme end of thecandlestick nearest the trend.It is different from theEveningandMorningStarsinthatitisasinglecandlestick.The (blue) oval at point 1

ontheMarriottchartshowsaShootingStaratthebottomofa trend lower.Thegap loweris followed by a small realbodycandlewith thebodyatthetopoftherange.Thisonedid not give a lot to theupside,but therewasa smallmove.Asasidenotehere,thebroader picture for Marriottduringthisfour-monthperiodshows a bottoming processwhile both the Shooting Star
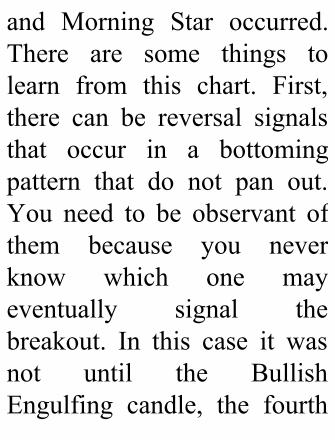
and Morning Star occurred.There are some things tolearn from this chart. First,there can be reversal signalsthat occur in a bottomingpattern that do not pan out.You need to be observant ofthem because you neverknow which one mayeventually signal thebreakout. In this case it wasnot until the BullishEngulfing candle, the fourth

reversal signal (point 4) thatthe trend eventually reversedhigher.Next, reversal signalsin a bottoming process orconsolidation often peter outbeforeasolidtrendbeginstofollow. You may take lossesduring these signals, but thatis okay. They giveinformation (a trend changein this case from down toneutral),andthatisusefulforfuture monitoring. If you do

see a consolidation channelforming, you can be a bitmore conservative with atradesetup.The chart of Netflix in
Figure 4.8 also has aShootingStar, but at the top.Inthiscaseitwasattheverytop, theall-timehigh.This isthe holy grail of tradingsignals that traders look for.Notice the gap higherwith along upper shadow before a
pullback and close near theopen. A short entry the nextdaywouldhavehadafewfitsand starts along theway, butthe trend eventually took theprice79percentlowerinlessthan five months. That is atrade. And this is why welook for these patterns. It isnotoftenthatyougetasignalatatopandthenhaveatrendofthismagnitude,butitdoesmake the businessmore fun.

Andnoticethattherewerenoclassical technical analysissignals that this reversalwould occur. Before you allsend me e-mails asking howmuch of this one I caught Ihavetoconfesstheansweriszero.Ipickedthewrongtimeto spend four weeks drivingaround the country with myfamily. You win some andthen some just keep youhungryforthenextone.

FIGURE4.8Netflix—ShootingStar


■ContinuationPatternsFollowing are somecontinuation patterns alongwithadiscussionofeach.

ThreeAdvancingWhiteSoldiers/ThreeBlackCrowsThisnextpair ismyfavorite.The Three Advancing WhiteSoldiers is a bullish pattern.This is illustrated using thechartofPNCBank inFigure4.9fromearly2013,thethree(greenorwhite)arrowspointout the pattern. In the olden

days when there were onlyblackandwhitecharts,whitestoodforanupdayandblackforadownday(insteadofthegreenforupandredfordownin these charts on thecomputer screen). So threeoverlapping white candleswere a big deal. The key tothis pattern is that the realbodiesof thecandlesoverlapand proceed higher each daywith relatively small

shadows. If there are gapsbetweenthemorif theyhavelong real bodies or shadowsthere is a greater chance forthepatterntoexhaustquickly.
FIGURE4.9PNCBank—ThreeAdvancingWhiteSoldiers

Three Advancing WhiteSoldierssignalsastrongtrendthat will continue higher—white for the good guys andthey are moving forward. In

this example, the first oneconfirmed the Hammerreversal candle and then theprice started higher, runningupfrom62.50toabout66.50.Since it is a multiple-candlepattern, it does not need anyconfirmation. Just buy ’emup. When there are gapsbetween them, this is calledanAdvanceBlock.The three(greenorwhite)candlesfromApril8toApril10(furtherto

the right in the chart)illustrate an Advance Block.Despite the consecutivecandles,thegapsareasignofcaution (perhaps too mucheagerness to buy) that cancause the trend to endabruptlywhen thebuyersaredone.Theoppositepattern,Three
BlackCrows, brings tominda bunch of large, obnoxiousbirds picking up seeds or

cropsorthegrassoutofyourlawn. Nobody likes crowstoday, and apparently theJapanesedidn’t, either,1,000yearsago.Thisisabadvisualand it foretells a downsidetrend. If they were createdtoday, this pair of patternsmightbecalledThreeLotteryWinners and Three SuicideBombers.ThechartofUnderArmour in Figure 4.10 has aThreeBlackCrowsformation

marking a reversal lower. Aprolonged downsidemovement followed. Thepattern triggered at 39.61 onthe close of the third candlelower and ran eventually to27.20. This also needs nofurther confirmation beforeenteringshort.
FIGURE4.10UnderArmour—ThreeBlackCrows
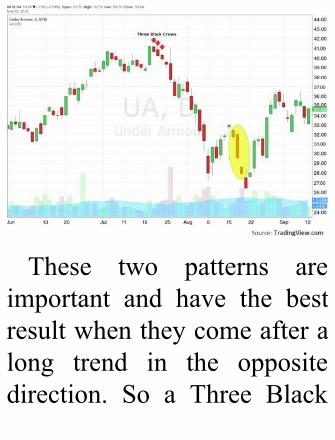
These two patterns areimportant and have the bestresultwhentheycomeafteralong trend in the oppositedirection. So a Three Black

Crows formation is strongdirectlyafterarunhigherlikethis one in Under Armourfrom 31 to 40. One otherpointcanbeillustratedintheUnder Armour chart. Noticethattherewerealsothree(redor black) candles in a rowlater in the chart, highlightedin theellipse,a reverseofanAdvance Block. Thesecandles gapped lower, andone had a long real body,

endingupexhausting the runquickly.Forthepatterntobevalid, the real bodies mustoverlap and be average inlength. I cannot give you adefinition of average length.It is kind of like the currentdefinition of pornography.You will know it when yousee it. Look relative to thesurroundingcandles.

RisingandFallingThreeMethodsMaybe the most boringlynamed pair of patterns, thesewere certainly not coined bysomeone seeking favor withthe emperor. The Rising andFalling Three Methodspatternsaredifferentfromallof the previous patterns inthattheysignalacontinuation

of a trend, not the start of anewtrendorareversal.Theseare typically five-candlepatterns,withalongcandleinthe direction of the trend,followedbythreesmallbodycandles where the entire realbody remains inside the realbody of the previouslymentioned long candle; thenthe fifth candle is anotherlongcandleinthedirectionofthe trend that makes a new

higherhighor lower low.Sothe formation consists of along candle, three smallerconsolidating candles, andanotherlongcandleresumingthe trend. Ipicture theseasasandwich with the two longcandles as the bread and thethree interior candles maybeas the turkey, a slice ofcheese, and a tomato (or anonionifthatsuitsyoubetter).The Rising ThreeMethods

is illustrated in the chart ofGoldman Sachs in Figure4.11 from early 2013, in the(yellow or light) box.Noticethat it happens in themiddleof the trend, when it lookedlike a consolidation mightoccur. It might also beinterpreted and a bull flag oraconsolidatingchannel.Alsonotice that the interiorcandles of the pattern hadshadows that exceeded the

first candle’s range,butnonehad real bodies that wereoutsideoftherealbodyofthefirst candle. Finally, I shouldpointoutthattherewerefourinteriorcandlesandnot three(bothatomatoandanonion).Thereissomeleewayonthisto add a candle or two orsubtract one. How many istoo many, you ask? Again,back to the porn definition:You will know it when you

seeit.Wearenotlookingforaquadruple-deckersandwich,just lunch before the nextmove higher. Finally, noticethattheruncontinuedfor$12after the pattern completed,despitehavingalreadymoved$26 into the pattern. Justbecause a stock has had along run does not mean itcannot have another runequally long or even longerthanthefirstrun.
FIGURE4.11GoldmanSachs—RisingThreeMethods
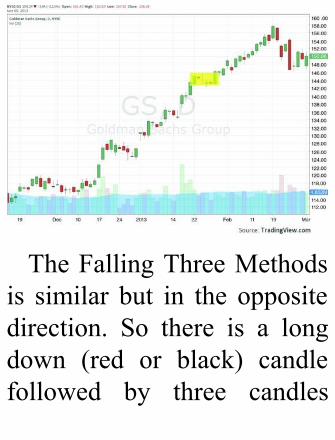
TheFallingThreeMethodsis similar but in the oppositedirection. So there is a longdown (red or black) candlefollowed by three candles
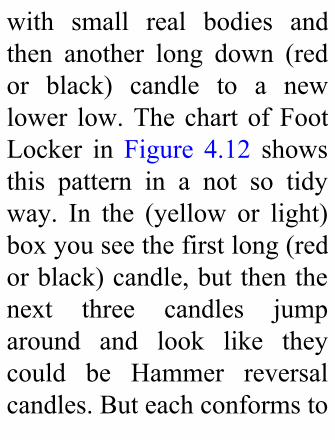
with small real bodies andthen another long down (redor black) candle to a newlower low.Thechart ofFootLocker in Figure 4.12 showsthis pattern in a not so tidyway. In the (yellow or light)boxyouseethefirstlong(redorblack)candle,butthenthenext three candles jumparound and look like theycould be Hammer reversalcandles.Buteachconformsto

theFallingThreeMethodsbymaintaining the real bodywithin the long first candle.The long (red or black)candle following to confirmthe pattern and continueddownside is also unlikewhatyoumight see in a textbook.This is not a neat sandwichvisual, but one that ismangled or falling apart—like you packed it in yourluggage and brought it on a
trip, only to find it smushedwhenyouare ready to eat it.Allthepiecesarethere,andittastes great, but it does notlook very good. But like thesandwich, it is the taste thatmatters, not the looks.Nonetheless it is a FallingThreeMethods,andthetrendcontinued lower for another$3.
FIGURE4.12FootLocker—FallingThreeMethods


Although these arecontinuation patterns, theycan also be interpreted as achange in the trend, if youcanexpandtothinkingofthe
trend in three options: up,down,orsideways.Thetrendmoves from one direction tosideways and back to thatsame direction again. In thisway the trend change cansignal a new entry if youmissed the initialentryat thebeginningofthetrend.

■IndecisionCandlesThere are three types ofindecision candles worthdiscussing:doji, Harami, andSpinning Top. These candleslook just like the middlecandlesintheStarformationswithasmallrealbody.Threethings distinguish them from
each other: their placementrelative to the prior candle,thesizeofthatrealbody,andthe sizes of the shadows.What they all have incommon is a signal ofindecision, often thought tobe a reversal signal, whentheycomeafteralongtrend.
DojiThedojiisprobablythemostrecognized and talked-aboutcandlestick. Its open andcloseareatthesamelevel,sothere is no real body. ThechartofJazzPharmaceuticalsin Figure 4.13 shows one onMay 7, 2013. These candlesarecommonlythoughttobeasign of a reversal but they

truly indicate indecision.Think about how they areformed. The stock opens atoneprice,headseitherhigheror lower, reverses to theopposite direction, and thenendsupclosingunchanged.Itis like it has attentiondeficit/hyperactivity disorder(ADHD). At some point, itwas expected to go higherand then lowerandendedupback where it started—the

definitionofindecision.Butitalso means that a trend thathadbeeninplace,likethatinJazz, has lost its strength. Itcould regain it or it couldstarta reversal. It isbetter tothink of these types ofcandles as potential actionpoints, almost like when astock reaches a support orresistance line. It can moveeither way, and you need tobeprepared.
FIGURE4.13JazzPharmaceuticals—Doji
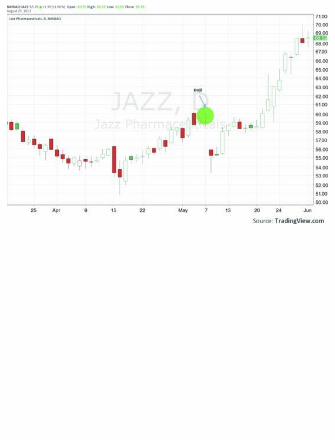

SpinningTopLooking like theoffspringofthe doji and a Star is theSpinningTop.Itdistinguishesitself by generally havinglongershadowsthanadojiorStar and a small but visiblereal body. The sameargument for showingindecision as in the dojiapplies here. It may be an

evengreater indecisiongiventhelongershadows.Thechartof Salesforce.com in Figure4.14 shows two examples.Spinning Tops should beviewedlikeadoji,apotentialforaction.
FIGURE4.14Salesforce.com—SpinningTop

HaramiThe last of the trio, theHarami, is a little bitdifferent, as it ismuchmorelikely to be a reversal signalthan are the previous twocandles. A Harami can looklikeadojioraSpinningTopor just a small real bodycandle. The Harami is alsothe opposite of a Bullish or
Bearish Engulfing candle.Classictechnicianswouldcallit an inside candle. That isbecause the full body of theHarami is contained withinthe body of the previouscandle. The chart of FreshMarket in Figure 4.15highlights one that is in theformofaSpinningTop.Thisone did confirm higher andinitiatedatrendreversal.TheHarami is also a call to look

for action to follow, but inthis case almost always tolook for that action to be areversal.
FIGURE4.15TheFreshMarket—Harami


■ConclusionJapanese candlesticks havebeen around for more than1,000 years and have a greatand storied history.We haveonly scratched the surfacewith these examples. Thereare many more JapanesecandlestickpatternswithsuchfunnamesasTweezersTops,ThreeMountainsandaRiver,

Belt Hold, and Tower Topsand Bottoms as a fewexamples. Do continue toexplore more on your own.Learning should be fun. Themost important thing to takeaway from this chapter onJapanese candlesticks is thatone or a very few days cansignalachangeinthetrendora point of action and anopportunity to trade andprofit.Thesesignalsoftendo
notshowupanywhereelseintechnical analysis. Byunderstanding the nuances oftheJapanesecandlesticksandcombining them with thepatterns from earlier in thebook, you can now start tocreate a technical mosaic foreachstockyoureview.Youshouldnowbeable to
recognize reversal,continuation, and indecisioncandlesticks. The reversal

candlestick pairs—Hammerand Hanging Man, Bullishand Bearish Engulfing, DarkCloud Cover and PiercingLines,alongwith theStars—can give an indication andthenconfirmareversalinjustthree candlesticks, withplenty of time for you toknow when to act. Thecontinuation candlestickpattern pairs like the ThreeAdvancing White Soldiers
and Three Black Crows, andRising and Falling ThreeMethods, can give you anunderstanding that a trendwill continue despiteconsolidation or beingextended. Knowing theindecision candles can giveyoualeguponothers,asyoucan now be prepared foraction in either directionwhen you see one of thesecandles.A finalpoint: if you

look back through theJapanese candlestick chartexamples in thischapter,youwill notice that the reversal,continuation, and indecisionpatterns occurred withoutcorresponding signals fromclassical technical analysis.This leads to the conclusionthat combining these twostyles can be beneficial toyouranalysisandtrading.Butitdoesnotendwiththesetwo

methods.

CHAPTER5

T
DerivedandQuantitativeAnalysis
here are many technicalmethods of analyzing
stocks that take on a morequantitative bent or arederived from a technicalchange in apattern.Manyof

these are either directly fromFibonacci analysisorderivedfromit.Thischapterexploressome of these: Fibonaccianalysis, Elliott Waveprinciples,andHarmonics,aswell as introducing Gannanalysis and follow up onAndrews’ Pitchfork analysispresented in Chapter 1. Bythe end of the chapter youshould know the majorFibonacci retracements and

extensions, understandrudimentary Elliott Waveanalysis, and observe thepotential that a Harmonicpattern may be in play. Thisisgettingintomoreadvancedtechnicalanalysis,andnoonecanbeanexpertfromreadingone chapter in a book onthese subjects. But a basicunderstanding of theirprinciples will help informing trading ideas and

analysis. As with all otherareas, there is suggestedadditional reading on thesesubjects at the end of thebook. Let’s start withFibonaccis, as so much isbuiltonthem.

■FibonacciAnalysisLeonardo da Pisa, betterknown as Fibonacci, diedover 750 years ago, but hisinfluence is still felt today.He led a fascinating life andisresponsibleforsomeofthemost important aspects ofmodern mathematics, despite

the fact that you may neverhave learned about him inyour math classes. He iscredited with bringing theHindu-Arabic numeralsystem (a fancy name forwhat we use today) toEurope, as well as anumerical sequence that is initself important to technicalanalysis and is the buildingstructure for other systems,theFibonaccisequence.
The Fibonacci sequencewas not actually discoveredby Fibonacci himself. In hiswork, Liber Abaci, heexplained the derivation ofthe sequence, whichoriginated in Indianmathematics, by describinghow a population of rabbitswould grow under idealcircumstances. By startingwith one rabbit and addinganothertogettworabbits,the
rabbits would mate and thentheir offspring would mate.Thus the iterations of thesequence were laid out. Youcan read more about thederivation, but you get thegist. The numbers growexponentially. The actualsequence expands by addingthe last two numbers to getthe next one. The first 13numbers in the sequence,then, are 1, 1, 2, 3, 5, 8, 13,
21,34,55,89,144,and233.These in themselves arefascinating,astheyarefoundthroughout nature. There aremanyvarietiesofflowersthathave 3, 5, 8, 13, 21, or 34petals,forexample.ButIdigress.Whatismost
interesting for the technicaltrader is the ratio of eachnumber to the previousnumber.Thisratio,knownastheGoldenRatio orΦ (phi),
approaches 1.618 as thesequence progresses. It onlytakes the first 13 numbers tostart getting very close toΦ.This ratio is also found allthroughout nature. The mostfamous example is thenautilus shell spiral, but italso describes the markingsonmoths,theproportionsofadolphin,androughlytheratioof the top and bottom of thehuman body. This ratio has

some very interestingmathematical properties. Forinstance, 1/1.618 is equal to0.618. But enough of thegeekymathstuff.Ifyouwanttoreadmoreaboutthis,thereis plenty to read out there.The point is that this ratio isembedded in the humanexperience andsubconsciously pleasing tothe human eye. It is on thisbasis and from practical

applicationthattheuseoftheGolden Ratio in technicalanalysiscameabout.Applied to technical
analysis, Φ and some of itsderivativesbecomeimportantas measures of flow for atrend or pullback.Specifically, the ratios0.236,0.382, 0.5, 0.618, 0.786, and0.886 are themost importantin terms of retracements orpullbacks from a trend. The

0.618 is obvious. The othersare derived from it. 0.786 isthe square root of 0.618,0.886 is the square root of0.786, and 0.382 is 0.618squaredbutitisalsofoundintaking the ratio betweennumbers in the sequence thatare two numbers apart. And0.236 is the ratio betweennumbers that are threepositions apart. The mostcommonly used ratios are

0.382, 0.5, and 0.618. Theseratiosareusedtodetermineapotential area for a pullbackfrom a major move in onedirection. That is to say, amoveof100pointshigher inastockwilloftenfindsupportonapullbackorreversebackhigher after amove lower of38.2, 50, or 61.8 points.Derivations of Φ are alsohelpful for targets on a newtrendasitextendsbeyondthe

length of the initial trend.Extensions of 1.27, 1.382,1.5, 1.618, 2.0, 2.24, and2.382arecommon.Soafterapullback the next trend mayextend to 127, 138.2, or 224pointswithresistanceatotherextensions. Collectively,thesefractionsandextensionsare known as Fibonacciratios.Right now I know you are
thinking that I am crazy if I

am going to let the ratio ofthe number of petals in adaisy (34) to the number ofpetals in a black-eyed Susan(13) determine when I willbuy or sell a stock. So let’slook at a few examples toshowthatthisisforreal.Themonthly chart for GoldmanSachs inFigure 5.1 from thepeak before the financialcrisisisagoodexample.Theinitial down move from

235.07 to 44.70 retraced toabove the 61.8 percentFibonaccilevelbeforepullingback to 162.35 and settlingforacoupleofmonths.Fromthere it bounced between the50 percent and 61.8 percentFibonacci levels beforecracking lower. The 61.8percent level becameimportant resistance again inearly 2011 before a pullbackto the 23.6 percent level.

From there it bouncedbetween the23.6percentand38.2 percent until breakinghigher and levelingeventuallyatthe61.8percentlevel again. Just from thischart the major Fibonaccilevels played a role as eithersupport or resistance at leastseventimes!
FIGURE5.1GoldmanSachsMonthlywithFibonacciLevels


TheweeklychartofNetflixinFigure5.2 isanothergoodexample. In this one we seethe collapse from the high at305 through the 78.6 percentlevel before a bounce that
was contained by the 61.8percent Fibonacci level andan eventual bottom afterretracing 88.6 percent of theprior move higher. At thatpoint the price started to riseandmetresistanceatthe38.2percent level, sending itbacklower to the 50 percent levelbefore a bounce up to the23.6 percent level. I haveadded a second set ofFibonaccilevelsinthesecond

Netflix chart in Figure 5.3measuring the retracementhigherofthecollapseof2011into 2012. These show thatafter breaking above a 50percent retracement of thatmove it became support. Atthis point it can getcomplicated. The stock priceused a pullback to the 38.2percent original Fibonaccilevelasaceilingandthenew50percent level as a floor to

consolidate. It then droppedto the original 50 percentlevel and then moved higherto findstabilityover thenew61.8 percent level before atouch higher at the old 23.6percent level. Gettingknocked back there, the new61.8 percent level providedsupport again. Each of thesemoves can also be brokendown into a series ofFibonaccilevels.

FIGURE5.2NetflixWeeklywithFibonaccis

FIGURE5.3NetflixwithNestedFibonaccis

With many changes intrend, continually addingFibonacci levels can getmessy, but it also illustratesseveral important points.First, nestedFibonacci levels

can add strength to supportand resistancewhen they getvery close to each other.Butit is important to use a levelofgranularitythatreflectstheproper scale for your tradingstyle.Asa swing trader, it isnicetoknowthatthelevelsof237.17 and304.70 inNetflixare important, but my rangewill likely be inside both ofthem. For a longer-termposition holder, they make
more sense and you mightalsowanttoaddsomeupsideextensions.Addingindicatorsjust to fill up a chart can bedistracting.Knowwheretheyare, and if they are notimportant toyour time frameor trade, then remove themagain.Second, it is good toknow
when Fibonacci levels occurvery close to each other.TheseFibonacciclustersfrom

the nestedmeasurements canaddalotmorestrengthtotheimportanceof that level. Justimagine if the day traders,swing traders, positiontraders, and long-terminvestors all think that the304.70 level is important.Withtradersonmultipletimeframes targeting the samelevel,itislikelytogivesomeresistancefora longerperiodof time. Finally, looking at
nested Fibonacci levels canalso reveal large pocketswhere there is no potentialFibonacci resistance orsupport. Wouldn’t you wantto know that there is smoothsailing for awhile instead ofalotofrockyprojectionsthatmaygetintheway?When it comes to moves
outside of the retracementrange, Fibonacci extensionscanbeoneofalimitedsetof

tools tousetoidentifywherea natural rhythm pause mayoccur. The Goldman Sachschart inFigure 5.4 is a goodexample of this. The movelower from 128.67 to 90.45wasretracedandstalledatthe78.6 percent Fibonacci levelbefore pulling back andfinding support at the 61.8percent level. But then itcontinued higher above the128.67level.Withnohistory,
how do you figure wheretheremightbeapause?Sometraderswould suggest itdoesnotmatter—justkeepholdingthe stock until it stops. Butwhat if itstallsat166.88,forexample, a 200 percentextension of the downwardmovement? Should you justdump the stock there on apullback?Maybe.Butifyourrisk tolerance keeps you inthe stock to 152.29, a
pullback to the161.8percentextension, you may be sorrytoletitgothereifyoudidnotknow that it was a logicalspot of support, as it didindeed then bounce back tothe 200 percent level.Without an understanding ofthe Fibonacci level ofretracement and extension,theupwardlevelsmighthaveseemed totally meaninglessandrandom.

FIGURE5.4GoldmanSachswithFibonacciExtensions

Idonotexpectyoutodrawnested Fibonaccis on everychart.Oftentimesitisobviousthatthecurrenttrendisstrongand moving beyond the fullretracementzone.Inthatcase
knowing where the nextpause point might be can beuseful,butitdoesnotneedtoclutter the chart. You canprobablyseethat ifyouwereto add Fibonaccis for everymoveupanddownandkeepthem on the chart you couldeventually make a case forsupportorresistanceateverypenny in a consolidatingstock.Sometraders thriveonthis. I do not. Keeping the
picture clear with only thoseFibonaccis thatpertain tomytime frame helps that. Whatexactly does that mean? If Iamlookingfora$10moveina stock and the last up ordown move was only $2 infull,thentheFibonaccisfromthat move will be irrelevant.Additionally, if the movebetween the 38.2 percentFibonacci and the 50 percentFibonacci is $30 around my

$10 anticipatedmove, then Ialso do not care. Fibonaccisaddanotherlayeroftexturetothetechnicalmosaicwehavebeenbuilding.But there is more to
Fibonaccis than this.FibonaccinumbersandratiosarethebasisforElliottWaveprinciples and Harmonicpatternsaswell.Iurgeyoutocontinue to learnmore abouttheir derivation and
application.Fornow,though,it is important to understandthat at these key ratiossupport or resistance ismorelikely to take hold, and asprice breaks these levels ithasmoreroomtomoveuntilit approaches the next level.Lock in your brain the 23.6percent, 38.2 percent, 50percent, 61.8 percent, 78.6percent,88.6percent,and100percent retracements, as well

as the 113 percent, 127percent, 138.2 percent, 150percent, 161.8 percent, and200 percent extensions.Practice with them, but keepitclean.

■HarmonicTradingThe Harmonic tradingapproachhasFibonacciratiosatitsroots.ItwasdefinedbyScott M. Carney, and heshared his work with theworld in three books and hiswebsite.Allareexcellentandgive good background and

examples. I urge you to seekthem out and read them. Forour purposes let’s boil themdowntoafewparagraphsandconcepts.Harmonic patterns all
contain one basic structure,the AB = CD. This isillustrated in the chart of 3DSystems in Figure 5.5. Theconceptisthatthereisatrendfrom A to B. This trendretraces to C, before a new
trendmoveshighertoD.Theretracement from B to Cshould be between 38.2percent and 88.6 percent ofthemove fromA toB.ThenthemovefromCtoDshouldbe equal to the initial movefrom A to B. Immediatelyyou can see this is not thecaseforthischart.Theinitialmove from A to B was$20.50, and the retracementtoCwas$8.50.A41percent
retracement fits within theparameters. But the movefrom C to D at $26.50exceeds the initial $20.50moveby$6.Hereisthetrick.The second trend leg canextendbeyond the initial leg.ThischartshowslegCDasa127 percent extension of legAB.Thesecondlegcanhaveextensionsof138.2percentor161.8 percent or any otherFibonacciextensionaswell.
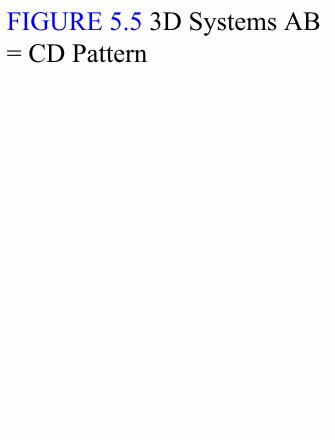
FIGURE5.53DSystemsAB=CDPattern

The takeaway iswhen yousee an AB = CD patternbuilding touse the initial legasaprimarytargetandallowthat it can extend. Thesepatterns can repeat several
timesaswell. Ifyouwere torelabelthemovefromCtoDas A to B, and then look atthepullbacktothe27.60areaas point C, a new point Dcouldbetargetedat54.10ona pure AB = CD. Harmonicpatternsalsogiveanestimateof time to achieve the target.Theruleistoassumethatthetimeittookforthefirstlegupwillberepeatedinthesecondleg higher. In this example

that would project that pointD would be hit in July.Obviously it happened inJanuary, well before that. Itcan also take a lot longer.That brings in a second rule,that the price target is moreimportant than the timetarget.Harmonic patterns use
Fibonacci ratios, and theyappear in the price actionregularly—more so than you

might think. The mostimportant ratios forHarmonics are the 0.618 and1.618 ratios, or phi, theGoldenRatiofromFibonacci.The primary derived ratiosfrom these, then, are 0.786,0.886, 1.13, and 1.27. Thesearethesquarerootandfourthroot of the primary ratios0.618 and 1.618. Finally, thecomplementaryderivedratiosare 0.382, 0.50, 0.707, 1.41,

2.00, 2.24, 2.618, 3.14, and3.618. Again, there are a lotof numbers and ratios toremember, but don’t worry.The theory behind thesenumbers is laid outeloquently elsewhere and soare the details and subtletiesof the patterns.Wewill lookat some examples and thenhighlight ideas as to how toemploy them in yourtechnical review of the

individualcharts.The broader Harmonic
structure actually starts withthelegbeforetheAtoBleg.This ends up making a five-point pattern. This is labeledtheXtoAleg.Includingthisleg, Carney has developednine basic patterns and theyall have cool names: Bat,Gartley, Crab, Deep Crab,Butterfly, Shark, ThreeDrives, and 5-0, to

supplement the boring AB =CD pattern. With this extralegtheyallresembleatypeof“W” on the chart, but nonehavethebottomsof theWatthe same spot. There are nodouble bottoms inHarmonics. If it is a truedouble-bottomed W ordouble-toppedM,thendonotlook to Harmonics. Also,thereareonlytwoexceptionswhere the second bottom is
lowerthanthefirst,theSharkand the 5-0. The differencesineachpatterncomefromthedepthoftheretracementsandthen the new trends. All canbeused to identify two typesof trades, continuation andreversal. The continuationcomesfromthecompletionofthe fourth leg, from B to C,and a reversal giving aprojection to finish thepattern at D. The reversal

trade comes after reachingDatwhatiscalledthepotentialreversalzone(PRZ).Amoveretracing back through theentire PRZ via a terminalprice bar gives a reversaltarget for the entire pattern.The first target will be amove retracing 38.2 percenton the entire span of thepattern, followed by asecondary target of a 61.8percentretracement.Iknowit

sounds complicated, but it isnot really. First look for theW formed or forming, andtake it from there.Let’s lookatafewexamples.TheThreeDrivespattern is
the simplestandshowsup inthe chart of Wells Fargo inFigure5.6.Here,notethatthepeaks are equidistant in aHarmonic ratio, in this case127percentapart,andhappenatequaltimeintervals.Thisis
a precursor to a reversallower, as you can seehappenedinthechart.
FIGURE5.6WellsFargo—ThreeDrives

The next example is aBearishButterfly in thechartof Occidental Petroleum inFigure 5.7. Notice that thepattern started in September2012atXandrandowntoA
in early December. Fromthere it retraced 78.6 percenthigher (defining theButterfly)toBinFebruary.Aretracement lower to C inAprilwasthenfollowedbyatarget of amovehigher toDat127percentofthelegXtoA. So after confirming areversebackhigher atCat aprice of about 77, it had atargethigherofover96.CanyoumakeouttheW?Itisthe

XABCD. That is a moveworth owning, don’t youthink?Youcanalsoseethatitis reinforced by the InverseHead and Shoulders pattern,withCasthehead.Thatgivesa price objective of 91whenconfirmed over the necklineat 84. This, then, becomes avery strong pattern, as twodifferent types of technicalanalysis both give extrememovesas targets ina trend—
the mosaic we have beentalkingabout.Thepatternhasnot quitemade it to thePRZat this time, reaching only a113 percent extension, butwasstillagoodonetofollow.It could still continue higherandachieve thePRZ.Carneycalled this a bearish patternbecause it was meant toconfirmareversallowerafterhitting point D. If for amoment you can pretend it

did hit 96.70 beforereversing, then the 38.2percent initial price objective(IPO) would be measuredagainst the range from 70.80to 96.70 or $25.90. Thiswould call for a pullback of$9.90 at 38.2 percent or $16at 61.8 percent of the range.These are also major movesworthcatching.
FIGURE5.7OccidentalPetroleum—BearishButterfly


The third example is of aBullish Shark in the chart ofAppleinFigure5.8.IthastheX toA legbeforeapullbackto B, followed by a movehigher to C that defines the

Shark.ThisisdefinedwithCextending somewherebetween 113 percent and161.8 percent of the A to Bleg higher. This pattern thengives a target lower to eitheran 88.6 percent retracementof the X to A leg at 386 inthisexample,ora113percentextensionoftheXtoAlegorto326.Sofaritlooksliketheshortertargetwasworking,asthepricereversedhigher.The

38.2 percent reversal higherof the range would bemeasuredfromthe355lowatX to the 693 high atC for amove of 129 higher from Xupto484.Abovethatcarriesthe 61.8 percent retracementto564.
FIGURE5.8Apple—BullishShark

Next,thechartofBlueNilein Figure 5.9 is showing acompletedBearishGartley.Inthis pattern the X to Aretracement in leg A to B is61.8 percent and the final

move higher targets a PRZ78.6 percent of the length ofthe X to Amove. This is to37.79.Theprice reached thislevel and moved higher butwhat is key is that it thenmovedbackthroughthePRZin a terminal price bar thatmoved through the PRZlower. The initial target of a38.2percent retracementwasmet at 36.03 and then itbounced. This Bearish
Gartleyheldtruetoform.
FIGURE5.9BlueNile—BearishGartley

One that has been fairlyrare in my review ofHarmonics is the5-0pattern.It is illustrated perfectly bythechartofTableauSoftwarein Figure 5.10. This pattern

sees a run-up into it, apullbacktopointA,andthena rise to point B. The keythenisthatpointCisatleasta 113 percent and no morethan a 161.8 percentextension of the AB move.The move to point D thenmustbeatleast161.8percentof the BC leg and no morethan 224 percent. Uponhitting this level, the movelower should retrace 50

percent of the CD leg. Areversal at that point can beboughttomovehigher.Whoa(wait until you see theWyckoffmethod).
FIGURE5.10TableauSoftware—5-0Pattern
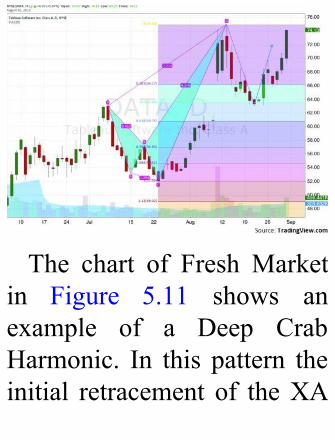
The chart of Fresh Marketin Figure 5.11 shows anexample of a Deep CrabHarmonic. In this pattern theinitial retracement of theXA

leg was a very deep 88.6percent. It gave a PRZ thatwasa161.8percentextensionoftheXAleg,to56.10inthiscase. Upon achieving thatlevel, the stock price movedlower through the terminalprice bar and met the initialretracement target at 38.2percent of the pattern at53.62. But it only stalledthereas itwaited tocontinuelower after reporting

earnings, for a fullretracementofthemove.
FIGURE5.11TheFreshMarket—DeepCrabHarmonic

A variation of the DeepCrabistheCrabpattern.It isdifferent in that it retracesonlyabout61.8percentoftheXA leg but carries the samePRZ at a 161.8 percent

extension of that leg. Thisexample,thechartofFrontierCommunications in Figure5.12 shows that the pricemoved beyond the PRZ andthenretracedbackthroughit,eventually coming near the38.2 percent retracement ofthepattern.
FIGURE5.12FrontierCommunications—CrabPattern
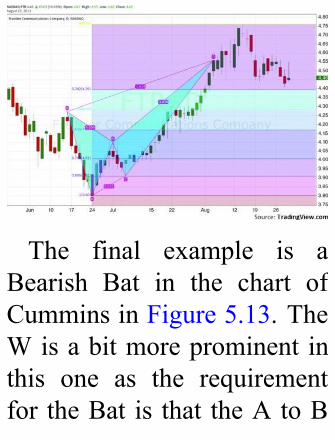
The final example is aBearish Bat in the chart ofCumminsinFigure5.13.TheWisabitmoreprominent inthis one as the requirementfor theBat is that theAtoB

retracementoftheXtoAlegis 50 percent. This gives atargetforDat88.6percentoftheX toA leg for a PRZ at121.72.Thisisalmostexactlywhere it reversed. The 38.2percent retracement of thepattern was then achieved inlate April. For the Bat it isalso interesting to note thatanotherpattern,theCrab,canlook identical. If the pricemoves beyond the D for the

Bat at 88.6 percent of the Xto A move, then the Crabkicksinwithatargetat161.8percent of theX toAmove.This is very bullish andsomething to look out forwhentheCtoDlegstarts toexceedtheXtoAleg.
FIGURE5.13Cummins—BearishBat

LearningHarmonicpatternswill have you seeing themeverywhere in the charts.Often they come back-to-back or embedded withinlarger Harmonic patterns.

Each of these patterns canalso extend, like the initialAB = CD example, so thePRZ is the initial target on amove. Look for the W andthenpulloutyourcheatsheet.And remember that thesecond bottom of the W (ortop of the M) is higher insevenoftheninepatternsandlowerintwoofthem,butitisnever flat. If it is a flat W,lookbeyondHarmonics.

Recall that there are twotimeswhenthesepatternsareinteresting. The first iswhentheCpoint is confirmed andthe new trend moves backabove the B point. At thatpoint it is safe to trade theHarmonic in the trenddirection to at least thePRZ.The second instance is whenthe PRZ has been achieved.Atthatpointitistimetolookfor the terminal price bar
drivingbackthroughthePRZtotradethereversaltoatleastan initial target of 38.2percent of the full patternmove.It will take a long time to
getcomfortablewithwhetherthe 50 percent retracementgoeswiththe78.6percentor88.6 percent or even 161.8percent extension of theinitialleg.Isuggestyoukeepa notebook or website

bookmarked as a reference.Spend your time looking forthe not-so-level W patterns,and then measure them todeterminewhichHarmonic itmightbe.Didyounoticethatall of the retracement andextensionlevelsareFibonacciratios? That is not anaccident. You are looking atthe actual price action now.These ratios are trulyprevalent in nature and

pleasingtothetraderaswell.Harmonic patterns areanother important piece tobuilding our mosaic becauseof the potential for a long-trending move or reversal.When they complementanotheranalysis theybecomeevenmoreimportant.

■ElliottWaveTrading using Elliott Waveanalysis also requires anunderstanding of Fibonaccilevels. The Wave principlediscovered by Ralph NelsonElliott in the1930shas at itscore that prices move inwaves. These are mostcommonlypackedinthree-orfive-wavepatternsandcanbe

eithermotive(inthedirectionof the trend) or corrective(againstthetrend).Eachfive-wavepatternconsistsofthreewaves in the direction of thetrend alternating with twowaves that are corrective. Soin an uptrend amotivewavewould have an up-down-up-down-up structure. Thatsounds like a lot of choppymarkets,right?Thedifferenceis that the up waves are

longer than the downwaves.Infactthe“down”wavescanbe sideways. The five-wavemotive pattern is expected tobe followed by a three-wavecorrective move: two wavesin the direction of thecorrection with one wave inbetween moving in theopposite direction. And thenthecyclerepeats.ElliottWaveprinciplestake
a lotofpractice to tradeas a

stand-alone system. Manytraders are scared of thembecause there are a lot ofrules, and the bestpractitioners are not alwaystransparent about how theyinterpret a wave count, asthey are called. In factmost,ifnotall,ElliottWavetraderskeep both a bullish and abearish count at the sametime. But Elliott Waveprinciplesdohavevalueeven

for the novice trader. I findthat they are very helpful inforecasting the extent of apotential trend, either majoror minor. Like Harmonics,this is the other major formthatgivesaprojectioninbothprice and time. Itwill take along time to learn all of thenuances of Elliott Waveprinciples.Butknowingthemcangiveyouthatextralegup.A few principles that are

worth learning are regardingthepersonalitiesofthewaves.Wave 1 is part of a basingprocess at least half the timeandshouldseerisingvolume.Wave 2 often retraces mostbutnotallofWave1.Wave3is thepowerhouse. It isoftenthelongestwaveandshowsaclearly defined trend. It alsocannot be the shortestimpulsewave.Wave4shoulddiffer in form fromWave 2.

So if Wave 2 is a deepcorrectivemove,thenWave4might be more sideways. Italso must not retrace all ofWave 3. Wave 5 is lessdynamic than Wave 3.Knowing the nuances—likethe third wave cannot be theshortest wave, and lookingfor a flat corrective waveafter adowncorrectivewave—canhelpindeterminingtheextent of a move. Frost and

Prechter’s Elliott WavePrincipleisthedefinitivereadto get educated in thismethod, and it has a greatchapter on Fibonacci and hiswork.Ihighlyrecommendit.As for the practicality ofElliottWave analysis for ourpurposes,sticktotheobviouspatterns that give you areinforcement of othermethods until you becomecomfortable. Use Elliott
Wave analysis to understandthe major extent of possiblemoves.
■Andrews’PitchforkTheAndrews’ Pitchfork wasintroduced in Chapter 1 as atool for identifying the trend.Recall that the lowermedianline, median line, and uppermedian line define thepitchfork.Asthepricemovesawayfromoneofthemedian

lines it is thought that itwillbeattractedbacktoitupuntilthepointwhereitgetsbeyondmidway to the next medianline. It can also be used as atradeentrytool.The chart of Anheuser-
BuschInBevinFigure5.14isausefulexample,butfirstwemust introduce the HagopianTrigger Line. This line,drawn from the base of thepitchfork tangent to the
break-off point for the tines,is the key to trade entry.Although the upper, lower,and median lines createbounds for the trend, pricecanstill leakoutsideof thosebounds. It is when the pricemoves outside of the upperand lower median lines andthen past the HagopianTriggerLinethatanewtrendcan be relied on. Othermethodsof technicalanalysis

may have signaled a reversalbefore this, but it can oftenadd weight to the directionchange.
FIGURE5.14Anheuser-BuschInBev—Andrews’PitchforkwithHagopianTriggerLines

In the Anheuser-Buschchart, in June 2013price hasalready broken below thelower median line. But youcan see that this happened

before, in February 2013.Back then it was quicklypulled back higher. The lastmovelowerseemstobemoretelling but also has not yetbroken below the HagopianTrigger Line, so the trend isstillhigherfromthisanalysis.Even if you have a signalfrom another methodologythat the trend has changed,thisnewsignalcanacceleratethemove.Wehavediscussed

the move lower, but the twobreakouts to the upside thatwere suckedback in are alsoexamples of the HagopianTrigger Line containing thebreakout and thus denying atrendchange.
PointandFigure,Gann,andWyckoffThere are many othermethodsof technicalanalysisemployedbytechnicians.Itisgood to be aware of themeven if you do not haveexpertise in these styles.Some have pieces that areeasytopickupandcanaddalittle bit to that mosaic. The

three listed here are notnecessarily the most popularbut give some broadperspectiveofwhatelseisoutthere. These are each verydifferent. I find that they arenot as useful for a shortertime frame but can give alonger-term compassdirection.The first one, point and
figure, is likely the oldestWestern technique. It started

withtradersplottinganX(forup)oranO(fordown)basedon daily price movementstaken from the ticker tape.Therehasbeenmuchanalysisdone through the years toreadpatternsandbreakoutstousethistickdatatogivepriceobjectives.Fortunatelyforallof us, there are chartingprograms that can give apoint and figure priceobjective instantly and for

free. It is a fascinatingscience, and I suggest youlearn more but take the freeinformation for now as aguide. If there is a priceobjective that is far aboveyour target in a stock that istrending higher, that canreinforce your view. If thepriceobjecthasalreadybeenmet and your analysis iscalling for a continuedmovehigher, or if the price

objective is lower than thecurrentprice,youmightwanttodouble-checkyourwork.Itdoes not mean that you arewrong, but it does say thatthere are traders who arebettingagainstyou.TheworkofW.D.Gannis
a bit further out there forsome. His Gann angles aresaid to combine geometry,astronomy, astrology, andancient math to help find

what he called the derivativeof a line on a chart. Okay.There are many disciples ofGann, so regardless of whatyou make of it, the Gannmethod becomes relevant forthat reason.The piece that iseasiest for me to use andunderstand is similar to acombinationof theAndrews’Pitchfork and Fibonacci FanLines (projectingaFibonacciratio of amove fromA toB

outintime).Gannanglesusea series of lines labeled 4/1,3/1, 2/1, 1/1, 1/2, 1/3, 1/4,emanating from an importantpoint to guide where futurepriceactionwouldhead.Thenumbersrefertounitsoftimeand price, and the mostimportantone is the1/1 line,whereoneunitoftimeequalsoneunitofprice.Thiscreatesa 45° angle on a chart.Mostof the price action is

supposed tostaybetween the2/1 and 1/2 lines, creating acone for theprice to travel. Ilike to look at the lines assimilartotheupperandlowermedianlinesoftheAndrews’Pitchfork, providing supportand resistance as well asattracting price back on abreakthrough.Finally, there is the
Wyckoff method. Thismethod posits that there are

four trends: the immediate,short-term, intermediate, andlong-term. When price isalignedineachtimeframe,ithas the strongest movementpotential. Sounds simple,right? If you take one thingaway fromWyckoff,make itthat. The implementationbecomesalotmorecomplex,andtherearedozensofbooksand even a university courseonit.Looktooneofthemfor

moreinformation,notme.
■ConclusionThat concludes the directanalysis of the price action.This chapter has focused onthe natural flow of marketsusing many techniques. Themost prevalent are derivedfrom Fibonacci analysis.UsingFibonacciretracementsand extensions, you shouldnow be able to identify

possible price targets andresistance and support areasthat may not appear throughclassicaltechnicalanalysis.Two systems built on the
back of Fibonacci analysis,Harmonic trading and ElliottWave principles, can alsogive points of potentialresistance and support withpriceextensiontargets.Butinaddition they give possiblescenarios for reversal targets

based on the natural flow ofprice action. You should beable to identify theW that isprominent in Harmonicpatterns to allow you topursue more detailedanalysis.Fromthediscussionon Andrews’ Pitchfork, youshouldbeabletoidentifytheHagopian Trigger Line andhow it is used as aconfirmation of change ofdirection of a stock price,
outsideofthemedianlines.You should also be aware
that there are many otherforms of technical analysisthat can influence the priceaction in a stock. Some arevery complex, like Gannanalysis and the Wyckoffmethod,andsomearesimple,like point and figure charts.Each has pieces of theanalysis that can be quicklyincorporated into your
building mosaic. Lookingback to our initial trenddiscovery in Part I, there aremanyderivativesofpricethatare useful in determining thebroadtrendandtheriskstoit.These are equally applicableto individual stocks. This isournextstep.

CHAPTER6

T
PriceDerivatives,Momentum,andOtherIndicators
here are several typesofindicators that derive

from the direct price action.We discussed somepreviously in thedetermination of the majortrend. In this chapterwewilldig deeper into the maingroups of these derivedindicators.Most of these arerelatively new, from the1970s or so, as thedevelopment of computershas led toeasiercalculations.Specifically looking at the

momentum indicators andoscillators, volatility, andmoving averages as afoundation, we will see howthey can help in identifyingstrengthandweaknessaswellas trading opportunities inindividualstocks.Wewillusethe big guns—RelativeStrengthIndex(RSI),movingaverageconvergence/divergence(MACD) indicator, Bollinger

bands, and moving averages—toestablishabaseline.Buttherearemanyderivativesofthese that can be used totweak the perspective. Let’slook at each of thesegranddaddy indicators inmore detail and with an eyetoward how they can bothsignal an entry and confirmanotherindicator.
■RelativeStrengthIndex(RSI)The Relative Strength Index(RSI) measures momentumandmovesinarangebetween0and100.Itwasdesignedtomeasure the strength orweaknessofastockbasedon

itsclosingprices fora recenttrading period. The standardviewlooksatthepast14daysfor swing trading charts, butmany day traders use a two-day view, and longer-termtradersmayusealongertimeframe as well. It wasdeveloped by J. WellesWilder Jr. in the late 1970sand is really quite simple:looking at up and downclosesrelativetotheprevious

day and measuring thestrength of the move. TheIndex then compares the updaystothedowndaysoveraperiod of past history andequates the RSI to a scalebetween 0 and 100.Practitioners generallyindicate the RSI as bullishover50andbearishwhenitisunder 50with anoverboughtconditionwhenitisabove70andoversoldwhenbelow30.

This is as far as we gotearlier.Butformanyitisnotthatsimple.TheRSIisusedexclusively
bysometradersintheirwork.They do this byunderstanding that it is ameasure of momentum. Yes,somekeepitsimpleandlookat an RSI over 50 as bullishand an RSI under 50 asbearish. But the RSI canfluctuate a bit in its moves

and especially between thevalues of 40 and 60. So,many(includingmyself)lookto theRSI tomoveabove60toconfirmabullishtrendandunder 40 for a bearish one.Onewaytolookatthisisthatit is just being moreconservative than using themidline. The importance toidentifying tradingopportunities is that as theRSI moves into bullish or
bearish territory it can eitherleadasignalforabreakoutorconfirm one. It can alsosignal a trend reversal. As itturns from moving lower torising, it can give a buysignal, and as it turns fromrisingtofalling,asellsignal.As it is bound within therangefrom0to100,itcanbehardtoseelittlemovesanditcanalsomovebackandforthenough to confuse you. For
this reason I use it mainlyeither to confirm the broaderanalysis or to raise a cautionflag. There are twoexceptions to this, which wewilldelveinto.If the broader analysis
shows a rising trend but theRSI is breaking below 40,this divergence can helpavoidwhat couldbe a losingtrade. But when the price isbasing after a pullback and

the RSI is holding the 40level, not giving up bullishterritory, it can help clear upconfusion in a pattern early.ThechartofDuPontinFigure6.1 is a good example. Thisstockhadpulledbackfromahigh near 56.50 and had anRSI that moved lower from70tojustunder40.Thetrendin price lower leads one toquestion whether it is just atrend down or a bullish
Falling Wedge. The RSIholdingat40givesacluethatthe wedge may be in place,and price eventually didmove higher, with the RSIleadingthewayup.
FIGURE6.1DuPontatRSISupportat40

Theoneexceptiontothisiswhen the RSI reaches anextreme level. When it isunder15orover85, theRSIsignals an extreme case in

momentum. These extremescan be trade signals for areversal on their own. Thechart of IronwoodPharmaceuticalsinFigure6.2shows two times in the firsthalf of 2013 that the RSImoved into technicallyoverbought territoryandover80. The first time, it reached82, and the second time, 93.These extreme readings giveasignaltolookforareversal
in the RSI. This can happenbythepricemovingsidewaysor falling, so there is not aguarantee for a profitabletrade. The signal from anextreme RSI is to watch thepriceaction fora reversal. Inthisexample,thecandlestickswere also signaling thepotential for a reversal withtwo Spinning Tops (dojiswith long upper and lowershadows) in the firstoneand
avery longuppershadowonthe second. Both eventuallymoved lower withconfirmation of the RSIfallingandmadeforexcellentshortopportunities.
FIGURE6.2IronwoodPharmaceuticals—RSIOverbought

But there is also an oldtrader adage that goes: justbecauseastockisoverbought(oroversold)doesnotmeanitcannot get more overbought(or oversold). The chart of

AeropostaleinFigure6.3isagoodexampleontheoversoldside.Fromthetimeitbecametechnically oversold with theRSIbreakingbelow30,pricecontinued to drop another 33percent andwas still runningat extreme levels when thiswaswritten.Alloversoldandoverbought conditions willeventually work themselvesoff through either time or areversal in price. But how
long do you want to wait?Thecorrectansweris to lookfor the reversal in the priceafter theoversold/overboughtextreme before placing atrade. Keep these extremeRSItradesonyourradar;justdo not pull the trigger untilthey have confirmed areversal.
FIGURE6.3Aeropostale—RSIOversold

The other exception is forsomething called an RSIpositive/negativereversal.AnRSI positive reversal occurswhen the RSI makes a newlowerlowinanuptrendwhile
thestockpricedoesnotmakea lower low. This technicalsetuptargetsareboundhigherin the stock price thatmakesa new higher high and isequivalent to the last movehigher off of the RSI low.This is very similar to ameasuredmovehigheroutofa pattern. This happenedtwice in three months inChevron in Figure 6.4. Youcansee thefirst time that the
reboundmadeanewhighbutdid not move the full 13.27points of the priormove, butstillalmost90percentofit.ItthenmadeanewlowerlowintheRSIonAugust21withoutthepricemakinganewlowerlow. If this positive RSIreversal plays out, it wouldtargetatleast127.84andlookfor a move to 129.11,equivalent to the last movehigher. The symmetry of the

last twomoves also suggeststhat it should happen in fourtofiveweeksfromthebottomorbetweenSeptember25andOctober2.
FIGURE6.4Chevron—RSIPositiveReversal

There are many othermethodsoftradingusingRSI,and several books have beenwrittenon the indicator.Youcan apply classical technical
analysis chart patterns to theRSI—for example, lookingfor support and resistancebreaksandthingslikeaHeadand Shoulders pattern. YoujustneedtokeepinmindthatRSIisboundedby0and100andamovetoeitherextremetakes a lot of momentum.Take some free time to digdeeperintothisindicator.
■MovingAverageConvergence/Divergence(MACD)IndicatorThe moving averageconvergence/divergence(MACD)indicator,developed

byGeraldAppelinthe1970s,alsomeasures the strengthofthe trend but is not boundedinto an index like RSI. Itinsteadlooksatbothashorterand a longer momentumindicator, the exponentialmovingaverage(EMA;morelater)andcompareshowtheymove relative to each other.Think of MACD as ameasurement of fastmomentum compared to

slowermomentum. It can beplottedtwoways.Thefirstisshowing two lines,onebeingthe faster versus the slowermomentum or the differencebetween the EMAs, and thesecond line being asmoothingmechanismofthatline and known as the signalline.The first line,called theMACD line, is typicallycreatedbysubtractingthe26-period EMA (the slow

momentum) from the 12-period EMA (the fastmomentum). The signal lineis typically the nine-periodEMAoffthatMACDline.Therearealsoseveralways
touseitasanindicationofapotential trade setup. WediscussedearlierinPartIthatarisingsignallineindicatesarising trend and a fallingsignal line a falling trend.Traders will also use a

crossovertoindicateachangein trendandapossible trade.WhentheMACDlinecrossesthesignalline,itisasignaltotrade.Acrossupisabuyandacrossdownisasell.Traderswill also look at the relativevalue on the MACD linecompared to previous highsorlowstoindicateapotentialfor momentum to end soon.Finally, the MACD linecrossing the zero level is
another indicator that the12-and 26-period EMAs arecrossing,showingmomentumeitherpickingupordeclining.Each of these three signalscan be used to trade on itsown.The MACD histogram is
much simpler. If it isgrowing, it is an indicationthat thecomponentsdecreasein the relativemomentumona falling trend. The cross at

the zero level indicates acrossof the twocomponents.Anothermethodof trading isto buy the cross up and sellthe fall off the peak of thehistogram, or sell the crossdown and cover the short asthe histogram starts toimprove. These will notalways lineuppreciselywiththe price action at turningpoints so they can give asignalbeforeamove.

ThechartofElectronicArtsinFigure6.5isagoodonetoillustratethetradesignalonasignallinecrossover.Itshowsseven sell signals indicatedby the arrows in the top halfof the MACD panel wheretheMACDlinecrosseddownthrough the signal line, eachcorresponding to a fall inprice. Notice that thehistogram also changes frompositive to negative at these

turningpoints.Thehistogramcan also sometimes be usedas a leading indicator of achangeintrendaswellwhenit starts to fall back from anextreme value toward thezeroline.IntheexamplethishappensastheMACDlineisstarting to turn back butbeforethecrossoversignalinga change in trend. There arealso four buy signalsindicatedbythearrowsinthe
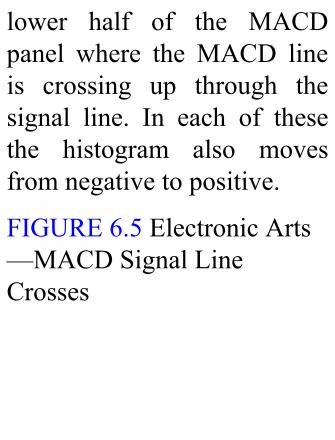
lower half of the MACDpanel where the MACD lineis crossing up through thesignal line. In each of thesethe histogram also movesfromnegativetopositive.
FIGURE6.5ElectronicArts—MACDSignalLineCrosses
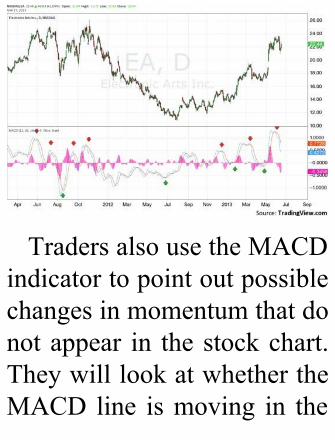
TradersalsousetheMACDindicatortopointoutpossiblechangesinmomentumthatdonotappear in the stockchart.TheywilllookatwhethertheMACD line ismoving in the

same direction or divergingfrom the price data. Adivergence is seen as apossible trend reversalindicator. The chart ofAmerican Capital Agency inFigure 6.6 shows how youcanuseMACDwithprice tolookforapotentialmove.Asthepricewasfallingfromthepeak in early May, theMACD linewas also falling.The MACD line leveled

slightly before the price did,butwhat is of interest is thattheMACDlinestartedhigherin early July and has notlookedback,yetthepricehasjust been consolidating. Thisdivergence would have atrader looking for a movehigheroutofconsolidationinthepricetofollowtheMACDlinehigher.InthismannertheMACDisnotusedasa tradesignal but to highlight a
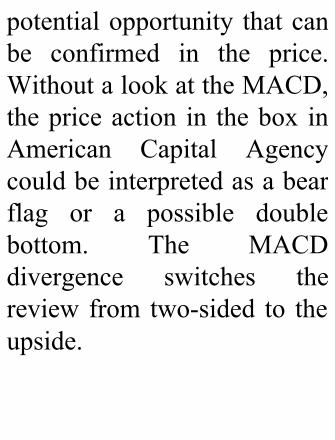
potentialopportunity thatcanbe confirmed in the price.WithoutalookattheMACD,thepriceaction in thebox inAmerican Capital Agencycouldbeinterpretedasabearflag or a possible doublebottom. The MACDdivergence switches thereview from two-sided to theupside.

FIGURE6.6AmericanCapitalAgency—MACDDivergence

The MACD indicator is awidely used and exploredindicator, with only thesurface touched in theseparagraphs. Like the RSI,using it to confirm other
analysis is a good way tostart. When there is adivergence, it should raise ared flag or highlight apotential opportunity on thebroadanalysis.

■BollingerBandsThe Bollinger bands are ameasure of volatility aroundthe price action. They werenamed after John Bollinger,who developed them in theearly 1980s. They consist ofthreecurvesaround thepriceaction, known as the upper
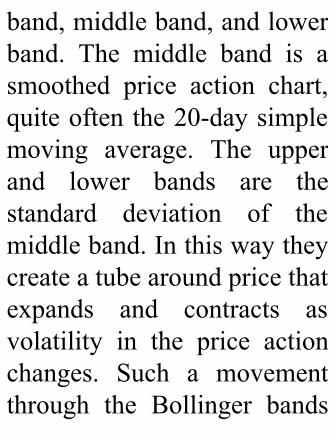
band,middleband,andlowerband. The middle band is asmoothed price action chart,quiteoftenthe20-daysimplemoving average. The upperand lower bands are thestandard deviation of themiddleband.Inthiswaytheycreateatubearoundpricethatexpands and contracts asvolatility in the price actionchanges. Such a movementthrough the Bollinger bands

can signal an overbought oroversold condition by itself,as an extension beyond astandard deviation of priceaction. In the chart ofCallaway Golf in Figure 6.7there are five buy arrowsbelow and five sell arrowsabove in just an eight-monthperiodusing thebreakof theupper or lower Bollingerbandas a trading signal.Thetechnical signal is the price
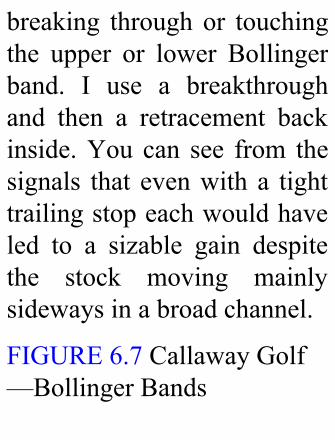
breaking through or touchingthe upper or lower Bollingerband. I use a breakthroughand then a retracement backinside.You can see from thesignals that evenwith a tighttrailingstopeachwouldhaveled to a sizable gain despitethe stock moving mainlysidewaysinabroadchannel.
FIGURE6.7CallawayGolf—BollingerBands

Bollingerbandscanalsoberead by looking for relativechanges in them. Forexample, you can look forthemmoving from awide tonarrow zone. Bollinger band

squeezes,wheretheygetverynarrow, can signal powerfulmoves to come in a stock.The chart of JPMorgan inFigure 6.8 illustrates this.Afterarelativelysteadyrangein the Bollinger bands fromJuly through August 2012,theBollingerbandsgotmuchtighter around the price asvolatility moved out of thestock. The bands weresqueezing the price action.
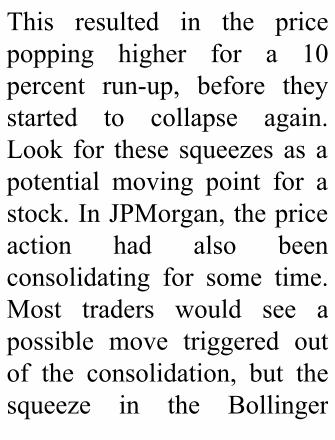
This resulted in the pricepopping higher for a 10percent run-up, before theystarted to collapse again.Look for these squeezes as apotential moving point for astock.InJPMorgan,thepriceaction had also beenconsolidating for some time.Most traders would see apossible move triggered outof the consolidation, but thesqueeze in the Bollinger
bands puts some imminenttimingaroundit.
FIGURE6.8JPMorgan—BollingerBandSqueeze

One final thing to look forwith Bollinger bands is howtheytendforthemostparttoact as support and resistance.Youdonotneedtolookforabounce off aBollinger upper

or lowerbandorabreakandretracement alone; they canalsobeusefultoindicatethata trend can continue as thepriceisnotneartheBollingerband, or even if it is near it,the band it is following isopening toallowfora runorcontinued trend. This can beseen in that same JPMorganchartfromDecemberthroughthe end of January as theprice rises along the upper

Bollingerband.There are many other
variants of the volatilitymeasure, like the AverageTrue Range (ATR), KeltnerChannels, and straightvolatility bands as well, thatcan be used to measure thesame thing.And thework inthisareaofvolatility issomeof themost interesting in thecurrentera.Whatyouneedtokeep inmind is that changes

involatilitycanoftensignalachangeofcharacterinastockorshowanextrememove.

■MovingAveragesThe use of moving averageswas discussed in Chapter 1,about identifying the trend.There we learned that asimple check is to see if theprice is above or below themoving average and thedirection of that moving

average, up or down, toidentify and confirm thetrend. This applies toindividualstocksaswell.Butthereisalotmorethatcanbesaid about moving averages.They can act as support andresistanceliketrendlinesandhorizontal lines.Traders tendtofocusonthe20-,50-,100-,and200-daymovingaveragesfor swing trading (holding afew days to a couple of

weeks).But somewill swearby the 144-day, since it is aFibonacci number, or thefive- or nine-day if they arevery short-term traders.Movingaveragescanbeusedonanytimeframeaswell.Aday trader might look at the20-periodmovingaverageona five-minute chart whereaslonger-termholdersmayrefertothe20-week(veryclosetothe100-day)movingaverage.

Thesemovingaveragescanbe simple or exponential,referring to how they arecalculated. Simple movingaverages (SMAs) use anarithmetic average of thestockprices,butwhichones?Opening, closing, high, low,oraverage?Most tradersandinvestorspresumetheclosingpricetobethemostimportantandusethisasthedefaultforcalculatingamovingaverage,

even if it is for an intradayperiod.Soa100-daySMAisjust an average of the past100 days of prices. Theexponential version (EMA)gives greater weight to themore recent prices than itdoes to the older prices. Inthis way it reacts to pricechangesfaster.Tradersuse9-,12-,and26-dayEMAsmostoften to trade from.Remember that the latter two

are also used to create theMACD indicator. To me, ifyouwantthemovingaverageto react faster, then youshouldjustuseashortertimeperiodforyourcalculationonanSMArather thanusinganEMA.Iusethe20-,50-,100-,and
200-day SMA on my charts.Dependingon thestrengthofthe trend and the particularstock, some can be more

useful than others. The chartofBurgerKingWorldwideinFigure6.9 isagoodexampleof how they can be used totrade from. Notice that overits short life since exitingbankruptcy, it has bouncedoffof the100-daySMAfourtimes. Each time provided along trade opportunity, threeofthemgoodformorethana15percentmove.

FIGURE6.9BurgerKingWorldwide—MovingAverageSupport

The chart of JPMorgan inFigure 6.10 is anotherexampleofthe100-daySMAacting as support. Here thereare also four touches thatsignaled a reversal back

higher.But thisexamplealsoillustrates the point from thePart I trend identification.The firstmoveover the100-daySMAinSeptember2012wasasignal tobuy thestockas the trend change wasconfirmed with the moveabove the SMA. Togeneralize, when the pricecomes back to an SMA thathas shown significance (orany of the 50-, 100-, or 20-

daySMAs)andthenreverses,itcanbea tradeentrysignal,eitherlongorshort.
FIGURE6.10JPMorgan—MovingAverageSupport
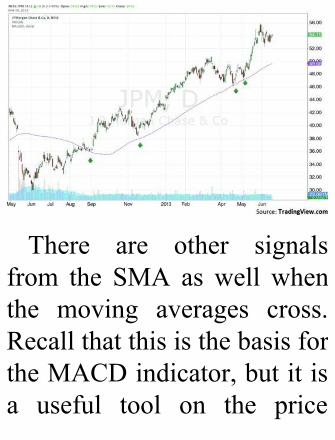
There are other signalsfrom the SMA as well whenthe moving averages cross.RecallthatthisisthebasisfortheMACDindicator,butitisa useful tool on the price
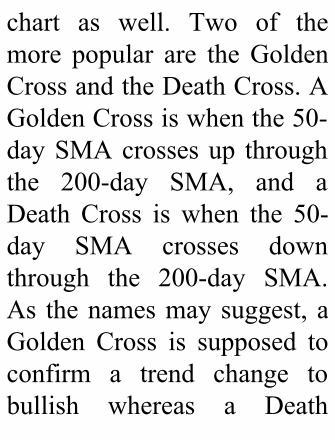
chart as well. Two of themore popular are theGoldenCrossandtheDeathCross.AGoldenCrossiswhenthe50-daySMAcrossesup throughthe 200-day SMA, and aDeath Cross is when the 50-day SMA crosses downthrough the 200-day SMA.As thenamesmaysuggest, aGolden Cross is supposed toconfirm a trend change tobullish whereas a Death

Cross confirms a trendchange lower. These can beuseful sometimes but havedrawbacks.The chart of Diebold in
Figure 6.11 is useful inillustrating many of thesepoints.Therearefiveofthesecrosses in the chart. Let’swalk through them. The firstisaGoldenCrosshighlightedin the small oval in October2010.Noticethattheangleof

intersectionofthetwoSMAsisrelativelysteep.Whenit issteep, the cross carries moreweight. This is because itshows a strong trend in theshorter50-daySMA.Butthisalsoshowsthedrawbackforashort-termtraderinusingthisas a signal; the price hadalreadymovedup25percentwhen the Golden Crossoccurred.Thesecondcross,aDeath Cross, has a good

angle of intersection, nearlyperpendicular. But the pricehad already dropped 18percent to28andwas in factmovingbackhigherwhenthecross occurred. It didcontinue back lower, givingmore downside then. Thethird cross is anotherGoldenCross, but at a very shallowangle.These are often not asreliable, and you see it wasnot until the 50-day SMA
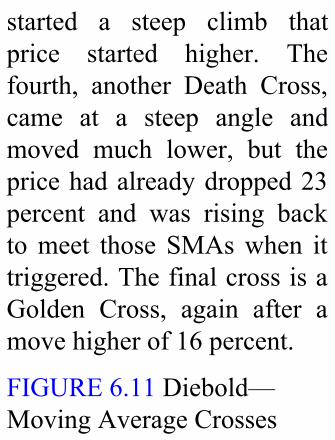
started a steep climb thatprice started higher. Thefourth, another Death Cross,came at a steep angle andmoved much lower, but thepricehadalreadydropped23percent and was rising backtomeet those SMAswhen ittriggered.ThefinalcrossisaGolden Cross, again after amovehigherof16percent.
FIGURE6.11Diebold—MovingAverageCrosses

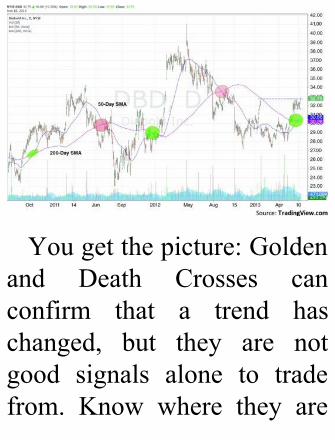
Yougetthepicture:Goldenand Death Crosses canconfirm that a trend haschanged, but they are notgood signals alone to tradefrom. Know where they are
so that you do not tradeagainstthem,butusethemtocomplement other analysis.Closingout thisexample, thelast Golden Cross ishappening as the price ismoving out of consolidationin a channel and overhorizontal resistance. In thisway it confirms an entry onthebreakout,asneakpeakofthingstocomelater.Onefinalpoint tohighlight
withSMAsisthatsometimestheSMAcangiveaheads-upforamovewhentheyjustgetclose together. Theconfluence of the 50-, 100-,and 200-day SMAs in thechart for Aeropostale inFigure 6.12 illustrates this.The two ovals show pointswherethethreeSMAsmovedtogetherandshortlyafterwarda major move in the stockoccurred (to the downside in
thiscase).
FIGURE6.12Aeropostale—MovingAverageConfluences

It is okay to experimentwithyourownadjustmentstothemovingaveragestoseeifyou can get an edge outsideof the basic 50-, 100-, and200-daySMAs.Justbeaware

which are the most popularand are the standard defaultsfor charting packages. Mostpeople will not change thedefaults, so these becomeimportant for that reasonalone.

■ConclusionThis chapter could not havebeen written in the 1960s.First, because I was just aboy, but more importantlybecause the tools needed tocreatetheseindicatorsrequirecomputing power that wasnot available then. The fourtools explored derive fromprice data, not with overly
complex calculations, butcomplex enough that onlyfirms with an army ofanalysts could do thecalculations outside of just afew indexes back then. Thatis a good thing for traderswho think that all systemseventually get arbitragedaway. These newer tools (ifyou can consider 30 to 40years “new”) are not asbroadly employed and may

stillhavesomeedge.We just scratched the
surface in each,but there aremany characteristics that youshouldbeabletoaddtoyouranalysis in determining therightsecuritiestotrade.Fromthe RSI you should now beable to identify when RSIconfirms a trend andoverbought and oversoldconditions in a stock so thatyou can protect positions at
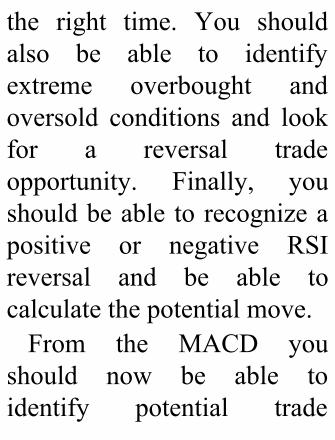
the right time. You shouldalso be able to identifyextreme overbought andoversold conditions and lookfor a reversal tradeopportunity. Finally, youshouldbeabletorecognizeapositive or negative RSIreversal and be able tocalculatethepotentialmove.From the MACD you
should now be able toidentify potential trade

opportunities from a signallinecrossaswellasfromthehistogram. You should alsobeabletorecognizewhentheMACD is diverging fromprice and may be a leadingindicator of a potentialreversal in trend, thusprovidingatradeopportunity.From the Bollinger bands
analysisyoushouldbeabletorecognize potential supportand resistance levels using

theupperandlowerBollingerbands, as well as be able toidentify potential tradeopportunities from a reversalwhen thepriceexceeds thesebands. You should also beable to recognize when theBollingerbandsareleadingatrend higher and when theyare squeezing, creating apossibletradeopportunity.Finally, from the reviewof
moving averages you should

beabletoidentifystrengthina stock when it is above themovingaverageaswellasthepotential for support andresistance that the movingaveragesprovide.Youshouldbeawarethatmovingaveragecrosses can be a point ofaction, but the most talkedabout, the Golden Cross andthe Death Cross, may belagging indicators. Youshouldalsonowknowtolook

for a potential stock pricemovearoundaconfluenceofmultiplemovingaverages.These indicators can be
used both to confirm whatyou see with classicaltechnical analysis andstanding alone to look fortrading opportunities. Eachhasmanyderivatives or, as Ilike to say, flavors that youcan choose from. Definitelyexperimenttoseewhatworks

foryou.Butattheendoftheanalysis, remember that it isprice that is most important,not the indicators, until youcandirectlytradeanindicatoronanexchange.Addthesetoyour tool belt to create yourtotalstockmosaic.

CHAPTER7
T
TheWatchListandInitialPlan
he critical groundworkhas now been laid. You
nowknowhowtoidentifythetrendandallofthethingsthatcouldchangeit.Youcandrilldown to discern which

sectors are best suited tofollow the trend to look forindividual stock setups. Andfinally,usingseveraldifferenttypes of technical analysistools from classical technicalanalysis,Japanesecandlesticktechniques, derived andquantitative methods, andprice derivatives, you canreview individual charts forcharacteristics that wouldmake for a good stock trade.

You may find five or 50stocks or more that fit thecriteria of reward potential.Recallthatwearelookingforstock setups that canpotentially return 5 to10percentormoreintwoweeksorlessforthetechnicalsetup.Butnowwhat?Inthischapteryou will learn how to put itall together into a watch listandaninitialplanfortrading.There are a fewnontechnical

pieces of information toreview for your stocks, andthen the list shouldbe culledtobeabletofocusonaselectlistofafewnames.Fromthatpoint we will focus oncreatingatradingplan.Attheendofthischapteryoushouldbereadytotradestocks.

■CreatetheMosaicThe best setups for a tradehave several different piecesof technical analysisworkingto support a move. This iscalledbuildingamosaic.Youcan think of it as writing asong.Adding the bass to thepianomakes it a little better.

Whenthedrumsandhornarealso working together, it isnearly complete. Add somestellarvocalsanditturnsintoa winner. There are manydifferent styles of technicalanalysis, and we touched onfourofthemhere.Itmaynotseem practical to look atevery stock in your universefromeachperspective,butasyougetmorepracticeaspectsof different styles will jump

out on different charts atdifferent points in time.Remember that we startedwith the trend and anunderstanding that somethingclose to 70 percent of stocksmove with the trend. Thinkabout what that means. Ifthere are aspects of technicalanalysis that are moreprevalentatapointintimeinthe indexes, then they standto be more prevalent in the

individual stocks that havebeen handpicked becausethey are following the trend.If the indexes are pullingback to the 100-day simplemovingaverage(SMA)orareshowing a Shark Harmonic,then you should not besurprised to seemany stocksat the 100-day SMA or in aShark pattern as well. Withenoughpracticeyouwillstartto get a feel for whether a

pullback is near a Fibonaccilevel,andthenearWshapeisaneasygiveaway to look foraHarmonic.Believe it or not, many
techniciansdonotneedtoputlines on a chart to seepatterns, trends, and supportandresistance.Asyouperusethe charts with your returncriteria in mind, you willrecognize that the Fibonaccilevels may not apply to one
situation. That is okay. Asetupthatworkswithjustonetypeoftechnicalanalysisisagoodwaytostart.Ifyoustartwithaclassicalapproachandfindapattern ready tobreak,then look at the candlesticksto see if they confirm ordisagree with your analysis.WhataboutanyFibonacciorHarmonic pattern then? Andif there is one, does it agreeor not? What are the
momentum indicators sayingabout the chart? The moredifferent styles that align inyour analysis, the moreconfident you can be in thesetup.Itdoesnotmeanthatitwillevertrigger,butwouldn’tyou prefer a stock that looksto be breaking an InverseHead andShoulders necklinehigher in aHarmonic patternwithapotentialreversalzone10 percent higher that has a

risingRelativeStrengthIndex(RSI)andaThreeAdvancingWhite Soldiers candlestickpattern, rather than a stockthat has just one of thesethingsgoingforit?Thisprocessofputtingitall
together is not intended towipe out those stocks thathaveonlyonethinggoingforthem. Remember that theymay have the one thing thatthe indexes have going for
them,sothatmaybeenough.What you do want to do,though, at this stage is toorganize a few priority lists.It is difficult to watch manystocks at the same time, soputting them into groups A,B,C,Dor1,2,3,4canhelp.Use as the criteria aqualitative analysis of thepotential move combinedwith the probability that itmay trigger. The stock that

has four different types oftechnicalanalysisworkingforit has a higher probability oftriggering than the one withjust one. A 10 percentpotential move based on thecombination of a ThreeDrives pattern and a trianglebreakout as a stock isapproaching the trigger withsupporting RSI and movingaverageconvergence/divergence
(MACD),forexample,wouldbe ranked very high versusonewitha4percentpotentialmove that is 2 percent fromthe trigger but has goodsupporting technicals. Youare now almost ready totrade.
■OtherInformationThere are a fewnontechnicalthings to review now beforeexposingcapital to risk.Firstis looking for any kind ofnews on the company thatmight influence the stock.This can be fundamentalnews like an upcoming
dividend or an earningsrelease, or some kind ofregulatory approval like aFood and DrugAdministration (FDA) panelfor a pharmaceutical name.Any event that you know iscoming can then be plannedfor.It can also be sentiment-
driving news. A goodexample of thiswas inApril2010 when BP’s Deepwater
Horizon platform exploded.ThechartinFigure7.1showsthat the stock was in anuptrend at the time. But noamount of good technicalinputswas going to turn thisstockarounduntil some timehad passed or a settlementwas made. This stock justkeptgoinglower.Thiscanattimes make it easy to take afew stocksoffofyourwatchlists.Sentimentcanplayabig
role in determining thedirection of stock prices.There are many traders whotrade almost solely offsentiment, and many greatresourcestolearnmoreaboutitsimpact.Thisaspectappliestoindividualstocks,butmostsentimentindicatorsdealwiththe impact to the broadmarket or a particular sectorand not to individual stocks.This includes the Deepwater

information, as well assurveysofbullishandbearishsentiment and things like theput/callratio.
FIGURE7.1BP—NotingDeepwaterExplosion

Finally, it is important tolook at the short interest instocks on your watch list.Whether you are trading thestock to the longor theshortside, the short interest can

influence your decisionmaking.Thisisbecausewhentraders short a stock they aresellingstock that theydonotown.Theyneedtoborrowthestock to make delivery towhomever they sold it to.Your broker handles this foryou, and often at a hefty feethat you probably never see.But it is important to you asyou develop your watch listbecauseitcanbefueltofirea
quick runhigher in the stockprice.This isgoodifyouaretrading it from the long side(buying it), but can bedisastrousifyouaretryingtoshort it. Every share that hasbeenshortedmustbecoveredatsomepoint;youjustdonotknowwhen.Oftenabreakofresistance higher in a stockthat is heavily shorted (over10 percent for our purposes)can trigger this short

covering. If the short interestis high enough and the otherbuyers aggressive enough,this can lead to a shortsqueeze.Stocks can move very
quicklyinashortsqueezeandto extreme levels. TeslaMotorsinFigure7.2isaverygoodexamplehappeningasIwas writing this book. ThecompanyreleasedearningsonMay 8, 2013. At the time

over 40 percent of the floatwas short. As the earningsbeat analyst expectations, thestocktookoff.Itmovedfrom$56persharetoover$112inless than three weeks. Thinkabout that: a 100 percentmovein14tradingdays.Thatisagreatthingifyouarelongbut can wipe you out if youareshort.
FIGURE7.2TeslaMotors—ShortSqueeze


Ingeneral,youwanttogiveextra weight in yourconsiderationtostockswithagood long setup that havehigh short interest. And youwanttousemorecautionwith

stocks thathaveagoodshortsetup that have high shortinterest.Iftheshortinterestisover 10 percent, then youmaywanttoremovethestockfromyourwatchlistifitisonthere for a short setup.Sometimesyoumayfindthatthere is no borrowingavailable in a stock with agood short setup anyway sothat your broker will not letyou execute a short sale. In

thiscase,dropitandmoveonto the next stock. There areways to trade these usingoptions that we will get tolater in the book, but tradingthestockinthesenamesisfartoorisky.With all of the news and
short interest factored intoyour stock selection, yourwatchlistsarenowcomplete.

■ThePlanWith the watch list revisedfornews,sentiment,andshortinterest, it is time to developthe plan for each stock. Theplan will include the trigger,stop loss level and how toadjust it, as well as when toreassessor takesomeprofits.These all come from youranalysis. You may be

overwhelmed with 20 or 30namesatfirst,andyoushouldbe. Narrow the watch list towhat you can manage withthe time and resources youhave available. If you havescreenspacetowatchonly10names, then your watch listshouldbecutto10names.Ifyou can devote only an hourper day to trading and anadjustment when an alertsounds, then cut it even

further or never enter morethan a couple of names at atime.But whatever the size of
your watch list or availabletime, make sure you have aplanforeachnameonthelistbefore you think aboutplacing a trade. Without aplan, stop losses slip,emotions and biases getinvolved, and mistakes aremade. And every mistake in
the stock market gives yourmoneytosomeoneelse.Witha plan, there is no rashdecisionmaking. If a stop ishit, it executes. If a target ismet,astopisraisedorprofitsare taken. Mistakes will stillhappen because you cannotplan for every outcome, buttheywillbefewerandfartherbetween.I find itbest towritedown
my tradeplans so there isno

room for error. I can stilltweak entries or adjust exits,but having a plan in placebefore I trade is the key tosuccess. It may also help toset alerts for when the pricegets close to the trigger.Some traders go even a stepfurtherandsetuptradeswitha bracket order (a buy orderwith a profit limit sell andcontingent stop loss all atonce) to take profits and a

stop loss all triggered on theinitialentry.Youdonothaveto get that mechanical, but Ido suggest entering a hardstop loss after the trade istriggered. You never knowwhen your broker orconnectiontothebrokermaygo down and leave youvulnerable. If this happens,invariablythemarketstartstomoveagainstyou.Probably the most
important part of the plan iswhereyouwilldeterminethatyou are wrong—that is,wherethestoplossshouldbeplaced. We will discuss inmore detail later how todeterminethatlevel.Fornow,takeitasagiventhatyoudonot trade before you knowhowmuchyouarewilling tolose.Byhaving this level setbefore each trade is entered,youareautomaticallylimiting

your losses so that you cankeep trading another day.Without it,many traders turninto investors as they let aloss progress. There isnothing wrong with beingeithera traderoran investor,but theonlyreasonyouwantto be both on the same tradeis if the stock keeps movingthewaythatyouhaveplayedit to move, not against you.Never let a trade that was

intended to be a three- orfour-day trade turn into twomonths or more as you waitfor your great idea to turnaround and work off a loss.Having the plan before youtrade allows you to detachfrom the idea and determineahead of time when you arewrong. If you end up gettingstoppedoutofatrade,thensobe it. You move on to thenext trade setup that triggers.

Youwantyourwinnerstobebig and your losses to besmall.Itisnotasimportanttohave a great winningpercentageasitistohavethewinners be bigger than thelosers. Many successfultraders have only amarginally winning record,between 50 and 60 percent,but are very good atmanaging risk. That meanscuttingthelosersfast.

You cannot possibly writedown all of the permutationsthatcanhappentoyourtradesetup through time. Butwitha good understanding fromyour technical review frommultipleperspectivesyoucanbuild the framework for atradeplanthatprotectscapitaland allows you to win.Anotherthingtokeepinmindis that some days you mayhavenotradestrigger.Thatis
okay. You do not have totrade every day. Other daystheremaybe25tradesoutofyour 30-namewatch list thattrigger. This is even worse.Do not try to take all of thetrades that trigger all of thetime.You need to be able toremaincomfortablemanagingthe open positions. If youhavetoomany,thenmistakesstart tocreep in.A largepartof trading is patience,

otherwiseknownassittingonyour hands. This is aboutdevelopingaprocesstomakemoney, not a process toalways be playing and thenhopingthatmoretradesmakemoneythanlosemoney.Hereare a couple of trade setupsfrommysubscriberserviceasexamples to see how youmight develop your tradeplan.Exact Sciences (EXAS) in

Figure 7.3 is in aconsolidationafteralongrunhigher. Using the MorningStar at 8.00 from April 24(seearrow)asabasingpoint,it has a measured movehigherto18onabreakofthatconsolidation to the upside.The RSI has worked off thetechnically overboughtconditionandisholdinglevelin bullish territory, with theMACD leveling after a short

pullback. Short interest at 15percent could help it higherfast. There is resistancehigher at 13.50and then freeair, with support below at12.50 and 12 followed by11.40 and 11 before 10.40wherealltheSMAssit.Enterlong on a move over 13.20withastopat12.95,ormoreconservatively over 13.55withastopat13.30.Aspricemoves over 14, convert the

stoptoa40centtrailingstopand take off one-third at 18,leavingtheresttorunagainstthe trailing stop. With thelarge short interest, I do notrecommend shorting thisstockunder12.50unlessyouuseoptions.
FIGURE7.3ExactSciences—TradeSetup
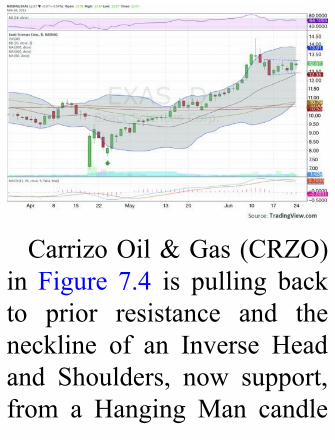
CarrizoOil&Gas(CRZO)in Figure 7.4 is pulling backto prior resistance and theneckline of an Inverse Headand Shoulders, now support,from a Hanging Man candle

Wednesday.WithaSpinningTopdojionthatlevel,amovehigherMondaycouldconfirmanother reversal back higher.Thiswouldmakeforahigherlow, the 5th in successionafter a long string of higherhighs as well. The RSI isholding in bullish territorywithaMACDthatismovinghigher to support furtherupside, and short interest ishigh at about 15 percent.
There is resistance at 28.50and 29.50 and then free air.Supportlowercomesat27.50and a gap fill at 26.89followedby25.90and23.50.Enter long on a move overFriday’shighto28.50withastop at 27.50. On a pullbackyou can also try a reversallong on a gap fill thatreversesbackover27.50witha stop at 27. As the pricemovesover29convertittoa
75cent trailingstopand takeoffone-quarterat30, leavingthe rest to run against thetrailing stop toward theInverse Head and Shouldersprice objective of at least35.10.
FIGURE7.4CarrizoOil&Gas—TradeSetup
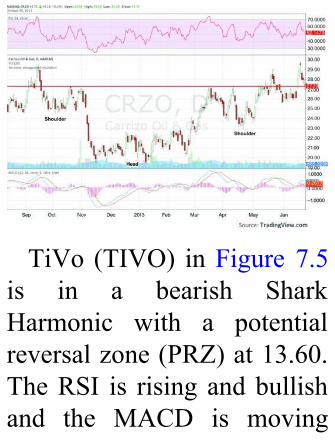
TiVo (TIVO) inFigure 7.5is in a bearish SharkHarmonic with a potentialreversalzone(PRZ)at13.60.TheRSI is rising andbullishand the MACD is moving

higher. There is resistancehigher at 11.90 and 13.20followed by 13.75. Supportlower is found at 11.50 and10.75 before 10.50. Enterlongonamoveoverthe200-day SMA and 11.90 with astop at 11.50, just under the100-daySMA.Movethestoptobreakevenasthestockhits12.15 and as it moves over12.40, closing the gap, andconvertittoa30centtrailing

stop.Take off one-third on astallat13.25orhigher.Shortinterest is a bit elevated atjust under 6 percent in thisname.
FIGURE7.5TiVo—TradeSetup
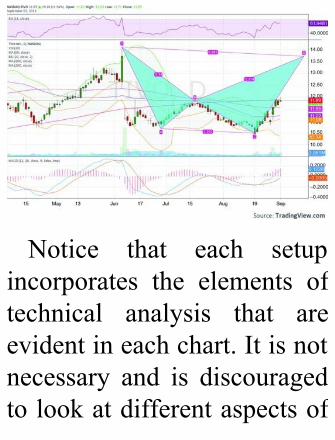
Notice that each setupincorporates the elements oftechnical analysis that areevidentineachchart.Itisnotnecessary and is discouragedtolookatdifferentaspectsof
technical analysisindividually. The mosaic ismuch easier to create on onecanvas. Each also discussesthe short interest as it is atrelevant levels for thesenames.Noneof thethreehasanynewsassociatedwithitorearnings to deal with. Eachplanhasa triggerwithastoploss right there with it. Theplanalsohastargetsforprofittaking and adjustments for

protecting gains as the pricemoves in your direction.These examples wereintendedforsomewhatactivetraders, so the trailing stoplossesallowthemnottohaveto pay as close attention aswith fixed stops that wouldneed to be adjusted. If youcan monitor trades and keepstop losses to valid potentialsupport and resistance levels,thatisevenbetter.Yourplans
can be as simple as this orcodednotes in themargin ofyour trading journal. Justmakesurethat theyexistandare concrete. Setting a stoparound the 100-day SMA inmy experience means youwillexecuteitwhenthestockhasgone threedays in a rowbelow the100-daySMAandis 5 percent below it. Settinga stop at the 100-day SMAless10centsgetsexecutedat

theSMAless10cents.
■ConclusionYoushouldnowknowhowtoput the whole technicalpackagetogetherandcreateaplan to trade stocks. Startingwiththebuildingofamosaicofyourtechnicalanalysisandleading to several rankedwatch lists, you know thatyouthenneedtolookforanyknown news events like
earnings or major headlinesthat can influence yourdecisions aboutwhich stockstotrade.Youalsoknowthatacheckoftheshortinterestcansaveyou timeandmoneybyhelping you avoid high shortinterest stocks that youidentifysetupsthatarebiasedlower and using high shortinterest to your advantage instocksthatlookbetterhigher.Finally, you understand the

importance of writing a planwith concrete stops andtargetsbeforeyoutrade.
PartII:ConclusionThatconcludesthepartonindividualsecurityselection.Prettysimple,right?Justlookatsomepictures,drawsomelines,andmaybedoalittleadding,subtraction,andmultiplicationbutnohighmath.Andthenglanceatsomeheadlines.Asmy

daughterwouldsay,easypeasylemonsqueezy.Therewasalotofgroundcoveredinthispart,startingwithclassicaltechnicalanalysis.Severalthousandsofpagesoftexthavebeendevotedtothestudyofthatsubjectalone,andwejustscratchedthesurface.Butwiththetoolspresented,youshouldbeabletoidentifytradingopportunitiesusingsupportandresistanceandotherclassictechnicalpatterns.ThroughtheexplorationoftheworldofJapanesecandlesticks,youshouldnowbeabletoidentifycandlestickpatternsthatprecede

continuationsandreversals,andbereadytoexploitthem.Youshouldalsorecognizeindecisioncandlesthatcanforetellamoveeitherway.WiththeintroductionofFibonacci-basedapproaches,youcannowidentifyimportantpointsfromthenaturalflowofstockpricesthatmaybecomesupportandresistance,aswellasidentifytradingopportunitieswhentheflowpresentsthem.Youcanalsouseindicatorsderivedfromprice,likemovingaverages,theRSI,andMACD,aswellasthosederivedfromvolatility,likeBollingerbands,to

giveyouanedgeinidentifyingsupportandresistancelevels,aswellasdivergencesandextremereadingsthatcanleadtotradeopportunities.Combiningallofthesestylestocreateamosaicputsthefullvalueofyouranalysisinoneplace.Thisnowallowsyoutobuildandrankwatchlistsbasedontheirpotentialtoperformandtheaggregateofanalysisbackingthat.Fromthereyouknowtolookforoutsidenewsandeventsthatcouldderailyourideas.Finally,youknowtolookforshortinteresttodetermineifit

mayhelporhurtyourideas.Ifithurts,youmightevendiscardsomepossibilities.Withrevisedwatchlists,younowcandevelopaplantotradeeachstock.Thewrittenplanwillhaveatriggerstoplossandtargetaswellassomethoughtsabouthowtoadjusttheplanformovementsinpriceinyourdirection.Youunderstandtheimportanceoftheplanbeingwrittensoastoavoidanyuncertainty.Nowyouarereadytotradestocks.Butyouwanttotradeoptions.Inthenextpartwewillgoover

someoptionsbasicsandthenadapttheanalysisuptothispointtotheoptionsmarket.

PARTIII
OPTIONSSTRATEGIES

In the firstpartof thebookwelearnedhowtoidentifythetrendinthemajormarketindexes. This is importantbecause the vast majority ofstocks move in the directionofthattrend.Wealsolearnedthat it is important tounderstand what mightimpact that trend so we canbe prepared for a possiblechange in the trend from anoutsideinfluence.Inaddition,
we learned how to focus theprocess of trade preparationbyusingrelativestrengthandother measures to determinewhich market sectors mightbethebestonestolookatforstocks that are aligned withthetrend.In the second part of the
bookwedrilleddownfurther,exploring many differenttypes of technical analysis todetermine which securities

were best suited to tradebased on their potential tohaveabigmove.Welearnedwheretriggerpointsmightbe,based on potential reversalsor support and resistance.(There will be more on howtoapplythisinthesectiononposition sizing and stoplosses in Chapter 10 in PartIV.)We explored the impactthat news, either scheduled(likeanearningsrelease)ora
surprise (like the Gulf oilspill), can have on whetheryou choose a stock to trade,and how short interest canplay a role in determiningwhether to take the trade.Leaving Part II, you wereprepared to trade with awatch list and a plan for thesecuritiesonthatlist.Inthispartwewillgoover
some options basics so thatwe can then adapt all the

prior analysis to designoptions trades.We startwithsome definitions and buildinto some strategies to get agood understanding. Fromthere we delve into someoptions trading basics beforewe tie it all together. Thereare plenty of great resourcesthat you can review to learnin depth about options, so Iwill not spend the time heredoing so. We will cover

enough that you canunderstand the philosophyand style without all of theminor nuances. Optionstradingcanbeverycomplex,depending on your strategy.Those strategies that employthe Greeks (delta, theta,gamma, etc.) can get highlyquantitative.Fortunately,theydonotplayalargeroleinourstyle of trading. You mayhavealsoheardoftheBlack-

Scholes methodology fordeterminingthefairvaluationof options. It uses partialdifferential equations and isabout as complex as it canget. You will be happy toknow that has nothing to dowith our process. You couldsaywe do not care what thefair value of an option is.Thatisnottotallytrue,butisagoodapproximationtostart.I hope I have allayed your

fearsandyouwillcontinuetoread with a slower, moresteady heartbeat now. Let’sget started with some simpledefinitions.

CHAPTER8
IntroductiontoOptions

Derivativesarethoughttobe complicated and out
of reach for most investors.They are considered therealm of financial engineerswith degrees in astrophysics—truerocketscientists.Theycan indeed be verycomplicated, but the mostbasiconesarewellwithinthereach of the general public.Exchange-traded funds(ETFs) are a great example,

andsoareoptions.Options are derivative
securities. All that means isthat they derive their pricefromanother security. In thischapter we focus on optionsbasics. We define all of theimportant terms thatcharacterize an option first.Thenwediscusswhyoptionsare useful and how they aredifferentfromstocks.Finally,we delve more deeply into

two main building blocks ofalloptionsstrategies,putsandcalls.(Manyofyouwhohaveabackground inoptionsmayfind this remedial; for othersitmaybeagoodrefresher,oryoumaywant to just skip toChapter 9 on optionscombinations.)By theendofthis chapter you should beable to understand andrecognize the data in optionstables.Youshouldalsoknow

whyoptionsareusefulforourtrades and the basics of putsandcalls.

■DefinitionsOptions, aside from being aderivative,arealsoacontract.The contract has manystandardized features.First isthat it gives the holder, orbuyer, the right, but not theobligation, to buy or sell asecurity at a predeterminedpriceinthefuture.Thatpriceis called the strike price. A

callconveystherighttobuyastock, and a put conveys theright tosellastock.Putsandcalls are the building blockswe will use to build tradesand manage risk with ourindividual stock trade setups.Liketransactionsinthestockmarket, there is a seller foreverybuyer.The seller of anoption, however, has theobligation to transact if thebuyer chooses to use the

option. This happens if theholder exercises the option.For a call option, the buyerowns the right to buy thestock at the strike price at adate in the future. The sellerofthecalloptionisobligatedto sell the stock to the callbuyeratthestrikepriceifthebuyer does exercise the rightto buy. This is known asbeing called. The seller of aput option has the obligation

tobuythestockfromtheputholder who exercises againsttheseller.Thisiscalledbeingput the stock. Both of thesetransactions happen at thestrikepriceoftheoption.
■ExpirationandExerciseOptions also have anexpiration date, the expiry.After this date, anyoutstanding options held andnot exercised becomeworthless. Some 90 percentof options expire worthless.Options can have either an
American or a Europeanexercise feature. TheAmerican exercise, used forall U.S. stocks and indexes,allows the holder of theoptiontoexerciseatanytimeup until the expiry. OptionswithaEuropeanexercisecanbe exercised only at expiry.Expiry used to be theSaturday following the thirdFriday of every month, andfor most stocks that is still

true. Now, however, optionson the indexes and manyactively traded stocks alsohave weekly expiries. TheChicago Board OptionsExchange (CBOE) keeps alist of stocks with weeklyoptions for the next fewweeksonitswebsite.Neglecting early exercised
options for the time being,when options are exercised,the Exchange is usually left

withadecisionastowhowillbe exercised against. To gettothispoint,thelongoptionsholders have already decidednot to sell their options for again,andsincetheyarebeingexercised, they want to ownthe stock (call holders) or beshort the stock (put holders).Everyoneofthesellersoftheoptions does not want to beexercised against, becausethey will lose money. Some

willhavecappedtheirlossbybuying the option back in aclosingtransaction,or“buytoclose.” The rest are justsittingaroundwaitingfor thepain of being assigned. Theassignment process is easiestto explain using those earlyexercisersasanexample.Suppose a holder of 100
call options decides toexercise a week early,perhapstocaptureadividend.

The Exchange then needs todecide which of the manytrades where the calls weresold in an openingtransaction,or“soldtoopen,”shouldbeobligated to sell toeach exercising long callholder.TheExchangehas analgorithm that determineshowmanyshouldbeforeachbrokerand then in turn thosebrokers have algorithms thatdetermine which clients are

assigned. Depending on thenumber of “sold to open”transactionsoutstanding,howmanyareatyourbroker,andyour broker’s algorithm, youmaybeassignedonecontract,yourwholeposition,anythingin between, or nothing. Thepoint is that selling optionscarries a risk of assignmentthatmaynotbemeasurable.

■ContractSizeThe options contract is alsovery specific; it is for 100shares of stock. However, afew exceptions to this haverecently appeared. In March2013,minioptionsforasmallnumberofhigh-priced stocksand the indexes became

available. In these thecontract is foronly10sharesof stock. Two months laterjumbo options came out forthe indexes as well. Thesejumboscover1,000sharesofstockinthecontract.SonowfortheS&P500youcanbuyamini,normal,orjumbosizeoptioncontract.Thissoundsabit like Goldilocks and theThreeBears.Lookfortheonethatfitsyoujustright.Atthis

writing,boththeminiandthejumbo options are veryilliquid, rarely traded, and atotaldisaster.Theymaycatchon, but until they havemassive liquidity you shouldsticktotheoriginal100-sharecontracts. It is better to tradeone liquid contract than 10illiquid ones. It is also betterto trade 10 of the originalliquid contracts than one ofthe new illiquid jumbos.

Liquidity matters more thansaving on commissions orhaving the ability tomicromanage positions instrategies.For the purposes of this
book and to avoid confusiongoing forward, I will alwaysbe referring to the normalmonthly expiration scheduleunless otherwise indicated,and the standard 100-sharecontract size. At last look,

thishasledtoalmost600,000different contracts to tradeacross all stocks and strikes.Thatisabignumber.

■PriceTerminologyOptionspricesaredeterminedbymany factors, but two arethemost important.They arethe time to expiry, or timevalue, and the price of thestock relative to the strikeprice,orintrinsicvalue.Forastocktradingatapriceof85,

the 80 strike call optionwould have $5 of intrinsicvalue(85minus80),whereasifthesamestockweretradingat 75 the intrinsic valuewouldbezero.(Infact,ifthestockprice is at or anywherebelow the strike price, theintrinsic value is zero.) Thetotal option price is then thetime value plus the intrinsicvalue.Soifthat80strikecalloption is priced at $6.50

whenthestockpriceisat85,itisthesumof$1.50oftimevalue and $5 of intrinsicvalue. If it is priced at $1.00whenthestockpriceisat79,thenit is thesumof$1.00oftime value and no intrinsicvalue. How close the stockprice is to the strike price,interest rates, dividends, andthe level of risk in the stockrelative to themarket can allimpact the option price, but
these two factors aresufficientforshortperiodsoftime.An option can be in-the-
money (ITM), at-the-money(ATM), or out-of-the-money(OTM).Thisisareferencetowherethepriceofthestockisrelative to the strike of theoption. For call options, anin-the-money call is onewherethestockpriceisabovethe call strike, so it has a

positive intrinsic value. At-the-money calls have thesame or nearly the samestrikepriceasthestockprice,and out-of-the-money callshaveastrikepricewellabovethe stock price. The oppositeis trueforputs.In-the-moneyputshaveastrikepriceabovethe stock price, at-the-moneyputs are still near the stockprice, but out-of-the-moneyputs have a strike price well
belowthecurrentstockprice.

■WhyUseOptionsOptions seem to be prettycomplicated,butonceyougetthe hang of them it is not sodifficult to use them.Butwehave not looked at why youwould want to use them.There are many reasons.First,optionscostless.Recall

fromearlierthatthepriceisafunction of time value addedto an intrinsic value, theamount the option is in-the-money.Forthe$85strikecallthat is $5 in-the-money, thecalloptionmightcost$6.50ifithassometimeuntilexpiry.But that $6.50 is only afractionofthe$85price.Youwilluselessthan8percentofthe capital that itwould taketo buy the stock in order to

buy the option. This ends updeliveringveryhigh leverageat times. If the option isdeeply in-the-money andclose to expiry, itmaymovenearlypennyforpennywithamoveinthestockprice.Withonly 8 percent of the capitaloutlay and nearly the sameprice performance, this is a12:1leverage.The lower cost for the
option also means that you

have lower risk. Wheneveryoubuyanoption,youareatrisk for only the premiumpaid to buy it. You cannotlosemorethanthat.Soifthatstock fell to $75, then youwould lose the full $6.50paid. But if you bought thestock at $85 and had it gapdown to $75, you would beout $10 and still haveadditional downside risk.Options limit the risk. You

will see later that they canalso help to control risk byadding protection to aposition.So options can control or
lower risk, increase leverage,anddoitatalowercostthanusing stock. Sounds worthexploringfurther,doesn’tit?

■HowDifferentfromStockBefore you go and throwstocks totally off of yourinvestment or trading plan,though,therearesomethingsthataredifferentwithoptionsthan with stocks. I have

already mentioned that theycost less. That is in the pluscolumn. Another one in theplus column is that longoptions holders do not incurmargincosts.Sinceyouareatrisk for only the premiumpaid,thereisnoneedforyourbrokertotakeextramargin.But options also expire
whereas the stock does not.You may have a great plan,buy options to execute it

when it triggers, and end uplosing money because thestock price stalled but theoption just kept losing valuefromthedecayoftimevalue.The commission costs arealsohigher.Thismaynotbeabig deal if you are trading amillionsharesoftheS&P500SPDRs and comparing thecost to 100,000 S&P 500SPDRs call options, but ifyou are trading 1,000 shares
of IBM and comparing it to10 call options it can bematerial. This is especiallytrue due to the fact that theoption costs a fraction of thepriceofthestock.Evenifthenominal value of thecommission is the same, thecost as a percentage of thecapitalusedismuchlarger.When you use options
insteadofstock,youarealsoforgoing dividends. Options

holders are not entitled todividends. This may beimportant in a staple stockwith a big dividend likeCampbell Soup (althoughthere are many stocks thatpaynodividendwhereitwillnotmakeadifference).Whatisworse is thatwhena stockgoes ex-dividend, if it wasanticipated the option pricemayfallanywayeventhoughthe options holders were not

paid a dividend. For largedistributions, splits, andunanticipated distributionsthe options strikes may beadjusted for the distribution.This is also often not ideal.Beawarewhichcasefitsyourtrade.Finally, options can be
relatively expensive to tradein terms of their executioncosts. Many stocks nowregularly trade with only a

pennyortwobid/askspreads.Unless you are trading theS&P500SPDRsoptions,youaremorelikelytoseespreadsofanickeloreven10centsormore. And that is in liquidoptions. For those that tradeonly a couple hundredcontractsperday,thespreadscan be very large. Thinkabout how a highercommission and a higherbid/offerspreadonasecurity
that cost a fraction of theprice of the underlying stockcan impact your trade. Andthis can get worse. Optionsare generally less liquid thanstocks. This means thatcertainordertypesthatcanbeusedforstocksareneverusedin the options world. Amarket order in IBM, givingyou maybe 5 to 10 cents ofslippage in a $200 stock, ismeaningless if you are right
about the trade setup. Butusing a market order on anoption trade can be deadlydue to the lack of liquidity.Youmightgetonecontractatthequoteyouseeandthenfillthe rest 50 percent higher.Always use limit orderswithoptions—noexceptions.

■OptionsTablesReading an options table toseethequotesforalltheputsand calls and knowing whatyou are looking at can be achallenge at first. I have re-created the closest twomonths options tables forGoogle in Table 8.1. There
arealotofnumbershere,butit is not so hard to walkthrough.Thetableissplitintotwosides, theoneon the leftfor calls and on the right forputs. The column down themiddle separating them liststhe expiry first and then thevarious strikes underneath it.I have truncated the list forGoogletoonlya$50rangeofstrikesforonlytheSeptemberand October expiries for
2013.ThisdataweretakenonSeptember 9, so there wereroughlytwoweeksleftintheSeptember options. ThecolumnlabelsLast(lastpricetraded), Change (fromprevious price traded), Bid,Ask,andVolumeareallself-explanatory. You see thesame data when you tradestocks.Thenext column, IV,for implied volatility, is ameasure of the risk or
uncertaintyoftheoptionsandis determined from thevolatility in the market andthestockitself.ThelowertheIV,thelessvolatile thestockandoptionsare.Theadjacentcolumn,OI, or open interest,tellsyouhowmanycontractswere outstanding as of theprior day’s close. As anoptions trade can be openingorclosing,thisisusefultoseewhere the majority of trades
are focused, and how itchanges over time. The lastcolumn, Delta, is a measureofhow theoptionspricewillchange with a change in thestockprice.TABLE8.1 GoogleOptionsTable
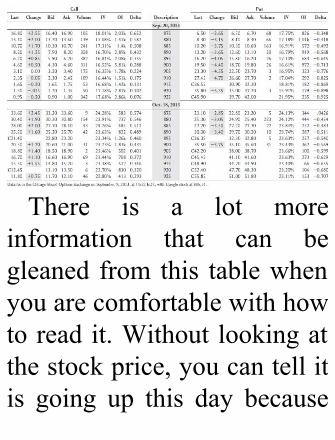
There is a lot moreinformation that can begleaned from this tablewhenyouarecomfortablewithhowtoreadit.Without lookingatthestockprice,youcantellitis going up this day because

thecallpriceshaverisenandthe put prices have fallen.You can also see that OI onthecallsideoutweighsOIonthe put side and the mostpopular call strike is the 900call in bothmonths from theOI. Notice that most of thevolume is takingplace in thenear month, September, andthat many strikes in Octoberhave not even traded (thosedenotedwith a C in front of
the last price). You mightalsonoticethattheIVisverylow at 16 to 17 percent inSeptemberandonly23 to24percent in October. Thishappens to be very close tothe IV of the broad marketindex ETF SPY. Google isnot a very volatile stock.There is awealth of analysisthatcanbedoneonthisdata.But start with understandingthebasics.
■SomeBasicsAppliedOptions can be traded justlike the stock, and thatanalogy is useful to make afew points. In some high-priced stocks likePriceline.com and Google,the options can be moreactive than the stock itself

because of the high stockprice.Tradersusuallybuyin-the-money (ITM) or at-the-money (ATM) calls, wherethe strike price is lower thanthecashpriceofthestock,orjustout-of-the-money(OTM)calls, where for example thestock price is $885 but thestrike is 890, and use thetechnical levels in the stockprice to stop theoption tradeortotakeprofits.Inthisway

they use a fraction of thecapital it would take to buythe stock. Using Google at$885 as an example, the 880strike ITM calls for the nearmonth were offered near$13.60, just under 2 percentthe price of the stock. The890 strike OTM calls wereoffered at $8.20, or about 1percent of the price of thestock.Which tochoose, ITMor OTM, is a big bone of

contentionwithtraders.IknowIpromisedtoavoid
the Greeks, but one Greek,delta, helps to illustrate thedifference. Delta is thechange in option price withthe change in price of thestock.Sothehigherthedelta,the more closely the optiontracks the stock. An ITMoption has a much higherdelta than one that is OTM,and thedeeper in-the-money,

the higher the delta, for agivenexpiry.Andthechangein delta as youmove up anddown the strike prices isasymptotic to 0 and 1. It isnear zero for far OTM callsand near 1 for deeply ITMcalls.The880 strike call hadadeltaof0.582,whereas the890 strike call had a delta of0.432. So for every $10 thatGooglemoveshigher,the880strike call will move about

$5.82 while the 890 strikecall will move only $4.32.For that $10 move the ITMcall would have a 42.8percent return, while theOTMcall has a 52.7 percentreturn. Seems like the OTMcallisthebestbet,right?Thetrouble is that it works thesamewayonthedownside.IfGoogle drops $10, then theITM call loses 42.8 percentwhile the OTM call loses

52.7 percent. This is wherethe debate comes from. Doyou favor protecting capitalormaximizing return? Ifyouare trading calls in thismanner as a stockreplacement strategy for alonger-termtrade,thenIurgeyoutotradeITMcallsnottoofar below the cash price, toprotect your capital. You arealready getting massiveleverage over the 1 percent

return the stock had for that$10move.This brief digression was
for a reason. The debatebetweenusingITMandOTMstrikes can be heated. Andboth are good for differentreasons. The correct optionstrike to employ is reallydependent on why you areusing options and how youare designing your trades.Mostofthetradeswewillbe
creating will use OTMoptions. This is intended tolowercostandcapitalatrisk.It is through creatingcombinations of optionsaround these primary tradesthat we can also adjust thatdelta higher andmanage riskbetter. So don’t get stuckthinking ITMoptions are theonly way to trade stock. Ipromise we will not talkaboutdeltaagainoreverlook

tocalculateit.As for the other options
Greeks, theta is the mostimportant. This measureshow options values decaythrough time. Just know thatthis happens because theyhave an expiry. Merelyholdinganoptionasthestockmovessidewayslosesmoney.Just what you need, right?Onemorewaytolosemoney.The rest of the Greeks we

don’t care about. They areimportant to many strategiesand to perfecting the optionsprice, but are not relevant toour trading strategy.There isa cousin of one of them,though, implied volatility,that will come up later, butagain with no calculations.There are no doubt millionsofpagesoftextaboutoptionsand the Greeks and manydifferenttradingstylestotake

advantage of all of thesenuances.All are important ifyou are trying to ensure thatyoudonotpaymorethanfairvalue for an option and thatyou sell it for at least fairvalue, or you are tradingspecificallyforthechangesinthe Greeks or volatility. Allof that is for the quants, notus. Please do continue toeducate yourself aboutoptions, as any additional

learningcanhelpaddtoyouredge,butthisisnottheplacetowriteitall.There is one final note on
alloptionsbeforewegetintothe combinations. Any shortoption combination willrequire margin to somedegree, with two exceptions.First, short put optioncombinationscanbeexecutedoutside of a margin account,like in an individual

retirementaccount(IRA)ora401(k), using what brokerscall cash-protected or cash-covered puts; basically, thebroker reserves the full priceof the naked put. Second,short call spreads can beexecuted in an IRA or a401(k); all other short callcombinations require amarginaccount.Withabasicunderstanding
oftheoptionsbuildingblocks

—alongcall,shortcall, longput, and short put—and anintroduction to the conceptsof delta and theta, we canstart assembling them to seewhatsomecombinationslooklike and how they react. Inthe chapter following thisdescriptivechapterwewillgothrough some practicalapplications using charts.Afterthatwewillbereadytodesign trade ideas from our

watchlist.

■ConclusionOptions can be great toolsonce you understand themand apply them to the rightsituation. In this chapter westarted to explore them andmany of their characteristics.You should now understandall of the specificcharacteristics of an optionscontract. You should

understand the differencebetween the rights of theoption holder and theobligations the option seller.You should understand thecharacteristics of the optioncontract, like the size of theobligations and when therights can and cannot beexercised. You shouldunderstand the pricingterminologyof in-the-money,at-the-money,andout-of-the-

moneyoptions, andhow thatcreates intrinsic value. Youshould also comprehend howanoptionspriceisthesumofthe time value and intrinsicvalue. You should realizewhyyouwoulduseanoptioninstead of stock and whatsome of the advantages anddisadvantages of options are.Finally,youshouldbeabletoidentify some differencesbetween options and stock

and know when they willmakeamaterialdifference.After this introduction, we
can now move on todeveloping combinations ofthese tools to design tradesforourstocksetups.

CHAPTER9
OptionsCombinations

With a basicunderstanding of the
options building blocks, putsand calls, you can now startto look at how you mightcombine them to youradvantage.Putsandcallscanbe combined in manydifferent ways to producecombinations that we willuse. The combinations areendless. Here is a list of the13mostpopularones,starting

with the most basic andworking into more complexcombinations. These willcover most of our tradesdirectlyorthroughcombiningthem.1. Covered call or buywrite.
2.Longaputorcall.3.Shortaputorcall.4. Long a put spread orcallspread.

5. Short a put spread orcallspread.
6.Longaratioputorcallspread.
7. Long or short aCalendar.
8. Long or short aDiagonal.
9. Long or short aButterfly.
10. Long or short aStraddle.

11. Long or short aStrangle.
12.Longor short an IronCondor.
13. Long or short a RiskReversal.
Option trading, like anyother business, has its ownlingo.Once you get to knowit,itwillbecomepartofyourdailyvocabularyaswell.Wewill look at each of thesecombinations with an eye
toward when they might beused and how.At the end ofthis chapter you should beable to define each strategyand have a goodunderstanding of when theymight be used. Let’s take abrieflookateachofthese.
■CoveredCallorBuyWriteThe covered call is nothingmore than selling a call,usually at a strike above thecurrentstockprice,whenyoualready own the stock. It isthe most popular optionsstrategy employed by far.Most investors or traders use

it to produce extra incomefrom their stock holdings. Itdoes cap your gains in aposition if it is in-the-money(ITM) at expiry. If thishappens, you will be calledaway at the strike price.When the call is sold at thesame time that the stock ispurchased, it is called a buywrite. Some traders use thisstrategy the same way thatthey do the covered call, to

earnextraincome.Ifthefirstexpiry passes without beingcalled, they write anothercoveredcall.The buy write can also be
executedasadistinctplay toattempt to capture the moveinastockwhile lowering theentry cost. The chart ofBoeinginFigure9.1helps toillustrate its use. A trader inthissituationonJuly5,2013,seeing a breakout possibility,

might elect to own the stockat 104.20 and then sell theweekly106callsfor50cents,making a buy write. If thestock moves above 106, thetraderiscalledawaybutforagain of $2.30 in one week.That is $1.80 on the stockplusthe50centsfromsellingthe call. A 2.30 move in aweekforBoeingisabigdeal,soyou shouldbehappywiththat, but if the short call

expires, thenthetradermightsell the July monthly orAugustcallstobringinmorepremium and lower thetrader’scostbasisfurther.
FIGURE9.1Boeing—CoveredCall/BuyWrite
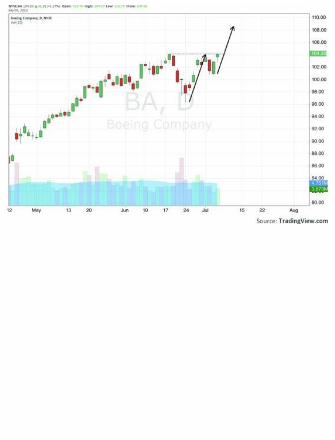

■LongaPutorCallWe have already spent sometimediscussinglongputsandcalls.Buyinga call is a low-cost way to capture upwardprice movement in a stock.Andbuyingaputisamethodto capture downsidemovement. Both limit the

capitalatrisktothepremiumpaid for the option. In thecaseof theputbuy, it isalsotheonlysafewaytogetshortexposure to a stock that hashigh short interest. Wediscussed inChapter7 that itisprudenttotakenameswithhigh short interest (over 10percent)offyourstockwatchlistifitisashorttradesetup.This is because the risk of ashortsqueezemeansthatyou

would be subject totheoreticallyunlimitedriskonthestockmovinghigher.Thiscan happen in a flash andalwayshappenswhenyouarenotpreparedfor it.Yousetastoplosstobuythestockandthe price gaps over it anddoes not execute becauseeveryone else is in line infront of you. The 50 centsyouthoughtyouwereriskingturns into a $2, $5, or $10

loss. Ouch! Buying a put inthis case changes thatdynamic. If youwant to risk50 cents, you buy a put thatcosts50cents.If thepriceofthe stock moves $10 higheragainstyou, thenyouareout50 cents. That is it. If theprice continues to fall, thenyou participate in thedownside movement. That isone of the most magicalpowersofoptions.

■ShortaPutorCallShorting calls and shortingputs, or call and put writing,are used for two verydifferent reasons. Shorting acall by itself can be a riskyventure.Whereasbuyingputsina stock thathashighshortinterest gives you magic

powers to avoid a shortsqueeze, selling a naked call(unhedged with stock oranother option) is like anti-magic. The most you canmake on this trade is thepremium that you sold theoption for, but the obligationto sell the stock can put youshortinastockjustwhenyoudonotwanttobe.A$10gapabove your strike will leaveyouexposedatjustthewrong

time. Most traders who sellcalls naked do so at levelsthatareperceivedtobesafelyabove the current price, sothatthetradercanhedgethembybuying the stock, creatinga covered call, before thepricereaches thestrikeprice.You will need to leave a lotof capital or margin in youraccount to be able to hedgeaftertradingashortcall.Shorting a put is very
different.Therearetwomajorstrategies that employ shortputs. The first is to generateincome, or premium as it iscalled by traders. The sameway that stockholders sellcovered calls for premium,putwritersinthisstrategyarelooking to collect thepremiumfromsellingtheput.They sell puts with strikesbelowwheretheybelievethestock will trade by expiry.

Theyrelyonthecombinationof their analysis of the pricemovement and the timedecay,theta,tolowerthecostoftheoptionsuntiltheygettoexpiry or a return acceptableto thewriter. They can closetheir naked put by buying itback, or hedge by shortingstock,ortheycanalsorolltheput down or out or both.Rollingtheputmeansbuyingitbackandthensellingeither

a lower strike put (rollingdown)or a longer expiryput(rolling out) or both (rollingdownandout).Time isworking foroption
writers. If you sell a put orcall and the stock goesnowhere, you win. Thesecond put selling strategyuses the same principles, buttopickandsellastrikethatislikelytobereachedatexpiry.In selling puts that are

expected to be in-the-moneyat expiry, traders are lookingto own the stock at a lowerprice than they can buy ittoday, and lower than theycan buy it if it falls to theirstrike. The chart of Verizonin Figure 9.2 offers a goodexample. If the stock is at51.29 and traders sell a 50strikeputfor$0.50,theywillownthestockwithabasisof49.50iftheyareputthestock
at expiry: lower than 51.29andlowerthan50.Theywanttobeput the stockat expiry,or at least are comfortableowning it at the strike pricethey are selling. If the stockdoesnotreachthestrike,thenthey get to keep the $0.50premiumlikethefirstputsalestrategy. They can alwaysbuythestockif itdoesbreakabovetheresistancenoted.

FIGURE9.2Verizon—PutSale


■LongaPutSpreadorCallSpreadAcallspreadisnothingmorethan buying a lower strikecall and thensellingahigherstrikecallofthesameexpiry.Aput spread is the samebutbuyingahigherstrikeputand

selling a lower strike put.This is also known as avertical spread. Let’s use thecall side to explain the rest,butyoucan replacecallwithput throughout thisexplanation.Thestrikeofthelongcallis
chosen based on youranalysis of where a triggershould be, and the short callstrike is chosen either tomatch where resistance is

expected or at a point toreduce the cost of the spreadto an acceptable level. Igenerally do not like to sellthe upside call to create thespread if the premium fromthe sale does not give me atleast 25 percent of thepremium paid for the longcall. I also look to maintainthe cost of the spread belowone-third of the differencebetween the strikes. So for a
$5 spread I do not want topay more than $1.33. Thisensures a reward-to-risk ratioofatleast3:1,orrisking$1tomake$3.So,forexample,ifIam reviewing a 50/55 callspread in Dollar Tree inFigure 9.3 and the 50 strikecall that I am purchasingcosts $1.75, I want the 55strikecall togenerateat least44 cents to meet the 25percentrule.Youcansellthe
upsidecallforless,butinmyview it is not worth cappingtheprofitinthetradeforlessthan25percentoftheoriginalcostunless it is avery stablestockwithlowvolatility.That55 strike call must alsogenerate at least 42 cents inpremium to meet therequirement that the net costbe less than one-third of thedifferenceinthestrikeprices.

FIGURE9.3DollarTree—LongCallSpread

Call spreads are usedinitially when there is strongdefined resistance above atrigger or the cost of thedesired long call isprohibitive. This is also in a
tradewhere there isaclearlydefineddirectionalbiastotheupside via some trigger. Thetraderwishestoparticipateinthestockpricemove.A longcallcanalsobe turned intoacall spread at a later date byselling the higher strike call,for more money, after thepriceofthestockhasrisen.

■ShortaPutSpreadorCallSpreadBeing short a put spread orcall spread is technically justthe opposite of being longone,buttheimplicationsareabit more complicated. Beingshort a call spread is being

short a lower strike call andthen buying a higher strikecall.Beingshortaputspreadis being short a higher strikeput and long a lower strikeput.With this trade,youwillearn a credit to enter itbecause the option that youare selling is close to theprice of the stock and hasmore value than the optionthatyouarebuying,whichislesslikelytobein-the-money

at expiry. The differencebetweenthetwo,orpremium,isthemaximumyoucanearn.Onebigdifferencebetween
being short a put or callspread instead of just beingshort a put or call is that itlimitstheriskinthetrade.Bybuying the put or call at thefurtherstrike,youarelimitingyour risk to the differencebetween the strikes of thespread, less the premium

earned from selling thespread. So if you sell a 95strike put for $2 on a stockwith a price of 94, you caneithercollect$2orbeat risktobuy thestockonaclosingprice of the stock at expiryunder 95. In this trade yourdownside could be as muchas $93 if the stock fell tozero. If instead youadditionally bought the 90strike put for 50 cents, to
createashortputspread,thenyour maximum gain isreduced to $1.50, but yourmaximumlossisalsoreducedto only $3.50. If the pricecloses below 90 at expiry,your losses are capped. Thisisbecauseinessenceyouwillhavetwooptionsexercisedatexpiry. The short putwill beexercisedagainstyou,forcingyou to buy the stock at 95.Butthenyouwillexercisethe

longputandsell the stockat90.Your losses at expiry are$5butyoumade$1.50ontheinitial sale of the spread. Inactuality your broker willoften take care of bothexercises of this for you iftheyarebothin-the-moneyatexpiry. The short call spreadworksthesameway.There are two reasons that
wewillusethesetoolsinourtrade design. The first is to

earn premium. In this tradewe are looking for the shortspread to finish out-of-the-money and just collect thepremium. In these trades wewill elect to sell strikes thatare unlikely to be in-the-money at expiry from ouranalysis of the technicalsituationinthechart.If thereare confluences of supportlevelsonastockatapriceof24, forexample,wemaysell

the22strikeput.Thesecondput that we are buying, tomake the spread, is thenselected to balance the profitfromthesalewith therisk inthe trade.More on this later.Thesecondlooksverysimilarbut is intended to serve adifferentpurpose.Sometimes we will sell a
call spread or put spread toreducethecostoftheprimarytrading strategy. If, for

example, we are looking toparticipateintheupsidepriceaction in Google above 900,wemaybuya900strikecalltodoso(seeFigure9.4).Thismay cost over $25 percontract if it has some timeleft until expiry. Since webelieve that there is strongsupportforGoogleat860,wemay decide to also sell an840/820 put spread for $5.This reduces the cost by 20
percent, increasing theleverageinthetrade.Thisputspread sale then is a fundingtrade.Westillwouldliketheput spread to expireworthless,butweputitonforadifferentreason.
FIGURE9.4Google—ShortPutSpreadExample
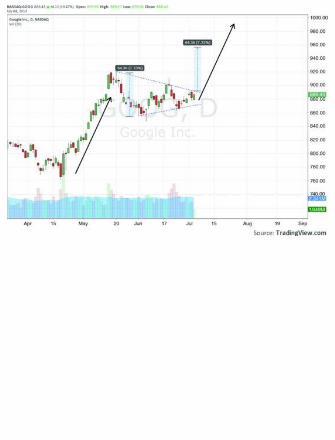

■LongaRatioPutorCallSpreadA slight variation on the putorcallspreadisaratioputorcall spread.Using a long putspread as the base case,moving to a long ratio putspread is nothing more than

selling two (or more) of thelowerstrikeputs.Soifwearetradinga50/45put spread inDollarGeneral, we buy a 50strikeputandsella45strikeput, to participate in a stockpricemovelowerfrom50/45.Byinsteadbuyinga50/451×2ratioputspread,buyingone50 strike put and selling two45 strike puts, you stillparticipate in a move in thestock lower from 50 to 45,

making $5. The 1 × 2 costsless, as you are selling twooptions instead of one in aregular spread. But in thisstructureifthepriceatexpiryis 45or under, thenyouwillalso be put the stock due totheextrashortput.Thistradehas a breakeven lower attwice thespread less thecostto put the trade on.So if the50/45 1 × 2 cost 50 cents,then it would have a

breakeven at 40.50. Between40.50 and 45, although youwere put the stock, you canimmediatelysellitforaprofitagainst the$5collected fromtheputspread.At45youwillownthestockwithabasisof40.50, the 45 price that youwereputthestocklessthe$5fromtheputspread.There are a few reasons to
usethistradeoverthestraightput spread. The lower strike

is usually chosen near astrongsupportlevel,sothatifyou are put the stock, yourbasis is lower thanwhere thestock price settles. If youwant to own the stock at alowerpriceafterparticipatingon the downwardmovement,this is a good construction.You might also select thelower strike at a level youbelieveissafelybelowwherethe stock will settle. In this
construction you are lookingto participate in somedownside in the put spread,but to avoid being exercisedagainst. The sale of thesecondputissolelytoreducethe cost to enter the trade,providing more leverage, oras a possible future entrypointtoownthestock.Manytraders also use this trade onthe call side when they arelong a stock that has been

depressedandlookssetuptomove higher. If theyoriginally bought CampbellSoup(seeFigure9.5)at44.50and it is trading at apriceof43.50,forexample, theymaybuy a 44/45 1 × 2 ratio callspread, buying a 44 call andselling two 45 calls, to rampup their earnings stream.Often these 1 × 2 ratio callspreads can be constructedfor zero cash outlay. The

beauty of them when youalreadyown the stock is thatyou thencanearndouble theupside at no additional risk,toacappedlevel.Ifthepriceexceedsthehigherstrike,youhaveacallspreadthatmaxesat$1andyougetcalledawayonyourstock$1higher.Yournet sale proceeds are at aprice of 46 instead of 45 ifyou had just sold the stockthereoracoveredcall.
FIGURE9.5CampbellSoup—RatioCallSpread
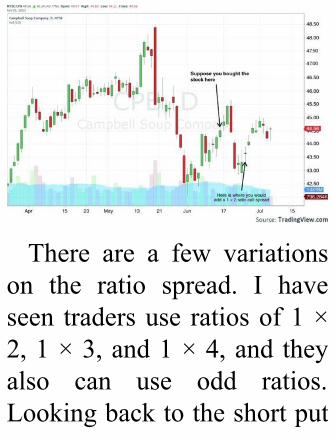
There are a few variationson the ratio spread. I haveseen tradersuse ratiosof1×2,1×3,and1×4,andtheyalso can use odd ratios.Lookingbacktotheshortput

spread, one reason forentering it was to fund adifferent trade. Ratio spreadscanbeusedinthismannertoadjust the cost of the othertrade. In these instances aratioof2×3or7×17oranyother ratio that creates thedesired reward-to-risk outlayon the entire trade may beused.Finally, thefartherout-of-the-money strike optionmay also be split in a ratio.

Using the previous DollarGeneral example, instead ofbuyinga50/451×2ratioputspread, buying one 50 strikeput and selling two 45 strikeputs, we might decide toinsteadbuya50/45−401×2splitratioputspread.Inthiscasewestillbuyone50strikeput, but we sell one each ofthe 45 strike put and the 40strike put. This constructionparticipates in the downside
from 50 to 45 and then iscappedbetween45and40at$5. It thenwill lose some ofthat gain if the stockcontinues to fall until at apriceof35itisatbreakeven.If the stock closes below 40atexpiry,youwillbeput thestock but at 40 and with abasis of 35. Traders mayadjust the ratio put (or call)spreadinthismannerbecausethey see a downside setup

that they wish to participateinthathasmorecertaintytoaparticular level, the firstdownsidestrike,and theyarewillingtoownitmuchloweror wish to avoid owning italtogether,butwishtoreducethe cost of the initial putspread.

■LongorShortaCalendarA Calendar spread is just afancy name for a call or putspreadwherethetwooptionshave different expiries. Thetwo options usually have thesame strike price. With one
month or more between theexpiries, these are alsoreferred to as time spreads.There isoneweirdnuance toCalendar spreads, though,when compared to regularspreads.Usingthecallvarietythistime,alongcallCalendarisonewhere the frontmonthisshortandthebackmonthislong.SoalongGoogle(referto Figure 9.4) July/August900callCalendarisshortthe

July 900 call and long theAugust900call.Ifindthatifyou look at it as if you arebuying time itbecomesmoreintuitive.Traders may buy a call
Calendarwhentheythinkthatthe price of a stockwill riseover time, but not too fast.Ratherthanjustbuyingacalloranoutermonthtogivethestock time to rise in price,they add a short call in the
nearmonthtolowerthecost.Thestrikeischosentoreflectthe potential resistance areasoverhead with anunderstanding of the timeuntil the expiry as well. Theperfect scenario for a traderwhoislongacallCalendarisfor the stock price to closejust under the strike price ofthe short option at expiry,making it worthless. At thatpoint the long call that

remains will still have timevalue, usually more than theinitial premium cost of thecombination. This leaves thetrader with two choices: sellthelongcalltotakeprofits,orcontinuetoholdthelongcalllooking for stock priceappreciation to sell it higherlater. If the stock is expectedto trend from your technicalreview, you would give thelongcallsometimetorisein

value.It is always possible that
your strike pick will end upITM at expiry. In this case,closing the spread willusually be profitable. This isbecause the short call willtrade at its intrinsic value—the option has no time valueorthetaleft.SoaGoogle900call at expirywhen the stockprice is 905 trades at theintrinsic value of $5. The

longcall,however,stillhasalot of time value in it inadditiontotheintrinsicvalue.At extreme moves, theCalendar can move to anunprofitable situation. If thestock is materially above theshort call strike price, thespread will move closer tointrinsic value on bothoptions, lessening the timevalue differential. Thesetrades are not for use when

there is the possibility of anoutsized move above theshort call price. Thealternative to closing thespreadisjusttobuybacktheshortcallandletthelongcallcontinuetomovehigher.Thisis riskier as there is noguarantee that the technicalview will play out asexpected. A long putCalendar is very similar andusedwhen the trader expects

thestocktofalloveraperiodoftime.Thechoicesatexpirywhether the price puts theshort put ITM or not are thesame. There is no need torehash it for long putCalendars.AshortcallCalendar,then,
is a combination where thetrader is long thenearmonthand short theoutermonth.Ashort IBMJune/July200callCalendar, then, is where the
trader is long the June 200calls and short the July 200calls. Putting on a short callCalendar generates a credit.Traders will use thiscombination when they wantto earn the premium frombeing short the longer call,but are also looking forprotection in the near termagainstastrongmovehigher,byalsobuyingacheapfront-monthcall.

IfindtheshortputCalendareasier to understand and amost useful tool on the shortside. The short GoldmanSachsAugust/September 140put Calendar spread is thecombinationofalongAugust140 put and a shortSeptember 140 put. In themacro view, this is a tradetaken with the expectationthatthepricewillcloseabove140atSeptemberexpiry.We
learned earlier in the straightput and call section thattraderswillsometimesshortaput as a trade entrymechanism or to collectpremiumwiththeexpectationthat the option will expireworthless. This is the samereason to employ the shortSeptember expiry put in thisput Calendar spread. Whentraders believe that there isshort-term risk to the

downside,theyconvertthistoa put Calendar, also buyingthe August 140 put in theexample.Thiswillsometimeshappenonanearningsreleaseor if some scheduled newsannouncementputs the initialshortputtradeatrisk.Thisisaninterestingaside.
Traders do not have to enterintobothoptionsof theshortput Calendar at the sametime. They also do not have

toexitbothpiecesatthesametime. When that spike downdoes come, and traders thenexpectareversalhigher, theycansellthecloserAugustputto enhance the value of thetrade,leavingtheshortputinSeptember, but with morepremium in their account.Soif the price drops to 135 andtheAugustputcanbesoldfor$7, the trader would still beshort the September 140 put,
but be protected down to aprice of 133 (the 140 strikeless the $7 collected on theAugustputsale).AshortputCalendar can alsobeusedasthe funding piece of a largercombinationofoptions.Occasionally there is a
stock that looks like it couldhave great upside potentialbut may be challenged or atriskfordownsideintheshortrun.Inthatcaseatradermay
opt to both buy a callCalendar and sell a putCalendar. If the stock pricefalls the trader can close theshorter-datedlongputtogainsome price buffer for thedownside, looking for thelonger-dated short put toexpire on a rebound in thestock price later. If the stockprice just rises, then the putCalendar sale served thepurpose of funding the call
Calendarmorecheaply.Let me give you one final
pointontheuseofCalendars.I find long call and putCalendars preferable overstraight buying of calls andputs when the market seemsto be pausing within thecurrent trend. They give theabilitytoexpressaviewwiththe trend in a longer timeframe but without all of thecostthatastraightcallorput
buy would entail when thereis no short-term gain to beseen. The alternative, asalways, is just not to tradeuntil the pause is done andthe trend resumes,but that isriskyinthatyoumaymissthestartofthemoveaswell.ItisrarethatIwilluseashortcallCalendar because of themargin required for shortcalls, but I use short putCalendars often as funding
tools, and as a specificstrategy around events likeearningsannouncements.

■LongorShortaDiagonalA Diagonal spread isbasicallyajustacombinationof the call or put spread andthe Calendar spread. For alongcallDiagonal,youbuyacall option inone expiry and
sell a call option at a higherstrike in a longer-datedexpiry. Using the GoogleJuly/August 900 callCalendar example frombefore, to convert that to acallDiagonal the trademightinstead put on aGoogle July890/August 900 callDiagonal. Here the trader isselling the July 890 call andbuying the August 900 call.This can also be a bullish

trade, looking for the stockpricetorise,butnotasfastasyouthinkitmayrise initiallyinthecallCalendarscenario.Short call Diagonals can
often be entered for a credit,asthenearmonththatyouareselling isusuallyworthmorethan theoutermonthyouarebuying. The reason for usingthiswouldbeifthroughyouranalysisyouseethatthestockisinaresistancezoneorthere

isonenearbyabovethatmaytake some time to workthrough.Thiscangiveaddedconfidence to sell a lowerstrike call than you wouldwith a trending stock, whereyou would use a Calendarinstead. Entering for a creditgives some leeway to closeout the shorter-dated optionearly ifyouarewrongand itmoves faster. This tradestructure has maximum loss

of the distance between thestrikes(lesstheinitialcredit).If the shorter strike 890 callexpires worthless asanticipated, then the trader isleft with the same decisionsontheremaininglongAugust900 strike as in the callCalendar scenario: sell or letitrunhigherwiththetrendingstock price. The short putDiagonal is the samestructure: short a near-dated

put and long an outermonthput at a lower strike. AGoldman Sachs August150/September 140 putDiagonal would be anexample.InthisDiagonalthetrader is looking forsomething to stall GoldmanSachs’s price above 150 inAugust and then for it tocontinuelower.ThismightbeapatterncompletingorareadofopeninterestintheAugust

options chain. These twotypes of trades, whenexecuted near the currentpriceinthestock,areabitofagambleontimingandmakethem difficult to haveconfidence of winning. Butwhen they are done fartherout-of-the-money, there canbe more certainty that youwillbeabletokeepthecredit.The flip sideof these trade
structures, long a put or call

Diagonal,aremorefrequentlyused for directional plays. Iftraders were to see thatGoldman Sachs looked tohead lower and wished toparticipate right away, theymight buy the August150/September 140 putDiagonal. Here they arebuying the August 150 putand selling the September140 put in anticipation thatthestockfallsbutmeetswith

support before hitting 140 orbounces above 140 by theSeptember expiry. Traderscan sell just the August 150puts on amove lower in thestock, or leg out of the tradewhen they thinka reversal isforming. In this trade thelower strike may be choseneither to avoid being put thestockdue to somesupportoratalevelthatthetraderwantstobuythestockinthefuture.

Long put or callDiagonalsusually cost money to enter(some can also be for acredit),andthatpremiumisagood approximation of whatis at risk, provided that thetrader closes both options atthe same time. So if theAugust150put isbought for$3andtheSeptember140putis sold for $1, the totalpremium of $2 is at risk.Traders would choose this

structure over a put spreadwith the same strikes if theydo not want their profitscapped on a move lower inthe short run and think thestockwill recover, or if theythink that the support willhold for a long time so thencan lower their cost of entryin the whole trade. Traderswould choose this structureoveraputCalendaratthe150strikeiftheythinkitmaytake

alotoftimeforarecoverytohappen in the stock priceonceitstopsfalling.Thelongcall Diagonal can be playedfor the opposite move. Thetrader is looking to capturethe near term upside in thestock by buying the GoogleAugust 900 calls andexpecting it to stall or fallback (due to reaching an all-timehighorduetohighopeninterest in the September

optionschainbelow920)andselling the September 920call. These spreads also costmoneytoenter,andthetradermay choose to close out oneleg of the spread early orbeforetheother.I find the short version of
these trades, yielding only asmall credit and then hopingthat the price moveaccelerates, not to be veryuseful or interesting and

rarely use the structure. Thelongversion is another story.These can be quite lucrative,especially for an earningsplay in a volatile stock withhigh short interest.The stockcan miss earningsexpectations and fallprecipitously,allowingyoutosell the shorter-dated option,and then short coveringmoves the price back higher,leaving the longer-dated

option at little risk or farenoughout-of-the-moneythatitcanbeprotectedorhedgedcheaply. Anotherconsideration before youdecide to trade these is thatlong Diagonals (like shortCalendars) use margin. Soevenifyouenterthetradeforacredityoumayincuracostbesidesthecommissions.

■LongorShortaButterflyA Butterfly involves tradingfour call or put options onthree different strikes. Thestrikes are equidistant fromone another, so a callButterfly on Google might
use the August 900/940/980strikes. A long call Butterflyspecifically would entailbuying the two outer strikes,the 900 and 980 calls, andthensellingofthetwomiddlestrikes, the 940 calls. Thiscreates the equivalent ofbeing long a call spread(August 900/940 call spread)andshortahighercallspread(August 940/980 call spread)atthesametime.Astheprice

of the stock rises at expiry,the Butterfly increases invalue to a maximum at themiddle strike and then fallsoffas thepricerisesover themiddlestrike.Asitreachesorexceeds the upper strike, itfalls to zero value. This is atrade that is targeting aspecificprice for thestockatexpiry,themiddlestrike.Themaximum lossonbeing longa Butterfly is the premium

paid, so it is a low-costdefined-risk strategy. That isthetheoryyouwillgetfromadetailedoptionsbook.In practice, though, stocks
move back and forth beforeexpiry, and traders have theability to close legs of thecombination separately ortimethepriceaction.Wewilldiscuss more on that in thelast section. A long putButterfly operates the same

way. The Goldman SachsJuly 130/140/150 putButterfly would be buying aJuly 130 put and a July 150put and selling two July 140puts, lookingforasettlementpriceatJulyexpirynear140.The center strike is themostimportant to select. It shouldbe chosen based on anexpectedsupportorresistancelevel ina trend,optionsopeninterest, or other patterns. If

there is a confluence ofsupport from a Fibonaccilevelandatraditionalpatterntarget, for example, that alsocoincides with large (in arelative sense) open interestintheoptionsforthatexpiry,youhaveagreatmiddlestrikefor your put Butterfly. Fromthat point, selection of thetwo outer strikes is acombination of reviewingnear and far put levels that

are important to the stock,and how that impacts theprice of the Butterfly. Sinceyou are buying the closeststrike, it will be the mostexpensive.Thefarstrikewillbetheleastexpensive.Somestartbylookingatthe
long call (or put) Butterflytrade as a long call (or put)spread to choose the nearstrike. That works. If youwanttoparticipateinamove

in Google from 900 to 940,then a 900/940 call spread isagreatchoice.Addingashort940/980 call spread to createthe900/940/980Butterflycanreduce the cost and yourcapital at risk, limiting yourprofit potential only if thepriceexceeds940atexpiry.AshortButterflyisanother
way to collect premiumwithlimitedrisk.Rememberthatashort IBM 170/180/190 put

Butterfly is a combination ofa short 190/180 put spreadand a long 180/170 putspread. This gives a smallercredit than just selling the190/180putspread,sinceyouarebuying the180 strikeputtwice. So why do it? If youarewrong, and Imean reallywrong, your loss evaporateswith the Butterfly. In the190/180 put spread, if theprice falls to only 191 at
expiry you keep the entirepremium from the spreadsale. If it falls to 180, thenyou lose $10, less thepremium you earned on theinitial sale. At any valuebelow 180 the loss is aconstant$10.Butintheshortput Butterfly, since you arenow also long a 180/170 putspread, your loss starts tolessenunder the180priceasthe 180/170 put spread is
increasing in value. And, infact, if the stock just cratersandclosesat170or loweratexpiry, the loss in the190/180 put spread ismatched by the gain on the180/170putspread.SoifyouenteredtheshortputButterflyforacredit,youwillkeepthatcreditasyourprofit.Thiscanbe a very cheap insurancepolicy against being wrong,especiallywhenyouseefrom

your technical analysis thatthereisapotentialforalargemovewhenthathappens.Thiscanbeagoodstrategy
forastockthatistradinginachannel well above a gapbelow near expiry. It isusually not that lucrative,though. The chart of Netflixin Figure 9.6 is a goodexample.AsitapproachestheJuly 2013 expiry, there is agap below from 204 to 176

andsupportat192inbetweenfrom the price action ofMarch throughApril. Sellinga July 200/195/190 putButterfly would express aviewthattheislandholdsup,butthatifitdoesnot,amovebelow 190 is likely, to closethe open gap. On July 3,2013, you could sell this putButterfly for about 15 cents,though—not a great reward-to-riskratio.

FIGURE9.6Netflix—PutButterflySale
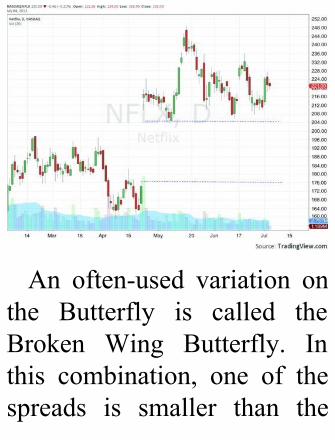
An often-used variation onthe Butterfly is called theBroken Wing Butterfly. Inthis combination, one of thespreads is smaller than the

other spread. In a longBroken Wing Butterfly it isusuallytheonefartherout-of-the-money, and in the shortBroken Wing Butterfly it isusually the opposite. Soinstead of the previous shortNetflix 200/195/190 putButterfly,youmightchangeitto a short 200/195/185 putBroken Wing Butterfly. Inthisvariation,yourmaximumlossisstillthe$5betweenthe

200 and 195 strike puts, buton a blowout lower the $10gainon the195/185 longputspread makes for an overallprofit of $5. The cost of thistrade on the same day wasabout 15 cents. Paying 15cents for the possibility tolose $5 and make $5 if youare really wrong seemsabsurd to me. I suggest youjust stay away from shortButterfliesaltogether.
TheBrokenWingButterflycanmakealotofsenseonthelongside,though.Goingbackto the Google August900/940/980 callButterfly, itcost $7.20 to enter in earlyJuly2013. If it settles at940onexpiry,thenthereward-to-risk ratio is 5.55:1 ($40maximum reward against$7.20atrisk).Thatisnotbad.But if you believe there is amoderate risk that the price

mightblowthrough940upto980level, thenyouwouldbeout the cost of the trade.UsinganAugust900/940/960call Broken Wing Butterflycosts a little more, $10.40,andpaysout the sameas thepreviousButterfly until pricereaches960.AtthatpointtheBroken Wing Butterflyensuresaprofitofatleast$10atanypriceabove960whilethe straight Butterfly can
continue togivebackprofits.So the call Broken WingButterfly is profitable at anyprice over 910, whereas thestraight call Butterfly isprofitable between 907 and973.

■LongorShortaStraddleA Straddle is a combinationof a put and call at the sameprice and expiry. A longStraddle, then, is being longboth a put and a call, and ashort Straddle is selling both
a put and a call. Like beingon both sides of the fence, aStraddle lets you participateinamoveinastockineitherdirection. Seems like a greatidea,right?Itisifitispricedright.But because a Straddleletsyoutradewithoutaview,it is often doubly expensivecomparedtowhenyouhaveadirectional bias. It makessense that if you buy a calland a put it will cost about

twice asmuch as if you buyonlyoneortheother.Straddles are used for a
numberof reasons.One is toparticipateinamoveoutofaconsolidation zone. A traderwatching Visa (see Figure9.7) in late June 2013mighthave noticed that theconsolidation channel wasapproaching two and a halfmonths, the same length asthechannel itbrokeoutof in

March.Butwithoutaviewastowhichway itmightbreak,tradersmightlooktoputonaStraddle. With absolutely nobias, they might use a 180Straddle, the middle of therange. This would be alogical choice in the middleofJunewhenthepricewasinthemiddleofthechannel.Togive you an indication, withone month until expiry this180 Straddle cost about $10

in mid-June. That was 5.5percent of the stock price,whereas if the traderanticipated that Visa wouldgo higher, the 180 call wasonly about $5. This meansthat the stock would have tomoveoutsideof the rangeof170 to 190 by expiry in onemonth to start to make aprofit.Thatisabigmove.
FIGURE9.7Visa—StraddleandStrangle


Another way to play thesamechannelwithaStraddleiswhen it reaches the top orbottom of the channel. As itreachedthetopofthechannelin late June, the trader could

play for either a breakoutabovethechannelorafailureand pullback toward thebottom of the channel bybuyingthe185Straddle.Thiswas priced at just under $10at that time. There are othervariations based on thetechnicalanalysisreview.Forexample,thetradercouldbuya longer-dated Straddle, outthreemonths.Thiswaspricedat $17. It had a higher cost,
but also hadmore time for amove.The tradermight also look
at the technical setup anddecidethata$10moveatthetopofthatchannelisunlikelywith the bottom of thechannelonly$8away.Inthiscase the trader may elect tosell the 185 Straddle andcollect the $10 premium. Inthistradethetraderislookingfor the stock to stay in place

and ideally at the Straddlestrike of 185. If the stockcloses at 180 at expiry, thetrader keeps the entire $10premium. This is unlikely,and since the trader is shortboth a put and a call, he orshe must be prepared to buybackoneorbothlegsinordernot tobeexercisedagainstatexpiry.These strategies are
employedbytradersforother
reasons as well that do notinvolve straight technicalanalysis.Optionstradersmaytrack the historical impliedvolatility in the options andthehistoricalvolatilityof thestock and make adetermination that theStraddle fromthesemeasuresis either expensive or cheap.Ifitisexpensivetheywillsellit,andif it ischeaptheywillbuy it. I mention this here

because it isaquitecommonstrategyandyoumayhearofit, but it is outside of thescopeofthisbook.Straddlesmayalsobeused
in conjunction with a stockposition. A trader who isstarting a position in Visawhen it breaks out over 185might buy a half position inthe stock and sell half aposition in the 185 Straddlefor $10. If the price of the
stockrisesorstayssteady,thetraderwillgetcalledawayonthe half position, but with a$10 gain on the trade. So aslongas thepricedoesnotgoover 195 the trader made agood trade. If the stockpricefalls, then the trader will beput the other half of a fullposition but have a basis of180 on the entire position(halfat185andhalfat175).I find long Straddles to be

most useful when severalfactors align: The stock ismoving in a very tightchannelforalongtime,therearebiggapsuntilsupportandresistance above and belowthe current price, and theStraddle is priced at whatseems like a cheap impliedmove in the stock by expiry.Conversely, short Straddlesare most useful when thestockistradinginarangefor
some time with support andresistance tight to the range,and the implied move in theStraddlewouldtakethestockwell outside of that supportandresistance.
■LongorShortaStrangleTaking the Straddle andadjustingitsothattheputandcall are on different strikes(still the same expiry)converts it to a Strangle. ForourexampleusingVisa,then,

instead of selling a 180Straddlewhen the stock is atthe middle of the channel at180, a trader may use a175/185 Strangle, selling the175putandthe185call.Thiswas $4 cheaper than theStraddle, giving only $6 inpremium inmid-June. In thiscombination the trader islooking for the price toremain between 169 and 191at expiry, and preferably

between175and185,thefullchannel. If it remainsanywherebetweenthestrikes,the trader keeps the full $6premium. The long Stranglecould be used as a cheaperway to trade for the channelbreak either way, but thetrader also does notparticipate inprofitsuntil thestock has moved further inprice than the Straddle. Itmustmove beyond the range

of the Strangle by thepremium paid in order for aprofit. It required a moveoutside of the 170 to 190rangetoprofitintheStraddlebutoutsideof169 to191 fortheStrangle.This isnotverydifferentandmaybeworthitfor the trader to pay less intheStrangle.Ifindthatthepreferenceof
oneovertheotherisamatterof the specifics of the stock

trade setup. If the channel oranticipated move from thetechnical analysis is wide,thenIpreferaStrangleonthesellsideofthetradeasithassome initial protection ifinertia takes hold. There aretimeswhenacombinationofStraddles or Strangles or amixisappropriateaswell.If,for instance, traders saw thatthe setup in Visa might takesome time to break out, then

theymight sell a Straddle orStrangle in the near monthand buy the Straddle orStrangleinanoutermonth.Inthis trade theyare looking toowntheoutermonthStraddleor Strangle after the nearmonth Straddle or Stranglehas expired or been boughtback very cheaply. The nearmonthsaleofaStranglethenis intended to lower the costof the outer Strangle, or to
fund that trade. If youexamine this double Strangleclosely,youwillnoticethatitcould also be described (andoftenis)asadoubleCalendartradeordoubleDiagonal.Thetrader is inessencelongbotha call Calendar and a putCalendar.

■LongorShortanIronCondorA final variation on theStraddle/StrangleiscalledtheIron Condor. The shortversion is short aStraddleorStrangle and then long awider Strangle in the same
expiry. The outer Strangle isequidistant from the innerStraddleorStrangle,meaningbothare$5or$10away, forexample. Referring back tothe Visa example, the tradermight sell a 180Straddle for$10andthenbuythe175/185Strangle for $6, creating a175/180/180/185 IronCondor. In this trade, thetradertakesin$4inpremiumand has a profitable trade if

thestockpriceremainswithinthe range of 176 to 184 (thestrike of the Straddle plus orminusthepremium).Becausethey are also long the outercall and put, they have amaximum loss of $1 againstthe potential of $4 profitmaximum.Traders would enter this
trade if they expected thestock to remain in a tightrange but wanted to limit
theirrisk.Inthelongversion,the trader is looking for amovetostopinarange,nearthe outer Strangle. You canlook at this trade as buyingboth a call spread and a putspread(theshortIronCondorwas short a call spread andshort a put spread). Buyingthe 180Straddle for $10 andthen selling the 175/185Strangle for $6 (the Visaexample) would not make
sense in this instance. Youwouldbebuyinga$5spreadfor $4, for a reward-to-riskratioofonly1.25:1,farlowerthan our requirement of atleast 3:1 reward-to-risk ratio.Trades tend to work betterwhen they consist of a longStrangle a bit away from thecurrentpriceandthenashortStrangle outside it. This isuseful when you expect alarge move in a stock either

wayandcandesign the tradeto pick up a piece of themove,notnear thebeginningofit,foraverycheapprice.Anothersituationwherethe
Iron Condor is used is whenthe trader believes that thestockwillgoupordown,butjustwantstolowerthecostofa Straddle. The trader maysell a wide Strangle then tocreate the Iron Condor withthe hope of not capping a
move in either direction butreducingsomecost.Sometimes traders call this
trade an Iron Butterfly if itusesaStraddle in themiddleand an Iron Condor onlywhenbothareStrangles.

■LongorShortaRiskReversalTheRiskReversal is the lastofthemajorcombinationswewill employ. A bullish RiskReversal is generally long acall and short a put at thesame expiry, and a bearish
Risk Reversal is long a putand short a call. The bullishRiskReversalholderthenhasleveraged exposure to thestock price in a one-directionalbet,up.Thetraderwinsonboththelongcallandtheshortputifthestockpricerises,andlosesonbothifthestock price falls. There aremany ways to form thiscombination,anditcangobymany names. If the put and

callhave the samestrikeandexpiry, it is often called asynthetic stockposition.Thisis because as the stock pricerises the longcallgoesup invalue, dollar for dollar, atexpiry, and below the strikeprice for the put the shortholder is exposed to thedownside price action in thestock. If a bearish RiskReversalispairedwithalongstock position, it is called a

Collar. The Collar givesdownside protection on thestockfromthelongputbelowthe strike, and the stock cangetcalledawayabovethecallstrike. A Collar almostalways uses different strikeprices and can also usedifferent expiries;most oftenthe call has more time thantheput,tohaveenoughvalueto sell it and buy the put forfreeorretainacredit.
Risk Reversals are oftenusedeitherwhen the stock isin a strong trend with nosignsofexhaustionorwhenastockisreversingtrends.Thechart for Con-Way in Figure9.8 is a good example of abullish Risk Reversal. Con-Way spent about one monthconsolidating after a movefrom 32 to the 37.50 to 40zone. Breaking higher atrader couldbuy the stockor

a call. An August 40 callwould cost $2.65 or anAugust 42.5 call would cost$1.40, just 6.6percentor3.5percent, respectively, of thepriceofbuyingthestock.Butif the trader were to buy anAugust37.5/42.5bullishRiskReversal, buying the August42.5 call and selling theAugust37.5put,itwouldcostonly 50 cents. If the pricemoved to 42.50 quickly, the

Risk Reversal is likely to beworth about $2.10versus theAugust 40 call at $4.40 andtheAugust42.5callat$2.65.Thatisaprofitof320percentfor the Risk Reversal andonly66percentor90percentforthestraightcalls.Thisisapretty powerful tool. Beingshort the 37.5 put does bringwith it added risk. You maybeputthestockat37.5anditrequiresmarginor theuseof
acash-coveredput,comparedto the straight calls, whichhavenodownsidebeyondthepremiumpaid.
FIGURE9.8Con-Way—RiskReversal
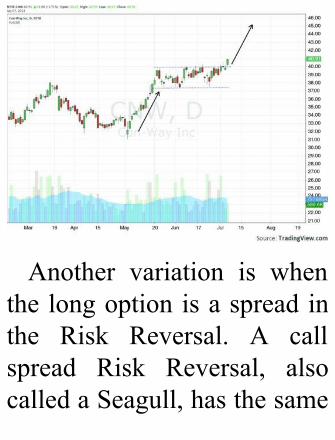
Another variation is whenthelongoptionisaspreadinthe Risk Reversal. A callspread Risk Reversal, alsocalledaSeagull,hasthesame
characteristics as the bullishRiskReversal,exceptthattheupside profit potential iscapped by the short higherstrike calls. Traders wouldpick this over a bullish RiskReversal if there is strongoverhead resistance and byselling a call near thatresistance they can lower thecost of the combination, thusincreasing the leverage andprofitpotential.

The chart for W.W.Grainger in Figure 9.9 is agoodone to see thepotentialfor this trade. With theRelativeStrengthIndex(RSI)turning higher and themoving averageconvergence/divergence(MACD) crossing up as itstarts to rise, the price istesting resistance and has anupward bias. A trader couldbuy the July 250/260 bullish

Risk Reversal for 80 centshere, but, realizing thepotentialforresistanceat268,could also sell the July 270call and create a bullish260/270 call spread RiskReversal by selling the 250put for a 55-cent credit. Theprofit is capped at $10 plusthe credit and the trader hasthe same downside exposureon a fall in the price. Butsince the trade was entered

for a credit, the trader alsomakes a profit if the stockpricedoesnothingforthetwoweeks until expiry. Enteringfor a credit also gives thetradera little leeway tocheaton the entry perhaps beforethe breakout occurs, with atight stop. Because RiskReversals use margin, andespecially with high-pricedstocks where a largedownside gap can be costly,
some traderswill extend thisvariationone step further, bymakingtheshortoptionintoaspreadaswell.
FIGURE9.9W.W.Grainger—Seagull

■ConclusionThat completes our tour ofoptionscombinations.Donotexpect to be an expert afterthissynopsisbutonlytohavea flavor of the ways thattraders combine options.Most options combinationsstartwithadirectionalbiasontheunderlyingstockandwithasimple longorshortcallor

put. The rest are added tomanipulate leverage andmanage risk to the trader’srequirements.Inthenextpartwewilldigintohowtoputallof these pieces together,alongwith the understandingof the trend providing thecurrent to themarketand thespecific technicals of theindividual stocks drivingthem. We leave this chapterwith a cheat sheet of the

combinations and theirdescriptions.Coveredcallorbuywrite
BuystockandsellOTMcall.
Longaputspreadorcallspread
BuyATMcall(orput)andsellOTMcall(orput)withsameexpiry.
Shortaputspreadorcallspread
SellATMcall(orput)andbuyOTMcall(orput)withsameexpiry.
Longa BuyATMput(orcall)and

ratioputorcallspread
twoormoreOTMputs(orcalls).
LongaCalendar
Buycallwithdistantexpiryandsellnearcallwithsamestrike.
LongaDiagonal
BuyATMputwithnearexpiryandsellOTMputwithdistantexpiry.
LongaButterfly
BuyATMcall,selltwohigherstrikecalls,andbuyhigheststrikecallwithsameexpiry.
LongaStraddle
Buyputandcallwithsamestrikeforsameexpiry.
Longa Buyputandcallwith
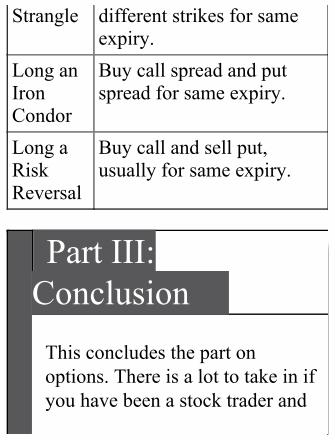
Strangle differentstrikesforsameexpiry.
LonganIronCondor
Buycallspreadandputspreadforsameexpiry.
LongaRiskReversal
Buycallandsellput,usuallyforsameexpiry.
PartIII:ConclusionThisconcludesthepartonoptions.Thereisalottotakeinifyouhavebeenastocktraderand

havehadnopreviousexposuretooptions.ItisalwayssimplerifIthinkaboutoptionsintermsofasetofbuildingblocks.Understandthepiecesandthenyoucanstarttoputthemtogetherandunderstandthewhole.Theanalysisandinformationinthispartcomprisefarfromaconclusivesetoftoolsanddefinitionsintheoptionsspace.Remember,weonlybarelytouchedontheGreeks.Usetheresourcesatthebackofthebooktoexplorefurtheranddeepenyourlearning.Youshouldnowunderstandthe

basicsofoptionsandcombinations,startingwiththedefinitionsthatcreateanewlanguagetodescribetheoptionscontract,likeexpiry,exercise,assignment,strike,intrinsicvalue,timevalue,andmore,andcontinuingtohowtheytradeandwhethertheyarein-the-moneyorout-of-the-money.Youshouldalsonowunderstandhowoptionscanbecombinedtomanageriskandleverage,andthelingothatgoesalongwiththat.Wearenowreadytoputthisnewfoundknowledgetogetherwiththepreviousanalysisonthe

trendandonindividualstockstocreatewinningtradesusingoptions.

PARTIV
DESIGNANDEXECUTION

You now have a firmgroundinginfindingthe
market trend andunderstanding how it maychange. This is importantbecause the vast majority ofstocks move with the trend.You also know how toexplorethesectorswithinthemajor indexes using relativestrength and other measuresto focus the process offinding potential stocks to

trade. We explored manydifferent styles of technicalanalysistolookforfavorabletrade setups in stocks—oneswhere there ispotential for a5 percent ormoremove in avery short time. And youlearned that the moretechnical views that aligntoward the same targets, thebetter the idea can be. Youalsolearnedthat therecanbemany outside factors like

earnings, news, and shortinterest that can lead to yourdeciding to remove a goodtrade setup from your list ifthese factors might workagainstyou.Finally,inPartIIIyouwere
introduced to the optionstools that can be used toenhance the stock tradesetups by adding leverage,reducing capital employed,and managing risk. In this

concluding part, everythingwe have discussed will bebroughttogethertocreateandexecutetrades.Itisorganizedinto three chapters. InChapter 10 we will discussthe elements of design,including details on positionsizingandsettingstoplosses.Chapter 11, on the tradingplan, includes a detailedexample of real plans for aweek.Chapter12,“Execution

and Beyond,” wraps it upwith a discussion on properentry and adjustments forprofit takingandhedging.Atthe end of Chapter 12 youshould be ready for releaseintothewild.

CHAPTER10
TheElementsofDesign

As we get started in thispart, there are a few
termsthatwillhelpmakethediscussioneasiertofollow.Ifyouwere just trading stocks,then it would be easy. Youwouldhaveonlyonetool,thestockitself.Youeitherbuyitorsellit.Thatisit.Butwhenyoubranchoutintooptions,itis like opening your toolboxand seeing a set of Allenwrenches. Yes, they are all

wrenches, but there are nowsomanytochoosefrom.Youneed to determinewhich oneis the right one: put or call,which expiry, and whichstrike. Most optionscombinations start with adirectional bias on theunderlying stock and with asimple long or short call orput. The rest are added tomanipulate leverage andmanage risk to the trader’s

requirements, as discussed inChapters8and9.In thischapterwefocuson
the why of the particularoptions. Each option for atradewill have a purpose, sowe will start by definingthose purposes. With thatdone,wewilldigressabitfora discussion on positionsizingandsettingstoplosses.Youwilllearnhowthesetwoareintertwined.Attheendof

this chapter, with theelements of design of thetradebehindyou,youshouldbe able to identify eachelement for your trades.Youshould also be able todeterminetheproperstoplossand position size for eachtradesetup.

■TheElementsYour first choice indeveloping an options tradesetup is the one option thatwill be the key to thewholeprocess. It is the call or putyou want to own or sell forpremium. Let’s call this firstchoicethedriver,asitisused

to drive the profitability ofthe trade. It is thecallorputoption that you want to belong or short nomatterwhatelseisgoingininthetrade.Itmay be obvious like the at-the-money (ATM) call withthenearmonthexpiry,ornotso obvious like the three-month-out call 15 percentabove the market price.Selecting the driver is themost important decision. It

comes from your analysis ofthechartandthepotentialforamovethatgotyouinterestedintradingthestockinthefirstplace.Once the driver is
determined,thetradesetupinthe stock can be used todetermine how best to selectthe option or options toreduce the cost of the tradeand provide more leverage.These are called the funding
options, as they fund or payfor the trade. They lower itscost. This is where anunderstanding of thecombinationsinPartIIIcomeinto play. Knowing whichmix of options is best whenthechart suggestsaquick10percent move on a breakoutversus a steady rise over thenext three weeks or aconsolidation with a chanceof amove either upor down

will make this part of theprocesseasier.Why?Take a stock that has a
projected $8 move in it likeState Street in the chart inFigure10.1. If your driver istheAugust70call,whichwasofferedat$1.55,youneed todetermine whether thefunding option will be asimpleAugust75callsalefor31cents (whichcuts thecostby 20 percent) for a call

spread. Or will it be a shortAugust 62.5 put for 55 centsto cut the cost by one-third?Orboth,tocutmorethanhalfofthecostofthedriver?Thespreadfitstheparametersofabetter than3:1 reward-to-riskratio. But the put sale doesnot cap the upside profitpotential and fits theparameters of a fundingoption by reducing the costby more than 25 percent. It
also takes onmargin and thepotential toownthestockona major move lower—morerisk.
FIGURE10.1StateStreet—FundingOptions
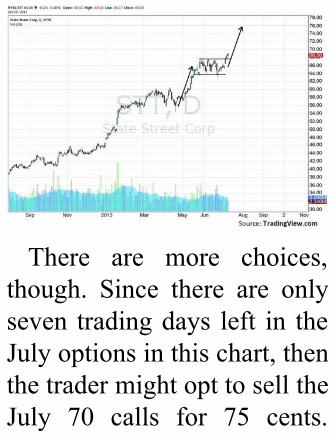
There are more choices,though. Since there are onlyseven tradingdays left in theJulyoptionsinthischart,thenthetradermightopttoselltheJuly 70 calls for 75 cents.
This keeps the tradeuncapped and allowsflexibility to swap that July70shortcallforanAugust75call later. It also opens thepossibility of selling ashorter-dated July 65 put for40cents, ahigher strike thanthe August 62.5 put earlierbutwithalotlesstimeforthestocktofallinprice.Youcansee that this can be themostcomplicated part, reviewing

the trade-off between thebenefit of funding andmanaging the risk eitherremoved or added in sellingoptionstofundthetrade.Andwithout the benefit ofhindsight it is impossible toknowwhich will be the bestchoice.In this particular
circumstance Iwould chooseto go with a July/August 70call Calendar spread and sell

theJuly65put,foranetcostof 40 cents, or only 26percent of the cost of thedriver. It gives an uncappedtrade, if the July 70 callexpires worthless in sevendays, into August with riskbelow65foronlysevendaysinamarketthatisrisingwitha stock that has broken out.Thebiggest risk at thatpointseemstobethepotential thatI will need to buy back the
shortJuly70callifitgoesin-the-money(ITM).Inoticedinchoosing these July strikesthat there is larger openinterestatthe65strikeinJulyon the put side and the 67.5strike on the call side thatmay keep the stock frommovingtooquicklyhigher.Ifit is the case that the pricedoes move above 70 beforethe July expiry, I can alwaysbuytheJuly70callsandsell

the August 75 calls,converting the trade to a callspreadwith a short July put.Thisconversionwilllikelybefor close to no cost if thepricemovesupslowlyas theJulyoptiondecaysfasterthantheintrinsicvaluecomesintoitand theAugustoptionseesrelatively little decaycompared to the price moverelated to the intrinsic value.You will grow more

accustomedtothispartoftheprocessthroughtime.When the driver and
funding options have beenchosen, thenyoumustassessthe risk remaining in thetrade. If necessary, you mayneed to also select a risklimiter before you are readytoexecute.IntheJuly/August70 call Calendar selling theJuly 65 put, there istheoretically$65ofdownside

risk in the trade. If it moveslower during trading hours,then you can just buy backtheshortputtocutyourrisk.But if it happens after theclose, then you would haveno recourse.The stock isnotlikely to gap down to zero,but 10 percent is not out ofthe question. And you canoften protect for this verycheaply.InthiscaseaddingalongJuly60put for11cents
or July 62.5 put for 18 centsare two choices. You mayfromyour analysisdeterminethat no protection isnecessarytolimitrisk.Ifyouwanted tobuyStateStreet at64, for example, then theshort 65 put can also beviewed as a potential entry.Sometimes switching fromthepointofviewofsearchingfor a combination that willdrive profits at an acceptable

leverage ratio and capitaloutlay to one of looking atlimitingriskcanalsoleadtoamajor overhaul of the tradeconstruction. For example, ifthe risk at 65 for seven daysisdeemedtoomuch,youmayelect to sell a July/August62.5 put Calendar to protectthe downside for seven daysagainst a failed breakout andthen take on the 62.5 riskgoingforward.
There is a lot to absorb inthis discussion about thedriver, funding options, andrisk limiter. I suggest youread it a couple of times andmarkupthecharttohelpyouunderstand the dynamicsbeforemovingon to thenextsection.
■PositionSizingandStopLossesPosition sizing is about riskmanagement. Your first jobas an options trader is riskmanagement.Without properriskmanagement, there is nomoneylefttotakecareof.So

what does position sizinghave to dowith this? It is atthe heart of the matter. Thisstrikes the balance betweenrisk and reward. If youroption positions are too bigyou can get wiped outquickly, and if they are toosmall you limit theopportunity. So how do youchoose the proper size? Likewith systems for tradingstocks, there is no one right

way to determine this. Whatyou need to consider is thatalongwithother factorsyoursizingcriterianeed toprotectagainst a crisis andallow forsuccess.

TheProcessStartswithGoalsOne obvious (two-part) goalis to protect against a crisisand allow for success. Butthat is pretty vague, isn’t it?Protecting against a crisismeans both not risking toomuch capital andunderstanding to the best ofyour ability where the crisis
cancomefrom.Thefirstpartis mechanical. The secondpartcomesfrompracticeandgaining skill in the areasdiscussedearlier in thebook.For a top-down technicalanalyst, this means firstassessing the trend and thentheinfluencerstothetrendtodeterminewhat couldchangeit likewe learned in the firstpart of the book. If the S&P500 is rising and the U.S.

Dollar Index and Treasuriesare falling, then there is astrong tailwind for allequities, for example. But ifthe dollar is rising andTreasuriesalsostarttoclimb,then stock prices may be atrisk.Next,lookattheindividual
risksinthestock.Thoserisksforaswingtraderincludetheliquidity in the stock,meaningthenumberofshares

that trade and the typicalspread, and whether or notthereareoptionstohedgeandhow liquid they are.A stockwith good liquidity and tightspreads inboth thestockandthe options can end uplooking better than a stockwith a massive movepotential but little liquidityand no way to hedge. Thatanalysis along with atechnical review of potential

support and resistance levelsleadstoanassessmentofhowmuchriskitmaytaketobeinatrade.A stock in an uptrend in a
marketthatistrendinghigherwith good support fromintramarket influencers andstrongliquiditycanbeplayedwith greater confidence thanthe same stock runningcountertothemarkettrend.There is some art and

estimation involved in thisprocess, of course. It cannotbe helped.With this analysisin hand, sizing a tradebecomes mechanical andfocuses on combining fourfactors: portfolio and traderisk tolerance, time frame,technical triggers, andliquidity.1.Portfolio and trade risktolerance. This issimply how much of

your portfolio you arewilling to lose on anygiventradeandthenonthe portfolio in total.You can try to controlall sorts of risks, but ifanovernightgaporhaltcomes into play, whatis your pain threshold?Look at this as apercentage of yourportfolio. It may bebigger if you trade
infrequently andsmallerifyouaremoreactive or have manypositions.Ilooktolimitthe total capital ormarginusedforatradeto 5 to 7.5 percent ofthe portfolio, so that isthe maximum that astock trade can lose.Butthenuseastoplosson each position tomeasure a worst-case

expected move on astock trade that willlimit a loss to far less.Fortradingbreakoutsitis usually a lot less, asthe breakout level is anaturalstoploss.
For options it is a similarstory. You also do notwant to have marginfromashortoptionthatcan destroy yourportfolio. I use a limit

of 7.5 percent of theportfolio here as well,and for ease ofcalculation I assumethat margin is taken at10 percent of the shortoption strike. Longoptions and optionsspreads can be verycheap and that wouldallow for very largepositions using 7.5percent of capital, so I

limit them further to 2percent of capital. Thisis not the only way todo it, but it works forme.
2.Timeframe.What timeframe do you trade?Areyouadaytraderora swing trader, aposition trader or aninvestor? For ourpurposes we areassuming a swing

trader, someone whowillholdpositionsforafewdaysuptoacoupleof weeks on average.Your time frame maybe different fordifferent trades, andthat is okay. Whateveryour time frame iswillinfluence your risk onthe position andtherefore your positionsize. This will be
crucial for determiningwhere tosetyourentryandstops.Forexample,day traders have theriskofahaltinastockbut do not haveovernight gap risk, sothey might use biggerposition limits.A long-termholdingmay haveawiderstopandthusasmallersize.
3. Technical triggers.

From your own reviewof the chart of anyparticular stock, wherearethetriggerstoenterandexit?Howfarapartare they?And onwhattime frame do theywork? This willdetermine how muchmoneyyoucanriskpershare.Two stockswiththe same price and allother factors equalwill

have different stopsbased on support andresistancelevelsnearbyand thereforemay alsohave differently sizedtrades. If you can lose$1 in a stock beforeyour trade isinvalidated comparedto$2intheotherstock,it makes sense for thetradewith awider losspotential to be smaller.

Strikes on the optioncome into play in thisareaaswell.
4. Liquidity. You neverwanttohaveapositionthat is more than 5percent of the recentaverage daily volume.Unless you are CarlIcahn or Bill Ackman,who frequently havelarge positions, thisbecomes important
when trading a thinlytraded stock or, if youhave a large portfolio,when trading a verylow-pricedstock.Beinga large percentage ofthe daily volume is aproblemonlywhenyouare trying to exit fast.Youarenevertryingtoexitfastwhenthestockis moving in yourdirection, only when it

is going against you.And that is alwayswhen you are beingstopped, not when youare making money.You do notwant to bein a position whereyour desire to sell isdepressing the pricefurther.
For a day trader this capcanalsobean intradayconcern, as volume is

generally larger in thefirst60minutesandthelast hour than in themiddle of the day. Foroptionsthiscanmeanadrastic reduction insize. They do notalways line up withtechnical levels andmay force you tochoosebetweenastrikethat is more expensiveand more likely to be
reachedversusonethatis less expensive butprotectslesswell.
Theoptionsmayalsohavevery different volumethanthestockitselfhas.Moststockstrademoresharesthanoptionsandsome are very inactiveon the options. But aswe discussed earlier,some very high-pricedstocksareveryactively

traded in the optionsrelativetothestock.
These four inputs willcombine to determine yourproper position size for anygiventrade.Therest ismath.Here isa recapof thesimplerulesIuse.1. Limit long stockpositions to7.5percentofportfoliocapital.
2. Limit margin usage on
short stock positions to7.5percentofcapital.
3.Limitpremiumspaidonlong options and debitoptions combinations(spreads, Calendars,Butterflies, etc.) to 2percentofcapital.
4. Limit margin usage tono more than 7.5percent of portfoliocapitalonshortoptionspositions (sold options,
credit spreads, etc.).This is estimated byassuming10percentofthe short strike asmargin.
5. Limit options to nomorethan100contractswhere liquidity andotherrulesallow.
There you go: five simplerules. They of course aretailored to my style oftrading, timeframe(swing to

position), and strategies, andare subject to adequateliquidity.ThechartinFigure10.2for
SunEdison shows a practicalexample of a trade I took inJuly 2013. It was breakingout of a Diamondcontinuation pattern withresistance higher at 8.75.Therewasstrongpotentialfora move higher as the moveinto the Diamond had come

from about 4, so a target onthe move higher would beabout 12.50. It had supportfor a move higher from theRelativeStrengthIndex(RSI)and the moving averageconvergence/divergence(MACD) indicator. Using8.75 as a trigger and a stoploss level back into theDiamond at 8.30 gives amaximum loss of 45 cents.This is the value to use to

assessposition size ifbuyingthe stock. Assuming a$100,000 portfolio, themaximumpositionsizewouldbe 857 shares at a price of8.75(costingabout$7,500or7.5 percent of portfoliocapital).Thiscanbe roundedto 800 or 900 shares for around lot size. SunEdisontradesover5millionsharesaday, so there were noliquidity issues in the stock.
At 900 shares we wererisking$405or5.1percentofthe trade size.Understandingthat the stock could gaplower, be halted for someaccounting issue, or declarebankruptcy the next day andbeworthless,thatiswhatthe7.5 percent limit was for. Inessencewewereriskingonly0.40 percent of the portfolioifthestoptriggersanexit.

FIGURE10.2SunEdison—StopLoss
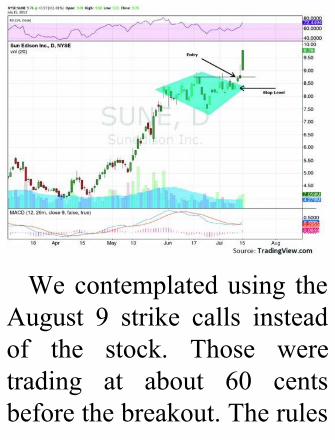
Wecontemplatedusing theAugust 9 strike calls insteadof the stock. Those weretrading at about 60 centsbeforethebreakout.Therules
would allow for 33 of theAugust 9 strike calls (I wishwe had done that instead,withthebenefitofhindsight),and there was plenty ofvolumetowarrantthatsizeofatrade.Ifinsteadweweretouse an August 7/9 bullishRisk Reversal, selling theAugust7put(at16cents)andbuying theAugust 9 call (60cents), the total cost of 45centswouldbenearwhatwe

were willing to risk in thestocktrade.ButtheAugust7put requires margin. Usingthe rulesallows for107RiskReversals since each isassumed to use only $70 ofmargin against the limit of$7,500.The option size limitwouldreducethatto100,andthe debit spread size limitwould reduce that to 44.Finally, the liquidity wouldcome into play. With a

bullish chart and the 7 strikebeing below a breakdownlevel, there was not muchliquiditytotradeit.Wemighthave been able to sell 25 or30. So for three differentpotential trades we had sizesof900shares,33calls,or44RiskReversals.Never risking more than a
small amount of your capitalwill let you live to playanother day. If you risk only

2 percent, then you can loseforever at progressivelysmaller sizes before you arebroke(ifthestreakgetsreallylong you might considerquitting early, though). Theaforementioned process fordefininghowmuchcapital isat risk is a bit of an art.Armed with your riskanalysis and support andresistance levels, you candetermine stop levels. This

will define your risk, intheory. But because themarkets are not continuous24-hour liquid markets, youare risking more than youmight think.This is real life.The one exception is whenyouarebuyingoptions.Forastockwith support on a longtrade $1 below your trigger,yourriskisdefinedas$1andyou can size your tradeaccording to your capital
rules, but a gap lowerovernight can destroy thatwithout ever stopping youout.Ifyouspend50centsonan option, then yourmaximum risk is 50 centsevenifthestockfallsorrises100percent.I started this section by
stating that there is no oneright way to determineposition size, and it is likelythat your rules will lead to

conflicts at some point, likeintheSunEdisoncasewhereIcouldbuymoreof theriskierRisk Reversals than I couldbuyof thestraightcalls.Youwill constantly review, thenrevisit, and then refine yourposition size limits and stoplosses over time. Just do notstarttradingwithoutthem.
■ConclusionYou should now be able tounderstand the concept of adriver, funding option, andrisk limiter and how thesework together. You shouldalsobe able todetermine theproper stop loss level andhow that relates to theposition size of your trade.Finally, you should

understand how theseparameters combine to createtrades that allow you toconserve and protect capitalwhile managing risk so thatyou can continue to tradewithout one or two tradesblowing up your account.Nowlet’sputthisalltogetherinatradingplan.

CHAPTER11
TradingPlan

Nowitistimetoputallofthis together and show
howwedevelopatradeplan.Starting from the trendidentification, throughsecurity selection, to theactual trade plan for eachstock, the process is verydetailed. The process to thispoint is a guide and the planthat follows is the result,starting with the trendanalysis. I have abbreviated

the normal weekly work toinclude only theU.S.–centricpieces for brevity. Normallytheweeklyreviewwouldalsoanalyze the ShanghaiComposite, emergingmarkets, as well as theRussell2000exchange-tradedfund (ETF) (IWM) and theNASDAQ-100ETF(QQQ).Ihave also abbreviated theindividualtradeplanstoonlyfive stocks, and have added

twoearningsplays.Thesearespecific event-driven tradesdesigned to profit from thetechnical analysis, optionsactivity, and other factors totake advantage of a specificevent and are put on the dayearnings are reported. Boththe trend identification andthe trade plan were culledfrom an actual plan for theweek of July 15, 2013. Theearnings trades are from the

beginning of the secondquarter of 2013 reportingperiod.Theanalysisfortheseplans was all done over theweekend after the close onFriday, July 12, 2013, andpreceding Monday, July 15,2013—atightwindow.

■WhattoLookForAs you read each set ofanalysis, look for the detailsdiscussed throughout thebook. Notice which way themajor trend is moving andhow it might be influenced.Then,fortheindividualstocktrades, check to see whether

they follow the trend. If not,is there a specific reason forthat? Remember that eachtrade setup needs to look atmanypossibilities so that thetrader can adjust as themarketchangeswithoutmuchadditionalwork.So there aremany different choices thatare laid out for eachindividual stock, includingboththestockanditsoptions.See if you can determine the
driver and funding optionsand then risk limiters if theyare listed. Most of theindividual stock trade setupsbuild the choices from thedriver, which maymake it abit easier to recognize.Finally, youmay look at thesetup and come up with adifferenttradeidea.Thatdoesnot mean that mine is rightand yours is wrong, or theother way around. What is

important is that you have aplan in place and executeaccordingtoit.
TrendIdentification
MacroWeekinReview/Preview,July12,2013Lastweek’sreviewofthemacromarketindicators,headingintothe
firstfullweekofJuly,suggestedthatthemarketswereimprovingandpossiblyreadytomovehigheragain.Welookedforgoldtocontinueitsdownwardmoveorconsolidateinabroadrangewhilecrudeoilwasexpectedtocontinuehigher.TheU.S.DollarIndexalsolookedtocontinuetotheupsidewhileU.S.Treasuriesresumedtheirmovelower.TheShanghaiCompositemightcontinueitsupwardbounceinitsdowntrend,buttheemergingmarketswerebiasedtothedownside.Volatilitylookedtoremainlowanddriftinglower,keepingthebiashigherforthe

equityindexexchange-tradedfunds(ETFs)SPY,IWM,andQQQ.TheirchartsshowedthattheIWMwasthestrongestandreadytocontinuehigherwhiletheSPYandQQQstillhadsomeresistancetoworkthroughintheirshort-termmoveshigherbeforetheywereinthecleartomovehigher.Theweekplayedoutwithgolddecidingitdidnotlikethosechoicesasitmovedhigherwhilecrudeoilalsomovedup,beforeconsolidatingtoendtheweek.TheU.S.DollarIndexmetresistanceandbrokelowerwhileTreasuriesconsolidatedunderresistance.TheShanghai
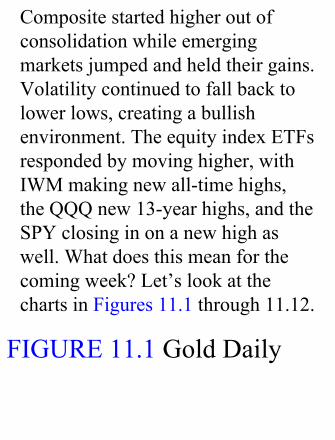
Compositestartedhigheroutofconsolidationwhileemergingmarketsjumpedandheldtheirgains.Volatilitycontinuedtofallbacktolowerlows,creatingabullishenvironment.TheequityindexETFsrespondedbymovinghigher,withIWMmakingnewall-timehighs,theQQQnew13-yearhighs,andtheSPYclosinginonanewhighaswell.Whatdoesthismeanforthecomingweek?Let’slookatthechartsinFigures11.1through11.12.
FIGURE11.1GoldDaily
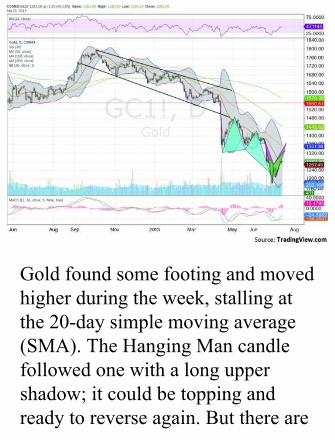
Goldfoundsomefootingandmovedhigherduringtheweek,stallingatthe20-daysimplemovingaverage(SMA).TheHangingMancandlefollowedonewithalonguppershadow;itcouldbetoppingandreadytoreverseagain.Butthereare

acoupleofpotentialbearishHarmonicsintheworksthatpointtomoreupsidefirst.InFigure11.1,aButterfly(green,rightsideandshorter)hasapotentialreversalzone(PRZ)at1333,andaBat(pink,rightsideandhigher)hasaPRZat1366.ThedailychartalsohadabullishCrab(blue,furtherleft)completeandretracetonearthefirstreversaltargetat1292.Thesecondtargetat1362isrightinthesamezoneasthebearishHarmonics—quiteaHarmonicconfluence.TheRelativeStrengthIndex(RSI)isrisingbuthasyettocrossthemidlineandgetbullsmoreexcited,whilethe

movingaverageconvergence/divergence(MACD)indicatorisrising.Bothsupportfurtherupside.Theweeklychart(Figure11.2)showsnascentsignsofareversalaswell.Thelong-tailedcandleofthreeweeksagowasfollowedbyasmallbodycandlelowerandthenareversallong(greenorwhite)candlethisweek.TheRSIismovingbackabovethetechnicallyoversoldlevel,buttheMACDisyettoturn.Thereisresistancehigherat1300and1328–1340before1360and1400.Amoveover1400willattractmorebulls.Supportlowerisfoundat1260and

1200before1180.Outlook:Continuedmovehigherinthedowntrend.
FIGURE11.2GoldWeekly

Crudeoilmovedhigherearlyintheweekbeforeconsolidatingoverthepreviousresistance/supportlevelat104.82.Thedailychart(Figure11.3)lookslikeitcouldusesometimehereasithasanRSIthatisnowtechnicallyoverboughtandan

MACDthatisreachingextremelevelsonthedailychart.Theweeklypicture(Figure11.4)looksstrong,though,continuingthebreakoutofthesymmetricaltriangletowardthetargetof117.50.TheRSIonthistimeframeisbullishandrising,withanMACDthatisalsorising,andbothhavesomeroomtogo.Thereisresistancehigherat108and110followedby114beforecrudeoilcantakearunatthehighfrom2008.Supportunder104.82comesat100andthen97.Outlook:Consolidationormoreupsideintheuptrend.

FIGURE11.3WestTexasIntermediateCrudeDaily
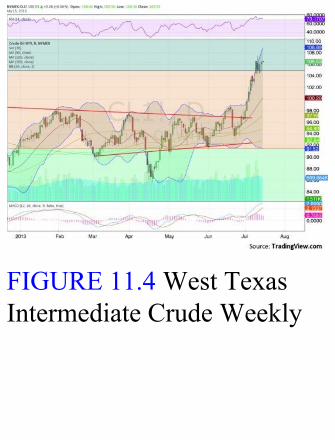
FIGURE11.4WestTexasIntermediateCrudeWeekly
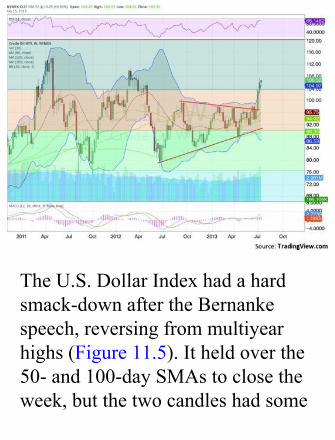
TheU.S.DollarIndexhadahardsmack-downaftertheBernankespeech,reversingfrommultiyearhighs(Figure11.5).Itheldoverthe50-and100-daySMAstoclosetheweek,butthetwocandleshadsome

longtoppingtails,indicatingsomefurtherdownside.TheRSIisatthemidlineafterheadinglower,withanMACDthatisfallingandhasjustcrossed.Ontheweeklyview(Figure11.6),theBearishEngulfingcandletakesyoureye.Anomenformoredownsideifconfirmednextweek,itissupportedinthatveinbyafallingRSIandanMACDthatisrunningsideways.Thereissupportlowerat82.60and82followedby81.20and80.60.Resistancehigherisfoundat83.40and86.20before88.70.Outlook:Continueddownside.

FIGURE11.5U.S.DollarIndexDaily

FIGURE11.6U.S.DollarIndexWeekly
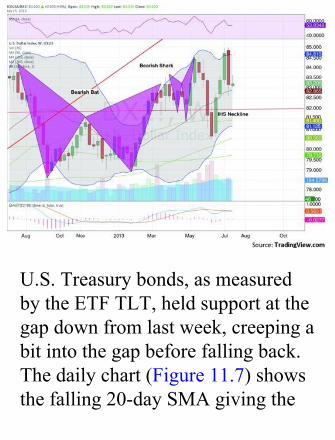
U.S.Treasurybonds,asmeasuredbytheETFTLT,heldsupportatthegapdownfromlastweek,creepingabitintothegapbeforefallingback.Thedailychart(Figure11.7)showsthefalling20-daySMAgivingthe
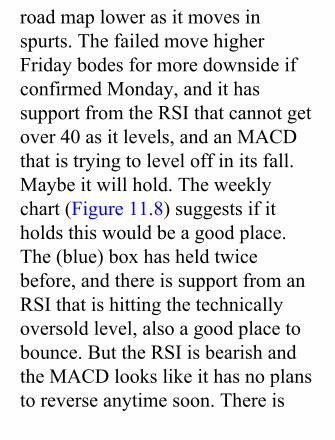
roadmaplowerasitmovesinspurts.ThefailedmovehigherFridaybodesformoredownsideifconfirmedMonday,andithassupportfromtheRSIthatcannotgetover40asitlevels,andanMACDthatistryingtoleveloffinitsfall.Maybeitwillhold.Theweeklychart(Figure11.8)suggestsifitholdsthiswouldbeagoodplace.The(blue)boxhasheldtwicebefore,andthereissupportfromanRSIthatishittingthetechnicallyoversoldlevel,alsoagoodplacetobounce.ButtheRSIisbearishandtheMACDlookslikeithasnoplanstoreverseanytimesoon.Thereis

supportlowerat105and100followedby97and91.50.Resistancehighercomesat108and110followedby112.Itneedstoproveanyreversal.Outlook:Continueddowntrend.
FIGURE11.7iSharesBarclays20+YearTreasuryBondFundDaily

FIGURE11.8iSharesBarclays20+YearTreasuryBondFundWeekly
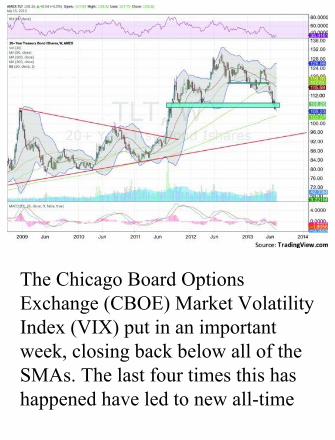
TheChicagoBoardOptionsExchange(CBOE)MarketVolatilityIndex(VIX)putinanimportantweek,closingbackbelowalloftheSMAs.Thelastfourtimesthishashappenedhaveledtonewall-time

highsintheS&P500,andittookonlytwodaysforthattohappenthistime.TheSPYhasyettomakeanewall-timehigh,though,sotheremaystillbemoretocome.Thedailychart(Figure11.9)showstheRSImovingintobearishterritoryforthefirsttimesincelateMarch2013,withanMACDthatisstartingtolevelonthehistogram.Theweeklypicture(Figure11.10)showsastrongmovebelowsupportandtheSMAswithafallingRSIandMACD.Theprospectisforlowervolatility.Thereissupportat12.40and10,withresistanceat15.67and18followedby22.Imaintainthe

viewthattheVIXshouldbeignoreduntilitclosesabove22.Outlook:Continuedlowvolatility.
FIGURE11.9VIXDaily
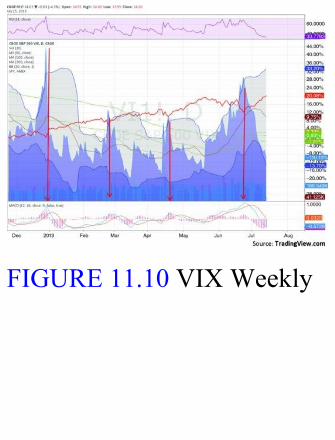
FIGURE11.10VIXWeekly

TheSPYcontinuedthemovehigherovertheSMAsandthetrendsupport/resistancelinefromtheNovember2012low.IthasthelookofapossibleSharkHarmonic,butthelowat155.73wentbeyondthe161.8percentlimitoftheextension

lower.TheweekendedwithaDojiStar,signalingindecision,justbelowresistanceat168.TheRSIonthedailychart(Figure11.11)isrisingandbullishandtheMACDisalsorisingandbullish.Ontheweeklychart(Figure11.12),thestrongcandleiswatereddownabitbythegappingnatureoftherise,lookingmorelikeanAdvanceBlockthanThreeAdvancingWhiteSoldiers—apotentialtrendexhaustion.TheRSIismovinghigher,though,andsoistheMACD,sothereisabullishbias.Thereisresistanceat168and169.07beforefreeairandnewall-timehighs.AnextendedRSI

positivereversalcouldseeithit171.25abovethat.Supportlowercomesat166and163followedby161.60.Outlook:Continuedupsidewithapossibilityofconsolidation.
FIGURE11.11SPYDaily

FIGURE11.12SPYWeekly

Headingintonextweek,themarketslookstrongbutmaybeabitextended.Lookforgoldtocontinuehigherinthedowntrendwhilecrudeoilslowsatresistanceintheuptrend.TheU.S.DollarIndexlookstocontinuelower,alongwithU.S.
Treasuries.TheShanghaiCompositeandemergingmarketsarenowbiasedtotheupsideintheirdowntrendsandhavepotentialtoreversethosetrendswithcontinuedstrongmoves.Volatilitylookstoremainlowanddriftinglower,keepingthebiashigherfortheequityindexETFsSPY,IWM,andQQQ.Allarebiasedhigher,withtheQQQlookingthestrongest,theIWMandSPYperhapsextendedalittleintheiruptrends.Thistrendanalysisgivesanupwardbiastothemarket,soindividualstocktradesshouldallbebiasedhigheraswell.

TradePlans
TopTradeIdeasfortheWeekofJuly15,2013:TheBestBroadSoft(BSFT)tookatumbletostartMarchbutrecoveredandhasbeenconsolidatingbetween26.50and31.05forthepasttwoandahalfmonths.(SeeFigure11.13.)Risingalongthe50-daysimplemovingaverage(SMA),itisapproachingthetopofthechannelwithsupport
forabreakhigherfromarisingandbullishRelativeStrengthIndex(RSI)andamovingaverageconvergence/divergence(MACD)indicatorthatisstartingtomoveup.Thereisresistancehigherat33.50and35.10followedby36.75and39.Supportlowercomesat28.20and26.50followedby24.75and23.40.Shortinterestiselevatedat12percentandcouldhelpBSFThigheroutofthechannel.Enterlongonamoveover31.15withastopat30.50.Asthepricemovesover32.10,convertthestoptoa$1trailingstopandtakeoffone-thirdatanystallover39.Asanoptions
tradeconsidertheAugust30calls(offeredat$2.55lateFriday)onthesametrigger,andtradethemlikethestocktrade.Asalow-costleveredtrade,considertheAugust25/35bullishRiskReversal(45cents).
FIGURE11.13BroadSoft(BSFT)

DeckersOutdoor(DECK)hasbeenmovinghigherandisapproachingresistanceat56.50.(SeeFigure11.14.)IthassupportfromarisingRSIandMACDformoreupside.Theshortinterestcanalsohelpat
over29percent.Thereisresistancehigherat59and60.40andthenfreeair.Supportlowerisfoundat52.50and50.55followedby48.Thereisalsoalargerelativeopeninterest(OI)attheJuly57.50call,whichcouldleadtoapinthereFriday.Inoptionslingo,apiniswhenlargeOIataparticularstrikeactsasamagnettokeepthestockpriceatthatstrikeatexpiryortodrawittoit.Ifitreallygetsgoing,thereisalsolargeOIatthe65callwellabove.Enterlongonamoveover56.50withastopat54.Asthepricemovesover57.50,converttoa$2trailingstopandtakeoffone-thirdatanystall

over60.40.Withallthatshortinterest,youdonotwanttocaptheupsideonanyoptiontradebeyondthisweek.Asanoptionstrade,considertheJuly/August57.5callCalendar($2.30)ortheAugust57.5($2.60)callsalone.OffsetsomecostbyalsosellingtheAugust47.5put(85cents,or$1.75netontheresultingbullishRiskReversal).TheJuly56.5/57.51×2ratiocallspread(10cents)isagoodwaytoplayforapinat57.5.HedgethatbetbyalsobuyingtheJuly58.5call(20cents)toturnitintoacallButterfly.

FIGURE11.14DeckersOutdoor(DECK)

MBIA(MBI)isstartingtomovehigheroutoflong,slowpullback.(SeeFigure11.15.)TheRSInevermovedintobearishterritoryduringthepullbackandisrisingagain,withanMACDthatisalsoturninghigher.Shortinterestisnear8
percentandcouldhelpMBIAhigher.Thereisresistanceat14and14.40before16,withameasuredmove(MM)to19.50.Supportlowercomesat13.10and12.40beforeasteepfall.Enterlongonamoveover14withastopat13.65.Asthepricemovesover14.40,convertthestoptoa50-centtrailingstopandtakeoffone-thirdatanystallover16.Asanoptionstrade,considertheAugust14calls(81cents)andtradethemlikethestocktrade.SelltheAugust16calls(23cents)inone-thirdsizetorecoupsomecost,andyoucanconsideralsosellingtheAugust12puts(21cents)ifyouare
comfortableowningthestockat12.
FIGURE11.15MBIA(MBI)

BostonScientific(BSX)isapproachingthetopofaconsolidationchannel,tightestbetween8.92and9.45butupto9.75.(SeeFigure11.16.)TheRSIisbullishandmakinganewhighasitrises,withanMACDthatisaboutto
crosstopositive.Abreakofthechannelcarriesatargetof10.60andthenameasuredmovehigherto11.Thereissupportlowerat8.90andthen7.95and7.65.Enterlongonamoveover9.75withastopat9.35.Asthepricemovesover10,convertthestoptoa40-centtrailingstopandtakeoffone-thirdat11.Asanoptionstrade,considertheAugust10calls(23cents)andtradethemlikethestocktrade.OffsetthecostbysellingtheAugust9puts(15cents)forabullishRiskReversal.
FIGURE11.16BostonScientific(BSX)
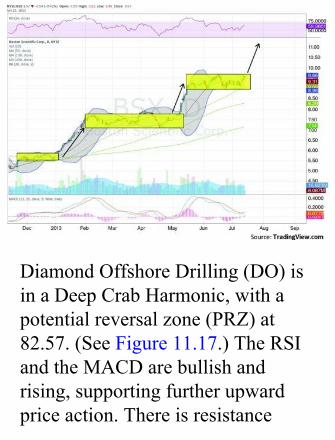
DiamondOffshoreDrilling(DO)isinaDeepCrabHarmonic,withapotentialreversalzone(PRZ)at82.57.(SeeFigure11.17.)TheRSIandtheMACDarebullishandrising,supportingfurtherupwardpriceaction.Thereisresistance
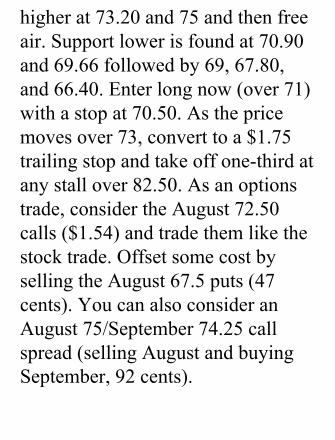
higherat73.20and75andthenfreeair.Supportlowerisfoundat70.90and69.66followedby69,67.80,and66.40.Enterlongnow(over71)withastopat70.50.Asthepricemovesover73,converttoa$1.75trailingstopandtakeoffone-thirdatanystallover82.50.Asanoptionstrade,considertheAugust72.50calls($1.54)andtradethemlikethestocktrade.OffsetsomecostbysellingtheAugust67.5puts(47cents).YoucanalsoconsideranAugust75/September74.25callspread(sellingAugustandbuyingSeptember,92cents).

FIGURE11.17DiamondOffshoreDrilling(DO)
EarningsTradePlans
WellsFargoEarningsTrade(chartshowspostsetuppriceactivity)WellsFargo(WFC)ispullingbackinwhatcouldbeasecondbullflagoutoftheconsolidationover39.60.(SeeFigure11.18.)Themeasuredmovesof$2wouldtakeitto43.50ifitweretomoveupfromhereandwouldalsocompleteaThreeDrivespattern.TheRSIisonthevergeofmovingthroughthemidlinethe

wrongway,thoughwiththeMACDindicatorabouttocrossdownaheadofthereportingdaynotedinthechart.Andthelongerredcandleisalsoadownsideomen.Thisallgivesadownsidebiasintheshortrun.Supportlowercomesfirstat41.5andthenthe40.80and39.60.Thereisresistanceat43andthensomeroomtorun.Thereactionstothepastsixearningsreportshavebeenmovesofabout1.95percentonaverageor$0.82,makingforanexpectedrangeof40.90to42.65.Theat-the-moneyweeklyJulyStraddlessuggestalarger$1.15movebyexpiryFriday,withimplied

volatility(IV)at59percent,abovetheJulyIVat29percentandtheAugustIVat21percent.
FIGURE11.18WellsFargo(WFC)

TradeIdea1:SelltheJuly41/42 Strangle for a$1.00credit.
Trade Idea 2: Buy theJuly/August 43 call

Calendarfor$0.26.Trade Idea 3: Buy theAugust 43/44 callspread, selling the July43call,forfree.
Trade Idea 4: Buy theAugust 43/44 callspread, selling the July26 weekly expiry 40put,forfree.
TradeIdea5:BuytheJuly12 weekly expiry/July43 call Calendar for

$0.13.Itraded#4.
WolverineEarningsTradeWolverineWorldWide(WWW)brokeoutofabullflaginlateJuneandmovedhigher.(SeeFigure11.19.)Themeasuredmove(MM)takesitto58fromthatbreakbuttherecentpullbackalsoreinforcesthatwithanewMMhigherto58aswell.TheRSIisbullish,withtheMACDindicatorrising—anupsidebiasevenifitpullsbackfirst.Support

lowercomesfirstat52and51before50.Thereisnoresistanceabovetoday’shighat55.95.Thereactionstothepastsixearningsreportshavebeenmovesofabout4.27percentonaverageor$2.37,makingforanexpectedrangeof53.10to57.95.Theat-the-moneyJulyStraddlessuggestalarger$3.00movebyexpiry,withimpliedvolatilityat40percentabovetheAugustIVat30percent.Shortinterestinthisnameiselevatedat10percent.
FIGURE11.19Wolverine(WWW)

Trade Idea 1: Buy theJuly/August 60 callCalendarfor$0.50.
TradeIdea2:BuytheJuly55callfor$1.90.

Trade Idea 3: Sell theJuly/August 50 putCalendar for a $0.10credit.
Trade Idea 4: Buy thestockandCollarwithaJuly 55/50 put spreadand a short August 55callfora$1.00credit.
Itraded#1.
The trend identificationwrite-up shows gold and
crude oil biased higher. Italso shows the U.S. DollarIndex and U.S. Treasuriesbiasedtocontinuelower,withvolatility continuing to belowanddriftinglower.Theseputabreezetothebackoftheequity index ETFs andparticularly theSPY.But theshort-term action in the SPYitselfsuggestedthatitmaybereadyforapullback.Thissetsup a bias higher in the

market, with tighter stops inexistingpositionsandquickerprofit taking. It also suggeststhat a pullback is likely ashort-lived event. This couldallchangethenextweek,butthat is how you wouldapproach the current week.You could of coursecorroborate this with otherindicators discussed in Part Itorefinetheview.Withthetrendinhand,then

the process in Part II is usedtoidentifythestockslistedinthe trading plan. This is themost time-consuming part ofthe process. It can take eighthours if you look at everystock individually like I do,ormuchlessifyouusescanstonarrow the search.Addingin the analysis from theoptions chains, triggers, andprofit and stop targetscompletes the plan.Youwill

notice that each trade has aninitialstoplossandthenplansfor adjusting that to protectprofits. We will dig furtherintothatinthelastchapter.

■ConclusionWith the full plans in place,wecannowwalkthroughtheexecution and then anyadjustments during the tradetohedge,createmoreprofits,or cut losses.Remember thatnoteverytradewilltrigger.Infact, you may have a weekwhen none of them trigger.You may also have a week
when all of them trigger atthe same time on Monday.Youdonothavetotakeeverytrade that comes along. Thenext chapter will start withtheexecution.

CHAPTER12
ExecutionandBeyond
To get to this point hastakenalotofwork.You
have identified the trend,sought out good tradingsetups, andwrittenplans thatcan be used for stocks andoptions. The plan is set. Inthis chapter we discuss whattodowiththeplan—notonlyhow and when to enter thetrade,butalsohowtoadjustitandwhentotakeprofits.Thiswillneed tobeanon-the-job

learning experience for you.No matter how well thoughtoutanddetailedyourplanis,therewill be details that youcould not have anticipated.Didthestocktriggerandthenreverse but not to your stopand then stall the rest of theday? What do you do? Orperhapsyouenterastockandit hits your first target andreversesbeforeyoucanmoveup your stop. Do you take

profits?Icannotgiveyouananswer
for every situation, and youcannotplanforthemall.Youjust need to do the best youcan to prepare so that thereare as few unexpectedsituations as possible, andover time you will becomemore comfortable with howtodealwiththem.Solet’sgotothefirststeps.
■ExecutionNow what? You wait. Youwait for a stock tomoveandtotrigger—thestockthatyouhave spent hours selectingand culling from the broaduniverse and then writing adetailed plan for. And therecan be a lot of waiting. Butthere are things to do as youwait.Youcansetpricealerts

for your watch list. You cansetuptheoptionsspreadsyouare considering to trade inyour trading system. Thenwaitsomemore.Afterallthisworkovertheweekend,thereis an urgency to trade whenthe market opens. But thereare also millions of otherprofessionals andnonprofessionals alike whohave been waiting for theopening bell so they can

executethatfirstorder.Somehave beenwaiting since theynoticed a company in thenews Friday evening. Somehave their weekends awayfrom theirdaily jobandonlythenget to seehow toadjusttheir plan. Some see eventsduring the weekend thatinfluence their decisions tobuyorsellastock.Butdon’ttradealongwiththem.Rule#1fortrading:Donot

trade in the opening minutesof the day. This pent-updemand can create a frenzythe first 30 to 60minutes onMonday. And the wholeprocessisrepeatedtoalesserextent, 30 minutes or so, atthestartofeveryotherdayoftheweek.Oftenthemovesinthis time period do not hold.However, I have threeexceptions to the “do nottradetheopen”rule.Thefirst

isifIamtakingaprofit.Thefrenzy can be the perfectplacetofeedyourpositionstothe unwitting and take yourprofits.Thesecondis ifIamlooking to day trade a stock,holdingitforonlyamatterofminutes.Thethirdisforlater.Now that it is 10:30 or so,
the waters will have clearedanditistimetowaitforyourtriggers. If a stock hastriggered in the opening

periodandhasheldup,withasideways consolidation or apullback to the trigger andthen reversed again, you cantrade it right away. If ittriggered and failed, thenkeepaneyeonitforthenexttriggertoenter.Thisiswherethe thirdexception to tradingthe open comes in. A stockthattriggersandfailsonedaycan be played early the nextday if it triggers during the
openingperiod.There are several methods
of entering the trade. For alongtradeyoucanbidontheoffer side of the market forthefullsizeofyourtradeifitissmallcomparedtotheoffersize. If you are looking totrade 1,000 shares or 25contractsinBankofAmerica,for example, go for it all atonce.Thatsamesizetradeina stock that trades only

500,000 shares or 100contractsperdaywillrequireyoutobuildintoit.Checkthesizeofthebidandaskandthelevel2marketdepth(thefullbook of bids and offers ateachprice)ifyouhaveaccesstogetabetterfeelforthis.In either case use a limit
order, not a market order. Amarketordermaybe fine for500 shares of Bank ofAmerica, a stockwith penny

spreads in the bid/offer andthousands of shares on eachside.Butasmallerstockwitha 5- or 10-cent spread (yes,thathappens)orevenahigh-pricedstocklikeGooglewithan even greater spread cancostalotifyouuseamarketorderinsteadofalimitorder.High-frequency trading(HFT) algorithms aredesigned to exploit that,among other things. If you

use a limit order, then youknow the most you will bepaying. If you are tradingoptions, then limit orders areadoublemust,astheliquidityin any one particular optioncan go to zero in ananosecond, leaving anymarket order exposed to ahorrendouspricespike.As you get more
experience, you will start tosee that your technical

analysis on the daily andweekly time scales can alsobeappliedtoshorterthree-orfive-minute time frames, andyou will use them to helpbetter plan an entry. Identifyshorter time frame supportand resistanceon the fly thatcan be used to amend yourplan. You will also likelystarttryingtosplitthebidandoffer, especially in wideoptions combinations, to

loweryourcost.As your trades execute, I
suggest thatyou immediatelyenter a stop loss. Sometraderswilltellyouthatdoingthis is a recipe for the HFTalgos to hunt for your stop.That could be true, butentering it immediately shiftsthe decision in your mindfrom “Do I stop it now orgive ita fewmorecents?” to“Will I take action so as to

allow myself to lose morethanmyplan?”Asyouwatchthepricemoveagainstyouinthe former, humanpsychology starts youthinkingthatyoucanmakeitback. You won’t, so do nothead down that road. Thelatter ismore likewalking totheedgeofthecliffandwhileyou are there, secure behindthe fence, deciding youwantto jump and see how badly
you get hurt. Keep thisanalogy in your head, and Ipromiseyouwill notmoveastop.As a practical matter,
placing a stop immediatelyalso allows you to do thingslikegotothebathroom,makelunch,takethekidstoschool,or talk toyour spouse.Manytrading systems allow you toattachastoplosstotheinitialtrade,and ifyoursdoes, then
use it.Foroptions this isnotalways possible. I preferusing the direct instrumentitself for a stop, given theshort-term nature of mosttrades.Thismeans that if thestop is at 920 in the stock inGoogle for a July 930 calloption, then your tradingsystem will need to haveconditional stops allowingyou to stop the options tradeonatriggerinthestockprice.
What is more likely is thatyou will need to set an alerton thestockat the stoppriceand then manually stop theoption.Expectsomeslippageon options stops unless youare trading straight calls orputs on a very liquid strike.S&P 500 options trade atpenny spreads, but notmanyothersdo.Let’s look at the Deckers
Outdoor trade from Chapter

11 to walk through as apracticalexample(seeFigure12.1). The first thing thatcomesupisthatweidentifiedat leastsixpotential tradestotakeifthestocktriggersover56.50.Howdoyouchoose?Itstated in the plan that withhighshortinterestwedidnotwant to cap any upsidepotential and that the movehigher could be significantfromtheopeninterest.Inthat

case we would give the lasttradetheJuly56.5/57.51×2call spread a low weightingand save it until Friday(expiry)ifithadnottriggeredyet. The call Calendar alsoworks best later in the weekwhen it is more certain thatthe July strike will not haveto be bought back. Thisleaves the August 57.5 calls,the August 47.5/57.5 bullishRisk Reversal, or the stock.

Withthefirstpricingat$2.60and the Risk Reversal at$1.75, since this is a bookaboutoptionswewillchoosebetweenthem.
FIGURE12.1DeckersOutdoor
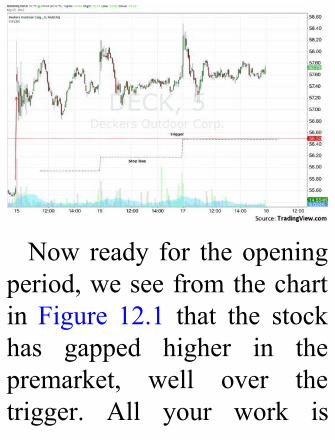
Now ready for theopeningperiod,weseefromthechartin Figure 12.1 that the stockhas gapped higher in thepremarket, well over thetrigger. All your work is

useless. Well, not really.There is still the sameresistance higher and supportbelow; just the prices havechanged. Using the bullishRisk Reversal, instead ofbeingabletobuyitfor$1.75,bythetime10:30rollsaroundit isquotedat$2.75,adollarhigher. With a first profittarget over 60.40, this is stilla good reward-to-risk ratio.And since the price is above

57.50, the stop has nowmoved to a $2 trailing stop.Sobythetimeyouenter,withthe stock at 58, the stop isnow at 56. This may meanyouneedtoadjustyourtradesize according to the rulesdue to the higher premium.The 15 contracts allowed forashort47.5strikeputusinga$100,000 portfolio and theprevioussizingrulesdoesnotchange, but the 2 percent of

capitalusedforpremiumwillreducethetradesizefrom11contracts to seven contracts.You may also do someadditional analysis on the flyto determine if you wish toadjust the trade beforeentering it, with either ahigher call or put strike, forexample.Moreonthatlater.You have now started to
learn something abouttrading. It can take a lot of
patience for a trade setup totrigger.Itcanalsotriggerandthen spit you back out in anhour.TheBroadSoft ideadidthis. Or it can never trigger,like Boston Scientific orMBIA for the week of thisplan.Butnowyouare in thestock or options. Theexecutionphaseisoveranditis on to the maintenance ofhedging, profit taking, andadjustments.

■Hedging,ProfitTaking,andAdjustmentsYou are in the trade now,feeling good, and time isrolling forward. This can bethe hardest part of a trade.
Youhaveastoplossinplaceandatargetfortakingprofits,but the stock you are tradingand the options combinationyou are in are running inplace. Time keeps ticking.Whatareyousupposedtodo,just wait? If you are in thestock, then yes! But for usoptions traders, there isalways something to look atthat might be adjusted. Thereason for that is the time

decay, or theta, that takesyour positions to zero overtime if nothing happens.Adjustments to tradesgenerally take the form ofthree varieties: hedging,profit taking, or straightadjustments to be able tohedgeor takeprofits later, ina sense buying time. Let’slookatallthree.

HedgingWhether it happens shortlyafter you enter the trade ormuch later, you willinvariablyrunintoasituationthat requires hedging. Thisdoesnotmeanyouarelosing.Hedging is simply protectingthecurrentposition,soitcanalso apply to protectingprofits as well as preventing

furtherloss.Solistenup.There are many ways to
hedge you position. The firstquestion to ask is: When doyouwanttohedge?Actually,you are hedging from yourfirst entry into a position ifyouareusingastoploss.Thisisyourfirstformofhedging.Butsometimesyoumaybeinan options position thatmoves in the after-hoursmarket. Since options trade
only during market hours,between 9:30 and 4:00 p.m.Eastern time, then you mayneed to use stock. Whenhedging,youcanusestockoroptions or a combination. Ilikesimplicityandtheabilityto act at all hours, so mypreferenceisstock.Ifyouarenet long in either a stock oran options combination,hedgingbysellingstockshortisthebestwaytogo.Forthe
opposite,ifyouareinashortposition, then you will needtobuystocktohedge.Itgivesa perfect 100 percentcorrelation,ordelta,with themove you are trying toprotectagainst,andisusuallymore liquid than any otheroption, unless the stock youare hedging is restricted orhardtoborrow.Thenyouarelimited to using options tohedge.

Youshouldhavesomesortof hedge going when theposition is first entered witheitherstockoroptions.Ifyouare at this point and need touseoptions,aquicktechnicalanalysis review,alongwithalook at the options chain forclues about support andresistance from the openinterest, is what you need todetermine how to hedge.What you are looking for is
which strike to use over thecourseofyourtradetoprotectthe initial thesis. As statedearlier,thismaybetoprotectgains (for an earnings eventor news cycle) or to preventfurtherlosses,soitisworthafreshlookatthechart.Practically speaking, if you
areup$4ina$20Googlecallspread as Google heads intoan earnings announcement,youhavemanychoices.First,
youcansellshortthestock.Ifyour call spread is the910/930 call spread with thestock at 920, then you canbuyoutmonthputsatthe920strike (they will not exhibittime decay) or sell 930 callsinanoutermonth,ordoboth.Using options for an outermonthconcentratesanymovein the stock to the pricemovement and less tochanges in volatility and to

changesintimetoexpiry.Ohyeah, you can also just booktheprofits.The hedge should be taken
offwhenthepriceisfinishedmovingagainstyou.Ifitwereonlythateasy,likeitraisesitshandwhen it is done hurtingyou. Technical analysis,usually on a shorter intradaytimeframe,canhelpdiscoverwhen this is happening,although in the end it is a

guess. The tendency is toleave the hedge on for toolong, and that isunderstandablefromahumanpsychology standpoint; youdo not want to be in thatlosing position again. Butwhen the trend has changedontheshortertimescale,thenit is time to take it off. Thisdoes not mean that you willnot have to do it again.Constantly be prepared to

hedge.Let’s look at a real-life
example from a trade donefor the earnings report onBlackBerry, at the end ofJune2013.Figure12.2showsthesetuppriortothereport.
FIGURE12.2BlackBerry(BBRY)Hedge
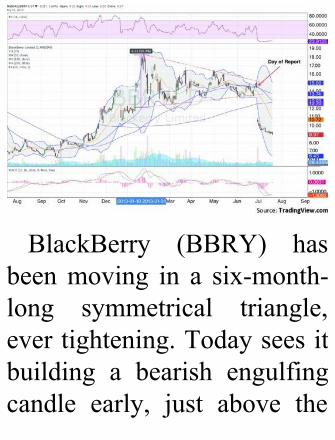
BlackBerry (BBRY) hasbeenmoving in a six-month-long symmetrical triangle,evertightening.Todayseesitbuilding a bearish engulfingcandle early, just above the

flat simple moving averages(SMAs) before the reportFridaymorning.TheRelativeStrengthIndex(RSI)isontheverge of moving into bullishterritory, with the movingaverageconvergence/divergence(MACD)indicatorturningup—a short-term upside bias.Support lower comes first at14 and 13.50 before 12.60and 12.15. Under 13.50, it
carries a measured move(MM)lowerto7.50.Thereisresistance at 15 and 16followed by 16.50 and 17.20before 18.20.Over 15.50 theMM higher is to 21.50. Thereactions to the past sixearnings reports have beenmovesofabout12.03percenton average or $1.81, makingfor an expected range of12.75 to 16.50. And shortinterest is very high at 35

percent. The at-the-moneyJune weekly Straddlessuggestasimilar$1.70moveby expiry with impliedvolatility(IV)at250percent,well above the July monthlyIV at 83 percent and theAugust IV at 67 percent.Options volume favors theupsidewith 8,333September17/18 call spreads trading onthe offer, and 1,000 August25bullishriskreversals.

Trade Idea 1: Buy theJune 15/16 call spreadand sell next week’s12.5 put for a $0.03credit.
Trade Idea 2: Buy theAugust 15 Straddle,selling the July 514/15.5 Strangle for$1.60.
Trade Idea 3: Buy theJune 15/July 5 16 callspreadandselltheJuly

512putfor$0.05.TradeIdea4:BuytheJuly515/16callspreadandsell the July512.5putfor$0.10.
I took trade #4 for a cost of12cents.Looking with hindsight,
maybe you would give adifferent interpretation of thesetup, but it happened. Thenext morning was an utterdisappointment with an

immediate sell-off. Thepremarket action (prior to9:30 a.m.) is not shown onthe chart, but there was aquick, nearly immediatereaction below thesymmetrical triangle. Beingshort the July 5 12.5 putrequired immediate hedgingtolimittheloss.Iwasabletoshort the stock at 11.60 as ittickedlower.Bythetimethemarketopened,itwastrading
at 10.71, with the hedgepaying off, limiting a loss to90cents.Butat that time theprice action in the stockwasjusthorrible.IclosedtheJuly5 12.5 puts at $1.85, leavingthe short stock position openandessentiallybookingalossof $1.95, expecting the stockto continue to move lowerfrom the technical analysis.The break of the trianglecarried with it an expected
move lower of $6.10, thewidest part of the triangle,whichwouldtakethestockto7.65. My breakeven for thetradewas then a stockmoveto9.65.At thatpoint I couldcover my short at breakevenforthetradewiththegainontheshortequalingthelossontheput.Asthestocktouched9.50itstalledandIclosed30percentoftheshortthere.Ona dip lower to 9.10 a week

later I closed50percent, andthen was stopped on theremaining 20 percent of theshort a few days later as itbouncedto9.37.Theaveragepricetoclosetheshortendedupbeing9.274,soIbookedagain on the entire trade of37.6 cents. When life givesyou lemons, make somelemonade.The point of including this
example is twofold.The first
purpose is to show theimportance of hedging.Withno hedge and a best-casecloseat theopen, the lossonthe trade by closing the putswould have been the full$1.95.Thehedgelimitedthatto 90 cents. Second, byunderstanding the technicalviewyoucanoftenadjustthetradeandturnaclunkerintoawinner.Whenyouarewrong,close quickly, but also

reassessthesituation.
ProfitTakingYou already have profittargets from the trading planand can follow them.That isthe easy part.But sometimesyouneedtoadjusttheplanonthe fly as the price actiongives you signals. Oneexampleofthathappenedinatrade idea thatwasoriginallyplanned for July 8, 2013, in
Ironwood Pharmaceuticals.Figure12.3showsthetrade.
FIGURE12.3IRWDProfitTaking
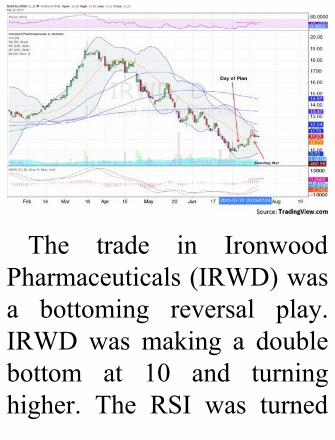
The trade in IronwoodPharmaceuticals(IRWD)wasa bottoming reversal play.IRWDwas making a doublebottom at 10 and turninghigher. The RSI was turned

upandtheMACDwasaboutto cross to positive territory.The price was more than 20percent below its 50-daySMA and had 18 percentshort interest to help it if itcould get started higher.Therewasresistanceat10.50,11.35,and12.50followedby13.80 and 14.40. The planwas to enter long on amoveover 10.50 with a stop at10.25. As the price moves

over 10.80, you convert thestoptoa30-centtrailingstopand take off one-third of theposition at any stall over13.80.YoucanalsoconsiderapartialpositionasaJuly10buy write, buying the stockand selling the July 10 call(70 cents) for a 2 percentreturn if called in twoweeksusing theFridaycloseon thestock. Another alternativewould be to add a July
10/August 12.5 Collar (free)to the stock position forprotectiontothedownsidefortwo weeks and still apotential for a 19 percentreturn at August expiry if itsqueezeshigher.Whichevertradewastaken,
it called for no profit takinguntil a touch at 13.80. Thetrailing stop would have hadyousellingthestockat11.54forasmartgainonthedayof

theShootingStar.Butwhatifyou did not adjust your stopyet? The signs in the chartalso suggested taking profits,at least some, well before itcould get to 13.80. TheShooting Star, beingconfirmedlowerthenextdaywith an RSI that leveledunder the midline, failing tomove into bullish territory,and anMACD that had alsoleveled on the histogram
shouldbeenoughtoconvincethetradertoplaceatightstopor take profits. All of thesesignspointtoareversal,oratleast a consolidation. Don’tletawinningtradeturnintoaloserbecauseitdidnotreachyour profit target. Use thestops but also continue towatch the chart. If the stockturns,goaheadandsellsomeof your position to takeprofits.
AdjustmentsYou spent a lot of timecreating a trade plan, so itmay seem counterintuitive tostart looking for ways toadjustitrightawayorshortlyafterthetradeisentered.Itisnot always necessary. If youare buying a stock withoptions or the stock directlyfor a breakout move higher

and it does that and justcontinues, your plan likelydoes not need any changes.But what if you get into apositionand itmovesagainstyou, but not to your stop?This could be an opportunitytoadjustthetradetoimproveit. A real-life examplemighthelphereaswell.Campbell Soup (shown in
Figure 12.4) had been adarling of the market from
June2012untilMay2013.Abig 14 percent pullback intomid-June presented anopportunity for a trade.Getting long the stock onJune7at43.75usingastopat42 seemed a good long-termplan.TheRSIhaddippedandwas turning back up and theMACD was improving. Alllooked well until the Juneexpiration.Threedaysahead,the stock fell from a high of

45.65 to 42.83 as openinterest lower may havepulled it down.The stop hadnot triggered but it didpresent an opportunity toadjust the trade. With thestock lower, it was time tolook at adding options toleverageanypophigher.Oneofmyfavoriteadjustmentstoastockthatisintheholebutlooksheadedhigher is a1×2callspread.ThisfitCampbell

Soupperfectly.IaddedaJuly44/46 1×2 call spread forfree.Thiscanbelookedatasadding a covered call to thestock trade,andacall spreadalongside. Because it wasfree, this meant that if thestock rose to 46 by JulyexpiryIwouldbecalledawayonthestockat46buthavea$2gainon the call spread aswell, so the net sale pricewouldbe48. Iwouldhavea
$5.15 gain on a $3.15 moveinthestock.
FIGURE12.4CampbellSoup—Adjustments

These types of adjustmentsareoftenavailableforfreeoreven a small creditsometimes. Of course if thestock does not move or fallsthey are worth nothing, so it

is importantnot topaymuchforthem.Butitdoesillustratethattherearesituationswhereadropinastockmayopenanopportunity thatdidnotexistjustadollarhigher.

■ConclusionThischapterstartstogiveyoua real feel ofwhat trading islike. It is lots of work andplanning followed bypatience to sit around andwaitforatrigger,sothatyoucan enter a trade andimmediately look to adjusttheplanthattookyousolongto create.You should have a

sense of when to avoid themarket and then how to dealwith your triggers on stocksthatdecidednot towait.Youshould also understand theconcept of hedging atmultiple levels and how youmightincorporatehedgesintoyour trading. I hope that thischapter also instilled theknowledge that the trade isnotoveruntilyouhaveclosedout all aspects of it. It can

always reverse in your favoror against you, andyouneedto be open to exploring thetechnical setup constantly tobe able to adjust and takeadvantage of the newsituation.

T
CONCLUSION
here is a lot ofinformation packed into
this book, all to try to helpyou be better prepared totrade stocks and especiallyoptions using technical

analysis.Tradingisaprocess,and like any process, themore prepared you are andthemorepracticeyouget,thebetter you can be at it. Istartedthisbookwithaquotefrom Seneca—“Luck iswhathappens when preparationmeets opportunity”—andhave written the chaptersfrom that perspective. Youwanttobereadytotradeandbepreparedtotakeadvantage
of any luck that the marketgives you. You now have asense of what it takes to beprepared, at least to tradefromatechnicalperspective.The first part of the book,
“Identifying andUnderstanding the Trend,”started the process. Weexplored how to identify themajor trend and whatinfluences it in Chapter 1.This is important because 70

percent ormore of all stocksmovewiththetrend.Wethenexplored the sectors inChapter 2, one layer deeperinto the onion of the marketstructure to see where tofocus. With just these twoprocesses mastered, you areprepared tomake the biggestdecisions of your investingand trading life, answeringthe question “Which way isthe market moving and how
doIusethatinformation?”Ifyou have gotten nothing elseout of this book but anunderstanding of how toidentify the trend and profitbytradingwithit,thenIhavesucceeded in my endeavor.Buttherewasalotmore.In Part II, “Technical
Analysis for IdentifyingIndividual Stocks,” we dugdeeperintothemarket.Inthispartwedelvedintofourtypes

oftechnicalanalysis.Thefirstarea, in Chapter 3, wasclassical technical analysis,the study of support andresistanceandofpatterns.WethenmovedintotheworldofJapanese candlestickformationsinChapter4.Nextfollowed the methods basedon rhythmic flows likeFibonacci retracements,Harmonic patterns, ElliottWave principles, and
Andrews’ Pitchfork, andmore, in Chapter 5. InChapter 6 we closed withtechnicaltoolsbasedonpricederivations like momentumoscillators and movingaverages,aswellasvolatility-based analysis. With thesesets of toolswe then learnedtocreatethetradingwatchlistandtradingplaninChapter7.At the end of Part II, youcould apply your new

knowledge to study chartsusing thesemultiplemethodsto create amosaic of a stockand determine its viability totrade,andthenscriptaplantoexecute using that stock. Ifyouaregoing to tradestocksatall,youneedtocontinuetorepeatthisprocess.We moved into options
strategies in Part III, startingwith some options basics.Thispartwasthefirststepin
adaptingalltheprioranalysisto design options trades.Westarted with some definitionsin Chapter 8 to gain anunderstanding of the toolsavailable. We then workedthrough numerouscombinations of options inChapter 9 that can be builtinto strategies to manageleverage,risk,andcost.WegottoPartIV,“Design
and Execution,” with a firm

grounding in finding themarket trend and stocks totrade with it, and completedthe preparation by adding anunderstandingofhowoptionstools can be used to enhancethe stock trade setups byadding leverage, reducingcapital employed, andmanaging risk. In this finalpart, everything we haddiscussed was broughttogether for the creation and
execution of trades. Chapter10 gave a discussion of thekey roles in this process: thedriver, funding options, andrisk limiter. We then movedontoadetaileddiscussionofposition sizing and settingstop losses. Chapter 11 thenshowed examples of acomplete weekly tradingplan,andChapter12wrappedit up with a discussion onexecutionandadjustmentsfor
profittakingandhedging.This process is time
consuming and arduous. It isalsoboringmostof the time.But it is what it takes to beprepared.Andbeingpreparedmeans eliminating as muchuncertainty as possible. Thisleaves you with theopportunitytotakeadvantageof circumstances and luck.Another wise man hadsomething to say about hard

work and luck. BenjaminFranklin noted, “Diligence isthemotherofgoodluck.”Letmeendwith thatquoteandawish of good luck to all ofyou.

ADDITIONALRESOURCES

■BooksCarney, Scott. HarmonicTrading. Vol. 6, ProfitingfromtheNaturalOrderoftheFinancial Markets. UpperSaddle River, NJ: FT Press,2010.Edwards,RobertD.,andJohnMagee.TechnicalAnalysisofStock Trends. 9th ed. NewYork:AMACOM,2007.

Frost, A. J., and Robert R.Prechter. Elliott WavePrinciple: Key to MarketBehavior. 10th ed. WileyTrading Advantage. NewYork: John Wiley & Sons,2001.Murphy, John J. IntermarketAnalysis: Profiting fromGlobalMarket Relationships.2nd ed. Wiley Trading.Hoboken, NJ: JohnWiley&Sons,2004.
Nison, Steve. JapaneseCandlestick ChartingTechniques. 2nd ed. UpperSaddle River, NJ: PrenticeHallPress,2001.Olmstead, W. Edward.Optionsfor theBeginnerandBeyond; Unlock theOpportunities and Minimizethe Risks. 2nd ed. UpperSaddle River, NJ: FT Press,2012.
■WebsitesThe Options IndustryCouncil:www.optioneducation.org/strategies_advanced_concepts/strategies.htmlMarket TechniciansAssociation:www.MTA.orgHarmonic Trader:www.harmonictrader.comMyblogandnewsletterideas:www.DragonflyCap.com

T
ABOUTTHECOMPANIONWEBSITE
o enhance your readingof this book, detailed
full-color charts are providedon the companion website.
Feelfreetodownloadandusethesecharts.Toaccessthewebsite,goto
www.wiley.com/go/tradingoptionsWhen prompted for apassword,enter“analysis.”

ABOUTTHEAUTHOR
Greg Harmon, CMT, CFA,founded Dragonfly CapitalManagement,LLCtoprovidedaily technical analysis ofsecurities markets and
consulting services to themarketplace.Hehastradedinthe securities markets since1986, having held seniorpositions including Head ofGlobal Trading, Head ofProduct Development, Headof Strategy, and Director ofEquity and Portfolio SwapsTrading at ChaseManhattan,State Street Corporation, andBNPParibas.GregearnedanMBA in finance from New

York University’s SternSchoolofBusinessandaBSin mechanical engineeringfrom Cornell University. HeisalsoafoundingpartnerandCIO of Presidium Capital,LLC, an asset managementfirm specializing in separateaccountmanagement.

INDEX
AAdvanceBlockpatternAmerican Association ofIndividual Investors (AAII)SentimentSurveyAmericanCapitalAgency

AmericanexercisefeatureAndrews,AlanAndrews'PitchforkAppel,GeraldAscendingTrianglepatternAssignmentprocessAt-the-money (ATM),definedAverageTrueRange(ATR)
BBatHarmonicpattern/Bearish

BatHarmonicpatternBearish Butterfly HarmonicpatternBearishEngulfingpatternBearish Gartley HarmonicpatternBlueNileBollinger,JohnBollingerbandsdefinedforsectorreviewanalysis
BP
BrentBrokenWingButterflyBullish Engulfing/BearishEngulfingreversalpatternsBullish Shark HarmonicpatternButterflyBuysignal,RSIasBuywrite
CCalendarspread
Callsdefinednakedput/callratioSee also Optionscombinations
Carney,ScottM.Cash-protected (cash-covered)putsChannelspatternChartsbarcharts

Japanese candlestickcharts, defined (See alsoJapanese candlestickpatterns)linechartsreading for trendidentificationreadingoptionstables
Chicago Board OptionsExchange(CBOE)exercisingoptionsandMarketVolatilityIndex
ChinaChinaASharesIndexShanghaiCompositeIndex
Classicaltechnicalanalysishorizontal support andresistancepatternsfor
ClosingtransactionsCommission costs, stockversusoptionsConsumer DiscretionarySelectSectorSPDR(XLY)
Consumer Staples SelectSectorSPDR(XLP)ContinuationpatternsRising and Falling ThreeMethodsThree Advancing WhiteSoldiers/Three BlackCrows
Contractsdefinedilliquidjumbooptioncontracts

minioptioncontractsnormaloptioncontracts
Copper, trend identificationandCoveredcallCrabHarmonicpatternCrossover,astrendindicatorCrudeoil,trendidentificationandCupandHandlepattern
D

Dark Cloud Cover/PiercingLinepatternsDaytradersapplicationofconceptsformovingaveragesforposition sizing and stoplossesRelative Strength Index(RSI)fortrendidentificationby
DeathCrossDeepCrabHarmonicpattern

DeepwaterHorizon(BP)DeltaconceptDerived and quantitativeanalysisAndrews'PitchforkElliottWaveanalysisFibonaccisequenceGannanglesgenerallyHarmonictradingapproachPointandFigureanalysisWyckoffmethod
DescendingTrianglepatternDesign.SeePlandesignDiagonalspreadDiamondpatternDividends, stock versusoptionsDojiindecisionpatternDow Jones IndustrialAverage (DJIA), identifyingandunderstandingtrendsDragonflyDojipatternDrivers

EElliott,RalphNelsonElliottWaveanalysisElliottWavePrinciple (Frost,Prechter)EmergingmarketequitiesS&P500versustrendidentificationand
Energy Select Sector SPDR(XLE)EuropeanexercisefeatureEveningStarpattern

Exchange-traded funds(ETFs), trend identificationandExecutioncosts, stockversusoptionsExercise,definedExpirydefinedstockversusoptionstimevalueand
Exponentialmovingaverages(EMAs)
definedMACDcreationand
FFalling signal line, as trendindicatorFallingWedgepatternFibonaccisequenceFinancials Select SectorSPDR(XLF)5-0HarmonicpatternFlagpattern

Frost,A.J.Fundingoptions
GGann,W.D.GannanglesGartleyHarmonicpatternGermanDAXIndexGladwell,MalcolmGoldsilvertogoldratiotrendidentificationand

GoldenCrossGoldenRatioGravestoneDojipattern
HHagopianTriggerLineHammer/Hanging ManpatternsHangingManpatternHaramiindecisionpatternHarmon,GregHarmonictradingapproach

HeadandShoulderspatternHealthcare Select SectorSPDR(XLV)High-yield (“junk”) bonds,U.S.TreasurybondsversusHistogramsHolders,definedHorizontal support. See alsoPatterns
IIlliquidcontracts

Indecisioncandles(patterns)DojiHaramiSpinningTop
Indexes, for trendidentificationIndicatorsBollingerbandsgenerallymoving averageconvergence/divergence(MACD)

movingaveragesRelative Strength Index(RSI)
Industrials Select SectorSPDR(XLI)Intermarket relationships,trendidentificationandIn-the-money(ITM)definedout-of-the-money (OTM)versus
Intrinsicvalue

Inverse Head and ShoulderspatternIronCondor
JJapanesecandlestickpatternsBullish Engulfing/BearishEngulfingcolorusedinDarkCloudCover/PiercingLineDoji

Hammer/HangingManHaramiJapanese candlesticks,definedprice action of stocksillustratedby“real body” of JapanesecandlesticksRising and Falling ThreeMethodsshadows of Japanesecandlesticks

SpinningTopStarsThree Advancing WhiteSoldiers/Three BlackCrows
Jumbooptioncontracts“Junk” bonds, U.S. Treasurybondsversus
LLeonardodaPisa(Fibonacci)Levels,setting

LiberAbaci(Fibonacci)Liquidityilliquidcontractsposition sizing and stoplosses
MMargincostsshortoptioncombination
MaterialsSelectSectorSPDR(XLB)

MinioptioncontractsMomentumindicators of (See alsoMoving averageconvergence/divergence(MACD); RelativeStrengthIndex(RSI))trendidentificationand
MorningStarpatternMosaic,buildingMoving averageconvergence/divergence

(MACD)creationofdefinedexponential movingaverages(EMAs)momentumstrengthandsectorreviewanalysis
Movingaveragesapplicationsofexponential movingaverages(EMAs)generally
GoldenCross,DeathCrossandmoving averageconvergence/divergence(MACD)simple moving average(SMA)
NNASDAQ-100identifying andunderstandingtrends

trendidentificationandNaturalgasNestedFibonaccisNewsaboutindividualstocksaboutmarkets
Nison,SteveNormal (size) optioncontracts
OOpeningtransactions
Optionsadvantagesofcontractsizeexpirationandexerciseoptiontablespriceterminologyrelateddefinitionsstockversusstrategies,generallytradingasprocessunderstandingSee also Derived and

quantitative analysis;Indicators; Japanesecandlestick patterns;Options combinations;Trading plan; Trendidentification; Watch listandinitialplan
Optionscombinations“cheat sheet” ofcombinations anddescriptionscoveredcallorbuywritelongaputorcall
long a put spread or callspreadlong a ratio put or callspreadlongorshortaButterflylongorshortaCalendarlongorshortaDiagonallong or short an IronCondorlong or short a RiskReversallongorshortaStraddle
longorshortaStranglepopularcombinationsshortaputorcallshort a put spread or callspread
OscillatorsOut-of-the-money(OTM)definedin-the-money(ITM)versus
PPatterns

ChannelsCupandHandleDiamondsFlagsgenerallyHeadandShouldersRisingWedgeTrianglesSee also Derived andquantitative analysis;Japanese candlestickpatterns

Piercing Line (PiercingCandle)patternPlandesigndesign and execution (SeealsoPlanexecution)elementsofindividualstocksandposition sizing and stoplossesSeealsoTradingplan
Planexecutionadjustments

designandexecutionhedgingprofittakingwaitingforstocktotriggerSeealsoTradingplan
PointandFigureanalysisPortfolio and trade risktolerancePositionsizingPositiontradersFibonaccianalysisforposition sizing and stop
lossestimeframefor
PowerShares QQQ Trust,trendidentificationandPrechter,RobertR.Preparationimportanceoftradingasprocessandusing charts for (See alsoTrendidentification)
Priceactionindicatorsderivingfrom
trendidentificationandSee also Japanesecandlestickpatterns
Putscash-protected (cash-covered)definedput/callratioSee also Optionscombinations
R

Ranking,ofsectorsRatiosGoldenRatioratiochartssignificantmarketratios
RelativestrengthRSIversusforsectorreviewanalysis
RelativeStrengthIndex(RSI)asbullmarketindicatordefinedRSI positive/negative
reversalsectorreviewanalysis
RenkochartsResistanceBollingerbandsanddefinedmovingaveragesand
ReversalpatternsBullish Engulfing/BearishEngulfingDarkCloudCover/PiercingLine

Hammer/HangingManStars
Rising and Falling ThreeMethodspatternsRising signal line, as trendindicatorRisingWedgepatternRiskas advantage to usingoptionsrisklimiterrisk management and

positionsizingRisk Reversal (optionscombination)Russell2000identifying andunderstandingtrendstrendidentificationand
SSeagullSectorreviewanalysisrelativestrengthand

Select Sector SPDR chartsforuseof
SelectSectorSPDRSellers,definedSellsignal,RSIasSentimentindicatorsShadows, of JapanesecandlesticksShanghaiCompositeIndexS&P500ratiotrendidentificationand

SharkHarmonicpatternShootingStarpatternShortinterestSilver,goldratiotoSimple moving average(SMA)definedMACDcreationandsectorreviewanalysissentimentand
“Soldtoopen”Spinning Top indecision

patternStandard&Poor's(S&P)emergingmarketsversusidentifying andunderstandingtrendsShanghaiComposite IndextoS&P500ratioS&P500SPDRtrendidentificationandU.S.TreasurybondsversusSee also Trendidentification

StarspatternsStocksdeveloping plan for (Seealso Watch list and initialplan)identifying andunderstandingtrendsnews about individualstocksoptionsversusplanexecutionandwaitingforstocktotrigger

See also Japanesecandlestickpatterns
Stoplosspositionsizingandsetting
StraddleStrangleStrikepricedefinedintrinsicvalue
SupportBollingerbandsand

definedmovingaveragesandSeealsoPatterns
SwingtradersFibonaccianalysisformovingaveragesforposition sizing and stoplossesRelative Strength Index(RSI)fortimeframeusedbytrendidentificationfor

SymmetricalTrianglepattern
TTechnicalanalysisgoalofunderstandingSeealsoClassicaltechnicalanalysis; Derived andquantitative analysis;Indicators; Watch list andinitialplan
Technical indicators. See

IndicatorsTechnicaltriggersThetaconceptThree Advancing WhiteSoldiers/Three Black CrowspatternsThree Drives Harmonicpattern3DSystemsTimeframesposition sizing and stoplosses

forsectorreviewanalysisfortechnicalanalysisgoalsfortrendidentificationwatchlistandSeealsoExpiry
TimespreadsTraders, types of. See Daytraders; Position traders;SwingtradersTrading Options (Harmon),companionwebsitetoTradingplan

analysisearningstradeplansforexecutionofplandesigntoptradeideasfortrendidentificationSee also Watch list andinitialplan
Trendidentificationindexes and time framesformarket influencers and

intermarketrelationshipsmomentumandpriceactionandratiochartsreadingchartsforsentimentindicatorssignificantmarketratiostrends,definedtrendtoolsSee also Sector reviewanalysis
Trianglepattern

UU.S. Dollar Index, trendidentificationandU.S.Treasurybondshigh-yield (“junk”) bondsversusS&P500versustrendidentificationand
Utilities Select Sector SPDR(XLU)
V

VolatilityChicago Board OptionsExchange MarketVolatilityIndexgenerallyindicators of (See alsoBollingerbands)
WWatchlistandinitialplanbuildingamosaiccreating trading plan (See

alsoPlandesign)nontechnical factors forreview
West Texas IntermediateCrude(WTIC)Wilder,J.Welles,Jr.“W,”ofHarmonicpatternsWyckoffmethod