Embed Size (px)
Citation preview


Contents 1 Introduction ............................................................................................................................ 4
1.1 Purpose of Audit ............................................................................................................... 4 1.2 Transparency .................................................................................................................... 4 1.3 Methodology .................................................................................................................... 4 1.4 Presentation of report ...................................................................................................... 4
2 Key findings ............................................................................................................................ 5 2.1 Where we have improved our services and/or continue to do well ................................... 5 2.2 Where we can improve our services .................................................................................. 5
3 Quality of Therapy .................................................................................................................. 6 3.1 Variety of children attending the Centre .......................................................................... 6 3.2 Goals and Outcome measures .........................................................................................11 3.3 Liaising with local therapists ...........................................................................................13 3.4 Therapy provision ............................................................................................................ 17
4 Feedback from parents ......................................................................................................... 19 4.1 Parent feedback ............................................................................................................. 20 4.2 Measure of processes of care – Occasional patients ....................................................... 21 4.3 Measures of processes of care for service providers (MPOC-SP) .................................... 22
5 Recommendations ................................................................................................................ 24 6 Conclusion ............................................................................................................................ 25 7 Service Delivery Terminology ............................................................................................... 26
7.1 Treatment Services ........................................................................................................ 26 7.2 Bobath Therapy .............................................................................................................. 26
8 Glossary of Terms ................................................................................................................. 27 9 Appendix............................................................................................................................... 30 10 Bibliography ......................................................................................................................... 34
List of Tables Table 1 – Diagnoses of occasional patients .................................................................................... 6 Table 2 – Classification of occasional patients with cerebral palsy ................................................. 7 Table 3 – Manual Ability Classification Levels (MACS) ................................................................... 9 Table 4 – Therapy Goals (SMART) and GAS goals for all children ................................................. 12 Table 5 – Visits by community therapists January to March 2013 ................................................. 14 Table 6 – Occasional patients: MPOC Category Scaled scores and Descriptive statistics ............. 22 Table 7 – MPOC-SP: Category Scaled scores and Descriptive statistics ....................................... 23 Table 8 - Occasional Patients - MPOC Item mean scores ..............................................................31 Table 9 - MPOC for service providers – MPOC Item mean scores................................................. 32 Table 10 - Item score comparison for MPOC-SP and MPOC for occasional patients .................... 33
List of Charts Chart 1: Types of Cerebral Palsy: European and Bobath populations 7 Chart 2: GMFCS levels of children attending the Bobath Centre 8 Chart 3: Comparison of rates of GMFCS levels in European population (Westbon et al., 2007) and Bobath Centre population 2013-15 8 Chart 4: Age band data 9
The Bobath Centre for Children with Cerebral Palsy
Page 4
1 Introduction Treatment services are delivered in different patterns (see Note 1 in Appendix 1), the allocation of which is dependent on the patient’s clinical needs, geographic location, and funding arrangements.
1.1 Purpose of Audit
This biannual internal clinical audit report aims to provide a transparent account of the clinical services of the Bobath Centre. Clinical audit informs changes in service practice and evaluates the effectiveness of any such changes.
1.2 Transparency
This report aims to provide all staff, including the trustees with current clear and open information about the performance of the services.
1.3 Methodology
The clinical audit plan was constructed to reflect the overall strategic plan for the Bobath Centre, to ensure analysis of all the following key areas. • Bobath treatment for a variety of children with cerebral palsy • Client and family friendly services • Education and training for carers • Liaison with local therapists • Reports and home activity programmes
The 2014/15 clinical audit report, strategic plan and clinical audit plan are available as separate documents on request from Christine Barber, Director of Therapy Services at the Bobath Centre. Data collection took place throughout the year to fit in with the clinical activities of the Centre and our financial year.
1.4 Presentation of report The report starts with a summary of the key findings for easy access, followed by a detailed report on each clinical area, future recommendations and a conclusion. Each clinical section includes information on the objectives, audit activities, performance indicators (see Glossary) and main findings.

Clinical Audit Report 2015
Page 5
2 Key findings
2.1 Where we have improved our services and/or continue to do well
Quality of service offered by the Bobath Centre remains high with appropriate clinical mix of therapies being provided for children in the vast majority of cases (96%).
A variety of children with cerebral palsy have attended the Bobath Centre, in terms of motor disorder, level of ability and age
Fifty-four percent of children attending this year had more limited mobility (GMFCS levels IV and V) and 45% had less common dyskinetic forms of cerebral palsy. Typical European populations would contain 22% and 6.5% respectively.
Therapists at the Bobath Centre are therefore more likely to treat children with very complex needs more frequently than typical community therapists, and have gained extensive experience with this patient group. This expertise is being used when providing therapy for these children and their families.
High standards have been maintained in setting therapy goals and achieving them. One hundred percent of children had at least one goal set, and 85% had 3 or more goals set. Ninety-three percent of children achieved their therapy goals. There has been a substantial increase in GAS (goal attainment scaling) goals set, 45-47% over the last 2 years in comparison to 35% previously.
Standardised outcome measures were used in 22 children in 2014-15. In 6 children, outcome measures were used once as a baseline assessment. The 16 children who had their outcome measures repeated at the beginning and end of their treatment all showed improvement in scores after their therapy.
Parents remain very satisfied with the therapy at the Bobath Centre and consider the service to be family friendly as evaluated on the Measure of Processes of Care (MPOC) and all parents received a draft home programme on the last day of their visit
Communication with local community therapists continues to be effective with the majority of therapists receiving phone contact (87%) from Bobath Centre therapists; with an increased number (79%) hearing of appointments well in advance by letter or phone call.
Community therapists have found their visits beneficial for treatment planning and gaining new ideas for treatment. Feedback from community therapists is good, with comments like “It has given me more confidence with handling techniques and new ideas” and “Very beneficial – more focussed and specific than treatment I do. Able to ask questions”
2.2 Where we can improve our services
Although more outcome measures were used in children within GMFCS I-III over the last two years (71-72%) compared to 57% in 2012-13, there has been a decline in use in children of levels IV and V (32% 2012-13; 25% 2013-14; 8% 2014-15). Overall the numbers of children having outcome measures administered remains the same as last year, despite strategies to try to increase this.
Reports are being sent out later due to a smaller staff team treating patients but also having more teaching and other responsibilities (report sent out within 3 weeks: 58% in 2012-13; 18% in 2014-15; report sent out within 5 weeks: 88% 2013-14; 65% in 2014-15). This was most acute during the summer months in our busiest period.

The Bobath Centre for Children with Cerebral Palsy
Page 6
3 Quality of Therapy
3.1 Variety of children attending the Centre
Objectives To provide services to children with cerebral palsy including children of various ages, with a variety of motor disorders and classifications.
Audit procedure data collected on indicator forms for each patient by therapists.
Actions following last audit report
none
Performance Indicator The variety of the caseload remains the same or complex cases increase
2010-11 2011-12 2012-13 2013-14 2014-15
Children with dyskinetic cerebral palsy (athetosis) (more complex cases) 41% 38.5% 43.4% 41.8% 45.6%
Children with GMFCS level IV & V (more complex cases) 61% 61.0% 54.9% 62.% 54%
99 occasional children attended in 2013-14 and 76 attended in 2014-15 and were analysed according to diagnosis, classification, and GMFCS level and age band. Table 1 – Diagnoses of occasional patients 2010-11 2011-12 2012-13 2013-14 2014-15
DIAGNOSIS No. % No. % No. % No % No %
Cerebral palsy 136 89.5% 119 88.8% 113 91.9% 91 92% 67 88.2%
Stroke 1 0.7% 0 0.0% 0 0.0% 1 1% 1 1.3% Traumatic brain injury 0 0.0% 3 2.2% 1 0.8% 0 0% 0 0.0%
Allied neurological conditions
15 9.9% 12 9.0% 9 7.3% 5 5% 8 10.5%
Undiagnosed 0 0.0% 0 0.0% 0 0.0% 2 2% 0 0.0%
Total 152 134 123 99 76
* Children who did not finish their block were excluded. Children attending for a block lasting more than 2 subsequent weeks were treated as one episode of care within this data. Therefore the total of occasional children attending shown above may be slightly different to that obtained from the appointments and funding department.

Clinical Audit Report 2015
Page 7
Table 2 – Classification of occasional patients with cerebral palsy
2010-11 2011-12 2012-13 2013-14 2014-15
SCPE CLASSIFICATION*
BOBATH CLASSIFICATION No % No % No % No % No %
Bilateral Spastic CP Spastic quadriplegia 40 29.4% 36 30.3% 25 22.1% 25 27.5% 13 19.1%
Bilateral Spastic CP Spastic diplegia 27 19.9% 26 21.8% 26 23.0% 19 20.9% 17 25.0%
Unilateral Spastic CP Spastic hemiplegia 12 8.8% 9 7.6% 8 7.1% 7 7.7% 4 5.9%
Dyskinesia Dystonic quadriplegia 42 30.9% 35 29.4% 30 26.5% 22 24.2% 18 26.5%
Dyskinesia Choreoathetosis 14 10.3% 11 9.2% 19 16.8% 16 17.6% 13 19.1%
Ataxia Ataxia 0 0.0% 2 1.7% 4 3.5% 2 2.2% 2 2.9%
Other Hypotonia 1 0.7% 0 0.0% 1 0.9% 0 0.0% 1 1.5%
Total 136 119 113 91 68
*Surveillance of Cerebral Palsy in Europe classification system
These only include data relating to children with cerebral palsy attending the Bobath Centre who can be classified according to their motor disorder and the GMFCS system. Children with ‘other’ conditions, who were not classifiable on the GMFCS were omitted (n=8). The classifications of motor disorder seen at the Bobath Centre differ in proportion from those seen in typical European populations (see Chart 1).
Chart 1: Types of Cerebral Palsy: European and Bobath populations
0%
10%
20%
30%
40%
50%
60%
Dyskinetic(Athetosis)
Bilateral Spasticity Unilateral Spasticity Other
Perc
enta
ge o
f Pop
ulat
ion
Type of Cerebral palsy
Chart 1:Types of Cerebral Palsy: European and Bobath populations
European populations
Bobath population 2013-14
Bobath population 2014-15

The Bobath Centre for Children with Cerebral Palsy
Page 8
The numbers of children seen with different levels of gross motor ability have shown slight changes with fewer children attending within GMFCS IV and V, and slightly more attending within GMFCS II-III (see chart 2).
Chart 2: GMFCS levels of children attending the Bobath Centre
The proportion of children within the different GMFCS levels seen at the Bobath Centre differ from those within typical European populations (see Chart 3).
Chart 3: Comparison of rates of GMFCS levels in European population (Westbon et al., 2007) and Bobath Centre population 2013-15
0%5%
10%15%20%25%30%35%40%45%50%
2010-11 2011-12 2012-13 2013-14 2014-15
Perc
enta
ge o
f chi
ldre
n
GMFCS level
GMFCS levels of children attending the Bobath Centre 2009-2015
I II III IV V
0%
10%
20%
30%
40%
50%
60%
I II III IV V
Perc
enta
ge o
f Pop
ulat
ion
GMFCS level
Chart 3: GMFCS levels: Comparison of European and Bobath populations
European population
Bobath population 2013-14
Bobath population 2014-15

Clinical Audit Report 2015
Page 9
Attendance of children classified according to their manual dexterity on the Manual Ability Classification System (MACS) has changed with fewer children attending who are in levels IV and more attending within level V.
Table 3 – Manual Ability Classification Levels (MACS)
2010-11 2011-12 2012-13 2013-14 2014-15
MACS LEVEL No. % No. % No. % No. % No. %
I 8 9% 11 13% 6 8% 9 15% 5 11%
II 21 24% 17 20% 16 21% 16 26% 13 29%
III 15 17% 15 18% 20 26% 8 13% 7 16%
IV 23 26% 19 23% 16 21% 17 27% 6 13%
V 22 25% 21 25% 20 26% 12 19% 14 31%
Total classifiable 89 83 78 62 45 Too young to classify 48 42 38 30 24
Not CP 15 9 7 7 7
The ages of children seen at the Bobath Centre are varied, but fewer children are seen under the age of two years and over the age of 12 years.
Chart 4: Age band data
0%
5%
10%
15%
20%
25%
30%
35%
40%
45%
2010-11 2011-12 2012-13 2013-14 2014-15
perc
enta
ge o
f chi
ldre
n
Age band
Chart 4: Age bands of children attending the Bobath Centre < 2yr2 – 4yr4 – 6yr6 – 12 yr
12 – 18yr

The Bobath Centre for Children with Cerebral Palsy
Page 10
Key findings
The Bobath Centre continues to provide therapy to a wide variety of children with cerebral palsy in terms of motor disorder, level of disability and age. However, in children seen with cerebral palsy, some types are over or under represented as follows: • Dyskinesia is seen in 45.6% of the children attending the Bobath Centre in
comparison with 6.5% found in typical European populations of children with cerebral palsy indicating that the Bobath Centre provides more services for children with very complex presentations.
• Twenty two – twenty four percent of children attending the Bobath Centre in the last two years were within GMFCS Levels I and II (milder impairment) in comparison to 66% within typical European populations.
• GMFCS Levels III to V (moderate to severe impairment) were seen in 74-76% of cases at the Bobath Centre in the last two years (versus 34% in typical European populations).
• Unilateral spastic cerebral palsy was seen less often (Bobath = 5.9-7.7%; European populations = 29%).
• The Bobath Centre saw fewer children under 2 years and children over 12 years, compared with other age groups.
Recommendations
To continue to attract patients across all age groups, classifications and GMFCS levels

Clinical Audit Report 2015
Page 11
3.2 Goals and Outcome measures
Objectives Demonstrate efficacy of therapy through
1. Increasing the frequency of use of GAS goals and outcome measures by therapists
2. Increasing the number of goals achieved
3. More pre and post treatment outcome measures will show improvement.
Goals: specific measurable therapy goals set for individual patients (SMART – see glossary). Outcome is achieved or not achieved.
Goal Attainment Scaling (GAS) Goals: Individual treatment goals with 5 possible outcomes. Following research about how GAS is used by other clinicians and researchers, it has been decided to adopt the practice of -2 being the child’s baseline level of pre-treatment function, scores of -1 to +2 all represent improvement in function and a score of zero or above is the aim of therapy.
Audit procedure Therapists to collect data on all occasional patients on indicator forms.
Actions following last audit report
• GAS goals practice sessions (>5) have been held regularly throughout the year
• Ongoing support and training has been provided for Bobath Centre therapists to encourage use of outcome measures
o On an informal basis, colleagues assist each other in the administration of outcome measures
o Individual training has been provided in relation to the Pediatric Evaluation of Disability Inventory – Computer adaptive test
Goals
All children had some goals set. One or more SMART goals were set for 85% (n=84) children in 2013-14 and 80% (n=61) of children in 2014-15. One or more GAS goals were set for 82 (83%) children in 2013-14 and 60 (79%) children in 2014-15. The target of setting >3 goals (SMART and/or GAS) was met by 84% of children in 2013-14 and 85.5% of children in 2014-15. The number of GAS goals where a score of 0 or higher was achieved, has remained high (85% for both years – see Performance Indicators above).
Performance Indicators for SMART and GAS goals
2010/11 2011/12 2012/13
2013/14 2014/15
Set > 3 goals (including GAS) for 90% occasional patients
89% 89% 89% 84% 85.5%
Achieve 80% of SMART therapy goals
90% 89% 90% 89% 93%
Achieve 80% GAS goal score of 0 or higher
87% 86% 79.2% 85% 85%

The Bobath Centre for Children with Cerebral Palsy
Page 12
Out of the total number of goals set for all children, 45% were GAS in 2013-14 and 46% in 2013-14, which is an increase of >10% since 2012-13 (see table 4).
Table 4 – Therapy Goals (SMART) and GAS goals for all children
2010-11 2011-12 2012-13 2013-14 2014-15
SMART Goals set 274 49% 276 56% 313 65% 200 55% 142 53%
GAS Goals set 292 51% 213 44% 168 35% 167 45% 124 47% SMART goals achieved 246 90% 245 89% 282 90% 178 89% 132 93%
GAS Goals achieved 285 98% 204 96% 166 99% 165 99% 120 97%
GAS >0 score 255 90% 175 86% 133 79% 141 85% 105 85%
GAS -1& -2 scores 30 10% 29 14% 33 20% 24 14% 15* 12% *From 2014 -1 scores only, as -2 now classified as baseline level of function
0=desired level of improvement or greater; -1 = smaller degrees of improvement
Outcome measures
Performance Indicators for Outcome measures
2010-11 2011-12 2012-13 2013-14 2014-15
Use Outcome measures in 70% of GMFCS level I-III children (more able)
64% 79% 57% 71% 72%
Use Outcome measures in 40% of GMFCS level IV-V children (more severe)
35% 51% 31% 25% 8%
Improve scores on Outcome measures in 80% of cases
85% 95% 94% 100% 100%
Increase frequency of use of Outcome measures overall (in whole population of occasional patients)
44% 50% 41% 41% 41%
• Outcome measures were used with 41 children, of which 39 had cerebral palsy in 2013-14 and in 22
children of which 17 had cerebral palsy in 2014-15 • 71 and 72% of children in levels I-III had an outcome measure set in 2013-14 & 2014-15 respectively,
compared with 57% in 2012-13. • There continues to be a decline in the use of outcome measures in children in levels IV-V – now
only 8% • All children who had outcome measures repeated during their therapy block showed improved
scores post therapy.

Clinical Audit Report 2015
Page 13
Key findings
Setting > 3 goals has remained at a high rate (85%) with a high proportion achieving goals. There has been a substantial increase in GAS goals set (47% compared with 35% in 2012-13). Less than 50% of children attending had outcome measures performed (similar to previous years). The number of children in GMFCS IV-V having outcome measures performed reduced to 8% from 25%.
Recommendations
Continue with GAS goal training sessions intermittently throughout the year as this has proved a very successful strategy and is received positively by therapists.
Endeavour to increase the use of outcome measures through ongoing training in a similar style to the GAS sessions and provide tutorials on a range of Outcome measures.
3.3 Liaising with local therapists
Objectives 4. Improve frequency of contact with local therapists by • The child’s local therapists being invited to attend every
occasional block by letter • Bobath Centre therapists making telephone contact with
community therapists preceding or during the visit if possible.
Local community therapists will be satisfied with their visit to the Bobath Centre
Reports and home programmes will be sent to all local therapists
Audit procedure Three strategies were used to collect data: • A questionnaire was given to all visiting community
therapists over a three month period in 2014 and five month period in 2015.
• A count of all community therapists who visited during the year was made from the appointment schedule.
• Bobath Centre therapists recorded information on an indicator form regarding their contact with community therapists, for every occasional patient throughout the year.
Actions following last audit report None

The Bobath Centre for Children with Cerebral Palsy
Page 14
Performance Indicators for liaison
2010-11 2011-12 2012-13 2013-14 2014-15
80% of visiting therapists to hear of Bobath appointment >4wk before appointment date (questionnaire)
82% 90% 88% 53% 1-3wks=41%
63% 1-3wks=32%
<5% of visiting therapists not informed of any changes in appointments (questionnaire)
0% 10% 0% 0% 0%
A community therapist attends during an occasional patient’s therapy block in >60% of cases (appointment schedule)
48% 53% 40% 39% 36%
Bobath Centre therapists achieve telephone contact with a community therapist involved with an occasional patient in 65% of cases*
80% n=112
80% n=95
78% n=96
92% 87%
>60% of community therapists attending complete a feedback form in specified time period
70% 50% 53% 85% 73%
>90% positive responses of community therapists to Bobath Centre reports
100% 100% 100% 100% 100%
>90% of community therapists record they are satisfied with their visit
100% 100% 100% 100% 100%
*Data only includes occasional patients with a community therapist
Visits by community therapists:
48 community therapists in total visited the Bobath Centre throughout this audit year which is fewer than during 2013-14 (n=83). When the same period of three months is compared, year on year, this also shows a smaller reduction in attendance (see Table 5).
Table 5 – Visits by community therapists January to March 2013
Jan-March 2010-11
2011-12
2012-13
2013-14
2014-15
No. of occasionals 36 33 29 15 16
Percentage of occasionals visited by therapist 47.0% 54.5% 58.6% 47.0% 43.8%
Number of occasionals visited by therapist 17 18 17 7 7
Comparison of 2013-14 and 2014-15 • Occasional patients visited by community therapists numbered 63 (39%) in 2013-14 and 38 (36%) in
2014-15. • The number of patients receiving visits by >1 therapist during their treatment block were 47% in
2013-14 falling to 26% in 2014-15

Clinical Audit Report 2015
Page 15
• Type of therapists:
2013-14 2014-15
35 25 Physiotherapists
14 8 Occupational therapists
14 5 Speech and language therapists
• Other people involved with occasional patients visited including case managers, teachers,
classroom assistants, etc. (n=21, 2013-14; n=10, 2014-15) • Fifty-four percent of consultation patients received visits in 2013-14 falling to 15% in 2014-15. • 13 regular patients were visited in 2013-14 and 8 were visited in 2014-15. • Patients with no community therapist due to living outside the UK were 20% in 2013-14 and 21% in
2014-15
Geographical location of visiting therapists
The work location of visiting therapists was recorded to see if more therapists working within a shorter distance from the Bobath Centre were visiting. If so, this might suggest that funds and time are limited and therefore those community therapists living further away were less likely to visit. Of the 23 therapists who recorded their work location in 2013-14, 17 were from the southern regions (London, Herts, Beds, Surrey, Cambridge and Essex) and 5 from other areas further away (Leicestershire, Milton Keynes, Stockton-on-Tees, Oxfordshire, Switzerland and New Dehli). In 2014-15 southern regions were similar, (n=15) but more attended from further away, n=13 (Midlands, North-East, South-West and India).
Administration of visits
Seventy-nine percent (n=15) of therapists were informed of the appointment by letter or telephone (2013-14= 58%). Sixty-three percent of therapists (n=12) knew at least four weeks in advance of the appointment (2013-14=53%). A further 32% knew between one and three weeks before the appointment. Fifty eight percent (n=11) of therapists had provided written information about the child they were visiting prior to their appointment (2013-14= 53%).
Telephone contact
Therapists at the Bobath Centre recorded their telephone contact on all patients throughout the year. Of patients with a community therapist, successful telephone calls numbered 87% (n=52) in total this year compared to 92% (n=75) in 2013-14.
However, within the small sample of visiting therapists completing a questionnaire, prior to the community therapist visiting the Bobath Centre only 21% (n=4) had received a phone call or spoken to the Bobath therapist on the telephone (previously 26%).
Visiting community therapist feedback (2014- 15)
26 therapists visited during the collection period, May to September 2015, and 73% (n=19) questionnaires were returned. The collection period was extended to 5 months rather than the usual two to allow sufficient questionnaires to be returned. Forms were received from 7 physiotherapists, 4 occupational therapists and 7 speech and language therapists visited. One therapist did not specify her occupation.

The Bobath Centre for Children with Cerebral Palsy
Page 16
Therapy
All visiting therapists found the visit beneficial. Seventeen were given the opportunity to ask questions, raise issues and/or discuss management, one stated they were not given this opportunity and one did not respond. 10 therapists (53%) were given opportunities to try out therapy activities during the session (59% last year), 3 (16%) preferred to observe, 1 (4%) would like to have tried out activities and the remainder did not mind or declined to comment.
Report
Of those therapists visiting children who had attended previously, 82% (n=9) had received reports, one said they had not received a report, and one therapist did not know.
Other Comments
There were many positive comments about the observed treatment session such as
“It has given me more confidence with handling techniques and new ideas”
“Very beneficial – more focussed and specific that treatment I do. Able to ask questions” “Therapists were very helpful with treatment techniques and tips”
“Some great new ideas”.
Several also commented how much they had enjoyed the visit and the opportunity to observe other children being treated. A few commented on the reports being thorough and helpful.
There were also some suggestions from therapists:
“Very detailed, almost too much info/photos. Good range of ideas but some were difficult to adapt to home or school therapy”
“Would have liked more time to discuss and would prefer a more team around the child rather than expert giving advice model”
“To discuss goal/target of each activity prior to starting the activity”
Key findings
Communication with local community therapists continues to be effective with the majority of therapists receiving phone contact (87%) from Bobath Centre therapists; 79% heard of appointments well in advance by letter which is an improvement from 58% in 2013-14.
The numbers of community therapists visiting occasional patients at the centre has reduced from 39% in 2012-13 to 36% in 2014-15. Visits to consultation patients have also dropped, from 54% in 2013-14 to 15% in 2014-15.
Community therapists value their visits and gave very positive feedback.

Clinical Audit Report 2015
Page 17
Recommendations
Therapists to be reminded to always invite local therapists to try out activities if they would like and within the constraints of the treatment session give as much opportunity for discussion as is possible and/or offer to follow up with a telephone discussion.
3.4 Therapy provision
Objectives Provide an appropriate clinical mix of therapies for occasional patients.
Audit procedure Therapists collect data on an indicator form about every occasional patient who attends.
Actions following last audit report
• Senior therapists now telephone a parent for more
information if this is thought necessary to facilitate identification of main therapy needs.
• Content of the parent questionnaire was reviewed in a senior staff meeting and changes made to facilitate identification of main therapy needs.
Performance Indicator: therapy provision
2010-11 2011-12 2012-13 2013-14 2014-15
Clinical mix of physiotherapy, occupational therapy and speech and language therapy should be appropriate to child’s needs in 85% of cases
95% 95% 98.4% 96% 96%

The Bobath Centre for Children with Cerebral Palsy
Page 18
Key findings
Appropriate clinical mix of therapies is occurring in 96% of cases (2013-14=96/99 patients; 2014-15=73/76 patients)
Six patients with inappropriate clinical mix of therapies:
Patient 1: Parents expressed three areas of concern on their questionnaire: fine motor, eat /drink; walking, but were unclear about which was their main concern. Occupational therapy was selected as the key. On attendance it was apparent the main concern was gross motor. In retrospect it would have been helpful to phone parents prior to their appointment to ascertain this information
Patient 2: Speech and language therapy needs were clearly stated on questionnaire. On review by the director, input was left open as it was a small baby with a complex presentation. SLT was found to be needed but none was then available.
Patient 3: On arrival, during assessment at the Bobath Centre it was apparent that the child needed SLT, but this wasn’t indicated on parent questionnaire. SLT was not available
Patients 4-6: All needed SLT but it was unavailable due to SLT staff being on annual leave or having no remaining available SLT sessions.
Recommendations:
Ensure if more than one area of concern identified parents are phoned to assess main concern
When a child’s therapy provision is left open due to various factors e.g. complexity, provisionally book possible slots with alternative disciplines. Telephoning the family approximately 4 weeks before treatment block for an update may be also be helpful.

Clinical Audit Report 2015
Page 19
4 Feedback from parents Objectives
• Parents and carers will have a continuing high opinion that the service they receive is family friendly.
• Parents will have a high level of satisfaction with therapy. • Occasional patients receive a Doctor’s letter, report and home
programme provided within a reasonable time frame and to a high standard.
• Improve parent satisfaction regarding quality of home programmes and confidence carrying out therapy activities.
• Provide accurate information on appointments for clients and families
• Maintain a high level of satisfaction by service users regarding flexibility of appointments system
Audit procedure 1. Parent feedback forms are routinely completed following treatment blocks. A sample of these is reviewed in the second year of the bi-annual audit
2. The Measure of Processes of Care (MPOC) is a standardised measure which identifies parents’ and service providers’ perceptions of the extent to which a service is family-centred. Parents of occasional patients attending from July to mid-August 2014 and 2015 completed the MPOC.
3. Bobath Centre therapists were surveyed using the MPOC for service providers to determine their views of the service during September 2014 and 2015.
4. Therapists recorded provision of draft home programmes and the date of sending out reports on clinical indicator forms for every occasional patient.
Actions following last audit report
None were planned.

The Bobath Centre for Children with Cerebral Palsy
Page 20
Performance indicators and results:
Performance Indicators 2009-10 2010-11 2011-12 2012-13 2013-14 2014-15
>90% of occasional parents/carers state they are satisfied or very satisfied with the therapy received (4 or 5, on 5 pt scale)
97% (n=35)
100% 100% 4=10.5% 5=89.5%
100% 4=12.5% 5=87.5%
* 94% 4= 25% 5= 69%
>90% of occasional parents/carers state that they had opportunity to practise therapy activities
100% 91%
100% 100% * 100%
>90% of occasional parents report that home activities are practical and will fit into home life
96% 96% 79% (15/19)
100% * 87.5% (14/16)
90% of occasional patients receive the doctor’s letter, therapy report and home programme within 3 weeks
89%
80%
69% 58% * 18%
Provide draft home programme on last day of visit to 95% of parents of occasional patients * Therapists reporting over 12 months * Parent sample over 2 months (on questionnaire)
97% 93%
97% 85.7%
98% 85.7% NR=2
98% 85.7% No=1 NR=1
* 100% 79%
Scaled scores for the same categories in MPOC and MPOC-SP will be within 1.0
Yes 4 out of 5 scales
Yes Yes 4 out of 5 scales
Yes
>60% of occasional parents complete an MPOC form in specified time period
68% 79% 95% 85.7% 75% 83%
100% of therapists complete an MPOC-SP form (excepting author of report & staff during induction)
100% 89%
100% 87.5% (7/8)
90% (9/10)
100%
*Bi-annual audit plan therefore some data is no longer collected annually
4.1 Parent feedback
Feedback forms from occasional patients were sampled from a 2 month period from April to May 2014. Sixteen forms were collected.
All respondents saw changes in their children and felt they would be able to fit the home activities into their daily routines.
Therapy
Fifteen parents (94%) rated the therapy provided at the Bobath Centre as 4or 5/5 indicating a high satisfaction rate. One parent did not respond.
Parents were asked about their current areas of concern and what they wanted to be addressed during therapy. These included: to be able to transfer between positions, improve walking, improve trunk control, improve balance and stability, improve ability to sit, use one side of their body more, reduce stiffness, learn new activities for home, receive advice about specific foot orthoses and help with feeding, using hands and improving communication. All respondents reported observing an improvement in their child’s abilities during their block of therapy.
Home programme of activities The percentage of parents receiving draft home programmes was recorded as 79% (previously 85.7%). All respondents had opportunities to practise therapy activities during their visit and 87.5% reported that the

Clinical Audit Report 2015
Page 21
activities would fit in with their daily life at home. Nine respondents reported they would carry out the activities on a daily basis, four stated a few times/week and three did not respond. Nine of the respondents already had the necessary equipment to carry out activities at home.
Appointments
All respondents rated the administration surrounding their visit as 4 or 5/5, with a similar number reporting it as 5/5 when last audited, indicating a very high level of satisfaction.
All respondents were happy with the referral to appointment process, their appointment times and dates. Eight asked to change some appointments, of which all requests were met. No respondents reported confusion over appointment times and dates, or any appointments starting more than ten minutes late.
Therapy reports
There has been a large decline in the number of doctors’ letters, reports and home programmes being sent out within 3 weeks from 58% in 2012-13 to only 18% in 2014-15. This is directly related to lower numbers of staff all of whom are carrying greater responsibilities. (By 4 weeks, 45% of reports were sent, 65% by 5 weeks, 79% by 6 weeks and 94% by 8 weeks.)
Consultation appointment feedback
Six children attended for consultations during the four month period from April 2014-July 2014. One family were from Russia with limited English so did not complete a form.
All respondents gave positive feedback about their visit including “useful”, “informative”, and “good ideas”.
Main concerns included wanting advice about head control, weight bearing over legs/arms, use of walker, stiffness, transfers, standing, ideas for therapy sessions, use of switches, and communication. All respondents stated that main concerns were addressed through discussion, ideas for therapy, demonstrations of exercises, activities and how to hold the child, and suggestions for equipment.
Understanding of the reasons why specific ideas were suggested were rated on a five point scale with 1 indicating ‘I don’t understand’ and 5 indicating ‘I completely understand the reasons’. Four respondents gave a rating of 5/5, and one gave a rating of 4/5. All parents reported they had an opportunity to practice activities during the session and that they were practical and would fit in with daily life at home.
Therapy and administration surrounding the visit were also rated on a five point scale with 1 indicating ‘not at all satisfied’ and 5 indicating ‘very satisfied’. For therapy all respondents gave a rating of 5/5. For administration four gave a rating of 5/5 and one a rating of 3/5.
One respondent commented that travel to London with a disabled child was quite a challenge and would have found attending the Cardiff Children’s Therapy Centre easier.
4.2 Measure of processes of care – Occasional patients
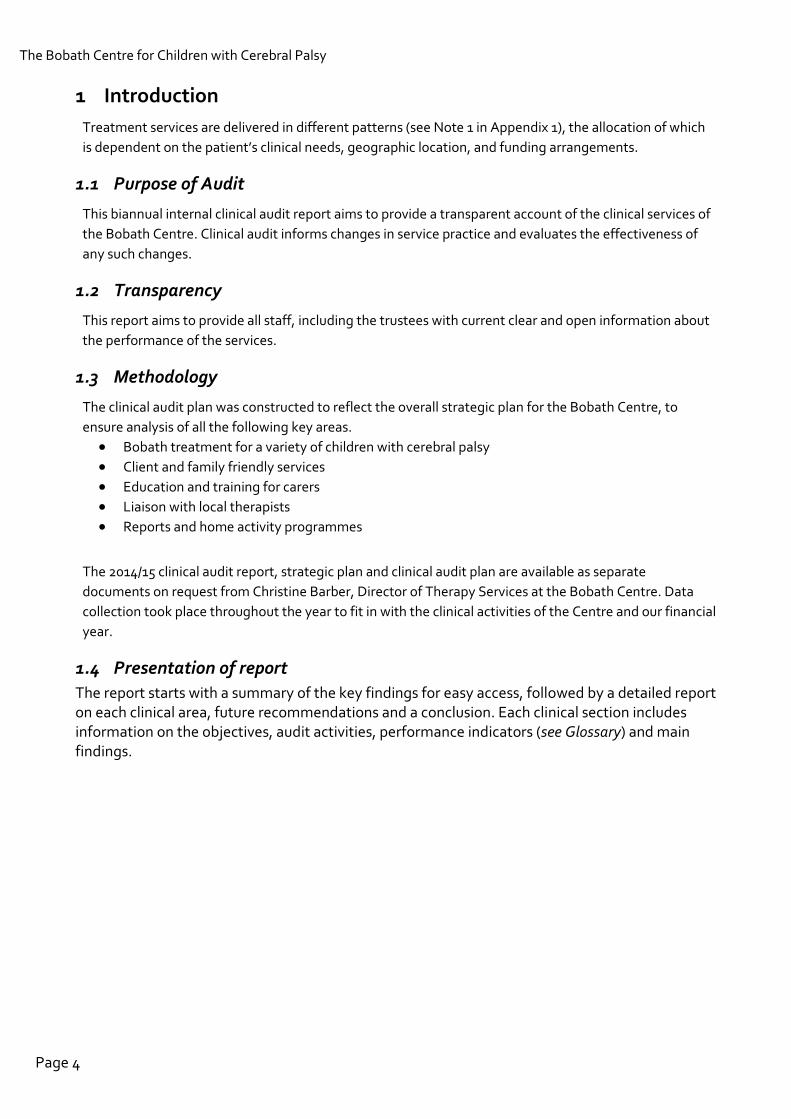
The Measure of Processes of Care (see Notes section for more information on this measure) was distributed to all occasional paediatric patients attending from mid-July to the end of August 2014 (n=12). Ten forms (out of a possible 12 patients) were distributed and 10 returned (100%) in 2014.
The scale scores have only changed by a small degree and not significantly (> 1 standard deviation from the previous year’s scores) with all showing a slight increase. Overall the mean of all scaled scores increased from 5.10 last year to 5.93 this year (scale from 1=not at all to 7= to a very great extent). All but 4 items went up slightly in score from last year. The items showing the greatest increase in score (>1.5)
The Bobath Centre for Children with Cerebral Palsy
Page 22
were: ‘fully explain treatment choices to you’ and ‘Let you choose when to receive information & the type of information you want’.
Table 6 – Occasional patients: MPOC Category Scaled scores and Descriptive statistics
Category
2014-15 Scaled Scores SD Min Max Range Median
2013-14
Scaled scores
Respectful & supportive care 6.22 1.27 3 7 4 6 5.57
Coordinated & comprehensive care 6.03 1.34 3 7 4 6 5.33
Enabling and Partnership 6.20 1.76 1 7 6 6 4.66
Specific information 5.61 2.12 1 7 6 6 5.61
General information 5.58 1.22 3 7 4 5 4.34
Mean of Scaled scores 5.93 5.10
(Excluding not applicable scores)
Data can be analysed to look for those behaviours occurring between ‘never’ and ‘to a moderate extent’ (scores 1-4). The only item where >50% of responders reported the item as occurring between ‘never’ and ‘sometimes’ was item 20: ‘Provide advice on how to get information or contact other parents, e.g. organization's parent resource library’
See Appendix for more detailed analysis and further tables.
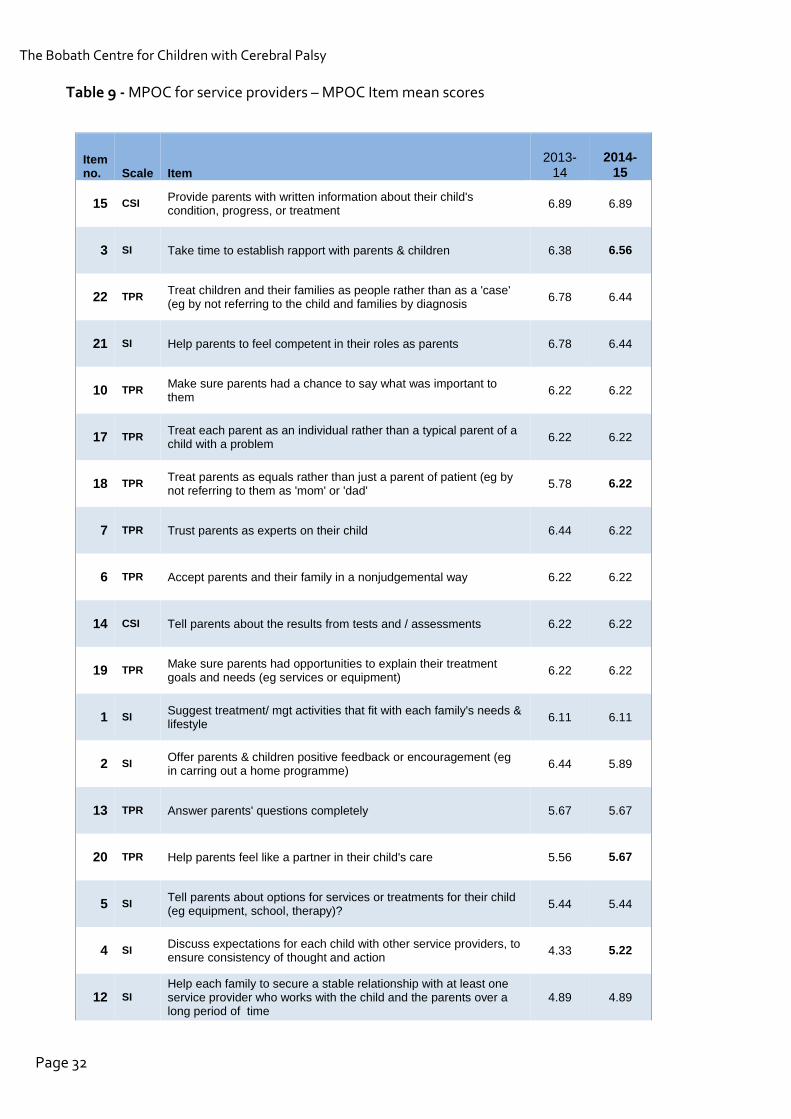
4.3 Measures of processes of care for service providers (MPOC-SP)
The Measure of Processes of care for Service Providers was distributed to all nine paediatric therapists during a four week period in September 2014 (n=9).
Mean Scale Scores
The highest scores were for providing respectful care, showing interpersonal sensitivity communicating and providing specific information. Providing general information received a lower score, similar to the parent MPOC results. Changes in score in relation to last year’s scores were not statistically significant and within 1 standard deviation of last year’s scores.

Clinical Audit Report 2015
Page 23
Table 7 – MPOC-SP: Category Scaled scores and Descriptive statistics
Categories
2014-15
Scaled Scores SD Min Max Range Median
2013-14 Scaled Scores
Showing interpersonal sensitivity 5.34 1.23 2 7 5 5.5 5.29
Providing General Information 3.64 1.67 1 7 6 3 3.58
Communicating specific information 5.93 1.36 2 7 5 6 5.92
Providing respectful care 6.12 0.8 4 7 3 6 6.16
See Appendix for more detailed analysis and further tables.
Key findings
Parents remain very satisfied with the therapy at the Bobath Centre and consider the service to be family friendly as evaluated on the Measure of Processes of Care. Although therapists have been very consistent in providing a draft home programme on the last day of the visit, reports are being sent out much later reflecting the smaller number of staff carrying more responsibility. This was most acute during the summer months in our busiest period.
Recommendations
Remind therapists about the three week target for reports, but also discuss how additional administrative sessions can be included in our busiest times of treatment for catching up on report writing.

The Bobath Centre for Children with Cerebral Palsy
Page 24
5 Recommendations
Variety of children attending for therapy
To attract patients across all age groups, classifications and GMFCS levels
Goals & Outcome Measures
Continue with GAS goal training sessions intermittently throughout the year as this proved a very successful strategy this year and it was received positively by therapists.
Endeavour to increase the use of Outcome measures through ongoing individual training in a similar style to the GAS sessions and provide tutorials on a range of Outcome measures.
Liaising with Local Community Therapists
Therapists to be reminded to always invite local therapists to try out activities if they would like and within the constraints of the treatment session give as much opportunity for discussion as is possible and/or offer to follow up with a telephone discussion.
Community therapists find their visits to the Bobath Centre beneficial, however most of them are from the south east area and not further afield. This may be due to time/cost restraints. It does not seem necessary to continue to monitor the geography of our visiting therapists as realistically we are always going to have the majority from the local area.
Therapy Provision
Ensure if more than one area of concern identified parents are phoned to assess main concern
When a child’s therapy provision is left open due to various factors e.g. complexity, then create flexibility in scheduling system to provisionally book possible slots with alternative disciplines. Telephone the family approximately 4 weeks before treatment block to update if necessary.
Parent feedback
Remind therapists about the three week target for sending out reports
Discuss also how additional administrative sessions can be included in our busiest times of treatment for catching up on report writing.

Clinical Audit Report 2015
Page 25
6 Conclusion Bi-annual clinical audit for 2013-15 demonstrates that the quality of service offered at the Bobath Centre remains high and there have been some specific improvements in clinical services.
Successes include that a very high percentage of children receive the appropriate mix of therapies and there has been a substantial increase in GAS goals set.
All children had at least one goal set in therapy and they are achieving the majority of goals set. Where they are used, higher scores in outcome measures are achieved after therapy, demonstrating the effectiveness of the treatment.
Areas where the Bobath Centre recognises it wants to make improvements include • increasing the frequency of use of outcome measures and • more prompt sending out of reports.

The Bobath Centre for Children with Cerebral Palsy
Page 26
7 Service Delivery Terminology
7.1 Treatment Services
‘Occasional’ therapy
Delivered in two-week intensive therapy blocks (90 minute daily appointments). Children typically attend once or twice per year. All patients have a key Bobath Centre therapist and may have one or two additional therapists of other professions to ensure all their needs are addressed.
‘Regular’ therapy
For children who live within reasonable travelling distance of the Bobath Centre, and attend the Bobath Centre either weekly, fortnightly or at a different frequency but on a regular basis throughout the year, or in long blocks. Appointments are either 45 or 90 minutes.
Helping Hand scheme
Blocks of 12 single or 6 double therapy sessions arranged within 6-12 week periods, at a subsidised rate for parents who are self funding.
Single Consultation
Appointments to address a specific issue. Some of these patients will then progress to occasional or regular therapy.
7.2 Bobath Therapy
Definition of Bobath Therapy
Bobath therapy is a problem solving neurodevelopmental approach for the assessment and treatment of individuals with cerebral palsy and other allied neurological conditions. It addresses the problems that occur as a result of impairment of the developing central nervous system that affects the individual’s sensory-motor, cognitive, perceptual, social and emotional development
It recognises that all clients with neurodisability have potential for enhanced function, emphasises a realistic approach, i.e. what is necessary for the person, and/or possible for the person to achieve, addresses the changing needs of the child with cerebral palsy as the lesion has occurred in an immature and still developing central nervous system, and in all treatment, emphasises the need for the person’s own activity.
How is Bobath therapy applied?
Therapy starts with individual assessment and analysis of how the child is currently participating in daily life, how the quality of their movement may affect future skills and what factors are limiting the child developing new skills. An individual treatment programme is developed to enhance and develop new functional skills. Specialised handling techniques are used which influence abnormal postural tone to more normal levels, and guide the child to move in more normal ways. The child is given experience and practice of more normal patterns of coordination in selected tasks to promote transfer of skills into daily life. The aim is always to involve active participation by the child, with gradual reduction in assistance. The approach anticipates possible future contracture and deformity and works to avoid or minimise these. Training is given to parents to carry out home activities and be empowered to know how best to carry out activities of daily living such as dressing, eating and drinking.

Clinical Audit Report 2015
Page 27
8 Glossary of Terms
Cerebral palsy (CP) a persistent but not unchanging impairment of posture and movement resulting from a non-progressive brain disorder due to hereditary factors, events during pregnancy, delivery, the neonatal period or the first two years of life. (Brett 1992)
Ataxia lack of balance and jerky quality of movements typically caused by damage to the cerebellum. Some children with cerebral palsy have ataxia
Athetosis unwanted involuntary movements which the child cannot control. Tone can fluctuate from low (floppy) to high (stiff). Some children with cerebral palsy have athetosis
Bilateral spasticity body affected all over, the arms or legs may be more affected. A term often used in research or registers of the frequency of different types of cerebral palsy and includes children with diplegia and quadriplegia
Choreoathetosis a type of athetosis where the child has unwanted involuntary movements resulting in tone changing between too low (floppy) and too high (stiff) which have a writhing quality and alternate between positions, e.g. knee bending then straightening
Clinical Audit a process which aims to improve quality of patient care and outcomes through a formal review of care against explicit criteria or standards and then implementing changes to care
Contracture tightness of muscles and joints which may be permanent or appear fixed, producing a limitation of joint movement.
Deformity body or limbs fixed in an abnormal position, e.g. hip dislocation, scoliosis (spine bending to one side), kyphosis (rounded upper back)
Dyskinetic disordered movement, a term which is often used as an umbrella for all children with cerebral palsy who have some form of athetosis
Dystonic athetosis a type of athetosis where sudden increases in tone occur (dystonic spasms), which may temporarily fix the child in distorted postures. The same postures are often repeated
Diplegia body affected all over, but legs more than arms
Goals specific objectives set in treatment with one aimed for outcome
Goal attainment scaling (GAS)
individual goals set for a child with a scale of five possible outcomes. Zero is the desired outcome, but if the child performs better than expected, they may achieve a score of +1 or +2, and if they do not quite achieve the hoped for outcome but still improve they may achieve a -2 or -1

The Bobath Centre for Children with Cerebral Palsy
Page 28
Gross Motor Function Classification System (GMFCS)
this classifies children with cerebral palsy aged 0-18 years into five levels according to age and their level of independent mobility. For example, a child in level I would and run with some limitations on uneven surfaces, whereas a child in level III would need a walking frame or other aids to walk and might use a wheelchair for longer distances, and a child in level V might only be able to roll on the floor and for mobility would need a powered wheelchair or to be pushed in a wheelchair
Hemiplegia whole of one side of the body affected (unilateral spasticity)
Hypotonia when parts or all of the body feel very loose and floppy. They can be moved in greater ranges than expected
Hypertonia when parts or all of the body feel stiff. Movement is limited in the affected parts
Involuntary movements
unintentional and unpredictable movements generated by the central nervous system
Manual Ability Classification System (MACS)
this classifies children with cerebral palsy aged 4-18 yrs according to their level of independent hand function. For example, a child in level I would handle objects easily and only have limitations in speed or accuracy whereas a child in level V would have severely limited ability to handle any objects and require total assistance
Measure of Processes of Care (MPOC)
is a standardised outcome measure which aims to identify parents’ perceptions of the extent to which certain health professionals’ behaviour occurs within childhood rehabilitation services, which are considered to represent important aspects of delivering a family-centred service. For more information, see Appendix
SMART a mnemonic denoting a description of a goal: Specific, Measurable, Achievable, Realistic and Timed
Outcome measure a test or scale used to measure progress before and after therapy which has been shown to measure accurately a particular attribute of interest to patients and therapists, e.g. the Assisting Hand Assessment which measures how much and how well a child uses their assisting (non-dominant) hand
Performance Indicators performance indicators help organisations understand how well they are performing in relation to their goals and objectives. They are quantifiable measurements, agreed to beforehand, by which the performance, efficiency, achievement, etc. of an organisation can be assessed, in comparison with an agreed standard or target
Postural tone state of readiness of muscles to do work which can be seen and felt as some tension within the muscles at rest. This allows you to maintain an upright position (against gravity)
Posture the arrangement of the body and limbs creating a position and state of readiness from which you can move
Clinical Audit Report 2015
Page 29
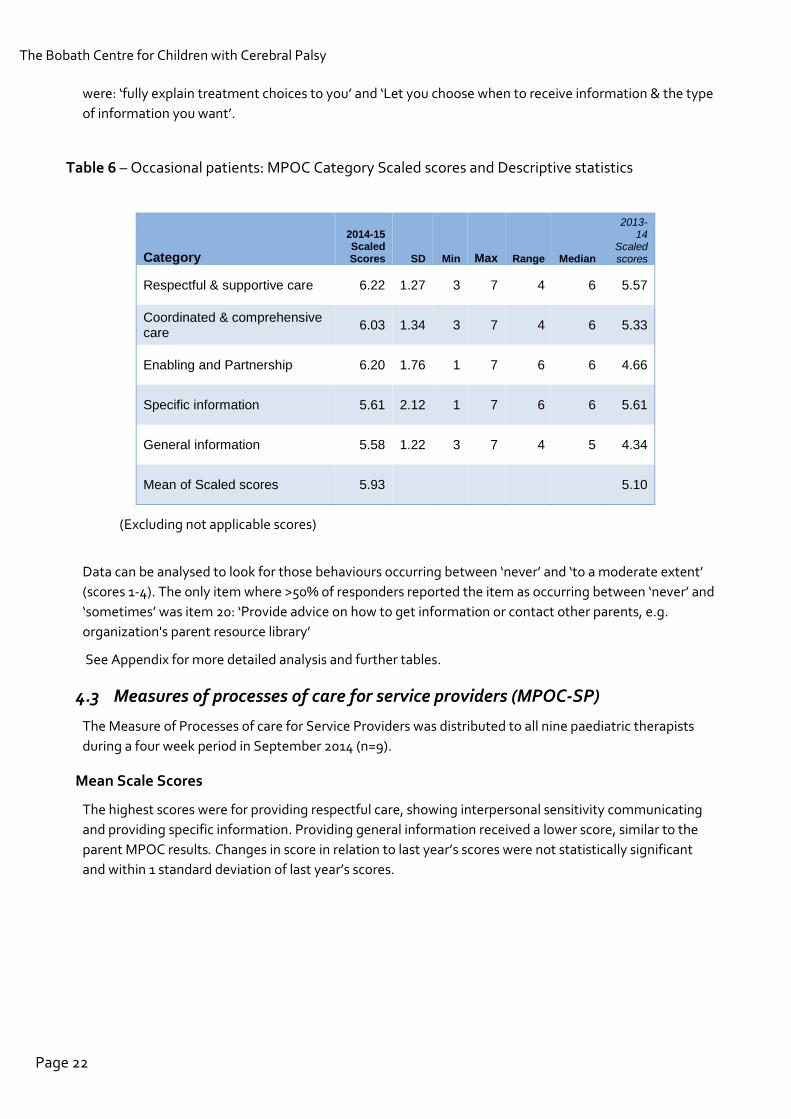
Quadriplegia total body involvement, with the arms usually more or equally involved as the legs and child has difficulty using the arms reliably for support
Spastic hypertonus damage to the brain (central nervous system), results in abnormally increased activity within muscles and a decrease in the messages from the brain which would normally reduce muscle activity to appropriate levels. Changes also take place within the muscles making them less elastic and shorter over time. These both lead to increased tone (stiffness) in muscles making movement limited or impossible
Stroke in children a blood clot or bleed in one side of the brain usually leading to hemiplegia. This can occur in a baby just before or after birth, or in childhood
Traumatic brain injury an injury caused to the brain after birth caused by trauma to the head. It can have many causes such as falls, road traffic accidents, a blow to the head and results in damage which may affect physical or cognitive function
Unilateral spasticity whole of one side of the body affected (hemiplegia). The term unilateral spasticity is often used in research or studies of the frequency of cerebral palsy

The Bobath Centre for Children with Cerebral Palsy
Page 30
9 Appendix Measure of Processes of Care (MPOC) & Measure of Processes of Care for Service Providers (MPOC-SP)
Measure of Processes of Care (MPOC)
The Measure of Processes of Care is a standardised outcome measure which aims to identify parents’ perceptions of the extent to which certain health professionals’ behaviour occurs within childhood rehabilitation services, which are considered to represent important aspects of delivering a family-centred service. Twenty items are scored on a seven point scale from 1 = does not happen at all to 7 = happens to a very great extent. Participants can also score 0 for not applicable. Items are arranged in five scales:
• Respect and support • Coordinated and comprehensive • General information • Specific information • Enabling and partnership
Raw scores for each scale are converted to scale scores by calculating a mean score from all participants’ data (omitting ‘not applicable’ scores). The range and standard deviation of these scores can be calculated. Individual item scores are also converted to mean scores so these can be analysed.
Measure of Processes of care for Service Providers (MPOC-SP)
The Measure of Processes of Care for Service Providers aims to identify service providers’ perceptions of the extent to which behaviours occur within their delivery of childhood rehabilitation services, which are considered to represent important aspects of delivering a family-centred service. Items are scored on a seven point scale from 1 = does not happen at all to 7 = happens to a very great extent. Participants can also score 0 for not applicable. Items are arranged in four scales:
• Showing interpersonal sensitivity • Providing General Information • Communicating specific information • Providing respectful care

Clinical Audit Report 2015
Page 31
MPOC tables: occasional patients & service providers
Table 8 - Occasional Patients - MPOC Item mean scores
Item Category 2013-
14 2014-
15
13 RS Treat you as an individual rather than as a typical parent of a child with a disability 5.75 6.33
1 RS Help you feel competent as a parent 5.09 6.33
11 RS Treat you as an equal, rather than just the parent of a patient 5.83 6.30
8 EP Provide opportunities for you to make decisions about treatment 4.89 6.30
7 EP Fully explain treatment choices to you 4.70 6.30
7 EP Fully explain treatment choices to you 4.70 6.30
10 CC Plan together so they are all working in the same direction 5.33 6.20
12 CC Give you information about your child that is consistent from person to person 6.36 6.10
9 RS Provide enough time to talk so you don't feel rushed 5.36 6.10
3 RS Provide a caring atmosphere rather than just give you information 5.75 6.10
5 CC Look at the needs of your whole child, e.g. mental, emotional, social, not just physical 5.27 6.00
4 EP Let you choose when to receive information & the type of information you want 4.40 6.00
6 CC Make sure that at least one team member is someone who works with you & your family over a long period of time 5.11 5.80
2 SI Provide you with written information about what your child is doing in therapy 5.44 5.70
17 GI Have information available about your child's disability (e.g. its causes, how it progresses, future outlook) 4.56 5.60
18 GI Provide opportunities for the entire family to obtain information 4.00 5.44
16 GI Give you information about the types of services offered by your organization/your community 4.13 5.40
15 SI Tell you about the results from assessments 5.73 5.40
14 SI Provide you with written information about your child's progress 6.27 4.60
19 GI Have information available to you in various forms, such as a booklet, kit, video 3.67 4.50
20 GI Provide advice on how to get information or contact other parents, e.g. organization's parent resource library 4.38 4.30
Values in bold show improved scores compared with last year
The Bobath Centre for Children with Cerebral Palsy
Page 32
Table 9 - MPOC for service providers – MPOC Item mean scores
Item no. Scale Item
2013-14
2014-15
15 CSI Provide parents with written information about their child's condition, progress, or treatment 6.89 6.89
3 SI Take time to establish rapport with parents & children 6.38 6.56
22 TPR Treat children and their families as people rather than as a 'case' (eg by not referring to the child and families by diagnosis 6.78 6.44
21 SI Help parents to feel competent in their roles as parents 6.78 6.44
10 TPR Make sure parents had a chance to say what was important to them 6.22 6.22
17 TPR Treat each parent as an individual rather than a typical parent of a child with a problem 6.22 6.22
18 TPR Treat parents as equals rather than just a parent of patient (eg by not referring to them as 'mom' or 'dad' 5.78 6.22
7 TPR Trust parents as experts on their child 6.44 6.22
6 TPR Accept parents and their family in a nonjudgemental way 6.22 6.22
14 CSI Tell parents about the results from tests and / assessments 6.22 6.22
19 TPR Make sure parents had opportunities to explain their treatment goals and needs (eg services or equipment) 6.22 6.22
1 SI Suggest treatment/ mgt activities that fit with each family's needs & lifestyle 6.11 6.11
2 SI Offer parents & children positive feedback or encouragement (eg in carring out a home programme) 6.44 5.89
13 TPR Answer parents' questions completely 5.67 5.67
20 TPR Help parents feel like a partner in their child's care 5.56 5.67
5 SI Tell parents about options for services or treatments for their child (eg equipment, school, therapy)? 5.44 5.44
4 SI Discuss expectations for each child with other service providers, to ensure consistency of thought and action 4.33 5.22
12 SI Help each family to secure a stable relationship with at least one service provider who works with the child and the parents over a long period of time
4.89 4.89

Clinical Audit Report 2015
Page 33
16 CSI Tell parents details about their child's services, such as types , reasons for, management 4.67 4.67
9 SI Anticipate parent's concerns by offering information even before they ask 4.44 4.44
8 SI Discuss/explore each family's feelings about having a child with special needs (eg their worries about their child's health or function)
4.33 4.33
11 SI Let parents choose when to receive information and the type of information they wanted 4.22 4.22
24 PGI Provide support to help families cope with the impact of their child's chronic condition 3.89 4.11
25 PGI Provide advice on how to get information or to contact other parents 3.89 3.89
26 PGI Provide opportunities for the entire family, including siblings, to obtain information 3.78 3.78
23 PGI Promote family to family 'connections' for social, informational or shared experiences 3.67 3.78
27 PGI Have general info available about different concerns 2.67 2.67
Values in bold show improved scores compared with last year
Table 10 - Item score comparison for MPOC-SP and MPOC for occasional patients
MPOC-SP Item No.
MPOC items for Service providers MPOC-
SP Scaled scores
MPOC-20
Scaled scores
MPOC-20 Item
No.
15 Provide parents with written information about their child’s condition, progress or treatment 6.89 6.35 Ave of
2 & 14
3 Take the time to establish a rapport with parents and children 6.56 6.10 3
14 Tell parents about the results of tests and assessments 6.22 5.40 15
20 Help parents feel like a partner in their child’s care 5.67 6.30 11
10 Make sure parents had a chance to say what was important to them 6.22 6.10 9
7 Trust parents as the ‘experts’ on their child 6.22 6.30 8

The Bobath Centre for Children with Cerebral Palsy
Page 34
10 Bibliography SCPE (2002). "Prevalence and characteristics of children with cerebral palsy in Europe." Developmental Medicine and Child Neurology 44: 633-640. Westbon, L., G. Hagglund, et al. (2007). "Cerebral palsy in a total population of 4-11 year olds in southern Sweden. Prevalence and distribution according to different CP classification systems." BMC Pediatrics 7(41).