Embed Size (px)
Citation preview
CONTENT DELIVERY IN THEMOBILE INTERNET
Edited by
Editor’s Name
A Wiley-Interscience Publication
JOHN WILEY & SONS
New York � Chichester � Weinheim � Brisbane � Singapore � Toronto

Contents
1 Characterizing Web Workload for Mobile Clients 1Atul Adya, Paramvir Bahl, Lili Qiu
1.1 Overview of Web Workload Characterization 2
1.2 Overview of Previous Work 3
1.3 Server Architecture and Data Gathering 8
1.4 Characterizing Web Browsing Workload 11
1.5 Characterizing Notification Workload 27
1.6 Correlation between Web Browsing and Notification 37
1.7 Comparison between Workload of Wireline Web and Mobile Web 40
1.8 Summary 42
References 43
Index 46
1 Characterizing Web Workload ofMobile Clients
Atul Adya, Paramvir Bahl, Lili Qiu
Microsoft ResearchRedmond, Washington
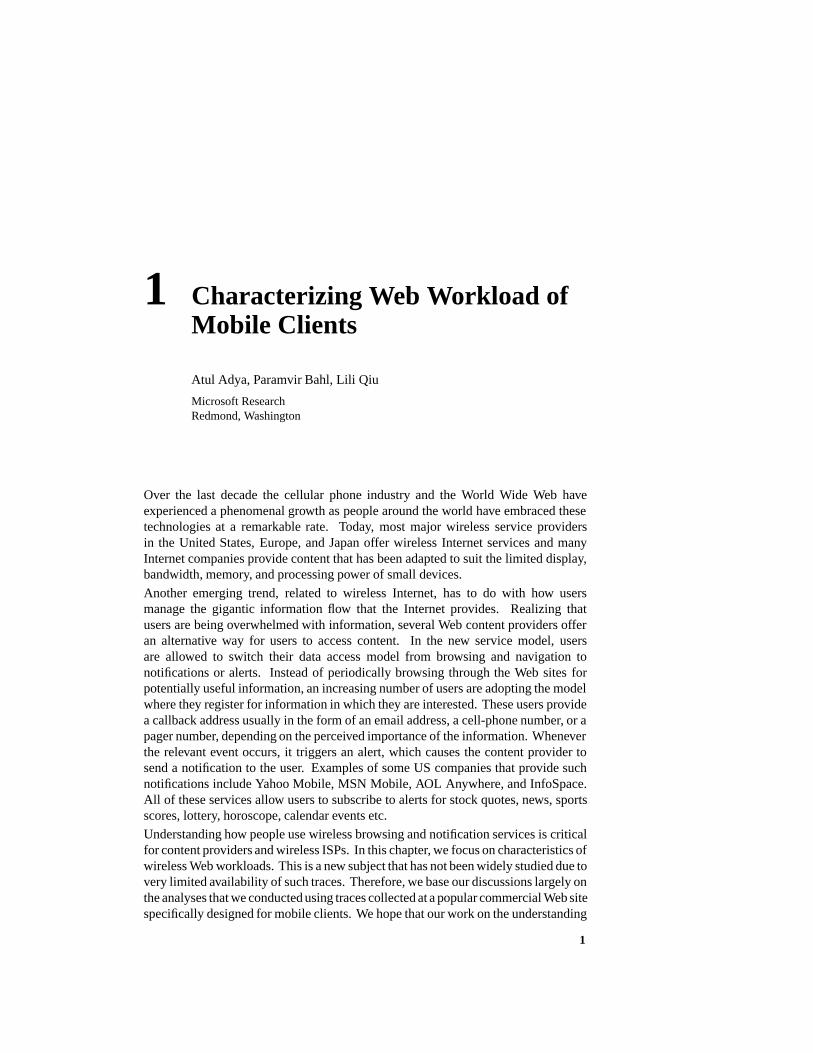
Over the last decade the cellular phone industry and the World Wide Web haveexperienced a phenomenal growth as people around the world have embraced thesetechnologies at a remarkable rate. Today, most major wireless service providersin the United States, Europe, and Japan offer wireless Internet services and manyInternet companies provide content that has been adapted to suit the limited display,bandwidth, memory, and processing power of small devices.
Another emerging trend, related to wireless Internet, has to do with how usersmanage the gigantic information flow that the Internet provides. Realizing thatusers are being overwhelmed with information, several Web content providers offeran alternative way for users to access content. In the new service model, usersare allowed to switch their data access model from browsing and navigation tonotifications or alerts. Instead of periodically browsing through the Web sites forpotentially useful information, an increasing number of users are adopting the modelwhere they register for information in which they are interested. These users providea callback address usually in the form of an email address, a cell-phone number, or apager number, depending on the perceived importance of the information. Wheneverthe relevant event occurs, it triggers an alert, which causes the content provider tosend a notification to the user. Examples of some US companies that provide suchnotifications include Yahoo Mobile, MSN Mobile, AOL Anywhere, and InfoSpace.All of these services allow users to subscribe to alerts for stock quotes, news, sportsscores, lottery, horoscope, calendar events etc.
Understanding how people use wireless browsing and notification services is criticalfor content providers and wireless ISPs. In this chapter, we focus on characteristics ofwireless Web workloads. This is a new subject that has not been widely studied due tovery limited availability of such traces. Therefore, we base our discussions largely onthe analyses that we conducted using traces collected at a popular commercial Web sitespecifically designed for mobile clients. We hope that our work on the understanding
1
2 CHARACTERIZING WEB WORKLOAD FOR MOBILE CLIENTS
of the dynamics of wireless Web is just a beginning, and other researchers will stepforward to provide more data points to enhance the knowledge about this importantresearch topic.
The organization of this chapter is as follows. In Section 1.1, we motivate theneed to understand user workloads, and describe a set of workload analyses. Wereview previous studies on wireline and wireless user access patterns in Section 1.2.Sections 1.3 through 1.6 present detailed analyses of the browse and notificationworkload observed at a commercial Web site. We include a summary of findings andimplications at the end of each section so that readers can get a quick overview of theresults. Finally we compare wireless and wireline user workload in Section 1.7, andsummarize the chapter in Section 1.8.
1.1 OVERVIEW OF WEB WORKLOAD CHARACTERIZATION
In this section, we motivate the need for understanding Web workload, and describea set of workload analyses.
1.1.1 Motivation for Workload Characterization
Characteristics of user workloads have significant implications on Web site design,content management, protocol design, and capacity planning.
For content providers, who are interested in attracting users to visit their Web site,understanding user workloads provides insight into how to enhance user experiencethrough more effective design and management of content. For example, answers tothe following questions are important to the content providers:
� How do users come to visit the Web site?
� Why do users leave the Web site? Is poor performance the cause for this?
� Where is the performance bottleneck? Is it at the server or at the network?
� What content are users interested in?
� How do users’ interests vary in time?
� How do users’ interests vary across different geographical regions?
Wireless service providers can also benefit from workload information for efficientresource allocation, capacity planning, and pricing. For example, a wireless serviceprovider can utilize information about loads imposed by different users for designingeffective pricing plans, and providing service differentiation.
Furthermore, for system designers, knowledge about workloads can shed light onpossible performance bottlenecks and the effectiveness of existing protocols. Forinstance, if users’ requests are stable and concentrated on a few popular pages, thencaching can be very effective.

OVERVIEW OF PREVIOUS WORK 3
1.1.2 Types of Analyses
We now discuss different types of workload analyses typically performed on the Webtraces.
1. Content analysis: This analysis reveals properties of Web content, such ascontent size, popularity, modification frequency. Such information is impor-tant to content providers who need to provide fast access to popular contentwhile using the system and network resources efficiently. Moreover, contentpopularity has significant implication on the effectiveness of Web caching andmulticast delivery.
2. User-behavior analysis: Analyzing user behavior is useful for personalization,targeted advertising, prioritizing, and capacity planning. Specifically, thefollowing aspects of user behavior are particularly interesting:
� User Load Distribution: the variation in load placed by different userson the Web site.
� Session duration: the duration of a sequence of interactions initiated bya user to a Web site.
� Temporal Stability: whether users are interested in requesting similardocuments over time.
� Spatial Locality: whether users in the same geographical region tend torequest similar content.
3. System load analysis: Analyzing system load helps us understand the tempo-ral variation of system load and sheds light on how to effectively architect andoptimize systems.
1.2 OVERVIEW OF PREVIOUS WORK
There have been a number of studies on characterizing user access patterns. Theycan be classified into two general categories: (i) studies on wireline users’ accesspatterns, and (ii) studies on wireless users’ access patterns. In this section, we reviewthe work in both areas.
1.2.1 Wireline User Workload Characterization
Most of the previous studies on workload characterization have focused on thebrowsing patterns of wireline clients. This is not surprising since Web access throughwireless service providers has become feasible and gained momentum only recently.Furthermore, since the wireline Web is accessed essentially through browsing (asopposed to notifications/alerts), the correspondinganalyses have focused on browsingpatterns only.
4 CHARACTERIZING WEB WORKLOAD FOR MOBILE CLIENTS
Previous work on wireline user workloads has analyzed Web traces collected at Webproxies, Web browsers, and Web servers, each providing a unique perspective on thefunctioning of the Web. Below we give a brief overview classified according to thetypes of analyses performed on the Web traces. The book [20] gives an in-depthsurvey of the measurement and analysis of wireline Web user workloads.
1.2.1.1 Content Analysis Previous work characterizes Web content by its type,size, popularity, and modification. We discuss each of these characteristics below.
Content Types: Web sites offer a wide variety of content, ranging from pure text filesto graphics rich multimedia files. Several studies [3, 4, 31] show that the majority ofcontent served by Web servers is comprised of text and image files. Of course, theexact combination of content types varies across Web sites, and is likely to changewith new applications.
Content Size: There are two definitions of content size. In the first definition, contentsize refers to the size of all content residing on a Web server; in the second definition,content size refers to the size of the content that is transferred by a Web server. Itis easy to see these two are not equivalent, since some files on a Web server may betransferred multiple times, or not transferred in completion, or not transferred at all.As reported in [7, 22], the median transfer size is around 2 KB, and the median Webcontent is a few hundred bytes larger.
Interestingly, several studies [4, 7, 11, 22] show that the distribution of content sizein both definitions exhibit a heavy tail, which indicates that there is a non-negligiblefraction of files that are very large. Moreover [8] shows that the body of content sizedistribution can be captured by a log-normal distribution. Therefore the combinationof log-normal and heavy tail distributions captures the full range of Web content size,with the former modeling the body, and the latter modeling the tail.
Content Popularity: The relative popularity of Web content has been studied exten-sively. The almost universal consensus is that content popularity follows a Zipf-likedistribution where the popularity of the �th most popular file is proportional to 1/� �.The value of � depends on where the traces were collected. The estimates of � rangefrom 0.5 to 1 in the Web proxy logs [9, 14, 24] and Web client logs [7, 12]; andrange from 1 to 2 in the Web server logs [4, 26]. A larger � implies that accesses aremore concentrated on a small set of popular documents. For example, a proxy-basedtrace study [9] reports that 25-40% of pages account for 70% of the client accesses.In comparison, studies based on Web server traces [4, 26] show that 10% or fewerpages cover 90% of the client accesses.
Content Modification Pattern: The work by Douglis et al. [13] uses proxy logscollected at Digital and AT&T to evaluate the rate of change and age distributionof Web content. They find that Web content exhibits a large variation in theirmodification patterns: lots of content was never modified, others were modifiedoften, and a significant fraction were modified at least once between two consecutiveaccesses. Moreover, they show that the rate at which content changes depends onthe content type and the top-level domains that the content belongs to. A limitation
OVERVIEW OF PREVIOUS WORK 5
of their study is that they infer the number of updates indirectly based on the last-modified timestamp, which could result in under-estimating the number of updates.
In [26], Padmanabhan and Qiu analyze the file modification logs obtained directlyfrom the MSNBC back-end site. They find that the content at the news server tendsto be highly dynamic with thousands of files modified and created over a one-weekperiod. Moreover, a file’s past modification interval, if averaged over a sufficientnumber of samples, gives a rough prediction about its future modification time.Furthermore, they show that most file modifications are small, which suggests thatdelta encoding could be quite useful for the news site under study.
1.2.1.2 User-behavior Analysis User Request Arrival & Duration: As de-scribed in [20], Web users’ workload occur at three levels: session, click, and request.A user’s session consists of a consecutive series of requests from a user to a Web site.During a session, the user may generate one or more clicks, where each click resultsin one or more HTTP requests, with the first request fetching the top-level documentand the subsequent requests fetching the embedded objects.
The amount of load imposed on the Web server by different users varies widely.Some users generate only a few requests during a session, while others generate a lotmore requests [22].
As shown in [20], many user workload characteristics exhibit heavy tails. Forexample, the number of clicks in a session, the number of embedded images in aWeb page, think time (i.e., time between two consecutive clicks), and active time(i.e., time to download a Web page and its embedded images) can all be modeled byPareto distributions [27] with heavy tails.
Temporal Locality & Stability: There are several ways to measure temporal locality,i.e., if a page is accessed now, what is the likelihood that it will be accessed againin the near future. One common measure is to look at users’ request sequence, anddetermine how soon a file will be requested again. This can be measured by Least-Recent-Used (LRU) stack distance, as done in [2]. A smaller stack distance suggestsa stronger temporal locality, which in turn implies that caching could be effective.As shown in [4], the temporal stability varies across different Web sites. Moreoverclient-side caching may reduce the temporal locality seen at a Web server.
Temporal stability is another important metric, and has significant implication on theeffectiveness of caching. In the MSNBC server trace study [26], the authors studythe ranking stability of Web pages, i.e., whether popular documents stay popular overtime. They find that the stability is reasonably high on the scale of days. The rankingtends to change only gradually over time.
Spatial Locality: Spatial locality is another interesting characteristic. It captures howlikely people in the same geographical location or at the same organization requestsimilar set of documents. This kind of spatial locality has obvious implications onperformance, particularly with respect to the effectiveness of proxy caching.
Wolman et al. analyzed the proxy traces collected at University of Washington [31].They computed the degree of local sharing (i.e., intra-organization sharing) under the
6 CHARACTERIZING WEB WORKLOAD FOR MOBILE CLIENTS
following two situations: (i) when clients are assigned to the true organization theybelong to, where the organizations include academic and administrative departments,dormitories, and the university modem pool (true assignment), and (ii) when clientsare assigned to organizations randomly, while preserving the size of each organizationas before (random assignment). Based on their analysis, they concluded that theimpact of organization membership is significant, and clients belonging to the sameorganization are more likely to access the same documents than clients picked atrandom. On the other hand, most requests are directed to objects that are requestedby multiple organizations.
Padmanabhan et al. [26] apply the above analysis technique to the MSNBC servertraces. In contrast to [31], organizations in their study [26] are defined using Internetdomain names. They show that domain membership is significant in most cases, i.e.,clients belonging to the same domain are more likely to share requests than clientspicked at random. This is in agreement with the findings reported in [31] despite thefact that the domains used in [26] are much larger and more diverse than universityorganizations used in [31]. However, when there is a “hot” event, they observe theglobal interest can become so dominant that even clients picked at random tend toshare many requests, thereby diminishing the significance of domain membership.
1.2.1.3 System Load Analysis As one would expect,user load varies with time andrecent events. For example, the World Cup trace study [3] reports a high correlationbetween games and the number of user accesses.
In addition, several studies [4, 11, 17] show that Web traffic may exhibit self-similarcharacteristics, especially under a high load. Crovella et al. [11] explains that self-similar Web traffic comes from the heavy-tail distributed Web document sizes and userthink time, as well as the effects of caching and superposition of many such transfersin a local area network. In [17], the authors analyzed the 1998 Olympic Games Website, and concluded that burstiness, trends, interdependencies and seasonal effectscontribute heavily to the self-similar behavior found in the access logs.
1.2.2 Wireless User Workload Characterization
Web access through wireless networks is a relatively new phenomenon. As a result,its characteristics are less well understood than those of wireline access. Fortunatelya few recent studies have helped uncover interesting characteristics exhibited bywireless users. We now review these studies.
1.2.2.1 Analysis of WAP Traffic at Bell Mobility’s PCS. The work closest to thefocus of this chapter is [21] by Kunz et al.. In that work, the authors analyze WAPtraffic traces collected at Bell Mobility’s Personal Communication Services (PCS)network between June 1, 1999 and December 31, 1999. They observe that networktraffic exhibits daily and weekly variation, and self-similar characteristics. Moreover,they find that the activity factor for data generated by a mobile browser applicationis lower than the voice activity factor, where the activity factor is defined as the
OVERVIEW OF PREVIOUS WORK 7
percentage of time that data is transmitted when the channel is at full rate. Thissuggests it is possible to achieve a higher multiplexing gain. The main limitationof their work is the size of the data analyzed: only 80K entries were logged over aperiod of seven months. It is unclear whether the inferences drawn from this studyare applicable for large commercial sites.
1.2.2.2 Analysis of a Metropolitan-Area Wireless Network Tang et al. [29] an-alyze a seven-week trace (February 1, 1998 - March 23, 1998) of the Metricommetropolitan-area packet radio wireless network. This study is different from theanalysis in [21] and our analysis of wireless Web traces, since it focuses on how thenetworks are used. For example, their study analyzes when the networks are mostactive, how active the network is, and how often users move, etc. Some of the majorfindings in [29] include: usage behavior shows diurnal and weekly patterns; users donot move frequently; most users move within their local area and only a few userstravel long distances between different Metricom installations.
1.2.2.3 Wireless LAN Study The following five studies analyze 802.11b tracescollected at university campus, a conference, and a large corporation. In comparisonwith the WAP traffic study [21] and our work, which examine content and applicationspecific details, the following studies focus on overall network activity and usermobility.
Workload of the Computer Science Building at Stanford University: Tang etal. [30] analyzed a 12-week tcpdump and SNMP trace of a wireless LAN networkinstalled at the Computer Science Building of Stanford University. They find thatmany people use laptops for session-oriented activities (e.g., ssh, telnet) and chat-oriented activities (e.g., talk, icq, irc, zephyr). In most cases, incoming traffic exceedsoutgoing traffic, but the opposite is true when the network load is high.
Workload at Campus-Wide Wireless LAN at Dartmouth: Kotz et al. [19] tracedthe activity of nearly two thousand users using a campus-wide network of 476 accesspoints (APs) spread over 161 buildings on Dartmouth campus. Similar in flavor tothe previous study [30], the new study is unique for its size, population diversity, anddetail of trace information. Some of their interesting findings include (i) wirelesscards are extremely aggressive in associating with APs, which results in many shortsessions and a high degree of roaming within sessions; (ii) while there is daily andweekly usage pattern, there is a high variation in the activity across different buildings,access points, and network cards, both over time and across space.
Workload at Campus-Wide Wireless LAN at Georgia Tech: Hutchins et al. [16]presented an analysis of wireless traces collected at Georgia Tech campus, whichcontained 110 wireless access points placed for maximum coverage across 18 build-ings. They showed that users exhibit variability in movement. In addition, theyshowed that many user sessions and transport level flows are short, but there are afew that last much longer.
Workload of a Technical Conference: Balachandran et al. [5] analyzed the userbehavior and network performance of a wireless LAN using a workload captured
8 CHARACTERIZING WEB WORKLOAD FOR MOBILE CLIENTS
during a three day technical conference in August 2001. Their study focused oncharacterizing users for the purpose of coming up with a parameterized model todescribe them. Additionally, they carried out workload analysis to address thenetwork capacity planning problem. Their main observations are the following:(i) users are evenly distributed across all access points (APs) and user arrivals arecorrelated in time and space. This is a consequence of the conference setting; (ii) Weband SSH account for 64% of the application traffic bytes and 58% of the flows; (iii)most users have short sessions, e.g., 60% of the user sessions are less than 10 minutes;(iv) the bandwidth distribution across APs is highly uneven, and does not correlateto the number of users around an AP. Instead an AP’s load is mostly governed byindividual user workload.
Workload of a Large Corporate Environment: Balazinska et al. [6] complementedthe previous studies on a campus-wide wireless LAN by analyzing a four week tracegathered in a large corporate environment with 1366 users. Many of their analysisresults confirmed the findings reported earlier in [5, 19, 30]. For example, they alsoobserved that different users impose different loads on the network, and the load atan access point is more influenced by which users are present than by the numberof users. In addition, they modeled user mobility using persistence and prevalence,where the former reflects session durations while the latter reflects how often usersvisit various locations. Their results show that probability distribution of both metricsexhibit power laws.
1.3 SERVER ARCHITECTURE AND DATA GATHERING
Starting with this section, we describe our analysis of Web traces collected at apopular commercial Web site designed for mobile clients. Note that even though ourstudy is based on a single Web site, we believe that many of the basic results will holdfor other sites serving wireless users. We encourage others to publish their study onwireless Web workload characterization to compare and contrast their observationswith ours, and strengthen our understanding of user behavior for the wireless Web.
Before presenting analyses in detail, we first describe the architecture of the Webserver designed for wireless users, and how the data are gathered and analyzed.
1.3.1 Server Architecture
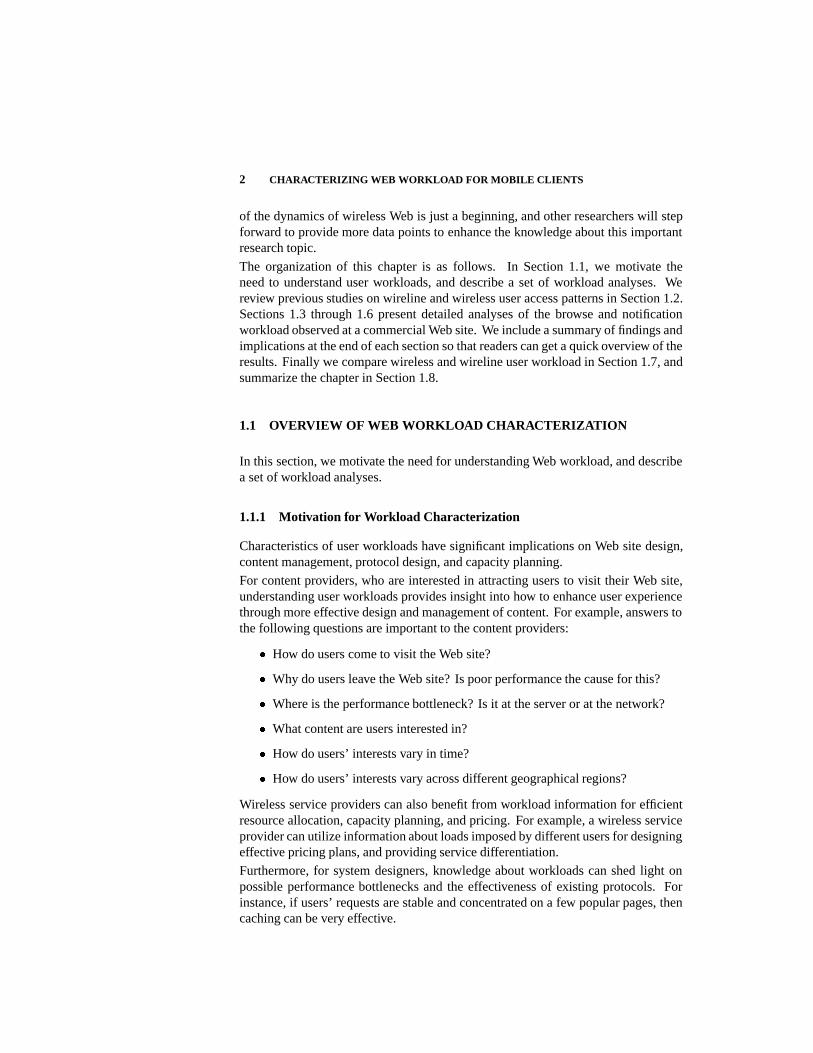
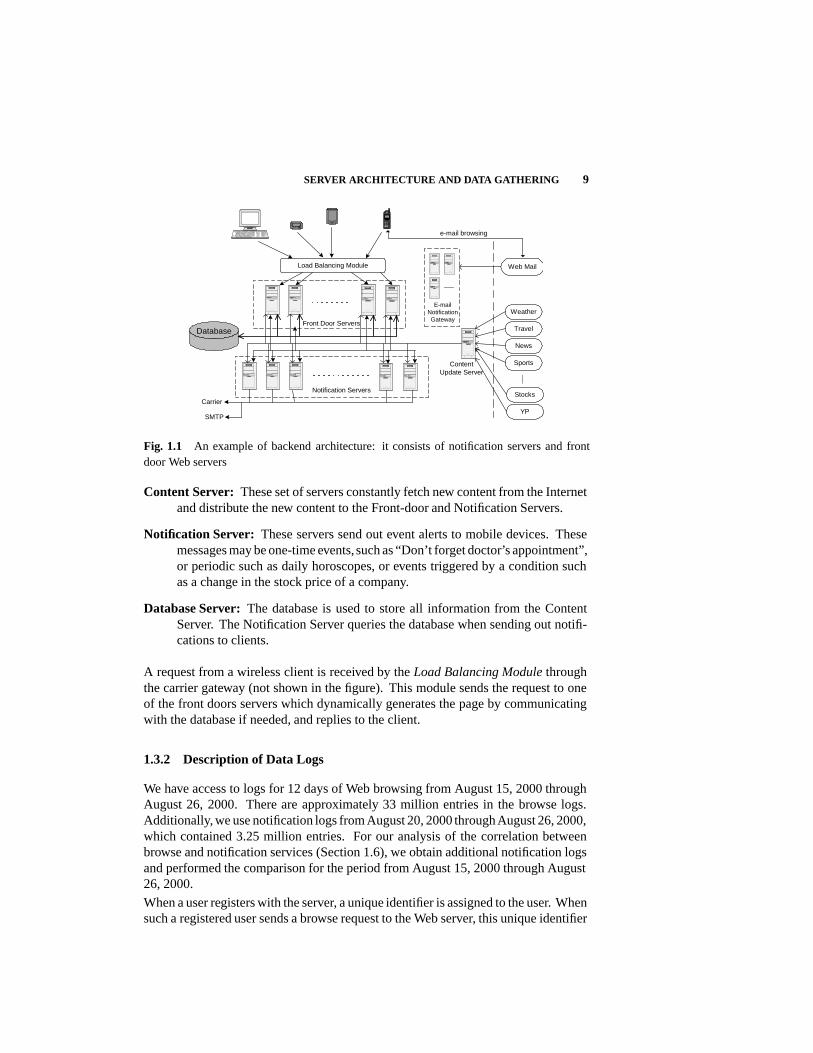
Figure 1.1 shows an example of Web server architecture for mobile users. It is madeup of the following components.
Front-door Server: A request from a Web browser is directed to one of theseservers using a standard redirector mechanism for load-balancing. Content isoptimized for small mobile devices such as cell phones and PDAs; however,the site may be accessed from desktop clients as well, e.g., for personalizationpurposes.
SERVER ARCHITECTURE AND DATA GATHERING 9
Load Balancing Module
Front Door Servers
E-mailNotificationGateway
Database
Notification Servers
Carrier
SMTP
ContentUpdate Server
Travel
News
Sports
Weather
Stocks
YP
Web Mail
e-mail browsing
Fig. 1.1 An example of backend architecture: it consists of notification servers and frontdoor Web servers
Content Server: These set of servers constantly fetch new content from the Internetand distribute the new content to the Front-door and Notification Servers.
Notification Server: These servers send out event alerts to mobile devices. Thesemessages may be one-time events, such as “Don’t forget doctor’s appointment”,or periodic such as daily horoscopes, or events triggered by a condition suchas a change in the stock price of a company.
Database Server: The database is used to store all information from the ContentServer. The Notification Server queries the database when sending out notifi-cations to clients.
A request from a wireless client is received by the Load Balancing Module throughthe carrier gateway (not shown in the figure). This module sends the request to oneof the front doors servers which dynamically generates the page by communicatingwith the database if needed, and replies to the client.
1.3.2 Description of Data Logs
We have access to logs for 12 days of Web browsing from August 15, 2000 throughAugust 26, 2000. There are approximately 33 million entries in the browse logs.Additionally, we use notification logs from August 20, 2000 through August 26, 2000,which contained 3.25 million entries. For our analysis of the correlation betweenbrowse and notification services (Section 1.6), we obtain additional notification logsand performed the comparison for the period from August 15, 2000 through August26, 2000.
When a user registers with the server, a unique identifier is assigned to the user. Whensuch a registered user sends a browse request to the Web server, this unique identifier
10 CHARACTERIZING WEB WORKLOAD FOR MOBILE CLIENTS
is also sent to the server and logged in the Web traces. For unregistered users, theidentifier field is empty. We use these identifiers to perform our user-based analysis.Each log record also contains other pieces of useful information such as date, time,type of browser, the URL accessed, the data received and sent by the server
When a notification message is sent, a record is created in a database. The recordcontains information about the server from which the notification message was sent,a user id, type of the device to which the message was sent (e.g., phone or pager),type of alert, and when it was sent.
1.3.3 Types of Accesses
For the Web site that we analyzed in this study, a single browse request results inexactly one HTTP request to the server. There are no images or other types of contentembedded in the page that is transmitted to a client.
The Web site can be browsed in three different ways: via desktop, offline, and wireless.Desktop access includes requests from desktop and laptop machines connected to theWeb site via wireline networks. Offline access is generated due to handheld devicessuch as PDAs. For example, companies such as Avantgo and Vindigo offer servicesthat let users select content from different Web sites, which is then downloaded ontotheir handheld devices for browsing at a later time. The content download occurswhen a user synchronizes his/her handheld with a desktop machine and is controlledby a “downloader” program. Wireless access occurs due to browse actions initiatedby users from their cell-phones or wireless devices. Typically, a request from a cell-phone is directed to a “gateway”, which is operated by the user’s service provider,and forwards the message to the Web site. This gateway also forwards the reply backto the cell-phone. Thus, from the Web site’s perspective, it communicates directlywith the gateway machines using the standard HTTP protocol. Since one gatewaycan serve multiple clients, we do not use IP addresses to identify users; instead, weuse a unique identifier assigned to every client that is logged with each access.
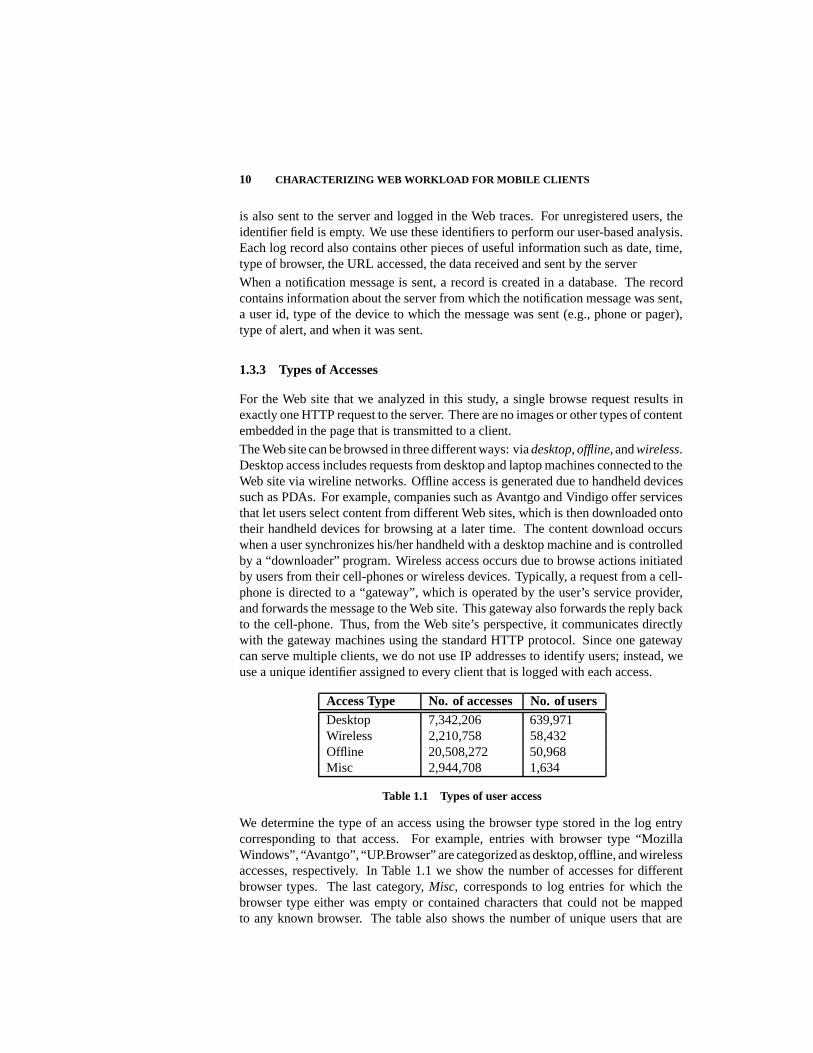
Access Type No. of accesses No. of usersDesktop 7,342,206 639,971Wireless 2,210,758 58,432Offline 20,508,272 50,968Misc 2,944,708 1,634
Table 1.1 Types of user access
We determine the type of an access using the browser type stored in the log entrycorresponding to that access. For example, entries with browser type “MozillaWindows”, “Avantgo”, “UP.Browser” are categorized as desktop,offline, and wirelessaccesses, respectively. In Table 1.1 we show the number of accesses for differentbrowser types. The last category, Misc, corresponds to log entries for which thebrowser type either was empty or contained characters that could not be mappedto any known browser. The table also shows the number of unique users that are
CHARACTERIZING WEB BROWSING WORKLOAD 11
responsible for different types of accesses. The number of desktop users is muchhigher than the offline and wireless users, because a large number of clients use theirdesktop machines to register with the Web site, and then never browse the Web sitelater from their mobile device.
In the case of notifications, more than 99% of the messages were sent to wirelessclients and the remaining were sent to desktop clients.
1.4 CHARACTERIZING WEB BROWSING WORKLOAD
In this section, we analyze the browser log collected from August 15, 2000 throughAugust 26, 2000. During this period the Web server received 1.6 – 3.2 millionrequests per day from 64,000 – 98,000 distinct clients.
1.4.1 Content Analysis
We begin with content analysis. In particular, we seek answers to the followingquestions: (i) how content varies in size, (ii) what are popular content categories, and(iii) how popularity varies across different Web content.
CDF for No. of entries vs Reply Size/100
0
0.2
0.4
0.6
0.8
1
0 100 200 300 400
Reply Size (Bytes/100) [Max value = 8087]
Frac
tion
ofm
essa
ges
WirelessOfflineAllDesktop
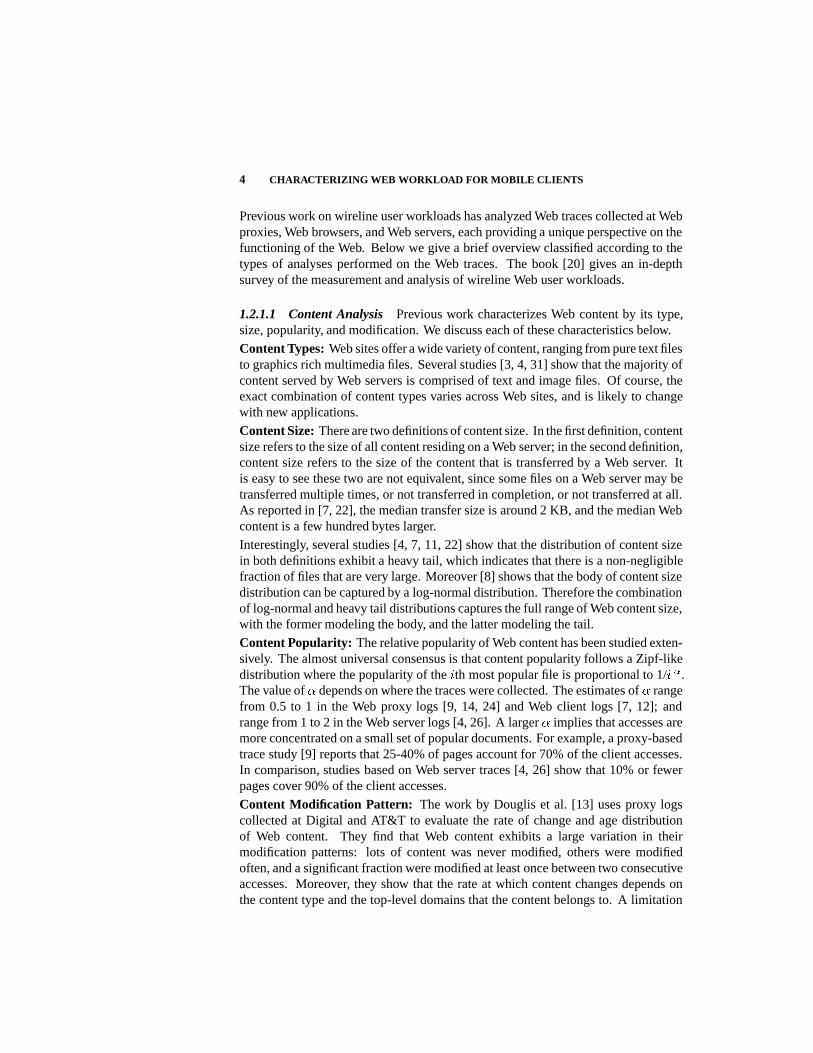
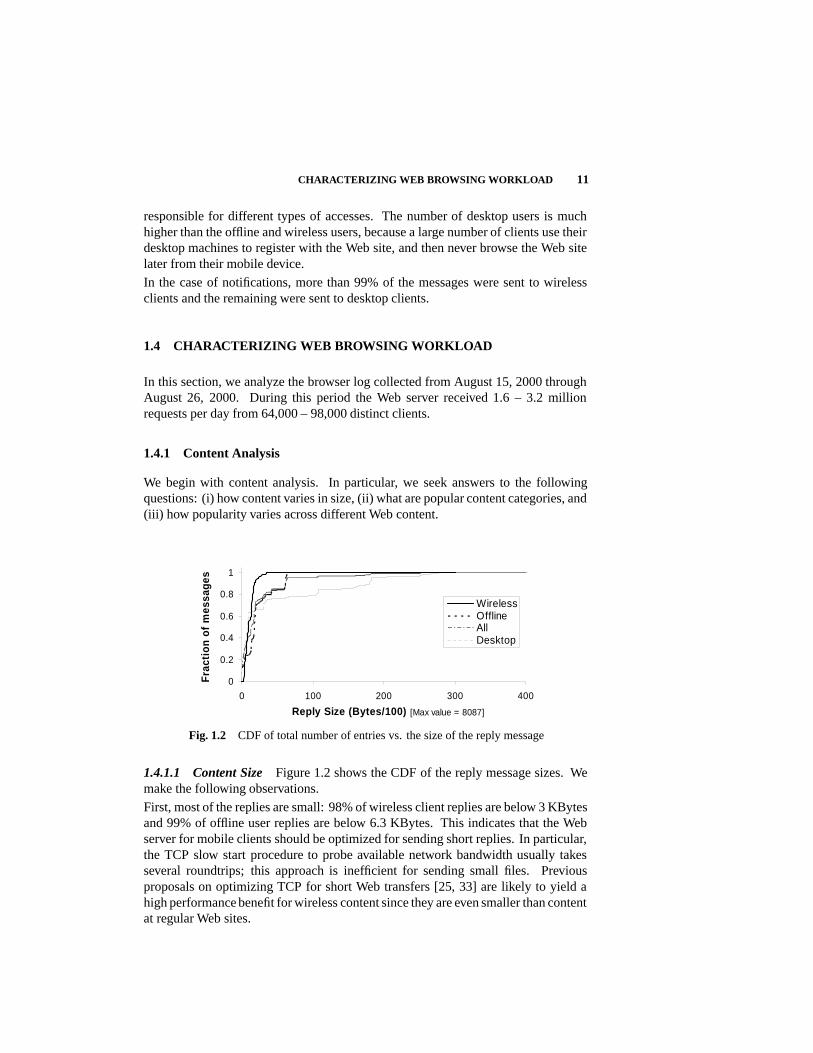
Fig. 1.2 CDF of total number of entries vs. the size of the reply message
1.4.1.1 Content Size Figure 1.2 shows the CDF of the reply message sizes. Wemake the following observations.
First, most of the replies are small: 98% of wireless client replies are below 3 KBytesand 99% of offline user replies are below 6.3 KBytes. This indicates that the Webserver for mobile clients should be optimized for sending short replies. In particular,the TCP slow start procedure to probe available network bandwidth usually takesseveral roundtrips; this approach is inefficient for sending small files. Previousproposals on optimizing TCP for short Web transfers [25, 33] are likely to yield ahigh performance benefit for wireless content since they are even smaller than contentat regular Web sites.
12 CHARACTERIZING WEB WORKLOAD FOR MOBILE CLIENTS
Second, the replies for desktop clients are larger than those for wireless clients;desktops clients are used for personalization and signup activity and these pages arerelatively bigger.
Third, a significant fraction of bytes are sent in large replies, e.g., 80% of the totalbytes are sent in the replies that contain 10 KBytes or more.
1.4.1.2 Popular Content Categories To study the popularity of Web pages interms of content categories, we classify content into different categories, such asentertainment, stocks, weather, news, travel, yellow pages.
As mentioned earlier, all pages on the Web site are dynamically generated: for everyWeb access, the server runs an appropriate ASP [15] script. Usually, the name ofthe ASP script is indicative of the category of information accessed. For example, ifthe URL in the browse log contains the script name find.asp we categorize it under“Yellow Pages”; similarly, if the script filename is stock.asp or onequote.asp, wecategorize the access as “Stocks”. This algorithm works for most URL entries in thelog, but there are some ASP file names that do not completely specify the categorytype. For such cases, we examine the database entries and categorize the URL basedon parameter values, e.g., the parameters to an unclassified file includes entries suchas categ=”sports”, categ=”news”, etc. Through this way, we categorize all 33million browse log entries.
Figure 1.3 shows the top three categories for wireless users, offline users, and desktopusers. We observe that Stock Quotes is the most popular category of interest towireless users and it is ranked the third for offline users; thus, content providersneed to continue providing stock quotes efficiently. We also observe that YellowPages and Direction services are more interesting to wireless users than offline users.In fact, for offline users Directions is one of the least popular categories. Sincethese services are tied to location services, it is reasonable to assume that when userlocation information is readily available, the popularity of location-aware servicesamong wireless users will go up considerably. Surprisingly, mail shows up as beinglow on popularity. A possible reason is that at the time of trace collection, the wirelessWeb site did not provide mail browsing. It simply re-directed the client queries to theuser’s Internet mail service provider’s Web site. We conjecture that when the Website is ready to handle mail accesses, the popularity of the mail service will go up.
Rank # 1 Rank # 2 Rank # 3
Wireless Stock Quotes News Yellow PagesOffline Help News Stock QuotesDesktop Sign-ups Mail Sports
Fig. 1.3 Top three preferences for different kinds of users
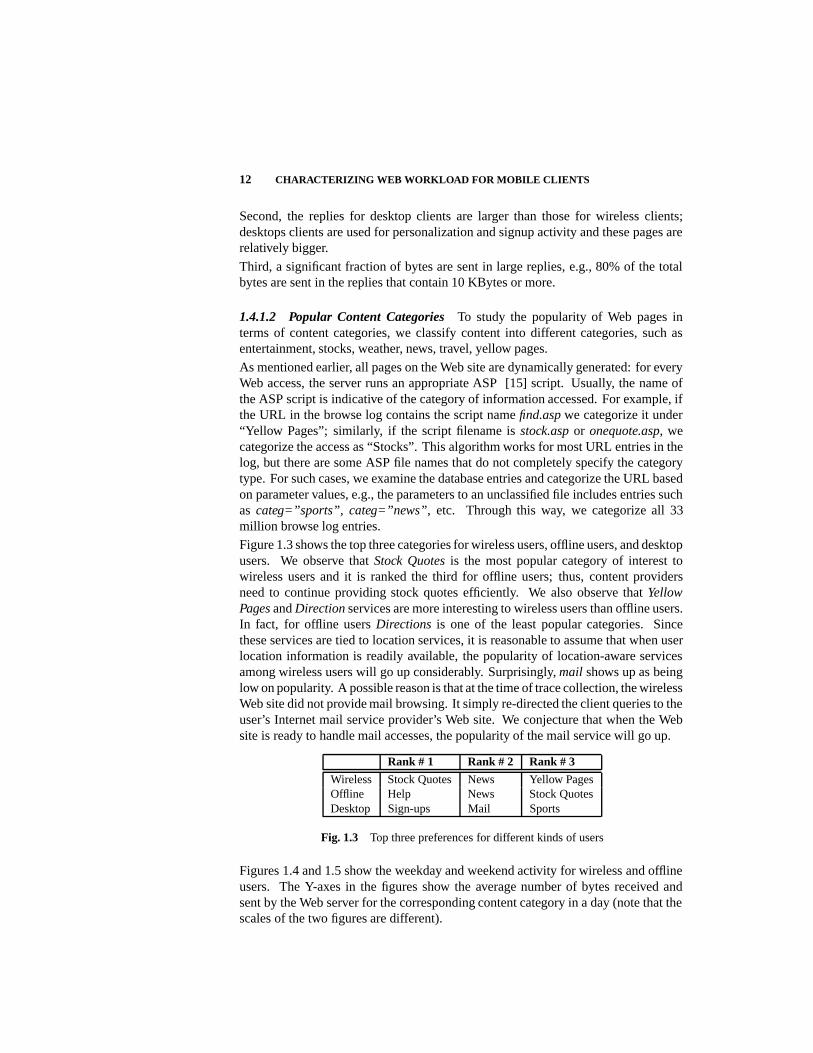
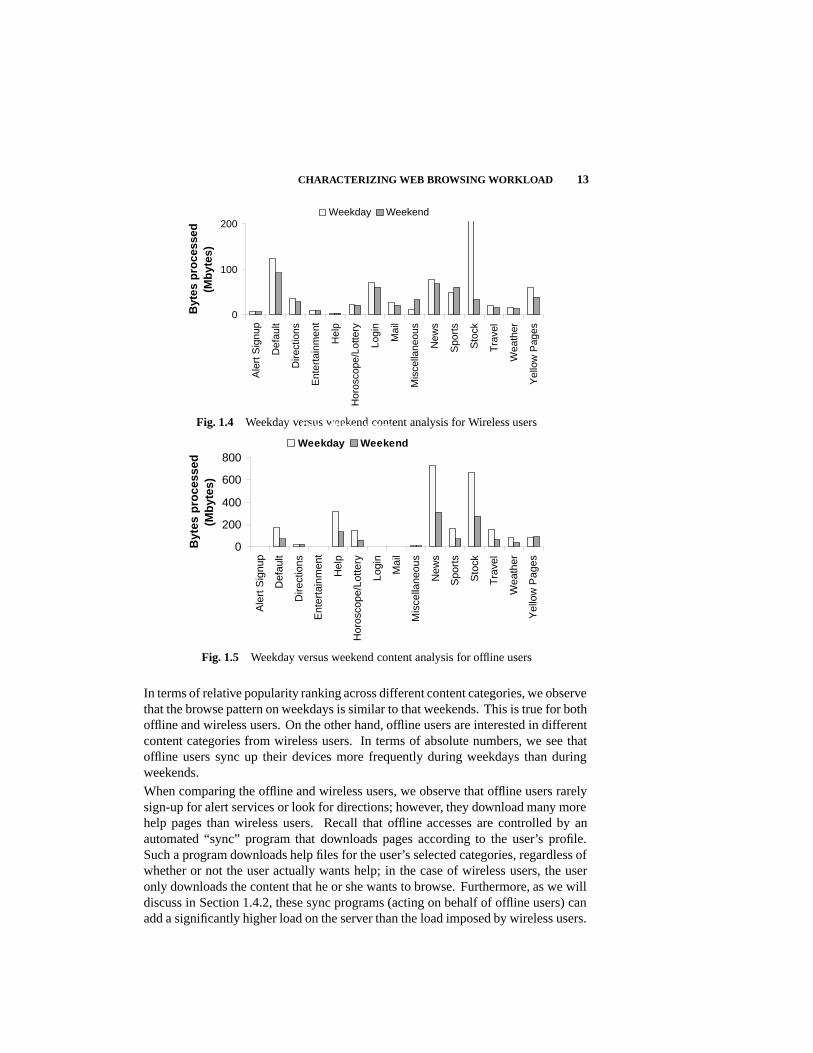
Figures 1.4 and 1.5 show the weekday and weekend activity for wireless and offlineusers. The Y-axes in the figures show the average number of bytes received andsent by the Web server for the corresponding content category in a day (note that thescales of the two figures are different).
CHARACTERIZING WEB BROWSING WORKLOAD 13For wireless users
0
100
200
Ale
rtS
ignu
p
Def
ault
Dire
ctio
ns
Ent
erta
inm
ent
Hel
p
Hor
osco
pe/L
otte
ry
Logi
n
Mai
l
Mis
cella
neou
s
New
s
Spo
rts
Sto
ck
Tra
vel
Wea
ther
Yel
low
Pag
es
Byt
esp
roce
ssed
(Mb
ytes
)Weekday Weekend
Fig. 1.4 Weekday versus weekend content analysis for Wireless usersFor offline users
0
200
400
600
800
Ale
rtS
ignu
p
Def
ault
Dire
ctio
ns
Ent
erta
inm
ent
Hel
p
Hor
osco
pe/L
otte
ry
Logi
n
Mai
l
Mis
cella
neou
s
New
s
Spo
rts
Sto
ck
Tra
vel
Wea
ther
Yel
low
Pag
es
Byt
esp
roce
ssed
(Mb
ytes
)
Weekday Weekend
Fig. 1.5 Weekday versus weekend content analysis for offline users
In terms of relative popularity ranking across different content categories, we observethat the browse pattern on weekdays is similar to that weekends. This is true for bothoffline and wireless users. On the other hand, offline users are interested in differentcontent categories from wireless users. In terms of absolute numbers, we see thatoffline users sync up their devices more frequently during weekdays than duringweekends.
When comparing the offline and wireless users, we observe that offline users rarelysign-up for alert services or look for directions; however, they download many morehelp pages than wireless users. Recall that offline accesses are controlled by anautomated “sync” program that downloads pages according to the user’s profile.Such a program downloads help files for the user’s selected categories, regardless ofwhether or not the user actually wants help; in the case of wireless users, the useronly downloads the content that he or she wants to browse. Furthermore, as we willdiscuss in Section 1.4.2, these sync programs (acting on behalf of offline users) canadd a significantly higher load on the server than the load imposed by wireless users.
14 CHARACTERIZING WEB WORKLOAD FOR MOBILE CLIENTS
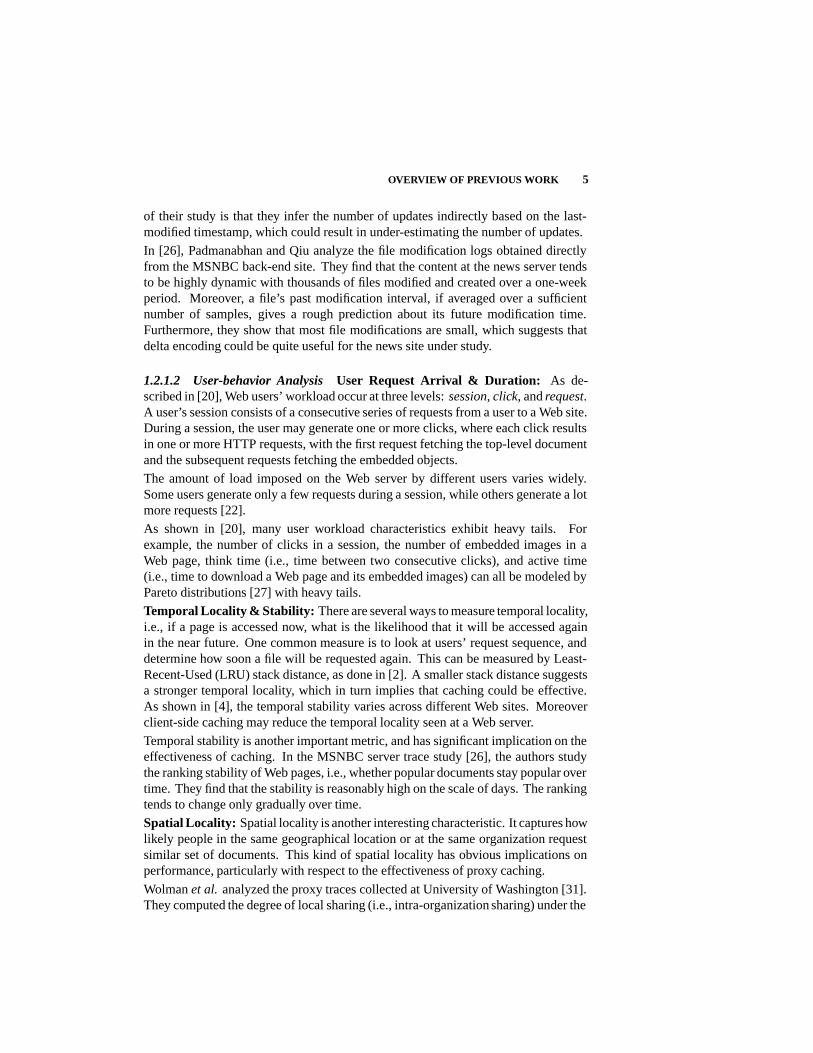
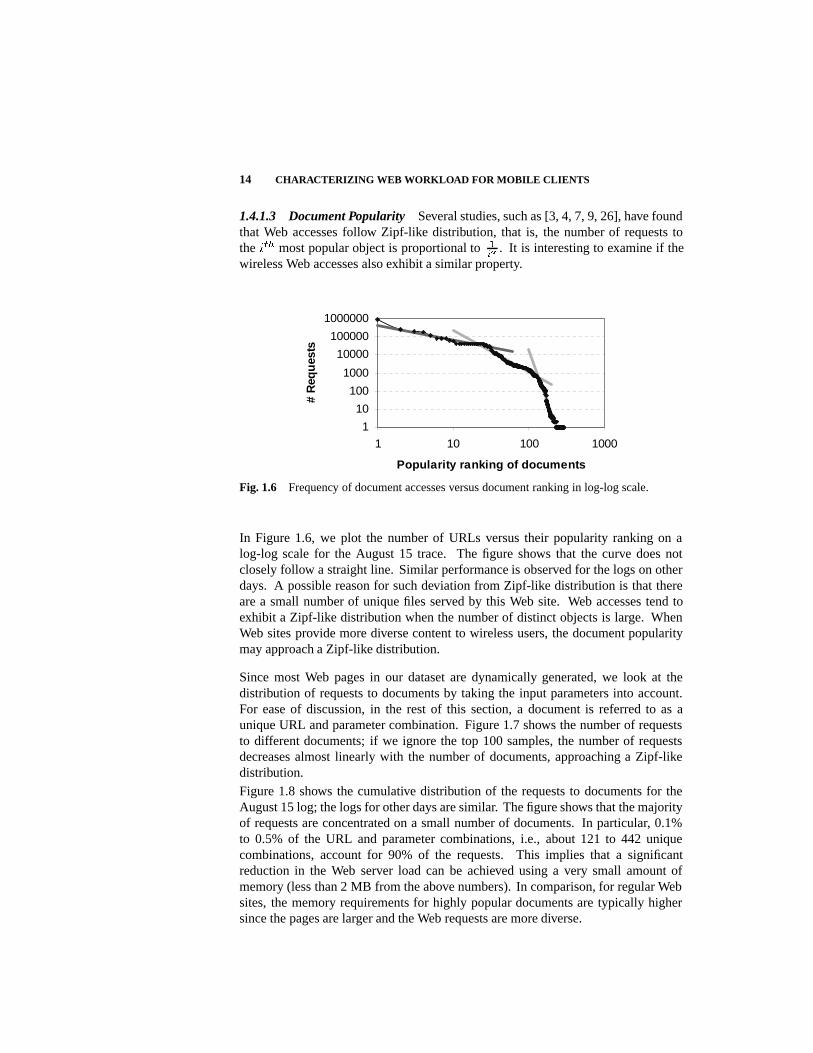
1.4.1.3 Document Popularity Several studies, such as [3, 4, 7, 9, 26], have foundthat Web accesses follow Zipf-like distribution, that is, the number of requests tothe ��� most popular object is proportional to �
��. It is interesting to examine if the
wireless Web accesses also exhibit a similar property.
1
10
100
1000
10000
100000
1000000
1 10 100 1000
Popularity ranking of documents
#R
equ
ests
Fig. 1.6 Frequency of document accesses versus document ranking in log-log scale.
In Figure 1.6, we plot the number of URLs versus their popularity ranking on alog-log scale for the August 15 trace. The figure shows that the curve does notclosely follow a straight line. Similar performance is observed for the logs on otherdays. A possible reason for such deviation from Zipf-like distribution is that thereare a small number of unique files served by this Web site. Web accesses tend toexhibit a Zipf-like distribution when the number of distinct objects is large. WhenWeb sites provide more diverse content to wireless users, the document popularitymay approach a Zipf-like distribution.
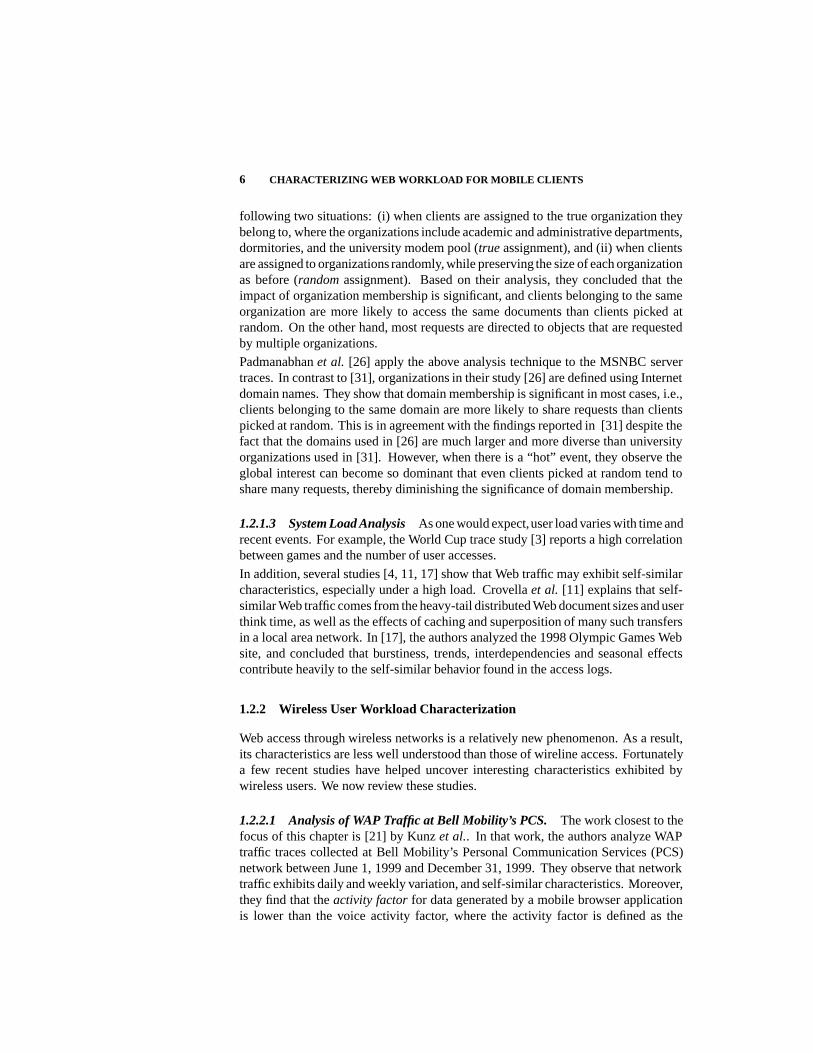
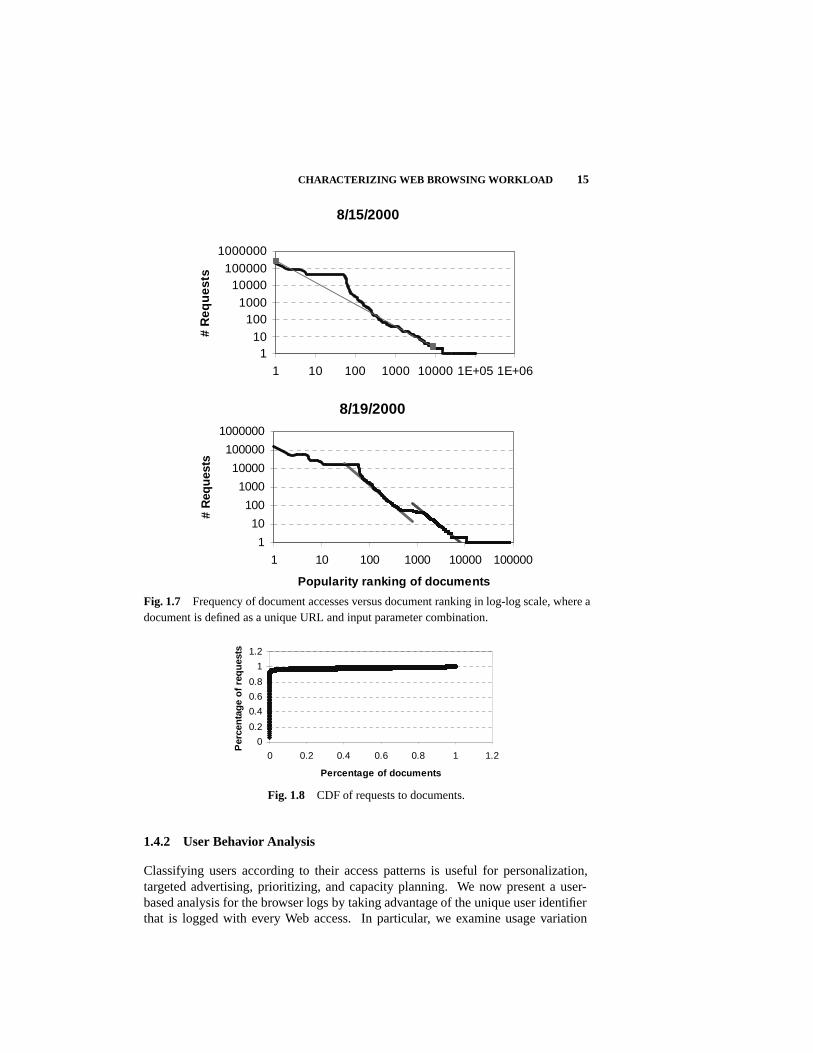
Since most Web pages in our dataset are dynamically generated, we look at thedistribution of requests to documents by taking the input parameters into account.For ease of discussion, in the rest of this section, a document is referred to as aunique URL and parameter combination. Figure 1.7 shows the number of requeststo different documents; if we ignore the top 100 samples, the number of requestsdecreases almost linearly with the number of documents, approaching a Zipf-likedistribution.
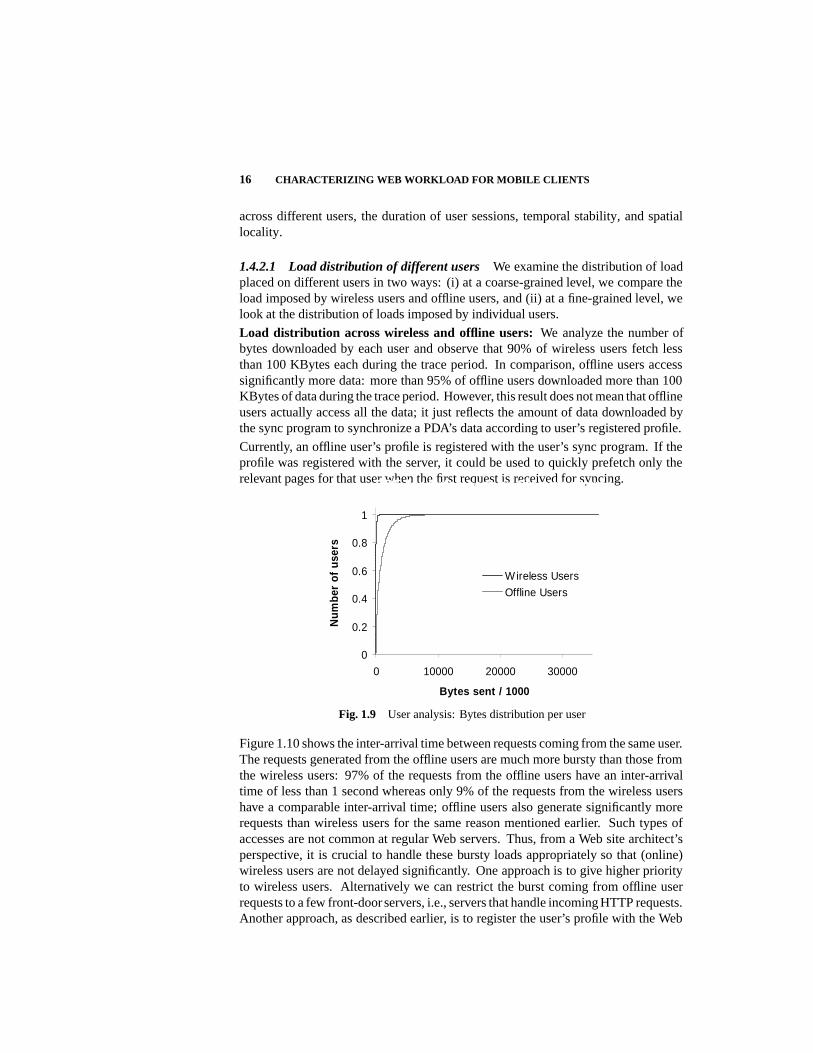
Figure 1.8 shows the cumulative distribution of the requests to documents for theAugust 15 log; the logs for other days are similar. The figure shows that the majorityof requests are concentrated on a small number of documents. In particular, 0.1%to 0.5% of the URL and parameter combinations, i.e., about 121 to 442 uniquecombinations, account for 90% of the requests. This implies that a significantreduction in the Web server load can be achieved using a very small amount ofmemory (less than 2 MB from the above numbers). In comparison, for regular Websites, the memory requirements for highly popular documents are typically highersince the pages are larger and the Web requests are more diverse.
CHARACTERIZING WEB BROWSING WORKLOAD 15
8/15/2000
110
1001000
10000100000
1000000
1 10 100 1000 10000 1E+05 1E+06
Popularity ranking of documents
#R
equ
ests
8/19/2000
1
10
100
1000
10000
100000
1000000
1 10 100 1000 10000 100000
Popularity ranking of documents
#R
equ
ests
Fig. 1.7 Frequency of document accesses versus document ranking in log-log scale, where adocument is defined as a unique URL and input parameter combination.
0
0.2
0.4
0.6
0.8
1
1.2
0 0.2 0.4 0.6 0.8 1 1.2
Percentage of documents
Per
cen
tag
eo
fre
qu
ests
Fig. 1.8 CDF of requests to documents.
1.4.2 User Behavior Analysis
Classifying users according to their access patterns is useful for personalization,targeted advertising, prioritizing, and capacity planning. We now present a user-based analysis for the browser logs by taking advantage of the unique user identifierthat is logged with every Web access. In particular, we examine usage variation
16 CHARACTERIZING WEB WORKLOAD FOR MOBILE CLIENTS
across different users, the duration of user sessions, temporal stability, and spatiallocality.
1.4.2.1 Load distribution of different users We examine the distribution of loadplaced on different users in two ways: (i) at a coarse-grained level, we compare theload imposed by wireless users and offline users, and (ii) at a fine-grained level, welook at the distribution of loads imposed by individual users.
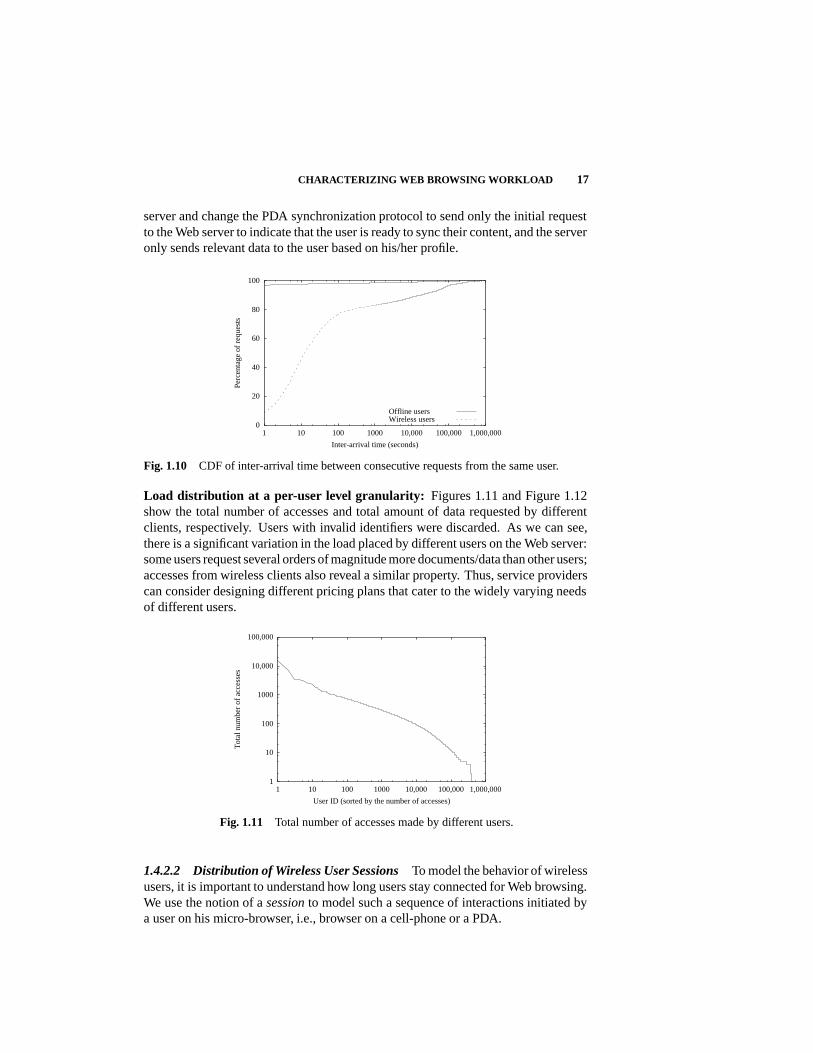
Load distribution across wireless and offline users: We analyze the number ofbytes downloaded by each user and observe that 90% of wireless users fetch lessthan 100 KBytes each during the trace period. In comparison, offline users accesssignificantly more data: more than 95% of offline users downloaded more than 100KBytes of data during the trace period. However, this result does not mean that offlineusers actually access all the data; it just reflects the amount of data downloaded bythe sync program to synchronize a PDA’s data according to user’s registered profile.
Currently, an offline user’s profile is registered with the user’s sync program. If theprofile was registered with the server, it could be used to quickly prefetch only therelevant pages for that user when the first request is received for syncing.CDF for bytes sent by the web server
0
0.2
0.4
0.6
0.8
1
0 10000 20000 30000
Bytes sent / 1000
Num
ber
ofus
ers
Wireless Users
Offline Users
Fig. 1.9 User analysis: Bytes distribution per user
Figure 1.10 shows the inter-arrival time between requests coming from the same user.The requests generated from the offline users are much more bursty than those fromthe wireless users: 97% of the requests from the offline users have an inter-arrivaltime of less than 1 second whereas only 9% of the requests from the wireless usershave a comparable inter-arrival time; offline users also generate significantly morerequests than wireless users for the same reason mentioned earlier. Such types ofaccesses are not common at regular Web servers. Thus, from a Web site architect’sperspective, it is crucial to handle these bursty loads appropriately so that (online)wireless users are not delayed significantly. One approach is to give higher priorityto wireless users. Alternatively we can restrict the burst coming from offline userrequests to a few front-door servers, i.e., servers that handle incoming HTTP requests.Another approach, as described earlier, is to register the user’s profile with the Web
CHARACTERIZING WEB BROWSING WORKLOAD 17
server and change the PDA synchronization protocol to send only the initial requestto the Web server to indicate that the user is ready to sync their content, and the serveronly sends relevant data to the user based on his/her profile.
0
20
40
60
80
100
1 10 100 1000 10,000 100,000 1,000,000
Perc
enta
ge o
f re
ques
ts
Inter-arrival time (seconds)
Offline usersWireless users
Fig. 1.10 CDF of inter-arrival time between consecutive requests from the same user.
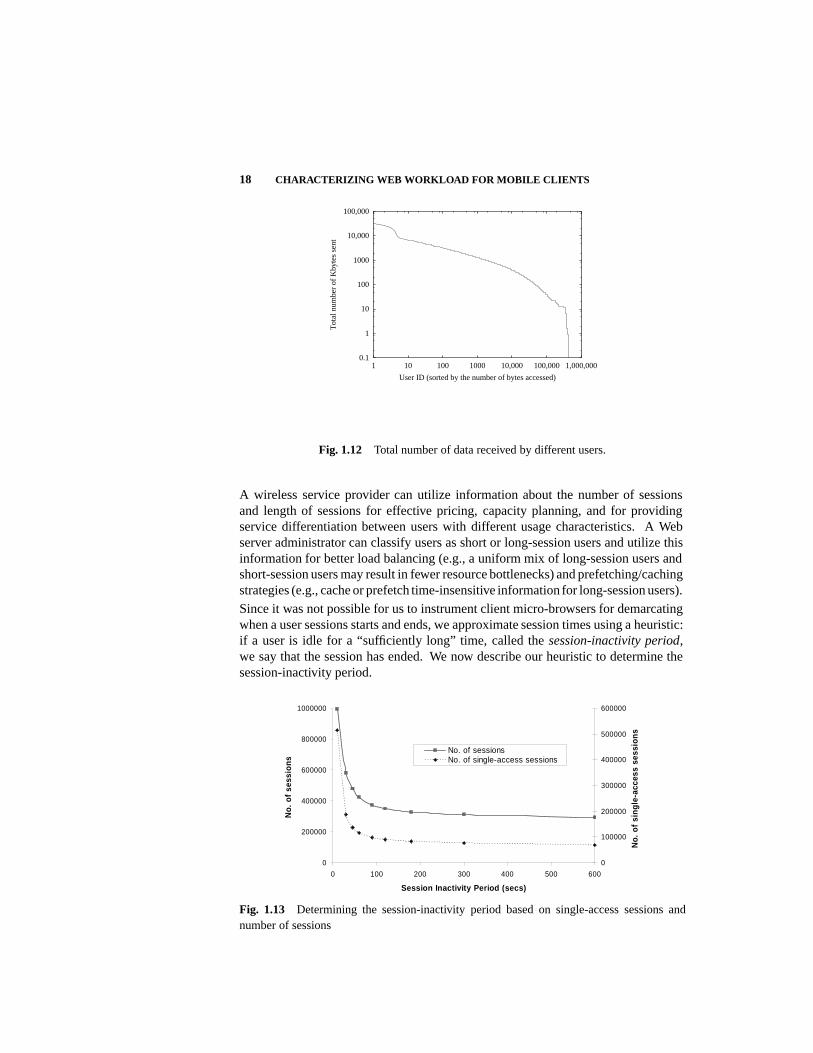
Load distribution at a per-user level granularity: Figures 1.11 and Figure 1.12show the total number of accesses and total amount of data requested by differentclients, respectively. Users with invalid identifiers were discarded. As we can see,there is a significant variation in the load placed by different users on the Web server:some users request several orders of magnitude more documents/data than other users;accesses from wireless clients also reveal a similar property. Thus, service providerscan consider designing different pricing plans that cater to the widely varying needsof different users.
1
10
100
1000
10,000
100,000
1 10 100 1000 10,000 100,000 1,000,000
Tot
al n
umbe
r of
acc
esse
s
User ID (sorted by the number of accesses)
Fig. 1.11 Total number of accesses made by different users.
1.4.2.2 Distribution of Wireless User Sessions To model the behavior of wirelessusers, it is important to understand how long users stay connected for Web browsing.We use the notion of a session to model such a sequence of interactions initiated bya user on his micro-browser, i.e., browser on a cell-phone or a PDA.
18 CHARACTERIZING WEB WORKLOAD FOR MOBILE CLIENTS
0.1
1
10
100
1000
10,000
100,000
1 10 100 1000 10,000 100,000 1,000,000
Tot
al n
umbe
r of
Kby
tes
sent
User ID (sorted by the number of bytes accessed)
Fig. 1.12 Total number of data received by different users.
A wireless service provider can utilize information about the number of sessionsand length of sessions for effective pricing, capacity planning, and for providingservice differentiation between users with different usage characteristics. A Webserver administrator can classify users as short or long-session users and utilize thisinformation for better load balancing (e.g., a uniform mix of long-session users andshort-session users may result in fewer resource bottlenecks) and prefetching/cachingstrategies (e.g., cache or prefetch time-insensitive information for long-session users).
Since it was not possible for us to instrument client micro-browsers for demarcatingwhen a user sessions starts and ends, we approximate session times using a heuristic:if a user is idle for a “sufficiently long” time, called the session-inactivity period,we say that the session has ended. We now describe our heuristic to determine thesession-inactivity period.
0
200000
400000
600000
800000
1000000
0 100 200 300 400 500 600
Session Inactivity Period (secs)
No.
of
sess
ions
0
100000
200000
300000
400000
500000
600000
No.
of
sin
gle
-acc
ess
sess
ion
s
No. of sessionsNo. of single-access sessions
Fig. 1.13 Determining the session-inactivity period based on single-access sessions andnumber of sessions
CHARACTERIZING WEB BROWSING WORKLOAD 19
When a user starts browsing, he or she accesses the home page (by default) and thentraverses the Web site under study. Given the structure of this Web site, we expectfew sessions access only one page, since during these sessions users only connectbut do not browse. Thus, if we choose a very small session-inactivity period, manyaccesses will be incorrectly counted as part of separate single-hit sessions. As thesession-inactivity period increases, these accesses are correctly classified as part oflarger sessions and the number of single-hit sessions will decrease. The appropriatesession-inactivity period is at the knee point where the change in its value does notproduce a significant change in the number of single-hit sessions.
Figure 1.13 shows the number of single-hit sessions versus the session-inactivityperiod. The figure shows that the knee point occurs somewhere between 30 and45 seconds; we use this knee point as the session-inactivity period. Note that eventhough our analysis is based on correctly classifying single-hit sessions, it impactsthe classification of multi-hit sessions as well.
We can verify our chosen period in another manner. As the session-inactivity periodincreases, smaller sessions merge into larger ones, thereby decreasing the total numberof sessions, until all sessions are merged into one big session. There is a point atwhich the rate of decrease of sessions becomes relatively steady and low. Again,this occurs in the region where the real session-inactivity period lies. In Figure 1.13,there is a relatively steep drop in the number of sessions from 10 to 30 seconds andthen a smoother curve from 30 seconds onwards is observed. This analysis confirmsthe fact that the session-inactivity period lies in the range from 30 to 45 seconds.This value is different from the one reported in [21], which used 90 seconds as thethreshold for reclaiming dynamic IP addresses.
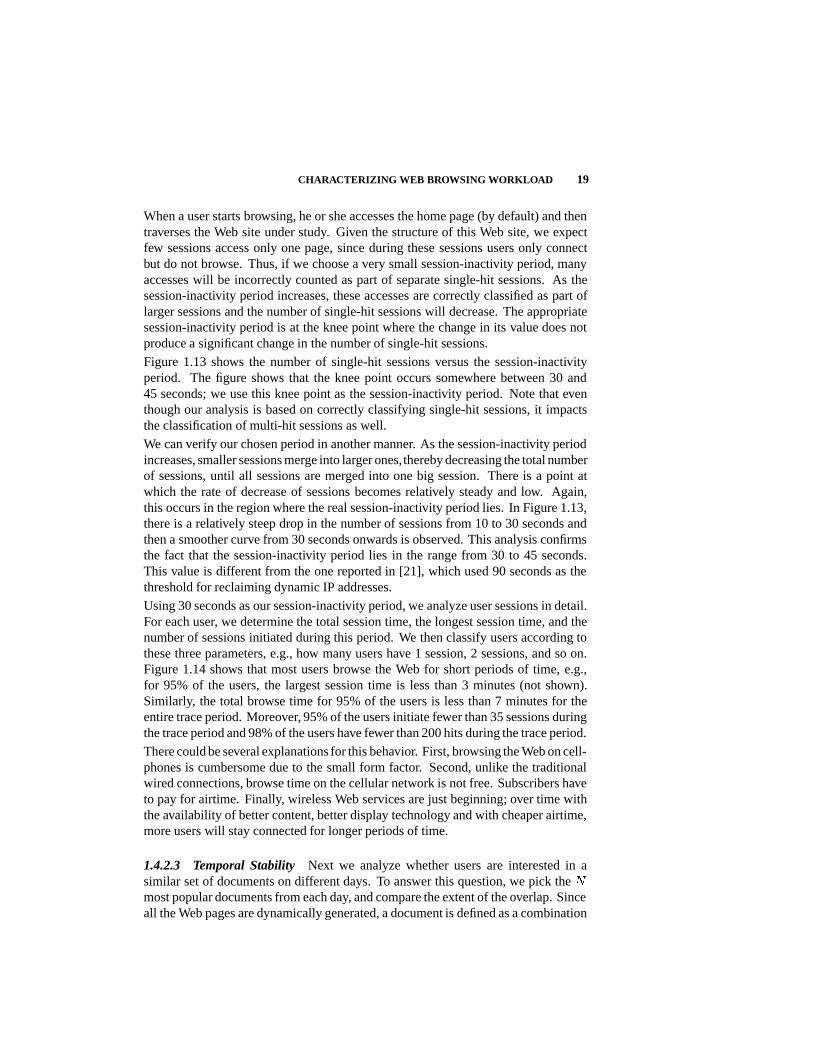
Using 30 seconds as our session-inactivity period, we analyze user sessions in detail.For each user, we determine the total session time, the longest session time, and thenumber of sessions initiated during this period. We then classify users according tothese three parameters, e.g., how many users have 1 session, 2 sessions, and so on.Figure 1.14 shows that most users browse the Web for short periods of time, e.g.,for 95% of the users, the largest session time is less than 3 minutes (not shown).Similarly, the total browse time for 95% of the users is less than 7 minutes for theentire trace period. Moreover, 95% of the users initiate fewer than 35 sessions duringthe trace period and 98% of the users have fewer than 200 hits during the trace period.
There could be several explanations for this behavior. First, browsing the Web on cell-phones is cumbersome due to the small form factor. Second, unlike the traditionalwired connections, browse time on the cellular network is not free. Subscribers haveto pay for airtime. Finally, wireless Web services are just beginning; over time withthe availability of better content, better display technology and with cheaper airtime,more users will stay connected for longer periods of time.
1.4.2.3 Temporal Stability Next we analyze whether users are interested in asimilar set of documents on different days. To answer this question, we pick the �most popular documents from each day, and compare the extent of the overlap. Sinceall the Web pages are dynamically generated, a document is defined as a combination
20 CHARACTERIZING WEB WORKLOAD FOR MOBILE CLIENTS
0
200
400
600
0 20000 40000 60000No. of users
Tot
alse
ssio
nti
me
(sec
s)
0
200
400
600
800
No.
of
sess
ion
s
Total session time
No. of sessions
Fig. 1.14 Distribution of session times and number of sessions for wireless users during thetrace period
of a unique URL name and the query parameters (i.e., two requests with the sameURL but different parameters are considered as different document requests). Wewill use the terms document and query interchangeably in this section.
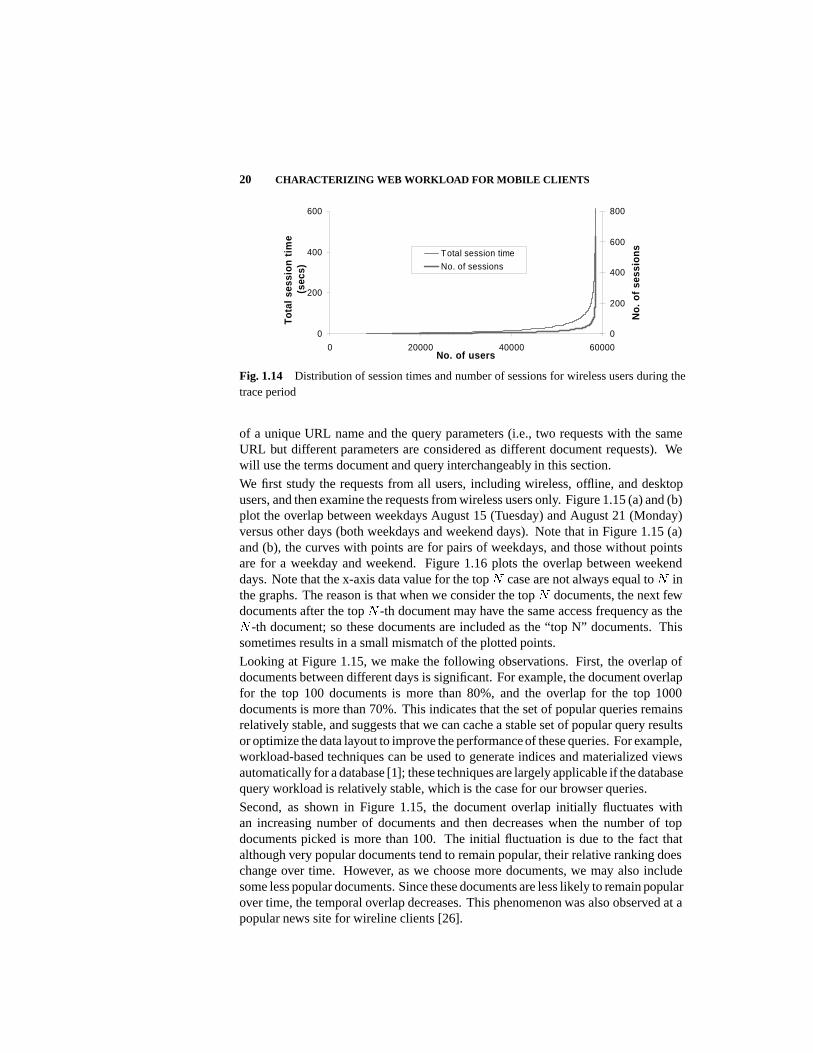
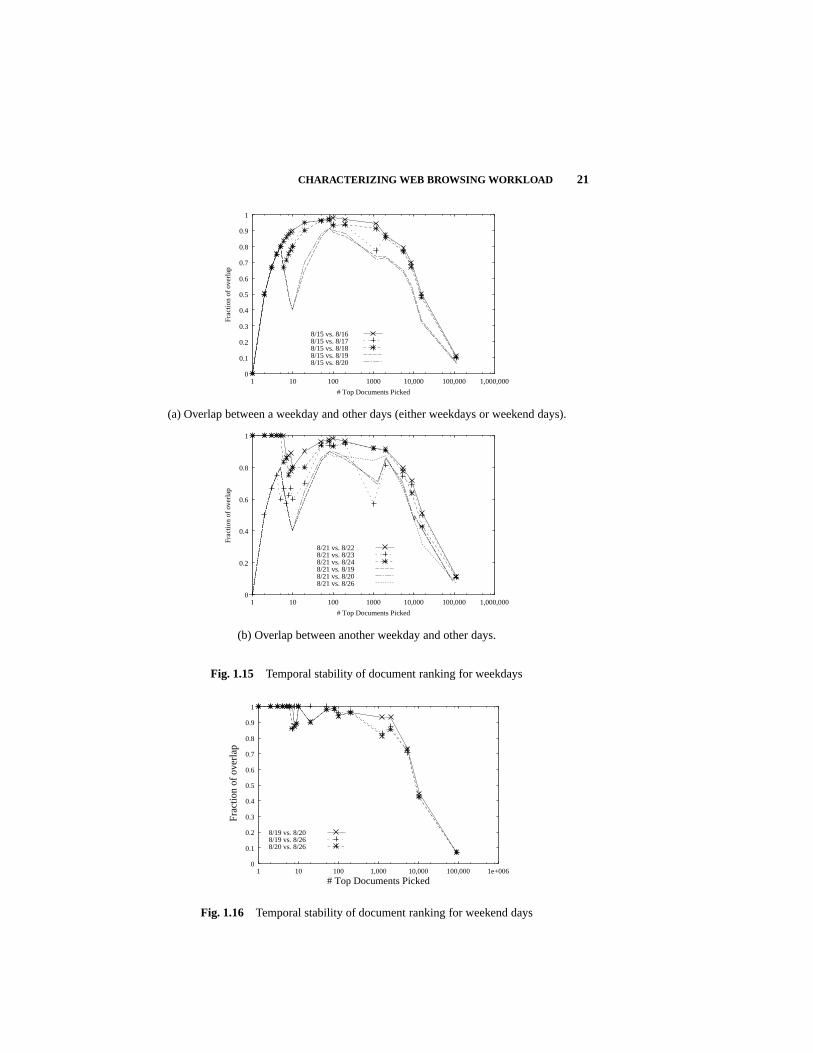
We first study the requests from all users, including wireless, offline, and desktopusers, and then examine the requests from wireless users only. Figure 1.15 (a) and (b)plot the overlap between weekdays August 15 (Tuesday) and August 21 (Monday)versus other days (both weekdays and weekend days). Note that in Figure 1.15 (a)and (b), the curves with points are for pairs of weekdays, and those without pointsare for a weekday and weekend. Figure 1.16 plots the overlap between weekenddays. Note that the x-axis data value for the top � case are not always equal to � inthe graphs. The reason is that when we consider the top � documents, the next fewdocuments after the top � -th document may have the same access frequency as the� -th document; so these documents are included as the “top N” documents. Thissometimes results in a small mismatch of the plotted points.
Looking at Figure 1.15, we make the following observations. First, the overlap ofdocuments between different days is significant. For example, the document overlapfor the top 100 documents is more than 80%, and the overlap for the top 1000documents is more than 70%. This indicates that the set of popular queries remainsrelatively stable, and suggests that we can cache a stable set of popular query resultsor optimize the data layout to improve the performance of these queries. For example,workload-based techniques can be used to generate indices and materialized viewsautomatically for a database [1]; these techniques are largely applicable if the databasequery workload is relatively stable, which is the case for our browser queries.
Second, as shown in Figure 1.15, the document overlap initially fluctuates withan increasing number of documents and then decreases when the number of topdocuments picked is more than 100. The initial fluctuation is due to the fact thatalthough very popular documents tend to remain popular, their relative ranking doeschange over time. However, as we choose more documents, we may also includesome less popular documents. Since these documents are less likely to remain popularover time, the temporal overlap decreases. This phenomenon was also observed at apopular news site for wireline clients [26].
CHARACTERIZING WEB BROWSING WORKLOAD 21
0
0.1
0.2
0.3
0.4
0.5
0.6
0.7
0.8
0.9
1
1 10 100 1000 10,000 100,000 1,000,000
Frac
tion
of o
verl
ap
# Top Documents Picked
8/15 vs. 8/168/15 vs. 8/178/15 vs. 8/188/15 vs. 8/198/15 vs. 8/20
(a) Overlap between a weekday and other days (either weekdays or weekend days).
0
0.2
0.4
0.6
0.8
1
1 10 100 1000 10,000 100,000 1,000,000
Frac
tion
of o
verl
ap
# Top Documents Picked
8/21 vs. 8/228/21 vs. 8/238/21 vs. 8/248/21 vs. 8/198/21 vs. 8/208/21 vs. 8/26
(b) Overlap between another weekday and other days.
Fig. 1.15 Temporal stability of document ranking for weekdays
0
0.1
0.2
0.3
0.4
0.5
0.6
0.7
0.8
0.9
1
1 10 100 1,000 10,000 100,000 1e+006
Frac
tion
of o
verl
ap
# Top Documents Picked
8/19 vs. 8/208/19 vs. 8/268/20 vs. 8/26
Fig. 1.16 Temporal stability of document ranking for weekend days
22 CHARACTERIZING WEB WORKLOAD FOR MOBILE CLIENTS
Third, we observe that the document overlap between pairs of weekdays is generallyhigher than the overlap between a weekend day and a weekday; the overlap betweentwo weekend days is even higher. This observation is consistent with our intuition,and suggests that we should use past weekday (weekend) workload to predict futureweekday (weekend) workload.
We also examine the requests coming from wireless users only, and observe similarresults. As before, the set of popular queries remains stable over time. The stabilityis especially high when we consider the most popular queries. In addition, thereis a significant difference between the access pattern on weekdays versus that onweekends.
1.4.2.4 Spatial locality Finally we consider the following question: do people inthe same geographical region tend to issue a similar set of queries.
We take the following approach to carry out this analysis. We define a browse re-quest message to be locally shared if at least two users in the same cluster accessthe same document (URL and parameter combination). We compare the degree ofsharing using geographical clustering and four random clusterings. In the geograph-ical clustering case, clients in the same city are clustered together. In the randomclustering case, clients are clustered randomly with the cluster size being the sameas in geographical clustering. We obtained the geographical location of users usinga registration database which contains zip code information for each user. The zipcode information is not clean — some users supplied invalid zip codes; we filter outall the zip codes that are not 5 digits. 14% of the users supplied such invalid zipcodes. In the remaining entries, it is still possible to have zip codes that do not matchthe actual user location, but the fraction is likely to be small.
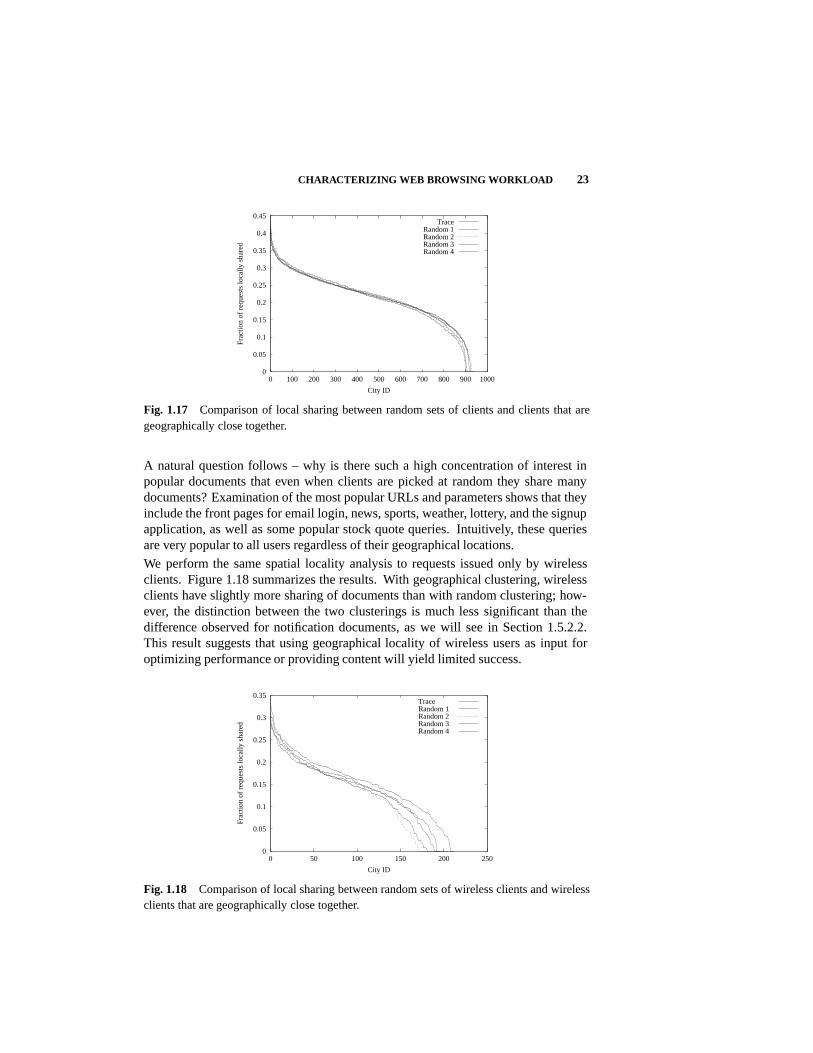
Figure 1.17 compares the fraction of documents that are shared within a geographicalcluster and within four random clusters for all the users. The figure shows thatthe curve for the geographical clusters overlaps with those for random clusters.This overlap indicates that the degree of sharing between geographical clusteringand random clustering is comparable, and the correlation between users’ interest inbrowsing over wireless networks and their geographical location is weak.
A possible explanation for the weak correlation is that lots of popular content hasglobal interest. In particular, as mentioned in Section 1.4.1.3, 0.1% to 0.5% ofthe URL and parameter combinations (i.e., about 121 — 442 unique combinations)account for 90% of the requests. With such a high concentration of user interest ona few documents, even when clients are picked at random, they share many requests;therefore, the geographical locality becomes insignificant. A similar phenomenon hasbeen observed in a study of a popular news server for wireline users [26], where theauthors observed that the significance of domain membership becomes diminishedduring a popular event. A major distinction between that study and ours is the wayin which users are clustered: in that study, users are clustered based on their DNSnames, whereas in our study we cluster users based on their geographical region, i.e.,the city in which they reside.
CHARACTERIZING WEB BROWSING WORKLOAD 23
0
0.05
0.1
0.15
0.2
0.25
0.3
0.35
0.4
0.45
0 100 200 300 400 500 600 700 800 900 1000
Frac
tion
of r
eque
sts
loca
lly s
hare
d
City ID
TraceRandom 1Random 2Random 3Random 4
Fig. 1.17 Comparison of local sharing between random sets of clients and clients that aregeographically close together.
A natural question follows – why is there such a high concentration of interest inpopular documents that even when clients are picked at random they share manydocuments? Examination of the most popular URLs and parameters shows that theyinclude the front pages for email login, news, sports, weather, lottery, and the signupapplication, as well as some popular stock quote queries. Intuitively, these queriesare very popular to all users regardless of their geographical locations.
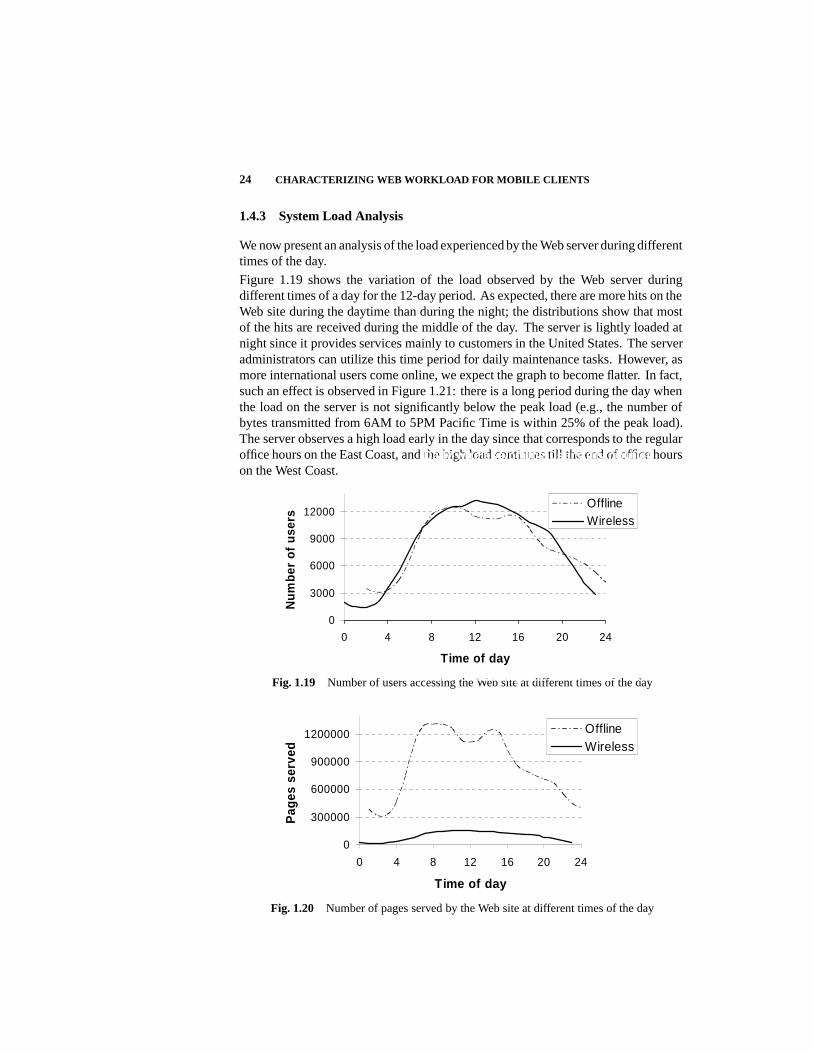
We perform the same spatial locality analysis to requests issued only by wirelessclients. Figure 1.18 summarizes the results. With geographical clustering, wirelessclients have slightly more sharing of documents than with random clustering; how-ever, the distinction between the two clusterings is much less significant than thedifference observed for notification documents, as we will see in Section 1.5.2.2.This result suggests that using geographical locality of wireless users as input foroptimizing performance or providing content will yield limited success.
0
0.05
0.1
0.15
0.2
0.25
0.3
0.35
0 50 100 150 200 250
Frac
tion
of r
eque
sts
loca
lly s
hare
d
City ID
TraceRandom 1Random 2Random 3Random 4
Fig. 1.18 Comparison of local sharing between random sets of wireless clients and wirelessclients that are geographically close together.
24 CHARACTERIZING WEB WORKLOAD FOR MOBILE CLIENTS
1.4.3 System Load Analysis
We now present an analysis of the load experienced by the Web server during differenttimes of the day.
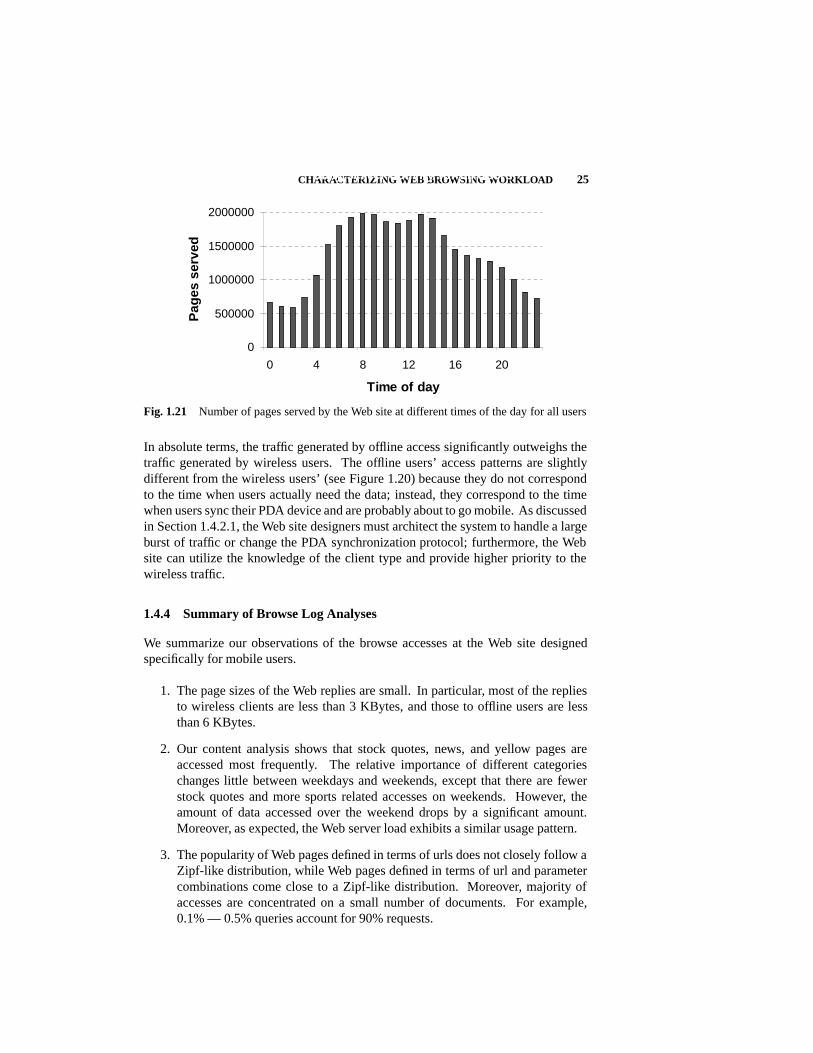
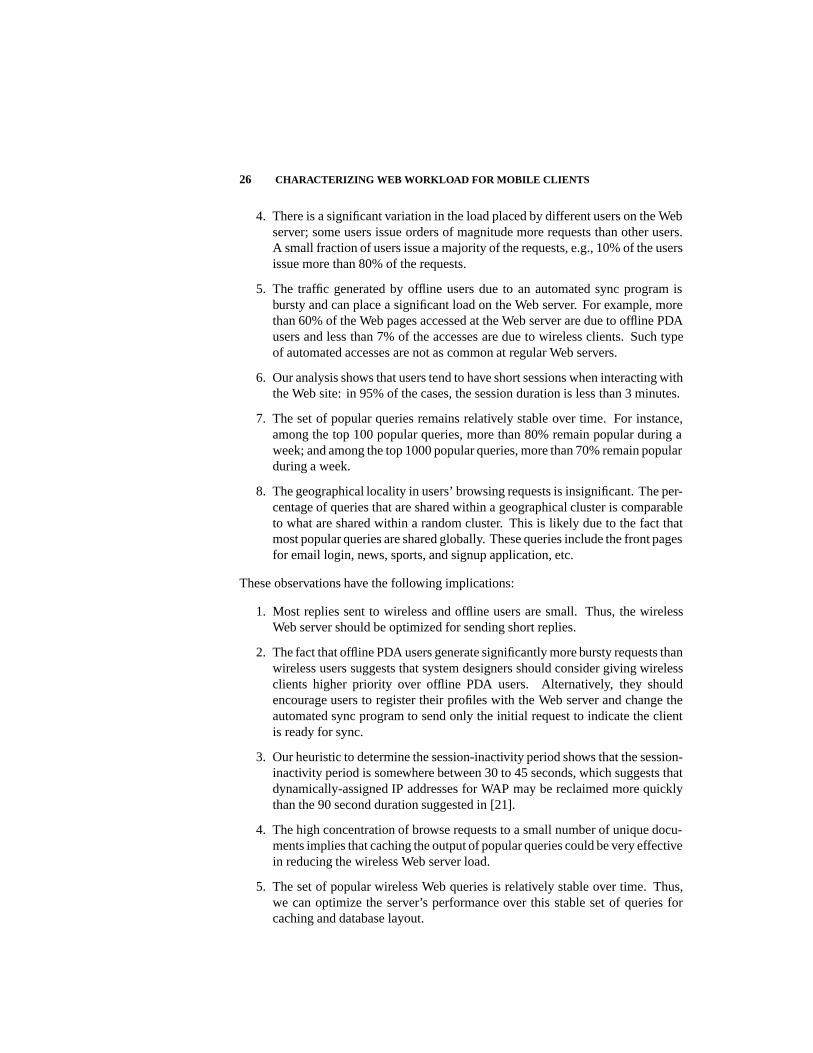
Figure 1.19 shows the variation of the load observed by the Web server duringdifferent times of a day for the 12-day period. As expected, there are more hits on theWeb site during the daytime than during the night; the distributions show that mostof the hits are received during the middle of the day. The server is lightly loaded atnight since it provides services mainly to customers in the United States. The serveradministrators can utilize this time period for daily maintenance tasks. However, asmore international users come online, we expect the graph to become flatter. In fact,such an effect is observed in Figure 1.21: there is a long period during the day whenthe load on the server is not significantly below the peak load (e.g., the number ofbytes transmitted from 6AM to 5PM Pacific Time is within 25% of the peak load).The server observes a high load early in the day since that corresponds to the regularoffice hours on the East Coast, and the high load continues till the end of office hourson the West Coast.
Daily wireless/offline users distribution
0
3000
6000
9000
12000
0 4 8 12 16 20 24
Time of day
Nu
mb
ero
fu
sers
OfflineWireless
Fig. 1.19 Number of users accessing the Web site at different times of the dayDaily server activity due to wireless users
0
300000
600000
900000
1200000
0 4 8 12 16 20 24
Time of day
Pag
esse
rved
OfflineWireless
Fig. 1.20 Number of pages served by the Web site at different times of the day
CHARACTERIZING WEB BROWSING WORKLOAD 25Daily server activity for all users
0
500000
1000000
1500000
2000000
0 4 8 12 16 20
Time of day
Pag
esse
rved
Fig. 1.21 Number of pages served by the Web site at different times of the day for all users
In absolute terms, the traffic generated by offline access significantly outweighs thetraffic generated by wireless users. The offline users’ access patterns are slightlydifferent from the wireless users’ (see Figure 1.20) because they do not correspondto the time when users actually need the data; instead, they correspond to the timewhen users sync their PDA device and are probably about to go mobile. As discussedin Section 1.4.2.1, the Web site designers must architect the system to handle a largeburst of traffic or change the PDA synchronization protocol; furthermore, the Website can utilize the knowledge of the client type and provide higher priority to thewireless traffic.
1.4.4 Summary of Browse Log Analyses
We summarize our observations of the browse accesses at the Web site designedspecifically for mobile users.
1. The page sizes of the Web replies are small. In particular, most of the repliesto wireless clients are less than 3 KBytes, and those to offline users are lessthan 6 KBytes.
2. Our content analysis shows that stock quotes, news, and yellow pages areaccessed most frequently. The relative importance of different categorieschanges little between weekdays and weekends, except that there are fewerstock quotes and more sports related accesses on weekends. However, theamount of data accessed over the weekend drops by a significant amount.Moreover, as expected, the Web server load exhibits a similar usage pattern.
3. The popularity of Web pages defined in terms of urls does not closely follow aZipf-like distribution, while Web pages defined in terms of url and parametercombinations come close to a Zipf-like distribution. Moreover, majority ofaccesses are concentrated on a small number of documents. For example,0.1% — 0.5% queries account for 90% requests.
26 CHARACTERIZING WEB WORKLOAD FOR MOBILE CLIENTS
4. There is a significant variation in the load placed by different users on the Webserver; some users issue orders of magnitude more requests than other users.A small fraction of users issue a majority of the requests, e.g., 10% of the usersissue more than 80% of the requests.
5. The traffic generated by offline users due to an automated sync program isbursty and can place a significant load on the Web server. For example, morethan 60% of the Web pages accessed at the Web server are due to offline PDAusers and less than 7% of the accesses are due to wireless clients. Such typeof automated accesses are not as common at regular Web servers.
6. Our analysis shows that users tend to have short sessions when interacting withthe Web site: in 95% of the cases, the session duration is less than 3 minutes.
7. The set of popular queries remains relatively stable over time. For instance,among the top 100 popular queries, more than 80% remain popular during aweek; and among the top 1000 popular queries, more than 70% remain popularduring a week.
8. The geographical locality in users’ browsing requests is insignificant. The per-centage of queries that are shared within a geographical cluster is comparableto what are shared within a random cluster. This is likely due to the fact thatmost popular queries are shared globally. These queries include the front pagesfor email login, news, sports, and signup application, etc.
These observations have the following implications:
1. Most replies sent to wireless and offline users are small. Thus, the wirelessWeb server should be optimized for sending short replies.
2. The fact that offline PDA users generate significantly more bursty requests thanwireless users suggests that system designers should consider giving wirelessclients higher priority over offline PDA users. Alternatively, they shouldencourage users to register their profiles with the Web server and change theautomated sync program to send only the initial request to indicate the clientis ready for sync.
3. Our heuristic to determine the session-inactivity period shows that the session-inactivity period is somewhere between 30 to 45 seconds, which suggests thatdynamically-assigned IP addresses for WAP may be reclaimed more quicklythan the 90 second duration suggested in [21].
4. The high concentration of browse requests to a small number of unique docu-ments implies that caching the output of popular queries could be very effectivein reducing the wireless Web server load.
5. The set of popular wireless Web queries is relatively stable over time. Thus,we can optimize the server’s performance over this stable set of queries forcaching and database layout.

CHARACTERIZING NOTIFICATION WORKLOAD 27
6. The lack of geographical locality in browsing over wireless channels impliesthat when we replicate wireless Web servers across different geographicalregions, the workload perceived at different locations is likely to be similar.Since the data is simply replicated at every site, the same optimizations, such asoptimization of the database layout, can be applied at all locations to improveperformance.
7. The substantial variation of the load observed by the Web server during differenttimes of day suggests that the server administrator can utilize night time, whenthe load is light, for daily maintenance.
1.5 CHARACTERIZING NOTIFICATION WORKLOAD
In this section, we analyze notification logs. In the following discussion, we use theterm notification document to refer to a unique document that may be sent to multipleusers; we refer to each such transmission as a notification message, which includesduplicates.
Table 1.2 shows the overall statistics for the notification logs. In one week, the serversent out 3.25 million notification messages for a total of 295 megabytes. One fourthof the messages sent out were distinct, while the remaining messages had the samecontent but sent to different users (in some cases, the same message is sent to a usermultiple times, e.g., if a user has registered for information to be delivered at specifictimes and the information has not changed during that period). The significant amountof duplication in messages sent to different users suggests that sending notificationvia application-level multicast would be useful; Section 1.5.1.3 examines this issuein greater depth. There were 200,860 distinct users, of which 99.02% were wirelessusers. The notifications were sent at the average rate of 323 messages per minute.The peak rate was much higher, approximately 30 times as high as the average rate.
Total messages 3,251,537Total distinct messages 884,272Total bytes transmitted 295 MBTotal bytes of unique messagestransmitted
71.3 MB
Total number of users 200,860Total number of wireless users 198,882Avg. notification rate 322.57 (msgs/min)Peak notification rate 9502 (msgs/min)
Table 1.2 Overall statistics for the notification logs for the period from Aug. 20 throughAug. 26, 2000.
28 CHARACTERIZING WEB WORKLOAD FOR MOBILE CLIENTS
1.5.1 Content Analysis
We begin our analysis by looking at the content of the notifications sent to varioususers.
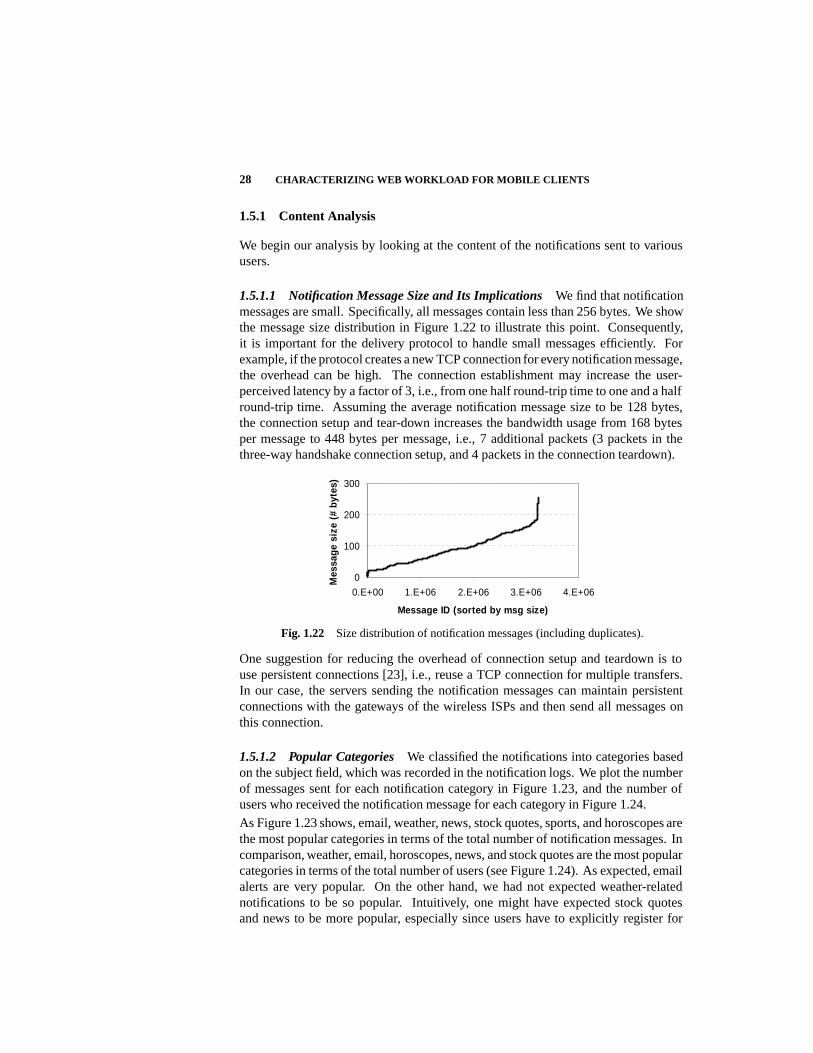
1.5.1.1 Notification Message Size and Its Implications We find that notificationmessages are small. Specifically, all messages contain less than 256 bytes. We showthe message size distribution in Figure 1.22 to illustrate this point. Consequently,it is important for the delivery protocol to handle small messages efficiently. Forexample, if the protocol creates a new TCP connection for every notification message,the overhead can be high. The connection establishment may increase the user-perceived latency by a factor of 3, i.e., from one half round-trip time to one and a halfround-trip time. Assuming the average notification message size to be 128 bytes,the connection setup and tear-down increases the bandwidth usage from 168 bytesper message to 448 bytes per message, i.e., 7 additional packets (3 packets in thethree-way handshake connection setup, and 4 packets in the connection teardown).
0
100
200
300
0.E+00 1.E+06 2.E+06 3.E+06 4.E+06
Message ID (sorted by msg size)
Mes
sage
size
(#by
tes)
Fig. 1.22 Size distribution of notification messages (including duplicates).
One suggestion for reducing the overhead of connection setup and teardown is touse persistent connections [23], i.e., reuse a TCP connection for multiple transfers.In our case, the servers sending the notification messages can maintain persistentconnections with the gateways of the wireless ISPs and then send all messages onthis connection.
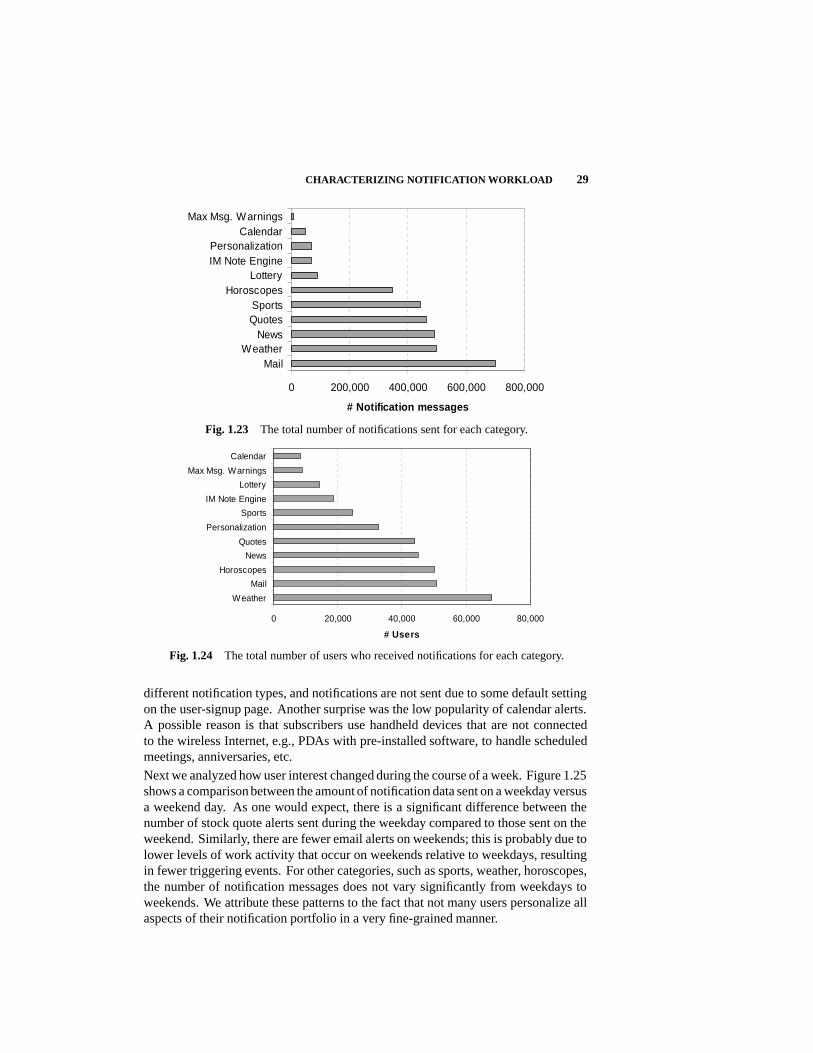
1.5.1.2 Popular Categories We classified the notifications into categories basedon the subject field, which was recorded in the notification logs. We plot the numberof messages sent for each notification category in Figure 1.23, and the number ofusers who received the notification message for each category in Figure 1.24.
As Figure 1.23 shows, email, weather, news, stock quotes, sports, and horoscopes arethe most popular categories in terms of the total number of notification messages. Incomparison, weather, email, horoscopes, news, and stock quotes are the most popularcategories in terms of the total number of users (see Figure 1.24). As expected, emailalerts are very popular. On the other hand, we had not expected weather-relatednotifications to be so popular. Intuitively, one might have expected stock quotesand news to be more popular, especially since users have to explicitly register for
CHARACTERIZING NOTIFICATION WORKLOAD 29
0 200,000 400,000 600,000 800,000
MailWeather
NewsQuotesSports
HoroscopesLottery
IM Note EnginePersonalization
CalendarMax Msg. Warnings
# Notification messages
Fig. 1.23 The total number of notifications sent for each category.
0 20,000 40,000 60,000 80,000
Weather
Horoscopes
News
Quotes
Personalization
Sports
IM Note Engine
Lottery
Max Msg. Warnings
Calendar
# Users
Fig. 1.24 The total number of users who received notifications for each category.
different notification types, and notifications are not sent due to some default settingon the user-signup page. Another surprise was the low popularity of calendar alerts.A possible reason is that subscribers use handheld devices that are not connectedto the wireless Internet, e.g., PDAs with pre-installed software, to handle scheduledmeetings, anniversaries, etc.
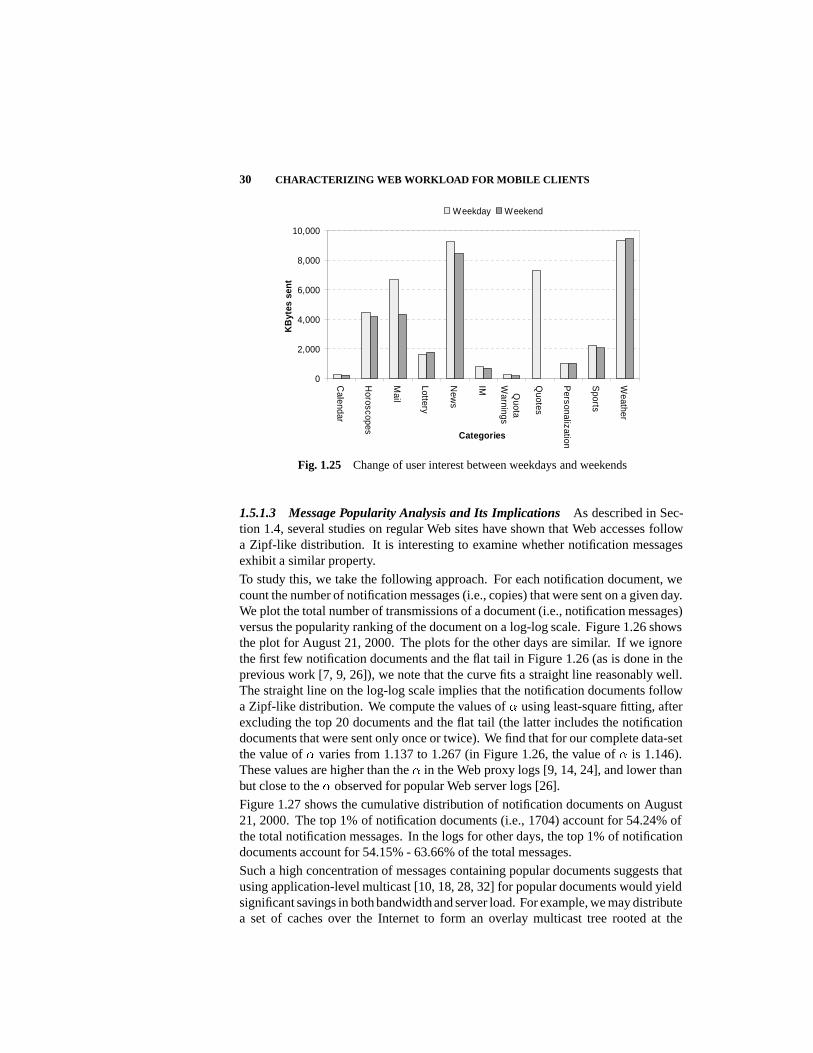
Next we analyzed how user interest changed during the course of a week. Figure 1.25shows a comparison between the amount of notification data sent on a weekday versusa weekend day. As one would expect, there is a significant difference between thenumber of stock quote alerts sent during the weekday compared to those sent on theweekend. Similarly, there are fewer email alerts on weekends; this is probably due tolower levels of work activity that occur on weekends relative to weekdays, resultingin fewer triggering events. For other categories, such as sports, weather, horoscopes,the number of notification messages does not vary significantly from weekdays toweekends. We attribute these patterns to the fact that not many users personalize allaspects of their notification portfolio in a very fine-grained manner.
30 CHARACTERIZING WEB WORKLOAD FOR MOBILE CLIENTS
0
2,000
4,000
6,000
8,000
10,000
Calendar
Horoscopes
Lottery
New
s
IM Quota
Warnings
Quotes
Personalization
Sports
Weather
Categories
KB
ytes
sent
Weekday Weekend
Fig. 1.25 Change of user interest between weekdays and weekends
1.5.1.3 Message Popularity Analysis and Its Implications As described in Sec-tion 1.4, several studies on regular Web sites have shown that Web accesses followa Zipf-like distribution. It is interesting to examine whether notification messagesexhibit a similar property.
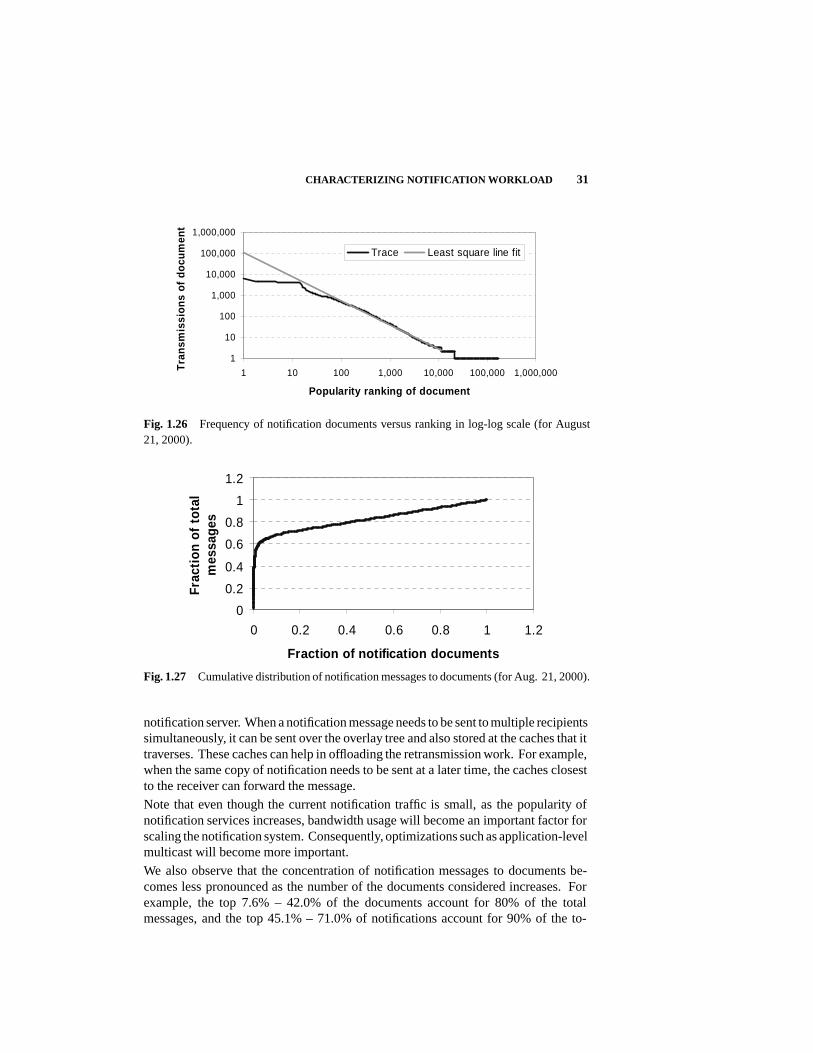
To study this, we take the following approach. For each notification document, wecount the number of notification messages (i.e., copies) that were sent on a given day.We plot the total number of transmissions of a document (i.e., notification messages)versus the popularity ranking of the document on a log-log scale. Figure 1.26 showsthe plot for August 21, 2000. The plots for the other days are similar. If we ignorethe first few notification documents and the flat tail in Figure 1.26 (as is done in theprevious work [7, 9, 26]), we note that the curve fits a straight line reasonably well.The straight line on the log-log scale implies that the notification documents followa Zipf-like distribution. We compute the values of � using least-square fitting, afterexcluding the top 20 documents and the flat tail (the latter includes the notificationdocuments that were sent only once or twice). We find that for our complete data-setthe value of � varies from 1.137 to 1.267 (in Figure 1.26, the value of � is 1.146).These values are higher than the � in the Web proxy logs [9, 14, 24], and lower thanbut close to the � observed for popular Web server logs [26].
Figure 1.27 shows the cumulative distribution of notification documents on August21, 2000. The top 1% of notification documents (i.e., 1704) account for 54.24% ofthe total notification messages. In the logs for other days, the top 1% of notificationdocuments account for 54.15% - 63.66% of the total messages.
Such a high concentration of messages containing popular documents suggests thatusing application-level multicast [10, 18, 28, 32] for popular documents would yieldsignificant savings in both bandwidth and server load. For example, we may distributea set of caches over the Internet to form an overlay multicast tree rooted at the
CHARACTERIZING NOTIFICATION WORKLOAD 31
1
10
100
1,000
10,000
100,000
1,000,000
1 10 100 1,000 10,000 100,000 1,000,000
Popularity ranking of document
Tra
nsm
issi
ons
ofd
ocu
men
t
Trace Least square line fit
Fig. 1.26 Frequency of notification documents versus ranking in log-log scale (for August21, 2000).
0
0.2
0.4
0.6
0.8
1
1.2
0 0.2 0.4 0.6 0.8 1 1.2
Fraction of notification documents
Frac
tion
ofto
tal
mes
sage
s
Fig. 1.27 Cumulative distribution of notification messages to documents (for Aug. 21, 2000).
notification server. When a notification message needs to be sent to multiple recipientssimultaneously, it can be sent over the overlay tree and also stored at the caches that ittraverses. These caches can help in offloading the retransmission work. For example,when the same copy of notification needs to be sent at a later time, the caches closestto the receiver can forward the message.
Note that even though the current notification traffic is small, as the popularity ofnotification services increases, bandwidth usage will become an important factor forscaling the notification system. Consequently, optimizations such as application-levelmulticast will become more important.
We also observe that the concentration of notification messages to documents be-comes less pronounced as the number of the documents considered increases. Forexample, the top 7.6% – 42.0% of the documents account for 80% of the totalmessages, and the top 45.1% – 71.0% of notifications account for 90% of the to-
32 CHARACTERIZING WEB WORKLOAD FOR MOBILE CLIENTS
tal messages. This implies that a large performance benefit can be obtained bymulticasting only the most popular notification documents.
1.5.2 User Behavior Analysis
We study two aspects of user behavior: (i) the distribution of load that users place onthe server, and (ii) the spatial locality of user interest.
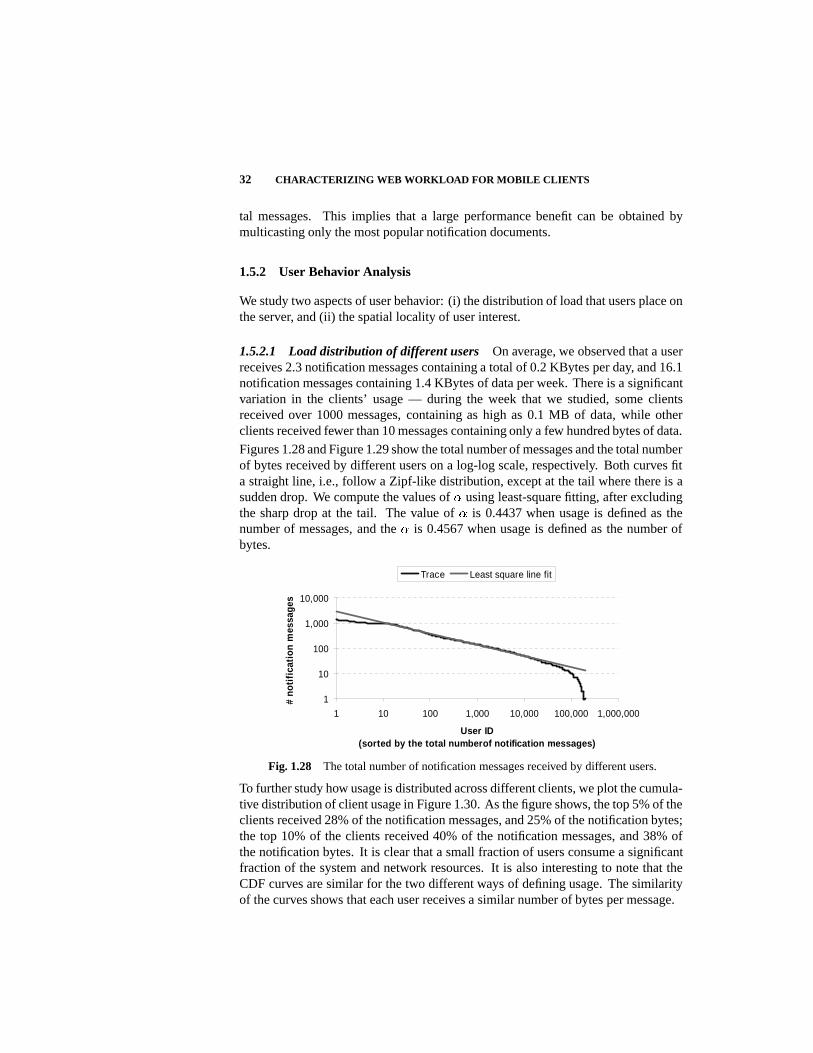
1.5.2.1 Load distribution of different users On average, we observed that a userreceives 2.3 notification messages containing a total of 0.2 KBytes per day, and 16.1notification messages containing 1.4 KBytes of data per week. There is a significantvariation in the clients’ usage — during the week that we studied, some clientsreceived over 1000 messages, containing as high as 0.1 MB of data, while otherclients received fewer than 10 messages containing only a few hundred bytes of data.
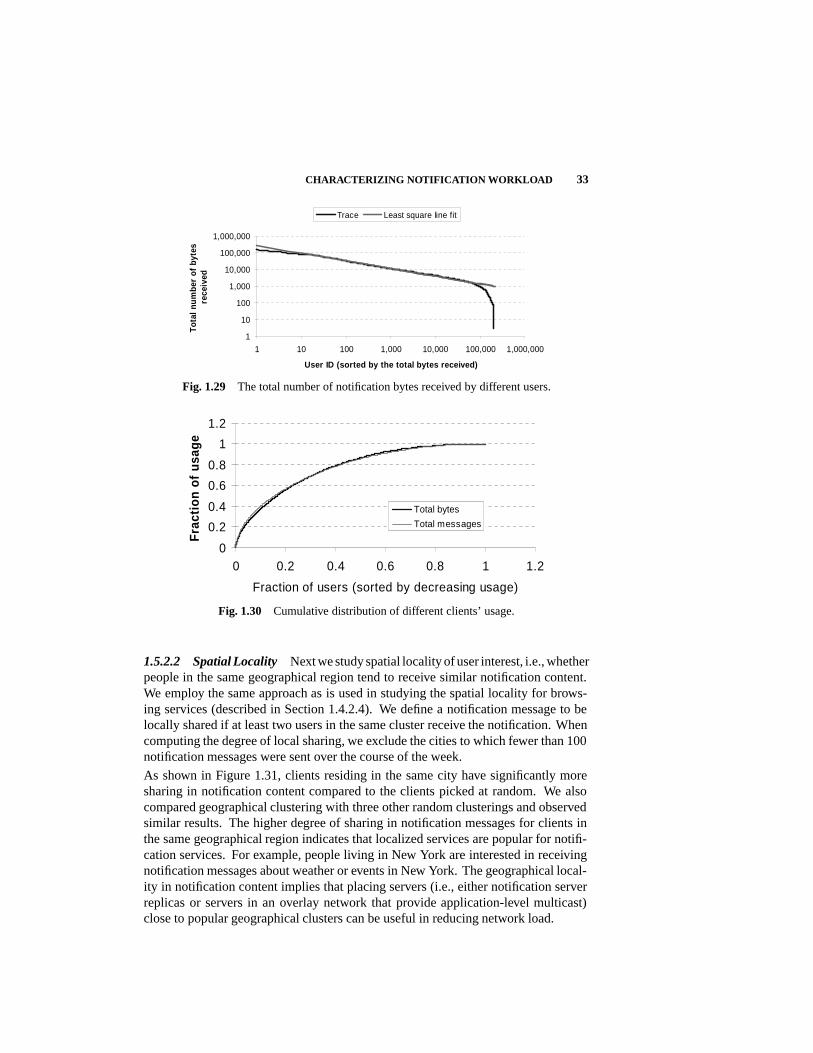
Figures 1.28 and Figure 1.29 show the total number of messages and the total numberof bytes received by different users on a log-log scale, respectively. Both curves fita straight line, i.e., follow a Zipf-like distribution, except at the tail where there is asudden drop. We compute the values of � using least-square fitting, after excludingthe sharp drop at the tail. The value of � is 0.4437 when usage is defined as thenumber of messages, and the � is 0.4567 when usage is defined as the number ofbytes.
1
10
100
1,000
10,000
1 10 100 1,000 10,000 100,000 1,000,000
User ID(sorted by the total numberof notification messages)
#no
tifi
cati
onm
essa
ges
Trace Least square line fit
Fig. 1.28 The total number of notification messages received by different users.
To further study how usage is distributed across different clients, we plot the cumula-tive distribution of client usage in Figure 1.30. As the figure shows, the top 5% of theclients received 28% of the notification messages, and 25% of the notification bytes;the top 10% of the clients received 40% of the notification messages, and 38% ofthe notification bytes. It is clear that a small fraction of users consume a significantfraction of the system and network resources. It is also interesting to note that theCDF curves are similar for the two different ways of defining usage. The similarityof the curves shows that each user receives a similar number of bytes per message.
CHARACTERIZING NOTIFICATION WORKLOAD 33
1
10
100
1,000
10,000
100,000
1,000,000
1 10 100 1,000 10,000 100,000 1,000,000
User ID (sorted by the total bytes received)
Tota
lnum
ber
ofby
tes
rece
ived
Trace Least square line fit
Fig. 1.29 The total number of notification bytes received by different users.
0
0.2
0.4
0.6
0.8
1
1.2
0 0.2 0.4 0.6 0.8 1 1.2
Fraction of users (sorted by decreasing usage)
Fra
ctio
nof
usag
e
Total bytes
Total messages
Fig. 1.30 Cumulative distribution of different clients’ usage.
1.5.2.2 Spatial Locality Next we study spatial locality of user interest, i.e., whetherpeople in the same geographical region tend to receive similar notification content.We employ the same approach as is used in studying the spatial locality for brows-ing services (described in Section 1.4.2.4). We define a notification message to belocally shared if at least two users in the same cluster receive the notification. Whencomputing the degree of local sharing, we exclude the cities to which fewer than 100notification messages were sent over the course of the week.
As shown in Figure 1.31, clients residing in the same city have significantly moresharing in notification content compared to the clients picked at random. We alsocompared geographical clustering with three other random clusterings and observedsimilar results. The higher degree of sharing in notification messages for clients inthe same geographical region indicates that localized services are popular for notifi-cation services. For example, people living in New York are interested in receivingnotification messages about weather or events in New York. The geographical local-ity in notification content implies that placing servers (i.e., either notification serverreplicas or servers in an overlay network that provide application-level multicast)close to popular geographical clusters can be useful in reducing network load.
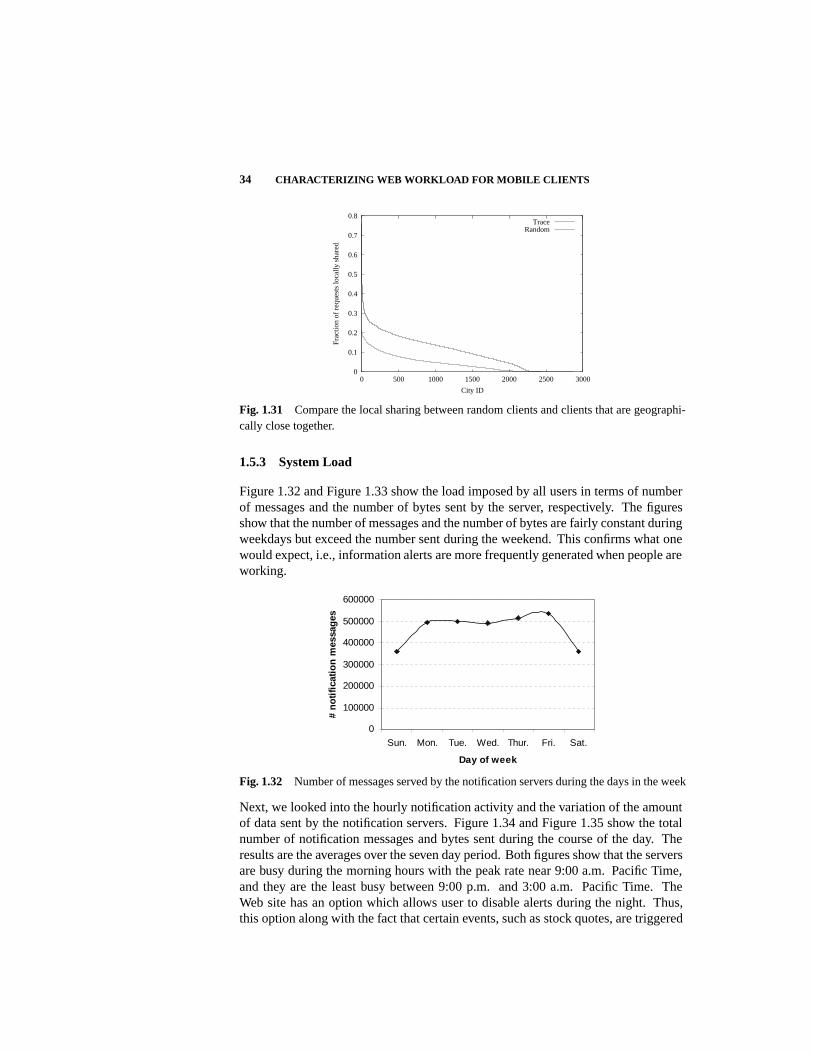
34 CHARACTERIZING WEB WORKLOAD FOR MOBILE CLIENTS
0
0.1
0.2
0.3
0.4
0.5
0.6
0.7
0.8
0 500 1000 1500 2000 2500 3000
Frac
tion
of r
eque
sts
loca
lly s
hare
d
City ID
TraceRandom
Fig. 1.31 Compare the local sharing between random clients and clients that are geographi-cally close together.
1.5.3 System Load
Figure 1.32 and Figure 1.33 show the load imposed by all users in terms of numberof messages and the number of bytes sent by the server, respectively. The figuresshow that the number of messages and the number of bytes are fairly constant duringweekdays but exceed the number sent during the weekend. This confirms what onewould expect, i.e., information alerts are more frequently generated when people areworking.
0
100000
200000
300000
400000
500000
600000
Sun. Mon. Tue. Wed. Thur. Fri. Sat.
Day of week
#n
oti
fica
tio
nm
essa
ges
Fig. 1.32 Number of messages served by the notification servers during the days in the week
Next, we looked into the hourly notification activity and the variation of the amountof data sent by the notification servers. Figure 1.34 and Figure 1.35 show the totalnumber of notification messages and bytes sent during the course of the day. Theresults are the averages over the seven day period. Both figures show that the serversare busy during the morning hours with the peak rate near 9:00 a.m. Pacific Time,and they are the least busy between 9:00 p.m. and 3:00 a.m. Pacific Time. TheWeb site has an option which allows user to disable alerts during the night. Thus,this option along with the fact that certain events, such as stock quotes, are triggered
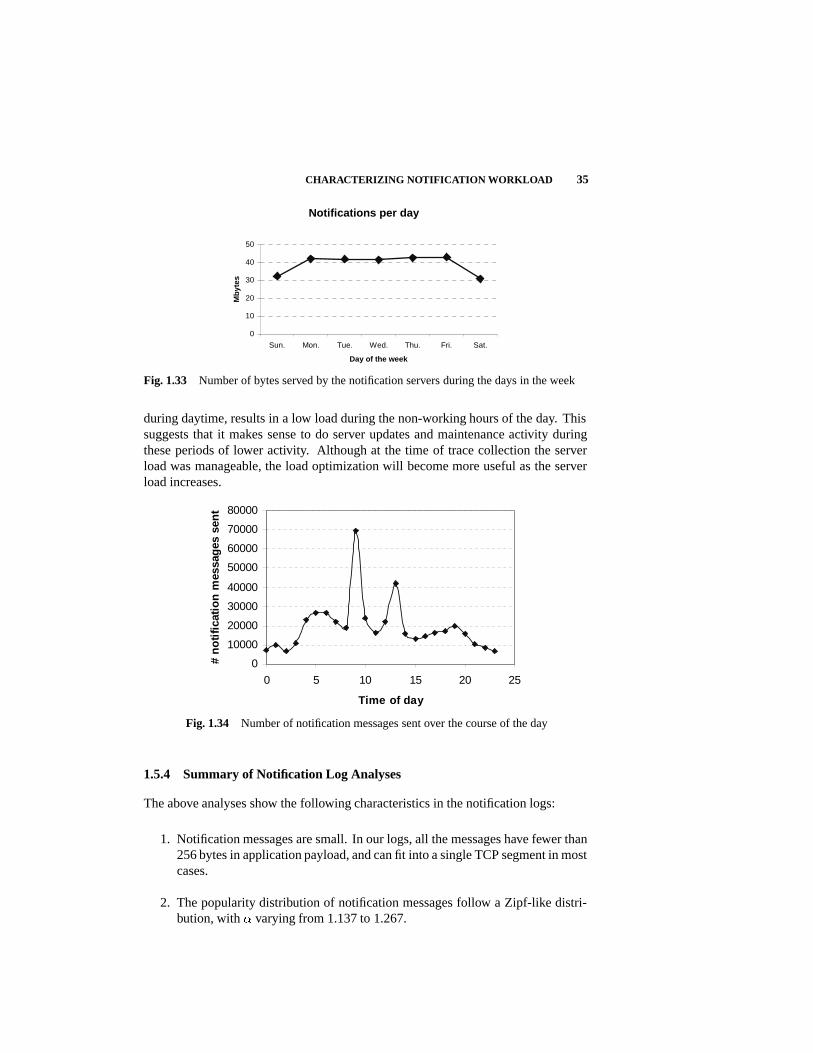
CHARACTERIZING NOTIFICATION WORKLOAD 35
Notifications per day
0
10
20
30
40
50
Sun. Mon. Tue. Wed. Thu. Fri. Sat.
Day of the week
Mb
ytes
Fig. 1.33 Number of bytes served by the notification servers during the days in the week
during daytime, results in a low load during the non-working hours of the day. Thissuggests that it makes sense to do server updates and maintenance activity duringthese periods of lower activity. Although at the time of trace collection the serverload was manageable, the load optimization will become more useful as the serverload increases.
0
10000
20000
30000
40000
50000
60000
70000
80000
0 5 10 15 20 25
Time of day
#n
oti
fica
tio
nm
essa
ges
sen
t
Fig. 1.34 Number of notification messages sent over the course of the day
1.5.4 Summary of Notification Log Analyses
The above analyses show the following characteristics in the notification logs:
1. Notification messages are small. In our logs, all the messages have fewer than256 bytes in application payload, and can fit into a single TCP segment in mostcases.
2. The popularity distribution of notification messages follow a Zipf-like distri-bution, with � varying from 1.137 to 1.267.
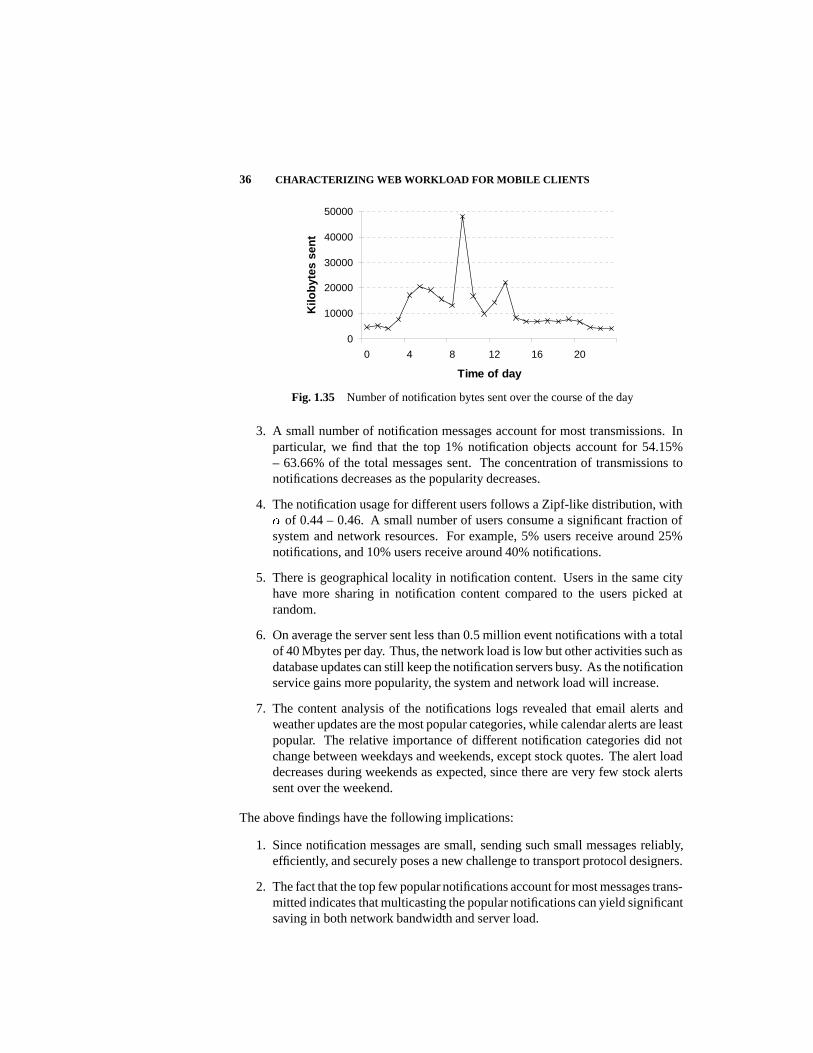
36 CHARACTERIZING WEB WORKLOAD FOR MOBILE CLIENTS
0
10000
20000
30000
40000
50000
0 4 8 12 16 20
Time of day
Kilo
byt
esse
nt
Fig. 1.35 Number of notification bytes sent over the course of the day
3. A small number of notification messages account for most transmissions. Inparticular, we find that the top 1% notification objects account for 54.15%– 63.66% of the total messages sent. The concentration of transmissions tonotifications decreases as the popularity decreases.
4. The notification usage for different users follows a Zipf-like distribution, with� of 0.44 – 0.46. A small number of users consume a significant fraction ofsystem and network resources. For example, 5% users receive around 25%notifications, and 10% users receive around 40% notifications.
5. There is geographical locality in notification content. Users in the same cityhave more sharing in notification content compared to the users picked atrandom.
6. On average the server sent less than 0.5 million event notifications with a totalof 40 Mbytes per day. Thus, the network load is low but other activities such asdatabase updates can still keep the notification servers busy. As the notificationservice gains more popularity, the system and network load will increase.
7. The content analysis of the notifications logs revealed that email alerts andweather updates are the most popular categories, while calendar alerts are leastpopular. The relative importance of different notification categories did notchange between weekdays and weekends, except stock quotes. The alert loaddecreases during weekends as expected, since there are very few stock alertssent over the weekend.
The above findings have the following implications:
1. Since notification messages are small, sending such small messages reliably,efficiently, and securely poses a new challenge to transport protocol designers.
2. The fact that the top few popular notifications account for most messages trans-mitted indicates that multicasting the popular notifications can yield significantsaving in both network bandwidth and server load.
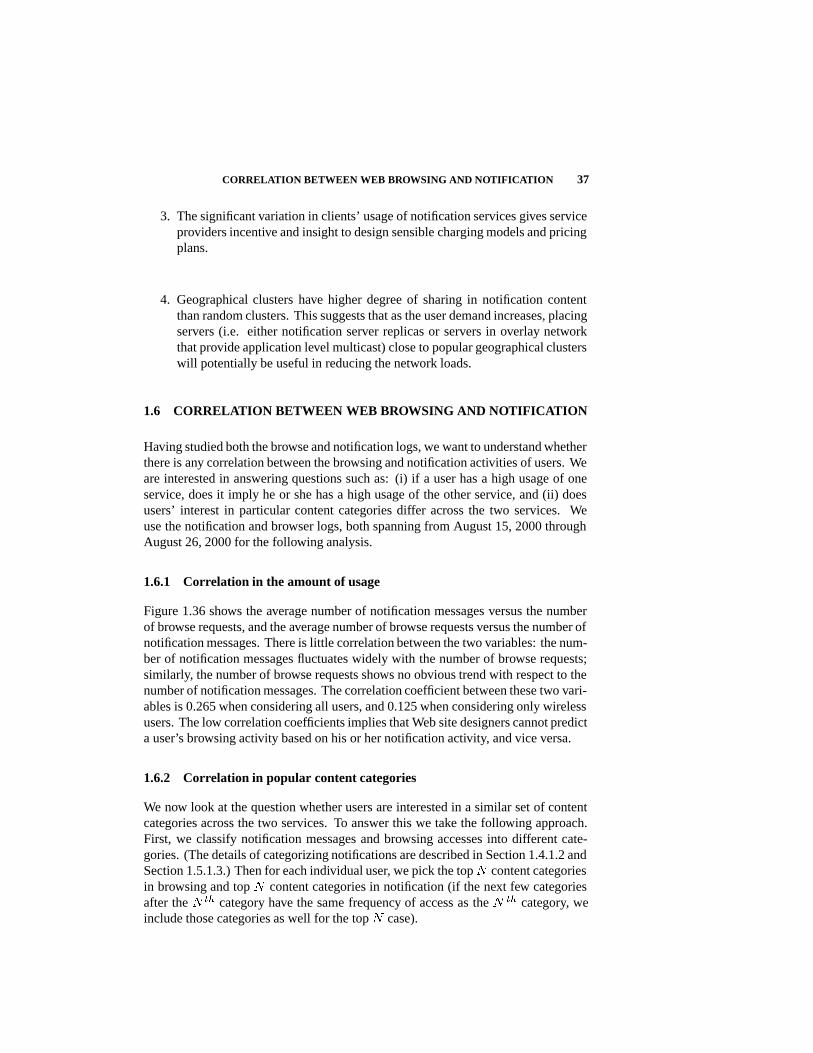
CORRELATION BETWEEN WEB BROWSING AND NOTIFICATION 37
3. The significant variation in clients’ usage of notification services gives serviceproviders incentive and insight to design sensible charging models and pricingplans.
4. Geographical clusters have higher degree of sharing in notification contentthan random clusters. This suggests that as the user demand increases, placingservers (i.e. either notification server replicas or servers in overlay networkthat provide application level multicast) close to popular geographical clusterswill potentially be useful in reducing the network loads.
1.6 CORRELATION BETWEEN WEB BROWSING AND NOTIFICATION
Having studied both the browse and notification logs, we want to understand whetherthere is any correlation between the browsing and notification activities of users. Weare interested in answering questions such as: (i) if a user has a high usage of oneservice, does it imply he or she has a high usage of the other service, and (ii) doesusers’ interest in particular content categories differ across the two services. Weuse the notification and browser logs, both spanning from August 15, 2000 throughAugust 26, 2000 for the following analysis.
1.6.1 Correlation in the amount of usage
Figure 1.36 shows the average number of notification messages versus the numberof browse requests, and the average number of browse requests versus the number ofnotification messages. There is little correlation between the two variables: the num-ber of notification messages fluctuates widely with the number of browse requests;similarly, the number of browse requests shows no obvious trend with respect to thenumber of notification messages. The correlation coefficient between these two vari-ables is 0.265 when considering all users, and 0.125 when considering only wirelessusers. The low correlation coefficients implies that Web site designers cannot predicta user’s browsing activity based on his or her notification activity, and vice versa.
1.6.2 Correlation in popular content categories
We now look at the question whether users are interested in a similar set of contentcategories across the two services. To answer this we take the following approach.First, we classify notification messages and browsing accesses into different cate-gories. (The details of categorizing notifications are described in Section 1.4.1.2 andSection 1.5.1.3.) Then for each individual user, we pick the top � content categoriesin browsing and top � content categories in notification (if the next few categoriesafter the � �� category have the same frequency of access as the � �� category, weinclude those categories as well for the top � case).
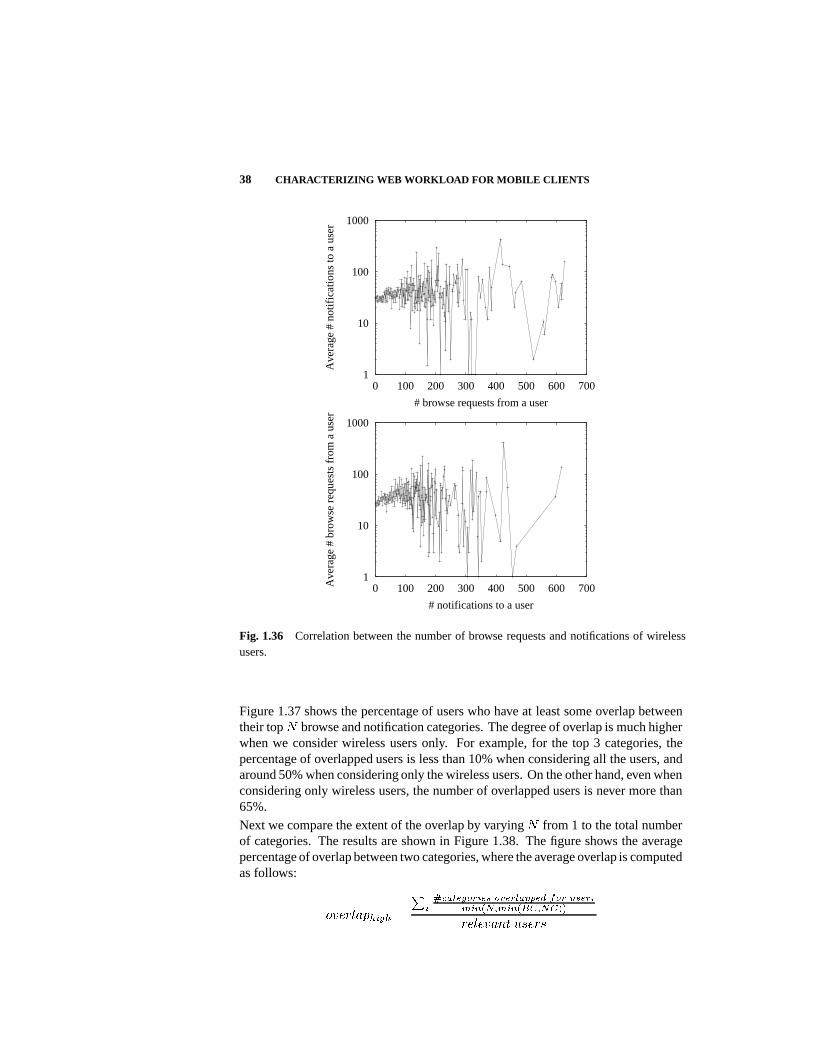
38 CHARACTERIZING WEB WORKLOAD FOR MOBILE CLIENTS
1
10
100
1000
0 100 200 300 400 500 600 700
Ave
rage
# n
otif
icat
ions
to a
use
r
# browse requests from a user
1
10
100
1000
0 100 200 300 400 500 600 700Ave
rage
# b
row
se r
eque
sts
from
a u
ser
# notifications to a user
Fig. 1.36 Correlation between the number of browse requests and notifications of wirelessusers.
Figure 1.37 shows the percentage of users who have at least some overlap betweentheir top � browse and notification categories. The degree of overlap is much higherwhen we consider wireless users only. For example, for the top 3 categories, thepercentage of overlapped users is less than 10% when considering all the users, andaround 50% when considering only the wireless users. On the other hand, even whenconsidering only wireless users, the number of overlapped users is never more than65%.
Next we compare the extent of the overlap by varying � from 1 to the total numberof categories. The results are shown in Figure 1.38. The figure shows the averagepercentage of overlap between two categories, where the average overlap is computedas follows:
���������� �
����������� ����� �� �� ���
�����������������
������� � ��
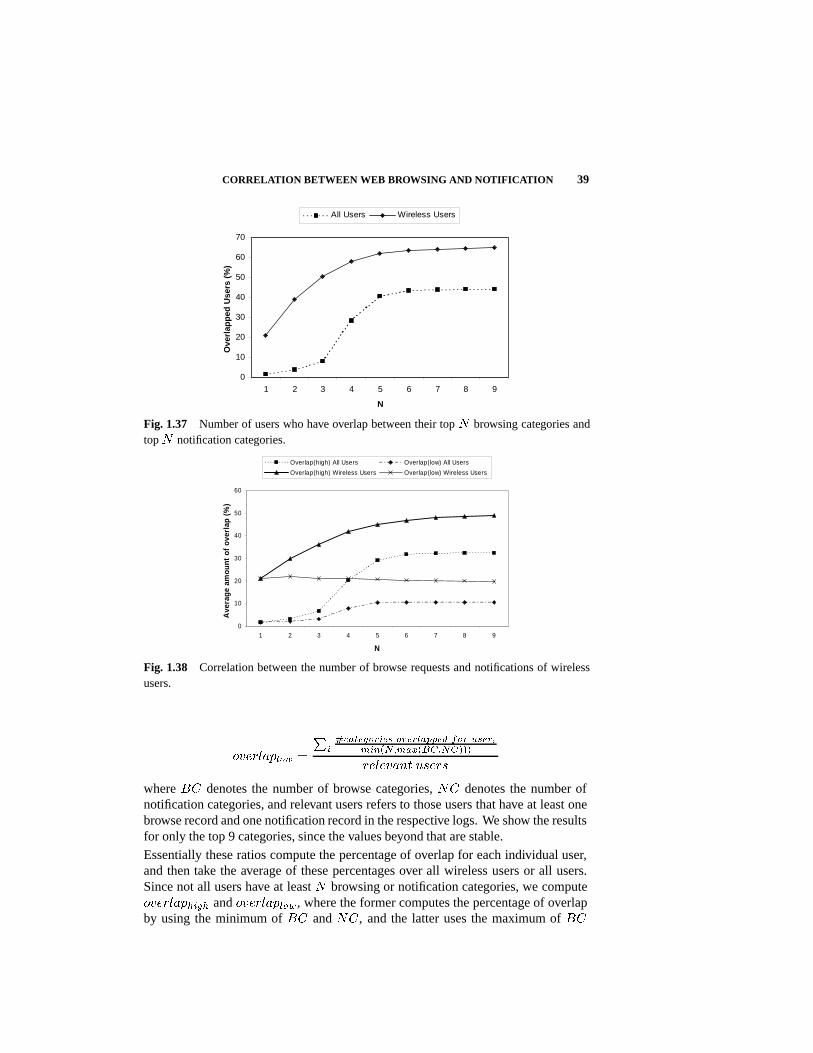
CORRELATION BETWEEN WEB BROWSING AND NOTIFICATION 39
0
10
20
30
40
50
60
70
1 2 3 4 5 6 7 8 9
N
Ove
rlap
ped
Use
rs(%
)All Users Wireless Users
Fig. 1.37 Number of users who have overlap between their top � browsing categories andtop � notification categories.
0
10
20
30
40
50
60
1 2 3 4 5 6 7 8 9
N
Ave
rage
amou
ntof
over
lap
(%)
Overlap(high) All Users Overlap(low) All Users
Overlap(high) Wireless Users Overlap(low) Wireless Users
Fig. 1.38 Correlation between the number of browse requests and notifications of wirelessusers.
��������� �
����������� ����� �� �� ���
������������������
������� � ��
where �� denotes the number of browse categories, �� denotes the number ofnotification categories, and relevant users refers to those users that have at least onebrowse record and one notification record in the respective logs. We show the resultsfor only the top 9 categories, since the values beyond that are stable.
Essentially these ratios compute the percentage of overlap for each individual user,and then take the average of these percentages over all wireless users or all users.Since not all users have at least � browsing or notification categories, we compute���������� and ���������, where the former computes the percentage of overlapby using the minimum of �� and ��, and the latter uses the maximum of ��
40 CHARACTERIZING WEB WORKLOAD FOR MOBILE CLIENTS
and ��. The figure shows that the amount of overlap is considerably higher whenconsidering only wireless users. For example, for the top three categories, the overlapis less than 7% when considering all users. In comparison, for wireless users, the��������� and ���������� values are 21% and 36%, respectively. We also observethat the effect of increasing � is small. Even when � is 8, the percentage of overlapis less than 50% for wireless users.
The above results indicate that wireless users have moderate correlation in the waythey use browse and notification services. In comparison, the correlation is muchlower when considering all users. This is because the most popular browsing cate-gories for desktop users are sign-up services, direction, and general help, whereasnotification is usually not used to deliver these types of content. On the other hand,some wireless users are interested in both browsing and receiving notifications aboutemails, stock quotes, personalization, news and sports. However, the degree of cor-relation is limited, and service providers cannot solely rely on a user’s notificationprofile to determine what content he or she may be interested in browsing.
1.6.3 Summary
To summarize, we observe that there is little correlation between clients’ notificationusage and their browsing usage. Users with the same amount of notification usagecan exhibit very different browsing usage, and likewise users with the same amountof browsing usage can exhibit very different notification usage.
A user’s popular notification categories have only small to moderate overlap with hisor her popular browsing categories. This indicates that people use the two servicesfor very different purposes. The different characteristics of notification and browsingservices make them suitable for delivering different types of content.
The lack of correlation between users’ browsing activities and notification activitiessuggests that users utilize the two services very differently. Higher usage in notifi-cation services does not imply higher usage in browsing, and vice versa. Web sitedesigners need to be aware that they cannot predict a user’s browsing activities bothin terms of the number of accesses and in terms of the type of content to be accessedonly based on his or her notification profiles. Service providers also need to keep thisin mind when designing pricing plans.
1.7 COMPARISON BETWEEN WORKLOAD OF WIRELINE WEB ANDMOBILE WEB
We now compare and contrast the workload between the Web sites designed forwireline users versus those designed for mobile users.
COMPARISON BETWEEN WORKLOAD OF WIRELINE WEB AND MOBILE WEB 41
1.7.1 Comparison in Web Content
We start by comparing the type, size, and popularity of content offered to wirelineand wireless users.
The content offered to wireline users is richer than the content offered to wirelessusers. However, we believe, as wireless Web services continue to grow, the richnessof content in the two environment will become comparable.
In terms of content size, we observe that the content offered to wireless users tendsto be significantly smaller. This is a consequence of the limited display capabilitiesof wireless devices and limited wireless bandwidth. Even though wireless deviceswill become more powerful and wireless bandwidth will improve in the future, thediscrepancy between wireless and wireline bandwidth and the discrepancy betweendisplay abilities of wireless and wireline devices will not go away. As a result, weexpect that content for wireless uers will remain more compact than that for wirelineusers.
In terms of content popularity, wireless content shares the Zipf-like popularity distri-bution as wireline content; moreover in both cases, a majority of requests are highlyconcentrated on a small number of documents.
1.7.2 Comparison in User Behavior
There is a significant variation in the load placed by different users on the Web serverfor browsing and notification: some users impose significantly higher load on a Webserver than other users. This is in agreement with browsing activities seen at regularWeb servers as well.
In addition, both regular Web servers and the Web server for mobile clients (consid-ered in our analysis) exhibit temporal stability: the set of popular content and queriesremain stable over time.
Spatial locality is observed in notification content (see Section 1.5.2) as well asregular Web server content [26, 31]. Wireless users, however, do not exhibit strongspatial locality in their browsing activities at the Web site we analyzed. This is likelydue to the limited content available at the time of our trace collection. As Web contentbecomes more diversified, we expect that spatial locality in the browsing activities ofwireless users to grow.
1.7.3 Comparison in System Load
The load at Web servers, regardless of whether they serve wireline or wireless clients,exhibit a diurnal and weekly variation. On the other hand, the popular Web server thatwe analyzed for mobile clients experienced significantly smaller load than popularWeb servers for wireline clients, e.g., World Cup Web site [3] and MSNBC Website [26]. However, we do expect that the load at the wireless Web server will growas the popularity of wireless devices and services increases.
42 CHARACTERIZING WEB WORKLOAD FOR MOBILE CLIENTS
In addition, the Web site for mobile clients has more heterogeneous population ofusers, including wireless, offline, and desktop clients. This offers additional oppor-tunity for performance optimization, such as service differentiation across differenttypes of clients.
1.8 SUMMARY
In this chapter, we presented a detailed analyses of the workload observed at apopular commercial Web server that provides browse and notification services formobile wireless users. We compared the workload of mobile users with that observedby regular Web servers. Our analyses suggests a number of important implicationson Web-server design optimizations, capacity planning, caching, multicast, and otherdesign strategies.
When reading the results, it is important to note that Web workloads may vary bothover time and across different Web sites. Therefore, we encourage others to stepforward to provide more data points, and compare and contrast their studies withours.
Internet access via small devices such as cell-phones and handheld devices is expectedto increase tremendously over the next few years. We hope that this chapter opens adoor to a better understanding of the dynamics of such wireless systems.
References
1. S. Agrawal, S. Chaudhuri, and V. Narasayya. Automated Selection of Mate-rialized Views and Indexes for SQL Databases. In Proceedings of the 26thInternational Conference on Very Large Databases (VLDB00), September 2000.
2. V. Almeida, A. Bestavros, M. Crovella, and A. de Oliveira. Characterizingreference locality in the www. In Proc. of the Fourth International Conferenceon Parallel and Distributed Information Systems (PDIS ’96), December 1996.
3. M. Arlitt and T. Jin. Workload characterization of the 1998 World Cup Web site.IEEE Network, pages 30 – 37, May/June 2000.
4. M. F. Arlitt and C. L. Williamson. Internet Web Servers: Workload Characteriza-tion and Performance Implications. In IEEE/ACM Transactions on Networking,pages 631–645, 1997.
5. A. Balachandran, G. Voelker, P. Bahl, and V. Rangan. Characterizing UserBehavior and Network Performance in a Public Wireless LAN. In Proceedingsof ACM SIGMETRICS ’02, June 2002.
6. M. Balazinska and P. Castro. Characterizing mobility and network usage incorporate wireless local-area network. In In Proc. of ACM MOBISYS ’2003,May 2003.
7. P. Barford, A. Bestavros, A. Bradley, and M. Crovella. Changes in Web ClientAccess Patterns. World Wide Web Journal, 1999.
8. P. Barford and M. Crovella. Generating representative web workloads for net-work and server performance evaluation. In Proc. of ACM SIGMETRICS ’98,1998.
9. L. Breslau, P. Cao, L. Fan, G. Phillips, and S. Shenker. Web Caching and Zipf-like Distributions: Evidence and Implications. In Proceedings of INFOCOMM’99, March 1999.
10. Y. Chu, S. Rao, S. Seshan, and H. Zhang. Enabling Conferencing Applicationson the Internet using an Overlay Multicast Architecture. In Proceedings of ACMSIGCOMM 2001, August 2001.
43
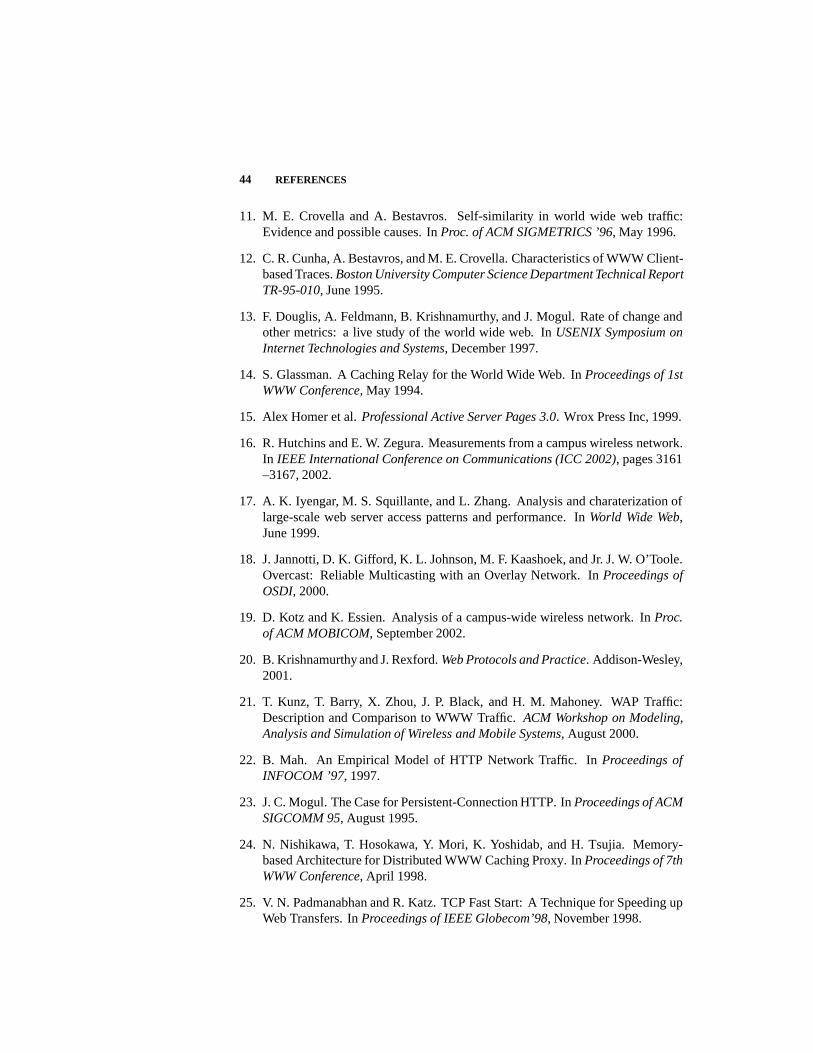
44 REFERENCES
11. M. E. Crovella and A. Bestavros. Self-similarity in world wide web traffic:Evidence and possible causes. In Proc. of ACM SIGMETRICS ’96, May 1996.
12. C. R. Cunha, A. Bestavros, and M. E. Crovella. Characteristics of WWW Client-based Traces. Boston University Computer Science Department Technical ReportTR-95-010, June 1995.
13. F. Douglis, A. Feldmann, B. Krishnamurthy, and J. Mogul. Rate of change andother metrics: a live study of the world wide web. In USENIX Symposium onInternet Technologies and Systems, December 1997.
14. S. Glassman. A Caching Relay for the World Wide Web. In Proceedings of 1stWWW Conference, May 1994.
15. Alex Homer et al. Professional Active Server Pages 3.0. Wrox Press Inc, 1999.
16. R. Hutchins and E. W. Zegura. Measurements from a campus wireless network.In IEEE International Conference on Communications (ICC 2002), pages 3161–3167, 2002.
17. A. K. Iyengar, M. S. Squillante, and L. Zhang. Analysis and charaterization oflarge-scale web server access patterns and performance. In World Wide Web,June 1999.
18. J. Jannotti, D. K. Gifford, K. L. Johnson, M. F. Kaashoek, and Jr. J. W. O’Toole.Overcast: Reliable Multicasting with an Overlay Network. In Proceedings ofOSDI, 2000.
19. D. Kotz and K. Essien. Analysis of a campus-wide wireless network. In Proc.of ACM MOBICOM, September 2002.
20. B. Krishnamurthy and J. Rexford. Web Protocols and Practice. Addison-Wesley,2001.
21. T. Kunz, T. Barry, X. Zhou, J. P. Black, and H. M. Mahoney. WAP Traffic:Description and Comparison to WWW Traffic. ACM Workshop on Modeling,Analysis and Simulation of Wireless and Mobile Systems, August 2000.
22. B. Mah. An Empirical Model of HTTP Network Traffic. In Proceedings ofINFOCOM ’97, 1997.
23. J. C. Mogul. The Case for Persistent-Connection HTTP. In Proceedings of ACMSIGCOMM 95, August 1995.
24. N. Nishikawa, T. Hosokawa, Y. Mori, K. Yoshidab, and H. Tsujia. Memory-based Architecture for Distributed WWW Caching Proxy. In Proceedings of 7thWWW Conference, April 1998.
25. V. N. Padmanabhan and R. Katz. TCP Fast Start: A Technique for Speeding upWeb Transfers. In Proceedings of IEEE Globecom’98, November 1998.
REFERENCES 45
26. V. N. Padmanabhan and L. Qiu. The Content and Access Dynamics of a BusyWeb Site: Findings and Implications. In Proceedings ACM SIGCOMM 2000,August 2000.
27. Pareto distribution. http://mathworld.wolfram.com/ParetoDistribution.html.
28. D. Pendarakis, S. Shi, D. Verma, and M. Waldvogel. ALMI: An ApplicationLevel Multicast Infrastructure. In Proceedings of USITS 2001, March 2001.
29. D. Tang and M. Baker. Analysis of a Metropolitan-Area Wireless Network. InProceedings of ACM MobiCom 99, pages 13–23, August 1999.
30. D. Tang and M. Baker. Analysis of a Local-Area Wireless Network. In Proceed-ings of ACM MobiCom 2000, August 2000.
31. A. Wolman, G. M. Voelker, N. Sharma, N. Cardwell, M. Brown T. Landray,D. Pinnel, A. Karlin, and H. Levy. Organizational-based Analysis of Web-ObjectSharing and Caching. In Proceedings of USITS ’99, October 1999.
32. H. Yu, L. Breslau, and S. Shenker. A Scalable Web Cache Consistency Archi-tecture. In Proceedings of ACM SIGCOMM ’99, 1999.
33. Y. Zhang, L. Qiu, and S. Keshav. Speeding up Short Data Transfers: Theory, Ar-chitectural Support, and Simulation Results. In Proceedings of NOSSDAV’2000,June 2000.
Index
Browsing, 1Content, 3–4, 11, 28, 36, 41
content analysis, 3, 11, 28, 36content modification, 4content popularity, 4, 41content size, 4, 41content type, 4, 41
Correlation, 37Diurnal pattern, 7Heavy-tail, 6HTTP, 10Knee point, 19Load distribution, 16–17, 32Load optimization, 35Multicast, 3, 30, 37
application-level multicast, 27, 30, 37Notification, 1, 11Popularity distribution, 35Power law, 8Request, 5
request arrival, 5request duration, 5
Self-similar, 6
Session, 3, 8, 17, 19, 26duration, 3, 8session inactivity period, 19, 26
SNMP, 7Spatial locality, 3, 5, 16, 22–23, 32–33System load analysis, 3, 6, 24, 34TCP, 11, 28Temporal locality, 5Temporal stability, 3, 5, 16, 19User, 3, 10, 12–13, 15, 32
behavior analysis, 3, 5, 15, 32desktop user, 10, 12load distribution, 3mobility, 8offline user, 10, 12–13wireless user, 10, 12–13
WAP, 6Web, 1
caching, 3workload, 1
Wireless LAN, 7Zipf-like distribution, 4, 14, 25, 30, 32, 35–36
46