Embed Size (px)
Citation preview

Onshore Power Supply (OPS) – Project
Susann Dutt, Port of Göteborg, SwedenEnvironmental Controller, Coordinator of the OPS project within World Ports Climate [email protected], +46 31 731 29 63
Shore-side electricity • Shore-connected electricity supply • Shore power •• Ship-to-shore • Cold ironing • Alternative Maritime Power (AMP)
Content of the presentation Introduction
- The technology- Best practice- Pros and cons- The guidance document
The OPS Project- Participating ports & Goal- The OPS website- Result from the questionnaire
Conclusions How to get involved!
IAPH Africa/Europe Regional Meeting 2009, Hamburg, Germany
6-20kV
6-20kV 20-100kV
onboard transformer
sub station
connection point
6-20kV
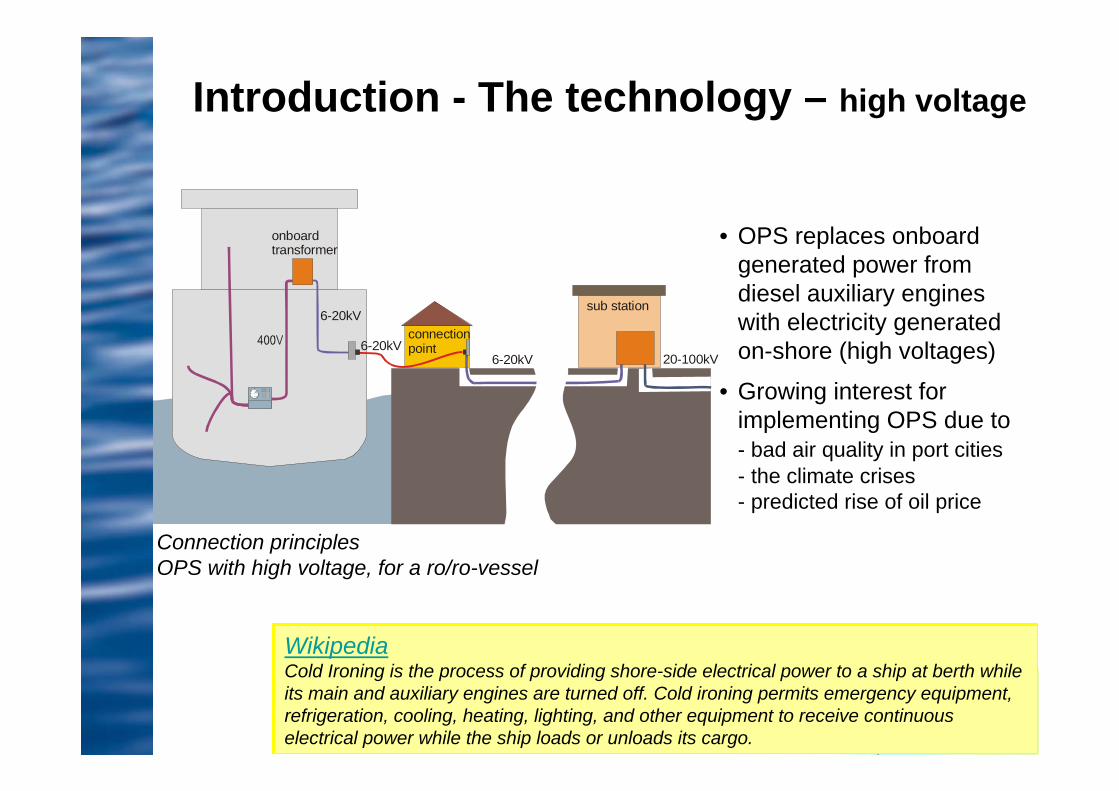
Introduction - The technology – high voltage
Connection principlesOPS with high voltage, for a ro/ro-vessel
• OPS replaces onboard generated power from diesel auxiliary engines with electricity generated on-shore (high voltages)
• Growing interest for implementing OPS due to - bad air quality in port cities- the climate crises- predicted rise of oil price
WikipediaCold Ironing is the process of providing shore-side electrical power to a ship at berth while its main and auxiliary engines are turned off. Cold ironing permits emergency equipment, refrigeration, cooling, heating, lighting, and other equipment to receive continuous electrical power while the ship loads or unloads its cargo.

Introduction – Best practice
Connecting a Ro/ro-vessel in Port of Göteborg
- Port of Göteborg first port in the world to offerOPS high voltage for cargo vessels in year2000, in close collaboration with Stora Enso
- About 10 vessels are connecting (ro/ro and ferries), >20 % of the calls- Significant reduction in local air pollutants (NOx, SO2, PM, VOC)
- Additional benefits noise & working conditions- When using a renewable energy sourceemissions of greenhouse gases can be keptto a minimum
- All new quays are prepared with canalizationfor OPS
- Vision to connect all ferries and roro vessels!

Introduction – Best practicePortsGöteborg, Lübeck, Zeebrügge, Ro/ro and/orKotka, Kemi, Oulu FerriesJuneau, Seattle CruiseAntwerp Container Port of Los Angeles Container Port of Long Beach ContainerSan Fransisco, San Diego ...
Ship owner/Goods owner/Line Management NYK, China Shipping, Evergreen, MOL, Princess Cruise, Stena Line, Stora Enso, Wagenborg, TransAtlantic, SOL, TransLumi, Cobelfret …
SuppliersABB, ESL, Cavotec, Siemens, SAM, Terasaki, Patton & Cooke, Callenberg Engineering ....
Port of Göteborg, photo The New York Times/Dean C.K. Cox
Container terminal, Port of Los Angeles
Current cases using OPS (high voltage)

Ports planning/investigating for OPS
Source: Shore-side power supply, A feasibility study and a technical solution for an on-shore electrical infrastructure to supply vessels with electric power while in port, Master of Science Thesis, Patrik Ericsson, Ismir Fazlagic (2008)
Please help us to make the picture complete!
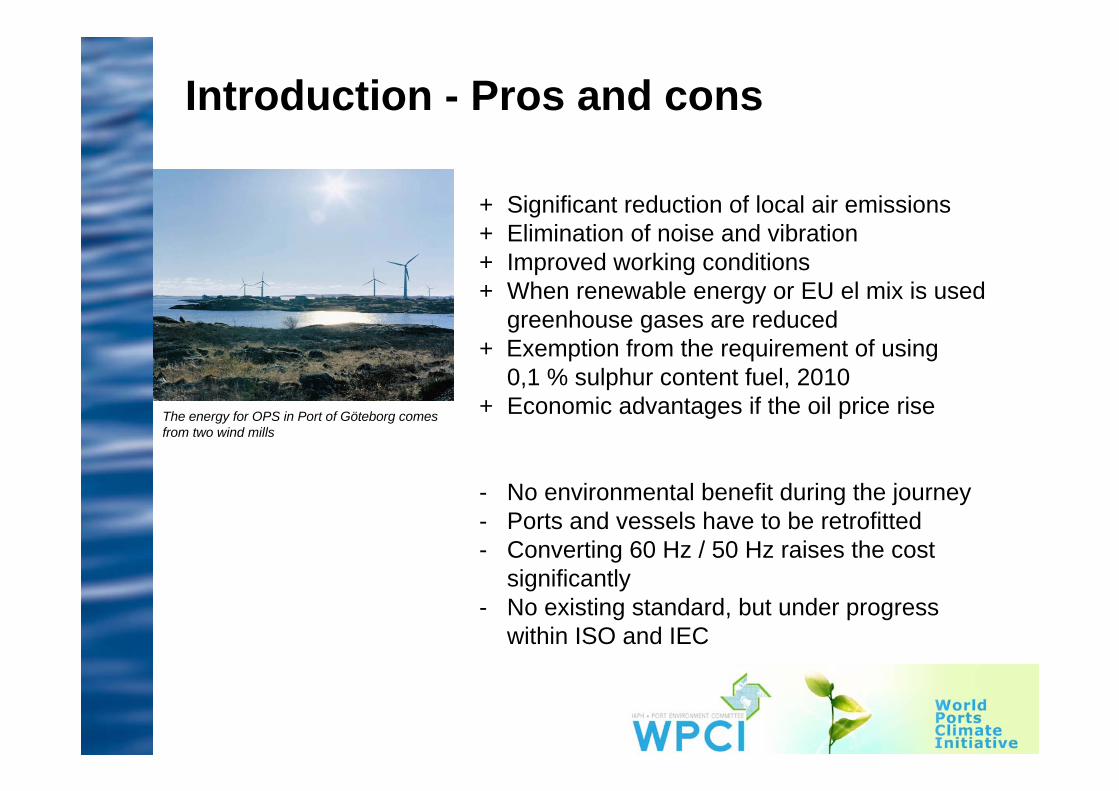
Introduction - Pros and cons
+ Significant reduction of local air emissions+ Elimination of noise and vibration+ Improved working conditions+ When renewable energy or EU el mix is used
greenhouse gases are reduced+ Exemption from the requirement of using
0,1 % sulphur content fuel, 2010+ Economic advantages if the oil price rise
- No environmental benefit during the journey - Ports and vessels have to be retrofitted- Converting 60 Hz / 50 Hz raises the cost
significantly- No existing standard, but under progress
within ISO and IEC
The energy for OPS in Port of Göteborg comes from two wind mills

Introduction - The Guidance Document
• At World Ports Climate Conference in Rotterdam, July 2008- A Guidance document – Onshore Power Supply
The content of the Guidance Document: 1. Background2. Guidance for implementation (Plan, Do, Check, Act) 3. Best practices and case studies4. Pros and cons5. Frequently asked questions
www.portgot.se (Environment-World Ports Climate Initiative)
The OPS Project within WPCI
Overall goal –Reduce local air pollutants and greenhouse gas emissions by stimulating as many ports, terminal operators and shipping lines worldwide to implement the technology of OPS where practical and useful.
Detailed goal –To stimulate the further use of Onshore Power Supply (OPS) by designing and building a web based application, which provides practical guidance on OPS, available for all ports. The application should also contain information for other stakeholders such as terminal operators and shipping lines.
Project leader: Susann Dutt, Port of Göteborg, [email protected] group: Amsterdam, Antwerp, Göteborg, Hamburg + IAPH+CE Delft

1. Environment & health- Methods to measure/calculate and maximize
the environmental benefits of OPS- Air quality- Climate- Noise and vibration
2. Costs- Methods to measure/calculate and maximize
the cost effectiveness of OPS- Operational costs- Investments- Technical solutions
3. Step - by - step implementation guide
- Important parameters to consider in eachstep of implementing OPS
- The standard (ISO)- Legal framework/policies
4. Best practice/business cases- Best practice/business cases
(container, ro/ro, cruise..)- Arguments for introducing the technology- Commercial set ups- How to approach/convince/sell the idea to a
terminal operator/shipping company
The OPS Website – Content
5. GeneralFrequently asked questions Glossary Links to other websites with experienceReference to other solutions to improve air quality in ports and control emission of green house gasesLibrary/further reading (feasability studies)

The OPS Website – Important criteria
Clean
Informative
Balanced
Modern
Green/blue
Easy to use/navigate
Something you would like to add?
Please let me know in the Coffee Break!
The OPS Website - GeneralGoal:Stimulate the further use of Onshore Power Supply (OPS) byproviding relevant and practical guidance on OPS via a website
Target group:Primarily portsBut also terminal operators, shipping lines and other stakeholdersNot the electrical experts, they will have the standard!
Time schedule:Second draft of website ready for comments mid January 2010Ready for release by end of February 2010 Promotion of the website via IAPH, ESPO, Ecoports ….
Challenge:How to keep the website updated/maintained in the long runLanguage

Electronic questionnaire on OPS
Spring/summer 2009
Aim:- To get an idea about the current status and future plans regarding OPS- To give important input to the upcoming work within the OPS project- Be reference information when evaluating the project
Was sent out to alla WPCI members + port community via ESPO, Green Port Journal, WPCI website, Port of Göteborg website and via different Port Associations.
Result from OPS questionnaire (1)
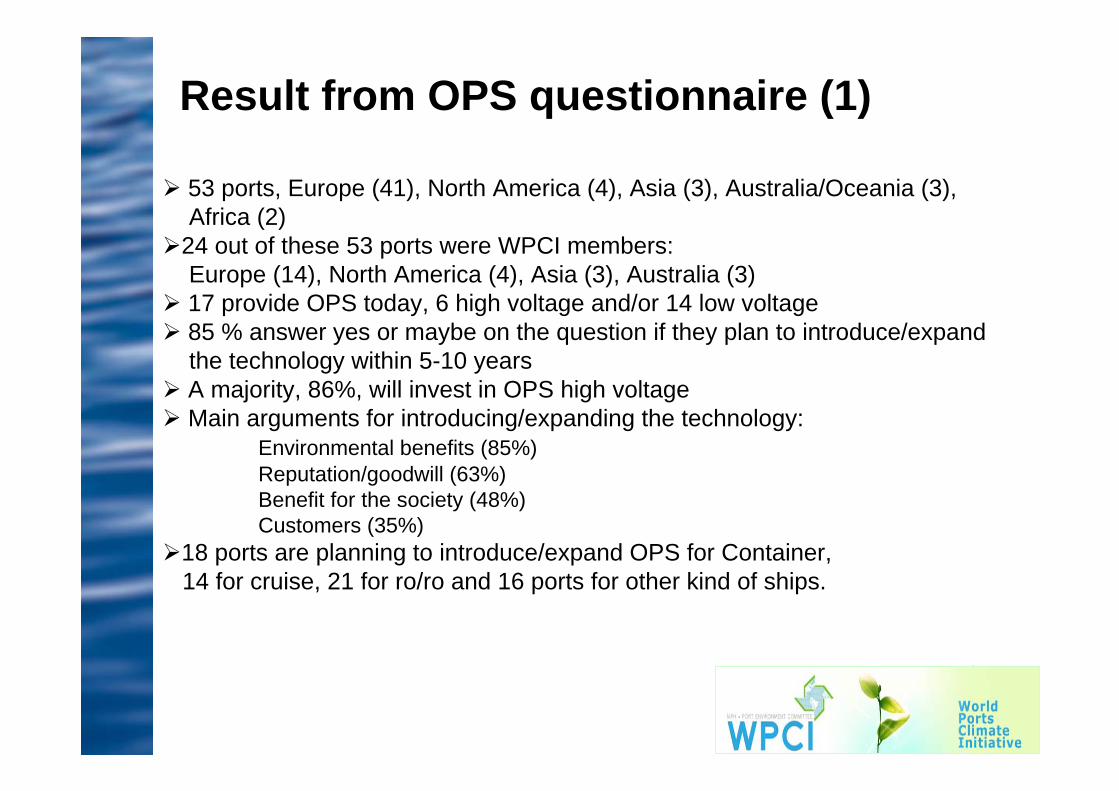
53 ports, Europe (41), North America (4), Asia (3), Australia/Oceania (3),Africa (2)
24 out of these 53 ports were WPCI members:Europe (14), North America (4), Asia (3), Australia (3)
17 provide OPS today, 6 high voltage and/or 14 low voltage 85 % answer yes or maybe on the question if they plan to introduce/expand
the technology within 5-10 years A majority, 86%, will invest in OPS high voltage Main arguments for introducing/expanding the technology:
Environmental benefits (85%) Reputation/goodwill (63%)Benefit for the society (48%)Customers (35%)
18 ports are planning to introduce/expand OPS for Container,14 for cruise, 21 for ro/ro and 16 ports for other kind of ships.

Main arguments when introducing OPS (17 ports offering OPS today):
0% 20% 40% 60% 80% 100%
License to operate
Economical benefits for the port
Environmental authority
Local citizens
Benefits for society
Reputation/goodwill
Customers
Environmental benefits
WPCI17 ports
WPCI = 9 ports

Is your port planning to introduce/ expand the technology to more quays within 5-10 years?
0%
10%
20%
30%
40%
50%
60%
Yes Maybe No
All ports
All ports not offering OPStoday(36)WPCI
All ports = 53/53All ports not offering OPS today 36/36WPCI = 24/24

Reason for not introducing the technology (8 ports):
0% 10% 20% 30% 40% 50% 60% 70% 80% 90% 100%
Difficulties in concinving the terminal operator
Difficulties in convincing the ship owner
Lack of information
Lack of interested stakeholders
Environmental benefit is too low
Technological problems
Lack of enough power
Cost effectiveness is too low
No feasibility study has been carried out
Other reason

If you answered yes/maybe what is the main argument/s to introduce/expand the technology?
0% 20% 40% 60% 80% 100%
Economical benefits
License to operate
Local citizens
Environmental authority
Customers
Benefits for society
Reputation/goodwill
Environmental benefits
WPCI40 ports
WPCI = 22/23
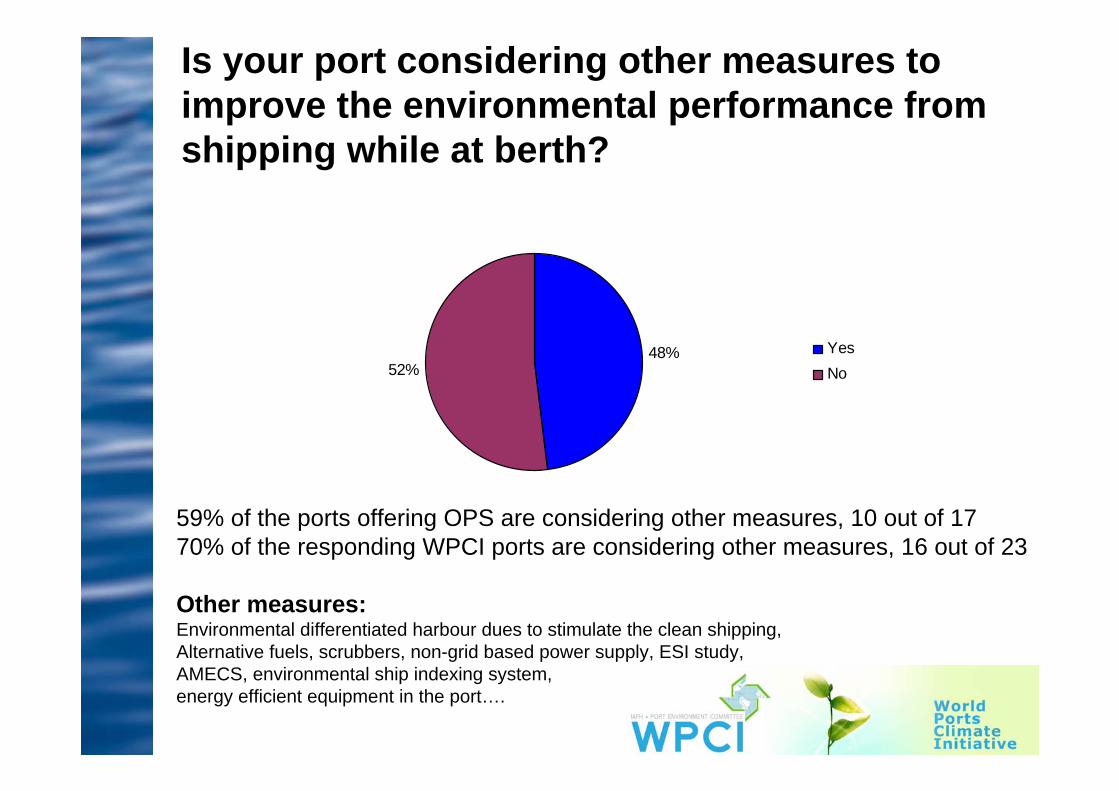
Is your port considering other measures to improve the environmental performance from shipping while at berth?
48%52%
YesNo
59% of the ports offering OPS are considering other measures, 10 out of 1770% of the responding WPCI ports are considering other measures, 16 out of 23
Other measures:Environmental differentiated harbour dues to stimulate the clean shipping,Alternative fuels, scrubbers, non-grid based power supply, ESI study,AMECS, environmental ship indexing system, energy efficient equipment in the port….
Result from OPS questionnaire (2)
About 80% of the corresponding ports would like to share experiencewith the OPS project.
All except one port would like to be informed about the progress withinthe WPCI Onshore Power Supply project.
Other comments from the questionnaire:” The lack of standards for the connection has to be solved”” In my opinion standardisation of connectors on ship and shore
as well as frequencies need to be achieved before any significant take upof shore power will occur”” Regarding introduction of OPS we will continously make efforts
to collect information on the trend of the national governmentand other ports in Japan”
Conclusions
• Great interest in the technology
• Main arguments are: Environmental benefits (85%) Reputation/goodwill (63%) Benefit for the society (48%)
• Mainly dealing with local air pollutants, but greenhouse gasescould be kept to a minimum when using alternative energy
• One alternative out of many to grow green, should preferablybe combined with other measures
• The OPS project - about reducing local air pollutants andgreenhouse gas emissions by stimulating as many ports, terminaloperators and shipping lines worldwide to implement thetechnology of OPS where practical and useful.
• A balanced website with good information on OPS will be set upand ready for launch February 2010.
• Great interest in the OPS project as well as sharing experience
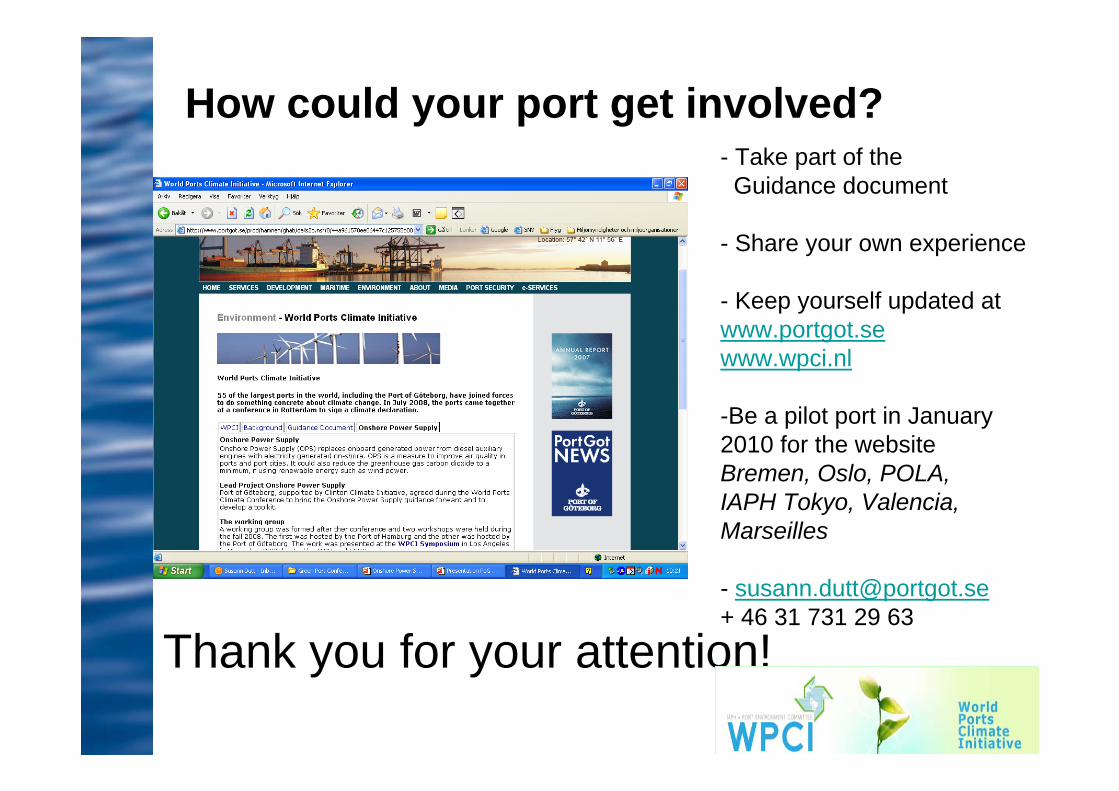
How could your port get involved?- Take part of the Guidance document
- Share your own experience
- Keep yourself updated atwww.portgot.sewww.wpci.nl
-Be a pilot port in January2010 for the websiteBremen, Oslo, POLA, IAPH Tokyo, Valencia, Marseilles
- [email protected]+ 46 31 731 29 63
Thank you for your attention!
Bonus pictures

Environmental benefit
Fuel consumption
onboard the ship
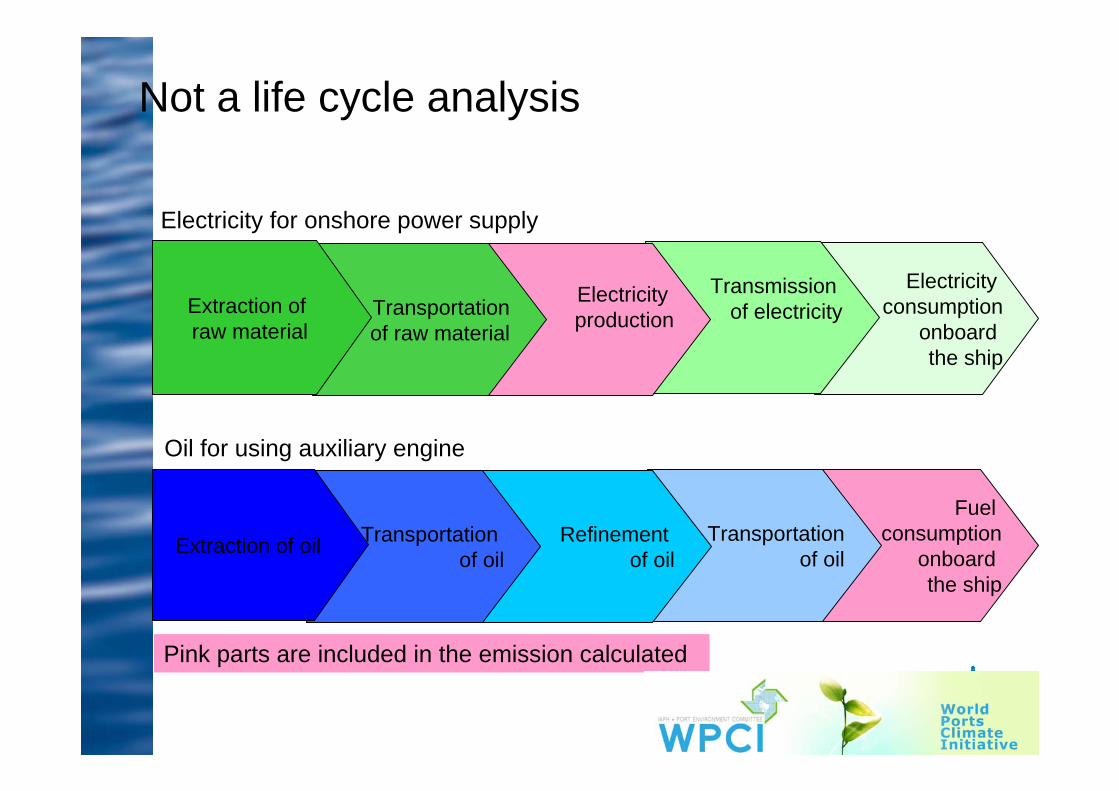
Not a life cycle analysis
Electricityconsumption
onboardthe ship
Transmission of electricity
Electricityproduction
Transportationof oil
Refinementof oil
Transportationof oilExtraction of oil
Transportationof raw material
Extraction of raw material
Pink parts are included in the emission calculated
Electricity for onshore power supply
Oil for using auxiliary engine
0
2
4
6
8
10
12
14
NOx SO2 PM*10 CO2/100
g/kW
h
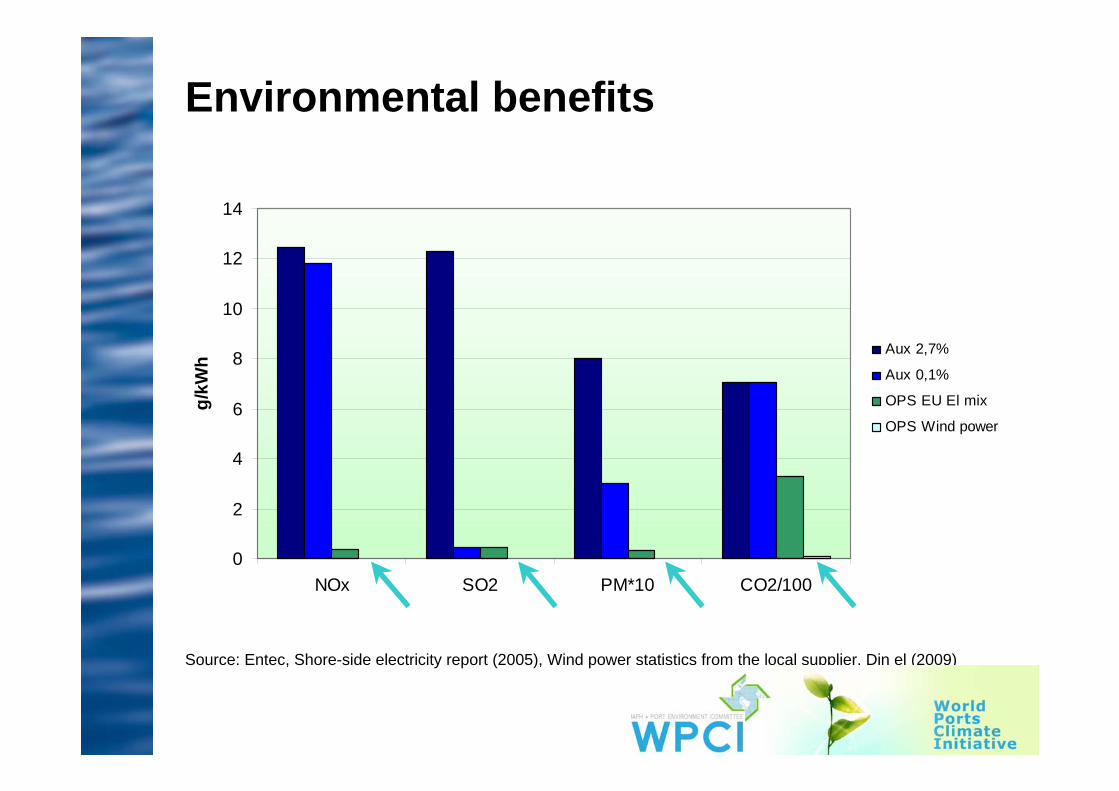
Aux 2,7%
Aux 0,1%
OPS EU El mix
OPS Wind power
Environmental benefits
Source: Entec, Shore-side electricity report (2005), Wind power statistics from the local supplier, Din el (2009)
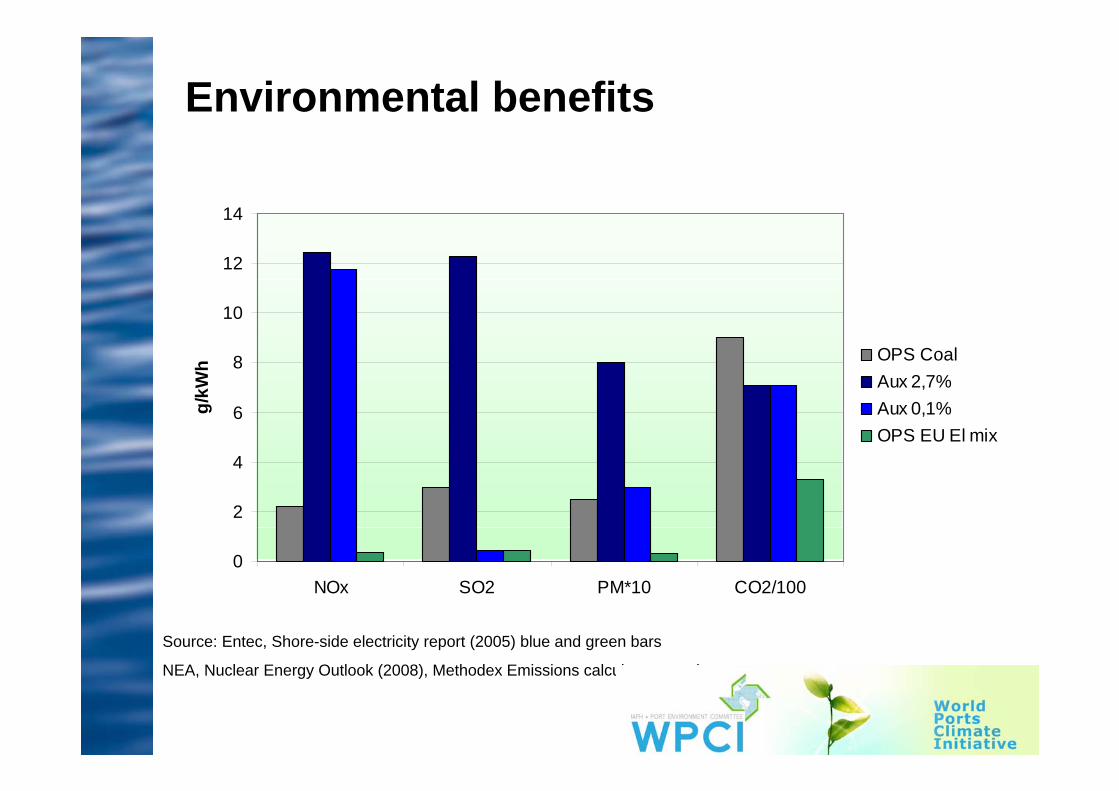
Environmental benefits
Source: Entec, Shore-side electricity report (2005) blue and green bars
NEA, Nuclear Energy Outlook (2008), Methodex Emissions calculator, grey bars
0
2
4
6
8
10
12
14
NOx SO2 PM*10 CO2/100
g/kW
h OPS CoalAux 2,7%Aux 0,1%OPS EU El mix
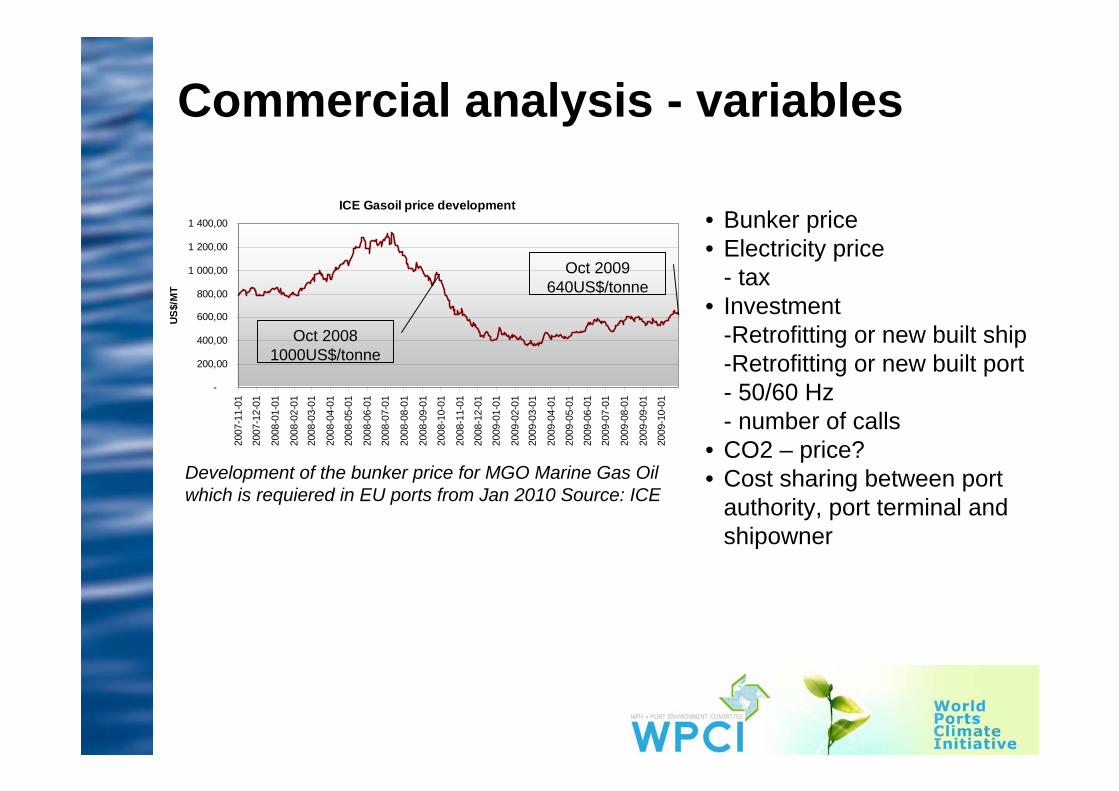
Commercial analysis - variables
• Bunker price• Electricity price
- tax• Investment
-Retrofitting or new built ship-Retrofitting or new built port- 50/60 Hz- number of calls
• CO2 – price?• Cost sharing between port
authority, port terminal and shipowner
Development of the bunker price for MGO Marine Gas Oil which is requiered in EU ports from Jan 2010 Source: ICE
ICE Gasoil price development
-
200,00
400,00
600,00
800,00
1 000,00
1 200,00
1 400,0020
07-1
1-01
2007
-12-
01
2008
-01-
01
2008
-02-
01
2008
-03-
01
2008
-04-
01
2008
-05-
01
2008
-06-
01
2008
-07-
01
2008
-08-
01
2008
-09-
01
2008
-10-
01
2008
-11-
01
2008
-12-
01
2009
-01-
01
2009
-02-
01
2009
-03-
01
2009
-04-
01
2009
-05-
01
2009
-06-
01
2009
-07-
01
2009
-08-
01
2009
-09-
01
2009
-10-
01
US$
/MT
Oct 2009 640US$/tonne
Oct 2008 1000US$/tonne
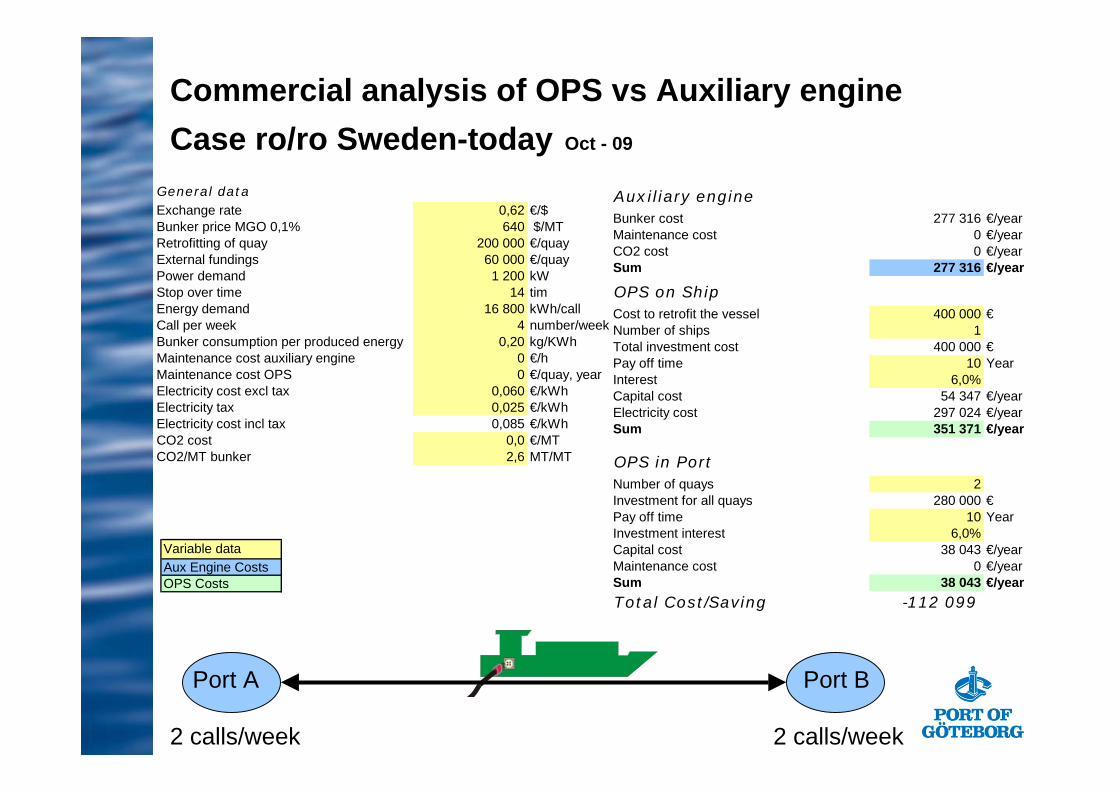
Commercial analysis of OPS vs Auxiliary engineCase ro/ro Sweden-today Oct - 09
Variable dataAux Engine CostsOPS Costs
Port A Port B
2 calls/week 2 calls/week
General dataExchange rate 0,62 €/$Bunker price MGO 0,1% 640 $/MTRetrofitting of quay 200 000 €/quayExternal fundings 60 000 €/quayPower demand 1 200 kWStop over time 14 tim Energy demand 16 800 kWh/callCall per week 4 number/weekBunker consumption per produced energy 0,20 kg/KWhMaintenance cost auxiliary engine 0 €/hMaintenance cost OPS 0 €/quay, yearElectricity cost excl tax 0,060 €/kWhElectricity tax 0,025 €/kWhElectricity cost incl tax 0,085 €/kWhCO2 cost 0,0 €/MTCO2/MT bunker 2,6 MT/MT
Auxiliary engineBunker cost 277 316 €/yearMaintenance cost 0 €/yearCO2 cost 0 €/yearSum 277 316 €/year
OPS on ShipCost to retrofit the vessel 400 000 €Number of ships 1Total investment cost 400 000 €Pay off time 10 YearInterest 6,0%Capital cost 54 347 €/yearElectricity cost 297 024 €/yearSum 351 371 €/year
OPS in PortNumber of quays 2Investment for all quays 280 000 €Pay off time 10 YearInvestment interest 6,0%Capital cost 38 043 €/yearMaintenance cost 0 €/yearSum 38 043 €/yearTotal Cost/Saving -112 099
Bunker
Ship invest
Port invest
Electricity
El. tax
0
50 000
100 000
150 000
200 000
250 000
300 000
350 000
400 000
450 000
500 000
Cos
t €/y
ear
Aux Engine OPS
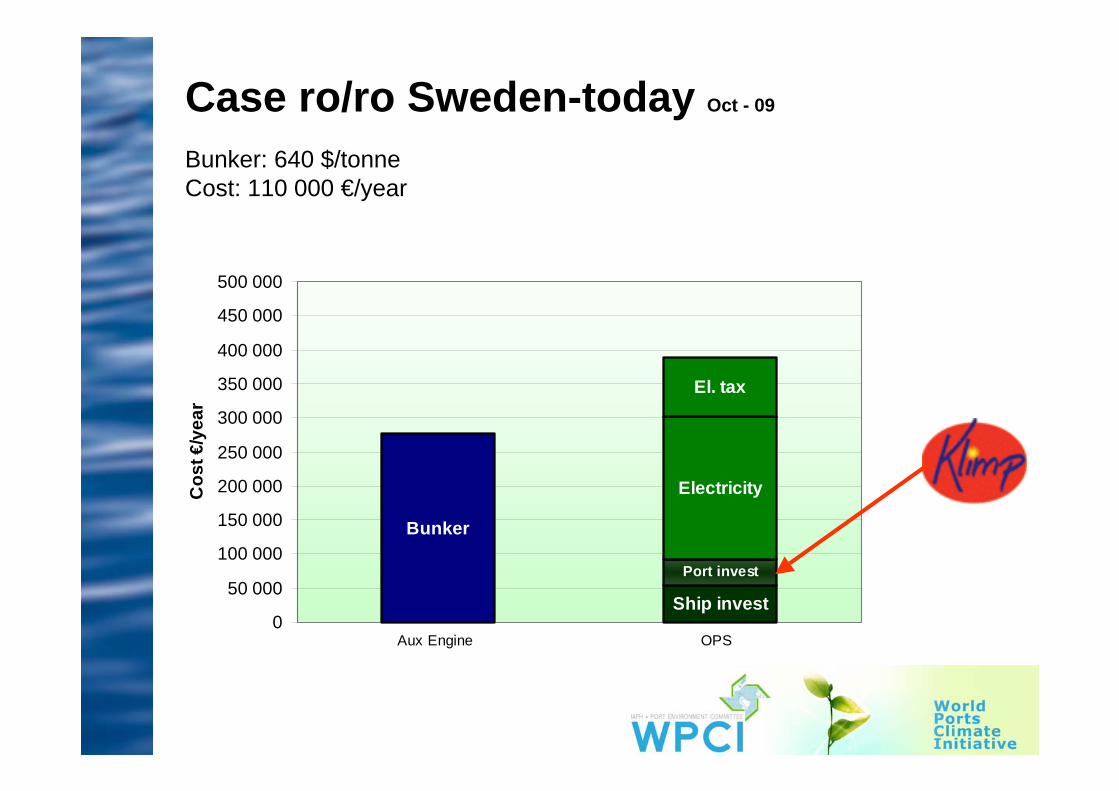
Case ro/ro Sweden-today Oct - 09
Bunker: 640 $/tonneCost: 110 000 €/year

Case ro/ro Sweden-yesterday Oct - 08
Bunker: 1 000 $/tonneSaving: 44 000 €/year
Bunker
Ship invest
Port invest
Electricity
El.tax
0
50 000
100 000
150 000
200 000
250 000
300 000
350 000
400 000
450 000
500 000
Cos
t €/y
ear
Aux Engine OPS

Case ro/ro Sweden- tomorrow? Oct -XX
Bunker: 640 $/tonne, no electricity tax
Cost: 25 000 €/year
Ship invest
Bunker
Port invest
Electricity
0
50 000
100 000
150 000
200 000
250 000
300 000
350 000
400 000
450 000
500 000
Cos
t €/y
ear
Aux Engine OPS
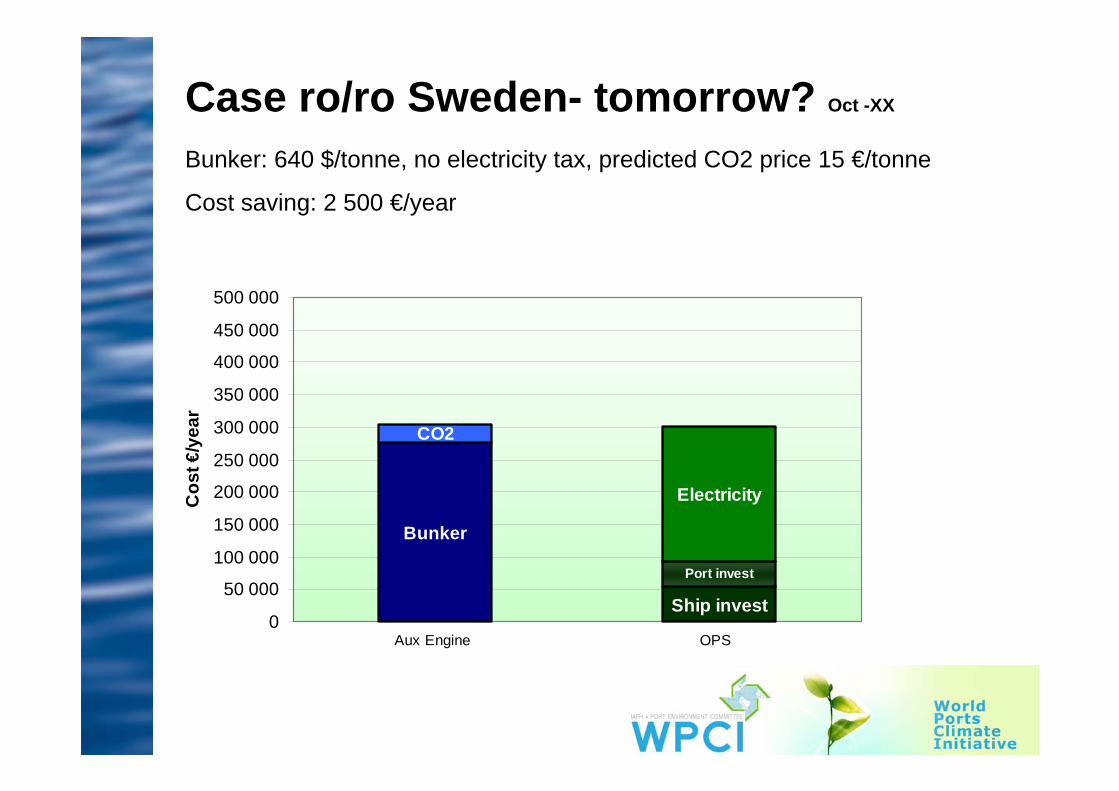
Case ro/ro Sweden- tomorrow? Oct -XX
Bunker: 640 $/tonne, no electricity tax, predicted CO2 price 15 €/tonne
Cost saving: 2 500 €/year
Ship invest
Bunker
Port invest
Electricity
CO2
0
50 000
100 000
150 000
200 000
250 000
300 000
350 000
400 000
450 000
500 000
Cos
t €/y
ear
Aux Engine OPS
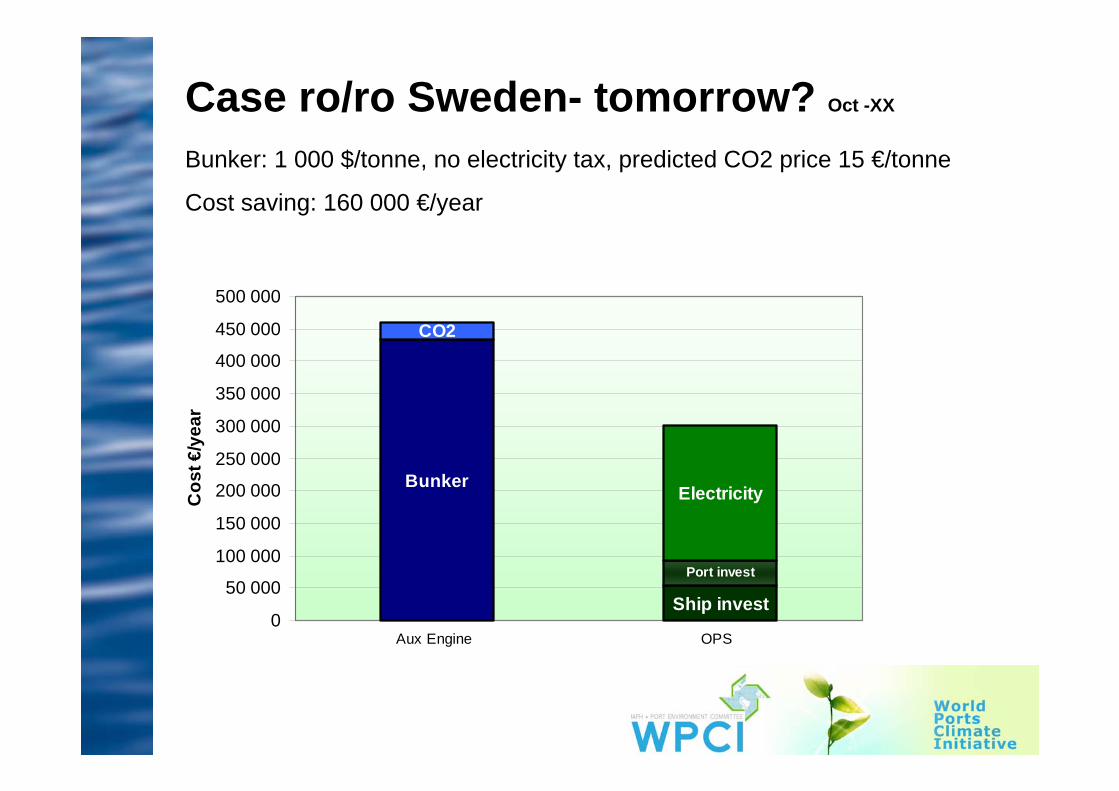
Case ro/ro Sweden- tomorrow? Oct -XX
Bunker: 1 000 $/tonne, no electricity tax, predicted CO2 price 15 €/tonne
Cost saving: 160 000 €/year
Bunker
Ship invest
Port invest
Electricity
CO2
0
50 000
100 000
150 000
200 000
250 000
300 000
350 000
400 000
450 000
500 000
Cos
t €/y
ear
Aux Engine OPS

050 000
100 000150 000200 000250 000300 000350 000400 000450 000500 000
500
540
580
620
660
700
740
780
820
860
900
940
980
1020
Bunker price $/tonne
€/ye
ar
AUX+CO2AUXOPSOPS excl tax
Break even points
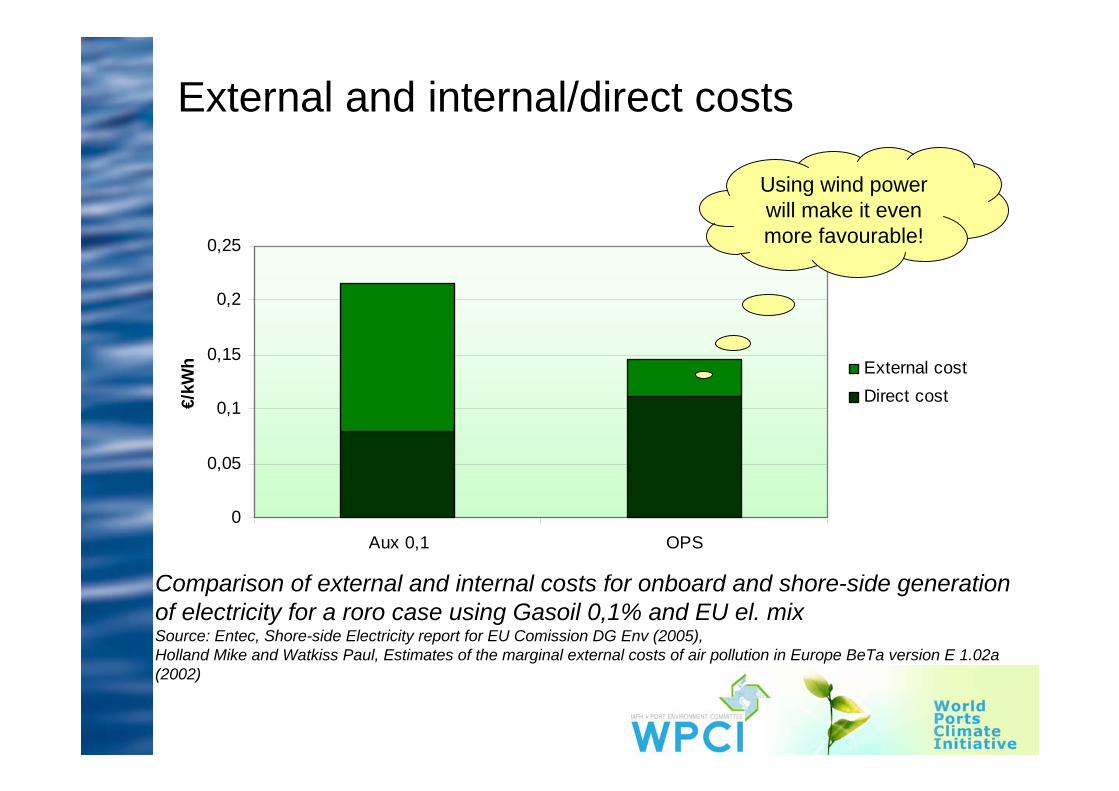
External and internal/direct costs
Comparison of external and internal costs for onboard and shore-side generation of electricity for a roro case using Gasoil 0,1% and EU el. mixSource: Entec, Shore-side Electricity report for EU Comission DG Env (2005), Holland Mike and Watkiss Paul, Estimates of the marginal external costs of air pollution in Europe BeTa version E 1.02a (2002)
0
0,05
0,1
0,15
0,2
0,25
Aux 0,1 OPS
€/kW
h External costDirect cost
Using wind power will make it evenmore favourable!
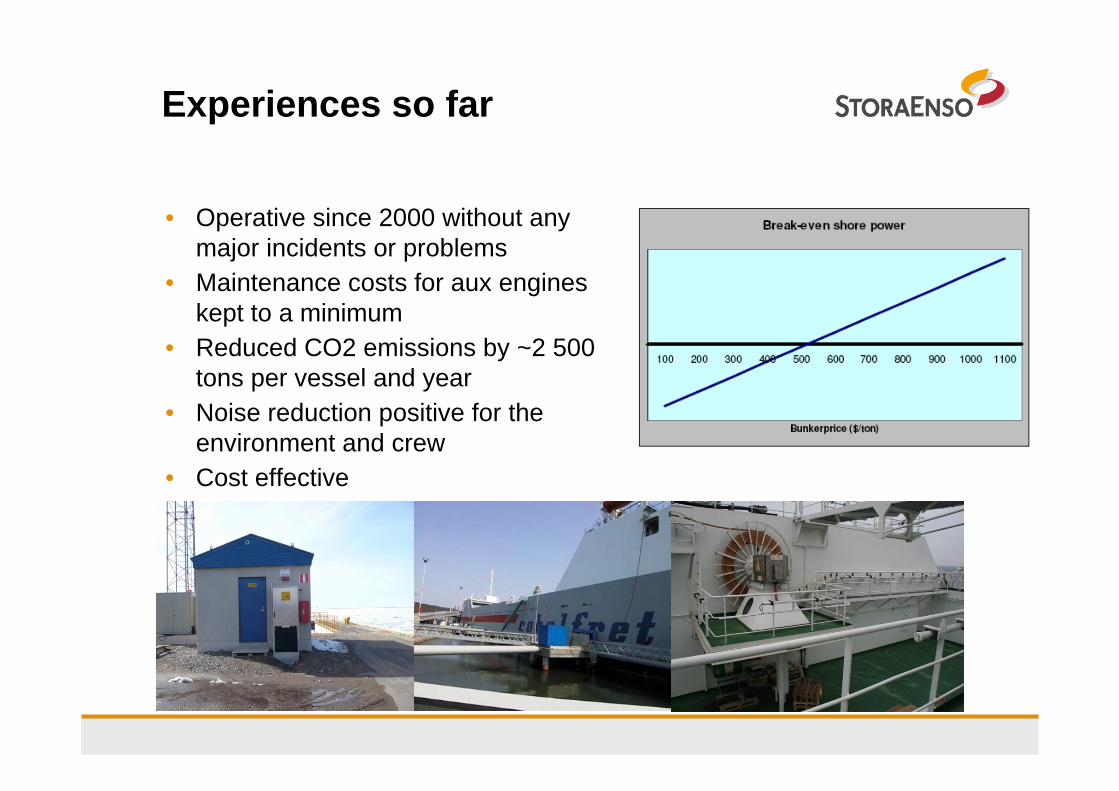
Experiences so far
• Operative since 2000 without anymajor incidents or problems
• Maintenance costs for aux engineskept to a minimum
• Reduced CO2 emissions by ~2 500 tons per vessel and year
• Noise reduction positive for the environment and crew
• Cost effective

Running cost for a connected shipdata from Stora Enso 2008
Shore powerInvestment• ~200 000€ per vessel• ~500 000€ per port
Running costs• ~70 000€ power supply per vessel
Savings• ~60 000€ MGO in port
• Extra cost per year 90 000€• Extra cost per day 246€• Extra cost per lm: 0,18€ 2.5€ per trailer
Connecting a Ro/ro-vessel in Port of Göteborg

Cable connected to the vessel
– Brödtext

Connection point at the quay

Outlet at the quay, connection point


![ismrau ismir ismir suKu pwvau] - WordPress.com to nature's law of 'action-reaction' materialistic life has ... heaven - hell life - death ... 'Gobind-Simran' is potrayed as the ocean](https://img.pdfslide.us/doc/110x75/5b319e157f8b9ab5728c437e/ismrau-ismir-ismir-suku-pwvau-to-natures-law-of-action-reaction-materialistic.jpg)