Embed Size (px)
DESCRIPTION
IntroductionThose measurements which make use of electrical signals as the analytical response are generally referred to as electroanalytical techniques. Electroanalysis is therefore the application of electrochemistry to solve analytical problems and encompasses a group of quantitative analytical methods that are based upon the electrical propertiesof a solution of the analyte, when it is made part of an electrochemical cell.Electroanalytical techniques have certain general advantages over other analytical procedures and therefore have found wide application in many fields.They are applicable over large concentration ranges, in some cases fromnanomolar (10-9M) levels to molar levels.;Electrochemical measurements are often specific for a particular oxidationstate of an element. For example chromium (VI), which is toxic, can beidentified and quantified in the presence of chromium (III), which is non-toxic, whereas most other analytical techniques are only able to identify totalchromium.Note: those terms shown inblue are explained on the next slides and defined in the ‘Glossary of Terms’
Citation preview

Analytical ScienceA course (in 15 Chapters), developed as an Open Educational Resource, designed for use at 2nd year England & Wales undergraduate level and as a CPD training resource
Author Brian W Woodget
Owner Royal Society of Chemistry
Title Chapter 9 – Measurements Using Electrical Signals
Classification F180, Analytical Chemistry
Keywords ukoer, sfsoer, oer, open educational resources, metadata, analytical science, cpd
training resource, analytical chemistry, measurement science, potentiometry, ion-
selective electrodes, amperometry, coulometry, Karl Fischer titration, plated film
thickness
Description This chapter considers the fundamental concepts of using the measurements of
current and voltage to provide analytical information. Individual topics covered
include ion-selective electrodes, measurement of pH, amperometry, introduction to
sensor technology and important examples of the application of coulometric
measurements.
Creative Commons licence http://creativecommons.org/licenses/by-nc-nd/2.0/uk/
Language English
File size 3.0Mbytes
File format Microsoft PowerPoint (1997 – 2003)
https://edocs.hull.ac.uk/muradora/objectView.action?parentId=hull%3A2199&type=1&start=10&pid=hull%3A2351
© Royal Society of Chemistry 2010
2
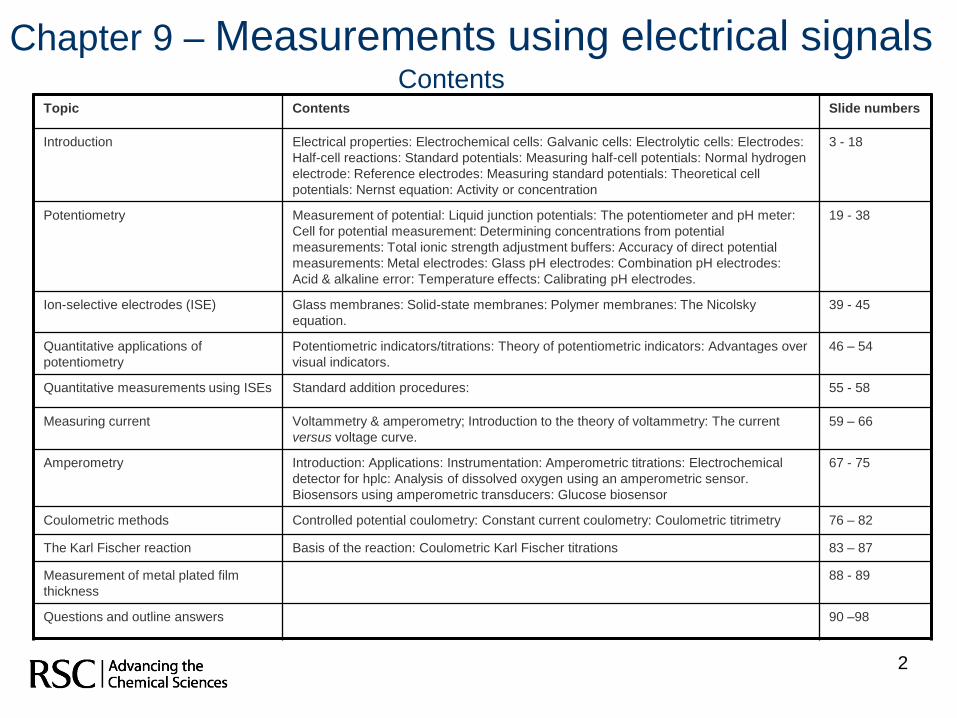
Chapter 9 – Measurements using electrical signals
Topic Contents Slide numbers
Introduction Electrical properties: Electrochemical cells: Galvanic cells: Electrolytic cells: Electrodes:
Half-cell reactions: Standard potentials: Measuring half-cell potentials: Normal hydrogen
electrode: Reference electrodes: Measuring standard potentials: Theoretical cell
potentials: Nernst equation: Activity or concentration
3 - 18
Potentiometry Measurement of potential: Liquid junction potentials: The potentiometer and pH meter:
Cell for potential measurement: Determining concentrations from potential
measurements: Total ionic strength adjustment buffers: Accuracy of direct potential
measurements: Metal electrodes: Glass pH electrodes: Combination pH electrodes:
Acid & alkaline error: Temperature effects: Calibrating pH electrodes.
19 - 38
Ion-selective electrodes (ISE) Glass membranes: Solid-state membranes: Polymer membranes: The Nicolsky
equation.
39 - 45
Quantitative applications of
potentiometry
Potentiometric indicators/titrations: Theory of potentiometric indicators: Advantages over
visual indicators.
46 – 54
Quantitative measurements using ISEs Standard addition procedures: 55 - 58
Measuring current Voltammetry & amperometry; Introduction to the theory of voltammetry: The current
versus voltage curve.
59 – 66
Amperometry Introduction: Applications: Instrumentation: Amperometric titrations: Electrochemical
detector for hplc: Analysis of dissolved oxygen using an amperometric sensor.
Biosensors using amperometric transducers: Glucose biosensor
67 - 75
Coulometric methods Controlled potential coulometry: Constant current coulometry: Coulometric titrimetry 76 – 82
The Karl Fischer reaction Basis of the reaction: Coulometric Karl Fischer titrations 83 – 87
Measurement of metal plated film
thickness
88 - 89
Questions and outline answers 90 –98
Contents
3
IntroductionThose measurements which make use of electrical signals as the analytical
response are generally referred to as electroanalytical techniques.
Electroanalysis is therefore the application of electrochemistry to solve analytical
problems and encompasses a group of quantitative analytical methods that are
based upon the electrical properties of a solution of the analyte, when it is made
part of an electrochemical cell.
Electroanalytical techniques have certain general advantages over other analytical
procedures and therefore have found wide application in many fields.
They are applicable over large concentration ranges, in some cases from
nanomolar (10-9
M) levels to molar levels.;
Electrochemical measurements are often specific for a particular oxidation
state of an element. For example chromium (VI), which is toxic, can be
identified and quantified in the presence of chromium (III), which is non-
toxic, whereas most other analytical techniques are only able to identify total
chromium. Note: those terms shown in blue are explained on the next slides and defined in the
‘Glossary of Terms’
4
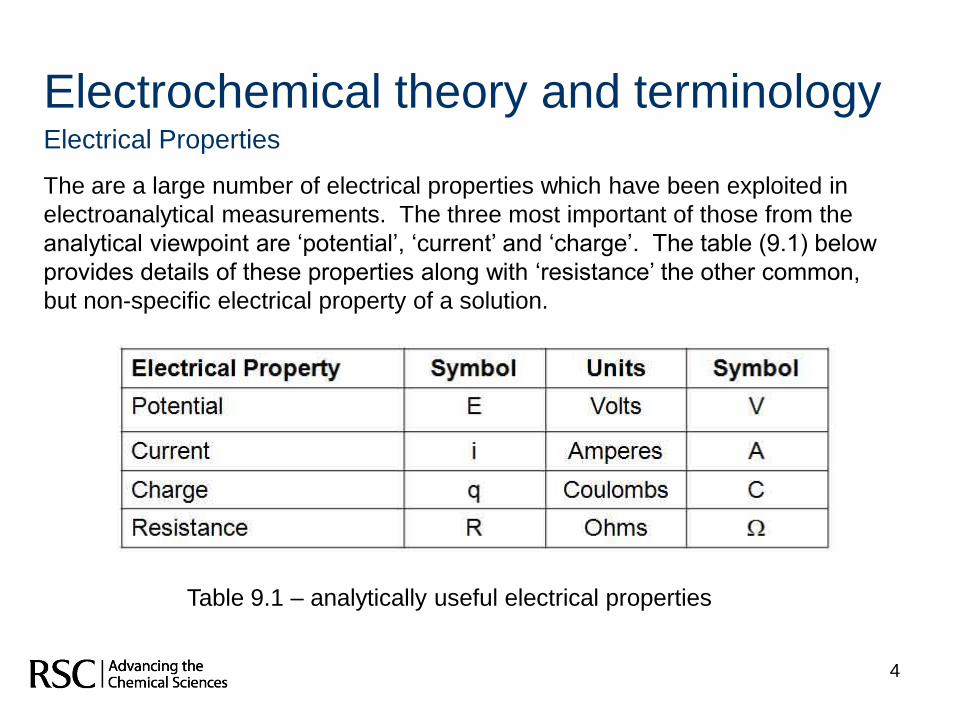
Electrochemical theory and terminologyElectrical Properties
The are a large number of electrical properties which have been exploited in
electroanalytical measurements. The three most important of those from the
analytical viewpoint are „potential‟, „current‟ and „charge‟. The table (9.1) below
provides details of these properties along with „resistance‟ the other common,
but non-specific electrical property of a solution.
Table 9.1 – analytically useful electrical properties
5
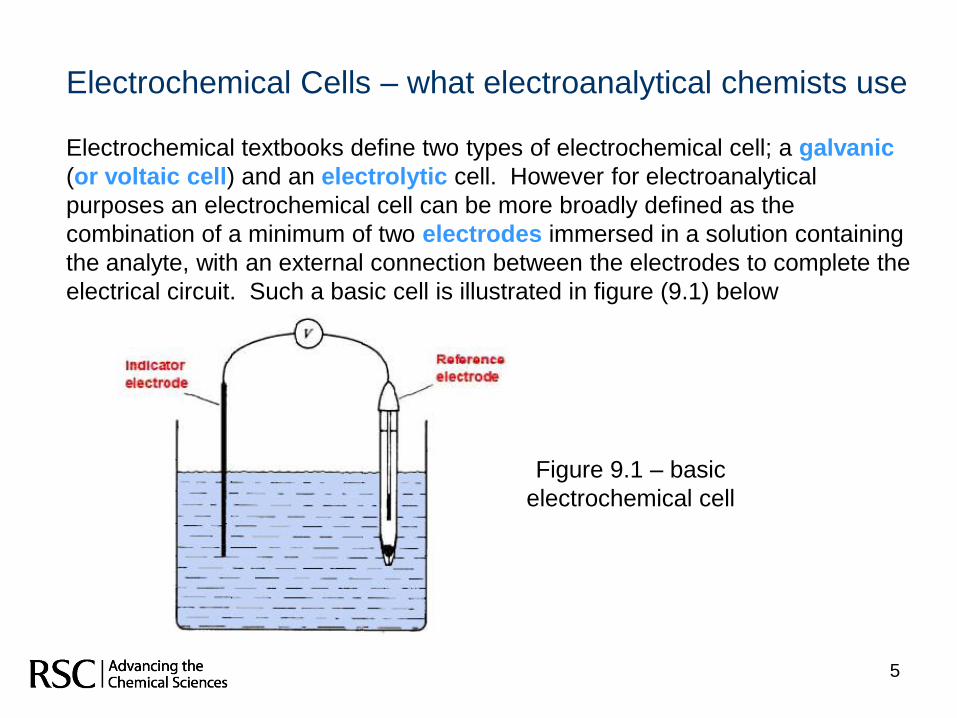
Electrochemical Cells – what electroanalytical chemists use
Electrochemical textbooks define two types of electrochemical cell; a galvanic
(or voltaic cell) and an electrolytic cell. However for electroanalytical
purposes an electrochemical cell can be more broadly defined as the
combination of a minimum of two electrodes immersed in a solution containing
the analyte, with an external connection between the electrodes to complete the
electrical circuit. Such a basic cell is illustrated in figure (9.1) below
Figure 9.1 – basic
electrochemical cell
6http://en.wikipedia.org/wiki/File:Galvanic_Cell.svg
Cu2+
+ 2e-= Cu (s) +0.34V Zn(s) = Zn
2++ 2e
-+ 0.76V
Cathode Anode
+ -
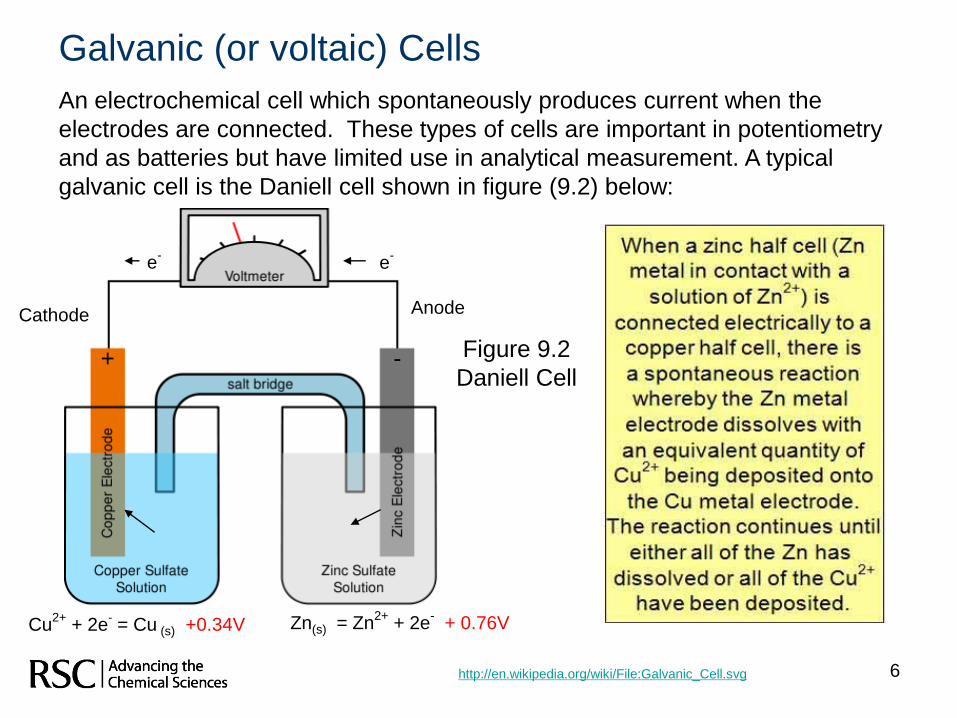
Galvanic (or voltaic) Cells
An electrochemical cell which spontaneously produces current when the
electrodes are connected. These types of cells are important in potentiometry
and as batteries but have limited use in analytical measurement. A typical
galvanic cell is the Daniell cell shown in figure (9.2) below:
e-
e-
Figure 9.2
Daniell Cell
7
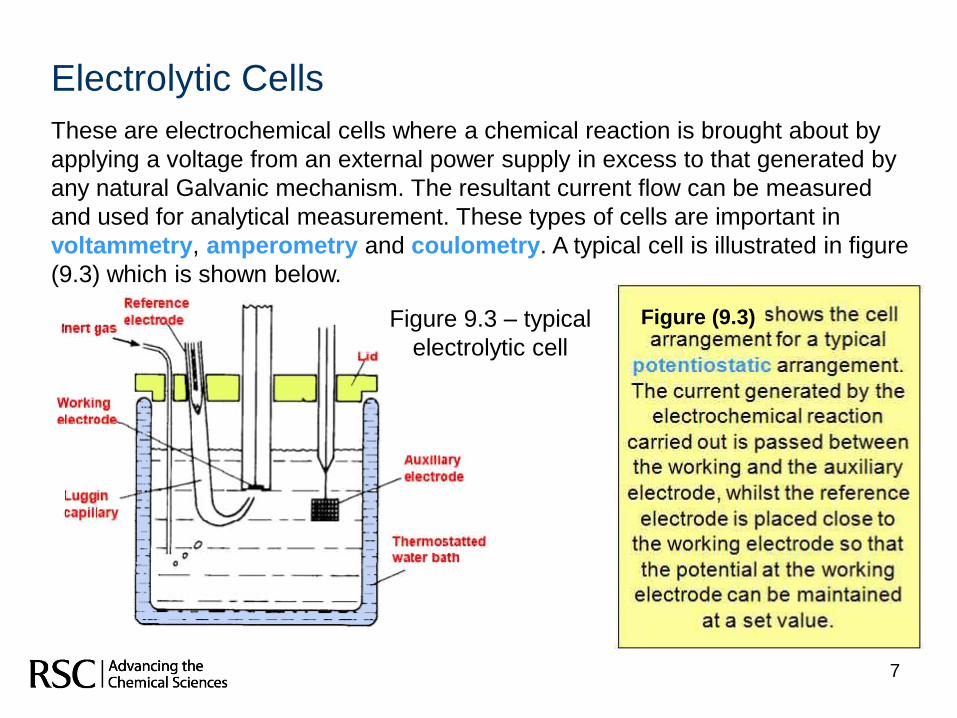
Electrolytic Cells
These are electrochemical cells where a chemical reaction is brought about by
applying a voltage from an external power supply in excess to that generated by
any natural Galvanic mechanism. The resultant current flow can be measured
and used for analytical measurement. These types of cells are important in
voltammetry, amperometry and coulometry. A typical cell is illustrated in figure
(9.3) which is shown below.
Figure (9.3)Figure 9.3 – typical
electrolytic cell
Electrodes
In both types of these cells the electrode at which oxidation occurs is the anode
and that at which reduction occurs is the cathode. In the galvanic cell shown in
figure (9.2) the cathode reaction is given by:
Cu2+
+ 2e-
Cu Equation (9.1)
and the anode reaction by:
Zn Zn2+
+ 2e-
Equation (9.2)
The solutions are contained in separate beakers and connected by a salt bridge
(a salt bridge allows charge transfer but prevents mixing of the solutions). If we
place a zinc electrode into the zinc solution and a copper electrode in the
copper solution and connect the two together we have a voltaic cell. If an
ammeter is connected between the two electrodes (in series) it indicates a flow
of current from the reduction of copper at the cathode. The released current
flows through the wire and oxidises the zinc at the anode. These reactions are
referred to as half cell reactions.
o
o
o
o
o
o
o
ElectrodeSolution
ElectrodeSolution
Electrode Solution
Solution
A Simple electrode transfer
Fe3+ + e- = Fe2+
B Metal deposition
Cu2+ + 2e- = Cu
C Gas evolution
2Cl- - 2e- = Cl2
D Corrosion
Fe – 2e- = Fe2+
Fe2+
Fe3+e-
Deposit
growth
2e- Cu2+
Cl2
Cl-e-
FeFe2+
e-
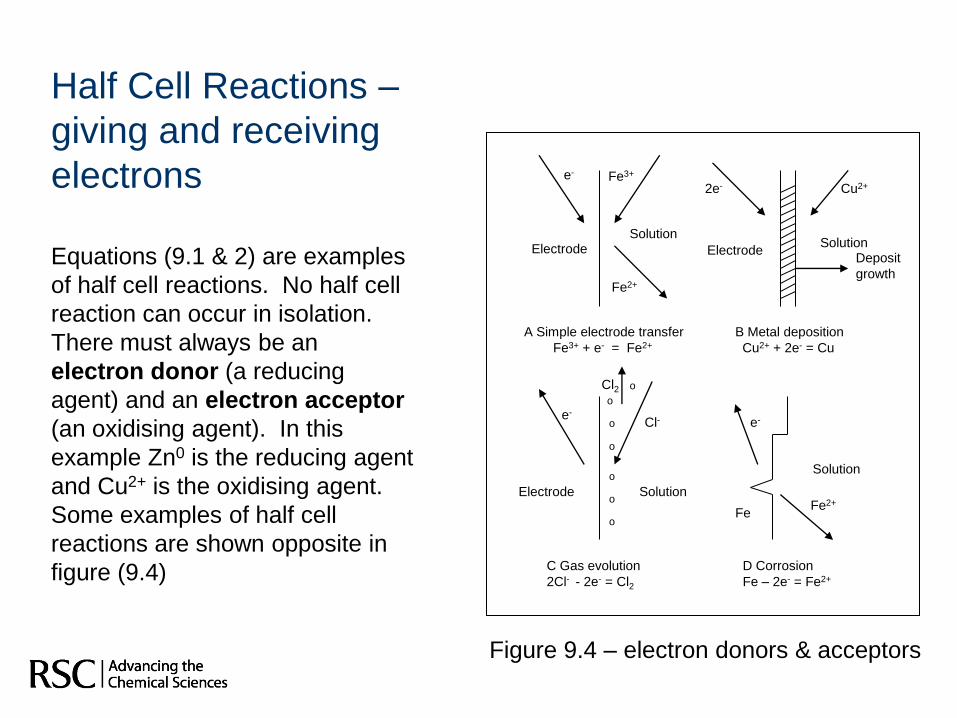
Figure 9.4 – electron donors & acceptors
Half Cell Reactions –
giving and receiving
electrons
Equations (9.1 & 2) are examples
of half cell reactions. No half cell
reaction can occur in isolation.
There must always be an
electron donor (a reducing
agent) and an electron acceptor
(an oxidising agent). In this
example Zn0 is the reducing agent
and Cu2+ is the oxidising agent.
Some examples of half cell
reactions are shown opposite in
figure (9.4)
10
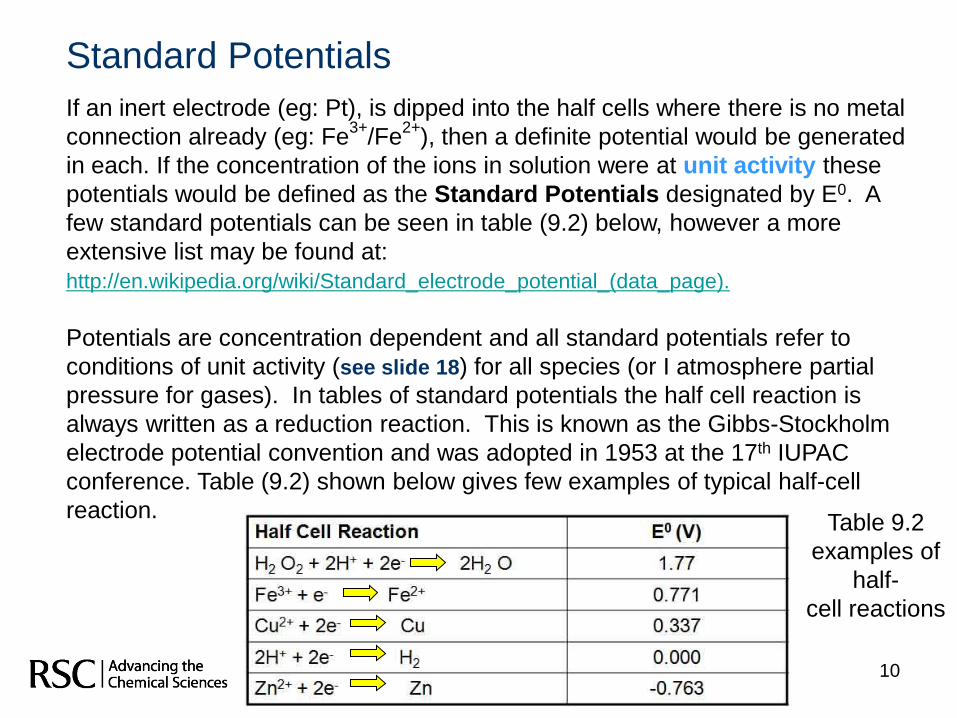
Standard Potentials
If an inert electrode (eg: Pt), is dipped into the half cells where there is no metal
connection already (eg: Fe3+
/Fe2+
), then a definite potential would be generated
in each. If the concentration of the ions in solution were at unit activity these
potentials would be defined as the Standard Potentials designated by E0. A
few standard potentials can be seen in table (9.2) below, however a more
extensive list may be found at:
http://en.wikipedia.org/wiki/Standard_electrode_potential_(data_page).
Potentials are concentration dependent and all standard potentials refer to
conditions of unit activity (see slide 18) for all species (or I atmosphere partial
pressure for gases). In tables of standard potentials the half cell reaction is
always written as a reduction reaction. This is known as the Gibbs-Stockholm
electrode potential convention and was adopted in 1953 at the 17th IUPAC
conference. Table (9.2) shown below gives few examples of typical half-cell
reaction.Table 9.2
examples of
half-
cell reactions
11
Measuring Half Cell Potentials
If the potentials of half cell reactions could be measured it would be possible to
determine which reactions could occur. Unfortunately, it is not possible to
measure individual half-cell reactions (electrode potentials) {cf: it can be
compared to the sound of one hand clapping} – only differences between two
different half-cells can be measured [cf: Daniell cell as shown in figure (9.2)].
In order to produce a table of relative half-cell (electrode) potentials, the
standard hydrogen half-cell has been chosen as the reference point and under
standard condition is said to have an half-cell potential of 0.000 V. The
equation for this hydrogen half-cell is shown in equation (9.3) below:
2H+
+ 2e-
H2 Equation (9.3)
This half-cell is called the normal hydrogen electrode (NHE), or the standard
hydrogen electrode (SHE).
Continued on the next slide
http://en.wikipedia.org/wiki/File:Standard_hydrogen_electrode_2009-02-06.svg
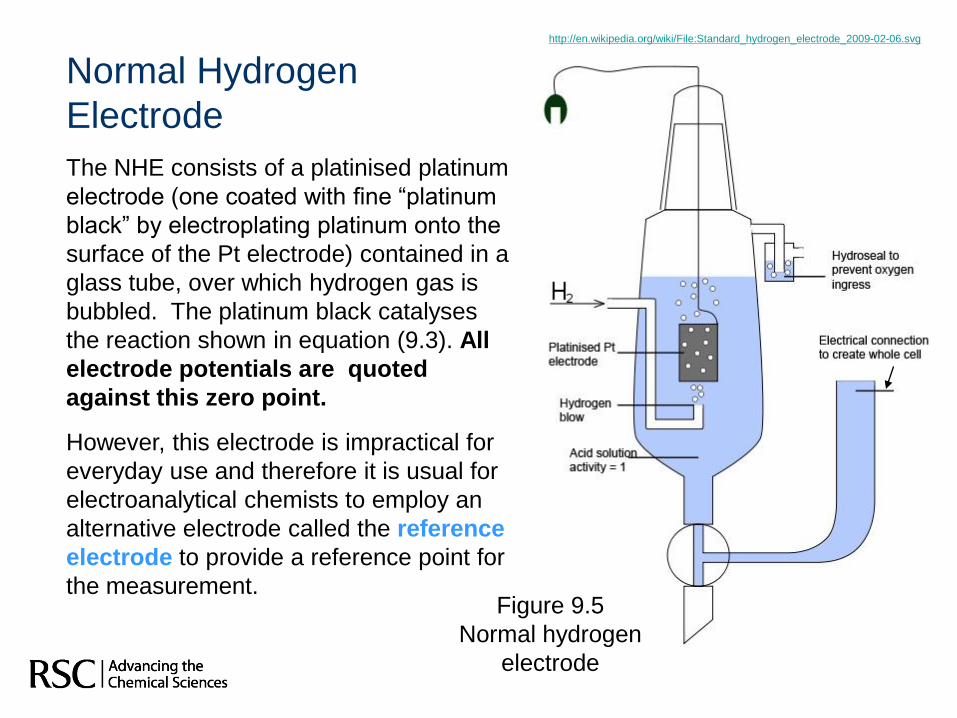
Normal Hydrogen
Electrode
The NHE consists of a platinised platinum
electrode (one coated with fine “platinum
black” by electroplating platinum onto the
surface of the Pt electrode) contained in a
glass tube, over which hydrogen gas is
bubbled. The platinum black catalyses
the reaction shown in equation (9.3). All
electrode potentials are quoted
against this zero point.
However, this electrode is impractical for
everyday use and therefore it is usual for
electroanalytical chemists to employ an
alternative electrode called the reference
electrode to provide a reference point for
the measurement.Figure 9.5
Normal hydrogen
electrode
13
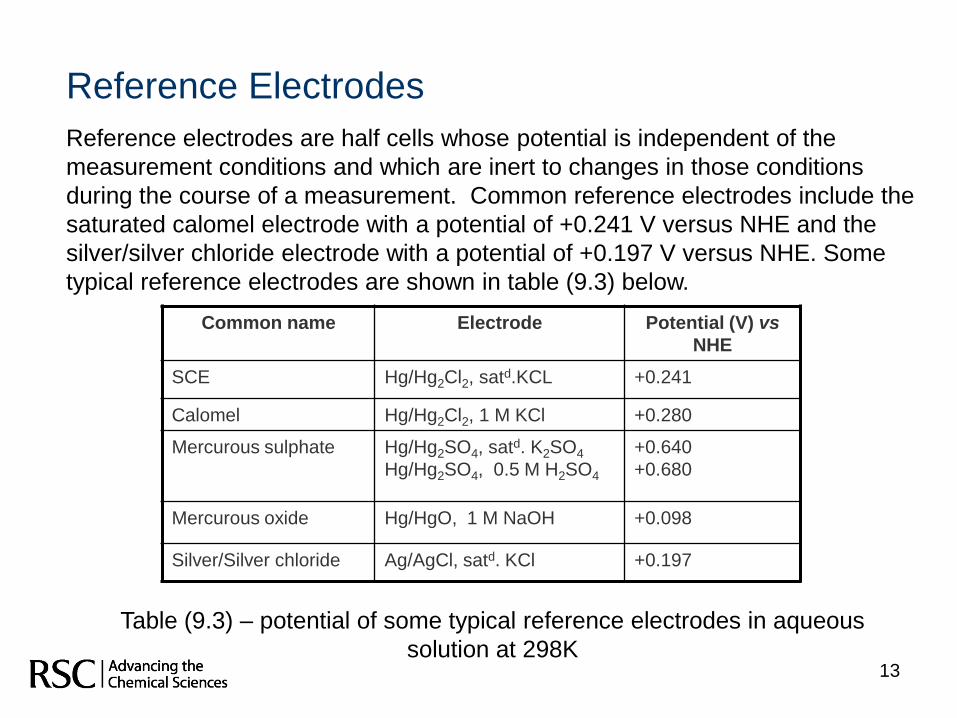
Reference Electrodes
Reference electrodes are half cells whose potential is independent of the
measurement conditions and which are inert to changes in those conditions
during the course of a measurement. Common reference electrodes include the
saturated calomel electrode with a potential of +0.241 V versus NHE and the
silver/silver chloride electrode with a potential of +0.197 V versus NHE. Some
typical reference electrodes are shown in table (9.3) below.
Common name Electrode Potential (V) vs
NHE
SCE Hg/Hg2Cl2, satd.KCL +0.241
Calomel Hg/Hg2Cl2, 1 M KCl +0.280
Mercurous sulphate Hg/Hg2SO4, satd. K2SO4
Hg/Hg2SO4, 0.5 M H2SO4
+0.640
+0.680
Mercurous oxide Hg/HgO, 1 M NaOH +0.098
Silver/Silver chloride Ag/AgCl, satd. KCl +0.197
Table (9.3) – potential of some typical reference electrodes in aqueous
solution at 298K
14
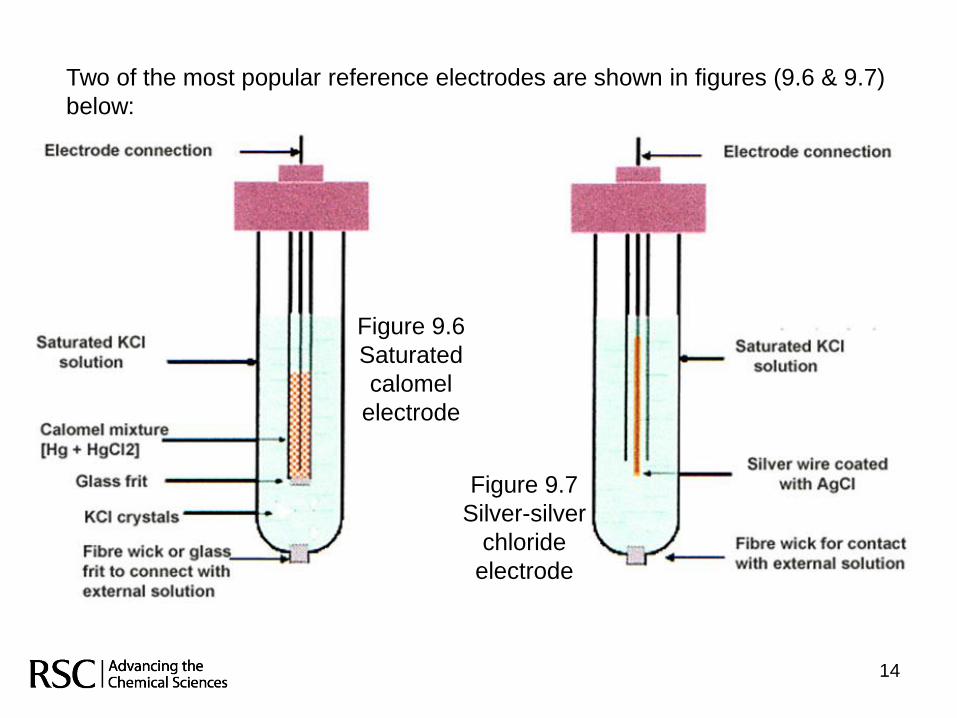
Two of the most popular reference electrodes are shown in figures (9.6 & 9.7)
below:
Figure 9.6
Saturated
calomel
electrode
Figure 9.7
Silver-silver
chloride
electrode
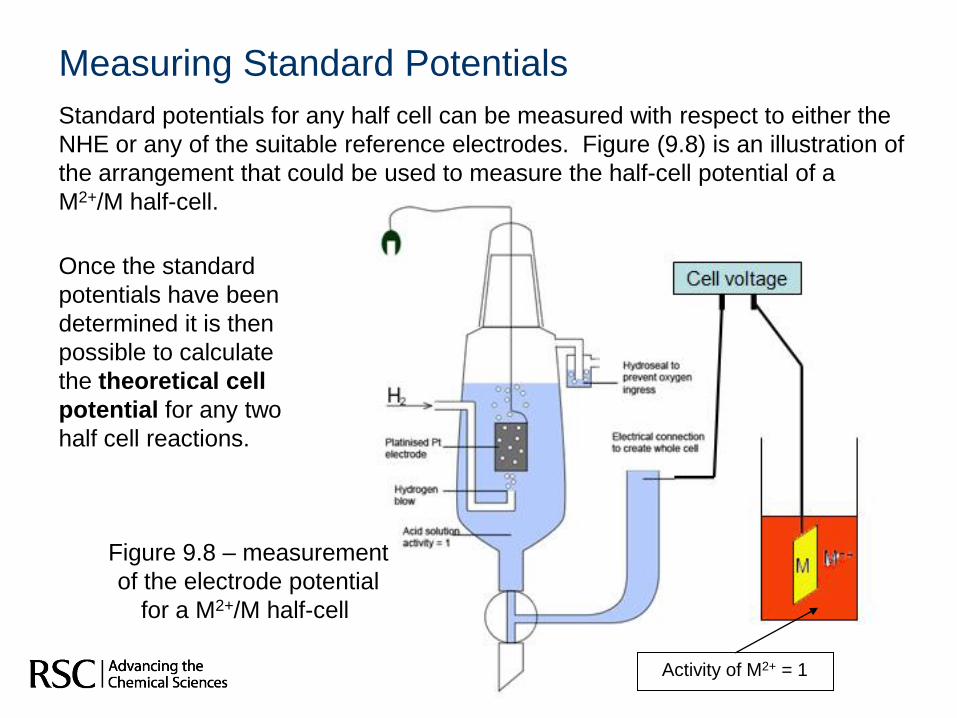
Measuring Standard Potentials
Standard potentials for any half cell can be measured with respect to either the
NHE or any of the suitable reference electrodes. Figure (9.8) is an illustration of
the arrangement that could be used to measure the half-cell potential of a
M2+/M half-cell.
Once the standard
potentials have been
determined it is then
possible to calculate
the theoretical cell
potential for any two
half cell reactions.
Figure 9.8 – measurement
of the electrode potential
for a M2+/M half-cell
Activity of M2+ = 1
16
Theoretical Cell Potentials
By convention, a cell is written with the anode on the left:
anode / solution / cathode Equation (9. 4)
The potential of a galvanic cell is given by:
Ecell = (Eright – Elef)t) = (Ecathode – Eanode) = (E+ – E-) Equation (9.5)
For example in the Galvanic (voltaic) cell shown earlier in equations (9.1 & 2),
E0
for equation (9.1) is 0.337 V and E0
for equation (9.2) is –0.763V. The
theoretical cell potential is therefore given by:
E0cell = Ecathode – Eanode = +0.337 – (–0.763) = 1.100 V Equation (9.6)
17
Nernst Equation – Effects of concentrations on
potentials
The standard potentials (E0
values) listed in table 9.2 were determined under
the special conditions where all the species present in the cell were at unit
activity. The first empirical E0
tables were produced by Volta and the values
were obtained under very controlled and defined conditions. Nernst
demonstrated that the potential was dependent upon the concentration of the
species and varies from the standard potential. This potential dependence is
described by the Nernst equation.
aOx + ne- bRed Equation (9.7)
Equation (9.8)
where E is the reduction potential at the specific concentrations, n is the number
of electrons involved in the half cell reaction, R is the gas constant (8.3143 V
coul deg-1
mol-1
), T is the absolute temperature and F is the Faraday constant
(96,485 coul eq-1
).
E = E0
- log2.3026RT
nF
[Red]b
[Ox]a
18
Activity or Concentration
On a number of occasions the term activity has been used in defining, for
example, standard electrode potentials. The activity of a species in solution is
the “effective concentration” of that species and is related to the true
concentration.
ai = Cifi Equation (9.9)
Where ai is the activity of the ion, Ci is the concentration of the ion and fi is its
activity coefficient.
This reflects the fact that ions do not exist in isolation in solution and in many
samples a number of species are present and these will interact with each other
changing absolute concentrations. In practice the activity coefficient is close to
unity in dilute solutions (below 10-4
M) and hence activity is approximately equal
to concentration below this value. [An extensive explanation of activity and
activity coefficients may be found at: http://en.wikipedia.org/wiki/Activity_(chemistry)]
19
Measuring Potential - PotentiometryPotentiometry is one of the simplest of all analytical techniques and is widely
used in many scientific disciplines. You have perhaps already used it as
measuring pH is an example of potentiometry.
In the preceding section the Nernst equation (9.8) was introduced, which relates
the potential of a cell to the concentrations of the species present in the cell
solution. The equation is reproduced below:
Equation (9.8)
It is this equation which underpins potentiometry – the measurement of cell
potential, and allows the calculation of the concentration of a given species.
You should also now appreciate that the Nernst equation is not written in terms
of concentration but of activity and therefore activities will be used through out
this section.
This section will describe the apparatus for making potentiometric
measurements, examples of metal electrodes, the important glass pH
electrode and various kinds of ion selective electrodes.
E = E0 - log2.3026RT
nF
[Red]b
[Ox]a
20
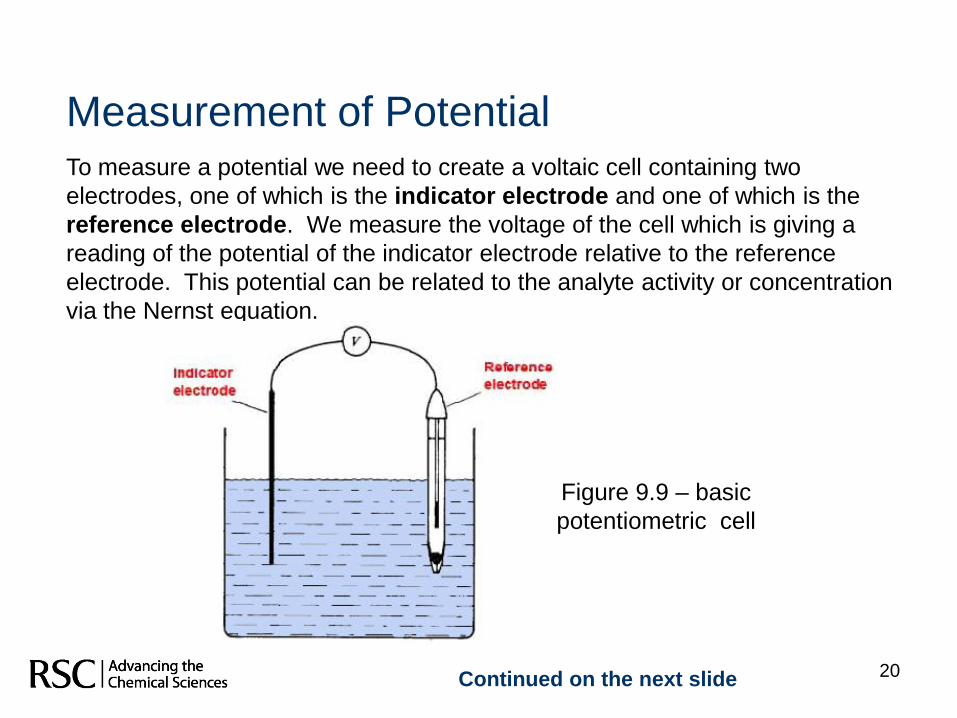
Measurement of PotentialTo measure a potential we need to create a voltaic cell containing two
electrodes, one of which is the indicator electrode and one of which is the
reference electrode. We measure the voltage of the cell which is giving a
reading of the potential of the indicator electrode relative to the reference
electrode. This potential can be related to the analyte activity or concentration
via the Nernst equation.
Figure 9.9 – basic
potentiometric cell
Continued on the next slide
21
A typical example of such a cell is:
Hg | Hg2Cl2(s) | KCl(saturated) || HCl(solution), H2(g) | Pt Equation (9.10)
The double line represents the liquid junction between two dissimilar solutions
and is often in the form of a salt bridge. The purpose of this is to prevent mixing
of the two solutions. In this way the potential of one of the electrodes is
constant, independent of the composition of the test solution and determined by
the solution in which it dips. The electrode on the left of the cell is the saturated
calomel electrode, a common reference electrode (see slide 14). The cell is set
up using the hydrogen electrode as the indicating electrode to measure pH.
The disadvantage of this type of cell is that there is a potential associated with
the liquid junction called the liquid junction potential.
22
Liquid Junction PotentialsThe potential of the cell in equation 9.10 is:
Ecell = (Eright – Eleft) + Ej Equation (9.11)
where Ej is the liquid junction potential and can be positive or negative. This
potential results from the unequal migration of ions on either side of the
boundary. Unequal migration occurs when there is a concentration difference
across the junction and the species involved migrate at different rates, for
example hydrogen ions migrate about five times faster than chloride ions.
A typical junction might be a fine-porosity frit separating two solutions of differing
concentration of the same electrolyte, for example HCl (0.1 M || HCl (0.01 M).
The net migration will be from high to low concentrations (although ions will
move in both directions), with the concentration gradient being the driving force
for the migration. Since the hydrogen ions migrate five times faster than the
chloride ions, there is a net build up of positive charge on the right hand side of
the boundary leaving a net negative charge on the left hand side. This charge
separation represents a potential.
Continued on the next slide
23
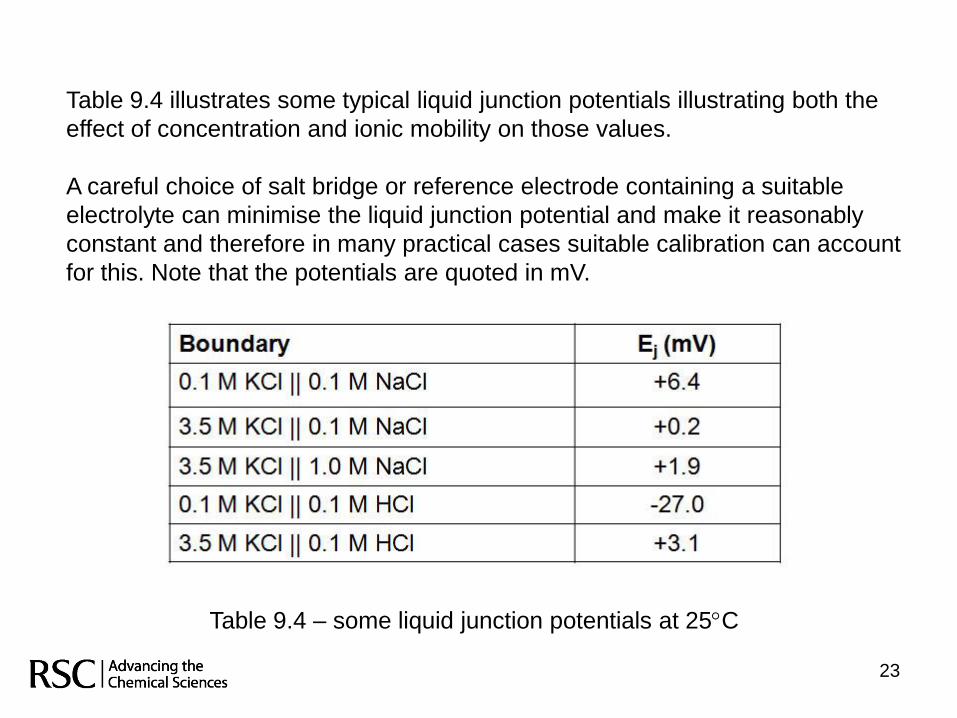
Table 9.4 illustrates some typical liquid junction potentials illustrating both the
effect of concentration and ionic mobility on those values.
A careful choice of salt bridge or reference electrode containing a suitable
electrolyte can minimise the liquid junction potential and make it reasonably
constant and therefore in many practical cases suitable calibration can account
for this. Note that the potentials are quoted in mV.
Table 9.4 – some liquid junction potentials at 25C
24
The Potentiometer and pH MeterThere are two commonly used instruments for making potentiometric
measurements.
The potentiometer is a device which is normally used for the measurement of
potentials in low resistance circuits and as a result is only rarely applied.
The pH meter, which is a voltmeter, is a voltage measuring device designed for
use with high resistance glass electrodes and can be used with both low and
high resistance circuits. During a measurement the voltage is converted to a
current for amplification via an ac circuit and these are therefore high input
impedance devices. (Impedance in an ac circuit is similar to resistance in a dc
circuit). Due to the high input resistance very little current flows during the
measurement, typically 10-13
to 10-15
A, hence the chemical equilibrium remains
relatively undisturbed and the criteria for applying the Nernst equation are
retained. For convenience when making pH measurements, the voltage reading
can be converted directly to pH units.
25
The Cell for Potential MeasurementThe normal cell format of a potentiometric measurement was shown in figure
9.9 (slide 20). For direct potentiometric measurements in which the activity of
one ion is to be calculated from the potential of the indicating electrode, the
potential of the reference electrode will have to be known. The voltage of the
cell is described by equation (9.11) including a term for the junction potential.
Ecell = (Eind – Eref) + Ej Equation (9.11)
The Ej can be combined with the other constants from equation (9.11) into a
single constant, k. This assumes that the junction potential is similar in all
solutions which is a pragmatic assumption as Ej cannot be determined under
most conditions.
k = E0ind – Eref + Ej Equation (9.12)
Thus for a 1:1 reaction
Equation (9.13)Ecell = k - log2.303RT
nF
ared
aox
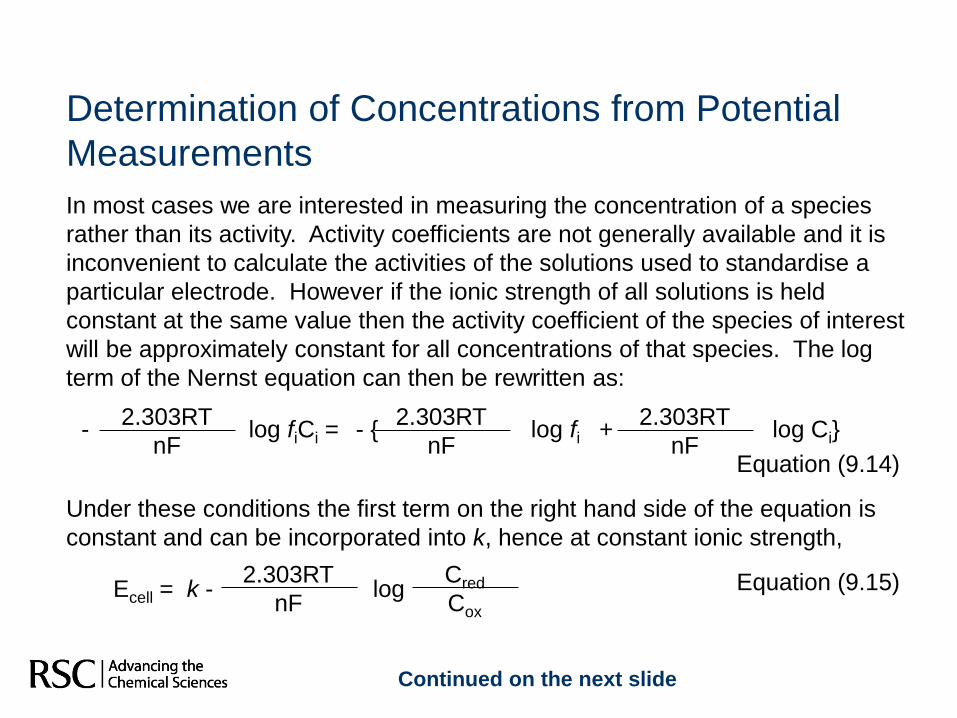
Determination of Concentrations from Potential
Measurements
In most cases we are interested in measuring the concentration of a species
rather than its activity. Activity coefficients are not generally available and it is
inconvenient to calculate the activities of the solutions used to standardise a
particular electrode. However if the ionic strength of all solutions is held
constant at the same value then the activity coefficient of the species of interest
will be approximately constant for all concentrations of that species. The log
term of the Nernst equation can then be rewritten as:
Equation (9.14)
Under these conditions the first term on the right hand side of the equation is
constant and can be incorporated into k, hence at constant ionic strength,
Equation (9.15)
Continued on the next slide
Ecell = k - log2.303RT
nF
Cred
Cox
- log fiCi =2.303RT
nF- { log fi
2.303RT
nF+ log Ci}
2.303RT
nF
27
Hence the electrode potential changes by ±2.303RT/nF volts for each 10 fold
change in concentration of the oxidised or reduced forms. At 250C, 2.303RT/nF,
simplifies to 0.05916/n volts i.e.: the ten fold change in concentration leads to
a change in potential of ±59/n mV.
In practice it is best to determine a calibration curve of potential versus log
concentration. This should have a slope of 59/n mV and any deviation from the
theoretical response is easy to visualise. Alternatively, as is the case in pH
measurements, since the theoretical response is known, a two point calibration
can be undertaken. If the potential difference between two standards, a decade
apart in concentration, is 59/n mV apart then the indicator electrode is working
satisfactorily.
To obtain the conditions in which activity coefficients are constant it is usual,
with the exception of pH measurements, to add large amounts of an electrolyte
to both the standards and to the samples. These solutions are often referred to
as total ionic strength adjustment buffers or TISABs.
28
Total Ionic Strength Adjustment Buffers - TISABs
TISABs are added to all standards and samples to ensure that there is a
constant ionic strength in all solutions being measured and hence the theoretical
treatment of the Nernst equation allows the direct measurement of
concentration rather than activity of the species of interest. In practise this
means mixing the sample or standard in a 1:1 ratio with the TISAB prior to
measuring the potential of the solution.
It is important to note that whilst the principle purpose of the TISAB is to
maintain a constant ionic strength, a TISAB for a particular electrode may also
contain other species such as pH buffers and chelating agents to ensure the
optimum conditions for the potentiometric measurement. Therefore TISABs for
different electrodes are not interchangeable.
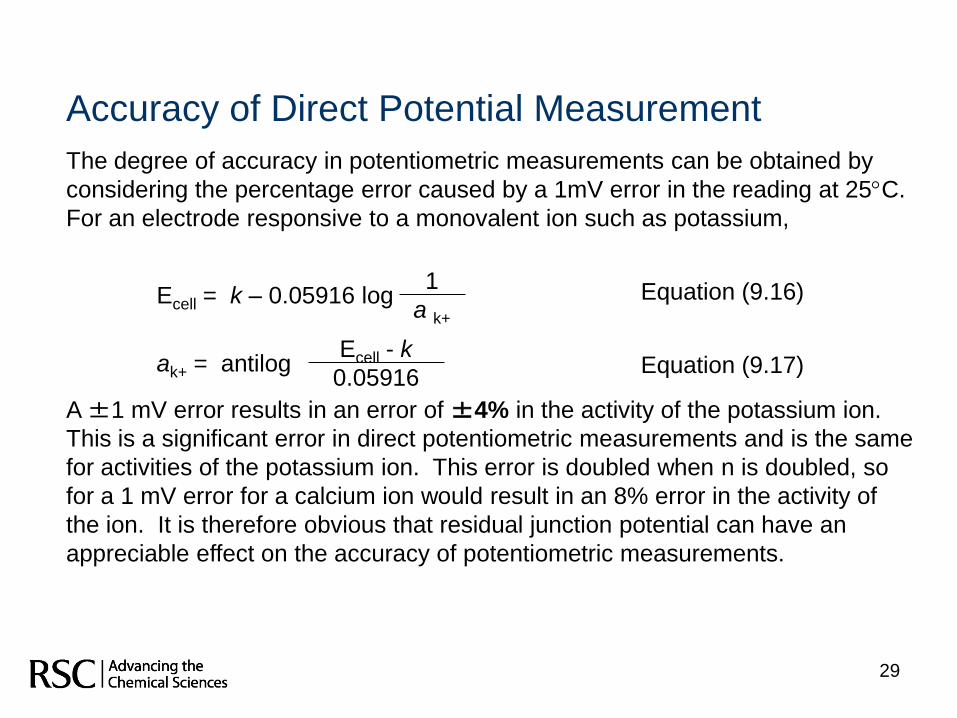
Accuracy of Direct Potential Measurement
The degree of accuracy in potentiometric measurements can be obtained by
considering the percentage error caused by a 1mV error in the reading at 25C.
For an electrode responsive to a monovalent ion such as potassium,
Equation (9.16)
Equation (9.17)
A ±1 mV error results in an error of ±4% in the activity of the potassium ion.
This is a significant error in direct potentiometric measurements and is the same
for activities of the potassium ion. This error is doubled when n is doubled, so
for a 1 mV error for a calcium ion would result in an 8% error in the activity of
the ion. It is therefore obvious that residual junction potential can have an
appreciable effect on the accuracy of potentiometric measurements.
29
Ecell = k – 0.05916 log1
a k+
ak+ = antilogEcell - k
0.05916
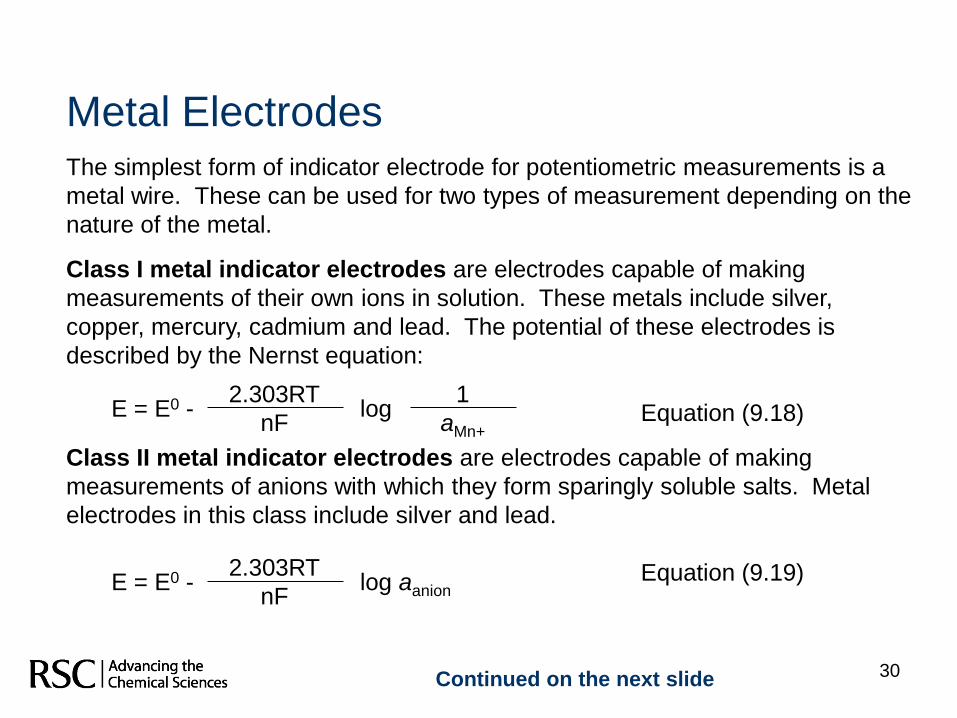
Metal ElectrodesThe simplest form of indicator electrode for potentiometric measurements is a
metal wire. These can be used for two types of measurement depending on the
nature of the metal.
Class I metal indicator electrodes are electrodes capable of making
measurements of their own ions in solution. These metals include silver,
copper, mercury, cadmium and lead. The potential of these electrodes is
described by the Nernst equation:
Equation (9.18)
Class II metal indicator electrodes are electrodes capable of making
measurements of anions with which they form sparingly soluble salts. Metal
electrodes in this class include silver and lead.
Equation (9.19)
30
E = E0 - log2.303RT
nF
1
aMn+
E = E0 - log aanion
2.303RT
nF
Continued on the next slide
31
These electrodes can be used to make very reliable measurements when the
composition of the solutions is well defined and known. This is not the case
however, with many solutions and in those cases where the electrode is capable
of detecting both their own cations and anions with which they form salts.
For example a silver electrode will respond both to the presence of silver ions in
solution and a range of anions with which it forms sparingly soluble salts
including chloride, bromide, iodide and sulphide.
This type of electrode is therefore said to lack specificity and the analyst cannot
determine the origin of the potentiometric signal. As a result this type of
electrode has fallen out of favour with analysts except for specific uses under
well defined conditions.
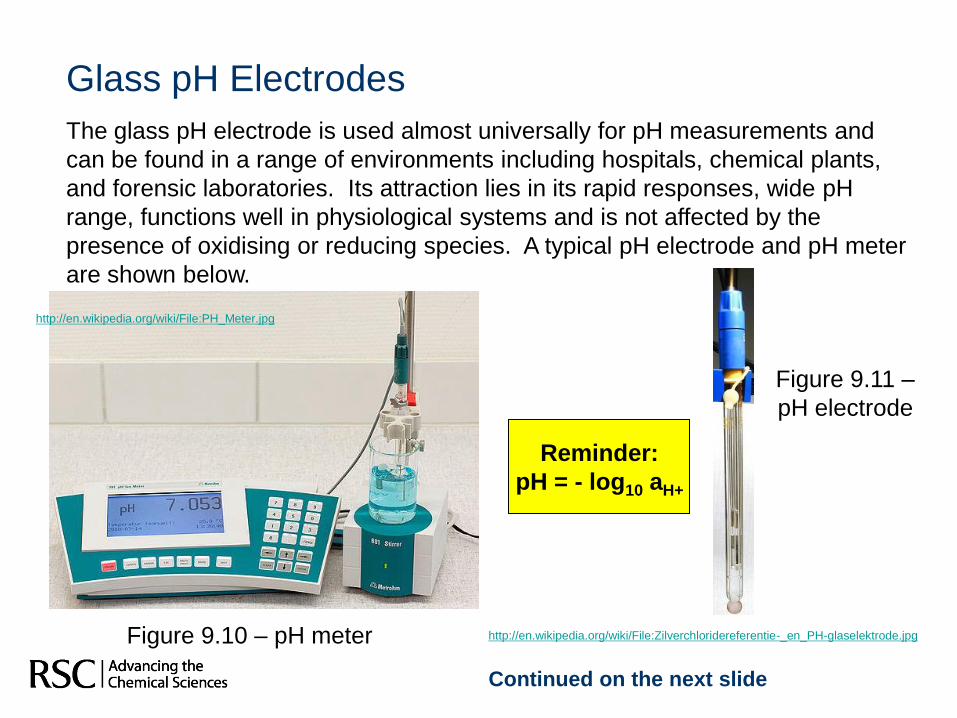
Glass pH Electrodes
The glass pH electrode is used almost universally for pH measurements and
can be found in a range of environments including hospitals, chemical plants,
and forensic laboratories. Its attraction lies in its rapid responses, wide pH
range, functions well in physiological systems and is not affected by the
presence of oxidising or reducing species. A typical pH electrode and pH meter
are shown below.
Continued on the next slide
Figure 9.10 – pH meter
Figure 9.11 –
pH electrode
Reminder:
pH = - log10 aH+
http://en.wikipedia.org/wiki/File:PH_Meter.jpg
http://en.wikipedia.org/wiki/File:Zilverchloridereferentie-_en_PH-glaselektrode.jpg
33
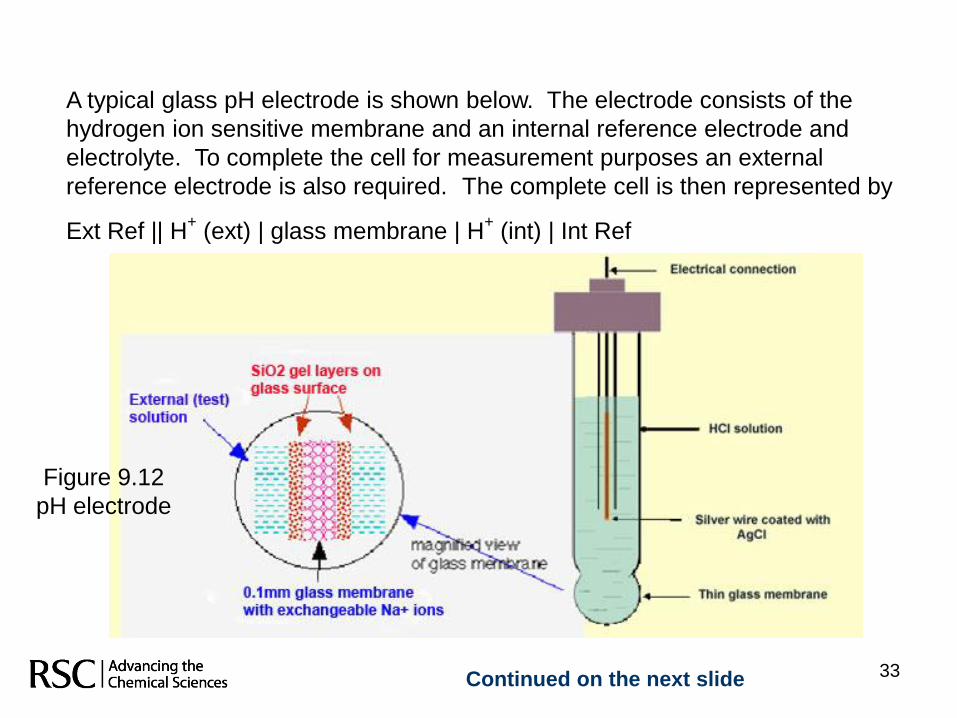
A typical glass pH electrode is shown below. The electrode consists of the
hydrogen ion sensitive membrane and an internal reference electrode and
electrolyte. To complete the cell for measurement purposes an external
reference electrode is also required. The complete cell is then represented by
Ext Ref || H+
(ext) | glass membrane | H+
(int) | Int Ref
Continued on the next slide
Figure 9.12
pH electrode
34
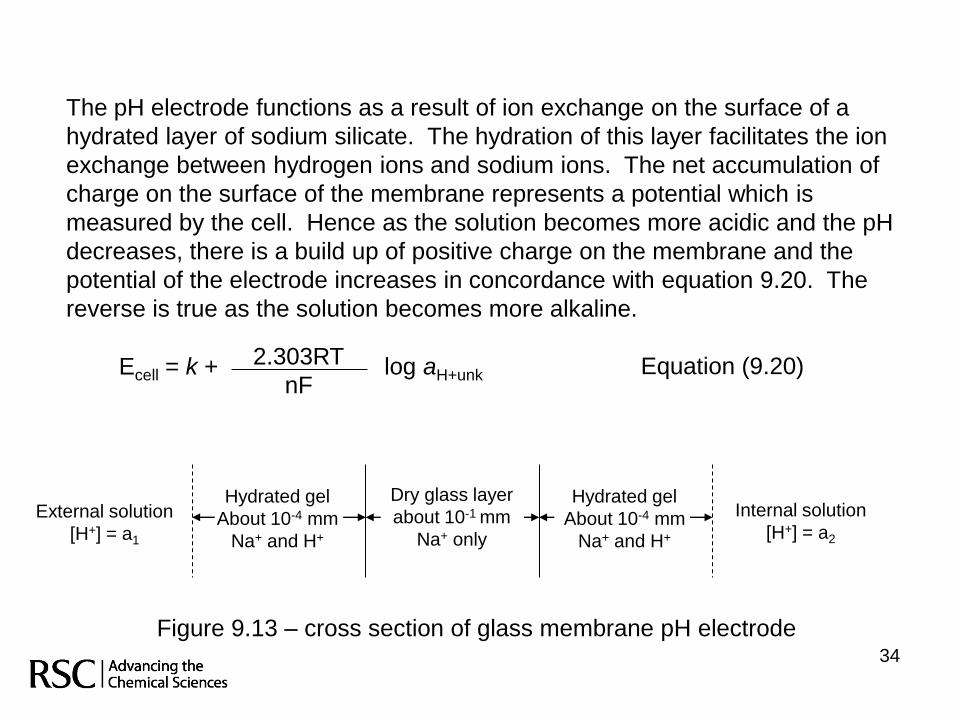
The pH electrode functions as a result of ion exchange on the surface of a
hydrated layer of sodium silicate. The hydration of this layer facilitates the ion
exchange between hydrogen ions and sodium ions. The net accumulation of
charge on the surface of the membrane represents a potential which is
measured by the cell. Hence as the solution becomes more acidic and the pH
decreases, there is a build up of positive charge on the membrane and the
potential of the electrode increases in concordance with equation 9.20. The
reverse is true as the solution becomes more alkaline.
Equation (9.20)
Figure 9.13 – cross section of glass membrane pH electrode
Ecell = k + log aH+unk2.303RT
nF
Dry glass layer
about 10-1 mm
Na+ only
Hydrated gel
About 10-4 mm
Na+ and H+
Internal solution
[H+] = a2
Hydrated gel
About 10-4 mm
Na+ and H+
External solution
[H+] = a1
35
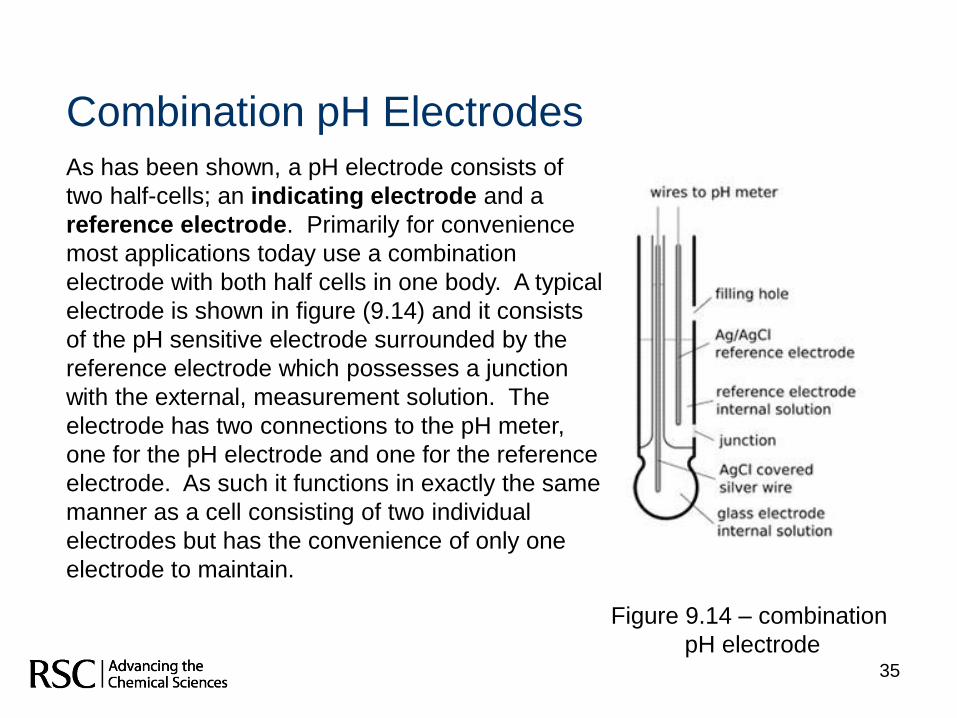
Combination pH ElectrodesAs has been shown, a pH electrode consists of
two half-cells; an indicating electrode and a
reference electrode. Primarily for convenience
most applications today use a combination
electrode with both half cells in one body. A typical
electrode is shown in figure (9.14) and it consists
of the pH sensitive electrode surrounded by the
reference electrode which possesses a junction
with the external, measurement solution. The
electrode has two connections to the pH meter,
one for the pH electrode and one for the reference
electrode. As such it functions in exactly the same
manner as a cell consisting of two individual
electrodes but has the convenience of only one
electrode to maintain.
Figure 9.14 – combination
pH electrode
36
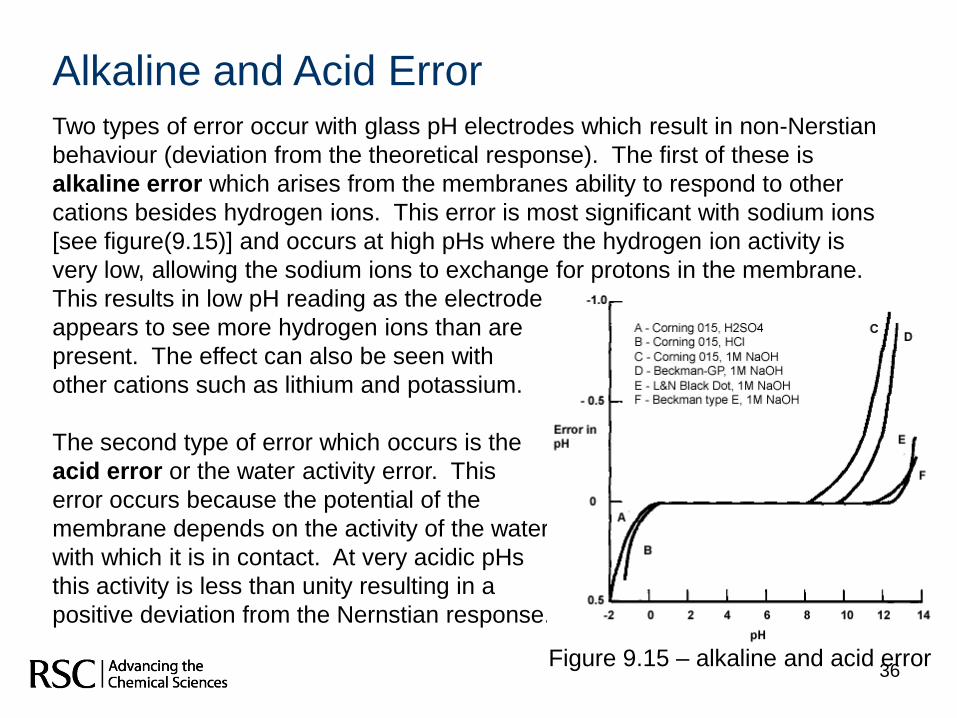
Alkaline and Acid ErrorTwo types of error occur with glass pH electrodes which result in non-Nerstian
behaviour (deviation from the theoretical response). The first of these is
alkaline error which arises from the membranes ability to respond to other
cations besides hydrogen ions. This error is most significant with sodium ions
[see figure(9.15)] and occurs at high pHs where the hydrogen ion activity is
very low, allowing the sodium ions to exchange for protons in the membrane.
This results in low pH reading as the electrode
appears to see more hydrogen ions than are
present. The effect can also be seen with
other cations such as lithium and potassium.
The second type of error which occurs is the
acid error or the water activity error. This
error occurs because the potential of the
membrane depends on the activity of the water
with which it is in contact. At very acidic pHs
this activity is less than unity resulting in a
positive deviation from the Nernstian response.
Figure 9.15 – alkaline and acid error
37
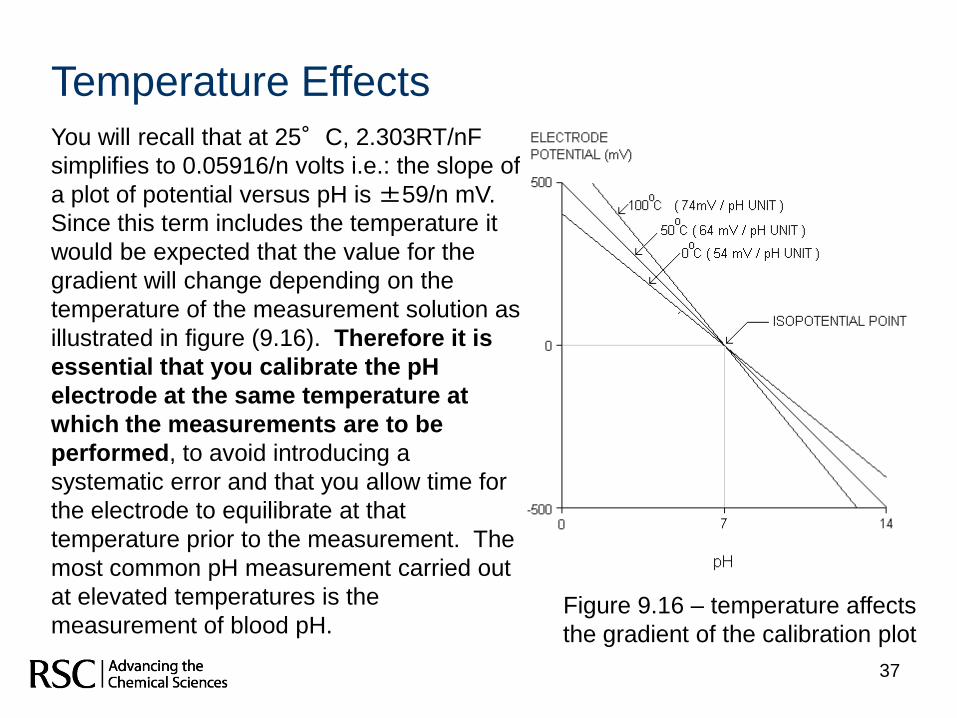
Temperature EffectsYou will recall that at 25°C, 2.303RT/nF
simplifies to 0.05916/n volts i.e.: the slope of
a plot of potential versus pH is ±59/n mV.
Since this term includes the temperature it
would be expected that the value for the
gradient will change depending on the
temperature of the measurement solution as
illustrated in figure (9.16). Therefore it is
essential that you calibrate the pH
electrode at the same temperature at
which the measurements are to be
performed, to avoid introducing a
systematic error and that you allow time for
the electrode to equilibrate at that
temperature prior to the measurement. The
most common pH measurement carried out
at elevated temperatures is the
measurement of blood pH. Figure 9.16 – temperature affects
the gradient of the calibration plot
38
Calibrating pH ElectrodesAll pH electrodes require calibration prior to use. This usually takes the form of
a two point calibration using appropriate buffer solutions. For example to
calibrate the electrode for acidic measurements it is usual to:
Use a pH = 7.0 buffer (typically a phosphate buffer)
A pH = 4.0 buffer (typically phthalate solutions)
For alkaline measurements the recommended buffers are:
A pH = 7.0 buffer
A pH =10.0 buffer.
All of these buffers are generally purchased from the manufacturers and are
based on the NIST (National Institute of Standards and Technology) certified
standard buffers. [A extended list of pH buffers can be found at :
http://www.nist.gov/cstl/analytical/inorganic/ph.cfm]. Prior to calibrating the pH
electrode it is important to adjust the temperature to compensate for
temperature effects. Some pH meters include a temperature probe which
allows for automatic temperature compensation (ATC).
39
Ion-Selective ElectrodesSince the introduction of the pH electrode during the 1930s chemists have
sought membrane materials which are sensitive to ions other than hydrogen
ions. This has led to a number of membrane electrodes being developed based
around;
Glass membranes
Plastic membranes
Solid state electrodes
Brief descriptions of these three membrane types are shown on the next slide
Generally these electrodes are useful for the direct measurement of ions at low
concentrations. They are especially suited to measurements in biological media
as they are not impaired by proteins, which has seen a rapid growth in medical
applications. The most significant drawback of the electrodes is that they are
not specific but only selective for the measurement of individual ion activities.
Therefore they are more correctly referred to as ion- selective electrodes
(ISEs) and a selection of commercial examples can be seen in table 9.5 on slide
42 with some diagrams on slide 43

40
Glass membranesGlass membranes are made from an ion-exchange type of glass (mainly silicate
based). This type of ISE has good selectivity, but only for several single-charged
cations eg: H+, Na
+, and Ag
+. The glass membrane has excellent chemical
durability and can work in very aggressive media. The most common example of
this type of electrode is the pH glass electrode. Gas sensing electrodes (which
are also based on pH electrodes), are available for the measurement of a limited
range of gases. These diffuse across a thin polymeric membrane to alter the pH
of a thin film of buffer solution which is itself in contact with a pH glass electrode.
Solid State membranes
These membranes are made from mono- or polycrystallites of a single
substance. They have good selectivity, because only ions which can introduce
themselves into the crystal structure can interfere with the electrode response.
Selectivity of crystalline membranes can be for both cation and anion of the
membrane-forming substance. An example is the fluoride selective electrode
based on LaF3 crystals.
Continued on the next slide

Polymer Membrane Electrodes
Polymer membrane electrodes consist of various ion-exchange materials
incorporated into an inert matrix such as PVC, or silicone rubber. After the
membrane is formed, it is sealed to the end of a PVC tube. The potential
developed at the membrane surface is related to the concentration of the
species of interest. Electrodes of this type include potassium, calcium,
chloride, nitrate, perchlorate, potassium, and one for water hardness.
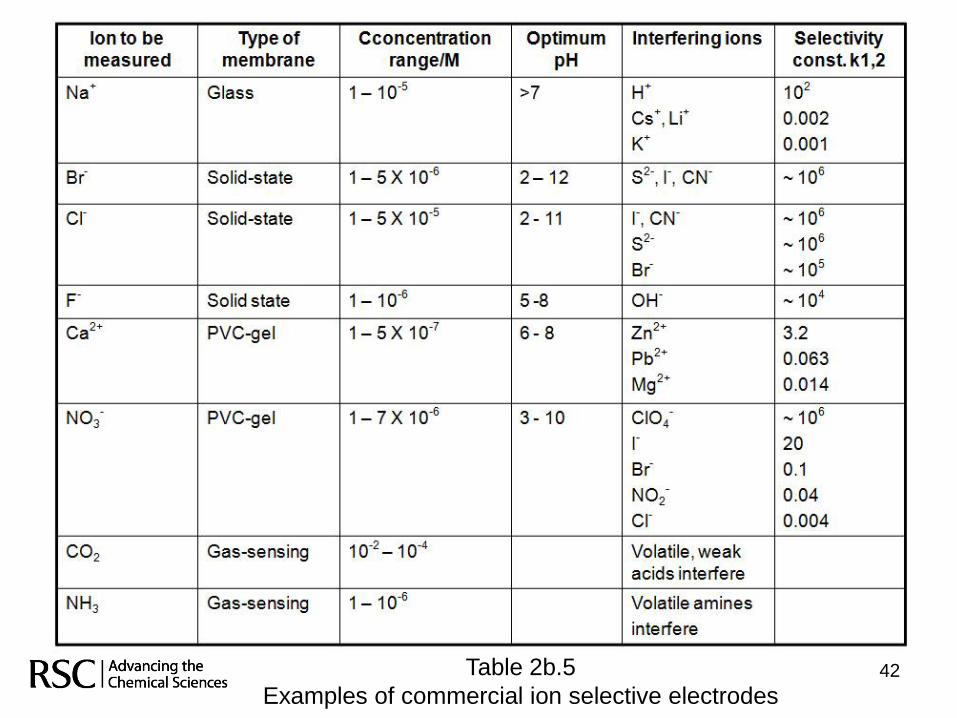
42Table 2b.5
Examples of commercial ion selective electrodes
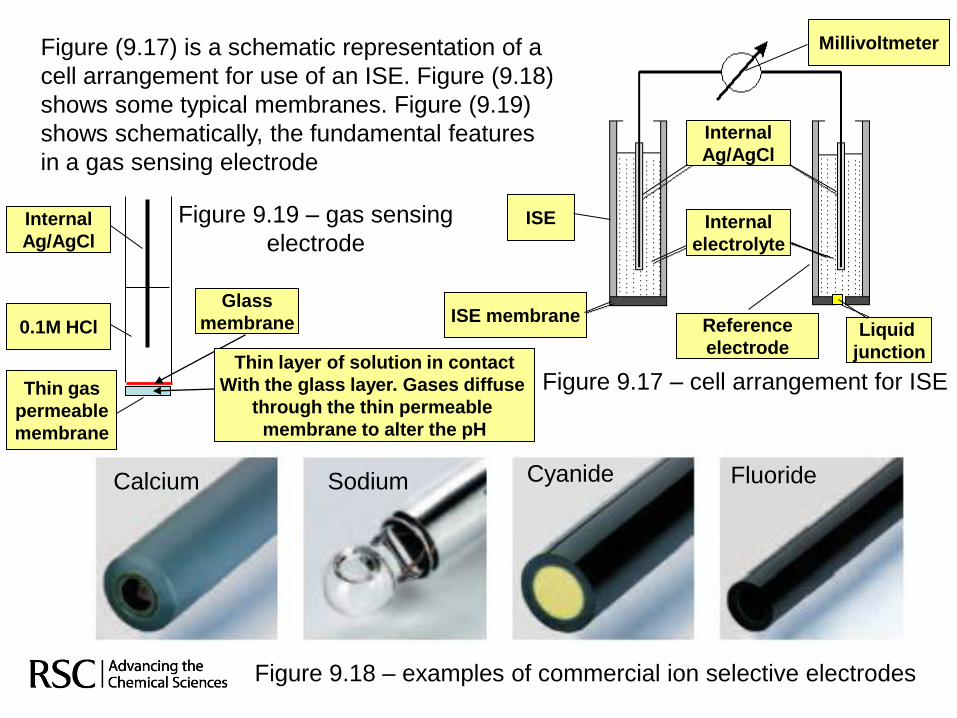
Figure 9.18 – examples of commercial ion selective electrodes
Figure (9.17) is a schematic representation of a
cell arrangement for use of an ISE. Figure (9.18)
shows some typical membranes. Figure (9.19)
shows schematically, the fundamental features
in a gas sensing electrode
ISE membraneReference
electrodeLiquid
junction
Internal
Ag/AgCl
Internal
electrolyte
Millivoltmeter
ISE
Calcium Sodium Cyanide Fluoride
Figure 9.17 – cell arrangement for ISE
Internal
Ag/AgCl
0.1M HCl
Glass
membrane
Thin layer of solution in contact
With the glass layer. Gases diffuse
through the thin permeable
membrane to alter the pH
Thin gas
permeable
membrane
Figure 9.19 – gas sensing
electrode
44
Eise = k + log acation
2.303RT
zF
Eise = k - log aanion
2.303RT
zF
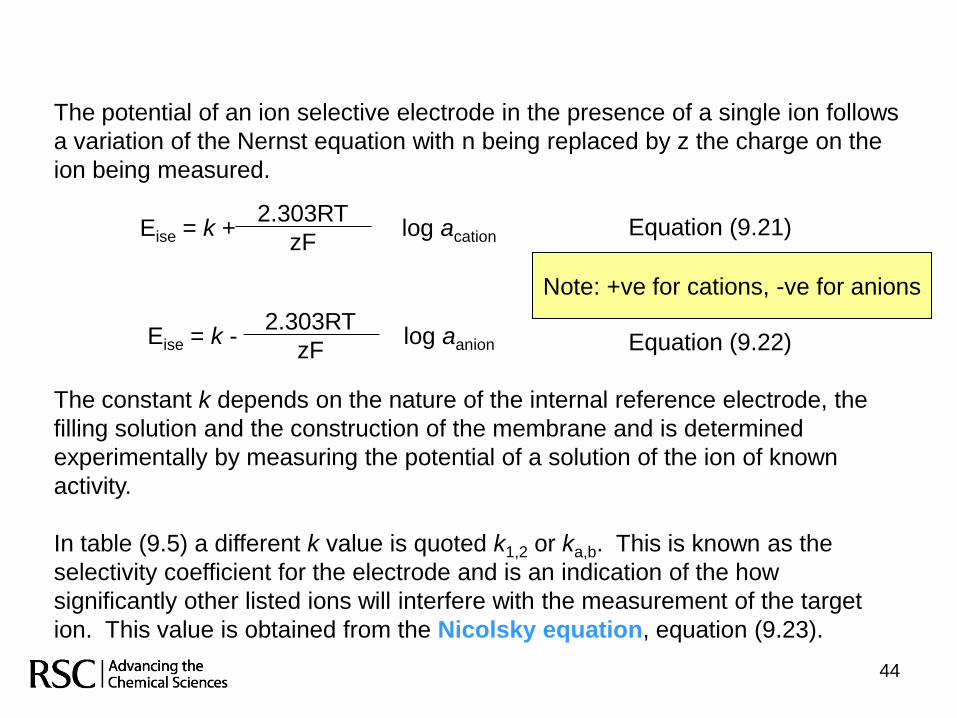
The potential of an ion selective electrode in the presence of a single ion follows
a variation of the Nernst equation with n being replaced by z the charge on the
ion being measured.
Equation (9.21)
Equation (9.22)
The constant k depends on the nature of the internal reference electrode, the
filling solution and the construction of the membrane and is determined
experimentally by measuring the potential of a solution of the ion of known
activity.
In table (9.5) a different k value is quoted k1,2 or ka,b. This is known as the
selectivity coefficient for the electrode and is an indication of the how
significantly other listed ions will interfere with the measurement of the target
ion. This value is obtained from the Nicolsky equation, equation (9.23).
Note: +ve for cations, -ve for anions
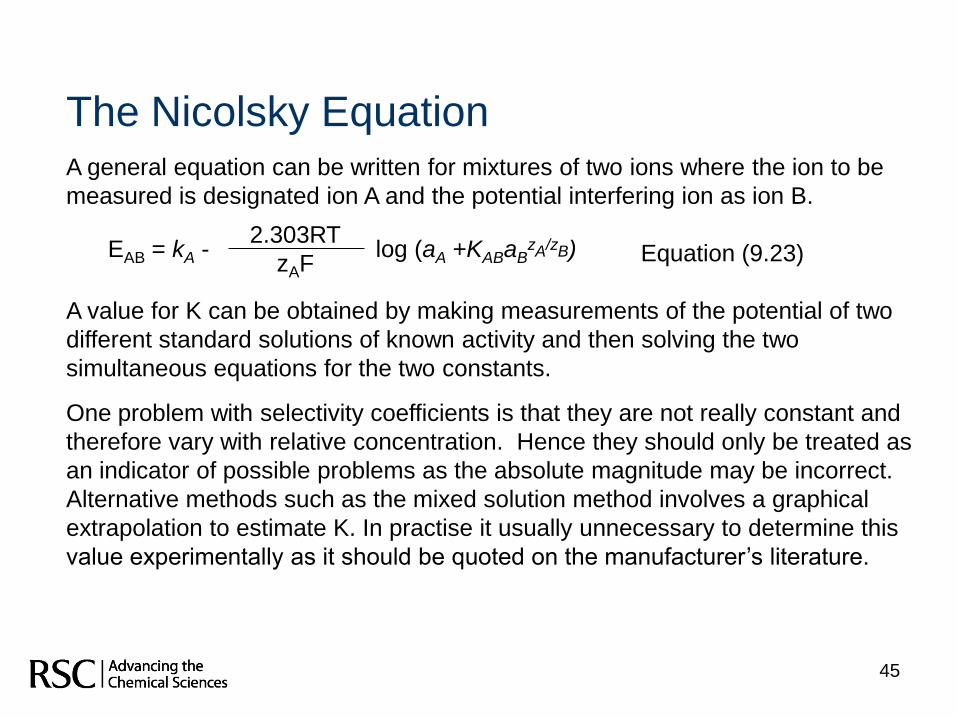
The Nicolsky EquationA general equation can be written for mixtures of two ions where the ion to be
measured is designated ion A and the potential interfering ion as ion B.
Equation (9.23)
A value for K can be obtained by making measurements of the potential of two
different standard solutions of known activity and then solving the two
simultaneous equations for the two constants.
One problem with selectivity coefficients is that they are not really constant and
therefore vary with relative concentration. Hence they should only be treated as
an indicator of possible problems as the absolute magnitude may be incorrect.
Alternative methods such as the mixed solution method involves a graphical
extrapolation to estimate K. In practise it usually unnecessary to determine this
value experimentally as it should be quoted on the manufacturer‟s literature.
45
EAB = kA - log (aA +KABaBzA/zB)
2.303RT
zAF

46
Quantitative applications of potentiometryThere are two ways in which the output from potentiometric measurements
can be used analytically:
Directly – termed Direct Potentiometry
Relatively – Potentiometric titrimetry
Potentiometric titrimetry was covered in Chapter 4 of this teaching and learning
programme and is reproduced here in slides 47 - 54
Direct potentiometry provides a rapid and convenient method of determining the
activity of a variety of cations and anions. The technique requires only a
comparison of the cell potential developed between the indicator and reference
electrodes, when immersed in the analyte solution compared to that developed
when immersed in one or more standard solutions of known analyte concentration.
The best example of this, is of course, the measurement of pH using a typical pH
meter calibrated against two buffer solutions. A useful on-line application is the
monitoring of nitrate levels in river waters using a nitrate ISE. A continuous read
out of nitrate levels is provided over long period of time. [This is an example of an
on-line procedure, which is covered later in Chapter 14 of this teaching & learning
programme.]
47474747
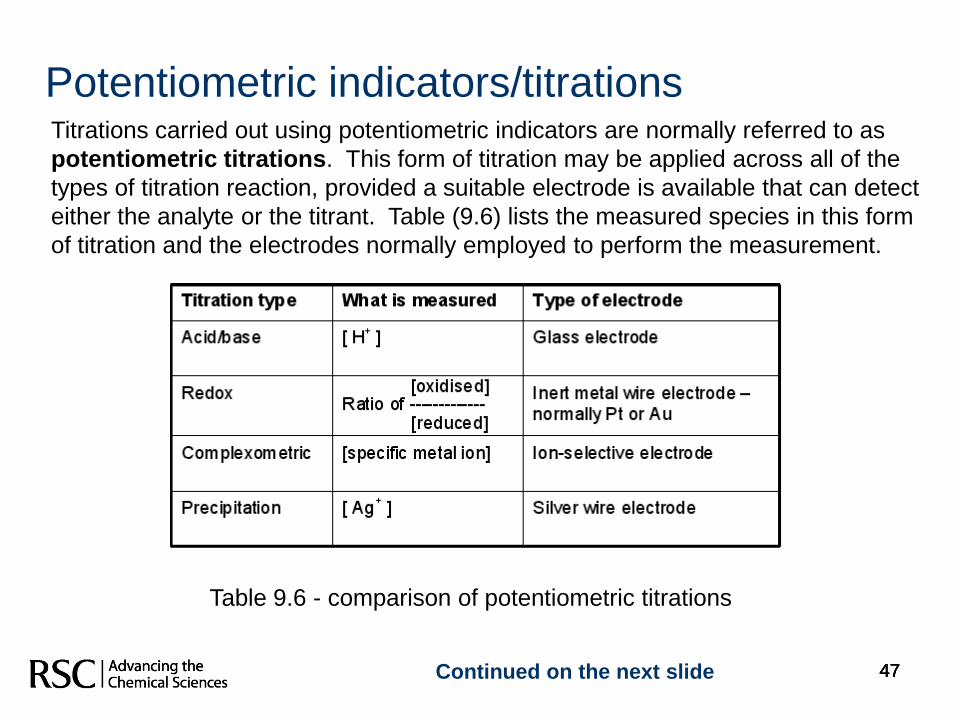
Potentiometric indicators/titrationsTitrations carried out using potentiometric indicators are normally referred to as
potentiometric titrations. This form of titration may be applied across all of the
types of titration reaction, provided a suitable electrode is available that can detect
either the analyte or the titrant. Table (9.6) lists the measured species in this form
of titration and the electrodes normally employed to perform the measurement.
Table 9.6 - comparison of potentiometric titrations
Continued on the next slide
48484848
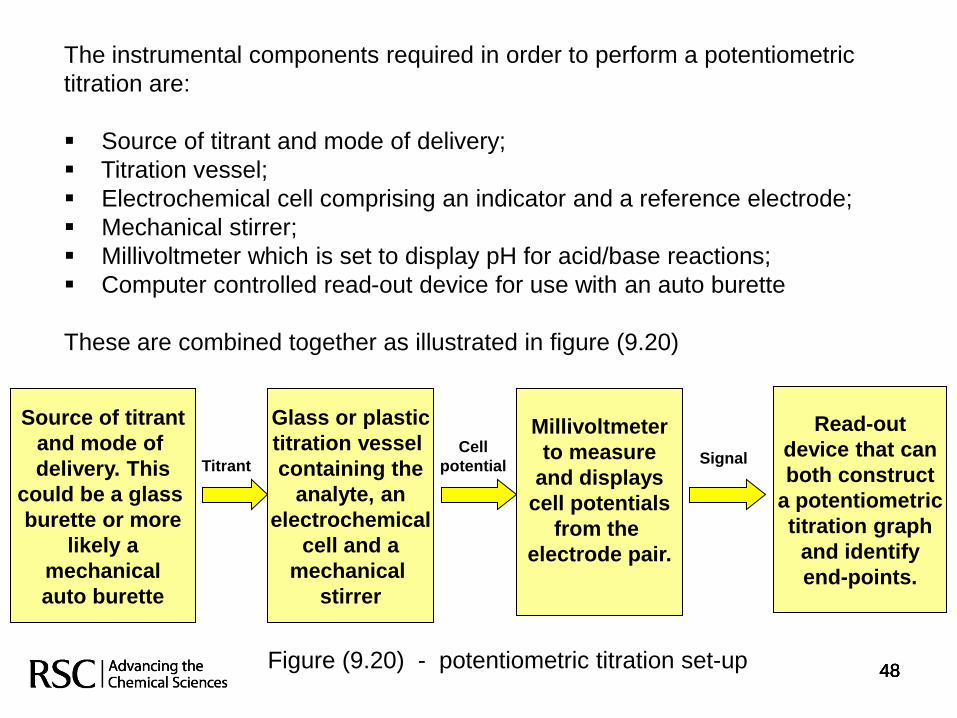
The instrumental components required in order to perform a potentiometric
titration are:
Source of titrant and mode of delivery;
Titration vessel;
Electrochemical cell comprising an indicator and a reference electrode;
Mechanical stirrer;
Millivoltmeter which is set to display pH for acid/base reactions;
Computer controlled read-out device for use with an auto burette
These are combined together as illustrated in figure (9.20)
Glass or plastic
titration vessel
containing the
analyte, an
electrochemical
cell and a
mechanical
stirrer
Millivoltmeter
to measure
and displays
cell potentials
from the
electrode pair.
Read-out
device that can
both construct
a potentiometric
titration graph
and identify
end-points.
Source of titrant
and mode of
delivery. This
could be a glass
burette or more
likely a
mechanical
auto burette
Titrant
Cell
potentialSignal
Figure (9.20) - potentiometric titration set-up
49494949
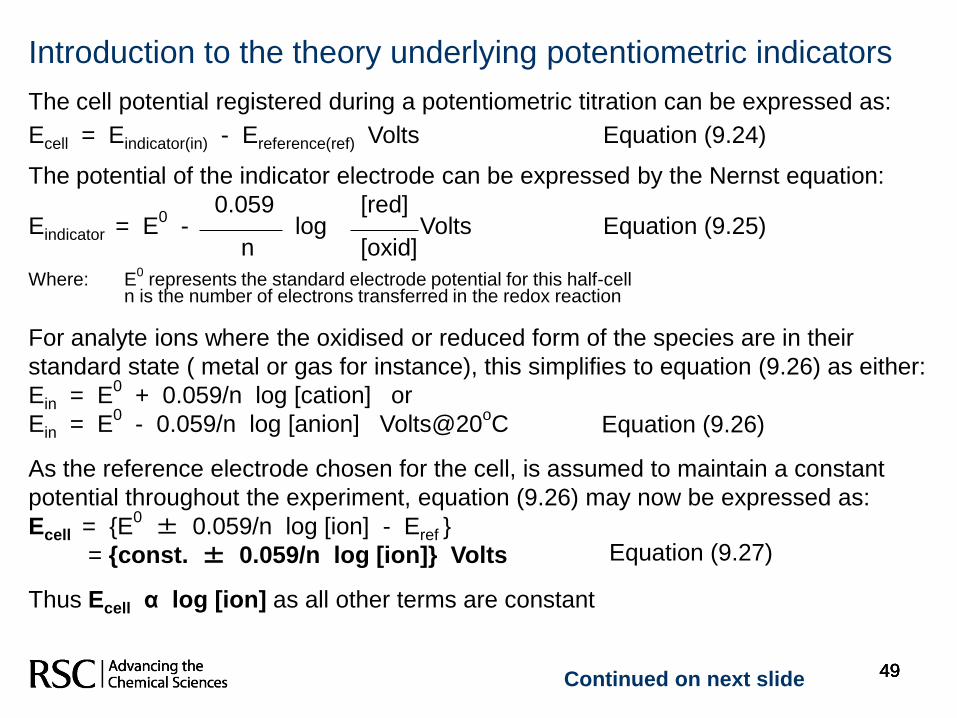
Introduction to the theory underlying potentiometric indicators
The cell potential registered during a potentiometric titration can be expressed as:
Ecell = Eindicator(in) - Ereference(ref) Volts Equation (9.24)
The potential of the indicator electrode can be expressed by the Nernst equation:
0.059 [red]Eindicator = E
0- log Volts Equation (9.25)
n [oxid]
Where: E0
represents the standard electrode potential for this half-celln is the number of electrons transferred in the redox reaction
For analyte ions where the oxidised or reduced form of the species are in their
standard state ( metal or gas for instance), this simplifies to equation (9.26) as either:
Ein = E0
+ 0.059/n log [cation] or
Ein = E0
- 0.059/n log [anion] Volts@20oC
As the reference electrode chosen for the cell, is assumed to maintain a constant
potential throughout the experiment, equation (9.26) may now be expressed as:
Ecell = {E0 ± 0.059/n log [ion] - Eref }
= {const. ± 0.059/n log [ion]} Volts
Thus Ecell α log [ion] as all other terms are constant
Continued on next slide
Equation (9.26)
Equation (9.27)
50
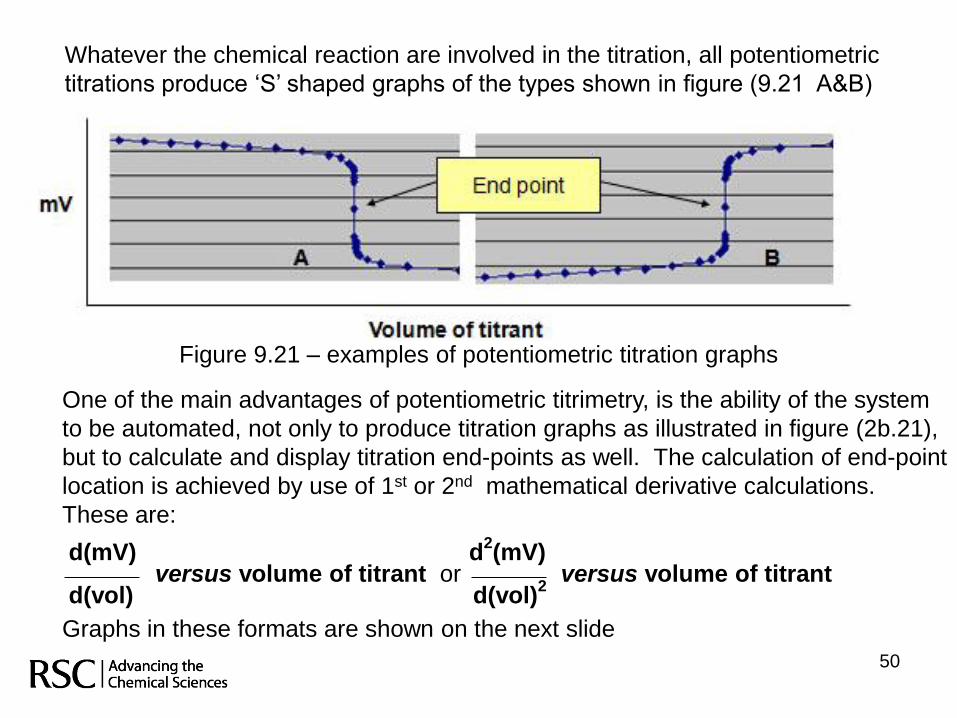
Whatever the chemical reaction are involved in the titration, all potentiometric
titrations produce „S‟ shaped graphs of the types shown in figure (9.21 A&B)
One of the main advantages of potentiometric titrimetry, is the ability of the system
to be automated, not only to produce titration graphs as illustrated in figure (2b.21),
but to calculate and display titration end-points as well. The calculation of end-point
location is achieved by use of 1st or 2nd mathematical derivative calculations.
These are:
d(mV) d2(mV)
versus volume of titrant or versus volume of titrantd(vol) d(vol)
2
Graphs in these formats are shown on the next slide
Figure 9.21 – examples of potentiometric titration graphs
51515151
1st derivative potentiometric titration plot
0
10
20
30
40
50
60
98.5 99 99.5 100 100.5 101 101.5
Volume of titrant in ml
dm
V/d
Vo
l
2nd derivative potentiometric titration
plot
-1000
-500
0
500
1000
98.5 99 99.5 100 100.5 101 101.5
Volume of titrant in ml
d2
(mV
)/d
(vo
l)2
Potentiometric titration plot
0
2
4
6
8
10
12
98.5 99 99.5 100 100.5 101 101.5
Volume of titrant in ml
mV
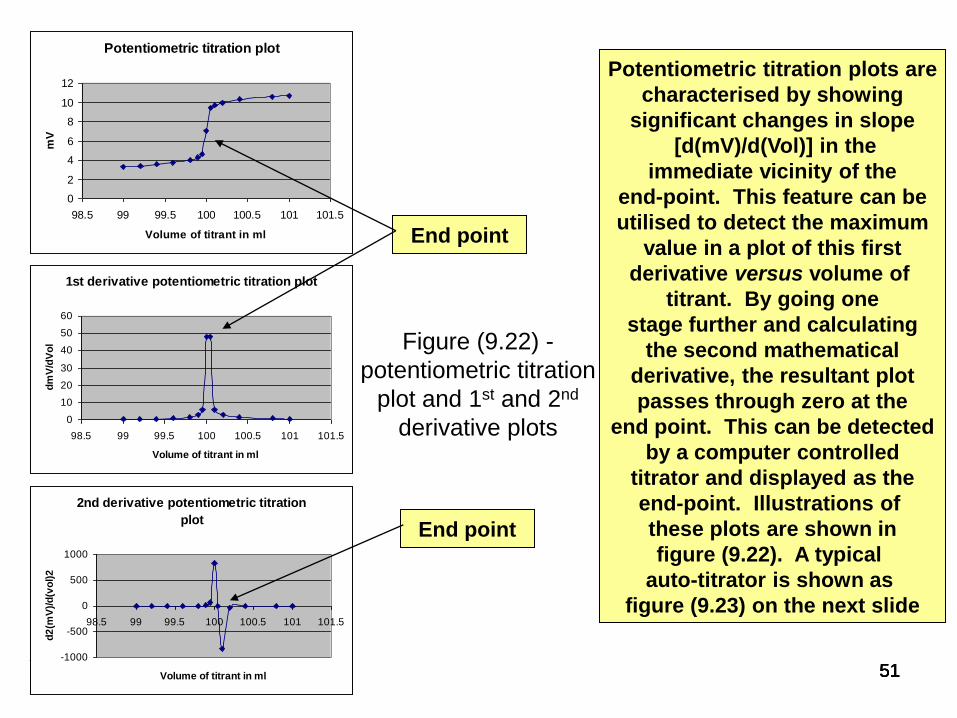
Figure (9.22) -
potentiometric titration
plot and 1st and 2nd
derivative plots
End point
End point
Potentiometric titration plots are
characterised by showing
significant changes in slope
[d(mV)/d(Vol)] in the
immediate vicinity of the
end-point. This feature can be
utilised to detect the maximum
value in a plot of this first
derivative versus volume of
titrant. By going one
stage further and calculating
the second mathematical
derivative, the resultant plot
passes through zero at the
end point. This can be detected
by a computer controlled
titrator and displayed as the
end-point. Illustrations of
these plots are shown in
figure (9.22). A typical
auto-titrator is shown as
figure (9.23) on the next slide
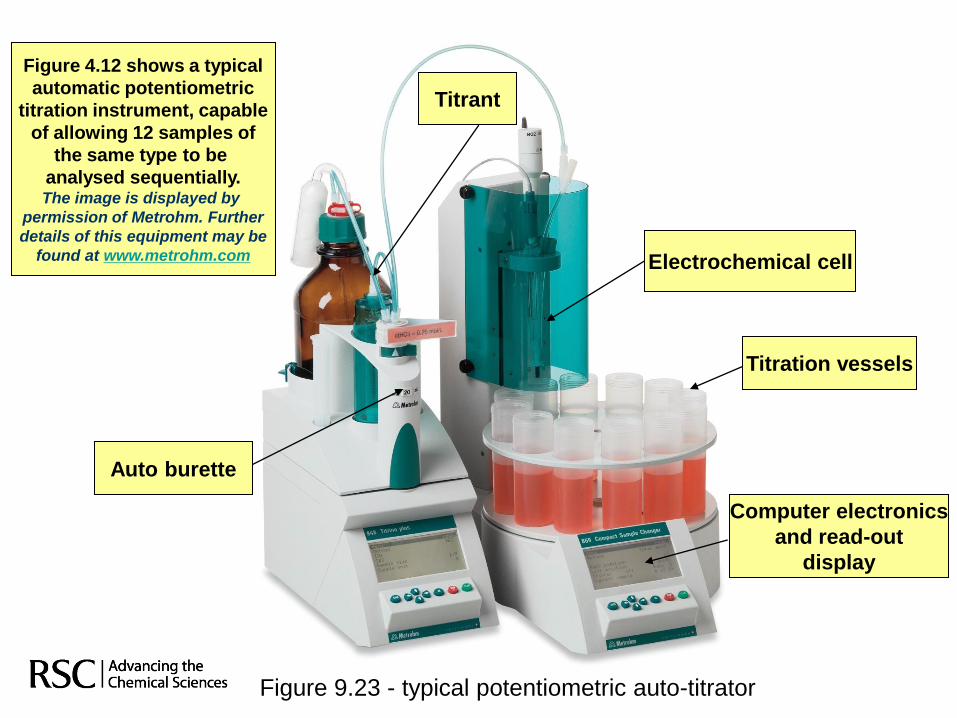
Titration vessels
Auto burette
Titrant
Figure 9.23 - typical potentiometric auto-titrator
Figure 4.12 shows a typical
automatic potentiometric
titration instrument, capable
of allowing 12 samples of
the same type to be
analysed sequentially.The image is displayed by
permission of Metrohm. Further
details of this equipment may be
found at www.metrohm.com
Computer electronics
and read-out
display
Electrochemical cell

53535353
There are number of advantages offered by potentiometric indicators over
visual indicators to follow the progress of titrimetric reactions and detect end-
points. These are:
Ability to function is highly coloured solutions;
Ability to find multiple end-points when samples contain more than one
titratable species. For instance, a sample containing both weak and strong
acids or polyprotic acids (eg: orthophosphoric acid H3PO4) where there is
a significant difference between the Ka values of the titratable protons. See
example (9.i) on the next slide
Offers opportunities for automation for both detection of end-points and for
the analysis of multiple samples dispensed from auto-samplers.
Advantages of potentiometric over visual indicators
pH
12
10
8
6
4
2
Volume of NaOH5 10 15 20
1st end point
2nd end point
- 1st end point
- 2nd end point
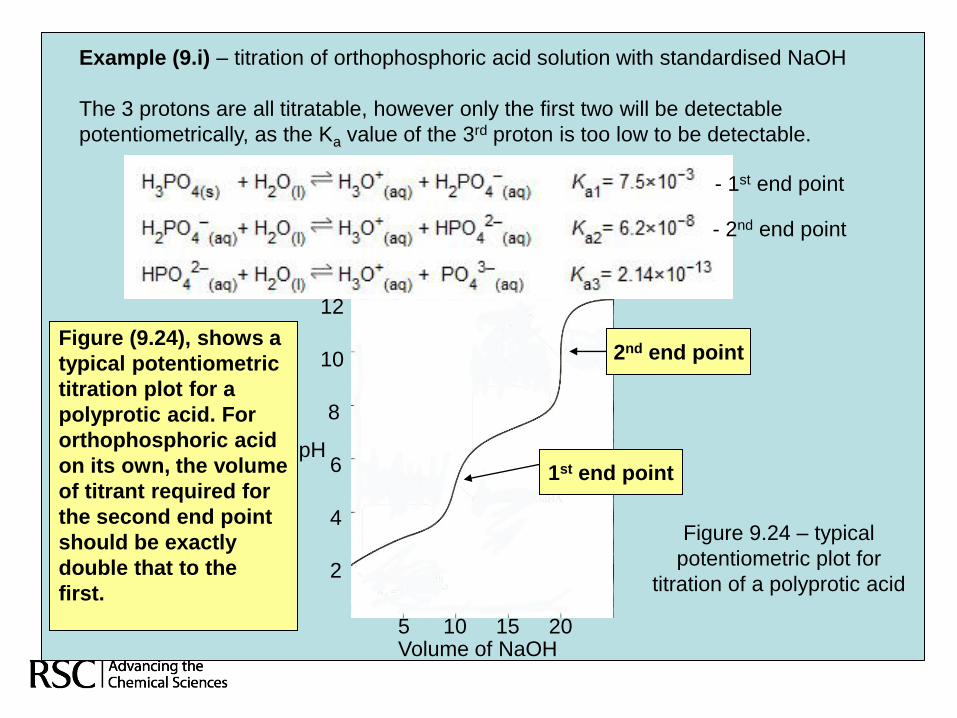
Example (9.i) – titration of orthophosphoric acid solution with standardised NaOH
The 3 protons are all titratable, however only the first two will be detectable
potentiometrically, as the Ka value of the 3rd proton is too low to be detectable.
Figure (9.24), shows a
typical potentiometric
titration plot for a
polyprotic acid. For
orthophosphoric acid
on its own, the volume
of titrant required for
the second end point
should be exactly
double that to the
first.
Figure 9.24 – typical
potentiometric plot for
titration of a polyprotic acid
55
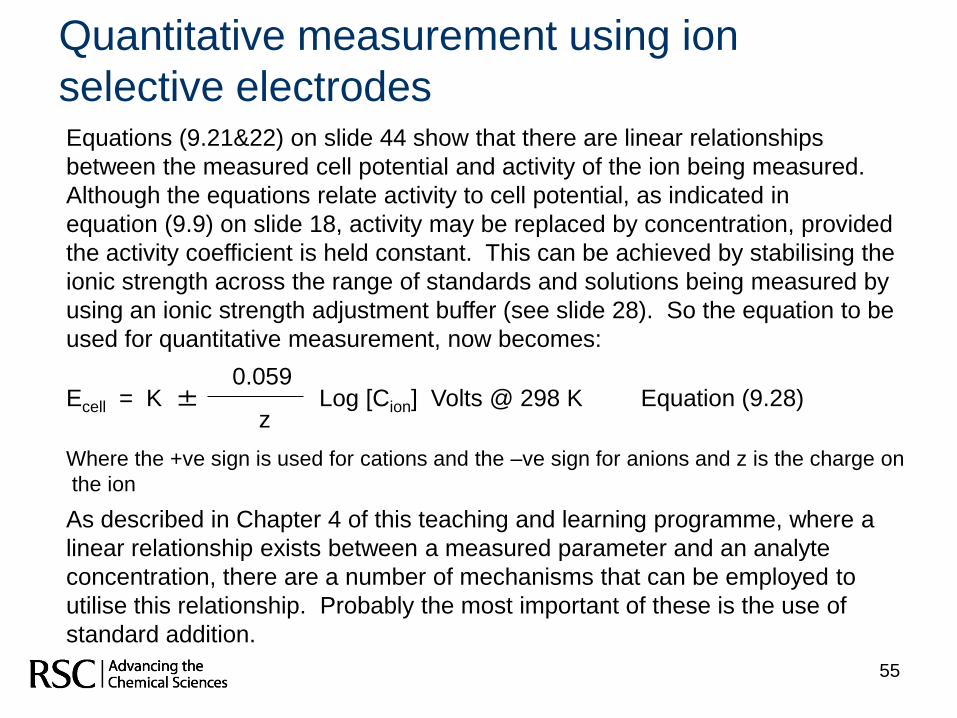
Quantitative measurement using ion
selective electrodesEquations (9.21&22) on slide 44 show that there are linear relationships
between the measured cell potential and activity of the ion being measured.
Although the equations relate activity to cell potential, as indicated in
equation (9.9) on slide 18, activity may be replaced by concentration, provided
the activity coefficient is held constant. This can be achieved by stabilising the
ionic strength across the range of standards and solutions being measured by
using an ionic strength adjustment buffer (see slide 28). So the equation to be
used for quantitative measurement, now becomes:
0.059Ecell = K ± Log [Cion] Volts @ 298 K Equation (9.28)
z
Where the +ve sign is used for cations and the –ve sign for anions and z is the charge on
the ion
As described in Chapter 4 of this teaching and learning programme, where a
linear relationship exists between a measured parameter and an analyte
concentration, there are a number of mechanisms that can be employed to
utilise this relationship. Probably the most important of these is the use of
standard addition.
56
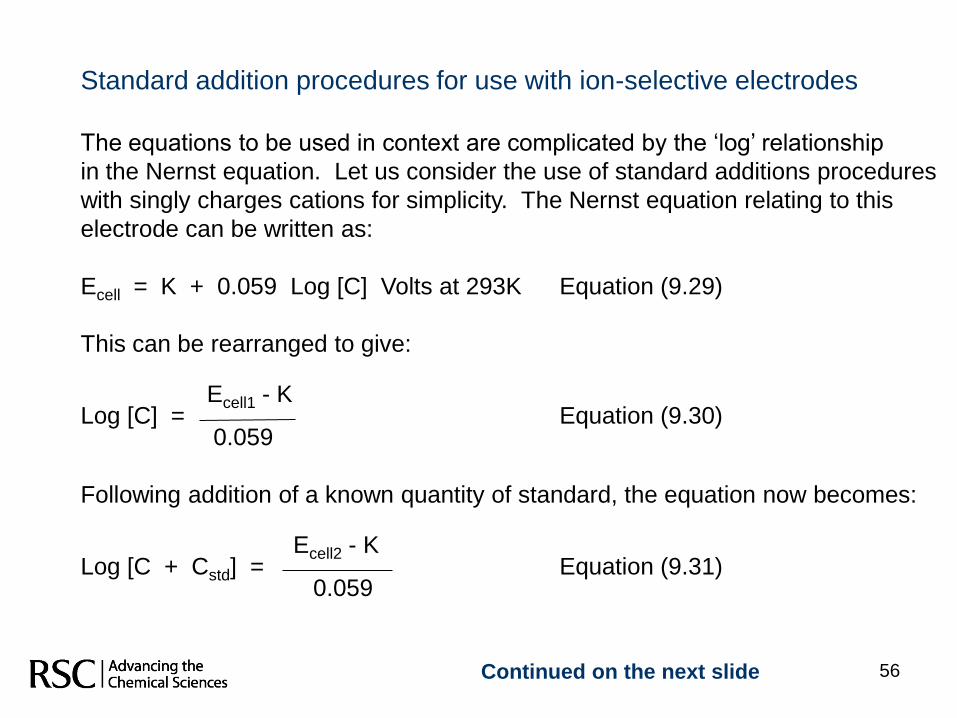
Standard addition procedures for use with ion-selective electrodes
The equations to be used in context are complicated by the „log‟ relationship
in the Nernst equation. Let us consider the use of standard additions procedures
with singly charges cations for simplicity. The Nernst equation relating to this
electrode can be written as:
Ecell = K + 0.059 Log [C] Volts at 293K Equation (9.29)
This can be rearranged to give:
Ecell1 - KLog [C] = Equation (9.30)
0.059
Following addition of a known quantity of standard, the equation now becomes:
Ecell2 - KLog [C + Cstd] = Equation (9.31)
0.059
Continued on the next slide
57
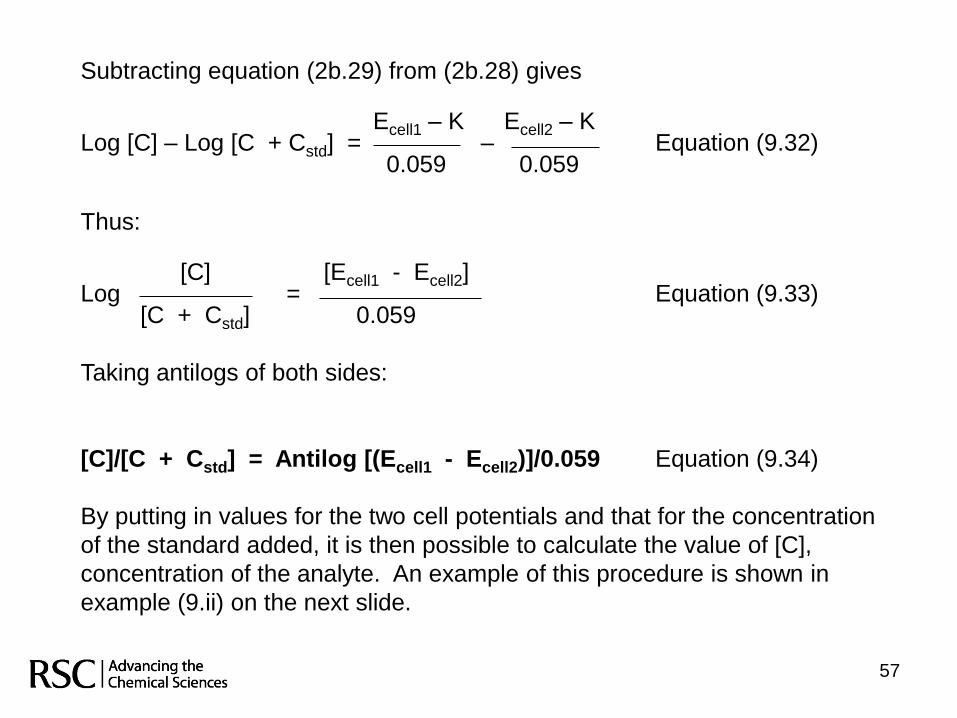
Subtracting equation (2b.29) from (2b.28) gives
Ecell1 – K Ecell2 – KLog [C] – Log [C + Cstd] = – Equation (9.32)
0.059 0.059
Thus:
[C] [Ecell1 - Ecell2]Log = Equation (9.33)
[C + Cstd] 0.059
Taking antilogs of both sides:
[C]/[C + Cstd] = Antilog [(Ecell1 - Ecell2)]/0.059 Equation (9.34)
By putting in values for the two cell potentials and that for the concentration
of the standard added, it is then possible to calculate the value of [C],
concentration of the analyte. An example of this procedure is shown in
example (9.ii) on the next slide.
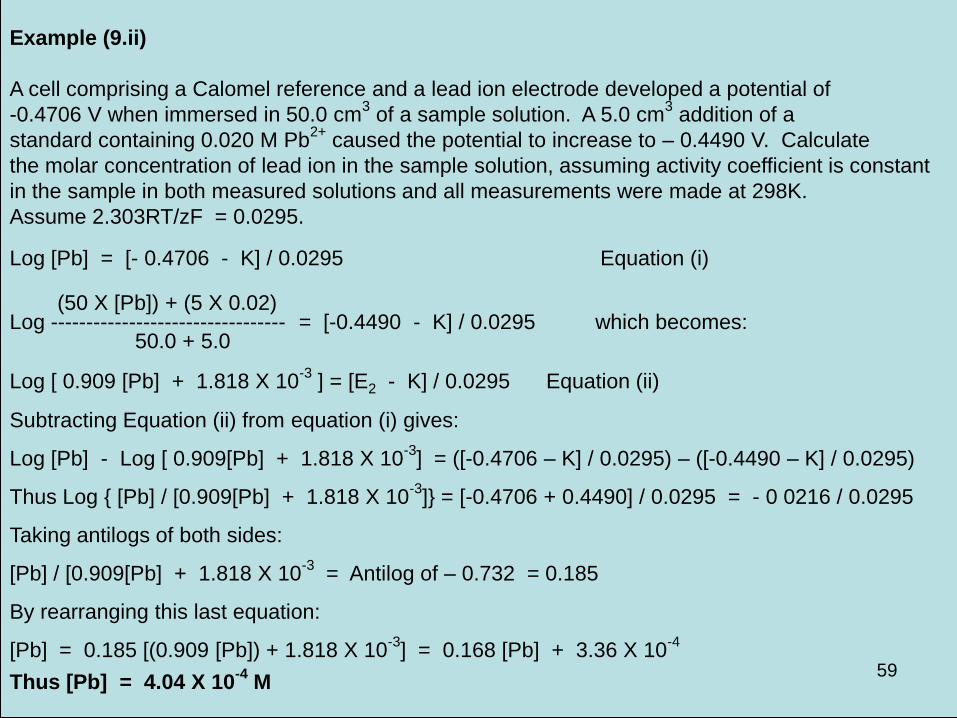
Example (9.ii)
A cell comprising a Calomel reference and a lead ion electrode developed a potential of
-0.4706 V when immersed in 50.0 cm3
of a sample solution. A 5.0 cm3
addition of a
standard containing 0.020 M Pb2+
caused the potential to increase to – 0.4490 V. Calculate
the molar concentration of lead ion in the sample solution, assuming activity coefficient is constant
in the sample in both measured solutions and all measurements were made at 298K.
Assume 2.303RT/zF = 0.0295.
Log [Pb] = [- 0.4706 - K] / 0.0295 Equation (i)
(50 X [Pb]) + (5 X 0.02) Log --------------------------------- = [-0.4490 - K] / 0.0295 which becomes:
50.0 + 5.0
Log [ 0.909 [Pb] + 1.818 X 10⁻³
] = [E2 - K] / 0.0295 Equation (ii)
Subtracting Equation (ii) from equation (i) gives:
Log [Pb] - Log [ 0.909[Pb] + 1.818 X 10⁻³
] = ([-0.4706 – K] / 0.0295) – ([-0.4490 – K] / 0.0295)
Thus Log { [Pb] / [0.909[Pb] + 1.818 X 10⁻³
]} = [-0.4706 + 0.4490] / 0.0295 = - 0 0216 / 0.0295
Taking antilogs of both sides:
[Pb] / [0.909[Pb] + 1.818 X 10-3
= Antilog of – 0.732 = 0.185
By rearranging this last equation:
[Pb] = 0.185 [(0.909 [Pb]) + 1.818 X 10⁻³
] = 0.168 [Pb] + 3.36 X 10⁻⁴
Thus [Pb] = 4.04 X 10⁻⁴
M59
59
Measuring Current
Many electroanalytical measurements are based on the measurement of a
current generated at an electrode due to the application of a voltage. Hence
they can be considered to be mini electrolysis reactions and are sometimes
referred to as dynamic electroanalysis as a reflection of the fact that the
absolute concentration of the analyte changes over time as a result of
undergoing electrolysis due to the applied potential.
There are generally two types of measurement possible:
Measurement of the current generated at a fixed potential (Amperometry);
Measurement of the varying current generated as the potential is scanned
between two fixed values (Voltammetry).
The techniques can offer very high levels of sensitivity (10-10
– 10-12
mol dm-3
have been reported), however require great care with the experimentation and
are not readily adaptable to automation. However the cost of the equipment is
relatively low and are increasingly available in portable versions allowing on site
measurements for example in environmental analysis.
Continued on the next slide
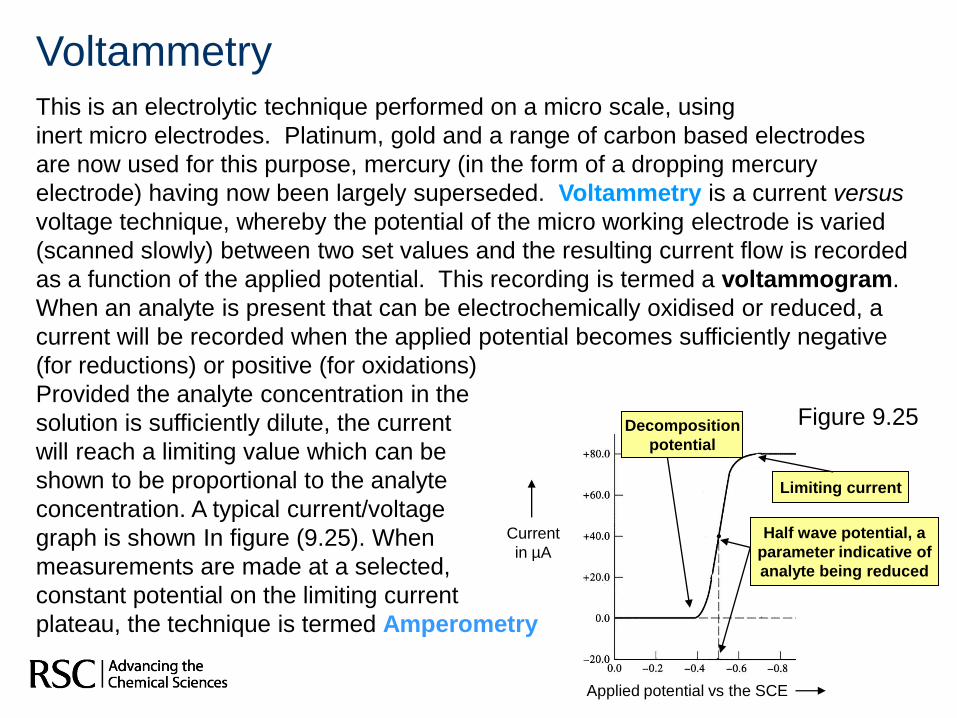
VoltammetryThis is an electrolytic technique performed on a micro scale, using
inert micro electrodes. Platinum, gold and a range of carbon based electrodes
are now used for this purpose, mercury (in the form of a dropping mercury
electrode) having now been largely superseded. Voltammetry is a current versus
voltage technique, whereby the potential of the micro working electrode is varied
(scanned slowly) between two set values and the resulting current flow is recorded
as a function of the applied potential. This recording is termed a voltammogram.
When an analyte is present that can be electrochemically oxidised or reduced, a
current will be recorded when the applied potential becomes sufficiently negative
(for reductions) or positive (for oxidations)
Provided the analyte concentration in the
solution is sufficiently dilute, the current
will reach a limiting value which can be
shown to be proportional to the analyte
concentration. A typical current/voltage
graph is shown In figure (9.25). When
measurements are made at a selected,
constant potential on the limiting current
plateau, the technique is termed Amperometry
Current
in µA
Applied potential vs the SCE
Limiting current
Half wave potential, a
parameter indicative of
analyte being reduced
Decomposition
potential
Figure 9.25
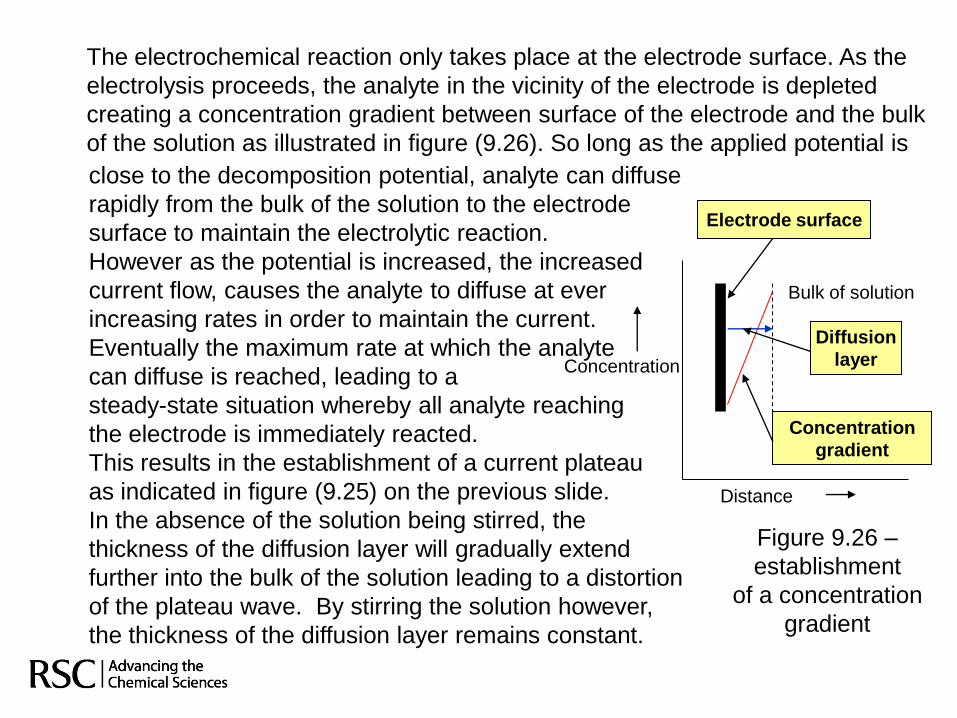
The electrochemical reaction only takes place at the electrode surface. As the
electrolysis proceeds, the analyte in the vicinity of the electrode is depleted
creating a concentration gradient between surface of the electrode and the bulk
of the solution as illustrated in figure (9.26). So long as the applied potential is
Concentration
Distance
Bulk of solution
Electrode surface
Concentration
gradient
close to the decomposition potential, analyte can diffuse
rapidly from the bulk of the solution to the electrode
surface to maintain the electrolytic reaction.
However as the potential is increased, the increased
current flow, causes the analyte to diffuse at ever
increasing rates in order to maintain the current.
Eventually the maximum rate at which the analyte
can diffuse is reached, leading to a
steady-state situation whereby all analyte reaching
the electrode is immediately reacted.
This results in the establishment of a current plateau
as indicated in figure (9.25) on the previous slide.
In the absence of the solution being stirred, the
thickness of the diffusion layer will gradually extend
further into the bulk of the solution leading to a distortion
of the plateau wave. By stirring the solution however,
the thickness of the diffusion layer remains constant.
Diffusion
layer
Figure 9.26 –
establishment
of a concentration
gradient
62
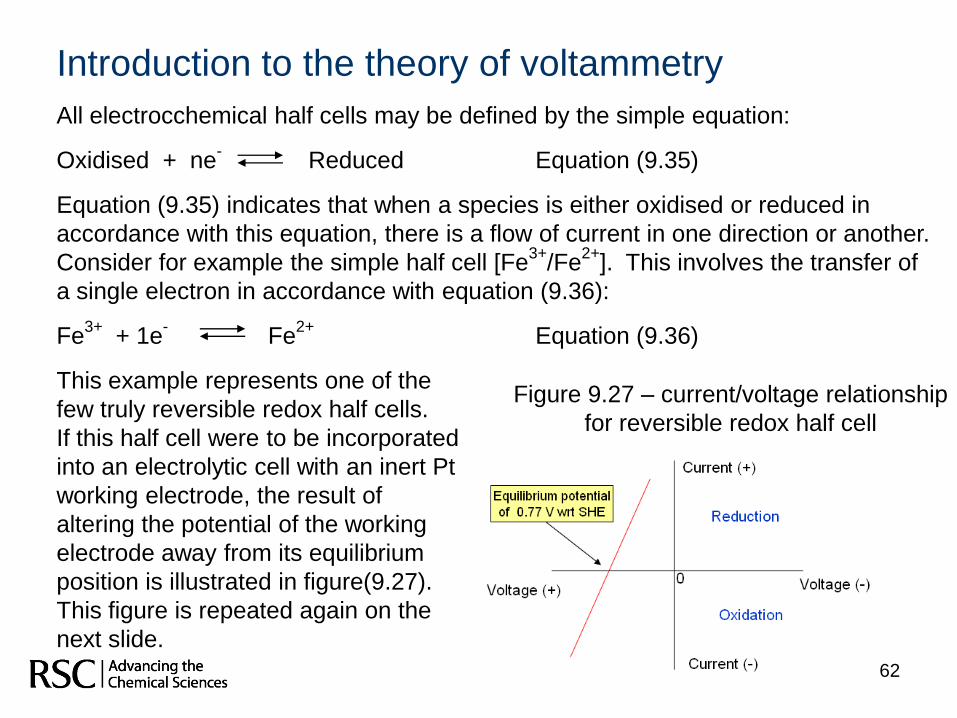
Introduction to the theory of voltammetry
All electrocchemical half cells may be defined by the simple equation:
Oxidised + ne-
Reduced Equation (9.35)
Equation (9.35) indicates that when a species is either oxidised or reduced in
accordance with this equation, there is a flow of current in one direction or another.
Consider for example the simple half cell [Fe3+
/Fe2+
]. This involves the transfer of
a single electron in accordance with equation (9.36):
Fe3+
+ 1e-
Fe2+
Equation (9.36)
This example represents one of the
few truly reversible redox half cells.
If this half cell were to be incorporated
into an electrolytic cell with an inert Pt
working electrode, the result of
altering the potential of the working
electrode away from its equilibrium
position is illustrated in figure(9.27).
This figure is repeated again on the
next slide.
Figure 9.27 – current/voltage relationship
for reversible redox half cell
63
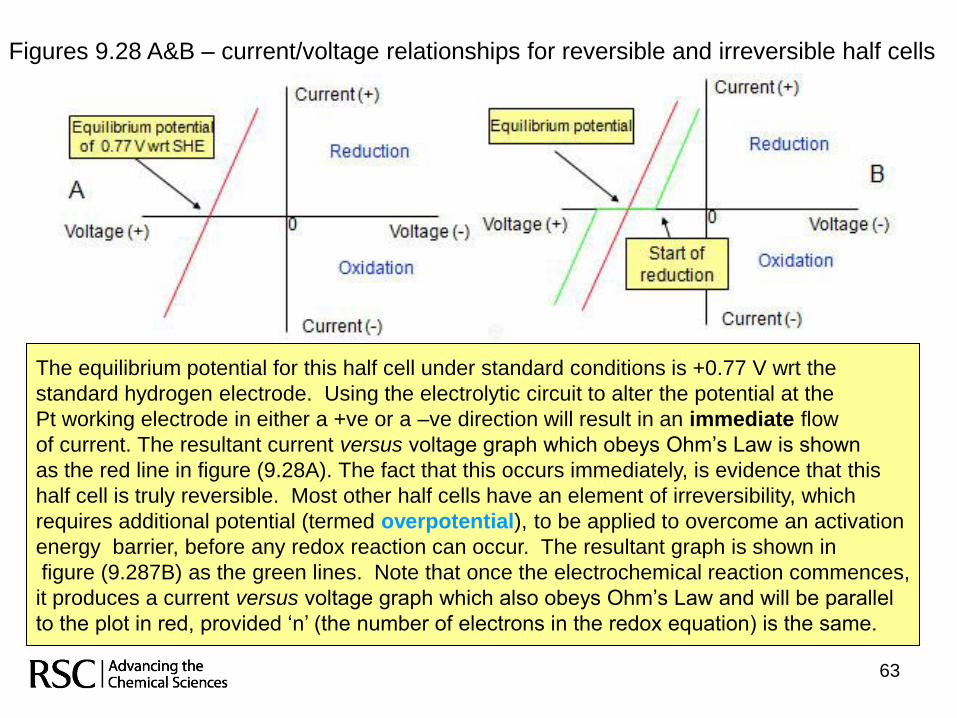
Figures 9.28 A&B – current/voltage relationships for reversible and irreversible half cells
The equilibrium potential for this half cell under standard conditions is +0.77 V wrt the
standard hydrogen electrode. Using the electrolytic circuit to alter the potential at the
Pt working electrode in either a +ve or a –ve direction will result in an immediate flow
of current. The resultant current versus voltage graph which obeys Ohm‟s Law is shown
as the red line in figure (9.28A). The fact that this occurs immediately, is evidence that this
half cell is truly reversible. Most other half cells have an element of irreversibility, which
requires additional potential (termed overpotential), to be applied to overcome an activation
energy barrier, before any redox reaction can occur. The resultant graph is shown in
figure (9.287B) as the green lines. Note that once the electrochemical reaction commences,
it produces a current versus voltage graph which also obeys Ohm‟s Law and will be parallel
to the plot in red, provided „n‟ (the number of electrons in the redox equation) is the same.
A
B
C
IB
IC
Current
in µA
Voltage (-)
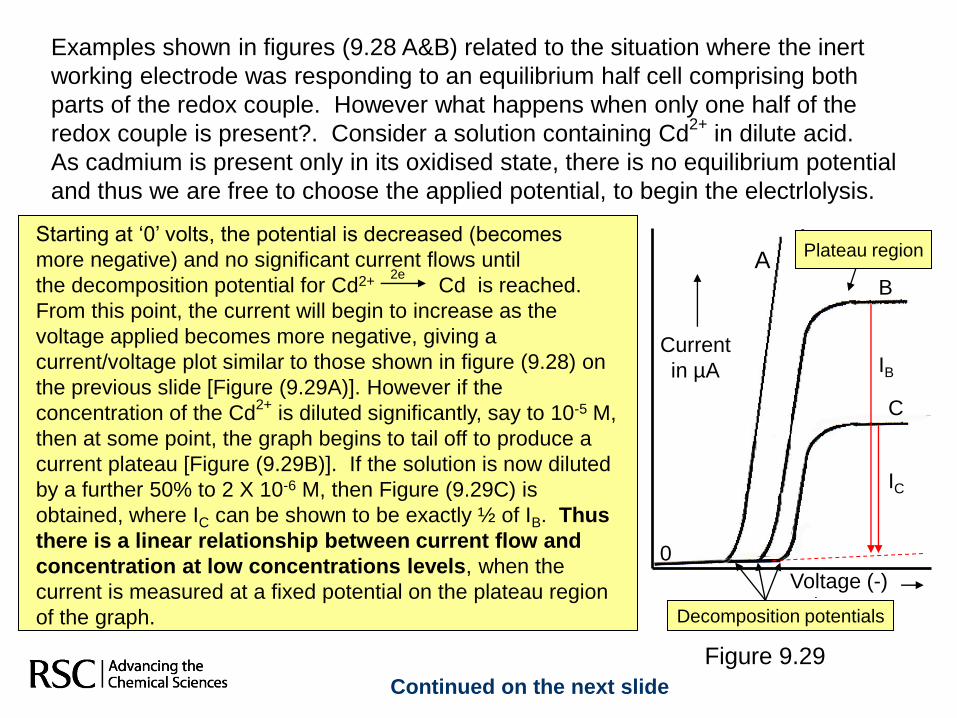
Starting at „0‟ volts, the potential is decreased (becomes
more negative) and no significant current flows until
the decomposition potential for Cd2+ Cd is reached.
From this point, the current will begin to increase as the
voltage applied becomes more negative, giving a
current/voltage plot similar to those shown in figure (9.28) on
the previous slide [Figure (9.29A)]. However if the
concentration of the Cd2+
is diluted significantly, say to 10-5 M,
then at some point, the graph begins to tail off to produce a
current plateau [Figure (9.29B)]. If the solution is now diluted
by a further 50% to 2 X 10⁻⁶ M, then Figure (9.29C) is
obtained, where IC can be shown to be exactly ½ of IB. Thus
there is a linear relationship between current flow and
concentration at low concentrations levels, when the
current is measured at a fixed potential on the plateau region
of the graph.
2e
Decomposition potentials
Plateau region
Examples shown in figures (9.28 A&B) related to the situation where the inert
working electrode was responding to an equilibrium half cell comprising both
parts of the redox couple. However what happens when only one half of the
redox couple is present?. Consider a solution containing Cd2+
in dilute acid.
As cadmium is present only in its oxidised state, there is no equilibrium potential
and thus we are free to choose the applied potential, to begin the electrlolysis.
0
Continued on the next slide
Figure 9.29
A
65
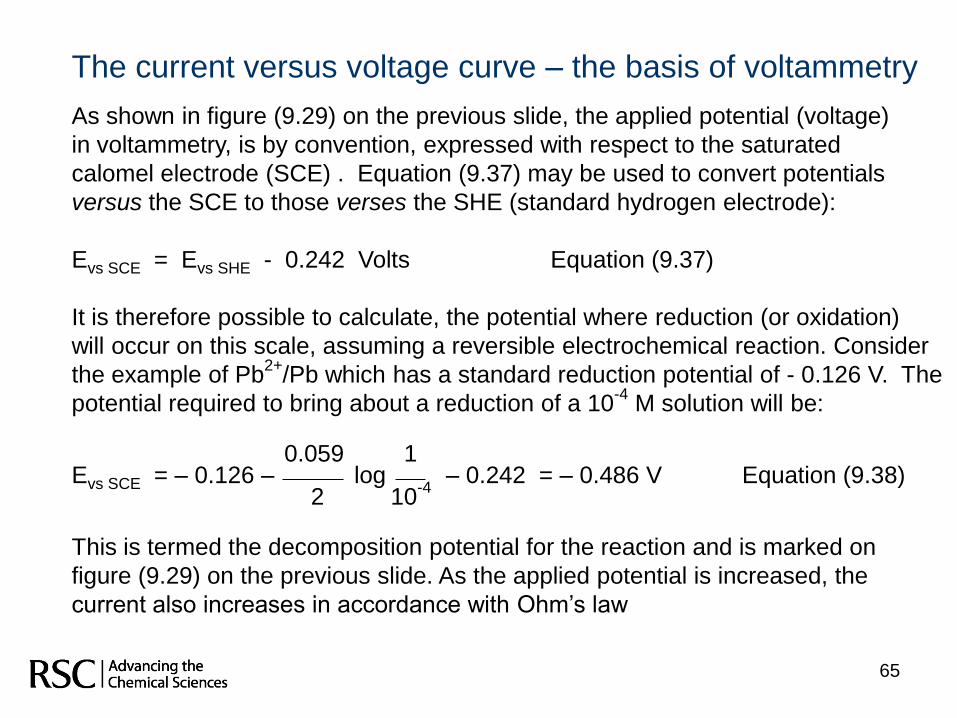
The current versus voltage curve – the basis of voltammetry
As shown in figure (9.29) on the previous slide, the applied potential (voltage)
in voltammetry, is by convention, expressed with respect to the saturated
calomel electrode (SCE) . Equation (9.37) may be used to convert potentials
versus the SCE to those verses the SHE (standard hydrogen electrode):
Evs SCE = Evs SHE - 0.242 Volts Equation (9.37)
It is therefore possible to calculate, the potential where reduction (or oxidation)
will occur on this scale, assuming a reversible electrochemical reaction. Consider
the example of Pb2+
/Pb which has a standard reduction potential of - 0.126 V. The
potential required to bring about a reduction of a 10-4
M solution will be:
0.059 1Evs SCE = – 0.126 – log – 0.242 = – 0.486 V Equation (9.38)
2 10-4
This is termed the decomposition potential for the reaction and is marked on
figure (9.29) on the previous slide. As the applied potential is increased, the
current also increases in accordance with Ohm‟s law

66
The volammograms illustrated as figure (9.29) on slide 64 are strictly
termed Polarograms, relating to the technique of Polarography which
is rarely used is modern analytical science.
The technique was discovered in the 1920‟s and was widely used for both
inorganic and organic analysis in the 1940‟s and 50‟s. It had a renaissance
in the 1970‟s with the availability of solid state electronics, which allowed more
sophisticated versions of the technique (Pulse, Square Wave and Differential
Pulse methods) to be employed. The most important working electrode for
use with Polarography was based upon mercury, generally in the form of
small drops, falling under gravity from a reservoir. Because of the toxic nature
of mercury, its use became discouraged and alternative electrode materials
never proved as effective for use as a routine technique.
Voltammetry continues to be researched and can offer some of the most
sensitive analytical methods available, however with the exception of
Amperometry, to be covered in the next group of slides, the technique has
largely been superceded as a routine analytical technique and thus no further
coverage is given in the teaching and learning programme. Anyone wishing
to find out more about voltammetry should consult textbooks on analytical
electrochemistry.
67
Amperometry
Amperometry refers to the measurement of the current flow resulting from an
electrochemical oxidation or reduction of an electroactive species. The
measurement technology normally uses a potentiostatic circuit (see next slide) and
is created, by maintaining a constant potential at the working electrode (normally
Pt, Au or C based), that is sufficient to bring about the redox transition of interest.
The potential chosen will be on the plateau region of the current/voltage
Voltammogram (refer to slide 64). Under normal conditions, the current flow is
directly proportional to the concentration of the species being measured.
The technique may be used:
To act as a means of detecting end points in a redox (or in some instances a
precipitation or a complexometric) titration;
As the basis of an electrochemical detector for HPLC;
As a basis for measurement in some types of biosensor.
All three of these application are described in the next few slides.
Introduction
68
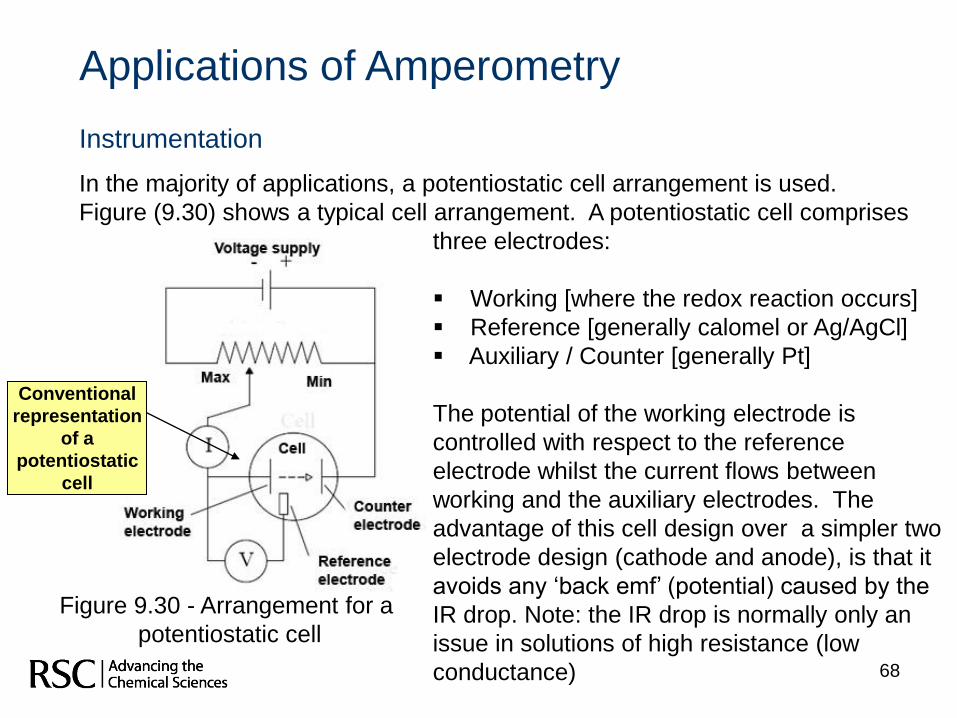
Applications of Amperometry
Instrumentation
In the majority of applications, a potentiostatic cell arrangement is used.
Figure (9.30) shows a typical cell arrangement. A potentiostatic cell comprises
three electrodes:
Working [where the redox reaction occurs]
Reference [generally calomel or Ag/AgCl]
Auxiliary / Counter [generally Pt]
The potential of the working electrode is
controlled with respect to the reference
electrode whilst the current flows between
working and the auxiliary electrodes. The
advantage of this cell design over a simpler two
electrode design (cathode and anode), is that it
avoids any „back emf‟ (potential) caused by the
IR drop. Note: the IR drop is normally only an
issue in solutions of high resistance (low
conductance)
Figure 9.30 - Arrangement for a
potentiostatic cell
Conventional
representation
of a
potentiostatic
cell
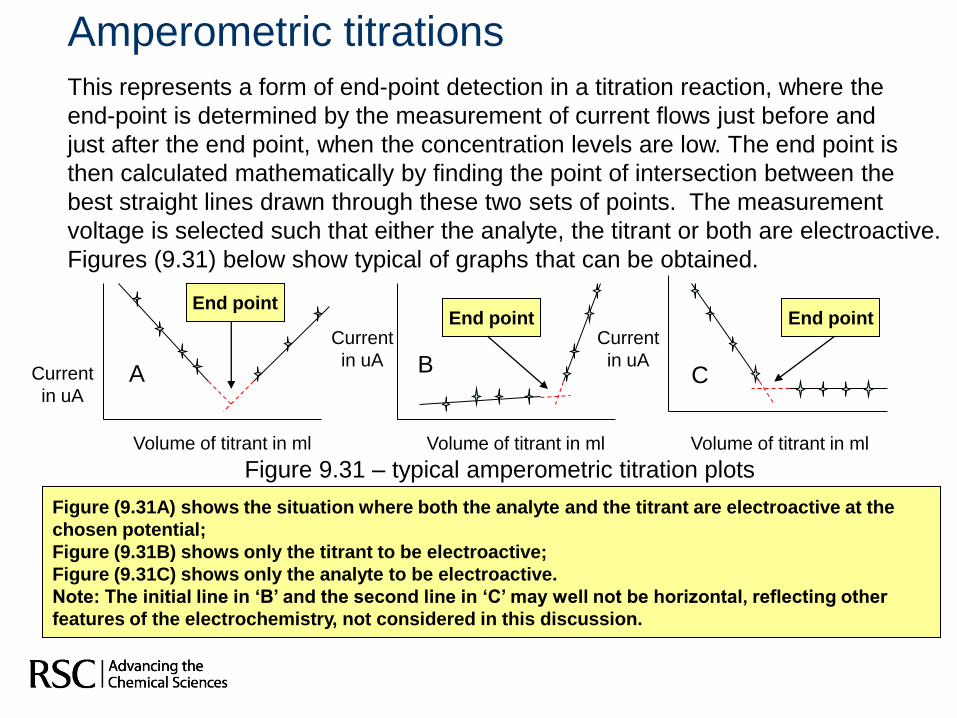
Amperometric titrationsThis represents a form of end-point detection in a titration reaction, where the
end-point is determined by the measurement of current flows just before and
just after the end point, when the concentration levels are low. The end point is
then calculated mathematically by finding the point of intersection between the
best straight lines drawn through these two sets of points. The measurement
voltage is selected such that either the analyte, the titrant or both are electroactive.
Figures (9.31) below show typical of graphs that can be obtained.
Current
in uA
Volume of titrant in ml Volume of titrant in ml Volume of titrant in ml
Current
in uA
Current
in uA
End pointEnd point End point
Figure (9.31A) shows the situation where both the analyte and the titrant are electroactive at the
chosen potential;
Figure (9.31B) shows only the titrant to be electroactive;
Figure (9.31C) shows only the analyte to be electroactive.
Note: The initial line in ‘B’ and the second line in ‘C’ may well not be horizontal, reflecting other
features of the electrochemistry, not considered in this discussion.
Figure 9.31 – typical amperometric titration plots
A B C
70
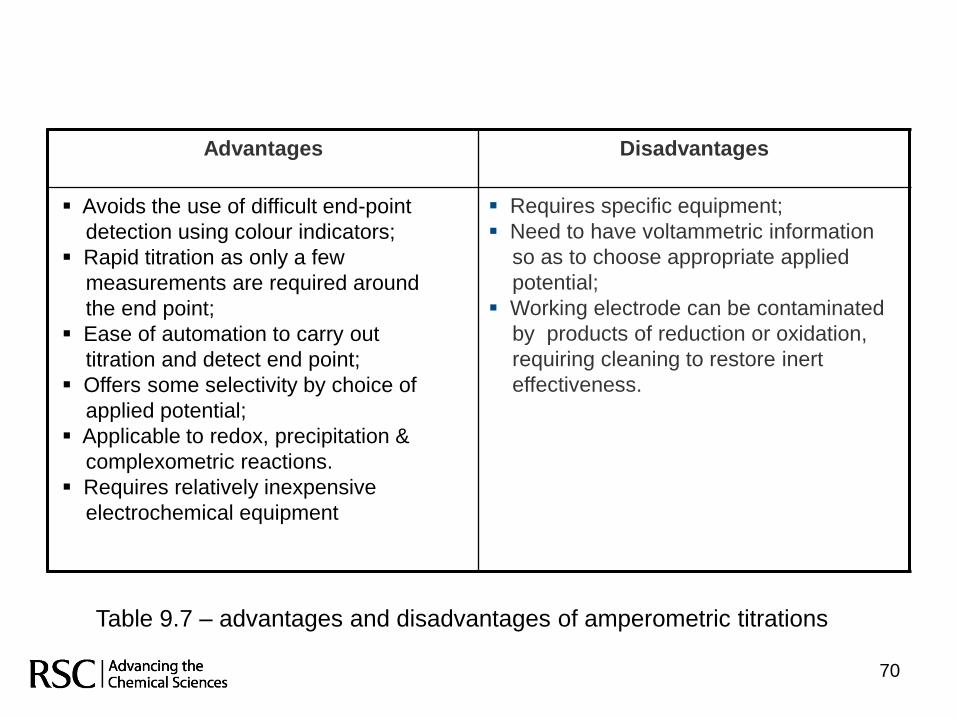
Advantages Disadvantages
Requires specific equipment;
Need to have voltammetric information
so as to choose appropriate applied
potential;
Working electrode can be contaminated
by products of reduction or oxidation,
requiring cleaning to restore inert
effectiveness.
Avoids the use of difficult end-point
detection using colour indicators;
Rapid titration as only a few
measurements are required around
the end point;
Ease of automation to carry out
titration and detect end point;
Offers some selectivity by choice of
applied potential;
Applicable to redox, precipitation &
complexometric reactions.
Requires relatively inexpensive
electrochemical equipment
Table 9.7 – advantages and disadvantages of amperometric titrations
71
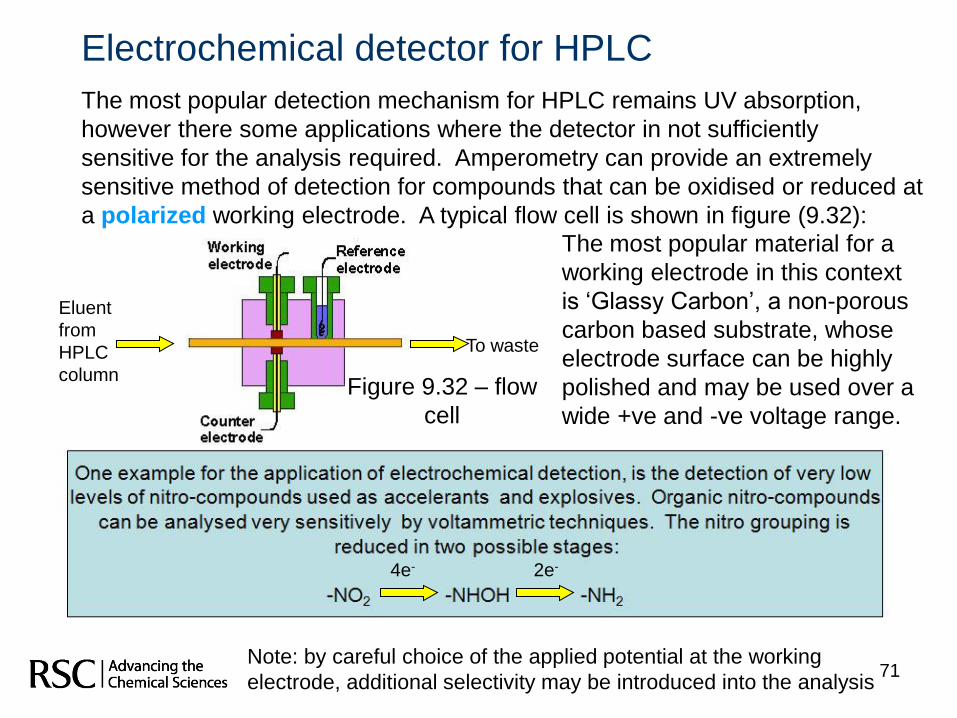
Electrochemical detector for HPLC
The most popular detection mechanism for HPLC remains UV absorption,
however there some applications where the detector in not sufficiently
sensitive for the analysis required. Amperometry can provide an extremely
sensitive method of detection for compounds that can be oxidised or reduced at
a polarized working electrode. A typical flow cell is shown in figure (9.32):
Eluent
from
HPLC
column
To waste
The most popular material for a
working electrode in this context
is „Glassy Carbon‟, a non-porous
carbon based substrate, whose
electrode surface can be highly
polished and may be used over a
wide +ve and -ve voltage range.
Note: by careful choice of the applied potential at the working
electrode, additional selectivity may be introduced into the analysis
4e- 2e-
Figure 9.32 – flow
cell
72
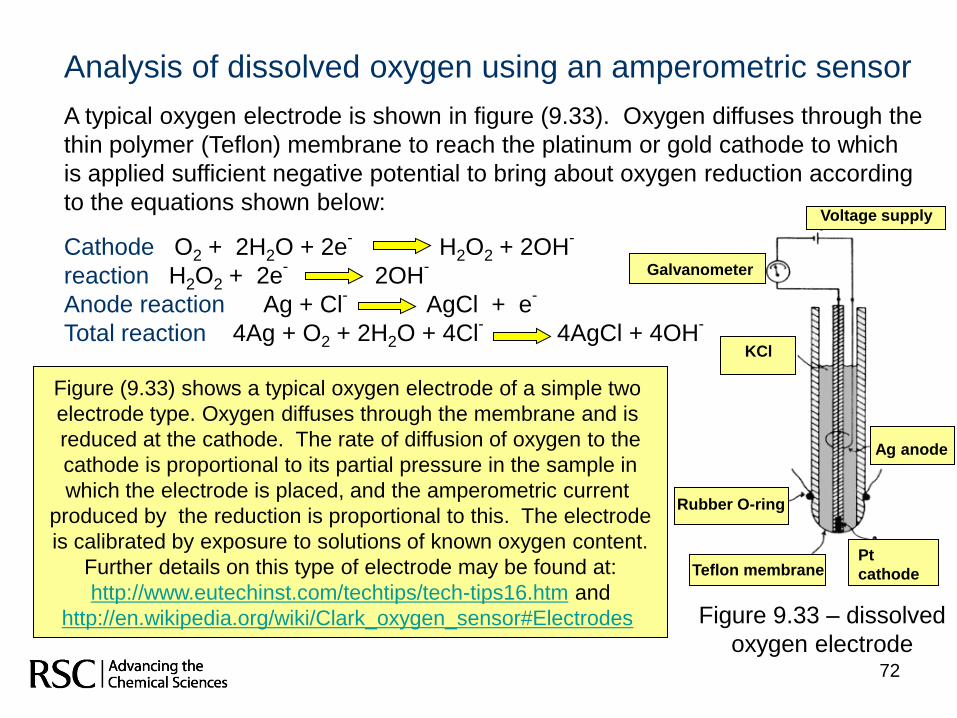
Analysis of dissolved oxygen using an amperometric sensor
A typical oxygen electrode is shown in figure (9.33). Oxygen diffuses through the
thin polymer (Teflon) membrane to reach the platinum or gold cathode to which
is applied sufficient negative potential to bring about oxygen reduction according
to the equations shown below:
Cathode O2 + 2H2O + 2e-
H2O2 + 2OH-
reaction H2O2 + 2e-
2OH-
Anode reaction Ag + Cl-
AgCl + e-
Total reaction 4Ag + O2 + 2H2O + 4Cl-
4AgCl + 4OH-
Voltage supply
Galvanometer
KCl
Ag anode
Pt
cathodeTeflon membrane
Rubber O-ring
Figure (9.33) shows a typical oxygen electrode of a simple two
electrode type. Oxygen diffuses through the membrane and is
reduced at the cathode. The rate of diffusion of oxygen to the
cathode is proportional to its partial pressure in the sample in
which the electrode is placed, and the amperometric current
produced by the reduction is proportional to this. The electrode
is calibrated by exposure to solutions of known oxygen content.
Further details on this type of electrode may be found at:
http://www.eutechinst.com/techtips/tech-tips16.htm and
http://en.wikipedia.org/wiki/Clark_oxygen_sensor#Electrodes Figure 9.33 – dissolved
oxygen electrode
73
Biosensors using amperometric transducers
A chemical sensor is a device that transform chemical information, into an
analytically useful signal. Chemical sensors normally contain two basic
components:
Chemical (molecular) recognition system (termed a receptor);
A physicochemical transducer.
Biosensors are chemical sensors in which the recognition system utilises
a biochemical mechanism. While all biosensors are more or less selective for
a particular analyte, some are by design, only class selective. The transducer
serves to transfer the signal from an output domain of the recognition system
to mostly the electrical domain. One of the most important electrical transducer
modes is amperometry. Important working electrode materials are:
Metal or carbon electrodes;
Chemically modified electrodes.
Analytes measurable by these systems are:
Oxygen, sugars, alcohols, sugars, phenols, oligonucleotides
74
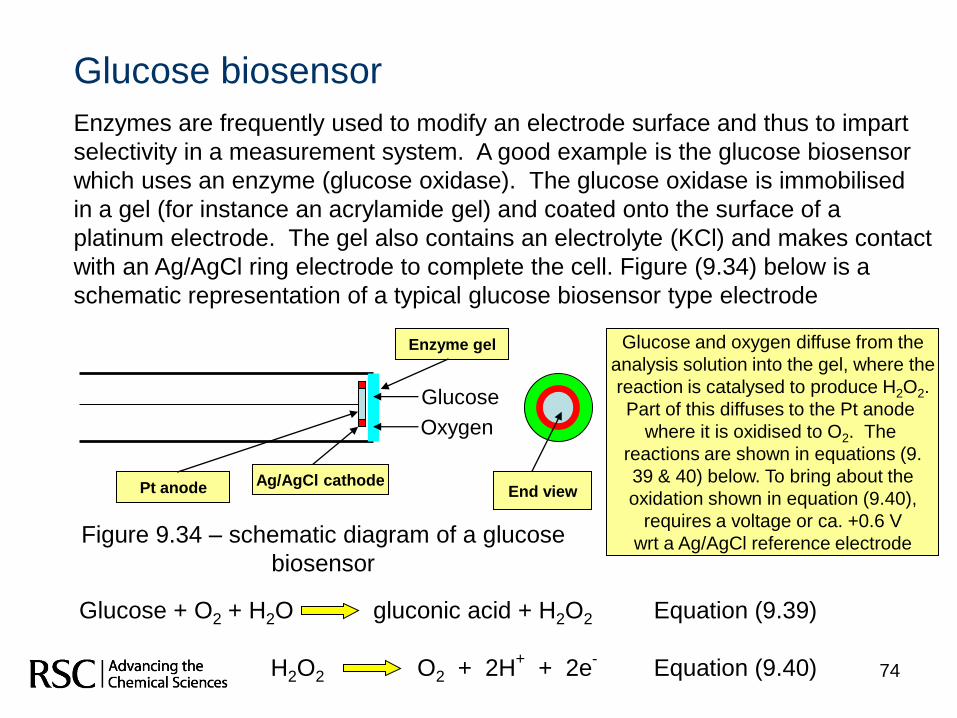
Glucose biosensor
Enzymes are frequently used to modify an electrode surface and thus to impart
selectivity in a measurement system. A good example is the glucose biosensor
which uses an enzyme (glucose oxidase). The glucose oxidase is immobilised
in a gel (for instance an acrylamide gel) and coated onto the surface of a
platinum electrode. The gel also contains an electrolyte (KCl) and makes contact
with an Ag/AgCl ring electrode to complete the cell. Figure (9.34) below is a
schematic representation of a typical glucose biosensor type electrode
Pt anode Ag/AgCl cathode
Enzyme gel
Glucose
Oxygen
Glucose and oxygen diffuse from the
analysis solution into the gel, where the
reaction is catalysed to produce H2O2.
Part of this diffuses to the Pt anode
where it is oxidised to O2. The
reactions are shown in equations (9.
39 & 40) below. To bring about the
oxidation shown in equation (9.40),
requires a voltage or ca. +0.6 V
wrt a Ag/AgCl reference electrode
End view
Glucose + O2 + H2O gluconic acid + H2O2 Equation (9.39)
H2O2 O2 + 2H+
+ 2e-
Equation (9.40)
Figure 9.34 – schematic diagram of a glucose
biosensor
75
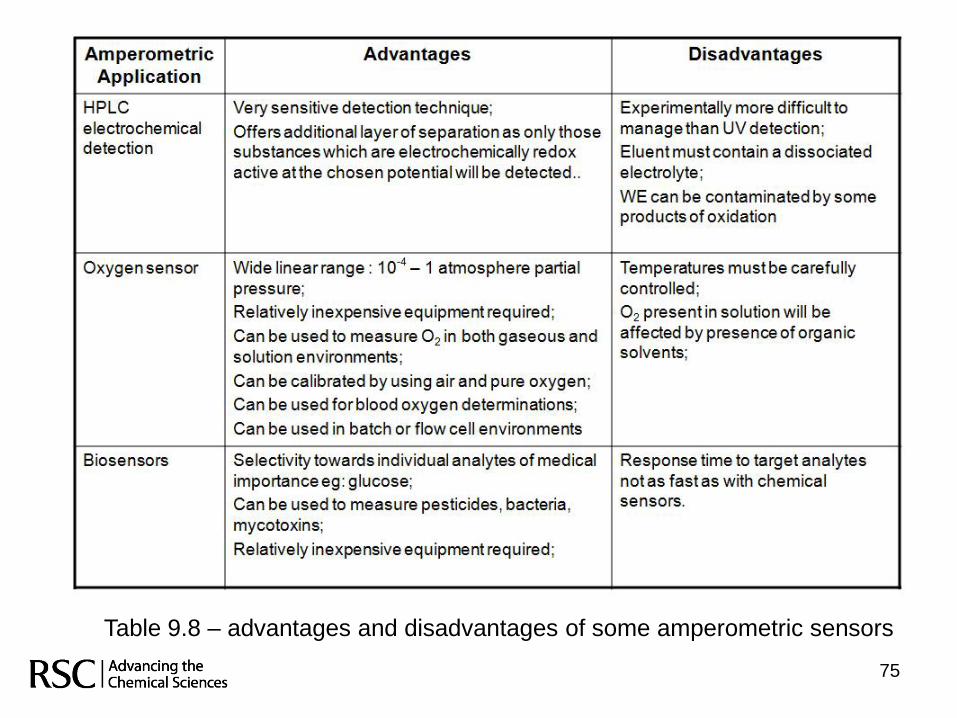
Table 9.8 – advantages and disadvantages of some amperometric sensors
76
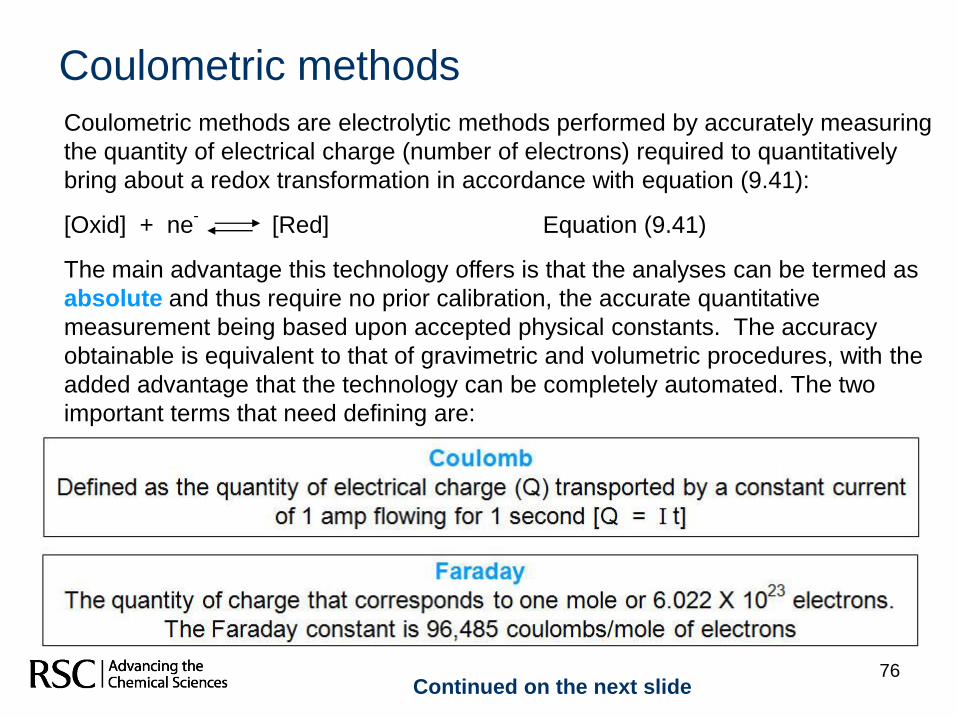
Coulometric methods
Coulometric methods are electrolytic methods performed by accurately measuring
the quantity of electrical charge (number of electrons) required to quantitatively
bring about a redox transformation in accordance with equation (9.41):
[Oxid] + ne-
[Red] Equation (9.41)
The main advantage this technology offers is that the analyses can be termed as
absolute and thus require no prior calibration, the accurate quantitative
measurement being based upon accepted physical constants. The accuracy
obtainable is equivalent to that of gravimetric and volumetric procedures, with the
added advantage that the technology can be completely automated. The two
important terms that need defining are:
Continued on the next slide
77
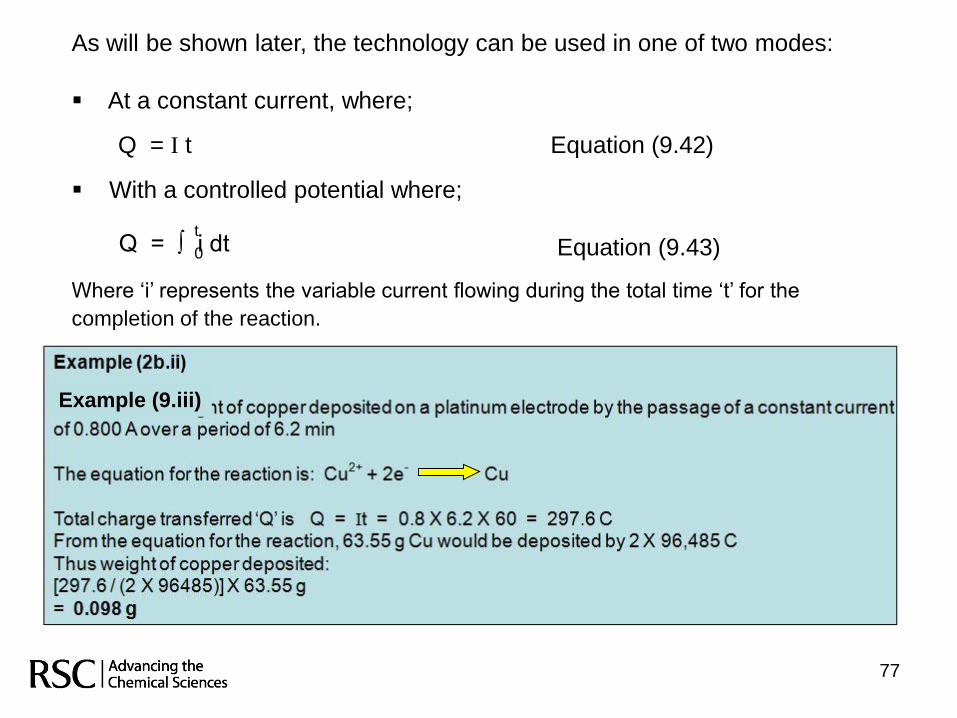
Q = ∫ i dtt
0
Example (9.iii)
As will be shown later, the technology can be used in one of two modes:
At a constant current, where;
Q = I t Equation (9.42)
With a controlled potential where;
Equation (9.43)
Where „i‟ represents the variable current flowing during the total time „t‟ for the
completion of the reaction.
78
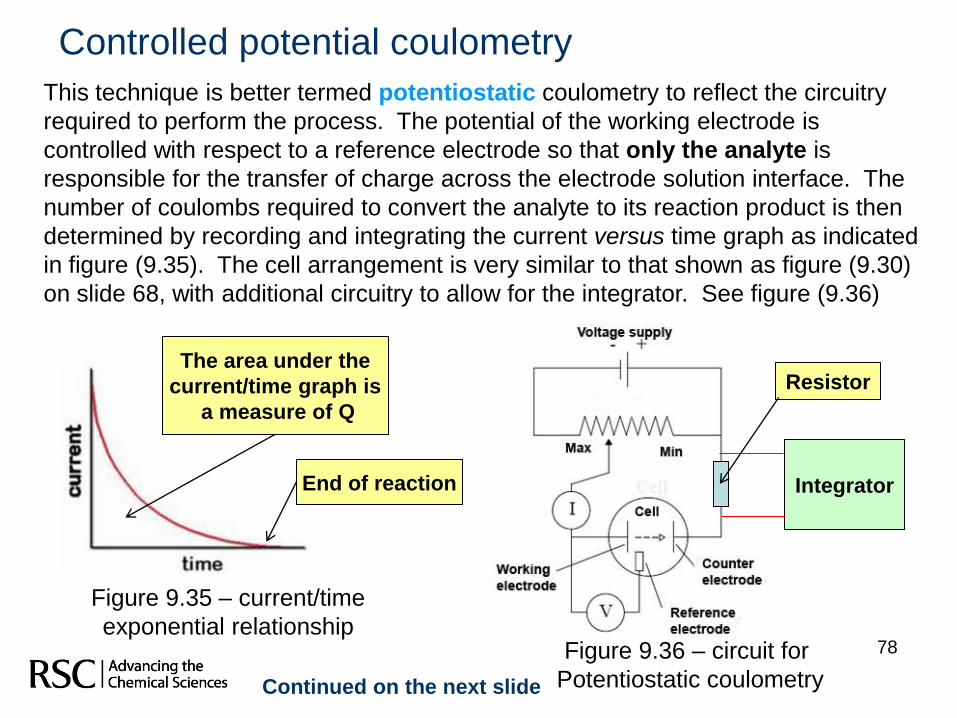
Controlled potential coulometry
This technique is better termed potentiostatic coulometry to reflect the circuitry
required to perform the process. The potential of the working electrode is
controlled with respect to a reference electrode so that only the analyte is
responsible for the transfer of charge across the electrode solution interface. The
number of coulombs required to convert the analyte to its reaction product is then
determined by recording and integrating the current versus time graph as indicated
in figure (9.35). The cell arrangement is very similar to that shown as figure (9.30)
on slide 68, with additional circuitry to allow for the integrator. See figure (9.36)
Integrator
Resistor
Figure 9.35 – current/time
exponential relationship
Continued on the next slide
The area under the
current/time graph is
a measure of Q
End of reaction
Figure 9.36 – circuit for
Potentiostatic coulometry
79
Two types of cell are frequently used for potentiostatic coulometry.
The first consists of a platinum gauze (large surface area) working electrode
together with a platinum counter electrode and a calomel reference. It is important
to physically separate the counter and working electrodes via a salt bridge, in
order to avoid products generated at the counter electrode from diffusing into the
analyte solution and causing interference. To avoid large liquid junction potentials,
the salt bridge frequently contains the same electrolyte as is present in the analyte
solution.
One of the main problems encountered when using acidic solutions to perform
analyte reductions at negative potentials (see the earlier section on voltammetry),
is that the reduction of hydrogen ion to hydrogen gas can lead to serious
interference. This can be overcome by the use of a pool of mercury as the
cathode, as the production of hydrogen at the mercury electrode is subject to a
large overpotential. So a mercury cathode forms the basis of the second type
of cell arrangement.
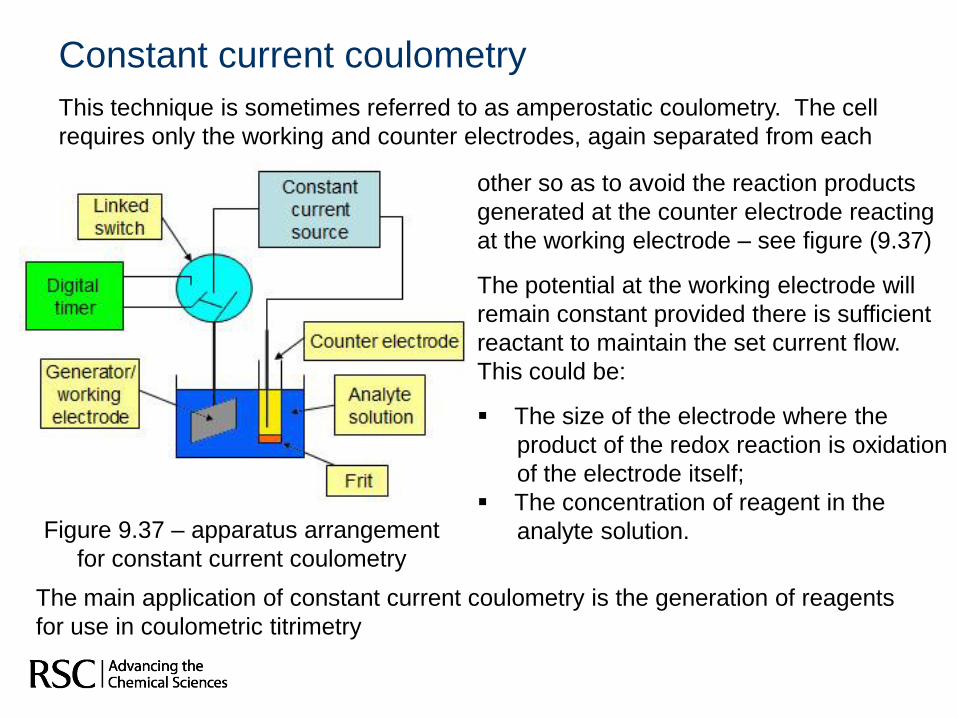
Constant current coulometry
This technique is sometimes referred to as amperostatic coulometry. The cell
requires only the working and counter electrodes, again separated from each
other so as to avoid the reaction products
generated at the counter electrode reacting
at the working electrode – see figure (9.37)
The potential at the working electrode will
remain constant provided there is sufficient
reactant to maintain the set current flow.
This could be:
The size of the electrode where the
product of the redox reaction is oxidation
of the electrode itself;
The concentration of reagent in the
analyte solution. Figure 9.37 – apparatus arrangement
for constant current coulometry
The main application of constant current coulometry is the generation of reagents
for use in coulometric titrimetry
81
Coulometric titrimetry
This form of titrimetry generates the reagent in-situ by use of constant current
coulometry. The only measurements required are current and time. The end
point in the titration may be detected by any of the usual methods, however
electrical methods are favoured (potentiometric, amperometric or
conductometric) as these methods can lead to the total automation of the system.
Since concentration polarisation is inevitable in coulometric titrimetry, it is
preferable for most of the titration reaction to take place away from the electrode
surface. If this is not the case, the system will have to continuously increase the
potential at the working electrode in order to maintain the production of titrant. An
example of this is the use of Fe2+
, generated from Fe3+
to titrate a range of
strong oxidising agents such as permanganate (MnO4-) and chromate (CrO4
2-).
Although redox type reactions would seem to be the obvious application of
coulometric titrimetry, neutralisation, precipitation and complexometric reactions
can also be carried out by using this technique. Table (9.9) on the next slide gives
some examples of reagents that can be generated coulometrically, together with
examples of uses to which they can be put.
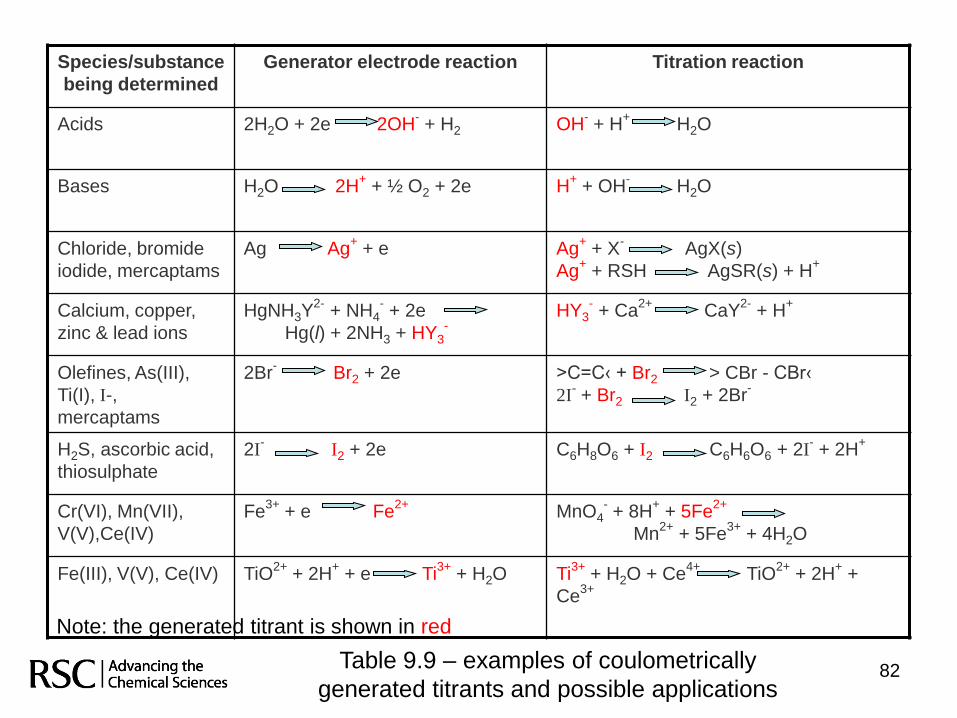
82
Species/substance
being determined
Generator electrode reaction Titration reaction
Acids 2H2O + 2e 2OH-+ H2 OH
-+ H
+H2O
Bases H2O 2H+
+ ½ O2 + 2e H+
+ OH-
H2O
Chloride, bromide
iodide, mercaptams
Ag Ag+
+ e Ag+
+ X-
AgX(s)
Ag+
+ RSH AgSR(s) + H+
Calcium, copper,
zinc & lead ions
HgNH3Y2-
+ NH4-+ 2e
Hg(l) + 2NH3 + HY3-
HY3-+ Ca
2+CaY
2-+ H
+
Olefines, As(III),
Ti(I), I-,
mercaptams
2Br-
Br2 + 2e >C=C‹ + Br2 > CBr - CBr‹
2I-+ Br2 I2 + 2Br
-
H2S, ascorbic acid,
thiosulphate
2I-
I2 + 2e C6H8O6 + I2 C6H6O6 + 2I-+ 2H
+
Cr(VI), Mn(VII),
V(V),Ce(IV)
Fe3+
+ e Fe2+
MnO4-+ 8H
++ 5Fe
2+
Mn2+
+ 5Fe3+
+ 4H2O
Fe(III), V(V), Ce(IV) TiO2+
+ 2H+
+ e Ti3+
+ H2O Ti3+
+ H2O + Ce4+
TiO2+
+ 2H+
+
Ce3+
Note: the generated titrant is shown in red
Table 9.9 – examples of coulometrically
generated titrants and possible applications
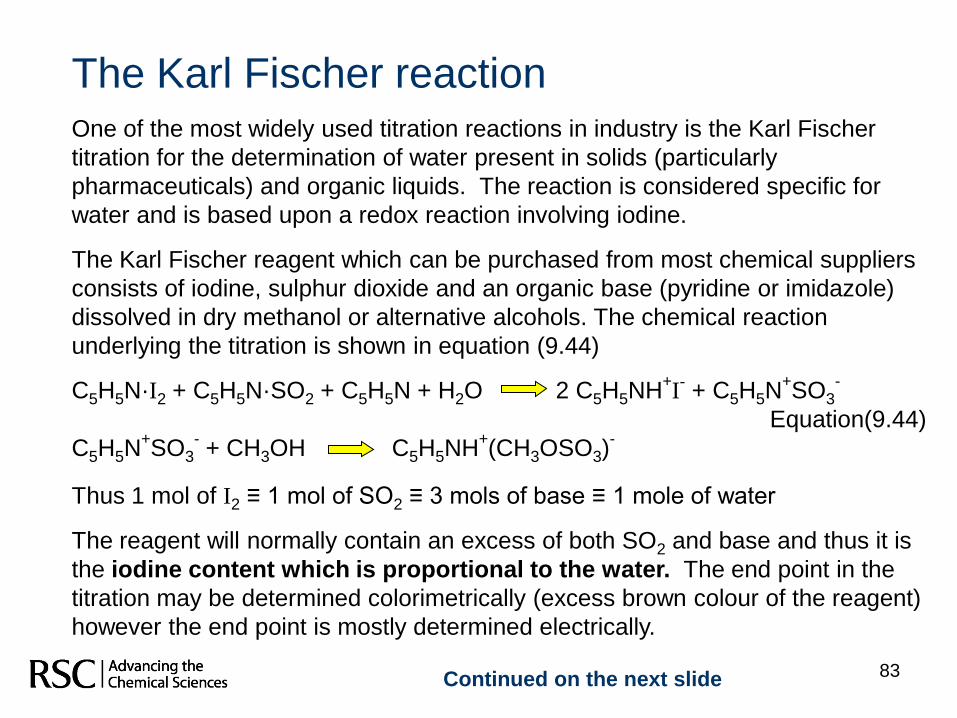
83
The Karl Fischer reactionOne of the most widely used titration reactions in industry is the Karl Fischer
titration for the determination of water present in solids (particularly
pharmaceuticals) and organic liquids. The reaction is considered specific for
water and is based upon a redox reaction involving iodine.
The Karl Fischer reagent which can be purchased from most chemical suppliers
consists of iodine, sulphur dioxide and an organic base (pyridine or imidazole)
dissolved in dry methanol or alternative alcohols. The chemical reaction
underlying the titration is shown in equation (9.44)
C5H5N·I2 + C5H5N·SO2 + C5H5N + H2O 2 C5H5NH+I-+ C5H5N
+SO3
-
Equation(9.44)
C5H5N+SO3
-+ CH3OH C5H5NH
+(CH3OSO3)
-
Thus 1 mol of I2 ≡ 1 mol of SO2 ≡ 3 mols of base ≡ 1 mole of water
The reagent will normally contain an excess of both SO2 and base and thus it is
the iodine content which is proportional to the water. The end point in the
titration may be determined colorimetrically (excess brown colour of the reagent)
however the end point is mostly determined electrically.
Continued on the next slide
84
Karl Fischer (K/F) reagent decomposes on standing and it is thus usual to
standardise the reagent against a standard solution of water in dry methanol on
a daily basis.
Great care must be exercised to keep all of the glassware used in the titration free
from contamination by water, particularly atmospheric moisture.
The titration can be carried out either:
Directly – dissolve sample in dry methanol and titrate directly with the reagent;
Indirectly – addition of an excess of K/F reagent followed by back titration
with standard water in methanol.
When the sample is totally soluble in methanol, a direct titration is usually possible.
However, when the sample is only partially soluble in methanol, the back titration is
likely to give more accurate results. The method is very sensitive allowing small
amounts of water (mg/dm3) to the determined accurately.
Modern Karl Fischer titration equipment is now based upon the coulometric
generation of iodine using a constant current type source, with linked
electrochemical detection. This process is described on the next slide with
a schematic diagram of the apparatus required as figure (9.38)
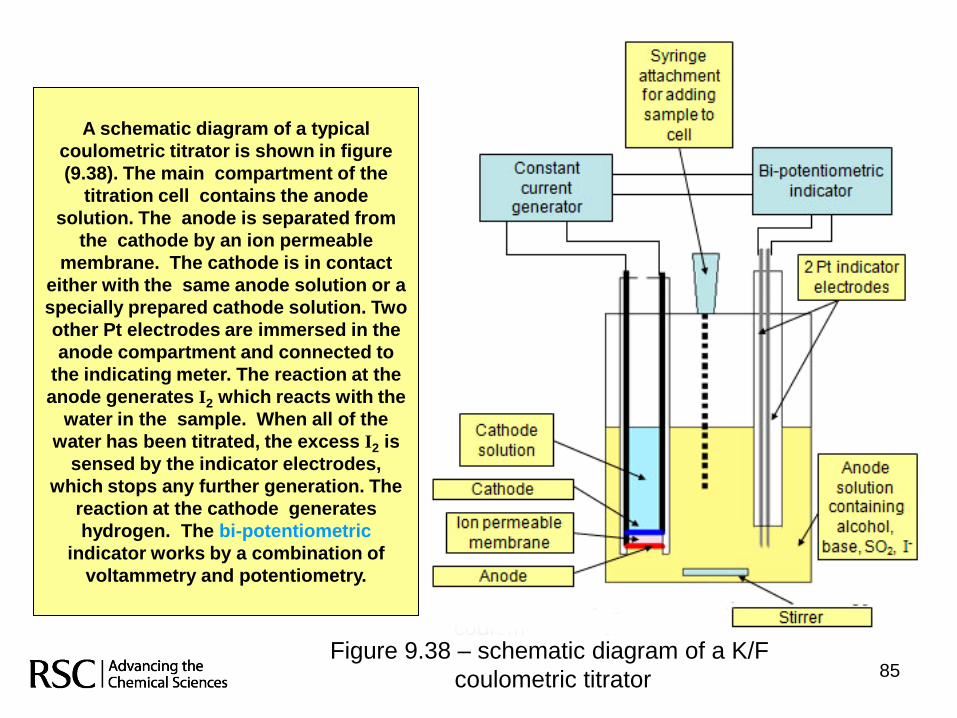
85Figure 9.38 – schematic diagram of a K/F
coulometric titrator
A schematic diagram of a typical
coulometric titrator is shown in figure
(9.38). The main compartment of the
titration cell contains the anode
solution. The anode is separated from
the cathode by an ion permeable
membrane. The cathode is in contact
either with the same anode solution or a
specially prepared cathode solution. Two
other Pt electrodes are immersed in the
anode compartment and connected to
the indicating meter. The reaction at the
anode generates I2 which reacts with the
water in the sample. When all of the
water has been titrated, the excess I2 is
sensed by the indicator electrodes,
which stops any further generation. The
reaction at the cathode generates
hydrogen. The bi-potentiometric
indicator works by a combination of
voltammetry and potentiometry.
86
Applications of coulometric Karl Fischer titrations
The technique may be applied to measure the water contents of a wide range of
inorganic and organic matrices. Where solubility in methanol is a problem then
other alcohol type solvent can be added to increase solubility for instance
decanol or hexanol. In order to avoid opening the anode compartment to the air,
samples are usually dissolved in a suitable dry solvent and then added via a
syringe into the reagent in the compartment. The quantity added will depend
upon the level of water expected. The current generator is also set to correspond
to expected water levels.
As indicated in equation (9.44) 1 mole of iodine ≡ 1 mole of water
1 mole of iodine is generated by 2 X 96485 C of power
Thus 18 g of water ≡ 192,970 C
Thus 1 mg of water ≡ 0.001/18 X 192970 C = 10.72 C
This factor may be used to calculate water contents of all samples analysed.
An example is shown as example (9.1v) on the next slide.
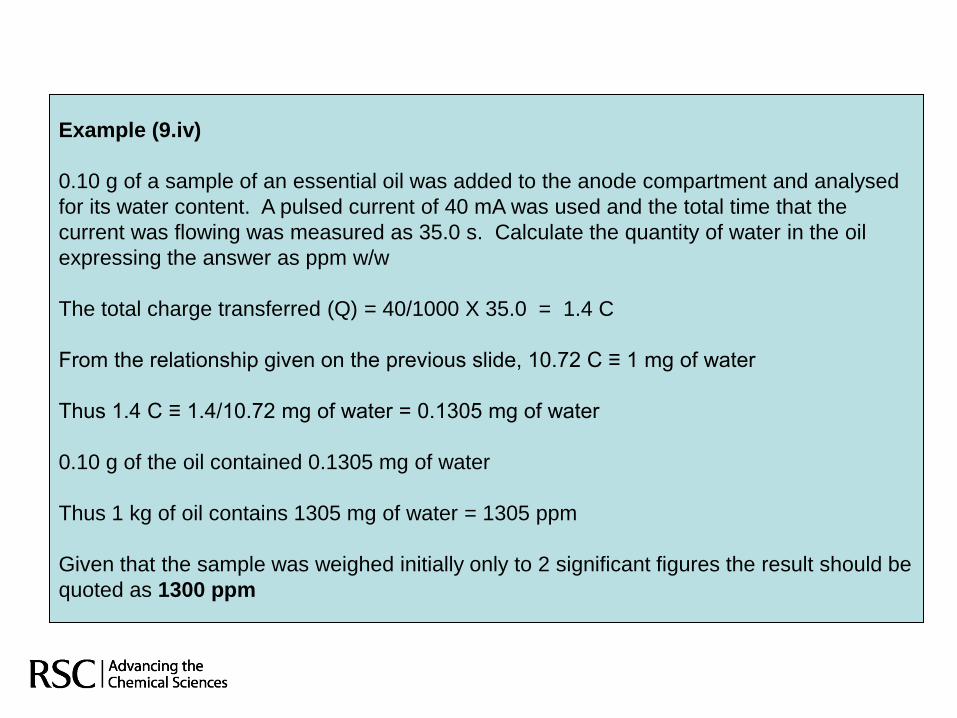
Example (9.iv)
0.10 g of a sample of an essential oil was added to the anode compartment and analysed
for its water content. A pulsed current of 40 mA was used and the total time that the
current was flowing was measured as 35.0 s. Calculate the quantity of water in the oil
expressing the answer as ppm w/w
The total charge transferred (Q) = 40/1000 X 35.0 = 1.4 C
From the relationship given on the previous slide, 10.72 C ≡ 1 mg of water
Thus 1.4 C ≡ 1.4/10.72 mg of water = 0.1305 mg of water
0.10 g of the oil contained 0.1305 mg of water
Thus 1 kg of oil contains 1305 mg of water = 1305 ppm
Given that the sample was weighed initially only to 2 significant figures the result should be
quoted as 1300 ppm
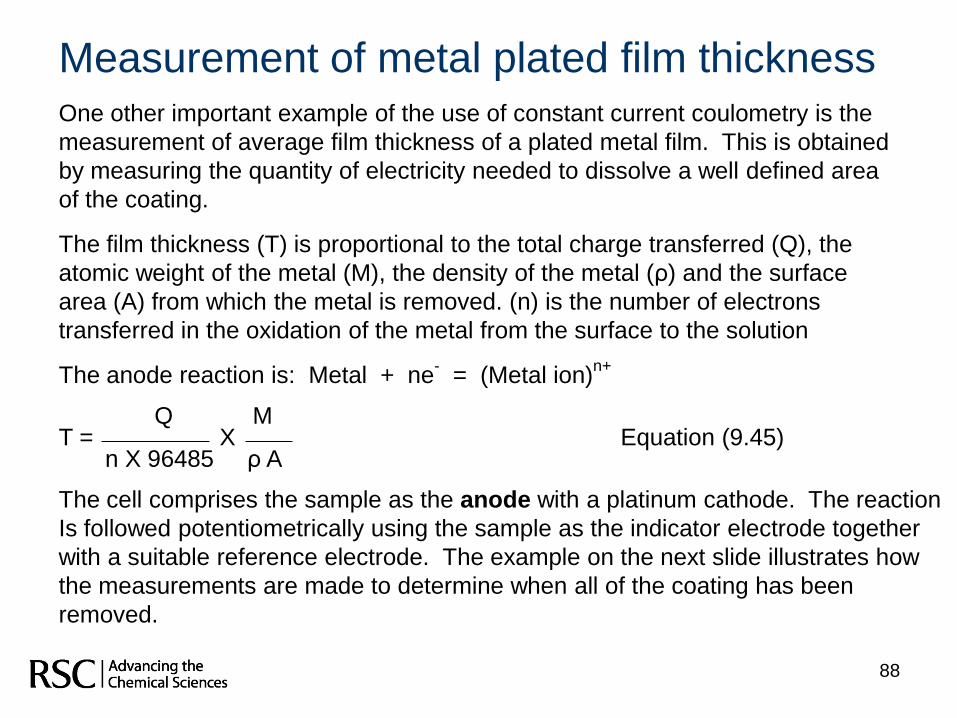
88
Measurement of metal plated film thicknessOne other important example of the use of constant current coulometry is the
measurement of average film thickness of a plated metal film. This is obtained
by measuring the quantity of electricity needed to dissolve a well defined area
of the coating.
The film thickness (T) is proportional to the total charge transferred (Q), the
atomic weight of the metal (M), the density of the metal (ρ) and the surface
area (A) from which the metal is removed. (n) is the number of electrons
transferred in the oxidation of the metal from the surface to the solution
The anode reaction is: Metal + ne-
= (Metal ion)n+
Q MT = X Equation (9.45)
n X 96485 ρ A
The cell comprises the sample as the anode with a platinum cathode. The reaction
Is followed potentiometrically using the sample as the indicator electrode together
with a suitable reference electrode. The example on the next slide illustrates how
the measurements are made to determine when all of the coating has been
removed.
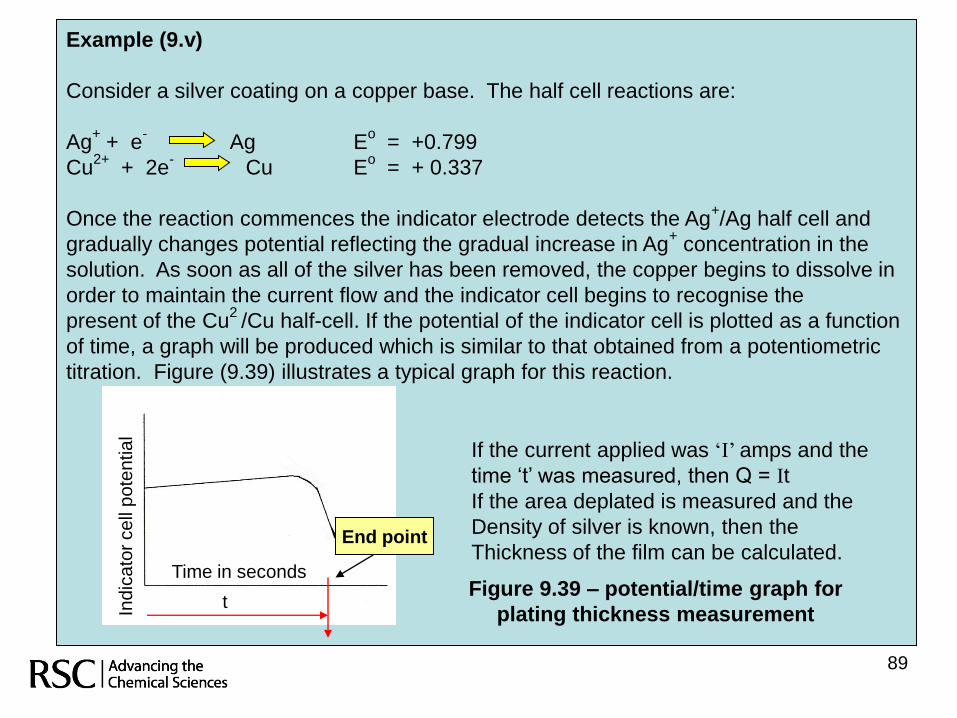
89
Example (9.v)
Consider a silver coating on a copper base. The half cell reactions are:
Ag+
+ e-
Ag Eo
= +0.799
Cu2+
+ 2e-
Cu Eo
= + 0.337
Once the reaction commences the indicator electrode detects the Ag+/Ag half cell and
gradually changes potential reflecting the gradual increase in Ag+
concentration in the
solution. As soon as all of the silver has been removed, the copper begins to dissolve in
order to maintain the current flow and the indicator cell begins to recognise the
present of the Cu2
/Cu half-cell. If the potential of the indicator cell is plotted as a function
of time, a graph will be produced which is similar to that obtained from a potentiometric
titration. Figure (9.39) illustrates a typical graph for this reaction.
Ind
ica
tor
ce
ll p
ote
ntia
l
Time in seconds
End point
t
If the current applied was ‘I’ amps and the
time „t‟ was measured, then Q = It
If the area deplated is measured and the
Density of silver is known, then the
Thickness of the film can be calculated.
Figure 9.39 – potential/time graph for
plating thickness measurement
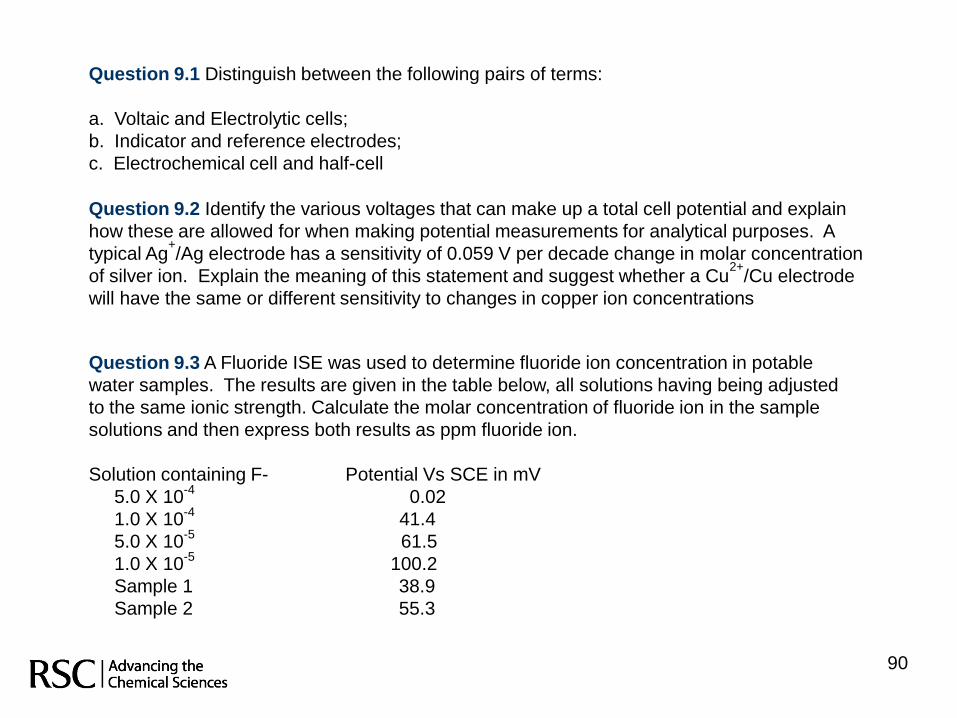
90
Question 9.1 Distinguish between the following pairs of terms:
a. Voltaic and Electrolytic cells;
b. Indicator and reference electrodes;
c. Electrochemical cell and half-cell
Question 9.2 Identify the various voltages that can make up a total cell potential and explain
how these are allowed for when making potential measurements for analytical purposes. A
typical Ag+/Ag electrode has a sensitivity of 0.059 V per decade change in molar concentration
of silver ion. Explain the meaning of this statement and suggest whether a Cu2+
/Cu electrode
will have the same or different sensitivity to changes in copper ion concentrations
Question 9.3 A Fluoride ISE was used to determine fluoride ion concentration in potable
water samples. The results are given in the table below, all solutions having being adjusted
to the same ionic strength. Calculate the molar concentration of fluoride ion in the sample
solutions and then express both results as ppm fluoride ion.
Solution containing F- Potential Vs SCE in mV
5.0 X 10⁻⁴
0.02
1.0 X 10⁻⁴
41.4
5.0 X 10⁻⁵
61.5
1.0 X 10⁻⁵
100.2
Sample 1 38.9
Sample 2 55.3
91
Question 9.4 10.0 cm3
of a plating solution was titrated with electrically generated H+
to a
methyl orange end point. The end point in the titration was reached after 3 min 22 sec at a
constant current of 43.4 mA. Calculate the concentration of NaCN in the sample titrated.
Question 9.5 Compare and contrast titrations performed potentiometrically, amperometrically and
coulometrically
Question 9.6 The thickness of tin on one side of a metal can was determined using a
coulometric process. The current used to remove the tin was 100 mA and the removal took
10.5 minutes. If the area from which the tin was removed was 4.5 cm2, calculate the
thickness of the tin layer in mm. The density of tin is 7.3. Express your answer in microns
92
Outline answer to question 9.1
The answer to this question may be found on slides 6 - 9 and 13 - 14
Voltaic cells generate current spontaneously as the two halves of the cell
attempt to achieve an equilibrium of lowest free energy. An electrolytic cell
applies a potential in order to reverse the chemical reaction generated in a voltaic
cell.
The indicator and reference electrodes form the basic cell used in analytical
potentiometry. The indicator electrode senses the present of an analyte and the
reference electrode completes the cell whist at the same time providing a
constant reference potential. Under these circumstances Ecell α Eindicator
A cell comprises two electrodes or two half-cells. Each half-cell is the theoretical
potential generated by a single electrode reaction and tables of these half-cells
may be found in standard textbooks under the terms of „Standard Electrode
potentials‟. The potential of a cell is termed „potential difference‟, to reflect the
fact that it is impossible to measure potentials of half-cells alone, only the
differences between two half-cells.
93
Outline answer to question 9.2
The answer to this question can be found on slides 16 and 20 - 22.
The potentials that contribute to a total cell are:
The potential of the indicator electrode;
The potential of the reference electrode;
The liquid junction potential.
Assuming that the same cell is used throughout the whole analysis process
then the potential of the reference electrode and the junction will remain
constant and do not need to be measured. This relates to both direct and
relative potentiometry.
The Nernst equation relating to the Ag+/Ag half-cell is;
E = E0
+ 0.059/1 log [Ag+] V @ 20
0C
The value of E will increase or decrease by 0.059 V as the concentration is
altered from 0.1 to 0.01 M due to the implication of the log term.
With the equivalent copper electrode the equation is now:
E = E0
+ 0.059/2 log (Cu2+
) @ 200C
The sensitivity in this case is 0.0295 V – half the sensitivity for a singly
charged electrode.
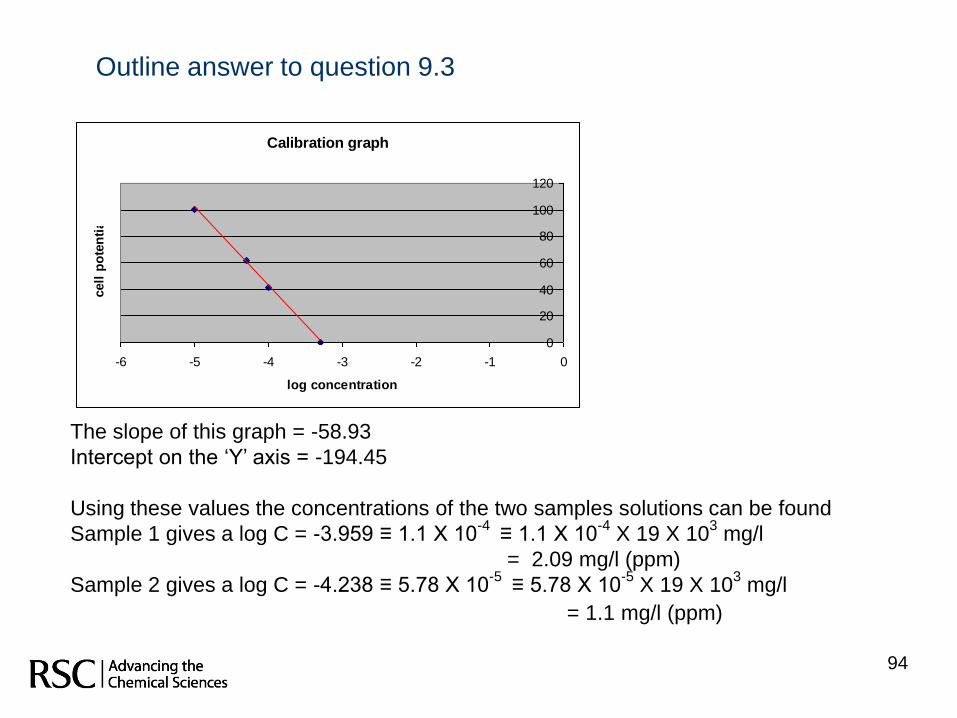
94
Outline answer to question 9.3
Calibration graph
0
20
40
60
80
100
120
-6 -5 -4 -3 -2 -1 0
log concentration
cell
po
ten
tial
The slope of this graph = -58.93
Intercept on the „Y‟ axis = -194.45
Using these values the concentrations of the two samples solutions can be found
Sample 1 gives a log C = -3.959 ≡ 1.1 X 10⁻⁴
≡ 1.1 X 10-4
X 19 X 103
mg/l
= 2.09 mg/l (ppm)
Sample 2 gives a log C = -4.238 ≡ 5.78 X 10⁻⁵
≡ 5.78 X 10-5
X 19 X 103
mg/l
= 1.1 mg/l (ppm)
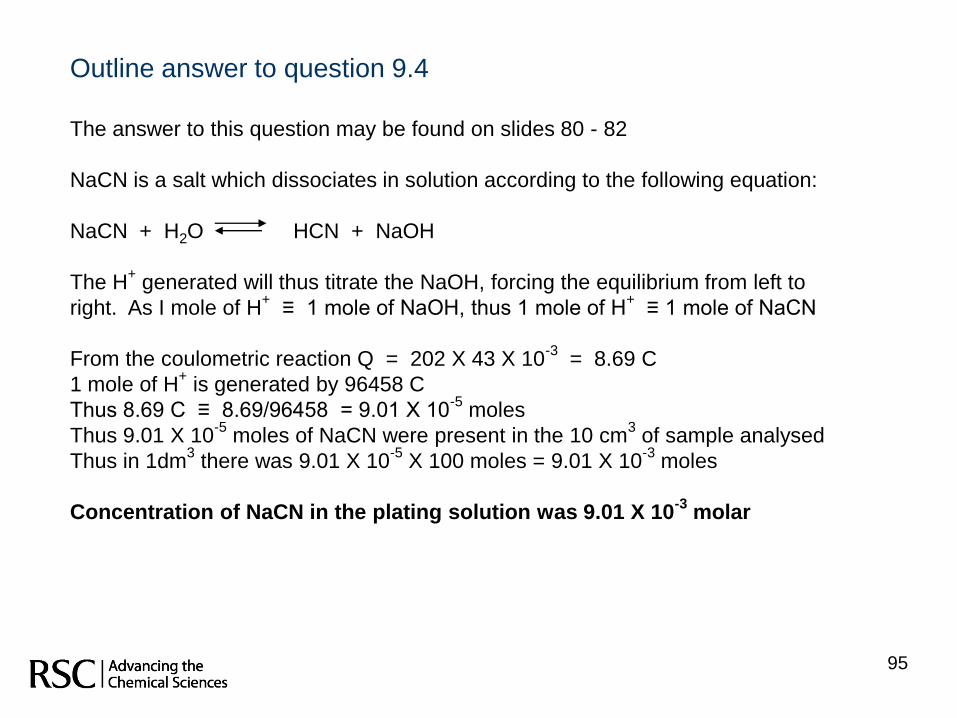
95
Outline answer to question 9.4
The answer to this question may be found on slides 80 - 82
NaCN is a salt which dissociates in solution according to the following equation:
NaCN + H2O HCN + NaOH
The H+
generated will thus titrate the NaOH, forcing the equilibrium from left to
right. As I mole of H+
≡ 1 mole of NaOH, thus 1 mole of H+
≡ 1 mole of NaCN
From the coulometric reaction Q = 202 X 43 X 10-3
= 8.69 C
1 mole of H+
is generated by 96458 C
Thus 8.69 C ≡ 8.69/96458 = 9.01 X 10⁻⁵
moles
Thus 9.01 X 10⁻⁵
moles of NaCN were present in the 10 cm3
of sample analysed
Thus in 1dm3
there was 9.01 X 10-5
X 100 moles = 9.01 X 10⁻³
moles
Concentration of NaCN in the plating solution was 9.01 X 10⁻³
molar
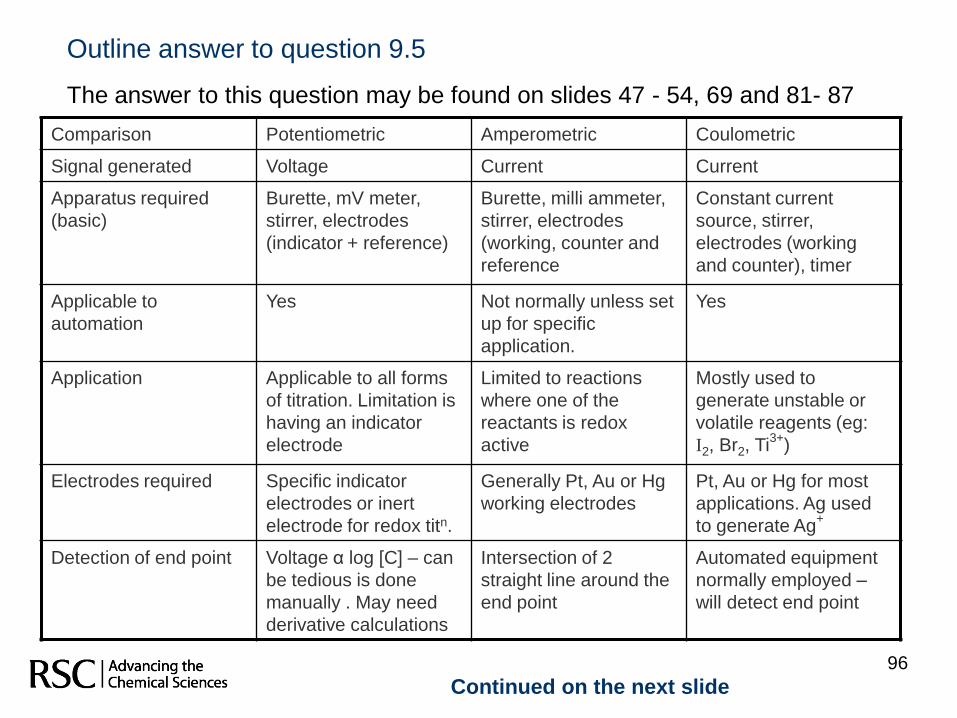
96
Outline answer to question 9.5
The answer to this question may be found on slides 47 - 54, 69 and 81- 87
Comparison Potentiometric Amperometric Coulometric
Signal generated Voltage Current Current
Apparatus required
(basic)
Burette, mV meter,
stirrer, electrodes
(indicator + reference)
Burette, milli ammeter,
stirrer, electrodes
(working, counter and
reference
Constant current
source, stirrer,
electrodes (working
and counter), timer
Applicable to
automation
Yes Not normally unless set
up for specific
application.
Yes
Application Applicable to all forms
of titration. Limitation is
having an indicator
electrode
Limited to reactions
where one of the
reactants is redox
active
Mostly used to
generate unstable or
volatile reagents (eg:
I2, Br2, Ti3+
)
Electrodes required Specific indicator
electrodes or inert
electrode for redox titn.
Generally Pt, Au or Hg
working electrodes
Pt, Au or Hg for most
applications. Ag used
to generate Ag+
Detection of end point Voltage α log [C] – can
be tedious is done
manually . May need
derivative calculations
Intersection of 2
straight line around the
end point
Automated equipment
normally employed –
will detect end point
Continued on the next slide
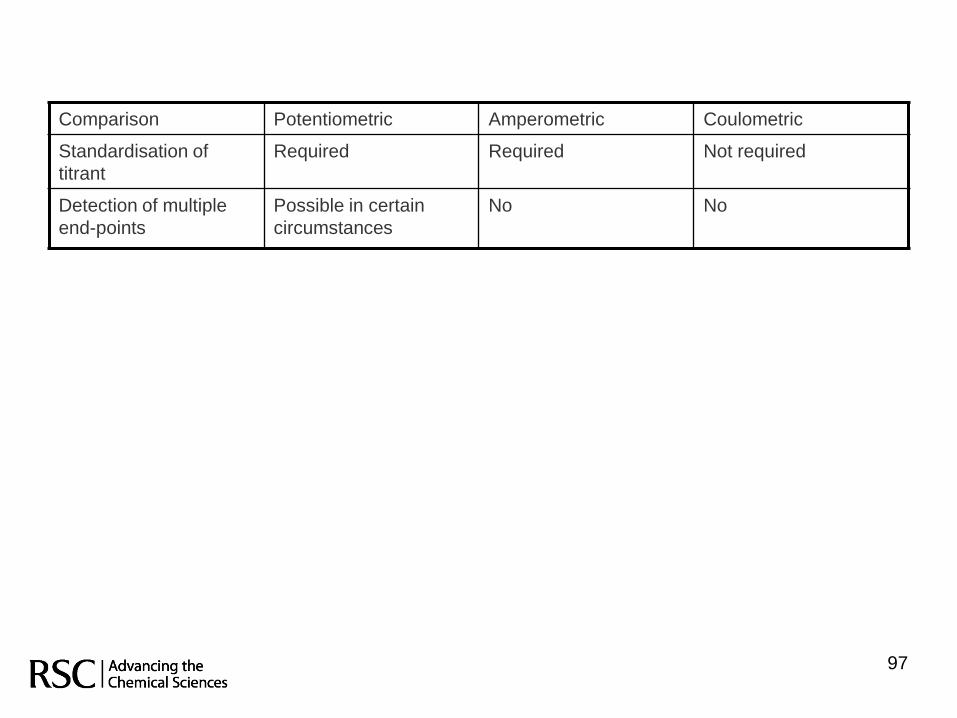
97
Comparison Potentiometric Amperometric Coulometric
Standardisation of
titrant
Required Required Not required
Detection of multiple
end-points
Possible in certain
circumstances
No No
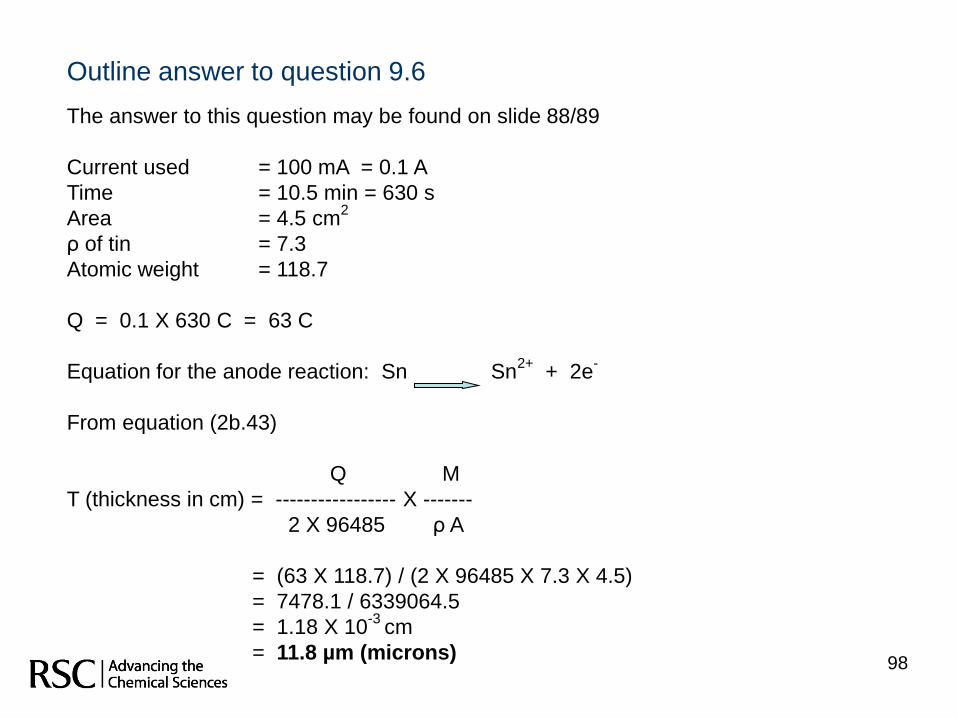
98
Outline answer to question 9.6
The answer to this question may be found on slide 88/89
Current used = 100 mA = 0.1 A
Time = 10.5 min = 630 s
Area = 4.5 cm2
ρ of tin = 7.3
Atomic weight = 118.7
Q = 0.1 X 630 C = 63 C
Equation for the anode reaction: Sn Sn2+
+ 2e-
From equation (2b.43)
Q M
T (thickness in cm) = ----------------- X -------
2 X 96485 ρ A
= (63 X 118.7) / (2 X 96485 X 7.3 X 4.5)
= 7478.1 / 6339064.5
= 1.18 X 10⁻³
cm
= 11.8 µm (microns)