Embed Size (px)
Citation preview

Consumer Staples: Company Presentation
Nishanker Damodara
Panchanathan Arthaballe Chandrasekaran

Agenda
Recap of Outlook & Sector Recommendation Stock Recommendations Summary Q&A
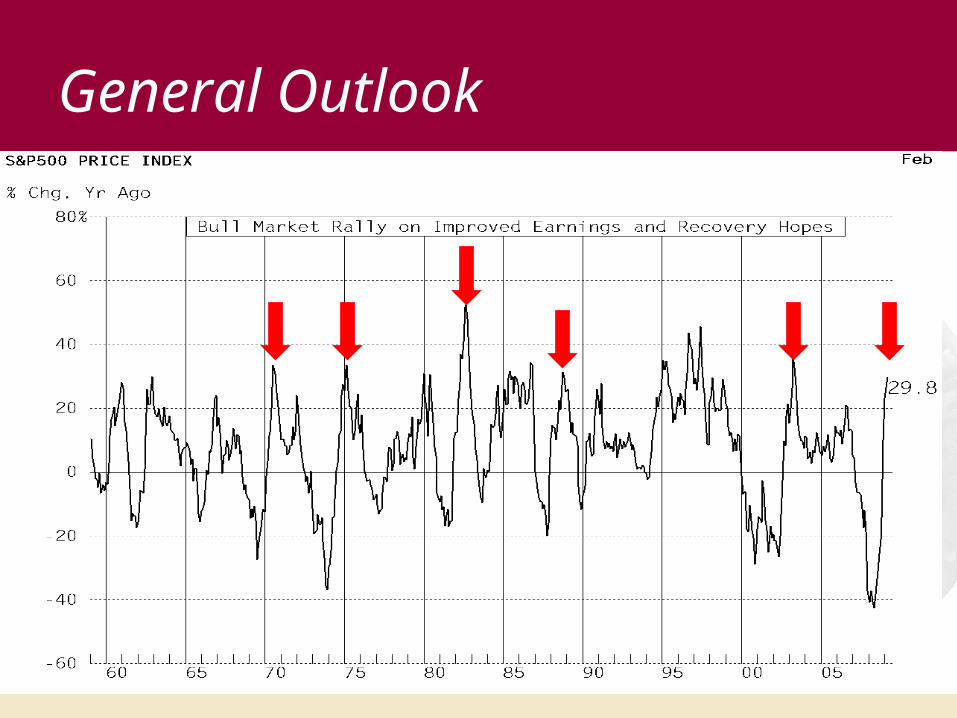
General Outlook
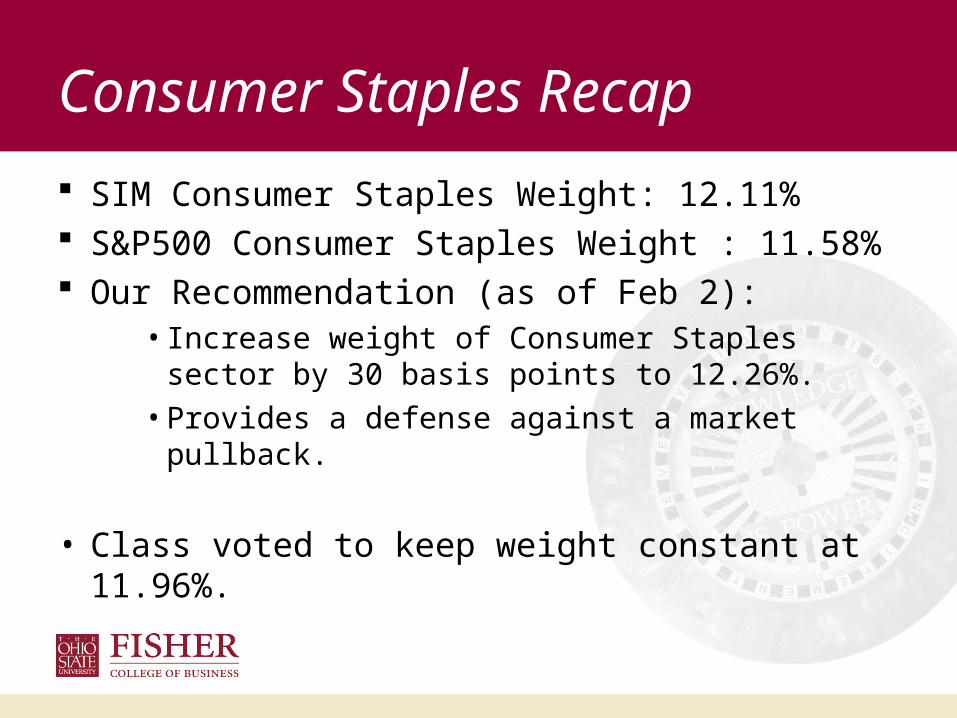
Consumer Staples Recap
SIM Consumer Staples Weight: 12.11% S&P500 Consumer Staples Weight : 11.58% Our Recommendation (as of Feb 2):
• Increase weight of Consumer Staples sector by 30 basis points to 12.26%.
• Provides a defense against a market pullback.
• Class voted to keep weight constant at 11.96%.
Sector Holdings
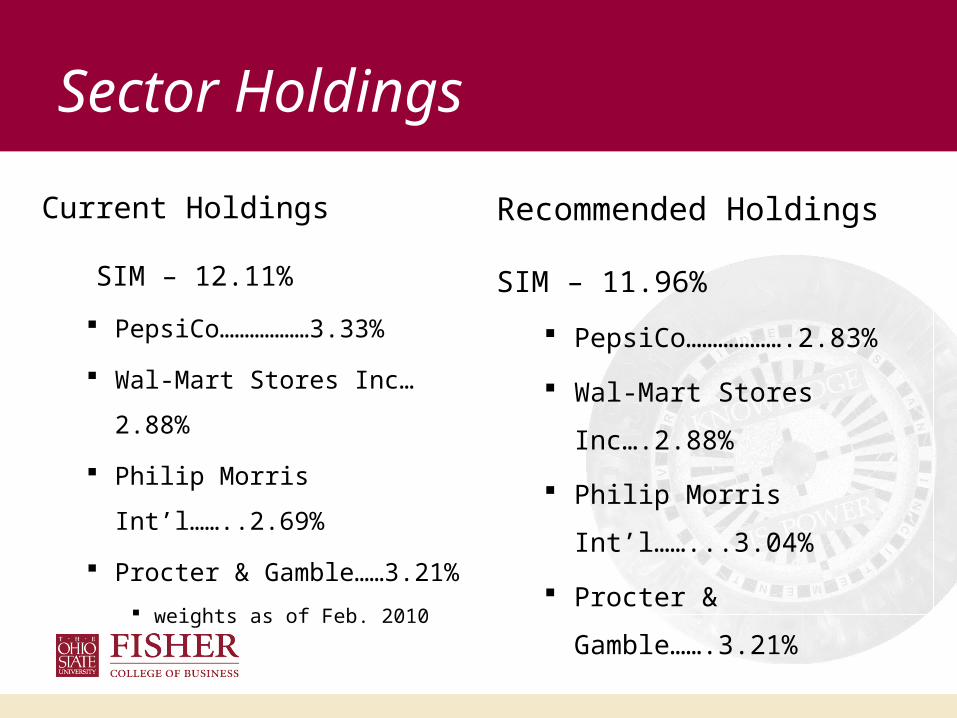
Current Holdings
SIM – 12.11%
PepsiCo………………3.33%
Wal-Mart Stores Inc…2.88%
Philip Morris Int’l……..2.69%
Procter & Gamble……3.21%
weights as of Feb. 2010
Recommended Holdings
SIM – 11.96%
PepsiCo……………….2.83%
Wal-Mart Stores Inc….2.88%
Philip Morris Int’l……...3.04%
Procter & Gamble…….3.21%
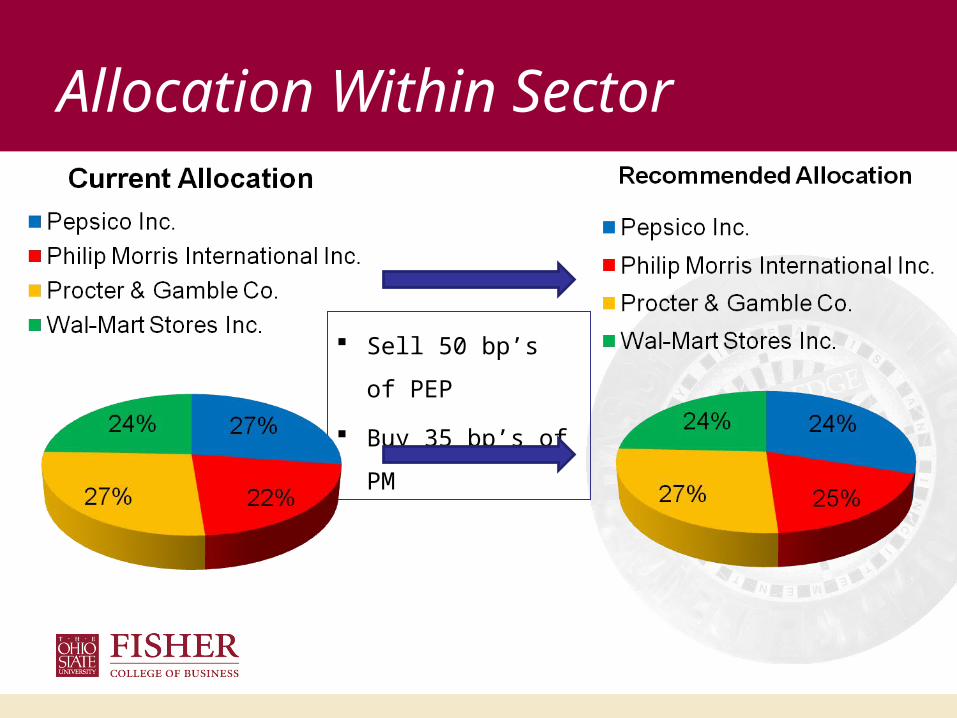
Allocation Within Sector
Sell 50 bp’s of PEP
Buy 35 bp’s of PM
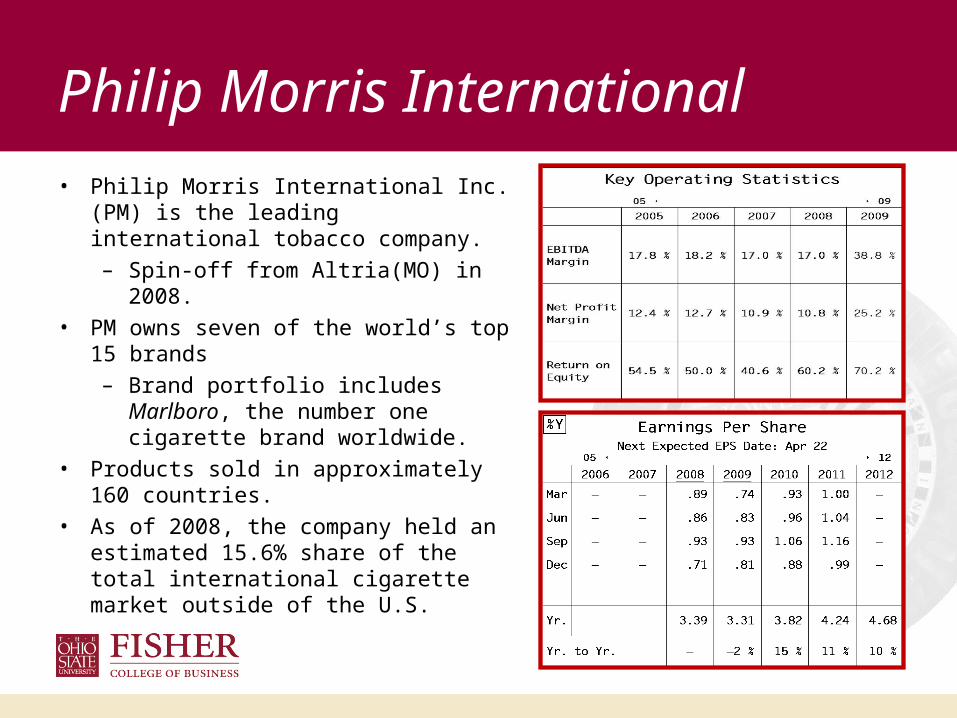
Philip Morris International• Philip Morris International Inc. (PM) is
the leading international tobacco company.
– Spin-off from Altria(MO) in 2008.
• PM owns seven of the world’s top 15 brands
– Brand portfolio includes Marlboro, the number one cigarette brand worldwide.
• Products sold in approximately 160 countries.
• As of 2008, the company held an estimated 15.6% share of the total international cigarette market outside of the U.S.
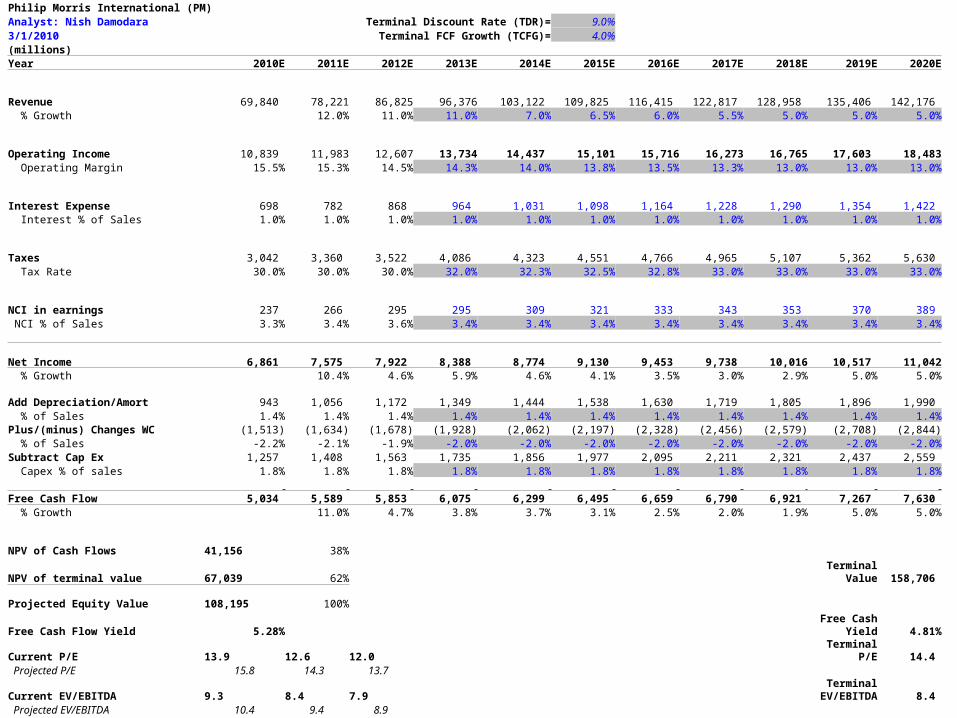
Philip Morris International (PM)Analyst: Nish Damodara Terminal Discount Rate (TDR)= 9.0%3/1/2010 Terminal FCF Growth (TCFG)= 4.0%(millions)Year 2010E 2011E 2012E 2013E 2014E 2015E 2016E 2017E 2018E 2019E 2020E
Revenue 69,840 78,221 86,825 96,376 103,122 109,825 116,415 122,817 128,958 135,406 142,176 % Growth 12.0% 11.0% 11.0% 7.0% 6.5% 6.0% 5.5% 5.0% 5.0% 5.0%
Operating Income 10,839 11,983 12,607 13,734 14,437 15,101 15,716 16,273 16,765 17,603 18,483 Operating Margin 15.5% 15.3% 14.5% 14.3% 14.0% 13.8% 13.5% 13.3% 13.0% 13.0% 13.0%
Interest Expense 698 782 868 964 1,031 1,098 1,164 1,228 1,290 1,354 1,422 Interest % of Sales 1.0% 1.0% 1.0% 1.0% 1.0% 1.0% 1.0% 1.0% 1.0% 1.0% 1.0%
Taxes 3,042 3,360 3,522 4,086 4,323 4,551 4,766 4,965 5,107 5,362 5,630 Tax Rate 30.0% 30.0% 30.0% 32.0% 32.3% 32.5% 32.8% 33.0% 33.0% 33.0% 33.0%
NCI in earnings 237 266 295 295 309 321 333 343 353 370 389 NCI % of Sales 3.3% 3.4% 3.6% 3.4% 3.4% 3.4% 3.4% 3.4% 3.4% 3.4% 3.4%
Net Income 6,861 7,575 7,922 8,388 8,774 9,130 9,453 9,738 10,016 10,517 11,042 % Growth 10.4% 4.6% 5.9% 4.6% 4.1% 3.5% 3.0% 2.9% 5.0% 5.0%
Add Depreciation/Amort 943 1,056 1,172 1,349 1,444 1,538 1,630 1,719 1,805 1,896 1,990 % of Sales 1.4% 1.4% 1.4% 1.4% 1.4% 1.4% 1.4% 1.4% 1.4% 1.4% 1.4%Plus/(minus) Changes WC (1,513) (1,634) (1,678) (1,928) (2,062) (2,197) (2,328) (2,456) (2,579) (2,708) (2,844) % of Sales -2.2% -2.1% -1.9% -2.0% -2.0% -2.0% -2.0% -2.0% -2.0% -2.0% -2.0%Subtract Cap Ex 1,257 1,408 1,563 1,735 1,856 1,977 2,095 2,211 2,321 2,437 2,559 Capex % of sales 1.8% 1.8% 1.8% 1.8% 1.8% 1.8% 1.8% 1.8% 1.8% 1.8% 1.8% Free Cash Flow 5,034 5,589 5,853 6,075 6,299 6,495 6,659 6,790 6,921 7,267 7,630 % Growth 11.0% 4.7% 3.8% 3.7% 3.1% 2.5% 2.0% 1.9% 5.0% 5.0%
NPV of Cash Flows 41,156 38%
NPV of terminal value 67,039 62%Terminal
Value 158,706 Projected Equity Value 108,195 100%
Free Cash Flow Yield 5.28%Free Cash
Yield 4.81%
Current P/E 13.9 12.6 12.0 Terminal P/E 14.4 Projected P/E 15.8 14.3 13.7
Current EV/EBITDA 9.3 8.4 7.9 Terminal
EV/EBITDA 8.4 Projected EV/EBITDA 10.4 9.4 8.9
Shares Outstanding 1,950
Current Price $ 48.93 Implied equity value/share $ 55 Upside/(Downside) to DCF 13.4%
Debt 15,416 Cash 1,540 Cash/share 0.79
Multiples
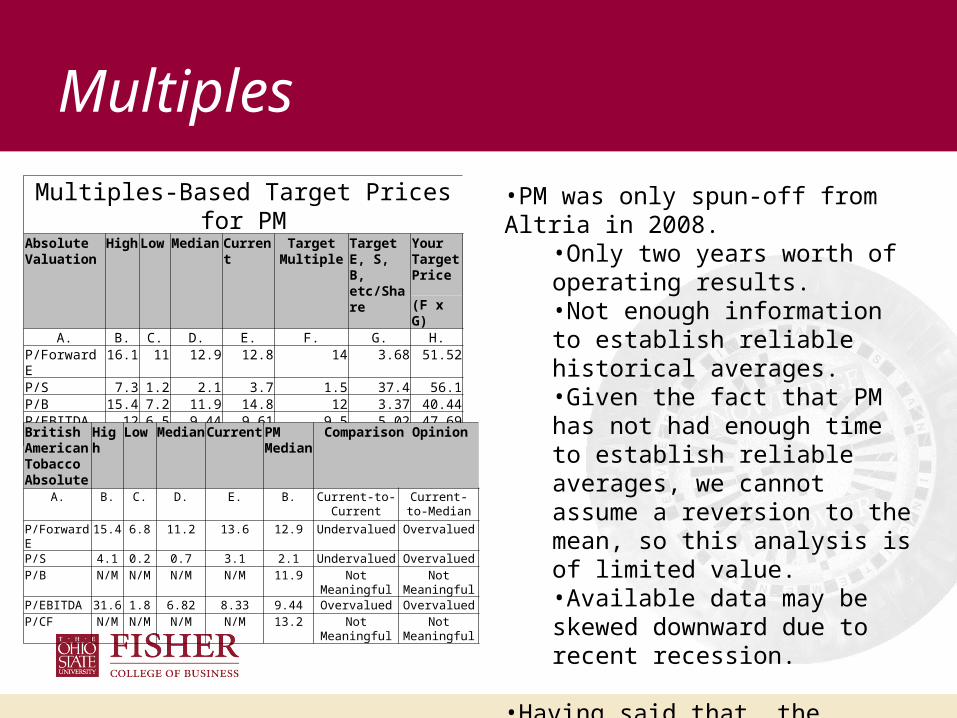
Multiples-Based Target Prices for PMAbsolute Valuation
High Low Median Current Target Multiple
Target E, S, B, etc/Share
Your Target Price
(F x G)A. B. C. D. E. F. G. H.
P/Forward E 16.1 11 12.9 12.8 14 3.68 51.52P/S 7.3 1.2 2.1 3.7 1.5 37.4 56.1P/B 15.4 7.2 11.9 14.8 12 3.37 40.44P/EBITDA 12 6.5 9.44 9.61 9.5 5.02 47.69P/CF 117 8.8 13.2 13.1 13 3.7 48.1
British American Tobacco Absolute
High Low Median Current PM Median
Comparison Opinion
A. B. C. D. E. B. Current-to-Current
Current-to-Median
P/Forward E 15.4 6.8 11.2 13.6 12.9 Undervalued Overvalued
P/S 4.1 0.2 0.7 3.1 2.1 Undervalued Overvalued
P/B N/M N/M N/M N/M 11.9 Not Meaningful Not Meaningful
P/EBITDA 31.6 1.8 6.82 8.33 9.44 Overvalued OvervaluedP/CF N/M N/M N/M N/M 13.2 Not Meaningful Not Meaningful
•PM was only spun-off from Altria in 2008.
•Only two years worth of operating results.•Not enough information to establish reliable historical averages.•Given the fact that PM has not had enough time to establish reliable averages, we cannot assume a reversion to the mean, so this analysis is of limited value.•Available data may be skewed downward due to recent recession.
•Having said that, the available data, which reflects operating results during the downturn in 2008 and 2009, generally supports the DCF price target.
PM Valuation
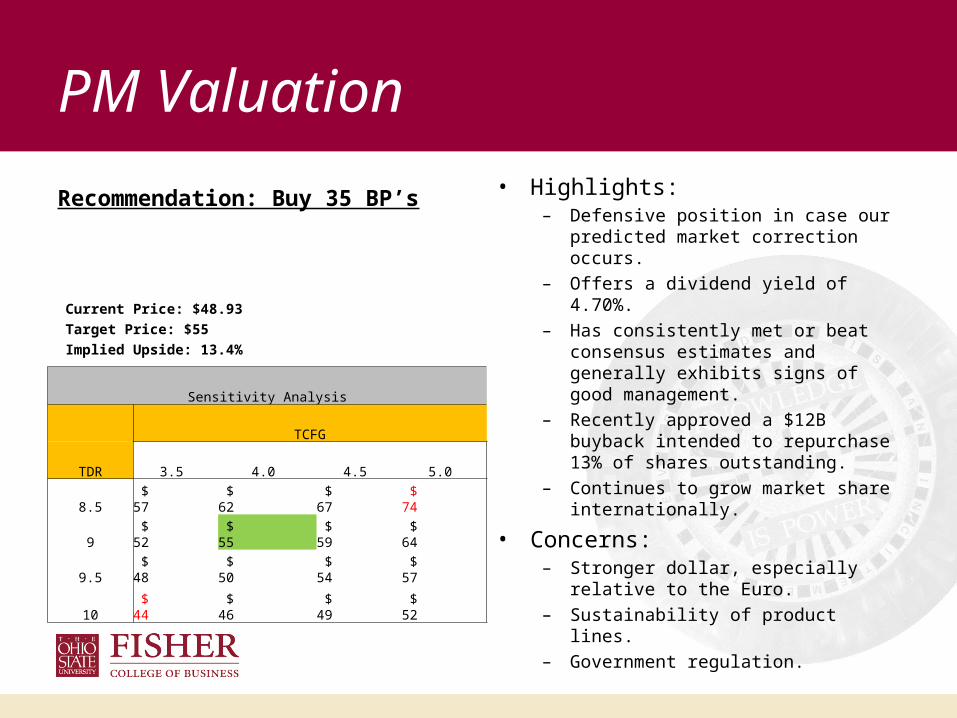
Recommendation: Buy 35 BP’s
Sensitivity Analysis
TCFG
TDR 3.5 4.0 4.5 5.0
8.5 $ 57 $ 62 $ 67 $ 74
9 $ 52 $ 55 $ 59 $ 64
9.5 $ 48 $ 50 $ 54 $ 57
10 $ 44 $ 46 $ 49 $ 52
Current Price: $48.93
Target Price: $55
Implied Upside: 13.4%
• Highlights:– Defensive position in case our predicted
market correction occurs.
– Offers a dividend yield of 4.70%.
– Has consistently met or beat consensus estimates and generally exhibits signs of good management.
– Recently approved a $12B buyback intended to repurchase 13% of shares outstanding.
– Continues to grow market share internationally.
• Concerns:– Stronger dollar, especially relative to the
Euro.
– Sustainability of product lines.
– Government regulation.
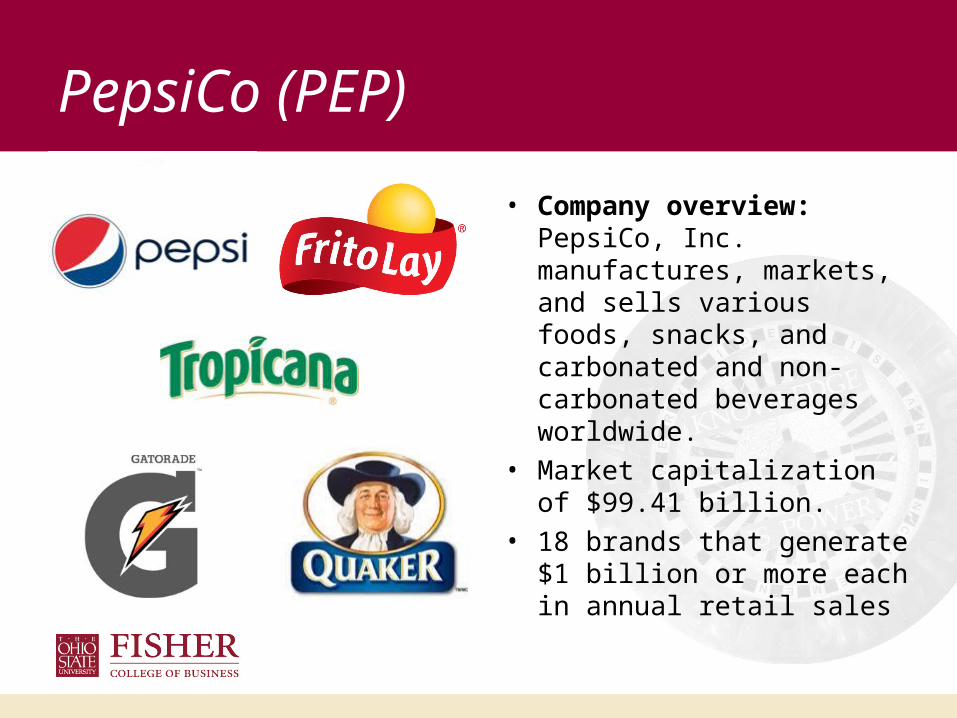
PepsiCo (PEP)
• Company overview: PepsiCo, Inc. manufactures, markets, and sells various foods, snacks, and carbonated and non-carbonated beverages worldwide.
• Market capitalization of $99.41 billion.
• 18 brands that generate $1 billion or more each in annual retail sales
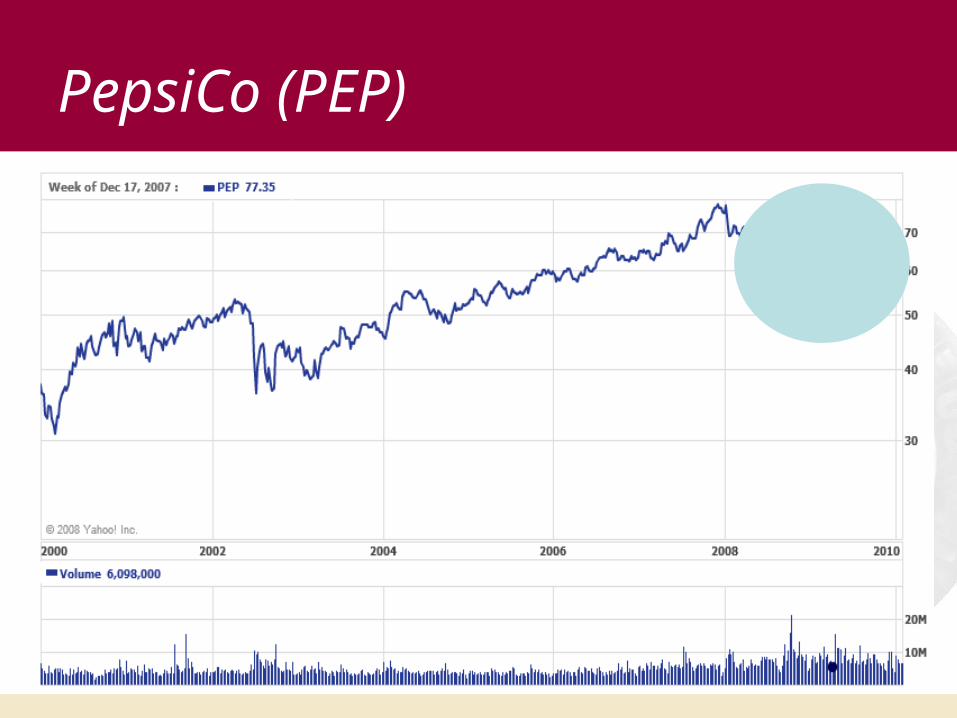
PepsiCo (PEP)
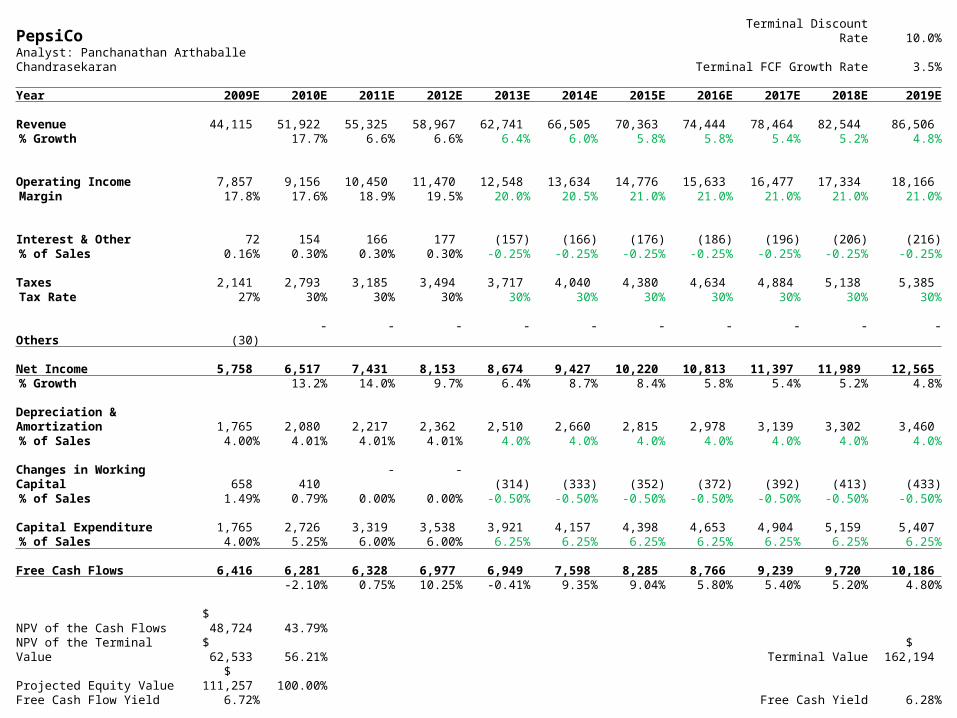
PepsiCo Terminal Discount Rate 10.0%Analyst: Panchanathan Arthaballe Chandrasekaran Terminal FCF Growth Rate 3.5%
Year 2009E 2010E 2011E 2012E 2013E 2014E 2015E 2016E 2017E 2018E 2019ERevenue 44,115 51,922 55,325 58,967 62,741 66,505 70,363 74,444 78,464 82,544 86,506 % Growth 17.7% 6.6% 6.6% 6.4% 6.0% 5.8% 5.8% 5.4% 5.2% 4.8%
Operating Income 7,857 9,156 10,450 11,470 12,548 13,634 14,776 15,633 16,477 17,334 18,166 Margin 17.8% 17.6% 18.9% 19.5% 20.0% 20.5% 21.0% 21.0% 21.0% 21.0% 21.0%
Interest & Other 72 154 166 177 (157) (166) (176) (186) (196) (206) (216)% of Sales 0.16% 0.30% 0.30% 0.30% -0.25% -0.25% -0.25% -0.25% -0.25% -0.25% -0.25%
Taxes 2,141 2,793 3,185 3,494 3,717 4,040 4,380 4,634 4,884 5,138 5,385 Tax Rate 27% 30% 30% 30% 30% 30% 30% 30% 30% 30% 30%
Others (30) - - - - - - - - - - Net Income 5,758 6,517 7,431 8,153 8,674 9,427 10,220 10,813 11,397 11,989 12,565 % Growth 13.2% 14.0% 9.7% 6.4% 8.7% 8.4% 5.8% 5.4% 5.2% 4.8%
Depreciation & Amortization 1,765 2,080 2,217 2,362 2,510 2,660 2,815 2,978 3,139 3,302 3,460 % of Sales 4.00% 4.01% 4.01% 4.01% 4.0% 4.0% 4.0% 4.0% 4.0% 4.0% 4.0%
Changes in Working Capital 658 410 - - (314) (333) (352) (372) (392) (413) (433)% of Sales 1.49% 0.79% 0.00% 0.00% -0.50% -0.50% -0.50% -0.50% -0.50% -0.50% -0.50%
Capital Expenditure 1,765 2,726 3,319 3,538 3,921 4,157 4,398 4,653 4,904 5,159 5,407 % of Sales 4.00% 5.25% 6.00% 6.00% 6.25% 6.25% 6.25% 6.25% 6.25% 6.25% 6.25%
Free Cash Flows 6,416 6,281 6,328 6,977 6,949 7,598 8,285 8,766 9,239 9,720 10,186 -2.10% 0.75% 10.25% -0.41% 9.35% 9.04% 5.80% 5.40% 5.20% 4.80%
NPV of the Cash Flows $ 48,724 43.79%NPV of the Terminal Value $ 62,533 56.21% Terminal Value $ 162,194 Projected Equity Value $ 111,257 100.00%Free Cash Flow Yield 6.72% Free Cash Yield 6.28%
Current P/E 16.58 14.65 12.84 11.71 Terminal P/E 12.91 Projected P/E 19.32 17.07 14.97 13.65
Current EV/EBITDA 10.36 8.87 7.87 7.20 Terminal EV/EBIDTA 7.69 Projected EV/EBITDA 12.00 10.27 9.11 8.35
Shares Oustanding 1,573
Current Price $ 63.44 Implied Equity Price $ 70.73 Upside(Downside) to DCF 12%
Debt 7,434 Cash 3,254
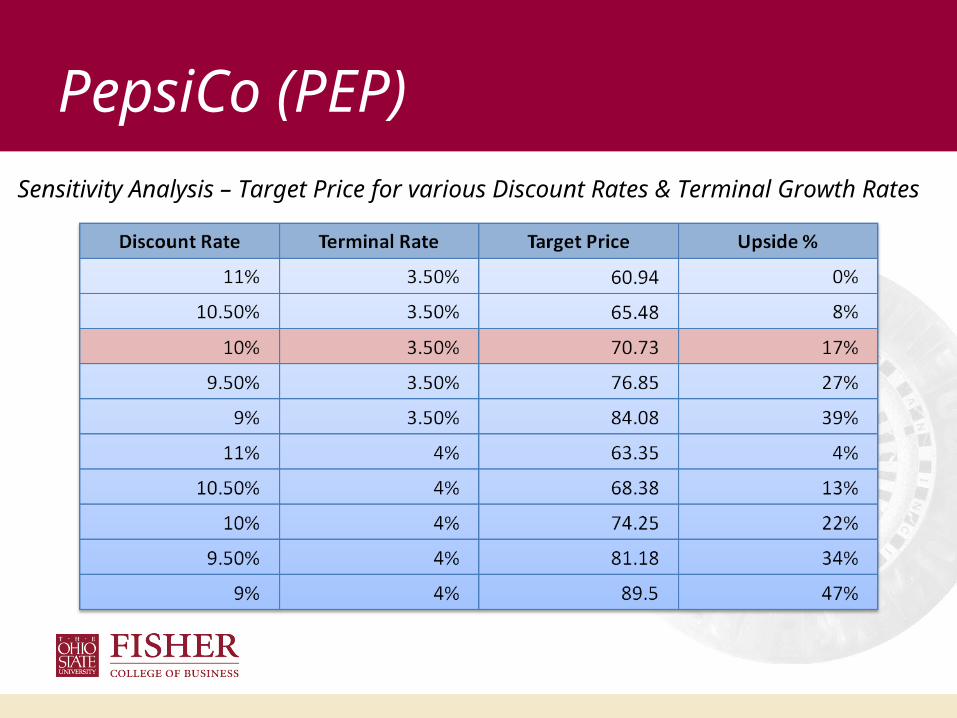
PepsiCo (PEP)
Sensitivity Analysis – Target Price for various Discount Rates & Terminal Growth Rates
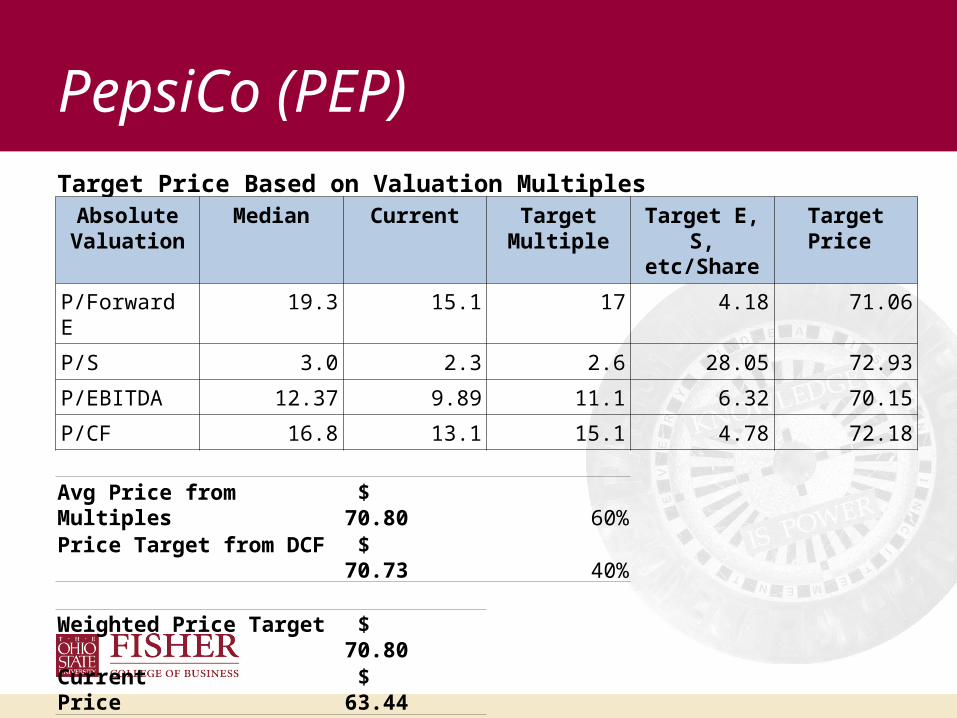
PepsiCo (PEP)Target Price Based on Valuation Multiples
Absolute Valuation
Median Current Target Multiple
Target E, S, etc/Share
Target Price
P/Forward E 19.3 15.1 17 4.18 71.06
P/S 3.0 2.3 2.6 28.05 72.93
P/EBITDA 12.37 9.89 11.1 6.32 70.15
P/CF 16.8 13.1 15.1 4.78 72.18
Avg Price from Multiples $ 70.80 60%Price Target from DCF $ 70.73 40%
Weighted Price Target $ 70.80 Current Price $ 63.44
Upside Potential 12%
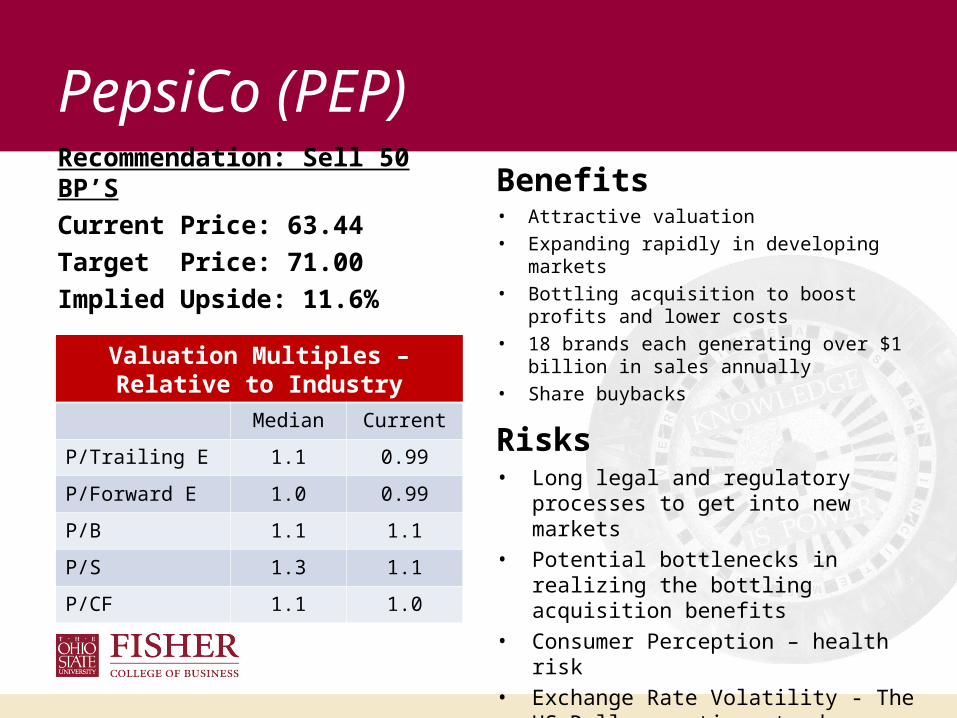
PepsiCo (PEP)Recommendation: Sell 50 BP’S
Current Price: 63.44
Target Price: 71.00
Implied Upside: 11.6%
Benefits• Attractive valuation• Expanding rapidly in developing markets• Bottling acquisition to boost profits and
lower costs• 18 brands each generating over $1 billion
in sales annually• Share buybacks
Risks• Long legal and regulatory processes to get
into new markets• Potential bottlenecks in realizing the bottling
acquisition benefits• Consumer Perception – health risk• Exchange Rate Volatility - The US Dollar
continue to decrease in value relative to currencies of emerging markets
Valuation Multiples – Relative to Industry
Median Current
P/Trailing E 1.1 0.99
P/Forward E 1.0 0.99
P/B 1.1 1.1
P/S 1.3 1.1
P/CF 1.1 1.0
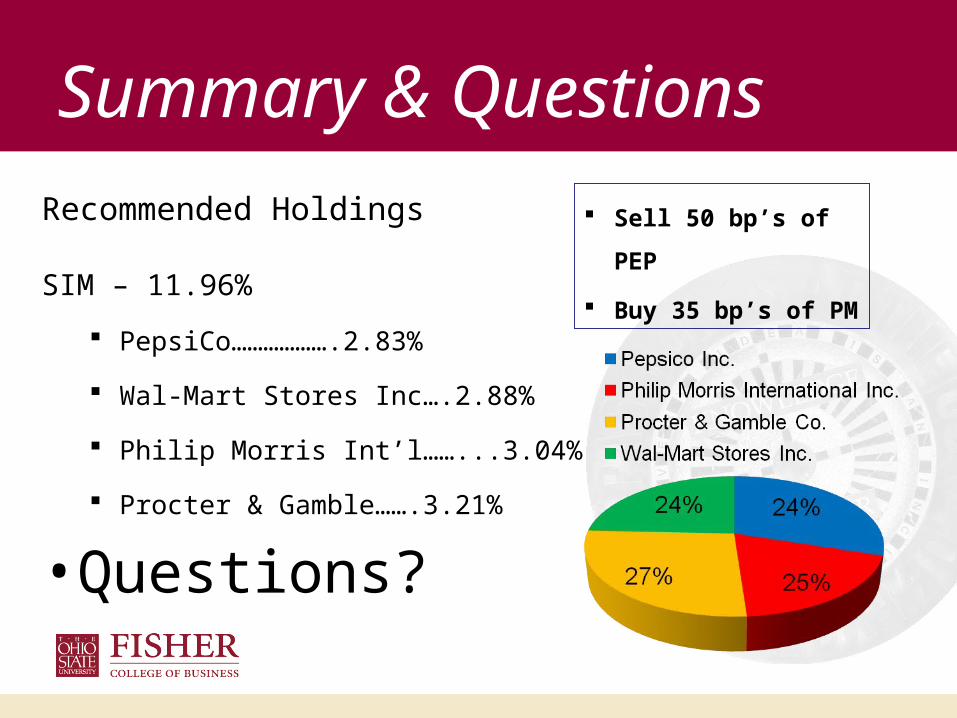
Summary & QuestionsRecommended Holdings
SIM – 11.96%
PepsiCo……………….2.83%
Wal-Mart Stores Inc….2.88%
Philip Morris Int’l……...3.04%
Procter & Gamble…….3.21%
• Questions?
Sell 50 bp’s of PEP
Buy 35 bp’s of PM
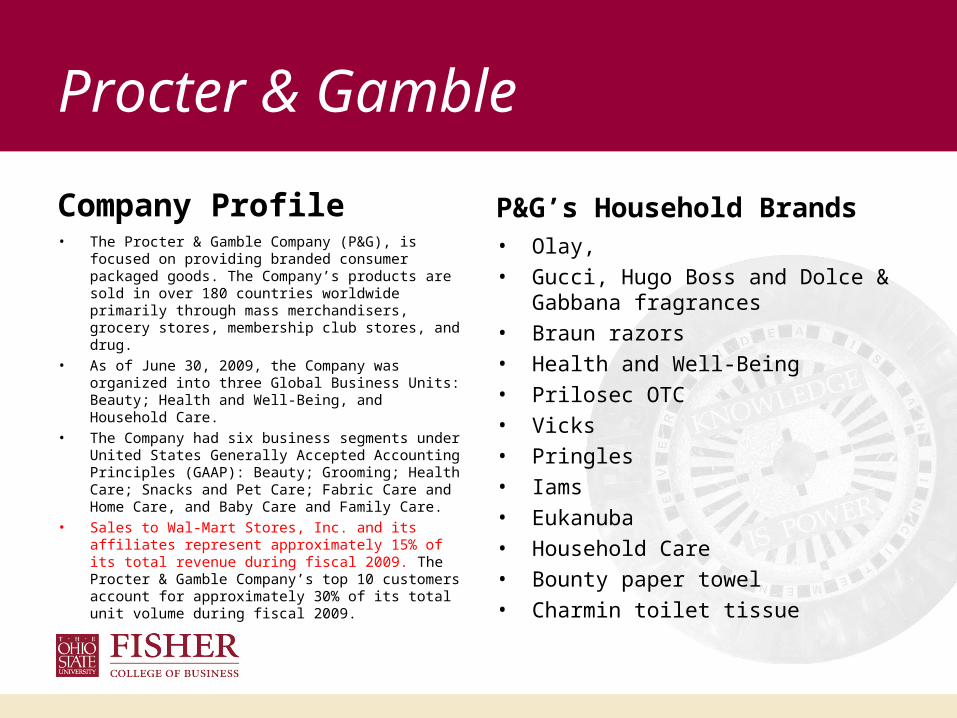
Procter & Gamble
Company Profile• The Procter & Gamble Company (P&G), is focused
on providing branded consumer packaged goods. The Company’s products are sold in over 180 countries worldwide primarily through mass merchandisers, grocery stores, membership club stores, and drug.
• As of June 30, 2009, the Company was organized into three Global Business Units: Beauty; Health and Well-Being, and Household Care.
• The Company had six business segments under United States Generally Accepted Accounting Principles (GAAP): Beauty; Grooming; Health Care; Snacks and Pet Care; Fabric Care and Home Care, and Baby Care and Family Care.
• Sales to Wal-Mart Stores, Inc. and its affiliates represent approximately 15% of its total revenue during fiscal 2009. The Procter & Gamble Company’s top 10 customers account for approximately 30% of its total unit volume during fiscal 2009.
P&G’s Household Brands• Olay, • Gucci, Hugo Boss and Dolce &
Gabbana fragrances• Braun razors• Health and Well-Being • Prilosec OTC • Vicks• Pringles• Iams • Eukanuba• Household Care• Bounty paper towel• Charmin toilet tissue
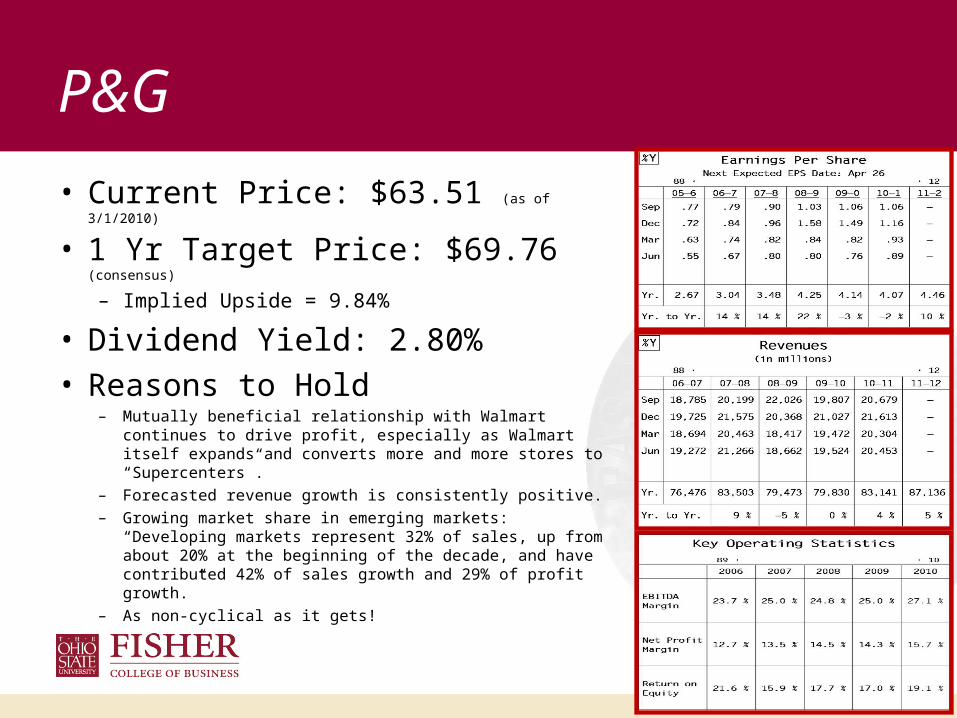
P&G
• Current Price: $63.51 (as of 3/1/2010)
• 1 Yr Target Price: $69.76 (consensus)
– Implied Upside = 9.84%
• Dividend Yield: 2.80%• Reasons to Hold
– Mutually beneficial relationship with Walmart continues to drive profit, especially as Walmart itself expands and converts more and more stores to “Supercenters”.
– Forecasted revenue growth is consistently positive.
– Growing market share in emerging markets: “Developing markets represent 32% of sales, up from about 20% at the beginning of the decade, and have contributed 42% of sales growth and 29% of profit growth.”
– As non-cyclical as it gets!
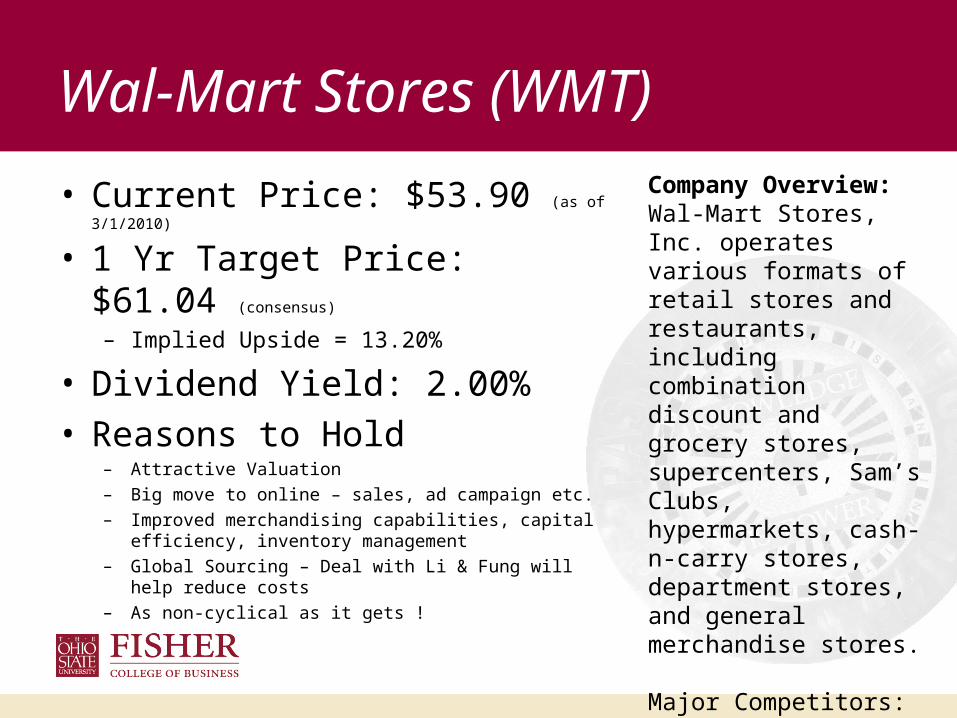
Wal-Mart Stores (WMT)
• Current Price: $53.90 (as of 3/1/2010)
• 1 Yr Target Price: $61.04 (consensus)
– Implied Upside = 13.20%
• Dividend Yield: 2.00%• Reasons to Hold
– Attractive Valuation
– Big move to online – sales, ad campaign etc.
– Improved merchandising capabilities, capital efficiency, inventory management
– Global Sourcing – Deal with Li & Fung will help reduce costs
– As non-cyclical as it gets !
Company Overview:Wal-Mart Stores, Inc. operates various formats of retail stores and restaurants, including combination discount and grocery stores, supercenters, Sam’s Clubs, hypermarkets, cash-n-carry stores, department stores, and general merchandise stores.
Major Competitors: Costco and Target
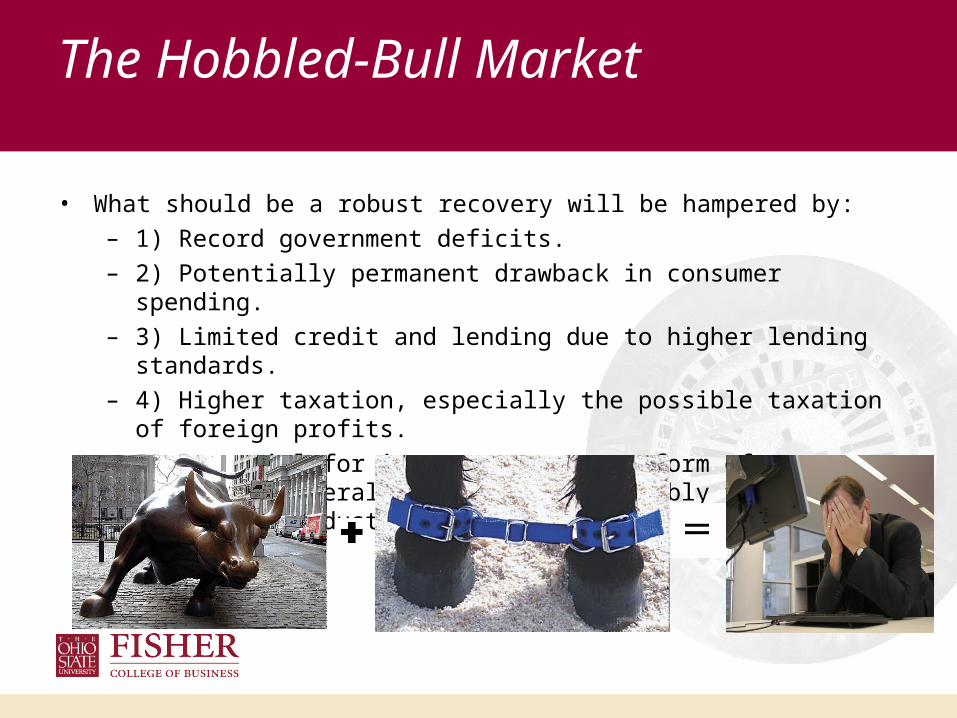
The Hobbled-Bull Market
• What should be a robust recovery will be hampered by:
– 1) Record government deficits.
– 2) Potentially permanent drawback in consumer spending.
– 3) Limited credit and lending due to higher lending standards.
– 4) Higher taxation, especially the possible taxation of foreign profits.
– 5) Potential for inept government reform of sectors crucial to overall economy- most notably the healthcare industry.