Embed Size (px)
Citation preview

Criteria Used for AnalysisIncome:Median Household Income
Age:Median Age
Population Stats:Total Population
Segmentation:1st Dominant Segment
$52,081 33.1 26,032 Up and Coming FamiliesTotal dollars:$52,081 out of $8,368
Total years:33.1 out of 26,032.0
Consumer SegmentationLife Mode UrbanizationWhat are thepeople like thatlive in this area?
Ethnic EnclavesEstablished diversity--young, Hispanic homeownerswith families
Where do peoplelike this usuallylive?
Suburban PeripheryAffluence in the suburbs, married couple-families,longer commutes
Top TapestrySegments
Up and ComingFamilies Middleburg Down the Road Urban Families
AmericanDreamers
% of Households 3,514 (42.0%) 1,593 (19.0%) 1,298 (15.5%) 722 (8.6%) 663 (7.9%)
% of Hillsborough County 43,364 (8.0%) 6,198 (1.1%) 17,726 (3.3%) 4,747 (0.9%) 26,182 (4.9%)
Lifestyle Group Ethnic Enclaves Family Landscapes Rustic Outposts Ethnic Enclaves Ethnic Enclaves
Urbanization Group Suburban Periphery Semirural Semirural Urban Periphery Urban Periphery
Residence Type Single Family Single Family Mobile Homes Single Family Single Family
Household Type Married Couples Married Couples Married Couples Married Couples Married Couples
Average Household Size 3.1 2.73 2.74 3.59 3.16
Median Age 30.7 35.3 34.3 28.3 31.8
Diversity Index 72.4 46.3 70.5 80.3 83.3
Median Household Income $64,000 $55,000 $36,000 $36,000 $48,000
Median Net Worth $96,000 $89,000 $30,000 $22,000 $53,000
Median Home Value $174,000 $158,000 $104,000 $92,000 $130,000
Homeownership 74.1 % 74.3 % 66.4 % 60.9 % 65 %
Employment Professional orServices
Professional orServices
Services orAdministration
Services Services orAdministration
Education College Degree College Degree High School Graduate No High SchoolDiploma
High School Graduate
Preferred Activities Visit theme parks,zoos. Contract forhome and landscapingservices.
Buy children's toys andclothes. Go hunting,bowling, targetshooting.
Visit chat rooms; playgames online. Gohunting, fishing.
Buy discount forchildren'sproducts. Readmagazines.
Own feature-rich cellphones. Pay bills,socialize online.
Financial Hold student loans,mortgages
Carry some debt;invest for future
Prefer convenience offrozen meals, fast food
Own no retirementsavings
Spend moneycarefully; buynecessities
Media Go online to shop,bank, forentertainment
Watch country,Christian TV channels
Watch Animal Planeton satellite TV
Listen to Hispanicradio
Listen to urban orHispanic radio
Vehicle Own late-modelcompact car, SUV
Own trucks, SUVs Bought used vehiclelast year
Own 1-2 vehicles;carpool
One or two vehicles
Ruskin, Florida
Copyright 2019 Realtors Property Resource® LLC. All Rights Reserved. Information is not guaranteed. Equal Housing Opportunity. 7/1/2019

Who We AreUp and Coming Families is a market intransition--residents are younger andmore mobile and ethnically diverse thanthe previous generation. They areambitious, working hard to get ahead, andwilling to take some risks to achieve theirgoals. The recession has impacted theirfinancial well-being, but they areoptimistic. Their homes are new; theirfamilies are young. And this is one of thefastest-growing markets in the country.
Our NeighborhoodNew suburban periphery: new families in newhousing subdivisions.Building began in the housing boom of the2000s and continues in this fast-growingmarket.Single-family homes with a median value of$174,000 and a lower vacancy rate.The price of affordable housing: longercommute times.
Socioeconomic TraitsEducation: 66% have some college educationor degree(s).Hard-working labor force with a participationrate of 71% and low unemployment at 7%.Most households (63%) have two or moreworkers.Careful shoppers, aware of prices, willing toshop around for the best deals and open toinfluence by others' opinions.Seek the latest and best in technology.Young families still feathering the nest andestablishing their style.
Market ProfileRely on the Internet for entertainment,information, shopping and banking.Prefer imported SUVs or compact cars, latemodels.Carry debt from credit card balances to studentloans and mortgages, but also maintainretirement plans and make charitablecontributions.Busy with work and family; use home andlandscaping services to save time.Find leisure in family activities, movies athome, trips to theme parks or the zoo, andsports, from backpacking and baseball toweight lifting and yoga.
An overview of who makes up this segment across the United States
The demographic segmentation shown here can help you understand the lifestyles and life stages of consumers in a market. Data provider Esri classifiesU.S. residential neighborhoods into 67 unique market segments based on socioeconomic and demographic characteristics. Data Source: Esri 2018. UpdateFrequency: Annually.
This is the
#1dominant segmentfor this area
In this area
42.0%of households fallinto this segment
In the United States
2.4%of households fallinto this segment
About this segment
Up and Coming Families
Ruskin, Florida
Copyright 2019 Realtors Property Resource® LLC. All Rights Reserved. Information is not guaranteed. Equal Housing Opportunity. 7/1/2019

Who We AreMiddleburg neighborhoods transformedfrom the easy pace of country living tosemi-rural subdivisions in the lastdecade, when the housing boom reachedout. Residents are conservative, family-oriented consumers. Still more countrythan rock and roll, they are thrifty but willingto carry some debt and are alreadyinvesting in their futures. They rely on theirsmartphones and mobile devices to stayin touch and pride themselves on theirexpertise. They prefer to buy American andtravel in the U.S. This market is youngerbut growing in size and assets.
Our NeighborhoodSemi-rural locales within metropolitan areas.Neighborhoods changed rapidly in theprevious decade with the addition of newsingle-family homes.Include a number of mobile homes.Affordable housing, median value of $158,000with a low vacancy rate.Young couples, many with children; averagehousehold size is 2.73.
Socioeconomic TraitsEducation: 66% with a high school diploma orsome college.Unemployment rate lower at 7.4%.Labor force participation typical of a youngerpopulation at 66.7%.Traditional values are the norm here--faith,country and family.Prefer to buy American and for a good price.Comfortable with the latest in technology, forconvenience (online banking or saving moneyon landlines) and entertainment.
Market ProfileResidents are partial to trucks, SUVs, andoccasionally, convertibles or motorcycles.Entertainment is primarily family-oriented, TVand movie rentals or theme parks and familyrestaurants.Spending priorities also focus on family(children's toys and apparel) or home DIYprojects.Sports include hunting, target shooting,bowling and baseball.TV and magazines provide entertainment andinformation.Media preferences include country andChristian channels.
An overview of who makes up this segment across the United States
The demographic segmentation shown here can help you understand the lifestyles and life stages of consumers in a market. Data provider Esri classifiesU.S. residential neighborhoods into 67 unique market segments based on socioeconomic and demographic characteristics. Data Source: Esri 2018. UpdateFrequency: Annually.
This is the
#2dominant segmentfor this area
In this area
19.0%of households fallinto this segment
In the United States
2.9%of households fallinto this segment
About this segment
Middleburg
Ruskin, Florida
Copyright 2019 Realtors Property Resource® LLC. All Rights Reserved. Information is not guaranteed. Equal Housing Opportunity. 7/1/2019

Who We AreDown the Road is a mix of low-density,semi-rural neighborhoods in largemetropolitan areas; half are located in theSouth, with the rest chiefly in the West andMidwest. Almost half of householders livein mobile homes; approximately two-fifthslive in single-family homes. These areyounger, diverse communities, with thehighest proportion of American Indians ofany segment. These family-orientedconsumers value their traditions. Workersare in service, retail trade, manufacturingand construction industries, with higherproportions in agriculture and mining,compared to the U.S. in general. Thismarket has higher unemployment, muchlower median household income andhome value, and a fifth of households withincome below poverty level.
Our NeighborhoodTwo-thirds of households are owned.Family market, primarily married couples orsingle-parent households.Close to half of all households live in mobilehomes.Four-fifths of households were built in 1970 orlater.About 18% of owned homes are valued under$50,000 (more than three times the U.S.percentage).
Socioeconomic TraitsEducation completed: 37% with a high schooldiploma only, 38% with some collegeeducation or a degree.Unemployment rate is 11.6%, higher than theU.S. rate.Labor force participation rate is 59.6%, slightlylower than the U.S.Family-oriented, outgoing consumers; theyplace importance on preserving time-honoredcustoms.They put a premium on convenience ratherthan health and nutrition.
Market ProfilePurchased a used vehicle in the past year,likely maintaining the vehicle themselves.Routinely stop by the convenience store topurchase a lottery ticket.Participate in fishing and hunting.Visit chat rooms and play games online.Listen to the radio, especially at work, with apreference for rap, R&B and hip-hop music.Enjoy programs on Animal Planet, typicallywatching via satellite dish.Often prepare quick meals, using packaged orfrozen dinner entrees.Favorite fast food: pizza.Frequent Walmart for all their shopping needs(groceries, clothing, pharmacy, etc.).
An overview of who makes up this segment across the United States
The demographic segmentation shown here can help you understand the lifestyles and life stages of consumers in a market. Data provider Esri classifiesU.S. residential neighborhoods into 67 unique market segments based on socioeconomic and demographic characteristics. Data Source: Esri 2018. UpdateFrequency: Annually.
This is the
#3dominant segmentfor this area
In this area
15.5%of households fallinto this segment
In the United States
1.1%of households fallinto this segment
About this segment
Down the Road
Ruskin, Florida
Copyright 2019 Realtors Property Resource® LLC. All Rights Reserved. Information is not guaranteed. Equal Housing Opportunity. 7/1/2019

Who We AreFamily is central within these diversecommunities. Hispanics make up morethan 70 percent of the residents. Morethan one in four are foreign born, bringingrich cultural traditions to theseneighborhoods in the urban outskirts.Dominating this market are youngerfamilies with children or single-parenthouseholds with multiple generationsliving under the same roof. Thesehouseholds balance their budgetscarefully but also indulge in the latesttrends and purchase with an eye tobrands. Most workers are employed inskilled positions across themanufacturing, construction or retail tradesectors.
Our NeighborhoodFamily market; over a third of all householdsare married couples with children, with anumber of multigenerational households andsingle-parent families; household size is higherthan U.S. average at 3.59.While most residents live in single-familyhomes, almost 10% of householders reside inmobile home parks.Homes are owner occupied, with slightly highermonthly costs but fewer mortgages.Most are older homes, more than 60% builtfrom 1950 to 1989.Most households have one or two vehicles;many commuters car pool or walk to work.Urban Family residents live within the urbanperiphery of larger metropolitan areas acrossthe South and West.
Socioeconomic TraitsWhile a majority finished high school, over40% have not.Unemployment is higher at 12% (Index 135);labor force participation is slightly lower at61%.Nearly one in four households is below thepoverty level.Residents balance their budgets carefully byspending only on necessities and limitingactivities like dining out.Many have no financial investments orretirement savings, but they have their homes.
Market ProfileResidents shop at discount department storesfor baby and children's products.Many households subscribe to satellitetelevision to watch their favorite Hispanicprograms.Magazines are extremely popular sources ofnews and the latest trends, including baby,bridal and parenthood types of magazines.Typical of this diverse segment, Hispanicprogramming dominates the radio dials.
An overview of who makes up this segment across the United States
The demographic segmentation shown here can help you understand the lifestyles and life stages of consumers in a market. Data provider Esri classifiesU.S. residential neighborhoods into 67 unique market segments based on socioeconomic and demographic characteristics. Data Source: Esri 2018. UpdateFrequency: Annually.
This is the
#4dominant segmentfor this area
In this area
8.6%of households fallinto this segment
In the United States
1.0%of households fallinto this segment
About this segment
Urban Families
Ruskin, Florida
Copyright 2019 Realtors Property Resource® LLC. All Rights Reserved. Information is not guaranteed. Equal Housing Opportunity. 7/1/2019
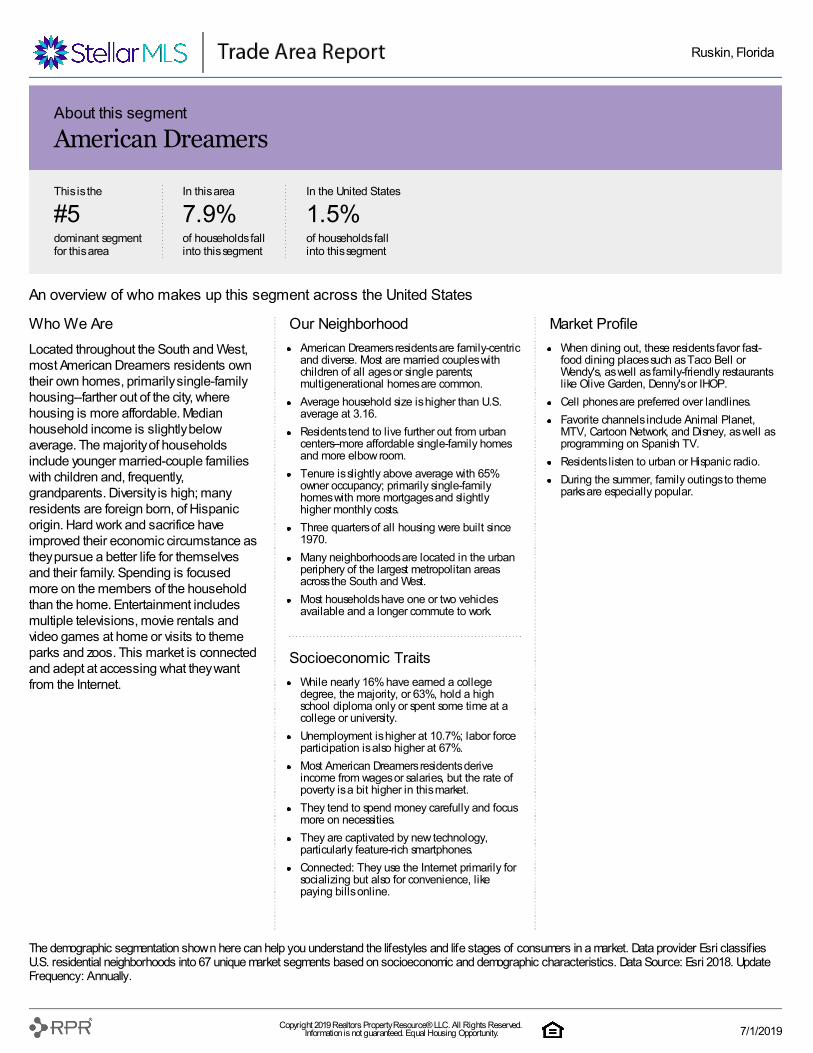
Who We AreLocated throughout the South and West,most American Dreamers residents owntheir own homes, primarily single-familyhousing--farther out of the city, wherehousing is more affordable. Medianhousehold income is slightly belowaverage. The majority of householdsinclude younger married-couple familieswith children and, frequently,grandparents. Diversity is high; manyresidents are foreign born, of Hispanicorigin. Hard work and sacrifice haveimproved their economic circumstance asthey pursue a better life for themselvesand their family. Spending is focusedmore on the members of the householdthan the home. Entertainment includesmultiple televisions, movie rentals andvideo games at home or visits to themeparks and zoos. This market is connectedand adept at accessing what they wantfrom the Internet.
Our NeighborhoodAmerican Dreamers residents are family-centricand diverse. Most are married couples withchildren of all ages or single parents;multigenerational homes are common.Average household size is higher than U.S.average at 3.16.Residents tend to live further out from urbancenters--more affordable single-family homesand more elbow room.Tenure is slightly above average with 65%owner occupancy; primarily single-familyhomes with more mortgages and slightlyhigher monthly costs.Three quarters of all housing were built since1970.Many neighborhoods are located in the urbanperiphery of the largest metropolitan areasacross the South and West.Most households have one or two vehiclesavailable and a longer commute to work.
Socioeconomic TraitsWhile nearly 16% have earned a collegedegree, the majority, or 63%, hold a highschool diploma only or spent some time at acollege or university.Unemployment is higher at 10.7%; labor forceparticipation is also higher at 67%.Most American Dreamers residents deriveincome from wages or salaries, but the rate ofpoverty is a bit higher in this market.They tend to spend money carefully and focusmore on necessities.They are captivated by new technology,particularly feature-rich smartphones.Connected: They use the Internet primarily forsocializing but also for convenience, likepaying bills online.
Market ProfileWhen dining out, these residents favor fast-food dining places such as Taco Bell orWendy's, as well as family-friendly restaurantslike Olive Garden, Denny's or IHOP.Cell phones are preferred over landlines.Favorite channels include Animal Planet,MTV, Cartoon Network, and Disney, as well asprogramming on Spanish TV.Residents listen to urban or Hispanic radio.During the summer, family outings to themeparks are especially popular.
An overview of who makes up this segment across the United States
The demographic segmentation shown here can help you understand the lifestyles and life stages of consumers in a market. Data provider Esri classifiesU.S. residential neighborhoods into 67 unique market segments based on socioeconomic and demographic characteristics. Data Source: Esri 2018. UpdateFrequency: Annually.
This is the
#5dominant segmentfor this area
In this area
7.9%of households fallinto this segment
In the United States
1.5%of households fallinto this segment
About this segment
American Dreamers
Ruskin, Florida
Copyright 2019 Realtors Property Resource® LLC. All Rights Reserved. Information is not guaranteed. Equal Housing Opportunity. 7/1/2019

20182023 (Projected)
Total PopulationThis chart shows the total population inan area, compared with othergeographies.Data Source: U.S. Census AmericanCommunity Survey via Esri, 2018Update Frequency: Annually
20182023 (Projected)
Population DensityThis chart shows the number of peopleper square mile in an area, comparedwith other geographies.Data Source: U.S. Census AmericanCommunity Survey via Esri, 2018Update Frequency: Annually
20182023 (Projected)
Population Change Since 2010This chart shows the percentage changein area's population from 2010 to 2018,compared with other geographies.Data Source: U.S. Census AmericanCommunity Survey via Esri, 2018Update Frequency: Annually
Ruskin
Total Daytime PopulationThis chart shows the number of peoplewho are present in an area during normalbusiness hours, including workers, andcompares that population to othergeographies. Daytime population is incontrast to the "resident" populationpresent during evening and nighttimehours.Data Source: U.S. Census AmericanCommunity Survey via Esri, 2018Update Frequency: Annually
Ruskin, Florida: Population ComparisonRuskin
Ruskin
Ruskin
Ruskin
Ruskin, Florida
Copyright 2019 Realtors Property Resource® LLC. All Rights Reserved. Information is not guaranteed. Equal Housing Opportunity. 7/1/2019

Ruskin
Daytime Population DensityThis chart shows the number people whoare present in an area during normalbusiness hours, including workers, persquare mile in an area, compared withother geographies. Daytime population isin contrast to the "resident" populationpresent during evening and nighttimehours.Data Source: U.S. Census AmericanCommunity Survey via Esri, 2018Update Frequency: Annually
20182023 (Projected)
Average Household SizeThis chart shows the average householdsize in an area, compared with othergeographies.Data Source: U.S. Census AmericanCommunity Survey via Esri, 2018Update Frequency: Annually
20182023 (Projected)
Population Living in FamilyHouseholdsThis chart shows the percentage of anarea’s population that lives in ahousehold with one or more individualsrelated by birth, marriage or adoption,compared with other geographies.Data Source: U.S. Census AmericanCommunity Survey via Esri, 2018Update Frequency: Annually
Women 2018Men 2018Women 2023 (Projected)Men 2023 (Projected)
Female / Male RatioThis chart shows the ratio of females tomales in an area, compared with othergeographies.Data Source: U.S. Census AmericanCommunity Survey via Esri, 2018Update Frequency: Annually
Ruskin
Ruskin
Ruskin
Ruskin
Ruskin, Florida
Copyright 2019 Realtors Property Resource® LLC. All Rights Reserved. Information is not guaranteed. Equal Housing Opportunity. 7/1/2019
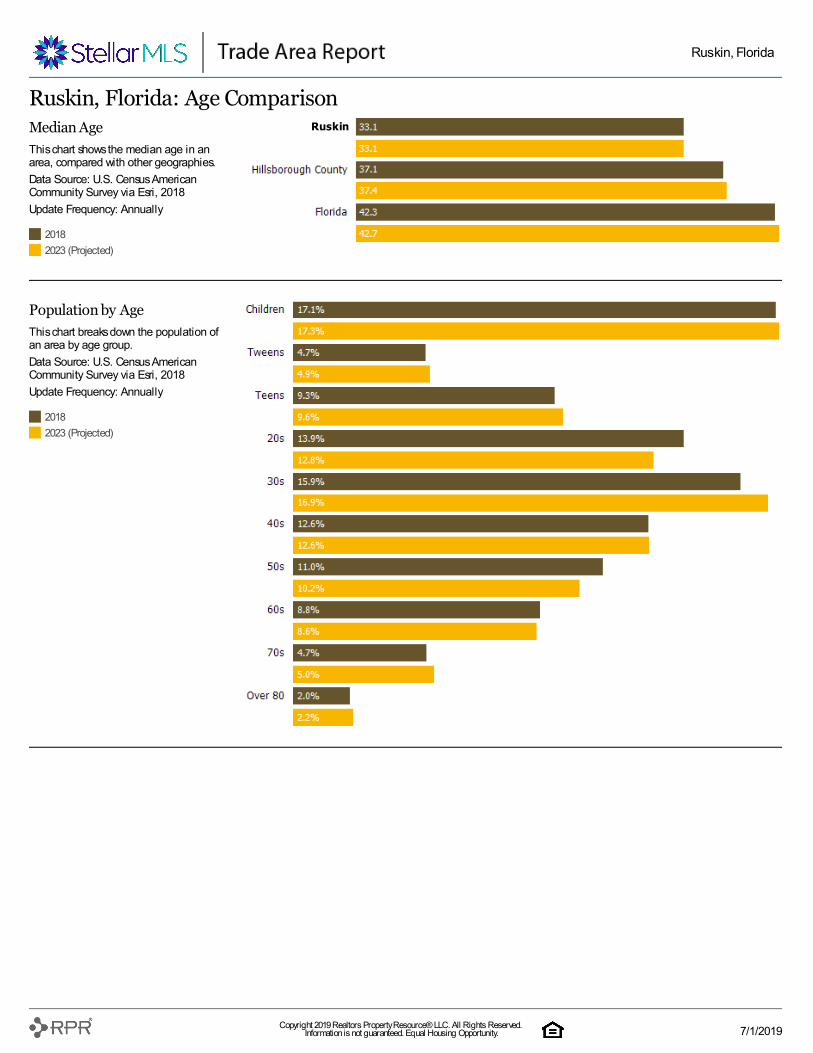
20182023 (Projected)
Median AgeThis chart shows the median age in anarea, compared with other geographies.Data Source: U.S. Census AmericanCommunity Survey via Esri, 2018Update Frequency: Annually
20182023 (Projected)
Population by AgeThis chart breaks down the population ofan area by age group.Data Source: U.S. Census AmericanCommunity Survey via Esri, 2018Update Frequency: Annually
Ruskin, Florida: Age ComparisonRuskin
Ruskin, Florida
Copyright 2019 Realtors Property Resource® LLC. All Rights Reserved. Information is not guaranteed. Equal Housing Opportunity. 7/1/2019
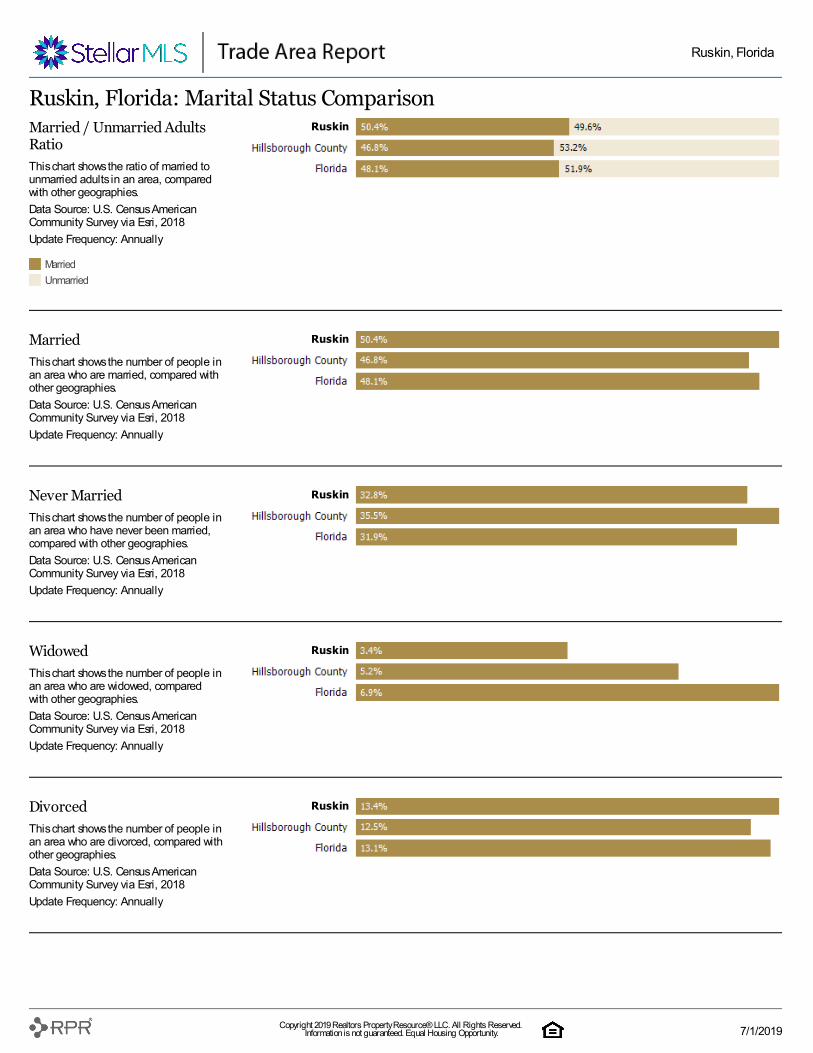
MarriedUnmarried
Married / Unmarried AdultsRatioThis chart shows the ratio of married tounmarried adults in an area, comparedwith other geographies.Data Source: U.S. Census AmericanCommunity Survey via Esri, 2018Update Frequency: Annually
MarriedThis chart shows the number of people inan area who are married, compared withother geographies.Data Source: U.S. Census AmericanCommunity Survey via Esri, 2018Update Frequency: Annually
Never MarriedThis chart shows the number of people inan area who have never been married,compared with other geographies.Data Source: U.S. Census AmericanCommunity Survey via Esri, 2018Update Frequency: Annually
WidowedThis chart shows the number of people inan area who are widowed, comparedwith other geographies.Data Source: U.S. Census AmericanCommunity Survey via Esri, 2018Update Frequency: Annually
DivorcedThis chart shows the number of people inan area who are divorced, compared withother geographies.Data Source: U.S. Census AmericanCommunity Survey via Esri, 2018Update Frequency: Annually
Ruskin, Florida: Marital Status ComparisonRuskin
Ruskin
Ruskin
Ruskin
Ruskin
Ruskin, Florida
Copyright 2019 Realtors Property Resource® LLC. All Rights Reserved. Information is not guaranteed. Equal Housing Opportunity. 7/1/2019

20182023 (Projected)
Average Household IncomeThis chart shows the average householdincome in an area, compared with othergeographies.Data Source: U.S. Census AmericanCommunity Survey via Esri, 2018Update Frequency: Annually
20182023 (Projected)
Median Household IncomeThis chart shows the median householdincome in an area, compared with othergeographies.Data Source: U.S. Census AmericanCommunity Survey via Esri, 2018Update Frequency: Annually
20182023 (Projected)
Per Capita IncomeThis chart shows per capita income in anarea, compared with other geographies.Data Source: U.S. Census AmericanCommunity Survey via Esri, 2018Update Frequency: Annually
Average Disposable IncomeThis chart shows the average disposableincome in an area, compared with othergeographies.Data Source: U.S. Census AmericanCommunity Survey via Esri, 2018Update Frequency: Annually
Ruskin, Florida: Economic ComparisonRuskin
Ruskin
Ruskin
Ruskin
Ruskin, Florida
Copyright 2019 Realtors Property Resource® LLC. All Rights Reserved. Information is not guaranteed. Equal Housing Opportunity. 7/1/2019

Hillsborough CountyFloridaUSA
Unemployment RateThis chart shows the unemploymenttrend in an area, compared with othergeographies.Data Source: Bureau of Labor Statisticsvia 3DLUpdate Frequency: Monthly
Employment Count byIndustryThis chart shows industries in an areaand the number of people employed ineach category.Data Source: Bureau of Labor Statisticsvia Esri, 2018Update Frequency: Annually
Ruskin, Florida
Copyright 2019 Realtors Property Resource® LLC. All Rights Reserved. Information is not guaranteed. Equal Housing Opportunity. 7/1/2019

Less than 9th GradeThis chart shows the percentage ofpeople in an area who have less than aninth grade education, compared withother geographies.Data Source: U.S. Census AmericanCommunity Survey via Esri, 2018Update Frequency: Annually
Some High SchoolThis chart shows the percentage ofpeople in an area whose highesteducational achievement is some highschool, without graduating or passing ahigh school GED test, compared withother geographies.Data Source: U.S. Census AmericanCommunity Survey via Esri, 2018Update Frequency: Annually
High School GEDThis chart shows the percentage ofpeople in an area whose highesteducational achievement is passing ahigh school GED test, compared withother geographies.Data Source: U.S. Census AmericanCommunity Survey via Esri, 2018Update Frequency: Annually
High School GraduateThis chart shows the percentage ofpeople in an area whose highesteducational achievement is high school,compared with other geographies.Data Source: U.S. Census AmericanCommunity Survey via Esri, 2018Update Frequency: Annually
Some CollegeThis chart shows the percentage ofpeople in an area whose highesteducational achievement is somecollege, without receiving a degree,compared with other geographies.Data Source: U.S. Census AmericanCommunity Survey via Esri, 2018Update Frequency: Annually
Ruskin, Florida: Education ComparisonRuskin
Ruskin
Ruskin
Ruskin
Ruskin
Ruskin, Florida
Copyright 2019 Realtors Property Resource® LLC. All Rights Reserved. Information is not guaranteed. Equal Housing Opportunity. 7/1/2019
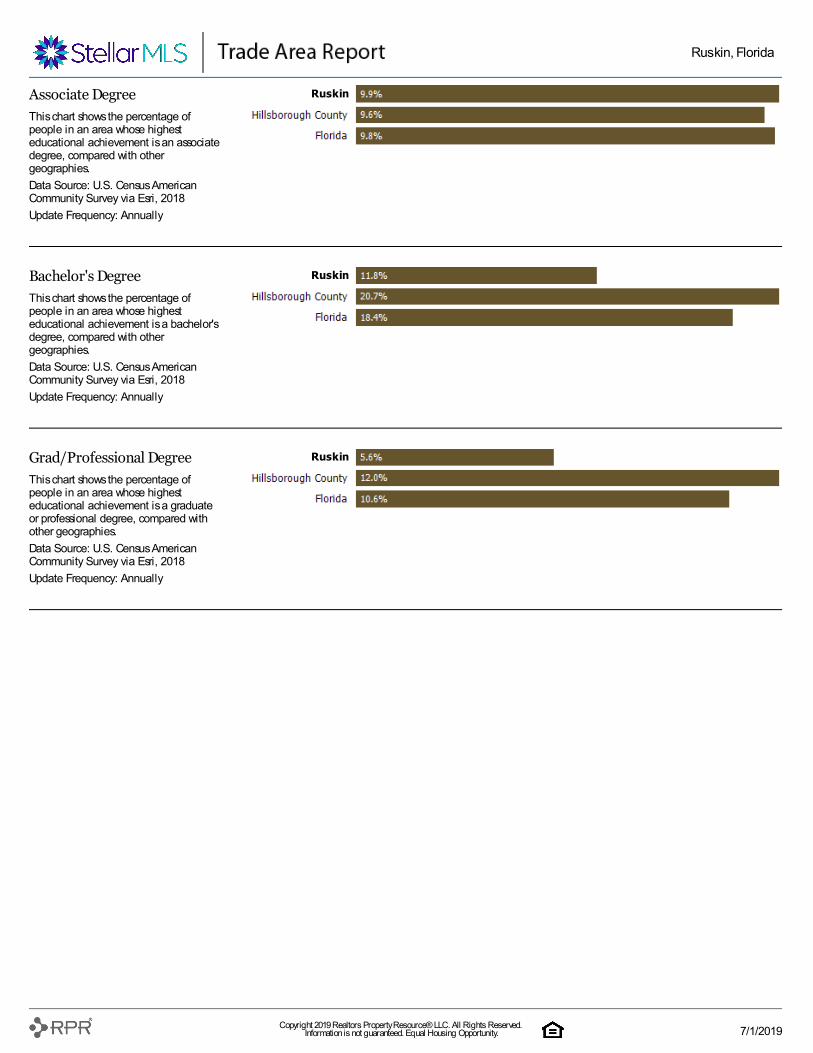
Associate DegreeThis chart shows the percentage ofpeople in an area whose highesteducational achievement is an associatedegree, compared with othergeographies.Data Source: U.S. Census AmericanCommunity Survey via Esri, 2018Update Frequency: Annually
Bachelor's DegreeThis chart shows the percentage ofpeople in an area whose highesteducational achievement is a bachelor'sdegree, compared with othergeographies.Data Source: U.S. Census AmericanCommunity Survey via Esri, 2018Update Frequency: Annually
Grad/Professional DegreeThis chart shows the percentage ofpeople in an area whose highesteducational achievement is a graduateor professional degree, compared withother geographies.Data Source: U.S. Census AmericanCommunity Survey via Esri, 2018Update Frequency: Annually
Ruskin
Ruskin
Ruskin
Ruskin, Florida
Copyright 2019 Realtors Property Resource® LLC. All Rights Reserved. Information is not guaranteed. Equal Housing Opportunity. 7/1/2019

Ruskin
Average Commute TimeThis chart shows average commute timesto work, in minutes, by percentage of anarea's population.Data Source: U.S. Census AmericanCommunity Survey via Esri, 2018Update Frequency: Annually
Ruskin
How People Get to WorkThis chart shows the types oftransportation that residents of the areayou searched use for their commute, bypercentage of an area's population.Data Source: U.S. Census AmericanCommunity Survey via Esri, 2018Update Frequency: Annually
Ruskin, Florida: Commute Comparison
Ruskin, Florida
Copyright 2019 Realtors Property Resource® LLC. All Rights Reserved. Information is not guaranteed. Equal Housing Opportunity. 7/1/2019

Median Estimated Home ValueThis chart displays property estimates foran area and a subject property, whereone has been selected. Estimated homevalues are generated by a valuationmodel and are not formal appraisals.Data Source: Valuation calculationsbased on public records and MLS sourceswhere licensedUpdate Frequency: Monthly
12-Month Change in MedianEstimated Home ValueThis chart shows the 12-month change inthe estimated value of all homes in thisarea, the county and the state. Estimatedhome values are generated by avaluation model and are not formalappraisals.Data Source: Valuation calculationsbased on public records and MLS sourceswhere licensedUpdate Frequency: Monthly
Median Listing PriceThis chart displays the median listingprice for homes in this area, the countyand the state.Data Source: On- and off-market listingssourcesUpdate Frequency: Monthly
12-Month Change in MedianListing PriceThis chart displays the 12-month changein the median listing price of homes inthis area, and compares it to the countyand state.Data Source: On- and off-market listingssourcesUpdate Frequency: Monthly
Ruskin, Florida: Home Value Comparison
Ruskin, Florida
Copyright 2019 Realtors Property Resource® LLC. All Rights Reserved. Information is not guaranteed. Equal Housing Opportunity. 7/1/2019

Best Retail Businesses: Ruskin, Florida
This chart shows the types of businesses that consumers are leaving an area to find. The business types represented by blue bars are relatively scarce in the area,so consumers go elsewhere to have their needs met. The beige business types are relatively plentiful in the area, meaning there are existing competitors for thedollars that consumers spend in these categories.Data Source: Retail Marketplace via Esri, 2018Update Frequency: Annually
Ruskin, Florida
Copyright 2019 Realtors Property Resource® LLC. All Rights Reserved. Information is not guaranteed. Equal Housing Opportunity. 7/1/2019

Match
Area Searched: Ruskin, FloridaRPR searched within your subject area for the places that are the best matches based on the criteria you selected below.
Criteria Used for Analysis
Spending Habits:All Retail Spending
$17,991
Ruskin, Florida
Copyright 2019 Realtors Property Resource® LLC. All Rights Reserved. Information is not guaranteed. Equal Housing Opportunity. 7/1/2019

Match
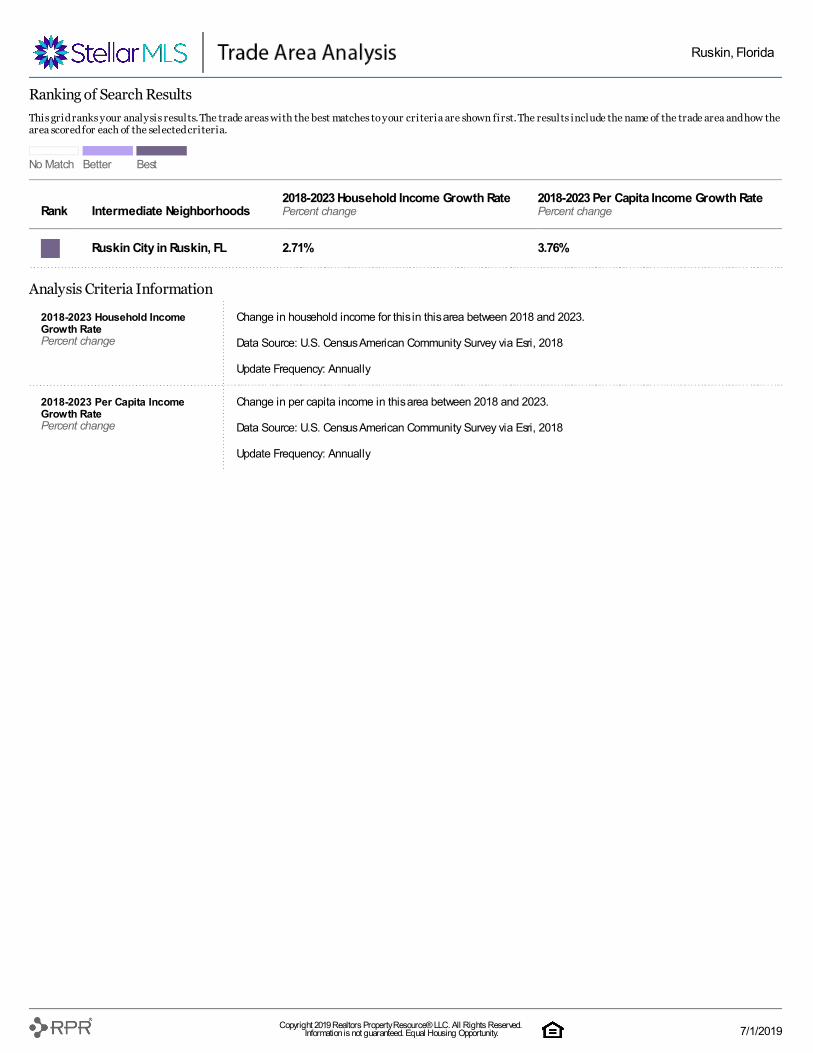
Ranking of Search ResultsThis grid ranks your analysis results. The trade areas with the best matches to your criteria are shown first. The results include the name of the trade area and how thearea scored for each of the selected criteria.
Rank Intermediate NeighborhoodsAll Retail SpendingDollars
Ruskin City in Ruskin, FL $18,657
Analysis Criteria Information
All Retail SpendingDollars
Average annual household spending on retail goods. Calculations are based on Consumer Expenditure Surveysfrom the Bureau of Labor Statistics.
Data Source: Esri Consumer Expenditure data, 2018
Update Frequency: Annually
Ruskin, Florida
Copyright 2019 Realtors Property Resource® LLC. All Rights Reserved. Information is not guaranteed. Equal Housing Opportunity. 7/1/2019

No Match Good Better Best
Area Searched: Ruskin, FloridaRPR searched within your subject area for the places that are the best matches based on the criteria you selected below.
Criteria Used for Analysis
Population Stats:Population Density
Population Stats:Total Population
Housing Stats:Total Households
2,813.8 2,706 883
Ruskin, Florida
Copyright 2019 Realtors Property Resource® LLC. All Rights Reserved. Information is not guaranteed. Equal Housing Opportunity. 7/1/2019

No Match Good Better Best
Ranking of Search ResultsThis grid ranks your analysis results. The trade areas with the best matches to your criteria are shown first. The results include the name of the trade area and how thearea scored for each of the selected criteria.
Rank Intermediate NeighborhoodsPopulation DensityCount
Total PopulationCount
Total HouseholdsCount
Diversity Index100=Most Diverse
Fairmont Mobile Estates in Ruskin, FL 7,076.2 455 128 74.4
Ruskin City in Ruskin, FL 2,508.4 2,251 755 69.7
Analysis Criteria Information
Population DensityCount
Number of people living in a square mile.
Data Source: U.S. Census American Community Survey via Esri, 2018
Update Frequency: Annually
Total PopulationCount
Total number of people living here.
Data Source: U.S. Census American Community Survey via Esri, 2018
Update Frequency: Annually
Total HouseholdsCount
Total number of households.
Data Source: U.S. Census American Community Survey via Esri, 2018
Update Frequency: Annually
Diversity Index100=Most Diverse
This Index summarizes racial and ethnic diversity by showing the likelihood that two people, chosen at randomfrom the same area, belong to different race or ethnic groups. The index ranges from 0 (no diversity) to 100(complete diversity).
Data Source: Calculations by Esri based on data from the U.S. Census American Community Survey via Esri, 2018
Update Frequency: Annually
Ruskin, Florida
Copyright 2019 Realtors Property Resource® LLC. All Rights Reserved. Information is not guaranteed. Equal Housing Opportunity. 7/1/2019

No Match Better Best
Area Searched: Ruskin, FloridaRPR searched within your subject area for the places that are the best matches based on the criteria you selected below.
Criteria Used for Analysis
Trends:2018-2023 Household Income Growth Rate
Trends:2018-2023 Per Capita Income Growth Rate
3.45% 3.53%
Ruskin, Florida
Copyright 2019 Realtors Property Resource® LLC. All Rights Reserved. Information is not guaranteed. Equal Housing Opportunity. 7/1/2019
No Match Better Best
Ranking of Search ResultsThis grid ranks your analysis results. The trade areas with the best matches to your criteria are shown first. The results include the name of the trade area and how thearea scored for each of the selected criteria.
Rank Intermediate Neighborhoods2018-2023 Household Income Growth RatePercent change
2018-2023 Per Capita Income Growth RatePercent change
Ruskin City in Ruskin, FL 2.71% 3.76%
Analysis Criteria Information
2018-2023 Household IncomeGrowth RatePercent change
Change in household income for this in this area between 2018 and 2023.
Data Source: U.S. Census American Community Survey via Esri, 2018
Update Frequency: Annually
2018-2023 Per Capita IncomeGrowth RatePercent change
Change in per capita income in this area between 2018 and 2023.
Data Source: U.S. Census American Community Survey via Esri, 2018
Update Frequency: Annually
Ruskin, Florida
Copyright 2019 Realtors Property Resource® LLC. All Rights Reserved. Information is not guaranteed. Equal Housing Opportunity. 7/1/2019
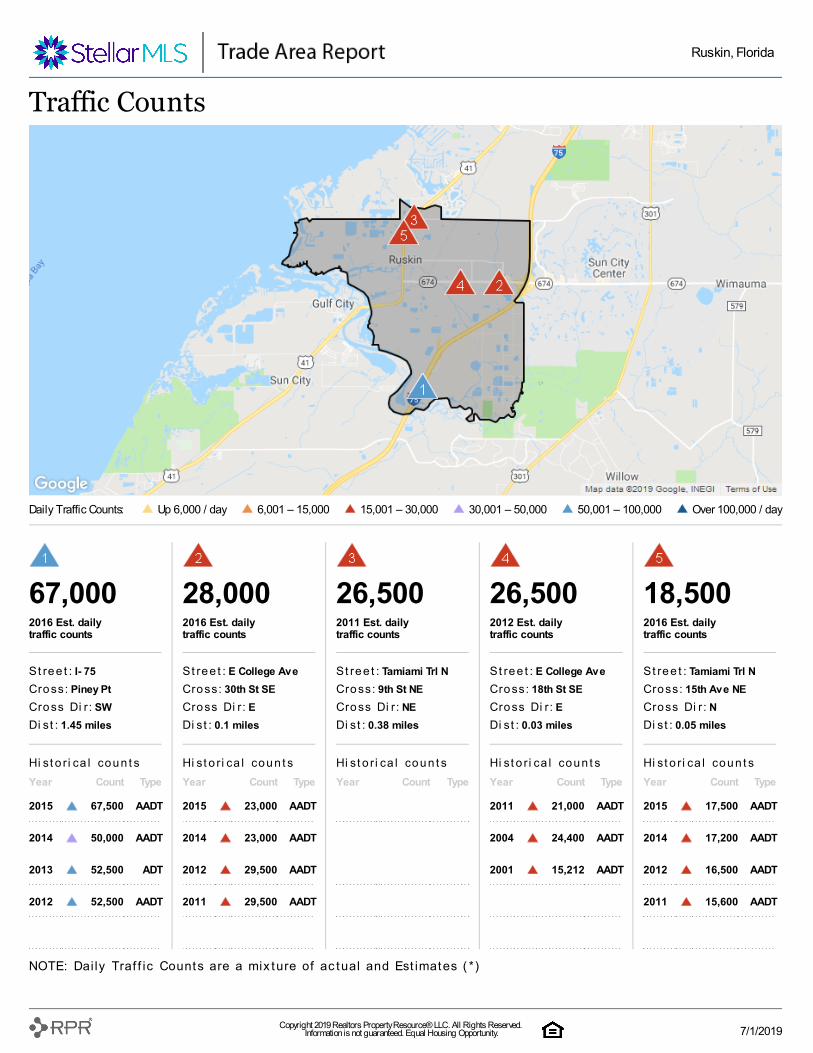
Daily Traffic Counts: Over 100,000 / day50,001 – 100,00030,001 – 50,00015,001 – 30,0006,001 – 15,000Up 6,000 / day
67,0002016 Est. dailytraffic counts
S |t |r |e |e |t |: I- 75C|r |o |s |s |: Piney PtC|r |o |s |s | |D|i |r |: SWD|i |s |t |: 1.45 miles
H|i |s |t |o |r |i |c |a |l | |c |o |u |n |t |sYear Count Type
2015 67,500 AADT
2014 50,000 AADT
2013 52,500 ADT
2012 52,500 AADT
28,0002016 Est. dailytraffic counts
S |t |r |e |e |t |: E College AveC|r |o |s |s |: 30th St SEC|r |o |s |s | |D|i |r |: ED|i |s |t |: 0.1 miles
H|i |s |t |o |r |i |c |a |l | |c |o |u |n |t |sYear Count Type
2015 23,000 AADT
2014 23,000 AADT
2012 29,500 AADT
2011 29,500 AADT
26,5002011 Est. dailytraffic counts
S |t |r |e |e |t |: Tamiami Trl NC|r |o |s |s |: 9th St NEC|r |o |s |s | |D|i |r |: NED|i |s |t |: 0.38 miles
H|i |s |t |o |r |i |c |a |l | |c |o |u |n |t |sYear Count Type
26,5002012 Est. dailytraffic counts
S |t |r |e |e |t |: E College AveC|r |o |s |s |: 18th St SEC|r |o |s |s | |D|i |r |: ED|i |s |t |: 0.03 miles
H|i |s |t |o |r |i |c |a |l | |c |o |u |n |t |sYear Count Type
2011 21,000 AADT
2004 24,400 AADT
2001 15,212 AADT
18,5002016 Est. dailytraffic counts
S |t |r |e |e |t |: Tamiami Trl NC|r |o |s |s |: 15th Ave NEC|r |o |s |s | |D|i |r |: ND|i |s |t |: 0.05 miles
H|i |s |t |o |r |i |c |a |l | |c |o |u |n |t |sYear Count Type
2015 17,500 AADT
2014 17,200 AADT
2012 16,500 AADT
2011 15,600 AADT
Traffic Counts
N|O|T|E|: | |D|a|i |l |y | |T|ra|f f i |c | |C|o|u|n|t |s |a|re| |a| |m|i |x |t |u|re| |o|f |a|c |t |u|a|l | |a|n|d| |E|st |i |m|a|t |e|s |( |* |)
Ruskin, Florida
Copyright 2019 Realtors Property Resource® LLC. All Rights Reserved. Information is not guaranteed. Equal Housing Opportunity. 7/1/2019


![ENCLAVES PATRIMONIALES Y MARCAS DE IDENTIDAD LOCAL …dup.ucentral.cl/dup_34/vicente_gamez.pdf · planeamiento urbano. [ Key Words ] Urban heritage, metropolitan periphery, urban](https://img.pdfslide.us/doc/110x75/5eb798cfe75d86445e7107bc/enclaves-patrimoniales-y-marcas-de-identidad-local-dup-planeamiento-urbano-key.jpg)