Embed Size (px)
Citation preview

Consumer Products and RetailQuarterly update
Q2 2018
Deloitte Corporate Finance LLC | www.investmentbanking.deloitte.com

Quarterly update | Q2 2018 | Consumer Products and Retail
www.investmentbanking.deloitte.com | Page 2
Consumer Products and Retail trends
Who we are
Deloitte Corporate Finance LLC is a leading global middle market M&A advisor. The firm’s professionals have extensive knowledge of and transaction experience in the Consumer Products and Retail space.
Contacts
Lorin DeMordauntManaging [email protected]+1 (704) 333-0591
Matt PreeceManaging [email protected]+1 (704) 731-7186
In the news
June 27, 20185,6,7 – Conagra Brands Inc. (Conagra) announced the acquisition of Pinnacle Foods Inc. (Pinnacle) for $8.2 billon in a cash and stock deal, representing an adjusted LTM EBITDA multiple of 16.5x. The resulting conglomerate is expected to produce about $11 billion in annual sales, positioning itself as the second-largest frozen-food business in the US behind Nestlé SA. The merger comes at a time when the frozen-foodsaisle has been a bright spot in an otherwise struggling packaged-foods industry and ConAgra management expects the combination of the two to result in approximately $215 million in annual synergies.
May 7, 20188,9 – Del Frisco’s Restaurant Group (Del Frisco’s) announced the acquisition of Barteca Restaurant Group, LLC (Barteca) from Rosser Capital Partners, General Atlantic LLC and others for $325 million in cash. The strategic move by Del Frisco’s to reach new customers and grow in scale adds a 20 year-old company in Barteca that features two brands, Bartaco and Barcelona. Specializing in small plates, atmosphere, and wine, the two brands are popular with young adults. While Bartecacurrently operates 15 Barcelona and 16 Bartaco locations, Del Frisco’s management expects that over time, they will be able to open 50 to 100 Barcelona restaurants as well as 200 to 300 Bartaco locations.
In this update
• Consumer trends
• Economic outlook
• Industry analysis
• Select M&A transactions
• Appendix
This update will focus on news and trends in the following areas:
• Beauty & Cosmetics
• Active Lifestyle & Apparel
• Food & Beverages
• Products & Durables
• Restaurant & FoodServices
• Specialty Retail
Voice ordering popularity4
While consumer products traditionally fought for consumers in brick-and-mortar stores, and, more recently, digital marketplaces, the popularity of voice ordering, or the ability to place orders using a voice command, is on the rise. As a result, consumer product companies are increasingly battling to gain ground within homes, targeting busy customers who have quickly adapted to voice ordering for the level of convenience and ease that it provides in their day-to-day lives.
Beauty landscape is changing1
When it comes to beauty and personal care products, overall sales are down by 1 percent and 2 percent, respectively. However, increased transparency at the consumer level has led to healthy growth in natural products and in the clean, simple ingredients categories. Additionally, consumers have knowledge of and improved access to a wider range of brands and options, leading companies to differentiate themselves through an increased variety of products. In the past five years, the number of colors available in facial cosmetics has grown 22 percent.
Blockchain technology usage3
Consumer goods companies are beginning to utilize blockchain technologies across the industry. Companies can use the technology in order to track products through the supply chain as well as to trace foods in order to help ensure that the ingredients are actually farm to table, certified organic, and/or humanely treated as they claim to be. As more companies begin to use this new technology, the consumer industry should become more efficient and have even more detailed and precise information at their fingertips.
Brand connection is key2
With an increased prevalence of consumers turning to online retailers, consumer connections with businesses have become crucial and increasingly challenging to develop. No longer are consumers only concerned with the surface level details of the product, but they are also searching for the background, mission, and values of the company behind the product. This has led many companies to allocate additional resources to the development and the branding of their story.

Quarterly update | Q2 2018 | Consumer Products and Retail
Macroeconomic and Consumer Products and Retail Sector Outlook
www.investmentbanking.deloitte.com | Page 3
Macroeconomic and Consumer Products and Retail sector outlook
US Treasury yield curve2
(nominal vs. real)US gross domestic product1
US per capita disposable income5 Monthly total US retail sales6
US unemployment rate3 ISM non-manufacturing indexand consumer confidence index4
Initial jobless claims Unemployment rate (%)
55.0
65.0
75.0
85.0
95.0
105.0
115.0
125.0
135.0
48.0
50.0
52.0
54.0
56.0
58.0
60.0
62.0
64.0
Con
su
mer c
on
fid
en
ce
IS
M n
on
-man
ufa
ctu
rin
g
ISM Non-Manufacturing
200
250
300
350
400
450
500
550
600
4.0%
6.0%
8.0%
10.0%
Job
less c
laim
s (
thou
san
ds)
% u
nem
plo
yed
0.0%
0.5%
1.0%
1.5%
2.0%
2.5%
3.0%
3.5%
In
terest
rate
Real Yield (%) Nominal Yield (%)
$0.0
$5.0
$10.0
$15.0
$20.0
0.0%
1.0%
2.0%
3.0%
4.0%
5.0%
$ in
tril
lion
s
YoY
percen
t ch
an
ge
GDP ($ in Trillions) YoY % Growth (Adj. for Inflation)
$320.0
$330.0
$340.0
$350.0
$360.0
$370.0
$380.0
$390.0
$400.0
$410.0
$ in
billion
s
$40.0
$44.0
$32.0
$34.0
$36.0
$38.0
$40.0
$42.0
$44.0
$46.0
$ in
th
ou
san
ds

Quarterly update | Q2 2018 | Consumer Products and Retail
(20.0%)
(10.0%)
0.0%
10.0%
20.0%
30.0%
40.0%
50.0%
60.0%
70.0%
S&P 500 Index NASDAQ Composite Index Consumer Index
Consumer Products and Retail sector breakdown and trading statistics1
Public comparables three-year stock market performance2
www.investmentbanking.deloitte.com | Page 4
*Consumer Index companies listed on pages 6 and 7 in the Appendix.
S&P 500 Index 23.81%
NASDAQ Composite Index 36.56%
Consumer Index* 7.30%
Last twelve months NTM
SectorNumber of
companies
% of 52
Week high
Median
revenue
CAGR (3 Yr)
Median LTM
EBITDA
($M)
Median
EBITDA
margin
Median
enterprise
value ($M)
EV/
Revenue
EV/
EBITDA
EV/
EBITDA
Beauty & cosmetics 12 77.2 % 3.7 % $833.1 15.4 % $8,980.5 1.9 x 12.5 x 11.5 x
Food & beverage 10 88.5 (0.9) 2,507.9 19.3 18,706.3 2.2 13.2 12.5
Home & garden 10 79.0 4.1 726.0 15.5 8,318.6 1.9 12.4 10.9
Restaurant & food services 18 90.5 3.2 377.8 13.0 3,712.0 1.6 12.8 10.8
Apparel & specialty retail 11 86.5 4.2 335.2 13.3 5,516.1 1.5 11.2 10.1
Consumer products index 61 87.2 % 3.5 % $495.7 15.0 % $5,560.9 1.8 x 12.2 x 11.1 x

Quarterly update | Q2 2018 | Consumer Products and Retail
Select recent Consumer Products and Retail M&A transactions1
www.investmentbanking.deloitte.com | Page 5
Annual Consumer Products and Retail M&A transaction volume2
1,983
2,479
2,772
3,041 2,874
3,213 3,199
2,603
2,369
1,194
0
500
1,000
1,500
2,000
2,500
3,000
3,500
2009 2010 2011 2012 2013 2014 2015 2016 2017 2017
YTD
2018
YTD
Num
ber
of deals
Undisclosed <$100M $100-$250M $250M-$500M $500M-$1,000M >$1,000M
1,075
Announce date Target/acquiror Target business description
Enterprise
value
("EV")
Jul-18Spice World, Inc.
Palladium Equity partners, LLC
Spice World, Inc. produces and supplies garlic, shallots, ginger, and
specialty spices. It serves supermarkets in the United States. N/A N/A
Jun-18Pinnacle Foods Inc.
Conagra Brands, Inc.
Pinnacle Foods Inc. manufactures, markets, and distributes branded
convenience food products in North America. It operates through
four segments: Frozen, Grocery, Boulder, and Specialty.
$10,904.1 16.5 x
Jun-18Chobani, LLC
Healthcare of Ontario Pension Plan Chobani, LLC produces and markets Greek yogurt. N/A N/A
Jun-18Varsity Brands, Inc.
Bain Capital Private Equity, LP
Varsity Brands, Inc. manufactures cheerleading uniforms and school
spirit merchandise. 2,500.0 N/A
Jun-18Geoffrey Beene, LLC
PVH Corp.
Geoffrey Beene, LLC manufactures and sells apparel and
accessories for women and men.N/A N/A
Jun-18
Sara Lee Frozen Bakery & Van's Businesses of
Tyson Food Inc.
Kohlberg & Company, L.L.C.
Sara Lee Frozen Bakery & Van's Businesses of Tyson Foods Inc.
comprises food restaurant brands. The asset is located in the United
States.
N/A N/A
May-18
Marketing and Distribution Rights of Various
Brands of Starbucks Corporation
Nestlé S.A.
Marketing and Distribution Rights of Various Brands of Starbucks
Corporation comprises marketing and distribution rights of various
brands of food products.
7,150.0 N/A
May-18Barteca Resturant Group, LLC
Del Frisco's Resturant Group, Inc.
Barteca Restaurant Group, LLC operates a chain of restaurants
under the name Barcelona Wine Bar & Restaurant.325.0 10.3
May-18Tate's Bake Shop, Inc.
Mondelez International, Inc.
Tate's Bake Shop, Inc. produces baking products. Its products
include cookies, cookie and bar towers, gift baskets, gluten-free
desserts, bars and brownies, pies and cakes, breakfast treats, and
cookbooks and accessories.
500.0 N/A
Apr-18Old Orchard Brands, LLC
Lassonde Industries Inc.
Old Orchard Brands, LLC produces fruit juices. It offers bottled
juices, fruit juice concentrates, and frozen juice concentrates. 158.9 10.1
Apr-18Ainsworth Pet Nutrition Parent, LLC
NU Pet Company
Ainsworth Pet Nutrition Parent, LLC manufactures and distributes
healthy pet foods and treats.1,900.0 N/A
EV/
EBITDA

Quarterly update | Q2 2018 | Consumer Products and Retail
Appendix
Consumer Products and Retail trading multiples1
www.investmentbanking.deloitte.com | Page 6
Historical Last twelve months NTM
Company (ticker)
% of 52
Week high LTM revenue
Revenue
CAGR (3 Yr)
LTM
EBITDA
EBITDA
margin
Enterprise
value ("EV")
EV/
EBITDA
EV/
EBITDA
($ in millions)
Beauty & cosmetics (12)
Avon Products, Inc. (NYSE:AVP) 42.2 % $5,776.0 (6.3) % $432.2 7.5 % $1,852.3 0.3 x 4.3 x 4.0 x
Coty Inc. (NYSE:COTY) 63.9 9,339.9 28.4 1,225.6 13.1 17,803.7 1.9 14.5 11.6
L'Occitane International S.A. (SEHK:973) 70.0 1,625.4 3.9 252.2 15.5 2,079.7 1.3 8.2 7.9
L'Oréal S.A. (ENXTPA:OR) 98.7 31,248.4 4.9 6,973.6 22.3 134,913.5 4.3 19.3 19.1
Nu Skin Enterprises, Inc. (NYSE:NUS) 92.9 2,396.2 (0.6) 360.1 15.0 4,377.5 1.8 12.2 11.0
Oriflame Holding AG (OM:ORI) 63.7 1,667.9 2.8 229.5 13.8 1,765.6 1.1 7.7 7.2
Revlon, Inc. (NYSE:REV) 62.4 2,659.5 11.7 150.9 5.7 3,790.8 1.4 25.1 13.3
Sally Beauty Holdings, Inc. (NYSE:SBH) 72.1 3,942.5 1.3 600.4 15.2 3,663.0 0.9 6.1 6.3
The Estée Lauder Companies Inc. (NYSE:EL) 90.1 13,282.0 6.5 2,834.0 21.3 53,661.9 4.0 18.9 17.6
The Procter & Gamble Company (NYSE:PG) 83.0 66,408.0 (3.5) 18,033.0 27.2 217,412.5 3.3 12.1 12.4
Ulta Beauty, Inc. (NasdaqGS:ULTA) 82.2 6,113.3 21.7 1,065.8 17.4 13,583.5 2.2 12.7 11.4
Unilever PLC (LSE:ULVR) 92.6 64,499.3 3.5 11,977.7 18.6 173,613.2 2.7 14.5 13.7
Median 77.2 % 3.7 % $833.1 15.4 % $8,980.5 1.9 x 12.5 x 11.5 x
Mean 76.2 % 6.2 % $3,677.9 16.1 % $52,376.4 2.1 x 13.0 x 11.3 x
Food & beverage (10)
Conagra Brands, Inc. (NYSE:CAG) 88.7 % $7,938.3 (4.2) % $1,500.0 18.9 % $17,362.9 2.2 x 11.6 x 11.7 x
General Mills, Inc. (NYSE:GIS) 71.9 15,740.4 (3.7) 3,340.3 21.2 41,320.1 2.6 12.4 11.5
Hormel Foods Corporation (NYSE:HRL) 96.7 9,361.8 (0.5) 1,317.0 14.1 20,049.6 2.1 15.2 14.0
Mondelez International, Inc. (NasdaqGS:MDLZ) 88.2 26,247.0 (7.7) 4,945.0 18.8 98.0 0.0 0.0 0.0
Nestlé S.A. (SWX:NESN) 91.2 92,473.5 (0.6) 18,192.8 19.7 261,026.9 2.8 14.3 13.6
PepsiCo, Inc. (NasdaqGS:PEP) 88.9 64,038.0 (1.1) 12,669.0 19.8 177,338.9 2.8 14.0 13.2
The Coca-Cola Company (NYSE:KO) 91.0 33,918.0 (9.7) 10,908.0 32.2 215,894.1 6.4 19.8 18.9
The Hain Celestial Group, Inc. (NasdaqGS:HAIN) 65.4 2,950.7 4.7 259.0 8.8 3,865.1 1.3 14.9 14.4
The J. M. Smucker Company (NYSE:SJM) 79.7 7,357.1 8.9 1,675.4 22.8 16,706.5 2.3 10.0 9.6
TreeHouse Foods, Inc. (NYSE:THS) 60.3 6,252.1 26.2 548.6 8.8 5,350.3 0.9 9.8 9.6
Median 88.5 % (0.9) % $2,507.9 19.3 % $18,706.3 2.2 x 13.2 x 12.5 x
Mean 82.2 % 1.2 % $5,535.5 18.5 % $75,901.2 2.3 x 12.2 x 11.7 x
Home & garden (10)
Central Garden & Pet Company (NasdaqGS:CENT) 98.6 % $2,120.2 9.4 % $207.6 9.8 % $2,843.8 1.3 x 13.7 x 12.5 x
Helen of Troy Limited (NasdaqGS:HELE) 96.0 1,489.7 1.0 223.7 15.0 2,869.8 1.9 12.8 11.8
iRobot Corporation (NasdaqGS:IRBT) 69.6 932.5 18.5 105.7 11.3 1,939.0 2.1 18.3 13.8
Newell Brands Inc. (NYSE:NWL) 48.4 14,493.3 35.9 1,974.3 13.6 23,449.2 1.6 11.9 9.5
Snap-on Incorporated (NYSE:SNA) 86.7 4,054.9 4.6 1,018.9 25.1 10,097.4 2.5 9.9 9.4
Stanley Black & Decker, Inc. (NYSE:SWK) 75.2 13,100.2 4.9 2,107.1 16.1 24,320.3 1.9 11.5 10.0
The Clorox Company (NYSE:CLX) 88.3 6,080.0 2.8 1,251.0 20.6 18,881.0 3.1 15.1 13.8
The Toro Company (NYSE:TTC) 82.8 2,540.1 3.6 433.0 17.0 6,539.8 2.6 15.1 13.8
Tupperware Brands Corporation (NYSE:TUP) 57.9 2,243.6 (3.9) 402.7 17.9 2,775.8 1.2 6.9 6.5
Whirlpool Corporation (NYSE:WHR) 73.7 21,378.0 1.6 2,009.0 9.4 14,375.5 0.7 7.2 6.3
Median 79.0 % 4.1 % $726.0 15.5 % $8,318.6 1.9 x 12.4 x 10.9 x
Mean 77.7 % 7.9 % $973.3 15.6 % $10,809.2 1.9 x 12.2 x 10.7 x
EV/
Revenue

Quarterly update | Q2 2018 | Consumer Products and Retail
Consumer Products and Retail trading multiples (cont.)1
www.investmentbanking.deloitte.com | Page 7
Historical Last twelve months NTM
Company (ticker)
% of 52
Week high LTM revenue
Revenue
CAGR (3 Yr)
LTM
EBITDA
EBITDA
margin
Enterprise
value ("EV")
EV/
EBITDA
EV/
EBITDA
($ in millions)
Restaurant & food services (18)
Aramark (NYSE:ARMK) 81.0 % $15,151.8 0.6 % $1,312.1 8.7 % $16,834.4 1.1 x 12.8 x 9.7 x
Bloomin' Brands, Inc. (NasdaqGS:BLMN) 76.4 4,175.1 (2.4) 370.6 8.9 2,808.5 0.7 7.6 7.0
Brinker International, Inc. (NYSE:EAT) 87.7 3,129.0 1.4 422.5 13.5 3,437.8 1.1 8.1 8.3
Chipotle Mexican Grill, Inc. (NYSE:CMG) 93.0 4,556.0 2.0 476.0 10.4 11,730.1 2.6 24.6 20.7
Core-Mark Holding Company, Inc. (NasdaqGS:CORE) 59.3 12,452.9 14.4 96.0 0.8 1,476.5 0.1 15.4 9.2
Cracker Barrel Old Country Store, Inc. (NasdaqGS:CBRL) 87.5 2,962.8 1.7 385.0 13.0 3,986.1 1.3 10.4 9.8
Darden Restaurants, Inc. (NYSE:DRI) 98.7 8,080.1 6.1 1,083.3 13.4 14,188.5 1.8 13.1 12.2
Dine Brands Global, Inc. (NYSE:DIN) 88.9 601.5 (3.2) 203.0 33.8 2,605.8 4.3 12.8 11.6
Domino's Pizza, Inc. (NYSE:DPZ) 95.5 2,949.1 13.0 565.8 19.2 14,974.2 5.1 26.5 21.9
Dunkin' Brands Group, Inc. (NasdaqGS:DNKN) 97.5 865.5 4.3 479.1 55.4 8,438.1 9.7 17.6 18.1
Jack in the Box Inc. (NasdaqGS:JACK) 78.4 1,439.1 (1.8) 320.5 22.3 3,360.8 2.3 10.5 12.8
Recipe Unlimited Corporation (TSX:RECP) 92.2 638.4 42.2 150.3 23.5 1,708.0 2.7 11.4 10.0
SpartanNash Company (NasdaqGS:SPTN) 92.2 8,159.5 1.1 213.9 2.6 1,656.4 0.2 7.7 7.1
Sysco Corporation (NYSE:SYY) 99.3 57,832.5 6.0 3,107.4 5.4 43,918.3 0.8 14.1 12.8
Texas Roadhouse, Inc. (NasdaqGS:TXRH) 94.2 2,279.6 11.5 298.2 13.1 4,525.4 2.0 15.2 13.9
The Cheesecake Factory Incorporated (NasdaqGS:CAKE) 92.5 2,287.8 4.4 243.9 10.7 2,560.5 1.1 10.5 10.1
United Natural Foods, Inc. (NasdaqGS:UNFI) 82.3 9,975.5 8.1 341.4 3.4 2,647.3 0.3 7.8 7.5
YUM! Brands, Inc. (NYSE:YUM) 88.7 5,832.0 (23.8) 1,982.0 34.0 33,724.0 5.8 17.0 17.2
Median 90.5 % 3.2 % $377.8 13.0 % $3,712.0 1.6 x 12.8 x 10.8 x
Mean 88.1 % 4.8 % $669.5 16.2 % $9,698.9 2.4 x 13.5 x 12.2 x
Apparel & specialty retail (11)
Carter's, Inc. (NYSE:CRI) 84.6 % $3,423.4 5.4 % $495.7 14.5 % $5,560.9 1.6 x 11.2 x 11.1 x
Columbia Sportswear Company (NasdaqGS:COLM) 95.8 2,529.6 5.5 % 335.2 13.3 5,516.1 2.2 16.5 14.7
G-III Apparel Group, Ltd. (NasdaqGS:GIII) 84.5 2,889.6 9.8 % 228.5 7.9 2,504.8 0.9 11.0 10.1
Guess?, Inc. (NYSE:GES) 82.6 2,430.7 0.8 % 162.0 6.7 1,556.5 0.6 9.6 7.8
Hanesbrands Inc. (NYSE:HBI) 85.8 6,562.6 6.2 % 1,050.2 16.0 12,105.6 1.8 11.5 10.8
Iconix Brand Group, Inc. (NasdaqGS:ICON) 8.9 215.7 (16.9) % 107.4 49.8 747.7 3.5 7.0 7.4
Oxford Industries, Inc. (NYSE:OXM) 89.4 1,086.5 5.0 % 129.8 12.0 1,482.5 1.4 11.4 10.0
Perry Ellis International, Inc. (NasdaqGS:PERY) 100.0 888.0 (0.4) % 54.3 6.1 539.2 0.6 9.9 9.2
PVH Corp. (NYSE:PVH) 87.2 9,240.4 4.2 % 1,119.8 12.1 14,207.0 1.5 12.7 10.8
Ralph Lauren Corporation (NYSE:RL) 86.5 6,182.3 (6.7) % 944.9 15.3 9,167.2 1.5 9.7 9.5
V.F. Corporation (NYSE:VFC) 95.5 12,356.3 0.3 % 1,886.5 15.3 35,124.7 2.8 18.6 16.6
Median 86.5 % 4.2 % $335.2 13.3 % $5,516.1 1.5 x 11.2 x 10.1 x
Mean 81.9 % 1.2 % $592.2 15.3 % $8,046.6 1.7 x 11.7 x 10.7 x
EV/
Revenue

Quarterly update | Q2 2018 | Consumer Products and Retail
Recent Consumer Products and Retail M&A transactions1
www.investmentbanking.deloitte.com | Page 8
Target/acquiror Close date
LTM
revenue
LTM
EBITDA
EBITDA
margin
Enterprise
value ("EV")
EV/
Revenue
EV/
EBITDA
($ in Millions)
Spice World, Inc. Pending N/A N/A N/A % N/A N/A x N/A x
Palladium Equity Partners, LLC
Pinnacle Foods Inc. Pending 3,156.8 659.7 20.9 10,904.1 3.5 16.5
Conagra Brands, Inc.
Zipfizz Corporation Pending 54.1 N/A N/A 80.0 1.5 N/A
KUC Holding
Marketing and Distribution Rights of Various Brands of Starbucks Corp. Pending N/A N/A N/A 7,150.0 N/A N/A
Nestlé S.A.
Varsity Brands, Inc. Pending N/A N/A N/A N/A N/A N/A
Bain Capital Private Equity, LP
Sara Lee Frozen Bakery & Van's Businesses of Tyson Foods Inc. Pending N/A N/A N/A N/A N/A N/A
Kohlberg & Company, L.L.C.
Bare Foods Co. Pending N/A N/A N/A N/A N/A N/A
Frito-Lay North America, Inc.
Nine West and Bandolino Footwear and Handbag Business Pending N/A N/A N/A N/A N/A N/A
Authentic Brands Group LLC
Tilted Kilt Pub And Eatery LLC Pending N/A N/A N/A N/A N/A N/A
ARC Group
New Milani Group, Inc. Pending N/A N/A N/A N/A N/A N/A
Gryphon Investors Inc
Good Eats Food Co. Pending N/A N/A N/A N/A N/A N/A
Lakeside Foods Inc.
Chobani, LLC Jun-18 N/A N/A N/A N/A N/A N/A
Healthcare of Ontario Pension Plan
Barteca Restaurant Group, LLC Jun-18 127.9 31.7 N/A 325.0 2.5 10.3
Del Frisco's Restaurant Group, Inc.
Relish Labs LLC Jun-18 250.0 N/A N/A 700.0 2.8 N/A
The Kroger Co.
Geoffrey Beene, LLC Jun-18 N/A N/A N/A N/A N/A N/A
PVH Corp.
b8ta, Inc. Jun-18 N/A N/A N/A N/A N/A N/A
Macy's, Inc.
Tate's Bake Shop, Inc. Jun-18 N/A N/A N/A 500.0 N/A N/A
Mondelez International, Inc.
Tecumseh Poultry, LLC Jun-18 N/A N/A N/A N/A N/A N/A
Tyson Foods, Inc.
Flip Flop Shops Inc. Jun-18 N/A N/A N/A N/A N/A N/A
Bearpaw Holdings, LLC
Top Shelf Beverages, Inc. Jun-18 N/A N/A N/A N/A N/A N/A
Tenth and Blake Beer Company
New England Confectionery Company, Inc. May-18 50.6 N/A N/A 17.3 0.3 N/A
Round Hill Investments, LLC
Old Orchard Brands, LLC May-18 103.3 15.8 N/A 158.9 1.5 10.1
Lassonde Industries Inc.
Pulp Riot May-18 11.0 N/A N/A N/A N/A N/A
L'Oréal S.A.
Ainsworth Pet Nutrition Parent, LLC May-18 N/A N/A N/A 1,900.0 N/A N/A
NU Pet Company
Vornado Air, LLC May-18 N/A N/A N/A N/A N/A N/A
MerchSource, LLC
Median 20.9 % 2.0 x 10.3 x
Mean 20.9 % 2.0 x 12.3 x
Last twelve months
Quarterly update | Q2 2018 | Consumer Products and Retail
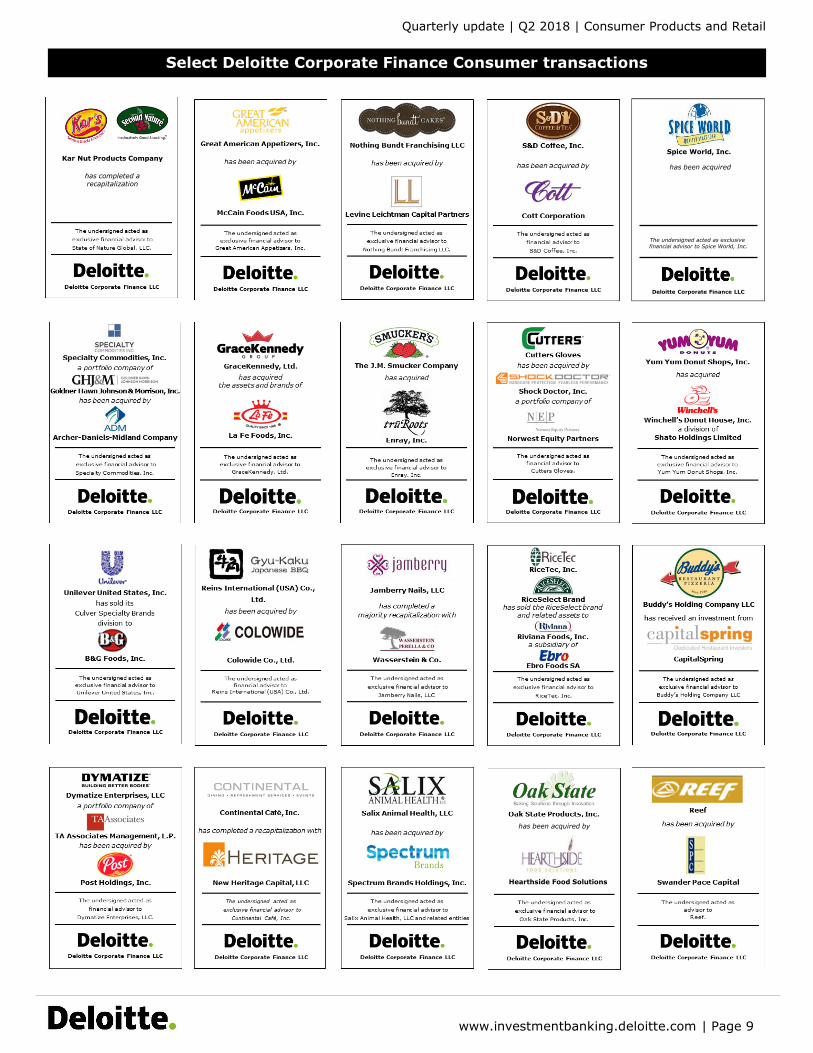
Select Deloitte Corporate Finance Consumer transactions
www.investmentbanking.deloitte.com | Page 9
Hearthside Food Solutions
has been acquired by
Kar Nut Products Company
has completed a recapitalization
The undersigned acted as exclusive financial advisor to Spice World, Inc.
has been acquired
Deloitte Corporate Finance LLC
Spice World, Inc.

Quarterly update | Q2 2018 | Consumer Products and Retail
Sources cited
Page 2:
1. “The Three Systemic Shifts Shaping the U.S. Beauty Landscape.” What People Watch, Listen To and Buy, 20 Feb. 2018,
http://www.nielsen.com/us/en/insights/news/2018/the-three-systemic-shifts-shaping-the-us-beauty-landscape.print.html,
accessed August 13, 2018.
2. “The CPG Industry Trends of 2018 That Brands and Retailers Must Prepare For.” Shopkick Insights.
https://www.shopkick.com/partners/blog/the-cpg-industry-trends-of-2018-that-brands-and-retailers-must-prepare-for/,
accessed August 13, 2018.
3. Schneider, Achim. “Trends to Watch in 2018.” Consumer Goods Technology, 5 Feb. 2018, https://consumergoods.com/trends-
watch-2018 , accessed August 13, 2018.
4. Zealley, John. “5 Consumer Goods Trends That Will Shape 2018.” The Marketing Insider, 5 Feb. 2018,
https://www.mediapost.com/publications/article/314036/5-consumer-goods-trends-that-will-shape-2018.html, accessed August
13, 2018.
5. S&P Capital IQ. July 9, 2018. Data as of July 9, 2018.
6. Naidu, Richa. “Conagra to Buy Pinnacle for $8.1 Billion, Creating Frozen Food...” Reuters, Thomson Reuters, 27 June 2018,
https://www.reuters.com/article/us-pinnacle-fds-m-a-conagra-brands/conagra-to-buy-pinnacle-for-8-1-billion-creating-frozen-
food-powerhouse-idUSKBN1JN19Y, accessed August 13, 2018.
7. Hirsch, Lauren. “Conagra Brands to Acquire Pinnacle Foods for about $8.1 Billion.” CNBC, CNBC, 27 June 2018,
https://www.cnbc.com/2018/06/27/conagra-brands-to-acquire-pinnacle-foods-for-10point9-billion-in-cash-and.html, accessed
August 13, 2018.
8. “Conagra Brands To Acquire Pinnacle Foods For $10.9 Billion In Cash And Stock.” The New York Times, The New York Times, 27
June 2018, https://markets.on.nytimes.com/research/stocks/news/press_release.asp?docTag=20
1806270615PR_NEWS_USPRX____LA39527&feedID=600&press_symbol=69514, accessed August 13, 2018.
9. Whitten, Sarah. “Steakhouse Del Frisco's to Acquire Tapas Restaurant Owner Barteca for $325 Million.” CNBC, CNBC, 8 May
2018, https://www.cnbc.com/2018/05/07/del-friscos-to-acquire-tapas-owner-barteca-for-325-million.html, accessed August 13,
2018.
10. S&P Capital IQ. July 9, 2018. Data as of July 9, 2018.
Page 3:
1. U.S. Bureau of Economic Analysis. July 3, 2018. Data as of July 3, 2018.
2. U.S. Department of the Treasury. July 3, 2018. Data as of July 3, 2018.
3. Bureau of Labor Statistics. July 3, 2018. Data as of July, 3 2018.
4. S&P Capital IQ. July 3, 2018. Data as of July 3, 2018.
5. IBISWorld. July 3, 2018. Data as of March 31, 2018.
6. U.S. Census. July 16, 2018. Data as of July 16, 2018.
Page 4:
1. S&P Capital IQ. July 3, 2018. Data as of July 3, 2018.
2. S&P Capital IQ. July 3, 2018. Data as of July 3, 2018.
Page 5:
1. S&P Capital IQ. July 3, 2018. Data as of July 3, 2018.
2. S&P Capital IQ. July 3, 2018. Data as of June 30, 2018.
Page 6:
1. S&P Capital IQ. July 3, 2018. Data as of July 3, 2018.
Page 7:
1. S&P Capital IQ. July 3, 2018. Data as of July 3, 2018.
Page 8:
1. S&P Capital IQ. July 3, 2018. Data as of July 3, 2018.
www.investmentbanking.deloitte.com | Page 10

Quarterly update | Q2 2018 | Consumer Products and Retail
Phil [email protected]+1 704 333 0533
Jonathan [email protected]+1 214 840 1779
Keith [email protected]+1 404 631 3455
Eric [email protected]+1 704 333 0518
Tony Blanchard [email protected]+1 313 396 3738
Doug [email protected]+1 704 731 7219
Hector [email protected]+1 404 631 3015
Nick [email protected]+1 212 436 3273
John [email protected]+1 704 333 0574
Lorin [email protected]+1 704 333 0591
Will [email protected]+1 312 486 4458
Mike [email protected]+1 213 996 4901
Simon Gisby [email protected]+1 212 436 2495
Bill [email protected]+1 980 312 3613
Jamie [email protected]+1 214 840 7057
James [email protected]+1 704 731 8230
Byron [email protected]+1 469 417 2462
Jonathan Ohm [email protected]+1 212 436 2287
Lou [email protected]+1 704 731 7202
Jason [email protected]+1 704 333 0136
Matt [email protected]+1 704 731 7186
Ron [email protected]+1 404 631 3710
Justin [email protected]+1 404 942 6960
Tom [email protected]+1 214 840 7014
Vijay [email protected]+1 212 313 1723
Charlie [email protected]+1 704 731 7201
Deloitte Corporate Finance LLC (DCF)
DCF provides deal execution and lead financial advisory services to large corporate, middle market, private equity and venture capital firms. DCF and its affiliates maintain a presence in key US financial centers.
For additional information or to find out more about how DCF can assist the deal initiation and execution process, please contact one of our DCF Managing Directors:
Brad HestonSenior Vice President [email protected]+1 404 631 3839
Deloitte Corporate Finance Business Development Group:
www.investmentbanking.deloitte.com
John LindseySenior Vice [email protected]+1 469 417 2147
Bill PucciSenior Vice President [email protected]+1 973 602 4542

Quarterly update | Q2 2018 | Consumer Products and Retail
This newsletter is a periodic compilation of certain completed and announced merger and acquisition activity. Information contained in this newsletter should not be construed as a recommendation to sell or a recommendation to buy any security. Anyreference to or omission of any reference to any company in this newsletter shall not be construed as a recommendation to sell, buy or take any other action with respect to any security of any such company. We are not soliciting any action with respect to any security or company based on this newsletter. This newsletter is published solely for the general information of clients andfriends of Deloitte Corporate Finance LLC. It does not take into account the particular investment objectives, financial situation, or needs of individual recipients. Certain transactions, including those involving early stage companies, give rise to substantial risk and are not suitable for all investors. This newsletter is based on information that we consider reliable, but we do not represent that it is accurate or complete, and it should not be relied upon as such. Prediction of future events is inherently subject to both known risks, uncertainties and other factors that may cause actual results to vary materially. We are under no obligation to update the information contained in this newsletter. We and our affiliates and related entities, partners, principals, directors, and employees, including persons involved in the preparation or issuance of this newsletter, may from time to time have “long” and “short” positions in, and buy or sell, the securities, or derivatives (including options) thereof, of companies mentioned herein. The companies mentioned in this newsletter may be: (i) investment banking clients of Deloitte Corporate Finance LLC; or (ii) clients of Deloitte Financial Advisory Services LLP and its related entities. The decision to include any company for mention or discussion in this newsletter is wholly unrelated to any audit or other services that Deloitte Corporate Finance LLC may provide or to any audit services or any services that any of its affiliates or related entities may provide to such company. No part of this newsletter may be copied or duplicated in any form by any means, or redistributed without the prior written consent of Deloitte Corporate Finance LLC.
About Deloitte
Deloitte Corporate Finance LLC, an SEC registered broker-dealer and member of FINRA and SIPC, is an indirect wholly-owned subsidiary of Deloitte Financial Advisory Services LLP and affiliate of Deloitte Transactions and Business Analytics LLP. Investment banking products and services within the United States are offered exclusively through Deloitte Corporate Finance LLC. For more information, visit www.investmentbanking.deloitte.com. Please see http://www.deloitte.com/us/about for a detailed description of our legal structure. Certain services may not be available to attest clients under the rules and regulations of public accounting.
Copyright © 2018 Deloitte Development LLC. All rights reserved.
www.investmentbanking.deloitte.com | Page 12


![INDEX [] LG-1550 LIEBHERR LTM 1500 LIEBHERR LTM-1400 LIEBHERR LTM-1225 LIEBHERR LTM-1220 LIEBHERR ... Cranes_over100tons.pdf](https://img.pdfslide.us/doc/110x75/5b07232e7f8b9ae9628e08fa/index-lg-1550-liebherr-ltm-1500-liebherr-ltm-1400-liebherr-ltm-1225-liebherr.jpg)