Embed Size (px)
Citation preview
1
Consumer preferences for farmed organic salmon and eco-labelled wild salmon in
Denmark1
Ankamah-Yeboah Isaac1, Frank Asche
2, Julia Bronnmann
3, Max Nielsen
4, Rasmus Nielsen
5
1,4,5Department of Food and Resource Economics, Faculty of Science, University of Copenhagen,
Rolighedsvej 25, 1958 Frederiksberg C, Denmark 2Institute of Sustainable Food Systems, School of Forest Resources and Conservation, University of
Florida, Gainesville, USA 3Department of Agricultural Economics, University of Kiel, Germany
1Corresponding author: Tel: +45 353-33755
Abstract
Sustainably produced food products have rapidly grown in popularity within the last years. Eco-
labeling systems to indicate the environmental sustainability of product have also been implemented in
the seafood market, with the MSC label for wild fish as the leading one. However, it is not clear
whether consumers really notice the values behind an eco-label and how important these attributes are
in their purchasing decision. This study analyzes data from a large household scanner panel to
investigate actual consumer purchasing behavior and preferences when faced with competing product
attributes such as organic and MSC labeled for salmon in Denmark. To accomplish these objectives
and explicitly account for consumer heterogeneity, a mixed logit as well as a latent class model is
applied. The results indicate substantial consumer heterogeneity with respect to MSC-labeled wild
salmon and organic labeled farmed salmon, with a negative preference on average. The latent class
model reveal the picture. In total, we find 5 segments, where 3 segments have no preference for eco-
labeled salmon at all. The study shows that there is approximately a combined 50% chance of a
consumer belonging to one of the segments that have a preference for eco-labeled salmon.
Keys: Eco-labeling, Salmon, Demand Preferences, Random Coefficient approach
JEL Classification: C23, D12, Q11, Q22
Introduction
While rapidly gaining increased popularity, at least when measured by the number of labeled products
offered, ecolabels remain controversial as it is far from obvious that they lead to real changes in
consumer behavior and thereby more sustainable production practices. A main reason for the
controversy is that there are few studies that have access to data that allows actual consumer behavior
to be measured. Using survey data to investigate consumer preferences or market data to estimate
premiums associated with ecolabels, one can obtain indirect evidence that an ecolabel is a useful signal,
but it is not conclusive evidence. This challenge is well illustrated with seafood, where there exist a
number of studies providing indirect evidence that an ecolabel will be effective. However, there exist to
our knowledge only two studies that investigate actual market impacts due to ecolabels for seafood.
1 Acknowledgement: This work is part of RobustFish. RobustFish is part of the Organic RDD 2 programme, which is
coordinated by International Centre for Research in Organic Food Systems (ICROFS). It has received grants from the Green Growth and Development programme (GUDP) under the Danish Ministry of Food, Agriculture and Fisheries.
2
Teisl et al (2002) indicate that the dolphin safe label on canned tuna increased demand for labeled
products. Villas-Boas and Hallstein (2013) investigate the impact of traffic-light labeling in a
California retail chain.2 The main result here is that consumers reduce their purchase of seafood with a
yellow label, while the green and red labels have limited impact. In this paper we will add to this
literature using household scanner data from Denmark to investigate consumer purchases of salmon.
The scanner data also contain demographic information, allowing us to investigate to what extent the
influence of ecolabels vary for groups of consumers – a feature that turns out to be important.
Since ecolabels for seafood was first introduced at the turn of the century, a large number of studies
using survey data indicated a strong preference for the ecolabel and a substantial positive willingness-
to-pay (WTP) for products carrying the ecolabel (Wessells et al., 1999; Johnston et al., 2001; Jaffry et
al., 2004; Johnston and Roheim, 2006; Brécard et al., 2009; Salladarré et al., 2010; Uchida et al.,
2014a,b; Fonner and Sylvia, 2016). Gudmundsson and Roheim (2000) show that a necessary condition
for an ecolabel to change producer behavior toward more sustainable practices is that it is profitable for
them. Accordingly, there must be a price premium associated with supplying product with an ecolabel.
In recent years, this has motivated a number of studies using market data to show that there is a positive
premium associated with many ecolabeled products. These are mostly hedonic price studies (Roheim,
Asche and Insignaris, 2011; Sogn-Grundvag, Larsen and Young, 2014; Asche et al, 2015; Blomquist,
Bardolino and Waldo, 2015; Ankamah-Yeboah et al, 2016; Bronnman and Asche, 2016), but there are
also other approaches (Wakamatsu, 2014; Stemle, Uchida and Roheim, 2015). These studies provide
evidence that in a large number of cases, there is a positive premium associated with an ecolabel.
However, the actual market impact of ecolabels is contested, as is the existence of the price premium
associated with the label (OECD, 2006; Washington, 2008). In a study not focusing on seafood,
Grunert, Hielke and Wills (2014) provide support for the critics in reporting evidence that general
concern about sustainability does not influence actual purchasing behavior to any extent.
A potential challenge with the price premium literature is that it does not account for the potential
consumer response to the higher price. The theory of the consumer indicates that ceteris paribus, a
higher price will lead to a lower quantity being purchased. However, this can be offset if the consumers
have a sufficiently strong preference for sustainable produced seafood that they are willing to pay the
higher price. Whether this is the case is of course an empirical question, although the results from the
consumer preference literature indicate that this may willl be the case. The consumer preference studies
also recognize that different groups of consumers may have different preferences with respect to the
ecolabel, and try to capture this by estimating the taste preferences to follow certain distribution or
clusters that are linked to demographic variables. This is a challenge for the price premium literature
that have been using store scanner data without taking account of consumer characteristics and
heterogeneity in preferences among consumers.
In this paper we will investigate the impact of ecolabels (specifically organic and Marine Stewardship
Council) on salmon demand in Denmark using household scanner data. These data capture consumer
behavior on actual household purchases. In addition, substantial information is available on
demographic characteristics of the consumers. Consumer heterogeneity will be accounted for by the
two most common approaches in the literature: A mixed multinomial logit model (MMNL) where
consumer heterogeneity is accounted for by random parameters, and a latent class model (LCM) where
heterogeneity is accounted for by consumer segments. The LCM is used to augment the MMNL in this
study in that, linking heterogeneity to households’ socio-demographic profile is interesting than merely
2 In addition, Stemle, Uchida and Roheim (2016) provides mixed evidence with respect to price effects using Ex. Vessel data in the US and Japan, and Blomquist, Bardolino and Waldo (2016) find that the existence of a price premium depend on the supply chain being served.
3
knowing the distribution of their preferences. Denmark is an interesting country to conduct such a
study, as it has a long tradition for buying organic food products. Organic products have a market share
of 8% in Denmark, that is ranked highest in the world (Willer and Lernoud, 2016).
Data Description
Consumer household scanner data are provided by the ‘Gesellschaft für Konsumforschung’ (GFK) for
the year 2014 and include about 2800 households. Households scan their food purchases on a daily
basis. Using ‘European Article Number’ (EAN) codes, each purchased salmon product can clearly be
identified. The panelists further add information about the point and date of purchase as well as
whether or not the product was on sale. The data set contains 1,477 salmon consuming households with
6,432 purchase transactions. Among the households, we select only those households that purchased
packages of salmon at least on five weeks within the observation period. In accordance with the
literature (Allender and Richards 2012), we furthermore choose those households that only purchase
one salmon product at a time. If households buy more than one product at one purchase event, we
cannot distinguish between households that are variety seekers and households that consist of several
members with diverging preferences. Furthermore, a prerequisite of the mixed logit model is that the
choices are mutually exclusive.
There are 257 distinct product alternatives (EAN codes) in the data. To simplify, products with less
than 0.5% choice share were identified with a common identifier, hence, collapsing the total
alternatives to 44 products. The data set identify 6 homogenous categories of distribution channels,
Coop, Dansk Supermarked, Reitan, SuperGros, Internet/Mail Order and Other Food, where the first
four are the main retail chains. Since we also need to specify the available alternatives that the
household did not choose, the household choice set is designed to include all product alternatives that
were available in the distribution channels visited. This reflects the changing product lines that gets
introduced or removed from the retail shelf. The alternative nonchosen price faced by the household is
calculated as the average unit price that is observed in the distribution channel visited during the
specified period. As a result, prices vary over time and between households according to the
distribution chain visited. In some situations, there are no alternatives available within a given week
for the chain visited; these purchases are therefore excluded from the analysis. Hence, the choice set in
our analysis is made up of 474 households with an average of 9 choice sets/purchase situations,
summing up to 4,047 purchase situations. With varying number of alternatives and purchase situations,
we analyze a total of 41,904 observations.
Most salmon consumed in Denmark is farmed and imported. The only ecolabel available for these
products are organic labeling.3 There is also some wild salmon in the data set, which all carry the label
of the Marine Stewardship Council (MSC). The MSC-label is the most common ecolabel for seafood,
but it only labels wild seafood. While the literature in the 1990s indicated that there were a positive
preference for farmed seafood (Gu and Anderson, 1995; Holland and Wessells, 1998), there is now
increasing evidence of a preference for wild seafood (Salladarré et al., 2010; Roheim et al., 2012;
Uchida et al., 2014a). As our data do not contain observations with unlabeled wild salmon, hence we
are not able to test any hypothesis with respect to wild versus farmed, and we will not be able to
estimate if there is preference associated with MSC for salmon in Denmark over the wild.
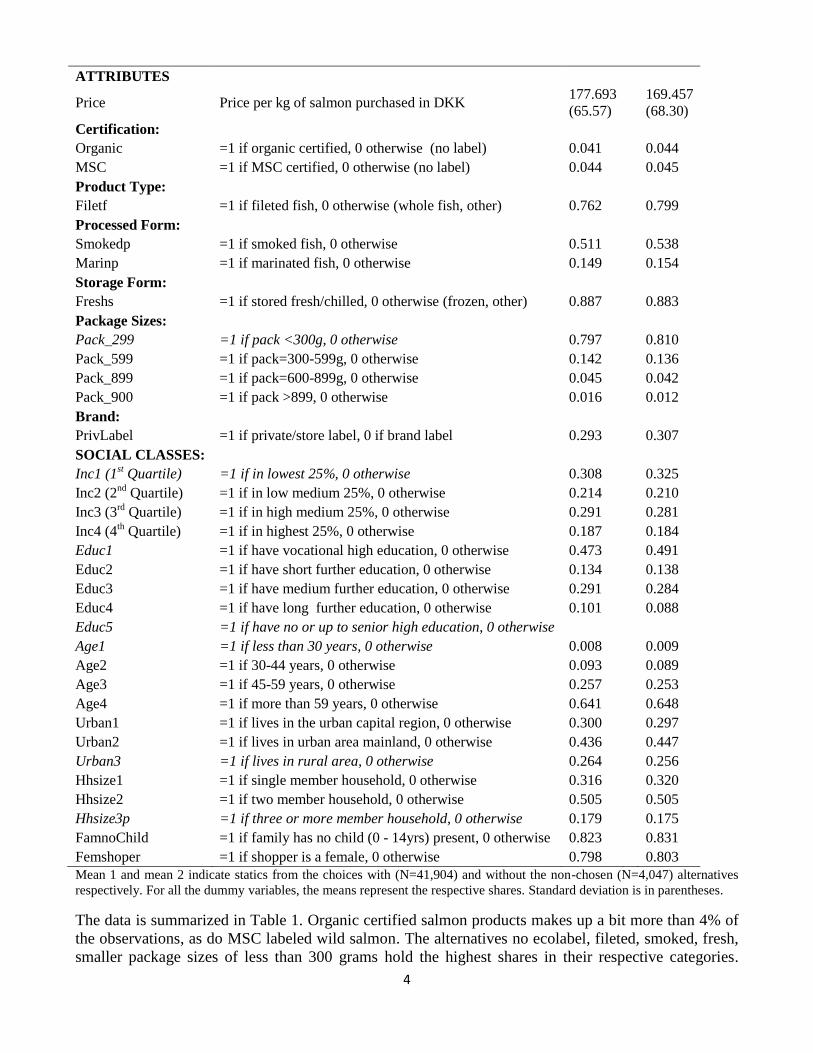
Table 1 Data summary of variables used in Estimations
Variable Description Mean 1 Mean 2
3 The Aquaculture Stewardship Council (ASC) was established first in 2012, and there are no products with that label in our data set. This is also similar to the setting observed by Asche et al (2015).
4
ATTRIBUTES
Price Price per kg of salmon purchased in DKK 177.693
(65.57)
169.457
(68.30)
Certification:
Organic =1 if organic certified, 0 otherwise (no label) 0.041 0.044
MSC =1 if MSC certified, 0 otherwise (no label) 0.044 0.045
Product Type:
Filetf =1 if fileted fish, 0 otherwise (whole fish, other) 0.762 0.799
Processed Form:
Smokedp =1 if smoked fish, 0 otherwise 0.511 0.538
Marinp =1 if marinated fish, 0 otherwise 0.149 0.154
Storage Form:
Freshs =1 if stored fresh/chilled, 0 otherwise (frozen, other) 0.887 0.883
Package Sizes:
Pack_299 =1 if pack <300g, 0 otherwise 0.797 0.810
Pack_599 =1 if pack=300-599g, 0 otherwise 0.142 0.136
Pack_899 =1 if pack=600-899g, 0 otherwise 0.045 0.042
Pack_900 =1 if pack >899, 0 otherwise 0.016 0.012
Brand:
PrivLabel =1 if private/store label, 0 if brand label 0.293 0.307
SOCIAL CLASSES:
Inc1 (1st Quartile) =1 if in lowest 25%, 0 otherwise 0.308 0.325
Inc2 (2nd
Quartile) =1 if in low medium 25%, 0 otherwise 0.214 0.210
Inc3 (3rd
Quartile) =1 if in high medium 25%, 0 otherwise 0.291 0.281
Inc4 (4th Quartile) =1 if in highest 25%, 0 otherwise 0.187 0.184
Educ1 =1 if have vocational high education, 0 otherwise 0.473 0.491
Educ2 =1 if have short further education, 0 otherwise 0.134 0.138
Educ3 =1 if have medium further education, 0 otherwise 0.291 0.284
Educ4 =1 if have long further education, 0 otherwise 0.101 0.088
Educ5 =1 if have no or up to senior high education, 0 otherwise
Age1 =1 if less than 30 years, 0 otherwise 0.008 0.009
Age2 =1 if 30-44 years, 0 otherwise 0.093 0.089
Age3 =1 if 45-59 years, 0 otherwise 0.257 0.253
Age4 =1 if more than 59 years, 0 otherwise 0.641 0.648
Urban1 =1 if lives in the urban capital region, 0 otherwise 0.300 0.297
Urban2 =1 if lives in urban area mainland, 0 otherwise 0.436 0.447
Urban3 =1 if lives in rural area, 0 otherwise 0.264 0.256
Hhsize1 =1 if single member household, 0 otherwise 0.316 0.320
Hhsize2 =1 if two member household, 0 otherwise 0.505 0.505
Hhsize3p =1 if three or more member household, 0 otherwise 0.179 0.175
FamnoChild =1 if family has no child (0 - 14yrs) present, 0 otherwise 0.823 0.831
Femshoper =1 if shopper is a female, 0 otherwise 0.798 0.803
Mean 1 and mean 2 indicate statics from the choices with (N=41,904) and without the non-chosen (N=4,047) alternatives
respectively. For all the dummy variables, the means represent the respective shares. Standard deviation is in parentheses.
The data is summarized in Table 1. Organic certified salmon products makes up a bit more than 4% of
the observations, as do MSC labeled wild salmon. The alternatives no ecolabel, fileted, smoked, fresh,
smaller package sizes of less than 300 grams hold the highest shares in their respective categories.
5
Private label on the other hand hold the least share4. The demographic variables include income,
education, age, the degree of urbanization of the community, household size, children and gender of
shopper. Age of the shopper is skewed with those over 60 years representing more than 60% of the
sample.5
Model Specification
Discrete choice modelling is based on the random utility theory (McFadden, 1974) and Lancaster
(1966) approach to individual utility maximization problem. Lancaster’s theory postulates that,
consumers derive utility from the attributes by which the product is described. According to the random
utility theory, utility is a latent construct in the consumer’s mind that cannot be directly observed.
Consider a consumer (decision-maker) who faces 𝐽 product alternatives in each of 𝑇 choice situations
(time periods), typically assuming that choice situations can vary among consumers and choice set can
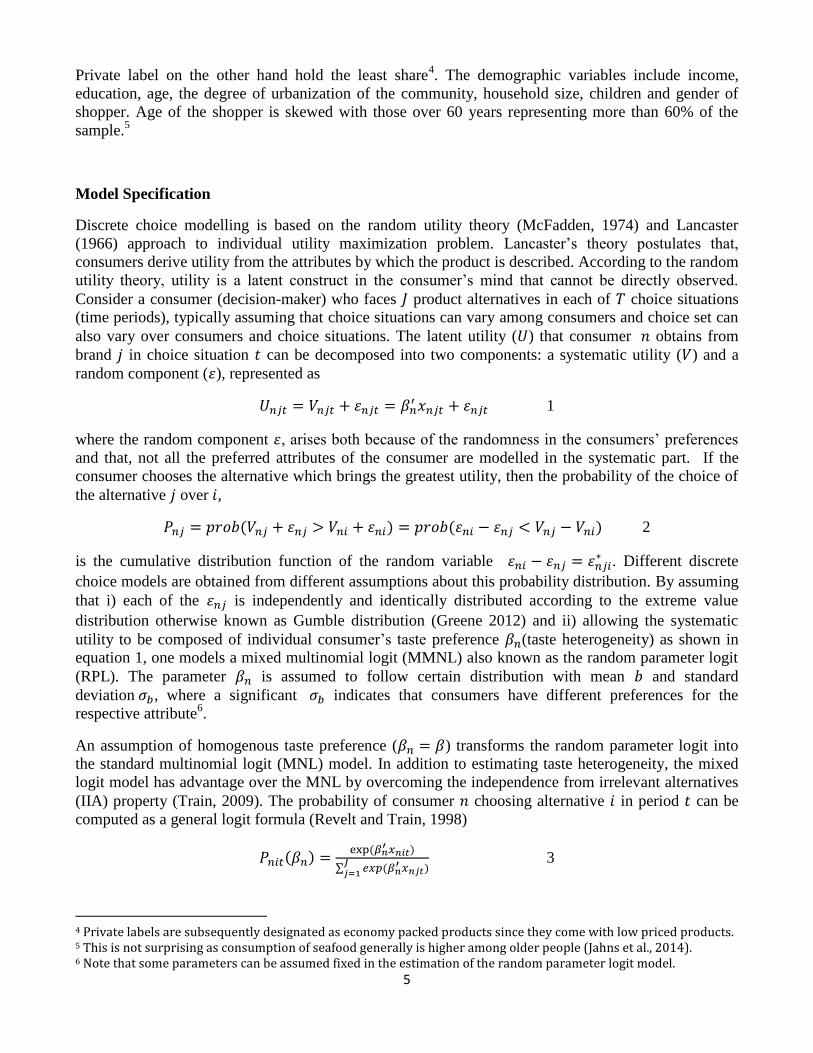
also vary over consumers and choice situations. The latent utility (𝑈) that consumer 𝑛 obtains from
brand 𝑗 in choice situation 𝑡 can be decomposed into two components: a systematic utility (𝑉) and a
random component (𝜀), represented as
𝑈𝑛𝑗𝑡 = 𝑉𝑛𝑗𝑡 + 𝜀𝑛𝑗𝑡 = 𝛽𝑛′ 𝑥𝑛𝑗𝑡 + 𝜀𝑛𝑗𝑡 1
where the random component 𝜀, arises both because of the randomness in the consumers’ preferences
and that, not all the preferred attributes of the consumer are modelled in the systematic part. If the
consumer chooses the alternative which brings the greatest utility, then the probability of the choice of
the alternative 𝑗 over 𝑖,
𝑃𝑛𝑗 = 𝑝𝑟𝑜𝑏(𝑉𝑛𝑗 + 𝜀𝑛𝑗 > 𝑉𝑛𝑖 + 𝜀𝑛𝑖) = 𝑝𝑟𝑜𝑏(𝜀𝑛𝑖 − 𝜀𝑛𝑗 < 𝑉𝑛𝑗 − 𝑉𝑛𝑖) 2
is the cumulative distribution function of the random variable 𝜀𝑛𝑖 − 𝜀𝑛𝑗 = 𝜀𝑛𝑗𝑖∗ . Different discrete
choice models are obtained from different assumptions about this probability distribution. By assuming
that i) each of the 𝜀𝑛𝑗 is independently and identically distributed according to the extreme value
distribution otherwise known as Gumble distribution (Greene 2012) and ii) allowing the systematic
utility to be composed of individual consumer’s taste preference 𝛽𝑛(taste heterogeneity) as shown in
equation 1, one models a mixed multinomial logit (MMNL) also known as the random parameter logit
(RPL). The parameter 𝛽𝑛 is assumed to follow certain distribution with mean 𝑏 and standard
deviation 𝜎𝑏, where a significant 𝜎𝑏 indicates that consumers have different preferences for the
respective attribute6.
An assumption of homogenous taste preference (𝛽𝑛 = 𝛽) transforms the random parameter logit into
the standard multinomial logit (MNL) model. In addition to estimating taste heterogeneity, the mixed
logit model has advantage over the MNL by overcoming the independence from irrelevant alternatives
(IIA) property (Train, 2009). The probability of consumer 𝑛 choosing alternative 𝑖 in period 𝑡 can be
computed as a general logit formula (Revelt and Train, 1998)
𝑃𝑛𝑖𝑡(𝛽𝑛) =exp (𝛽𝑛
′ 𝑥𝑛𝑖𝑡)
∑ 𝑒𝑥𝑝(𝛽𝑛′ 𝑥𝑛𝑗𝑡)
𝐽𝑗=1
3
4 Private labels are subsequently designated as economy packed products since they come with low priced products. 5 This is not surprising as consumption of seafood generally is higher among older people (Jahns et al., 2014). 6 Note that some parameters can be assumed fixed in the estimation of the random parameter logit model.
6
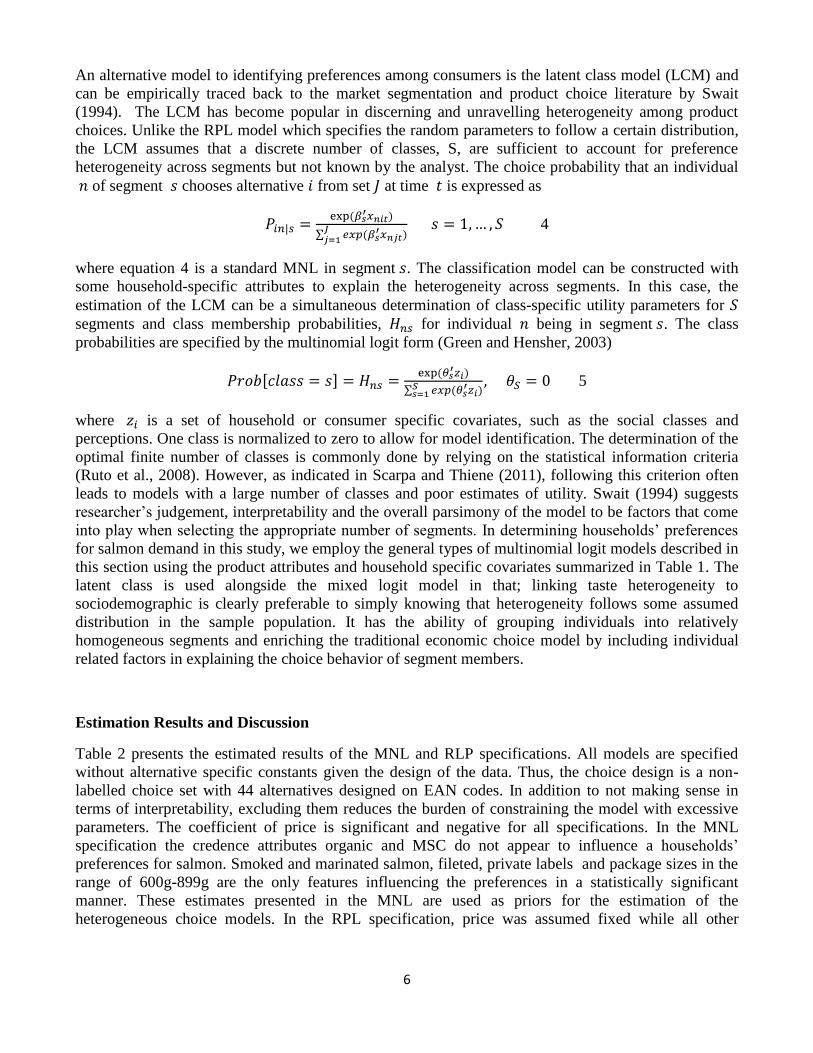
An alternative model to identifying preferences among consumers is the latent class model (LCM) and
can be empirically traced back to the market segmentation and product choice literature by Swait
(1994). The LCM has become popular in discerning and unravelling heterogeneity among product
choices. Unlike the RPL model which specifies the random parameters to follow a certain distribution,
the LCM assumes that a discrete number of classes, S, are sufficient to account for preference
heterogeneity across segments but not known by the analyst. The choice probability that an individual
𝑛 of segment 𝑠 chooses alternative 𝑖 from set 𝐽 at time 𝑡 is expressed as
𝑃𝑖𝑛|𝑠 =exp (𝛽𝑠
′𝑥𝑛𝑖𝑡)
∑ 𝑒𝑥𝑝(𝛽𝑠′𝑥𝑛𝑗𝑡)
𝐽𝑗=1
𝑠 = 1, … , 𝑆 4
where equation 4 is a standard MNL in segment 𝑠. The classification model can be constructed with
some household-specific attributes to explain the heterogeneity across segments. In this case, the
estimation of the LCM can be a simultaneous determination of class-specific utility parameters for 𝑆
segments and class membership probabilities, 𝐻𝑛𝑠 for individual 𝑛 being in segment 𝑠. The class
probabilities are specified by the multinomial logit form (Green and Hensher, 2003)
𝑃𝑟𝑜𝑏[𝑐𝑙𝑎𝑠𝑠 = 𝑠] = 𝐻𝑛𝑠 =exp (𝜃𝑠
′𝑧𝑖)
∑ 𝑒𝑥𝑝(𝜃𝑠′𝑧𝑖)𝑆
𝑠=1, 𝜃𝑆 = 0 5
where 𝑧𝑖 is a set of household or consumer specific covariates, such as the social classes and
perceptions. One class is normalized to zero to allow for model identification. The determination of the
optimal finite number of classes is commonly done by relying on the statistical information criteria
(Ruto et al., 2008). However, as indicated in Scarpa and Thiene (2011), following this criterion often
leads to models with a large number of classes and poor estimates of utility. Swait (1994) suggests
researcher’s judgement, interpretability and the overall parsimony of the model to be factors that come
into play when selecting the appropriate number of segments. In determining households’ preferences
for salmon demand in this study, we employ the general types of multinomial logit models described in
this section using the product attributes and household specific covariates summarized in Table 1. The
latent class is used alongside the mixed logit model in that; linking taste heterogeneity to
sociodemographic is clearly preferable to simply knowing that heterogeneity follows some assumed
distribution in the sample population. It has the ability of grouping individuals into relatively
homogeneous segments and enriching the traditional economic choice model by including individual
related factors in explaining the choice behavior of segment members.
Estimation Results and Discussion
Table 2 presents the estimated results of the MNL and RLP specifications. All models are specified
without alternative specific constants given the design of the data. Thus, the choice design is a non-
labelled choice set with 44 alternatives designed on EAN codes. In addition to not making sense in
terms of interpretability, excluding them reduces the burden of constraining the model with excessive
parameters. The coefficient of price is significant and negative for all specifications. In the MNL
specification the credence attributes organic and MSC do not appear to influence a households’
preferences for salmon. Smoked and marinated salmon, fileted, private labels and package sizes in the
range of 600g-899g are the only features influencing the preferences in a statistically significant
manner. These estimates presented in the MNL are used as priors for the estimation of the
heterogeneous choice models. In the RPL specification, price was assumed fixed while all other
7
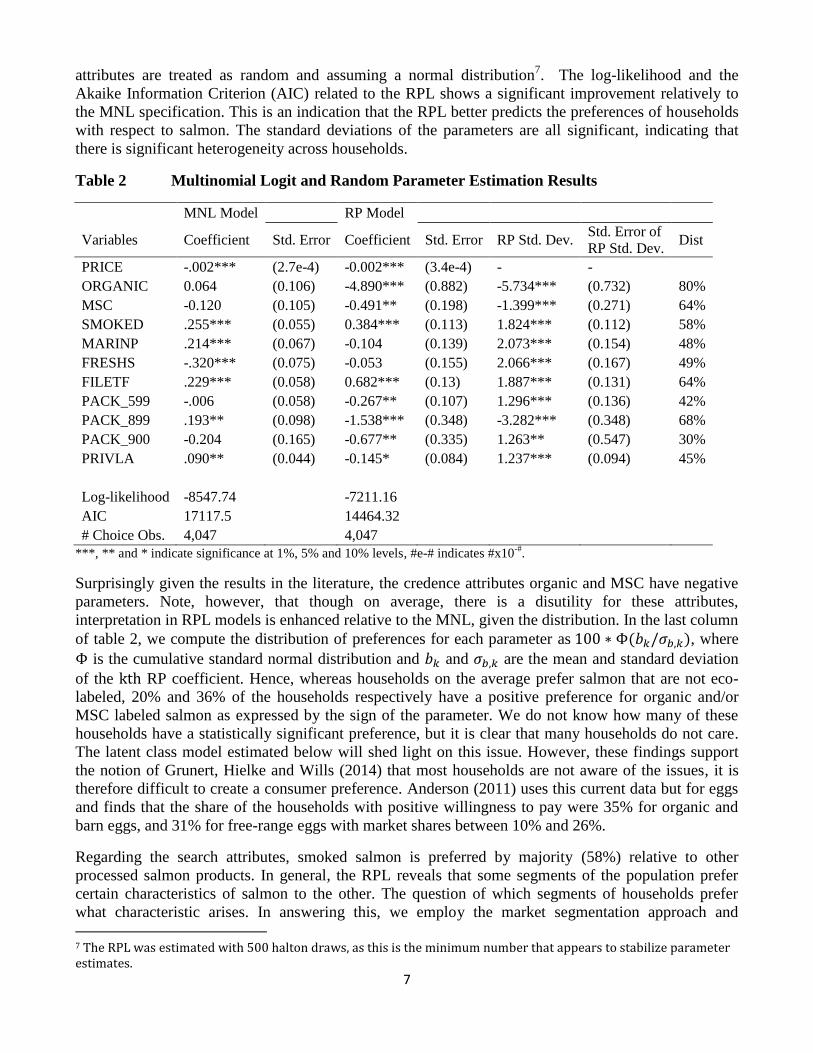
attributes are treated as random and assuming a normal distribution7. The log-likelihood and the
Akaike Information Criterion (AIC) related to the RPL shows a significant improvement relatively to
the MNL specification. This is an indication that the RPL better predicts the preferences of households
with respect to salmon. The standard deviations of the parameters are all significant, indicating that
there is significant heterogeneity across households.
Table 2 Multinomial Logit and Random Parameter Estimation Results
MNL Model RP Model
Variables Coefficient Std. Error Coefficient Std. Error RP Std. Dev. Std. Error of
RP Std. Dev. Dist
PRICE -.002*** (2.7e-4) -0.002*** (3.4e-4) - -
ORGANIC 0.064 (0.106) -4.890*** (0.882) -5.734*** (0.732) 80%
MSC -0.120 (0.105) -0.491** (0.198) -1.399*** (0.271) 64%
SMOKED .255*** (0.055) 0.384*** (0.113) 1.824*** (0.112) 58%
MARINP .214*** (0.067) -0.104 (0.139) 2.073*** (0.154) 48%
FRESHS -.320*** (0.075) -0.053 (0.155) 2.066*** (0.167) 49%
FILETF .229*** (0.058) 0.682*** (0.13) 1.887*** (0.131) 64%
PACK_599 -.006 (0.058) -0.267** (0.107) 1.296*** (0.136) 42%
PACK_899 .193** (0.098) -1.538*** (0.348) -3.282*** (0.348) 68%
PACK_900 -0.204 (0.165) -0.677** (0.335) 1.263** (0.547) 30%
PRIVLA .090** (0.044) -0.145* (0.084) 1.237*** (0.094) 45%
Log-likelihood -8547.74 -7211.16
AIC 17117.5 14464.32
# Choice Obs. 4,047 4,047
***, ** and * indicate significance at 1%, 5% and 10% levels, #e-# indicates #x10-#
.
Surprisingly given the results in the literature, the credence attributes organic and MSC have negative
parameters. Note, however, that though on average, there is a disutility for these attributes,
interpretation in RPL models is enhanced relative to the MNL, given the distribution. In the last column
of table 2, we compute the distribution of preferences for each parameter as 100 ∗ Φ(𝑏𝑘/𝜎𝑏,𝑘), where
Φ is the cumulative standard normal distribution and 𝑏𝑘 and 𝜎𝑏,𝑘 are the mean and standard deviation
of the kth RP coefficient. Hence, whereas households on the average prefer salmon that are not eco-
labeled, 20% and 36% of the households respectively have a positive preference for organic and/or
MSC labeled salmon as expressed by the sign of the parameter. We do not know how many of these
households have a statistically significant preference, but it is clear that many households do not care.
The latent class model estimated below will shed light on this issue. However, these findings support
the notion of Grunert, Hielke and Wills (2014) that most households are not aware of the issues, it is
therefore difficult to create a consumer preference. Anderson (2011) uses this current data but for eggs
and finds that the share of the households with positive willingness to pay were 35% for organic and
barn eggs, and 31% for free-range eggs with market shares between 10% and 26%.
Regarding the search attributes, smoked salmon is preferred by majority (58%) relative to other
processed salmon products. In general, the RPL reveals that some segments of the population prefer
certain characteristics of salmon to the other. The question of which segments of households prefer
what characteristic arises. In answering this, we employ the market segmentation approach and 7 The RPL was estimated with 500 halton draws, as this is the minimum number that appears to stabilize parameter estimates.
8
estimate a latent class model capable of unravelling the sources of heterogeneity among agents. The
estimated results are presented in Table 3.
When determining the optimal number of latent classes, the researcher’s intuition on interpretability of
parameters and well estimated parameters factoring in higher standard errors and collinearity issues
arising from increasing number of classes are used as a gauge. In this case, we settle on a five segment
latent class model where segment 3 is used as the reference for the class membership model for model
identification purposes. In the class probability model, age group 1 and 2 are bundled because they
form only a smaller share (see Table 1) of the sample and because of collinearity problems in the
estimation.
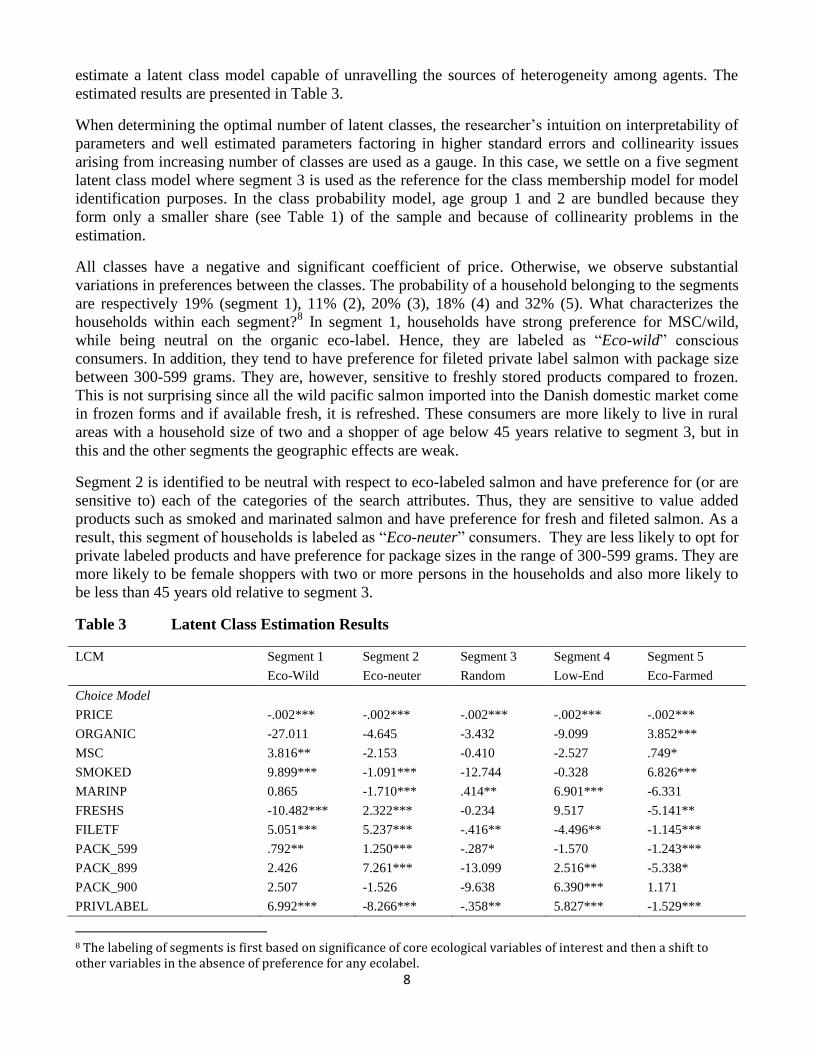
All classes have a negative and significant coefficient of price. Otherwise, we observe substantial
variations in preferences between the classes. The probability of a household belonging to the segments
are respectively 19% (segment 1), 11% (2), 20% (3), 18% (4) and 32% (5). What characterizes the
households within each segment?8 In segment 1, households have strong preference for MSC/wild,
while being neutral on the organic eco-label. Hence, they are labeled as “Eco-wild” conscious
consumers. In addition, they tend to have preference for fileted private label salmon with package size
between 300-599 grams. They are, however, sensitive to freshly stored products compared to frozen.
This is not surprising since all the wild pacific salmon imported into the Danish domestic market come
in frozen forms and if available fresh, it is refreshed. These consumers are more likely to live in rural
areas with a household size of two and a shopper of age below 45 years relative to segment 3, but in
this and the other segments the geographic effects are weak.
Segment 2 is identified to be neutral with respect to eco-labeled salmon and have preference for (or are
sensitive to) each of the categories of the search attributes. Thus, they are sensitive to value added
products such as smoked and marinated salmon and have preference for fresh and fileted salmon. As a
result, this segment of households is labeled as “Eco-neuter” consumers. They are less likely to opt for
private labeled products and have preference for package sizes in the range of 300-599 grams. They are
more likely to be female shoppers with two or more persons in the households and also more likely to
be less than 45 years old relative to segment 3.
Table 3 Latent Class Estimation Results
LCM Segment 1 Segment 2 Segment 3 Segment 4 Segment 5
Eco-Wild Eco-neuter Random Low-End Eco-Farmed
Choice Model
PRICE -.002*** -.002*** -.002*** -.002*** -.002***
ORGANIC -27.011 -4.645 -3.432 -9.099 3.852***
MSC 3.816** -2.153 -0.410 -2.527 .749*
SMOKED 9.899*** -1.091*** -12.744 -0.328 6.826***
MARINP 0.865 -1.710*** .414** 6.901*** -6.331
FRESHS -10.482*** 2.322*** -0.234 9.517 -5.141**
FILETF 5.051*** 5.237*** -.416** -4.496** -1.145***
PACK_599 .792** 1.250*** -.287* -1.570 -1.243***
PACK_899 2.426 7.261*** -13.099 2.516** -5.338*
PACK_900 2.507 -1.526 -9.638 6.390*** 1.171
PRIVLABEL 6.992*** -8.266*** -.358** 5.827*** -1.529***
8 The labeling of segments is first based on significance of core ecological variables of interest and then a shift to other variables in the absence of preference for any ecolabel.
9
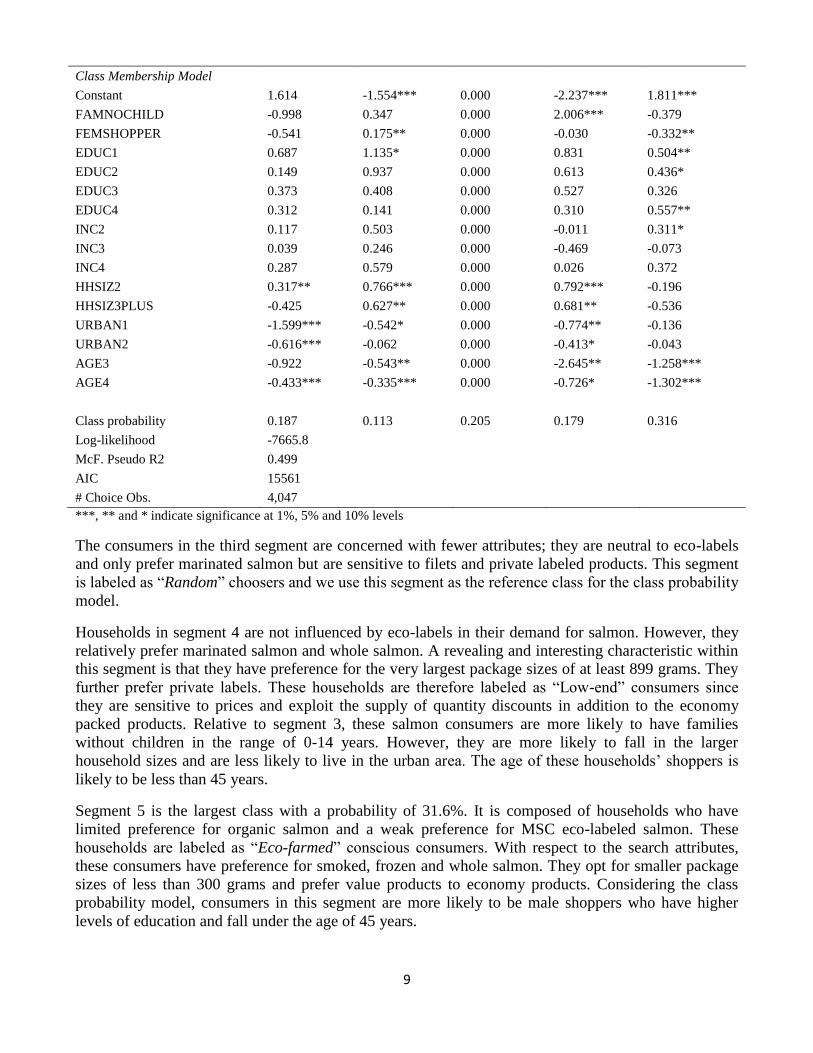
Class Membership Model
Constant 1.614 -1.554*** 0.000 -2.237*** 1.811***
FAMNOCHILD -0.998 0.347 0.000 2.006*** -0.379
FEMSHOPPER -0.541 0.175** 0.000 -0.030 -0.332**
EDUC1 0.687 1.135* 0.000 0.831 0.504**
EDUC2 0.149 0.937 0.000 0.613 0.436*
EDUC3 0.373 0.408 0.000 0.527 0.326
EDUC4 0.312 0.141 0.000 0.310 0.557**
INC2 0.117 0.503 0.000 -0.011 0.311*
INC3 0.039 0.246 0.000 -0.469 -0.073
INC4 0.287 0.579 0.000 0.026 0.372
HHSIZ2 0.317** 0.766*** 0.000 0.792*** -0.196
HHSIZ3PLUS -0.425 0.627** 0.000 0.681** -0.536
URBAN1 -1.599*** -0.542* 0.000 -0.774** -0.136
URBAN2 -0.616*** -0.062 0.000 -0.413* -0.043
AGE3 -0.922 -0.543** 0.000 -2.645** -1.258***
AGE4 -0.433*** -0.335*** 0.000 -0.726* -1.302***
Class probability 0.187 0.113 0.205 0.179 0.316
Log-likelihood -7665.8
McF. Pseudo R2 0.499
AIC 15561
# Choice Obs. 4,047
***, ** and * indicate significance at 1%, 5% and 10% levels
The consumers in the third segment are concerned with fewer attributes; they are neutral to eco-labels
and only prefer marinated salmon but are sensitive to filets and private labeled products. This segment
is labeled as “Random” choosers and we use this segment as the reference class for the class probability
model.
Households in segment 4 are not influenced by eco-labels in their demand for salmon. However, they
relatively prefer marinated salmon and whole salmon. A revealing and interesting characteristic within
this segment is that they have preference for the very largest package sizes of at least 899 grams. They
further prefer private labels. These households are therefore labeled as “Low-end” consumers since
they are sensitive to prices and exploit the supply of quantity discounts in addition to the economy
packed products. Relative to segment 3, these salmon consumers are more likely to have families
without children in the range of 0-14 years. However, they are more likely to fall in the larger
household sizes and are less likely to live in the urban area. The age of these households’ shoppers is
likely to be less than 45 years.
Segment 5 is the largest class with a probability of 31.6%. It is composed of households who have
limited preference for organic salmon and a weak preference for MSC eco-labeled salmon. These
households are labeled as “Eco-farmed” conscious consumers. With respect to the search attributes,
these consumers have preference for smoked, frozen and whole salmon. They opt for smaller package
sizes of less than 300 grams and prefer value products to economy products. Considering the class
probability model, consumers in this segment are more likely to be male shoppers who have higher
levels of education and fall under the age of 45 years.
10
Conclusion
During the last decade, a number of papers have provided strong evidence that ecolabels for seafood
work. Survey and experimental data indicate a consumer WTP for ecolabels, and number of hedonic
price studies find a premium. However, this evidence only provides strong indications as the first set of
studies do not use market data and the second set measures a price effect, but not the quantity effect.
With a downward sloping demand schedule, the observed price premium does not need to originate
from an outward shift of the schedule, it can be just a movement along the schedule. To separate these
outcomes, quantity effects need to be accounted for. The evidence from the two studies doing this is
mixed. Teisl et al (2003) provide evidence that the dolphin safe tuna label led to a positive shift in
demand. Villa-Boas and Hallstein (2013) provide a much more mixed picture with unexpected results
in that the effect of traffic light cards was limited from red and green labeled seafood, but a string
negative effect for seafood with a yellow label.
In this study we use scanner data to investigate consumer preferences for salmon in Denmark. A mixed
logit indicates substantial consumer heterogeneity with respect to MSC-labeled wild salmon and
organic labeled farmed salmon, with a negative preference on average. A latent class model nuances
the picture. We find 5 segments, where 3 segments have no preference for ecolabeled salmon. The two
remaining segments both have a preference for ecolabeled salmon, but are otherwise different. The
smaller segment has a strong preference for MSC-labeled wild salmon, while the largest segment has
preference for organic salmon and a weak preference for MSC-labeled wild salmon.
The results nuance the picture of seafood ecolabels in the literature. One the one hand, the skeptics get
some support in that a large number of consumer do not care about the ecolabel. Whether that is
because they genuinely do not care or whether they just are not informed cannot be determined using
market data. However, Grunert, Hielke and Wills (2014) and Uchida et al (2014) indicate that it may be
a bit of both. The results indicate that there is almost a combined 50% chance of a consumer belonging
to one of the segments that have a preference for ecolabeled fish. These two groups are, as noted above
highly different though in having one with a strong preference for MSC-labeled wild salmon and the
other with a preference for organic farmed salmon. Hence, communication to consumers with a
preference for ecolabeled salmon is complicated by the different preferences in the two groups.
References
Allender, W., & Richards, T. (2012). Brand Loyality and price Promotion Strategies: An Empirical Analysis.
Journal of Retailing, Vol. 88, 323-342.
Ankamah-Yeboah, I., Nielsen, M., & Nielsen, R. (2016). Price premium of organic salmon in Danish retail
sale. Ecological Economics, 122, 54-60.
Asche, F., Larsen, T. A., Smith, M. D., Sogn-Grundvåg, G., & Young, J. A. (2015). Pricing of eco-labels with
retailer heterogeneity. Food Policy, 53, 82-93.
Blomquist, J., Bartolino, V., & Waldo, S. (2015). Price Premiums for Providing Eco‐labelled Seafood: Evidence
from MSC‐certified Cod in Sweden. Journal of Agricultural Economics, 66(3), 690-704.
Brécard, D., Hlaimi, B., Lucas, S., Perraudeau, Y., & Salladarré, F. (2009). Determinants of demand for green
products: An application to eco-label demand for fish in Europe. Ecological economics, 69(1), 115-125.
11
Bronnmann, J., & Asche, F. (2016). The value of product attributes, brands and private Labels: an analysis of
frozen seafood in Germany. Journal of Agricultural Economics, 67(1), 231-244.
Fonner, R., & Sylvia, G. (2015). Willingness to pay for multiple seafood labels in a niche market. Marine
Resource Economics, 30(1), 51-70.
Greene, W. (2012). Econometric Analysis. 7th Edition. Edinburg: Pearson.
Greene, W. H., & Hensher, D. A. (2003). A latent class model for discrete choice analysis: contrasts with mixed
logit. Transportation Research Part B: Methodological, 37(8), 681-698.
Grunert, K. G., Hieke, S., & Wills, J. (2014). Sustainability labels on food products: Consumer motivation,
understanding and use. Food Policy, 44, 177-189.
Gu, G., & Anderson, J. L. (1995). Deseasonalized state-space time series forecasting with application to the US
salmon market. Marine Resource Economics, 171-185.
Gudmundsson, E., & Wessells, C. R. (2000). Ecolabeling seafood for sustainable production: implications for
fisheries management. Marine Resource Economics, 97-113.
Holland, D., & Wessells, C. R. (1998). Predicting consumer preferences for fresh salmon: the influence of safety
inspection and production method attributes. Agricultural and Resource Economics Review, 27, 1-14.
Jaffry, S., Pickering, H., Ghulam, Y., Whitmarsh, D., & Wattage, P. (2004). Consumer choices for quality and
sustainability labelled seafood products in the UK. Food Policy, 29(3), 215-228.
Johnston, R. J., & Roheim, C. A. (2006). A battle of taste and environmental convictions for ecolabeled seafood:
A contingent ranking experiment. Journal of Agricultural and Resource Economics, 283-300.
Johnston, R. J., Wessells, C. R., Donath, H., & Asche, F. (2001). Measuring consumer preferences for
ecolabeled seafood: an international comparison.Journal of Agricultural and resource Economics, 20-39.
Lancaster, K. J. (1966). A new approach to consumer theory. The journal of political economy, 132-157.
McFadden, D. 1974. Conditional logit analysis of qualitative choice behavior. In Frontiers in Econometrics, ed.
P. Zerembka, 105–142. New York: Academic Press.
OECD High Seas Task Force (2006). Closing the Net: Stopping Illegal Fishing on the High Seas 2006.
Available at: https://www.oecd.org/sd-roundtable/papersandpublications/39375276.pdf (last accessed 2 October
2016).
Revelt, D., & Train, K. (1998). Mixed logit with repeated choices: households' choices of appliance efficiency
level. Review of economics and statistics, 80(4), 647-657.
Roheim, C. A., Asche, F., & Santos, J. I. (2011). The elusive price premium for ecolabelled products: evidence
from seafood in the UK market. Journal of Agricultural Economics, 62(3), 655-668.
Roheim, C. A., Sudhakaran, P. O., & Durham, C. A. (2012). Certification of shrimp and salmon for best
aquaculture practices: Assessing consumer preferences in Rhode Island. Aquaculture Economics &
Management, 16(3), 266-286.
Ruto, E., Garrod, G., & Scarpa, R. (2008). Valuing animal genetic resources: a choice modeling application to
indigenous cattle in Kenya. Agricultural Economics, 38(1), 89-98.
Salladarré, F., Guillotreau, P., Perraudeau, Y., & Monfort, M. C. (2010). The demand for seafood eco-labels in
France. Journal of Agricultural & Food Industrial Organization, 8(1).
12
Salladarré, F., Guillotreau, P., Perraudeau, Y., & Monfort, M.-C. (2010). The demand for seafood eco-labels in
France. Journal of Agricultural & Food Industrial Organization, 8(1), Article 10.
Scarpa, R., & Thiene, M. (2011). Organic food choices and Protection Motivation Theory: Addressing the
psychological sources of heterogeneity.Food quality and preference, 22(6), 532-541.
Sogn‐Grundvåg, G., Larsen, T. A., & Young, J. A. (2014). Product differentiation with credence attributes and
private labels: the case of whitefish in UK supermarkets. Journal of Agricultural Economics, 65(2), 368-382.
Stemle, A., Uchida, H., & Roheim, C. A. (2015). Have dockside prices improved after MSC certification?
analysis of multiple fisheries. Fisheries Research.
Swait, J. (1994). A structural equation model of latent segmentation and product choice for cross-sectional
revealed preference choice data. Journal of retailing and consumer services, 1(2), 77-89.
Teisl, M. F., Roe, B., & Hicks, R. L. (2002). Can eco-labels tune a market? Evidence from dolphin-safe
labeling. Journal of Environmental Economics and Management, 43(3), 339-359.
Train, K., 2009. In: Discrete Choice Methods with Simulation, 2nd ed. Cambridge University Press, New York.
Uchida, H., Onozaka, Y., Morita, T., & Managi, S. (2014). Demand for ecolabeled seafood in the Japanese
market: A conjoint analysis of the impact of information and interaction with other labels. Food Policy, 44, 68-
76.
Villas-Boas, S. B., & Hallstein, E. (2013). Are consumers color blind? An empirical investigation of a traffic
light advisory for sustainable seafood.Journal of Environmental Economics and Management, 66.
Wakamatsu, H. (2014). The impact of MSC certification on a Japanese certified fishery. Marine Resource
Economics, 29(1), 55-67.
Washington, S. (2008). Ecolabels and Marine Capture Fisheries: Current Practice and Emerging Issues,
GLOBEFISH Research Programme, Vol. 91 (Rome: FAO, 2008, pp. 52).
Wessells, C. R., Johnston, R. J., & Donath, H. (1999). Assessing consumer preferences for ecolabeled seafood:
the influence of species, certifier, and household attributes. American Journal of Agricultural Economics, 81(5),
1084-1089.
Willer, Helga and Julia Lernoud (Eds.) (2016): The World of organic Agriculture. Statistics and Emerging
Trends 2016. Research Institute of Organic Agriculture (FiBL), Frick, and IFOAM – Organics International,
Bonn.
Jahns, L., Raatz, S. K., Johnson, L. K., Kranz, S., Silverstein, J. T., & Picklo, M. J. (2014). Intake of seafood in
the US varies by age, income, and education level but not by race-ethnicity. Nutrients, 6(12), 6060-6075.
Andersen, L. M. (2011). Animal welfare and eggs–cheap talk or money on the counter? Journal of
Agricultural Economics, 62(3), 565-584.