Embed Size (px)
Citation preview

Consumer InsightsMarket Research Team
John Lundeen, Alison Krebs, Colleen Moore, Shawn Darcy

Key Business Questions Research/IntelligenceInsights/Project
1. How can we best tell our production story? • Image Content Analysis and Production Image Campaign
2. Who sells the beef at retail? • IRI Panel Data
3. Are we selling more beef at retail and foodservice?
• IRI Scanner Data/Meat Solutions, Foodservice Volumetric
4. Who buys and eats the beef - in-home (today and tomorrow)?
• IRI/Panel Data, NPD/National Eating Trends, Consumer Beef Index
5. What is the upside for beef in restaurants? • Chef Value Study. MillennialListening Panel
6. How do we take advantage of the “smoked beef” trend?
• Chef New Product Investigation
7. What about selling beef online? • Consumer Beef Index, IRI Panel Data, Millennial Listening Panel
Agenda – Answering the Key Questions
2

HOW CAN WE BEST TELL OUR PRODUCTION STORY?
Consumer Image Index, Online Content Review, Producer Image Campaign
3

Importance of Meat Industries Openly Sharing
Information
77% 38%42%
39% 38% 37%
2012 2013 2014 2015 2016
Disagree that Beef Openly Shares Information
Transparency perceptions, increasing but still room for improvement
46% 45%
Beef Chicken
Beef vs. Chicken
Agreement
Source: Consumer Image Index 2016 – October – November 2016 4

Stewardship Content Evaluation Testing
5
Antibiotic Infographic Feedyard/ Sustainability Kirkland Feedyard
Grass-fed? Antibiotics Resource Use
Source: MSW*ARS Research Stewardship Content Evaluation – October – December 2016

Antibiotic Use
Grass Fed
FactoryFarming Practices
Resource Use
Sustain-abilityInfographic Video
It was from a credible
source 74% 78% 78% 85% 79% 82%
Shift in Concerned
Target Group
-12.6 -11.5 -20.3 -24.1 -9.3 -16.3
Stewardship Content Evaluation Testing
Source: MSW*ARS Research Stewardship Content Evaluation – October – December 2016 6

LegendHIGH interest (Red) MODERATE interest (White) LOW interest( Blue)
Stewardship Content Evaluation Testing –Antibiotics Infographic
Reader Path Tool
Source: MSW*ARS Research Stewardship Content Evaluation – October – December 2016 7

Reactions Playback Antibiotic Concerned
Favorable Execution 54%Informational / Educational 12%
Graphics/Images well put together 9%
Too Busy 3%
The vast majority of consumers like the infographic
84%T2B
26%
57%
Enjoyment
Stewardship Content Evaluation Testing – Antibiotic Infographic
8Source: MSW*ARS Research Stewardship Content Evaluation – October – December 2016

Consumers - in their own words
9
What do you like about the Infographic?
Source: MSW*ARS Research Stewardship Content Evaluation – October – December 2016; Quotes reflect consumer perceptions on the content pieces tested, used for market research purposes only
“just how easy it was too understand and read”
the clean information is so educational”
“The images, and the colors, are striking, leads to want to read the
information”
“THE LAYOUT AND DESIGN MAKES YOU WANT TO READ
MORE OF IT”
“The facts outweigh what I've heard about antibiotics in beef”“It made me feel good knowing
that the animals are being treated humanely and when sick not
suffering.”
“Everything! Everything I read taught me something that I had no idea about. I
was completely wrong about antibiotics…”

10
Sustainability/Feedyard Video
Shifts in very/extremely concerned
Gen Pop Sustainability Concerned
Use of other growth technologies -5.7 -8.2What cattle are fed -7.0 -9.9Animal abuse/inhumane treatment -5.7 -7.3Use of chemicals at slaughter facilities -6.3 -7.7Food safety/food borne illnesses (E. coli) -10.0 -10.7
Sustainability (combined) -9.0 -16.3
Source: MSW*ARS Research Stewardship Content Evaluation – October – December 2016

50
55
60
65
70
75
80
85
0 10 20 30 40 50 60 70 80 90 100 110 120 130 140 150 160
Sustainable Prac. Conc. Gen Pop
“being socially responsible “
“because it touches on multiple important
issues”
“I like that everything from the cow is
being put to use.”
“because of what the farmer feed his cattle it gives us better quality
meat in our grocery store for our families”
“It makes me feel more positive toward people
like him who realize how important it is”
INTE
RES
T LE
VEL
SECONDS
The upfront talk of the meaning of beef sustainability and how feed
yards comply garners very positive interest for the first fourth.
The “privilege, not a right,” employment, and other social/
community aspects of beef sustainability keep interest increasing gradually for the
remainder of the spot.
Stewardship Content Evaluation Testing -Feedyard/Sustainability Video
PEAK: 76.9 END: 76.9
11Source: MSW*ARS Research Stewardship Content Evaluation – October – December 2016; Quotes reflect consumer perceptions on the content piece, used for market research purposes only

12
Sustainability/Feedyard Video
• Based on the content analysis that was done, Sustainability at the Feedyard video was posted to FactsAboutBeef.com (https://factsaboutbeef.com/2017/01/24/sustain
ability-at-the-feedyard/) and on YouTube (https://www.youtube.com/watch?v=2_KvrL8MlN
I).• This content is being promoted
through a digital amplification campaign targeting consumers on the “Beef. It’s What’s for Dinner Facebook page and through YouTube.“
Video above is not clickable, please use one of the links to the upper right .

13
Producer Image Building Campaign
Denver
3 Focus Groups in Each City

WHO SELLS THE BEEF AT RETAIL?
• IRI Panel Data
14

What is Panel vs. Scanner Data?
Scanner DataSummarizes overall consumer purchasesWhat and how much purchased from whereMore detail, total of actual sales
15
Panel DataLinks demographics to purchases100,000 households Reflect overall population Who purchased how much
of what from whereSelf-reported vs. actual
Why Purchase This Data?
Gaps in scanner dataNo retailer-specific informationMissing retailer types
Panel data benefitsEnables better sizing of retailAdds demographic insightsLower cost
16

Four years of sales data2012-2015
Two years of demographic data2014, 2015
Product CategoriesFresh beef Total beef Ground beef Steaks Roasts Other
What Panel Data Did We Buy?
17

2012-2015: Retail Beef Purchases Have Declined by 1.25 Occasions Per Year
18Source: IRI Panel Data, 2012-2015
0
2
4
6
8
10
12
14
TOTAL BEEF ROASTS STEAKS GROUND BEEF BEEF OTHER
Annu
al P
urch
ase
Occ
asio
ns
Purchase Occasions Per Household by Category
2012 2013 2014 2015

560,000 Fewer Households Purchased Beef in 2015 vs. 2012
19Sources: IRI Panel Data, 2012-2015; www.statista.com
40%
50%
60%
70%
80%
90%
100%
TOTAL BEEF ROASTS STEAKS GROUNDBEEF
BEEF OTHER
Perc
ent o
f HH
Buy
ing
Share of Households Purchasing Beef by Category
2012 2013 2014 2015

0%
5%
10%
15%
20%
25%
30%
35%
40%
45%
50%
1970
1972
1974
1976
1978
1980
1982
1984
1986
1988
1990
1992
1994
1996
1998
2000
2002
2004
2006
2008
2010
2012
2014
2016
2018
Perc
ent o
f Lbs
/Cap
ita
Beef Share of Meat & Poultry Disappearance
Beef Share Linear (Beef Share)Source: USDA & CattleFax
Since 1980, Beef’s Market Share Has Declined 0.4% per Year
-0.3% since 1996
20

Scanner Data (MULO) Captures ~87% of Fresh Beef Sales
MULO = Scanner Data87%
Beyond MULO13%
RETAIL BEEF SALES ($)
21
Conv/Gas4%
Costco42%
Dollar1%Drug
0%Internet
5%Military
10%
Remaining2%
Specialty36%
NON-MULO BEEF SALES ($)
Sources: IRI Panel Data, 2012-2015 and IRI/Freshlook Total US MULO, 52 weeks ending 12/27/15; Categorized by VMMeat System

ARE WE SELLING MORE BEEF AT RETAIL AND
FOODSERVICE?• IRI Scanner Data/Meat Solutions, Foodservice Volumetric,
Government Sources
22

-4%
5%
-15%
-20%
-15%
-10%
-5%
0%
5%
10%
Dollars Pounds Price (from highs)
Perc
ent C
hang
e
2016 vs. 2015 Change in Retail Beef Sales (Jan-Nov)
Retail Volume Up 5%+ on Lower Prices
Yes!
23Source: IRI/Freshlook, Total US MULO ending 11/20/16; Categorized by VMMeat System

Retail Prices Down 15% from Highs; Steak and Roast Sales Are Strong
-4%
5%
-15%-12%
0%
-17%
3%
11%
-13%
2%
16%
-17%-20%
-15%
-10%
-5%
0%
5%
10%
15%
20%
Dollars Pounds Price (from highs)
Perc
ent C
hang
e
2016 vs. 2015 Change in Retail Beef Sales (Jan-Nov)Overall Ground Steak Roasts
24Source: IRI/Freshlook, Total US MULO ending 11/20/16; Categorized by VMMeat System

Ground Beef Share Correcting to More Historical Levels
45%
50%
55%
60%
65%
2009 2010 2011 2012 2013 2014 2015 2016
Perc
ent o
f Tot
al B
eef S
ales
Ground Percent of Total Beef Sales (Pounds)
Total Foodservice Retail (Meat Case)
25Sources: IRI/Freshlook, Total US MULO ending 11/20/16; Categorized by VMMeat System; Technomic Foodservice Volumetric Study

Consumers Are Taking Advantage of Increased Beef Featuring
26

2016 Retail Beef Sales: Key Takeaways
Steak & Roast volumes rebounding Ground Beef steady
Featuring robust
Featuring leading prices lower
27

Retail Price Deflation Is Pressuring Restaurants
28

Restaurant Traffic Is Lagging –Especially Casual Dining
29

64%
13%
11%
7%4%
1% Ground Beef—5.022 B
Pre-cut Steak—1.012 B
Roasts (subprimal)—0.838 B
Other Beef—0.505 B
Pre-Cooked Roast Beef—0.321 B
Ribs—0.117 B
30
2016 Beef Foodservice Volume Purchases Increased 1.0%
Pounds change 2016 vs. 2015 = +79 million lbs.
2016Annual total7.816 B lbs.
48 3910 2
-5 -17
Roasts* Pre-cut steak Pre-CookedRoast Beef
Ground Beef Ribs Other Beef
Source: 2016 Techomic Foodservice Volumetric Study

Filet Is Rebounding
Item Operator Purchases(Million Pounds)
OperatorPenetration
Penetration Improvement
Filet Steak +13 8% +1%
Tenderloin Roast +6 15% +2%
Source: 2016 TechnomicFoodservice Volumetric Study
31

Beef Foodservice Dollar Purchases Continue to Exceed Those of Chicken
0123456789
Pounds
Bill
ion
Poun
ds
Foodservice Purchases (Pounds)
Beef Chicken
0
5
10
15
20
25
30
35
Dollars
Bill
ion
Dol
lars
Foodservice Purchases (Dollars)
Beef Chicken
32Source: 2016 Techomic Foodservice Volumetric Study

WHO BUYS AND EATS THE BEEF - IN-HOME (TODAY AND
TOMORROW)?IRI/Panel Data, NPD National Eating Trends
33

More than 7 in 10 consumers eat beef in an average week… 2.6 eatings per week.
71.8 72.8 72.6
2.5 2.5 2.6
0
5
10
0
25
50
75
100
2013 2014 2015
WeeklyPenetration
Years (ending Aug)
Source: The NPD Group/National Eating Trends® Years ending in AugustData: Total Population; Based off an avg. week;In-Home & Carried From Home
Beef Consumption Trend (In-Home/Carried) WeeklyPenetration
“Disclosed with permission of The NPD Group solely for the purpose for which it is being provided by NCBA (a contractor to the Beef Checkoff). The reproduction, dissemination, or use of this information
for any other purpose is strictly prohibited without NPD’s prior written consent.”
31 billion servings of beef
34

31 billion eatings – who and why
35
“Who” Analysis: • By generation• By life-stage• By income• By ethnicity• By education level
“Why” - Helps Provide Focus to Communications, Culinary Direction, Merchandising Recommendations

0
20
40
60
80
100
120
140
MillennialsBorn 1976+
Gen X 1965-1976
YngrBoomers
1956-1964
OlderBoomers
1946-1955
Retirees1936-1945
Seniors pre-1936
Uni
t Ind
ex
Beef Unit Purchasing by Generation
Total Beef Ground Beef Steaks Roasts Other
Millennials Purchase Fewer Roasts, Seniors Less Ground Beef and Steaks
36Source: IRI Panel Data, 2012-2015

96 94 78
114 121117
55 50
39
30 23
30
Total Pop. Millennials with Kids Millennials without Kids
Seafood
Pork
Poultry
Beef
When Millennials have kids … animal protein (with exception of seafood) climbs.
37
Source: The NPD Group/National Eating Trends®; 2 years ending Aug 2016
Data In-Home & Carried From Home
Animal Protein AEPC (In-Home/Carried)
“Disclosed with permission of The NPD Group solely for the purpose for which it is being provided by NCBA (a contractor to the Beef Checkoff). The reproduction, dissemination, or use of this information
for any other purpose is strictly prohibited without NPD’s prior written consent.”
37
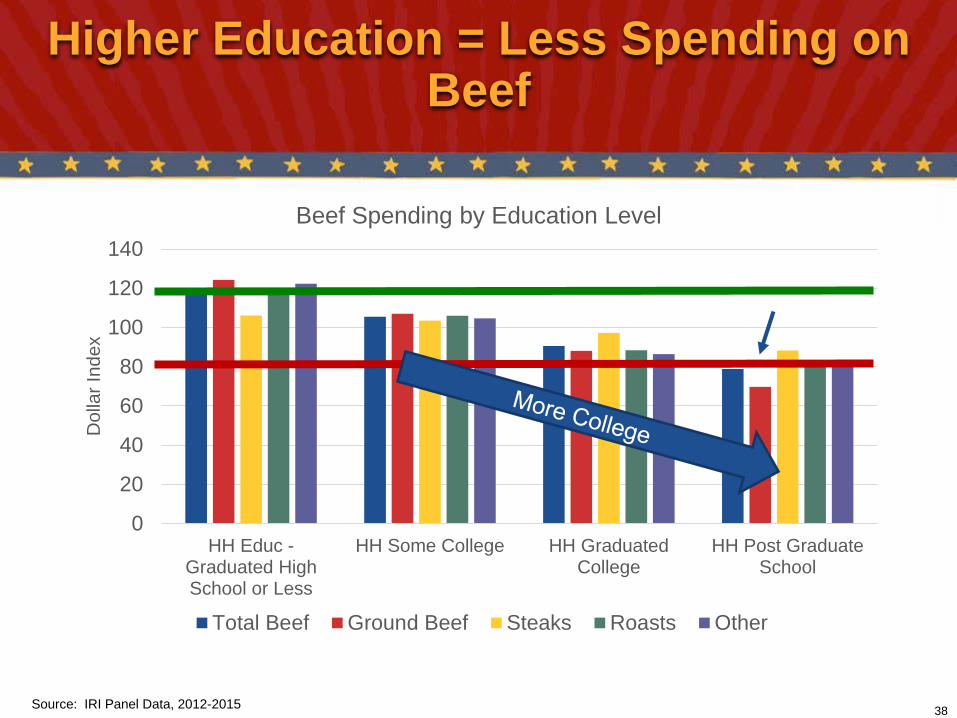
Higher Education = Less Spending on Beef
38
0
20
40
60
80
100
120
140
HH Educ -Graduated HighSchool or Less
HH Some College HH GraduatedCollege
HH Post GraduateSchool
Dol
lar I
ndex
Beef Spending by Education Level
Total Beef Ground Beef Steaks Roasts Other
Source: IRI Panel Data, 2012-2015
39
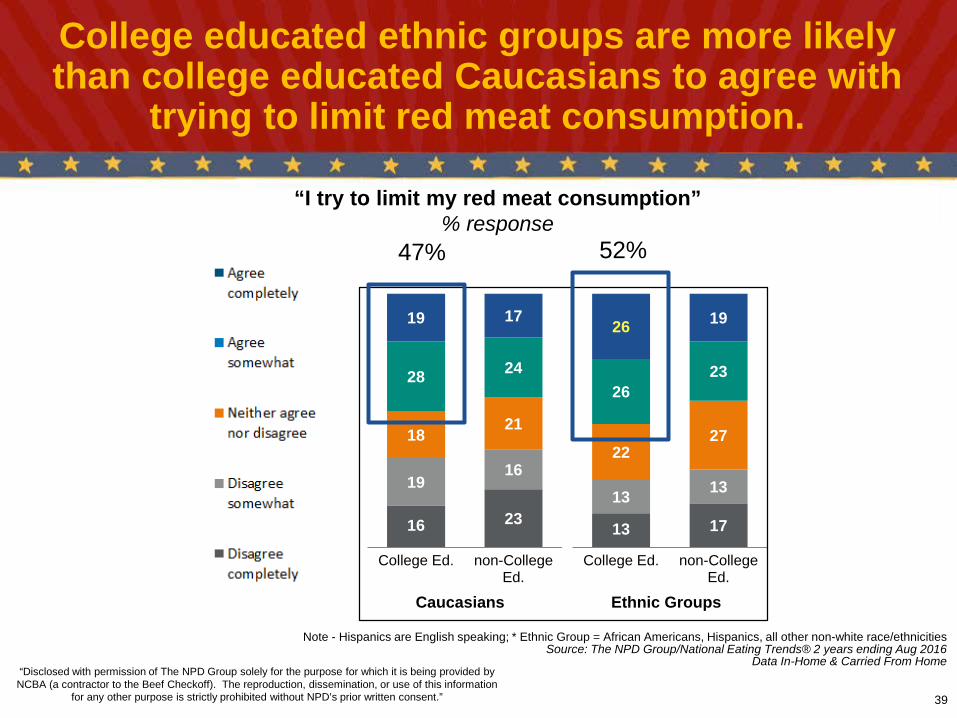
“I try to limit my red meat consumption”% response
16 23
1916
18 21
28 24
19 17
College Ed. non-CollegeEd.
13 17
13 13
2227
2623
26 19
College Ed. non-CollegeEd.
Caucasians Ethnic Groups
College educated ethnic groups are more likely than college educated Caucasians to agree with
trying to limit red meat consumption.
Note - Hispanics are English speaking; * Ethnic Group = African Americans, Hispanics, all other non-white race/ethnicitiesSource: The NPD Group/National Eating Trends® 2 years ending Aug 2016
Data In-Home & Carried From Home
47% 52%
“Disclosed with permission of The NPD Group solely for the purpose for which it is being provided by NCBA (a contractor to the Beef Checkoff). The reproduction, dissemination, or use of this information
for any other purpose is strictly prohibited without NPD’s prior written consent.” 39

0
20
40
60
80
100
120
140
HHw/younger
Chldrn
HH w/olderChldrn
YoungSingles -18 - 44years of
age
OlderSingles -
45+
YoungCouples -18-44 nochildren
OlderCouples -
45+ nochildren
Buye
r Ind
ex
Younger Singles Purchase Beef Less Often
Total BeefGround BeefSteaksRoastsOther
Younger Singles Purchase Beef Less Frequently
Source: IRI Panel Data, 2012-2015
Singles
40

One person households … a growing demographic, about 1/3 of American households
41
AEPC 2016
Source: The NPD Group/National Eating Trends®; 2 years ending in Aug 2016Data: In-Home & Carried From Home
Change in Total Beef Consumption by Household Member Size (In-Home/Carried)
0 30 60 90 12015% 10% 5% 0% 5% 10% 15%
1
2
3
4
5+
% Change vs. 2014
10%
28%
18%
21%
23%
% of Eatings
83 beef eatings per year
“Disclosed with permission of The NPD Group solely for the purpose for which it is being provided by NCBA (a contractor to the Beef Checkoff). The reproduction, dissemination, or use of this information
for any other purpose is strictly prohibited without NPD’s prior written consent.”
100 beef eatings per year
41

Asians and Blacks Have Weaker Beef Purchase Patterns
42
0
20
40
60
80
100
120
White Asian Black Other (mostlyHispanic)
Buye
r Ind
ex
Beef Purchase Frequency by Race (Ethnicity)
Total Beef Ground Beef Steaks Roasts Other
Source: IRI Panel Data, 2012-2015

43
Caucasian and Hispanics have the most frequent beef consumption, and are also the groups with the smallest declines
AEPC 2016
*Hispanics are English/Bilingual speakingSource: The NPD Group/National Eating Trends®; 2 years ending in Aug 2016
Data: In-Home & Carried From Home
Change in Total Beef Consumption by Race/Ethnicity (In-Home/Carried)
0 30 60 90 12015% 10% 5% 0% 5% 10% 15%
Caucasian
African Am.
Hispanic*
Other
% Change vs. 2014
66%
11%
18%
5%
% of Eatings
“Disclosed with permission of The NPD Group solely for the purpose for which it is being provided by NCBA (a contractor to the Beef Checkoff). The reproduction, dissemination, or use of this information
for any other purpose is strictly prohibited without NPD’s prior written consent.”
34% (of eatings)
43

WHAT IS THE UPSIDE FOR BEEF IN RESTAURANTS?
Chef and Beef’s Value Study
44

45
Chefs & Beef’s Value
Hypothesis: Beef Meals, while having a higher cost, deliver a greater profit than other protein meals.Do beef meals provide a greater value (profit) than other protein meals?
Are restaurant operators looking to add more beef items to their menus?
What would inspire additional beef menu items?Hypothesis: Beef Meals, while having a higher cost, deliver a greater profit than other protein meals
Source: Chefs & Beef’s Value Study 2016

46
Chefs & Beef’s Value
572 total operatorsmix of casual, upper casual, and fine dining
Source: Chefs & Beef’s Value Study 2016
• Filet Mignon• Ribeye Steak• Sirloin Steak• Beef Fajita• Beef Burger• Chicken Breast• Chicken Fajita• Chicken Sandwich• Salmon• Shrimp• Tilapia• Shrimp Fajita• Pork Chop• Pork Ribs

47
Dish
Whatever is
included on the plate?
+Additional
items ordered
= Meal
Menu PriceFood Cost
% of time ordered $ Profits% of Food Cost
Chefs & Beef’s Value

48
Chefs & Beef’s Value
Source: Chefs & Beef’s Value Study 2016
Menu Price
%Dish Food Cost
Dish $ Profit
Add On Revenue
Meal $ Profit
Beef costs more Beef delivers greater profit dollars, add-ons, and larger check sizes
Compared to:
$28.09 33% $18.28 $17.33 $31.77
%Meal Food Cost
30%
* Based upon median data
$16.25 26% $11.68 $11.97 $20.84 26%
49
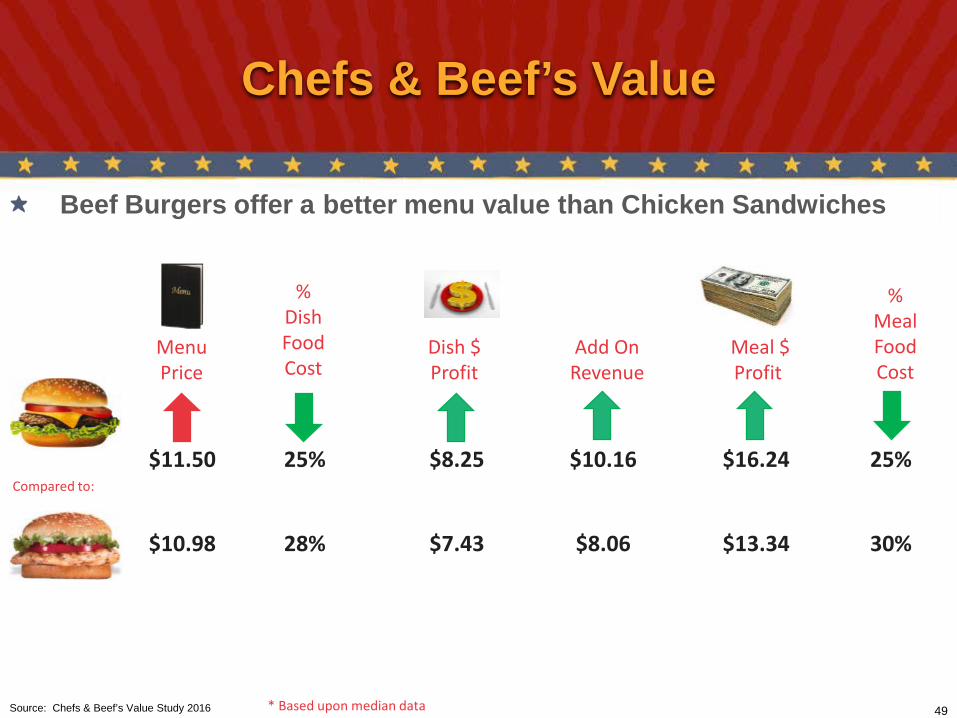
Chefs & Beef’s Value
Beef Burgers offer a better menu value than Chicken Sandwiches
Source: Chefs & Beef’s Value Study 2016 * Based upon median data
Compared to:
$11.50 25% $8.25 $10.16 $16.24 25%
Menu Price
%Dish Food Cost
Dish $ Profit
Add On Revenue
Meal $ Profit
%Meal Food Cost
$10.98 28% $7.43 $8.06 $13.34 30%
50
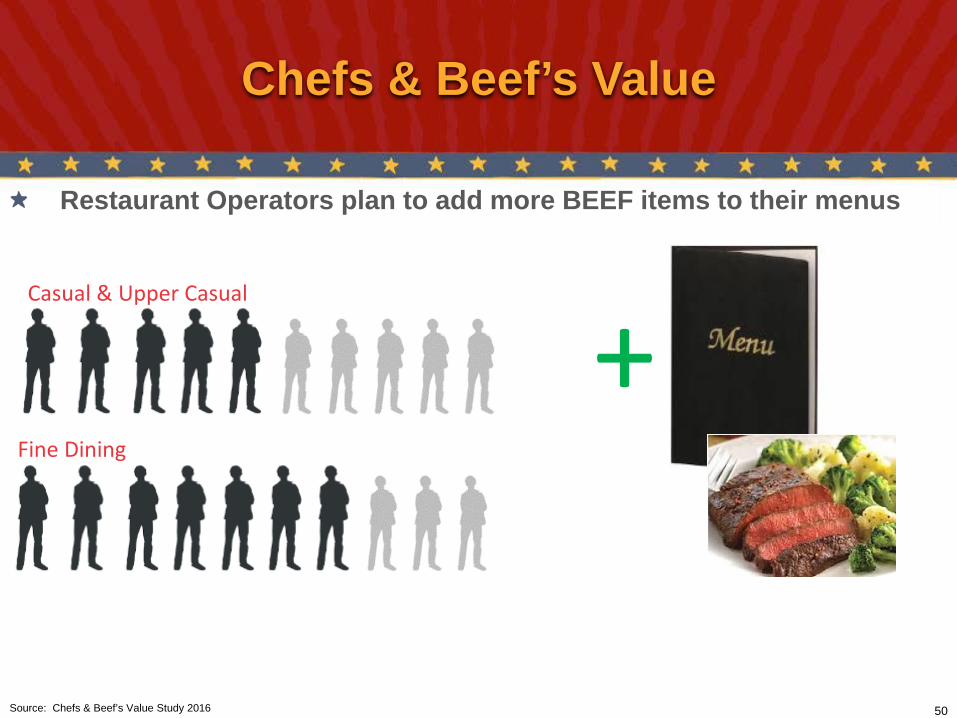
Chefs & Beef’s Value
Restaurant Operators plan to add more BEEF items to their menus
Source: Chefs & Beef’s Value Study 2016
Casual & Upper Casual
Fine Dining
+
51
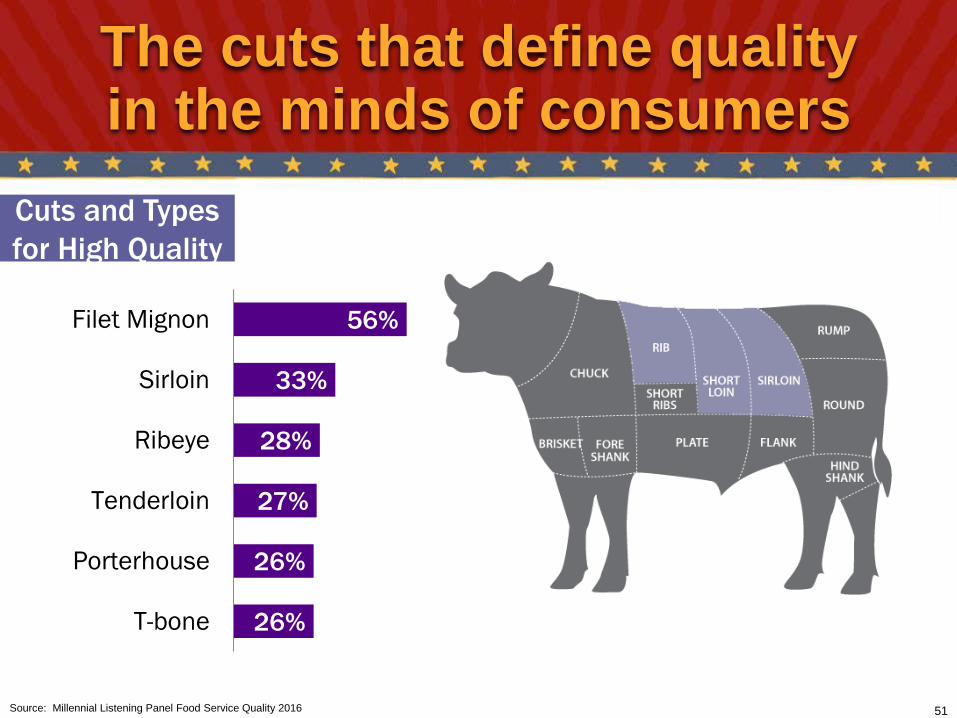
The cuts that define quality in the minds of consumers
Source: Millennial Listening Panel Food Service Quality 2016
56%
33%
28%
27%
26%
26%
Filet Mignon
Sirloin
Ribeye
Tenderloin
Porterhouse
T-bone
Cuts and Types for High Quality

HOW DO WE TAKE ADVANTAGE OF THE
“SMOKED BEEF” TREND?Chef New Product Investigation
52

53
Have you ever…
Spent an entire day or night smoking beef?
Wishing you could enjoy smoked beef, but don’t have a smoker?
Wanted to order smoked brisket only to find out the restaurant has run out?
Thought about a smoked steak that was cooked to a perfect medium?

54
Low EndLiquid Smoke
MidPre-cooked smoked
Outsource to a smokehouse offsite
HighOn-site smoker
Best opportunity area in competitive landscape
Smoked Beef Landscape
Source: Cold Smoked Foodservice Qualitative 2016

Fresh Smoked Beef
Source: Cold Smoked Foodservice Qualitative 2016
Chef feedback:
No need for a smoking equipmentReal smoke – not artificialConsistency Creativity on the menuPotential for different cutsHigh volume potential at buffets
55

Fresh Smoked Beef
56
Chef thoughts:“Cold smoked gives you
the versatility where you could serve a piece of meat up anywhere from rare to medium rare to
well done..”
“It’s just unique. I’ve never even thought of it for a raw steak to be smoked. Whenever I think smoke, it’s fully cooked…
It’s interesting to think of a filet or a ribeye to be smoked and still be cooked to temp. It would be cool to play around with tartar and
a filet. It opens a lot of options.”
“It saves me $200,000 from going out and getting a smoker. We could have the same thing as having a smoked
product without using the liquid smoke marinade which tastes horrible and other products that do
the same.”
Source: Cold Smoked Foodservice Qualitative 2016

WHAT ABOUT SELLING BEEF ONLINE?
IRI Panel Data, Consumer Beef Index, Millennial Listening Panel
57

Anticipated Future Delivery of Online Meals, Meat, Groceries
58
Next few years’ deliveries of meals, meats or other groceries
Key: Significantly higher/lower than non-segment ( ) Base: Beef Eaters (N = 978), Millennials (N = 397), Parents 20-34 (N = 122)Q.40h/i: Over the next few years, do you anticipate that your use of services that deliver meals, meats and other groceries will ……?
20%
5%
15%
26%
7%
19%
28%
7%
21%
Increase (Net)
Increase a lot
Increase a little
Total
Millennials
Parents (20-34)
July 2014
Source: Consumer Beef Index, July, 2014

Steak Share Has Decreased
59
0.4%
0.6%
0.8%
1.0%
1.2%
1.4%
1.6%
2012 2013 2014 2015
Perc
ent o
f Pou
nds
Internet Beef Sales Share of Retail Beef Sales
BEEF OTHER BEEF ROAST BEEF STEAKSGROUND BEEF TOTAL BEEF
Steak
Source: IRI Panel Data, 2012-2015

Less Repeat Business
60Source: IRI Panel Data, 2012-2015
0
20
40
60
80
100
2012 2013 2014 2015
Percent of Buyers Repeating - Total Beef
All Outlets Internet

Beef and Online Grocery
• Uncover barriers• What content
motivates purchase
• 323 participants• 150 Online Meat
Purchasers• 173 Potential
Online Meat Purchasers
• DMA’s with online shopping available.
Source: Millennial Listening Panel, E-Commerce Report, January, 2017 61

Beef and Online Grocery
Variety
Current e-meat shoppers
Product Detail
Potential e-meat shoppers
Prices/Delivery/Fat Content
Quality
Source: Millennial Listening Panel, E-Commerce Report, January, 2017 62

Beef and Online Grocery
Cut Recommendations Cooking Tips
Which e-commerce tools do they want to see launched?
Freshness Guarantee Recipe RecommendationsSource: Millennial Listening Panel, E-Commerce Report, January, 2017 63


![Beef Quality Assurance - USAHA · 2019. 4. 18. · October, 2014 Consumer Image Index, March 2015 Consumer Beef Index [VALUE] [VALUE] Concerned About Familiar with Antibiotic Use](https://img.pdfslide.us/doc/110x75/5fc36f76476a6c2e341f4309/beef-quality-assurance-usaha-2019-4-18-october-2014-consumer-image-index.jpg)